
Detection of Natural Gas Leakages Using a Laser-Based Methane Sensor and UAV


1
Department of Acoustics, Electronics and IT Solutions, Central Mining Institute, Plac Gwarków 1, 40-166 Katowice, Poland
2
Department of Surface and Structures Protection, Central Mining Institute, Plac Gwarków 1, 40-166 Katowice, Poland
3
Polska Spółka Gazownictwa Sp. z o.o., Oddział Zakład Gazowniczy w Zabrzu, ul. Szczęść Boże 11, 41-800 Zabrze, Poland
*
Author to whom correspondence should be addressed.
Remote Sens. 2021, 13(3), 510; https://0-doi-org.brum.beds.ac.uk/10.3390/rs13030510
Submission received: 18 December 2020
/
Revised: 23 January 2021
/
Accepted: 28 January 2021
/
Published: 31 January 2021
Abstract
:The safety of the gas transmission infrastructure is one of the main concerns for infrastructure operating companies. Common gas pipelines’ tightness control is tedious and time-consuming. The development of new methods is highly desirable. This paper focuses on the applications of air-borne methods for inspections of the natural gas pipelines. The main goal of this study is to test an unmanned aerial vehicle (UAV), equipped with a remote sensing methane detector, for natural gas leak detection from the pipeline network. Many studies of the use of the UAV with laser detectors have been presented in the literature. These studies include experiments mainly on the artificial methane sources simulating gas leaks. This study concerns the experiments on a real leakage of natural gas from a pipeline. The vehicle at first monitored the artificial source of methane to determine conditions for further experiments. Then the experiments on the selected section of the natural gas pipelines were conducted. The measurement data, along with spatial coordinates, were collected and analyzed using machine learning methods. The analysis enabled the identification of groups of spatially correlated regions which have increased methane concentrations. Investigations on the flight altitude influence on the accuracy of measurements were also carried out. A range of between 4 m and 15 m was depicted as optimal for data collection in the natural gas pipeline inspections. However, the results from the field experiments showed that areas with increased methane concentrations are significantly more difficult to identify, though they are still noticeable. The experiments also indicate that the lower altitudes of the UAV flights should be chosen. The results showed that UAV monitoring can be used as a tool for the preliminary selection of potentially untight gas pipeline sections.
1. Introduction
Methane is one of the most dangerous anthropogenic greenhouse gases, and is only second in terms of importance to carbon dioxide [1]. There are many sources of methane including landfills [2], thermally active extractive waste dumping facilities [3], coal mines and coal bed methane extraction facilities [4], and natural gas networks. The natural gas networks are vulnerable to damage resulting in the leaks of this gas into the atmosphere, which primarily contributes to the methane risk to people and the environment, as well as financial losses for the network owner. Methane is the main component of natural gas. Fossil fuel industry’s natural gas emissions per unit of production have declined from approximately 8% in the mid-1980s to approximately 2% in the early 2010s thanks to improvements associated with better management practices, technology and the replacement of older pipelines and other equipment used by the gas networks [1]. Despite this fact, the detection of natural gas leaks from the gas pipeline network has not become less important.
The main causes of damage to the natural gas network are the corrosion of steel pipelines, mechanical damage caused by construction works, the unsealing of connections and cracks in welded joints caused by stress. Additionally, material defects and defects of anti-corrosive coating, ground displacements due to landslides or mining impact may also be causes of damage to gas pipelines. In mining areas there is also damage to the steel gas pipeline expansion joints resulting from the displacement of pipeline segments, as well as wall deformations of steel and polyethylene pipelines due to sub-grade deformations [5]. In light of this, periodic inspections of their technical condition are of great importance.
There are many technical methods of subsurface pipelines monitoring, for example, geophysical methods of their location, technical state control, and leak detection. Gas leak detection technologies cover the use of geophones sensitive to acoustic emission caused by the gas flow from the damaged pipeline. Acoustic methods are also used to detect and locate leakages from the natural gas pipelines [6] beside other exterior methods and interior or visual/biological methods.
Nowadays, to detect natural gas leaks from the network laser methane detectors are used, among others. The laser methane detectors can be placed on the remotely controlled flying platform (UAV) to perform measurements [7]. Many studies of the use of UAVs with laser detectors enabling remote measurement of methane concentrations in the air have been described in the literature (see Section 2). The experiments conducted in these studies mainly focused on artificial methane sources used for simulating natural gas leaks from pipelines. There were performed only few experiments on the well pads and gathering pipelines, but not on pipelines with the real natural gas leak. Taking into account the previous research results we wanted to test the method in the real conditions. Our research mainly concerned the field experiments on a section of the natural gas pipeline with a small leakage just before repair. This leakage was revealed during the standard periodic procedure used by the owner of the natural gas distribution pipeline.
The main goal of this article is to present the possibility of the use of a laser methane mini detector which is hung on the UAV to detect natural gas leaks from the pipeline network in the real field conditions. The methodology of the research and analysis of the obtained measurement results were presented. In the first phase, the vehicle monitored the artificial source of methane to determine conditions for further experiments. Then the research on the selected section of the natural gas distribution pipeline was curried out. The analyzed data using machine learning methods enabled the identification of groups of spatially correlated regions with increased methane concentrations. However, the results from the field experiments showed that areas with increased methane concentrations are significantly more difficult to identify, but still noticeable. This indicates that research with the use of a UAV equipped with laser methane sensors should focus on experiments in the real field conditions of natural gas pipelines. Investigations on the UAV flight altitude influence on the accuracy of measurements were also carried out and the optimal altitude for data collection was determined.
The presented experiment results demonstrate that the UAV monitoring can be used for preliminary selection of the potentially leaky sections of natural gas pipelines. However, leaks need to be confirmed by more accurate measurements in these selected sections.
2. Materials and Methods
2.1. The Natural Gas Leak Detection with the Use of Laser Methane Sensors on a UAV
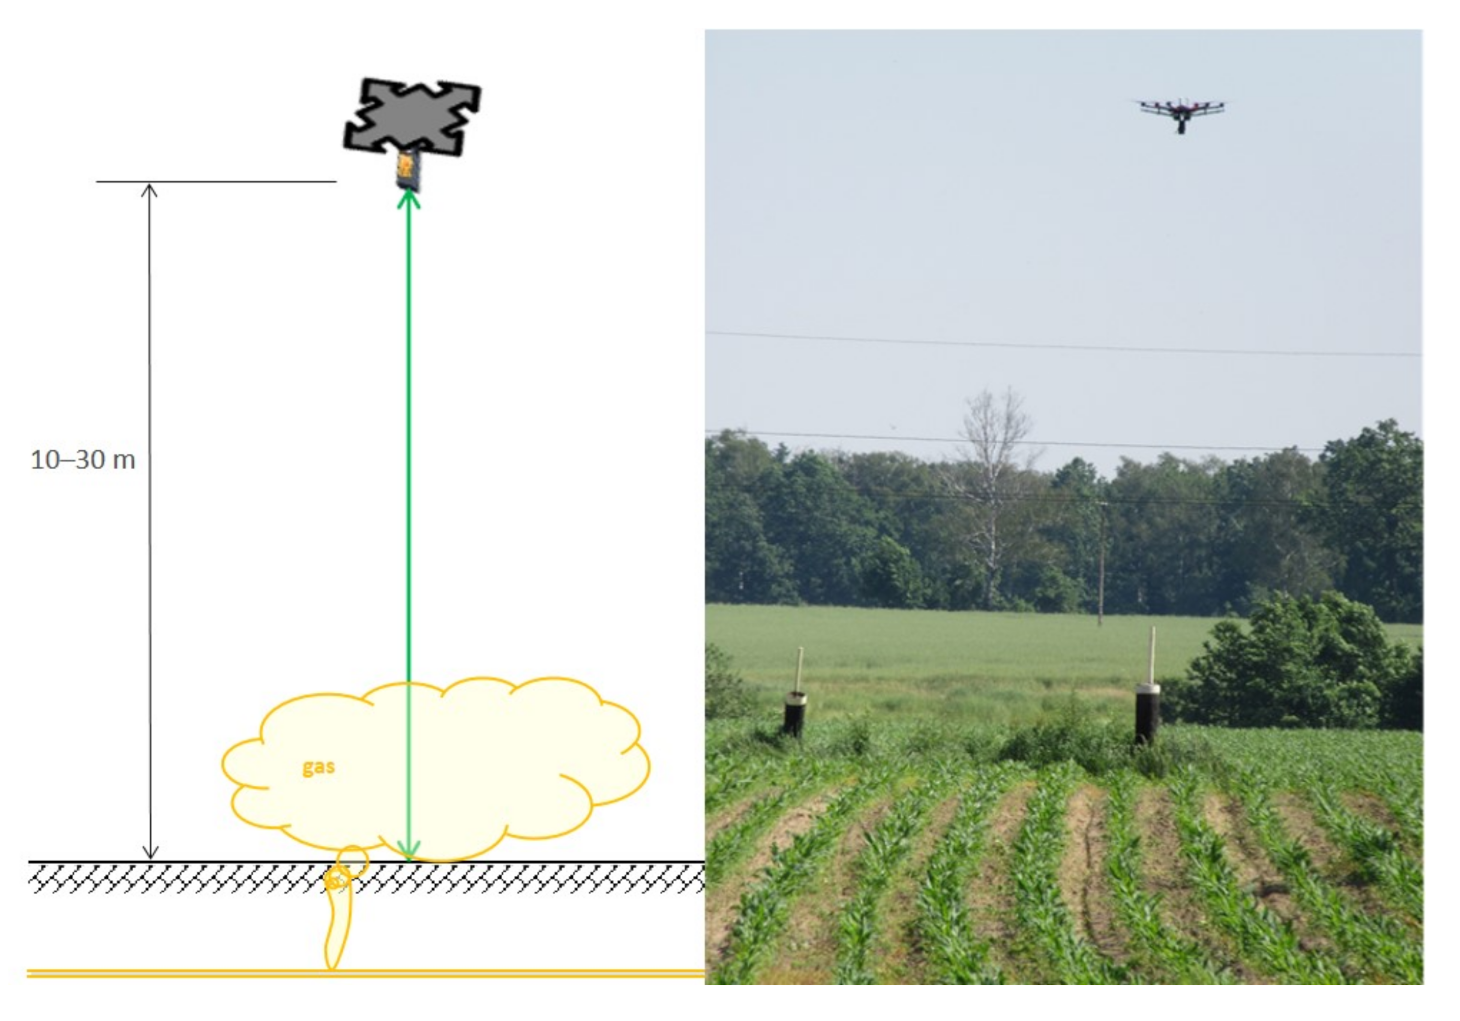
In recent years, unmanned aerial vehicles (UAV) have been increasingly used for remote sensing and the monitoring of facilities [8,9]. The detection and confirmation of natural gas leaks can also be conducted using detectors located on flying platforms. The flying platforms on the base of a UAV can have embedded [10,11,12,13] or suspended laser methane detectors [2,14,15,16]. Gas sensing technologies with the use of laser detectors enable the remote measurement of methane concentrations (Figure 1) in the air. This measurement is based on Infrared Absorption Spectroscopy using a semiconductor laser [17]. The detection relies on transmitting a laser beam towards the target point and measuring the absorption of the beam reflected from that point. Methane molecules absorb the energy of a specific wavelength of the electromagnetic spectrum. Laser detectors allow the measurement of methane concentration from a distance of 0.5–100 m, which enables their use for the detection of the methane in the air in the vicinity of gas pipelines and other gas network equipment from a safe distance. The measurement result is given in ppm × m (column density), which means the concentration of methane in ppm over the column between the UAV and the target point in m. With GPS coordinates, it is possible to fly the UAV with the detector directly above the gas pipeline route but good reconnaissance must be carried out before the flight to find terrain obstacles.
There are many investigations for the application of UAV systems to patrol oil and gas pipelines and other industrial facilities in order to investigate fugitive gas leakages. In [10,11] the Remote Methane Leak Detector-Unmanned Aerial Vehicle (RMLD-UAV) system for the monitoring of natural gas leaks is presented. This system is composed of a mini RMLD based on Backscatter Tunable Diode Laser Absorption Spectroscopy (TDLAS) embedded in the autonomous UAV and simplified quantification and localization algorithms. This system was tested at field sites in the USA and was used for the detection and quantification of natural gas leaks with controlled gas sources and on real gas production facility during blind tests. The flight altitude was mostly around 5–10 m. The TDLAS methane sensor and the optical gas imaging (OGI) camera placed on the UAV were used for methane emission detection from natural gas gathering pipelines in Ohio, USA [18]. The research team surveyed, with the UAV, 56 km of these pipelines, most of which was previously inaccessible, and detected areas with the high methane readings, but additional flights did not confirm leaks.
Several research teams have carried out detection tests of natural gas and methane leaks into the atmosphere using portable gas sensors, i.e., a Laser Methane mini suspended on a UAV. The related literature presents examples of specific solutions used in these tests and the results obtained during measurements. The paper [14] shows a solution with two LMmG detectors working simultaneously in a whisk broom scan pattern (doubled polyline). A leak detection system in the gas pipelines using a fixed-wing UAV was proposed in [15] by performing tests with simulated methane leaks on the programmed flight route. A UAV system with LMmG for detecting and monitoring methane emissions from landfills and mapping methane concentrations is presented in [2]. The University of British Columbia team performed field tests at a landfill at different altitudes of 30 m and 25 m. They presented a map showing higher methane concentrations above the landfill. The use of this equipment was also planned in order to evaluate for the inspection of natural gas pipelines. Field experiments with a UAV equipped with a laser methane mini detector and using controlled or uncontrolled release rates of methane from tanks were conducted in 2017 and 2018 by the University of British Columbia team [16,19]. This team also conducted experiments with subsurface methane injections to simulate natural gas leaks from buried pipelines. The flights were performed at 10 m above the Earth’s surface. They obtained methane concentrations at a level up to 100 ppm along the flight tracks near the release points, but no obvious methane plumes were mapped. Field experiments with the use of the flying platform UAV-REGAS equipped with an LMm detector installed on an aerial gimbal suspended on an octocopter were conducted in Germany [20,21]. A small glass cube filled with 2.5% of methane and a gas cylinder bundle were used as artificial sources of natural gas. The platform was used to perform experiments for a gas plume reconstruction. The measurements were carried out at different altitudes. They reconstructed 2D distribution maps of the gas plumes using cells which were 0.5 m in size.
The natural methane content in the atmosphere, according to literature data, is 1.6–2 ppm [22]. In measurements using a laser detector the obtained values are 28.1 ppm × m–70.9 ppm × m [21]; taking into account the distance from the reflection surface, the natural methane content was measured at a level of 2–10 ppm. This means that detector readings at a level around 100 ppm × m in the area of the gas network facilities may already indicate a natural gas leak. However, attention should be paid to the possibility of methane originating from various microbiological sources, where organic matter decomposes, e.g., rotting grass or other plants, or near landfills. Therefore, it is always important to determine the background in the area of investigation and to confirm the natural gas leaks. This confirmation can be carried out by additional, direct measurements of methane concentration in places with increased content, found during measurements using a flying platform.
2.2. The Goal of the Experiments
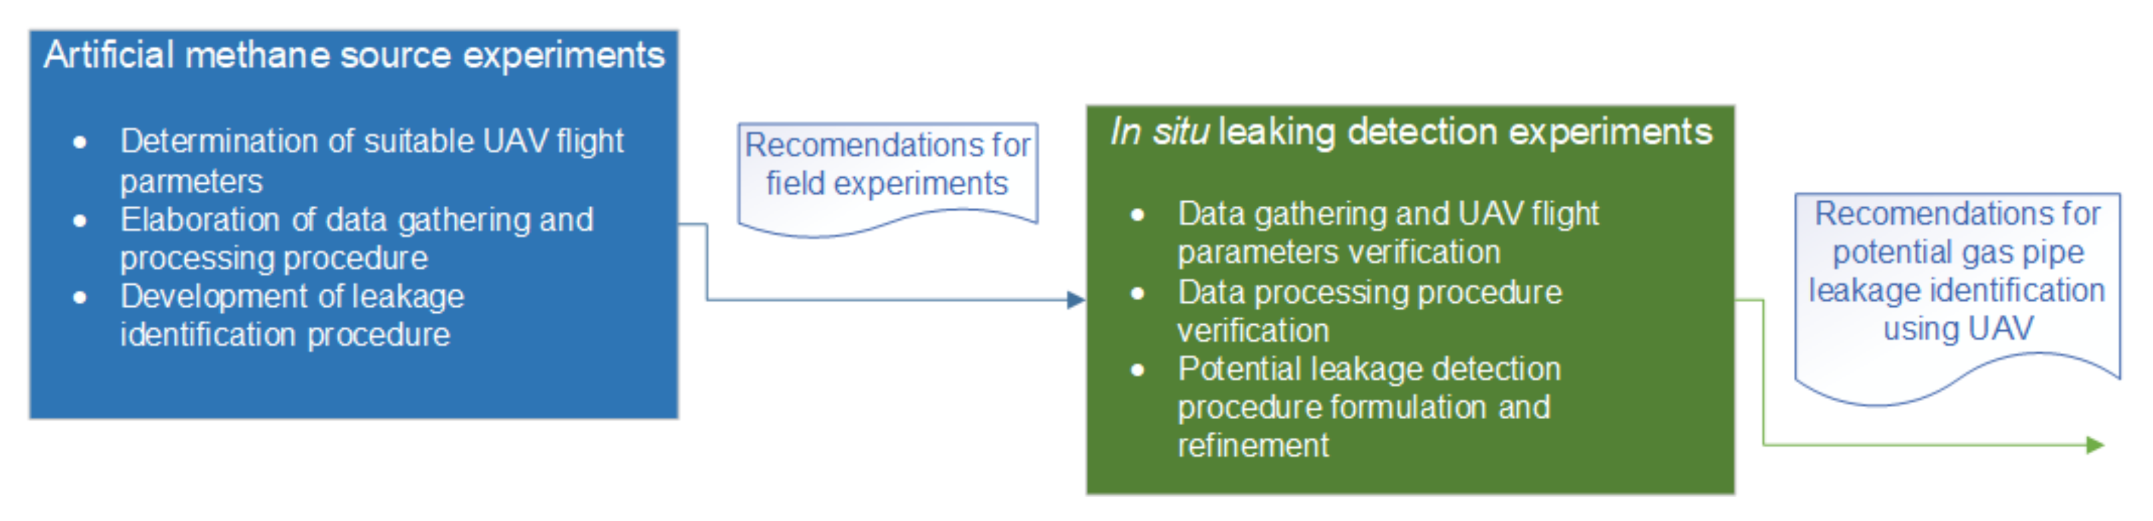
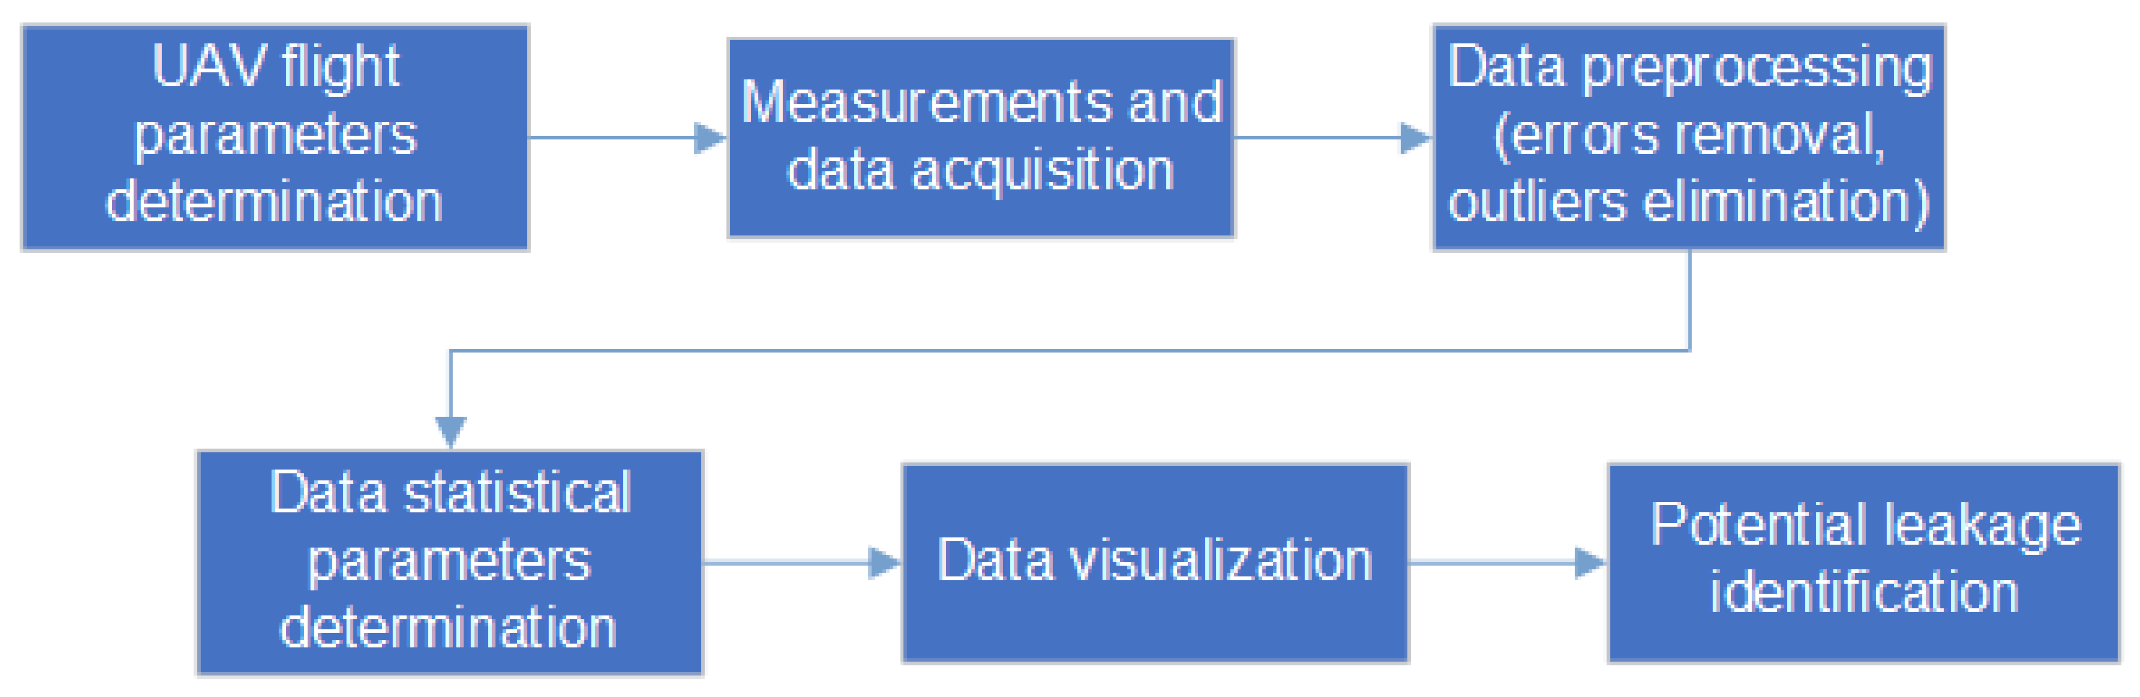
The goal of the experiment was to test the possibility of the use of the UAV equipped with a laser methane mini detector to detect natural gas leaks from the pipeline network. The detector is a device which was originally designed to be used as handheld equipment. It is used by workers when inspecting gas pipelines and surrounding infrastructure. Its application as a detector for a UAV platform would lead to significant cost reduction and would represent a consistent measurement source for both manual and UAV based inspections. The experiments carried out were supposed to answer two questions. Firstly, to check whether it is possible to use this type of device to detect changes in methane concentration using flying platforms. Secondly, to find out what flight parameters and what data processing should be used in order to determine a leakage in industrial conditions. The experiments were carried out in two separate phases, each targeting one of the aforementioned questions. For the first phase, the gas cylinder was used as an artificial methane source. The cylinder was placed on the ground simulating a small leakage. The second phase took place in the field. A segment of an operating, underground natural gas pipeline was inspected. This pipeline was previously checked for tightness by the gas company’s employees, revealing little leakage. The two-phase design of the experiments allowed to concentrate on different aspects of the phenomenon in each of them. Using the artificial, above ground methane source formed simpler conditions. Therefore, it was elaborated the recommendations for conducting the more difficult in situ experiments. During the in situ experiments phase, the recommendations were verified and foundations were developed for UAV based leakage detection procedure for buried gas pipelines (Figure 2). The proposed workflow for each of the experiments is presented in Figure 3. Each of the measurement’s sessions begins with establishing the flight parameters. During the flights the measurement’s raw data are gathered. The erroneous records are removed before further utilization. The outliers are identified and also removed. The data coordinates system is transformed, statistical parameters are calculated and the visualisations are prepared. The data are inspected for evidence of increased and spatially correlated values as a signs for leakage detection.
2.3. Flight Parameters
There are two considered flight parameters: height and velocity. The height determination was in the scope of the conducted experiments. In each phase, the UAV flew at several different altitudes. The measurements gathered were then analyzed to discover the optimum flight altitude. The UAV flight speed was determined based on the assumed frequency of the measurements. The detector used can measure the gas concentration with 10 Hz frequency. However, to increase the reliability of the measurements, they are averaged within a 0.5 s period, yielding the final measurement frequency to be 2 Hz. It was assumed that at least 1 measurement should be made per meter. Therefore, the maximum UAV horizontal flight velocity was limited to 2 m/s (7.2 km/h). During all of the experiments, the UAV velocity was established at 1.4 m/s ( 5 km/h). The position of the UAV was determined by a GPS device. The timestamp, the geographical coordinates and the methane detector readout were collected on the memory card as csv files.
2.4. Artificial Methane Source Experiment Setup
A standard gas cylinder was used as an artificial source of methane. The mixture in this cylinder consisted of methane (5.5%) and nitrogen. The gas cylinder was placed on the ground and gas flow of 5 kg/h was set, which corresponded to 275 g of methane released every hour. Seven flights were conducted. The flight altitudes above ground level followed the sequence: 3 m, 3 m (methane source turned off), 6 m, 9 m, 15 m, 15 m (methane source turned off) and 20 m. During each flight, the methane concentration measurements were collected along with the UAV coordinates. As the location of the artificial leakage point is known, the gathered data was analyzed in order to discover:
- the values representing background,
- the values indicating the cloud of leaking methane,
- the consistency of the data set.
All experiments were carried out during windless, sunny weather.
2.5. Gas Pipeline Leaking Detection Experiments
The field tests focused on a 30 m long segment of natural gas pipeline. The placement of the gas pipeline was known. The manual inspections revealed a small leakage in one location along the gas pipeline segment. The inspections were made as a part of the standard procedure used by the gas pipeline owner. Before the gas pipeline was tightened, a set of experiments using a UAV was made. The 9 flights were made at various altitudes above ground level (3.5 m, 6 m, 9 m, 12 m, 15 m, 18 m, 21 m and 25 m). Because a UAV battery replacement was necessary the flight at 15 m was repeated. As a point of reference, a few flights over non-leaking gas pipe were made. The goals of the measurements’ analysis were to:
- discover leakage in field condition,
- verify the determined optimal flight altitudes,
- assess the background level of methane concentrations.
The experiments were made in grass fields during windless, sunny weather.
2.6. Gas Detector Characteristic
The measurements were performed using the LaserMethane mini SA3C321-BE detector. The device uses the laser beam for the estimation of methane concentration. The measurement acquisition requires targeting the device towards a reflective surface. The laser beam emitted by the detector is reflected by the surface and the methane concentration along with the laser ray is determined. The maximum distance between the laser detector and a reflective surface, as declared by the device manufacturer, is 30 m. The preliminary tests showed that the device can operate at the reported distance. However, the measurements are sometimes influenced by the reflective material. Transparent materials (e.g., glass), in particular should be avoided. The measurement’s value represents the detected amount of methane on the laser beam distance and is expressed in ppm × m (so called column density). The detection limits are 1–50,000 ppm × m with accuracy of . It has to be noticed, that the detector can yield the same value for different methane concentrations along the laser beam path. For example, if the laser beam travels the distance of 10 m, the same measurement readout can be expected when the dense, compact cloud of methane is measured as well as when the low concentration cloud is spread at a greater distance. The device is capable of taking autonomous measurements with 10 Hz frequency. The measurement values can be sent by Bluetooth connection to a logging device. For the experiments, a smartphone was used as a data logger. The smartphone saved the concentration data along with the GPS acquired spatial localization.
2.7. Flying Platform Characteristics
As a flying platform, a six-rotor unmanned airborne vehicle, the Matrice 600 Pro produced by DJI, was used. This UAV has a maximum take-off weight of 15.5 kg with a curb weight of 9.5 kg. Its maximum flight speed is 65 km/h and the maximum range is 5 km with flight time of up to 32 min. on one set of batteries. The Matrice 600 Pro is equipped with A3 Pro flight controller, 3 GPS modules and 3 IMU modules.
2.8. Data Acquisition and Processing
The data acquisition system consisted of two components: a LaserMethane mini SA3C321-BE detector and a SAMSUNG Note 3 smartphone. The detector measured the methane column density with 10 Hz 2 Hz frequency and averaged it at 0.5 s intervals. The data was transmitted by Bluetooth connection to the smartphone. The smartphone logged the data along with the time and GPS location stamp. The measurements form a series where each is a tuple . The represents the measured value, and is the spatial coordinate at which the measurement was taken. The is a time stamp, and the is a status value informing of the problems with the registered measurement. The k represents the series number () and i numbers the measurement within the series (). The number of measurements within the series is and the number of all the series is N. As the further data analysis is identical for all series, the upper index k is omitted for clarity. The timestamp is neglected during further analysis, and the status information is only used to drop the measurements, for which the error conditions have been detected. Therefore, for the further analysis, the sequences of pairs are considered.
After the completion of the test, the data was transmitted to a PC for further processing. The data analysis consisted of three main stages:
- data cleaning,
- background/leakage gas concentration determination,
- location of the leakage estimation.
In the data cleaning stage, erroneous measurements were removed from the data set. The errors appear when the measuring laser beam is reflected by an overly reflective surface or its reflection is too small. The data cleaning phase included the removal of outliers. The outliers were identified in two regimes: the measured value regime and the GPS location regime. In the first case, all the single values where magnitude was at least two orders higher than surrounding measurements were treated as outliers. Such measurements are usually probably laser beam interaction with glass or other transparent materials, causing the additional reflections. GPS location errors manifested in the appearance of values assigned to points deviating from the UAV flight route. Such errors were eliminated using the selected grouping algorithm. The background/leakage gas concentrations were estimated by analyzing the variability of the values in different parts of the measurement series. Finally, the places where concentrations suggest leakage are extracted and their locations reported as expected leakage places.
3. Results
3.1. Artificial Methane Source
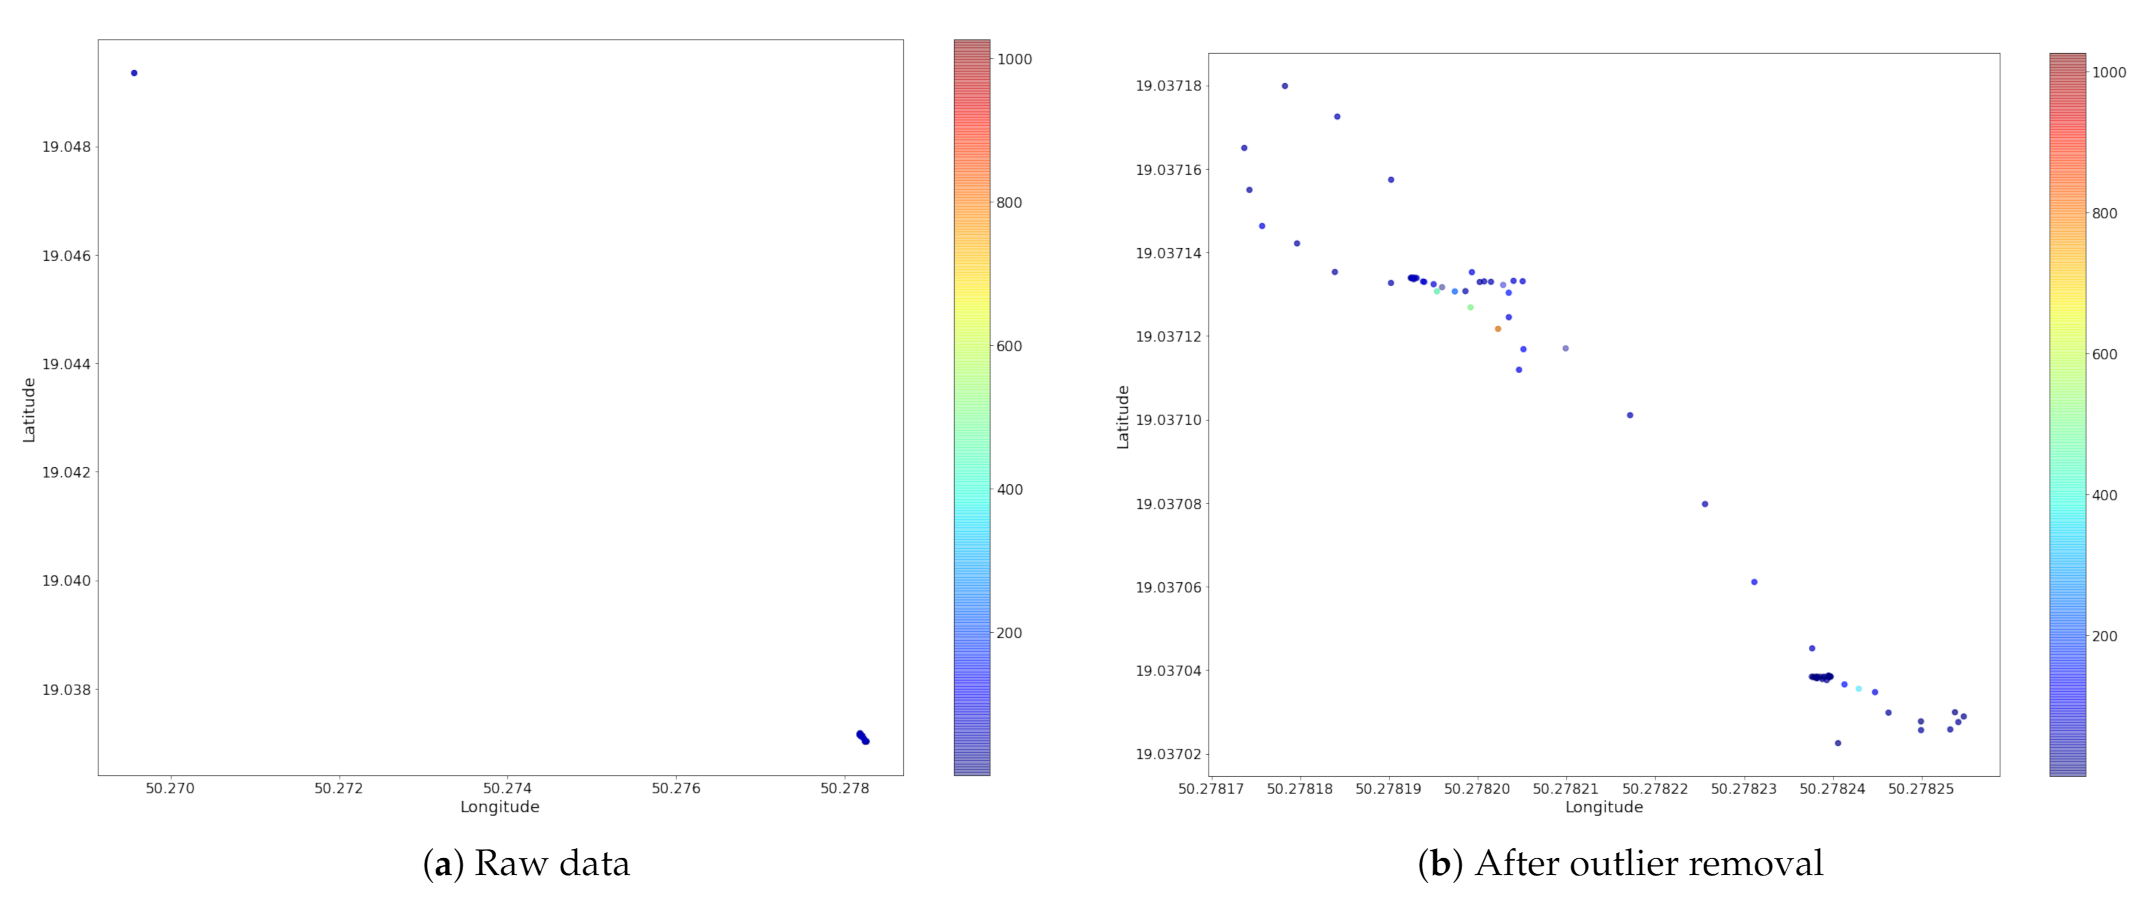
The research was carried out on wasteland within the city of Katowice. Bottles containing methane () and nitrogen () mixture were placed at ground level. The flights were conducted at the following altitudes above ground level: 3, 6, 9, 12 and 15 m. The gas outflow was established at the level of 5 kg/h (275 g of per hour). For the altitude 3 and 15 m additional flights were performed, without the gas release. At each altitude, the UAV flew forward and back, scanning the analyzed area. The raw data was filtered to remove erroneous values. Then, it was inspected for outliers, both in value and spatial domains. As the measurements form a sequence, the following rule was used to remove outliers in values domain: if the value of the given measurements is much higher than the average of measurements with indexes smaller (left side) and indexes greater than its index (right side), the point was removed. The value was treated as much higher when it exceeded more than three times the standard deviations calculated on the left and the right side. The elimination of the outliers in the spatial domain made use of the observation that most of the measurements form a cluster. The others are located outside the cluster and form groups consisting of just a few measurements. Therefore, a DBSCAN algorithm was used to identify the main cluster. The measurements not included in the cluster were removed from the dataset. The minimum cluster size identified by DBSCAN was established as 50 elements and the epsilon, the maximum distance between two samples for one to be considered as in the neighborhood of the other, was assumed to equal 0.3. The data coordinates were normalized before the grouping and selection. The comparison between filtered and unfiltered data is presented in Figure 4. Unfortunately, the data gathered for an altitude of 15 m suffered from a high rate of errors and had to be excluded from further analysis.
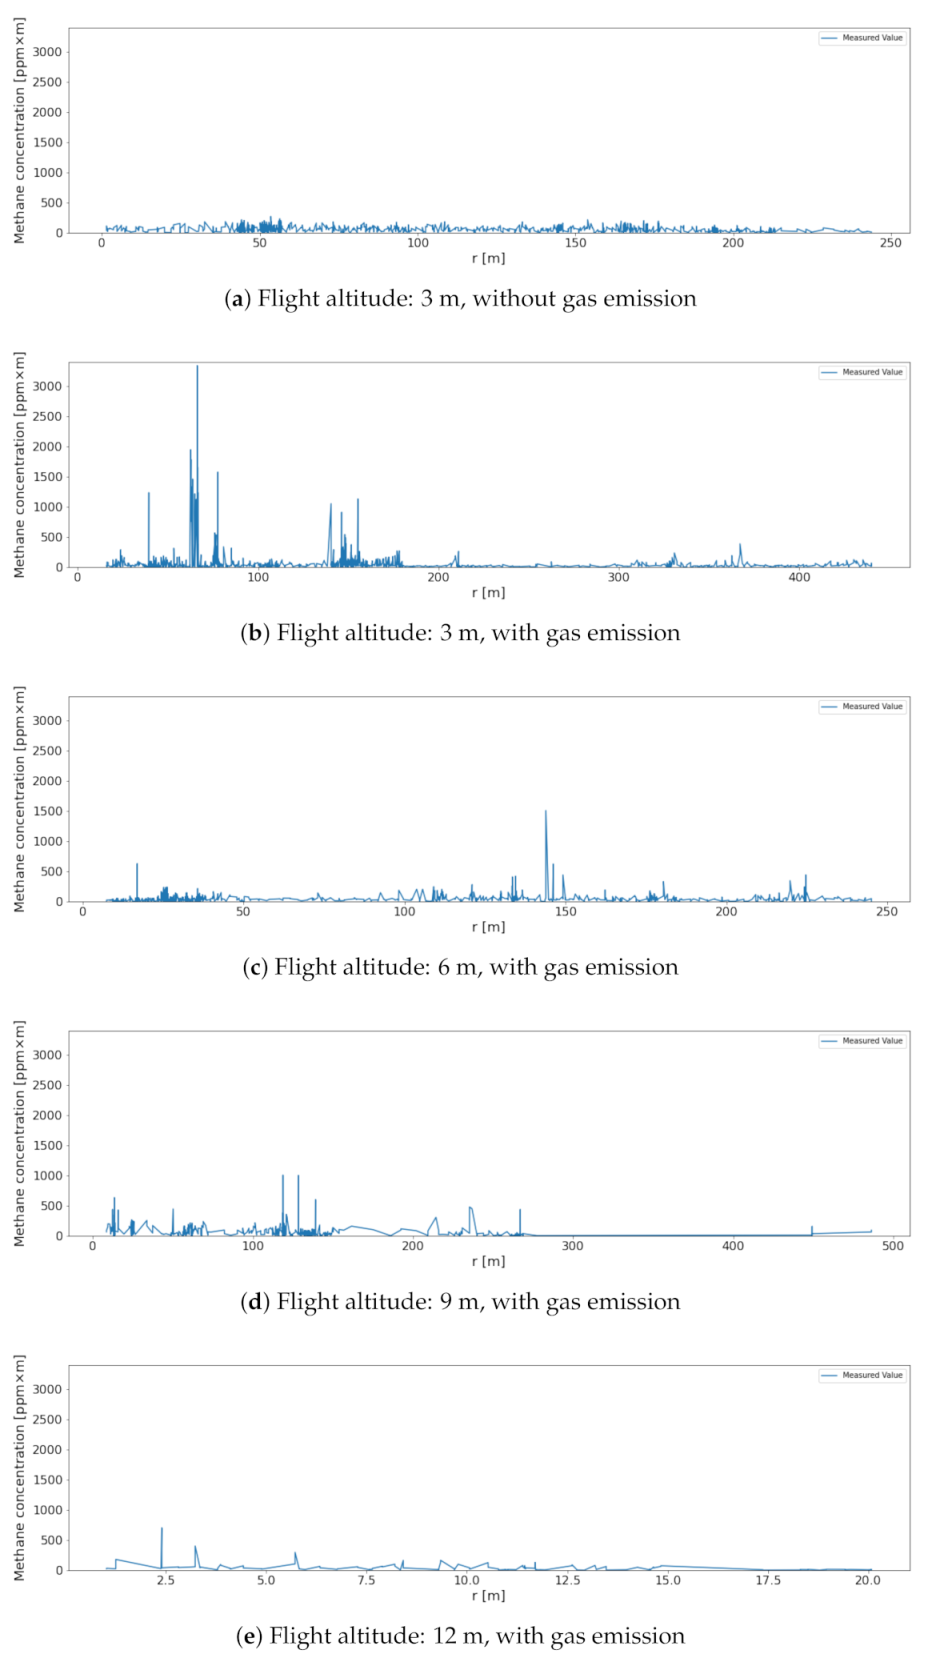
Because of the UAV circulations over the methane source, the same area can be monitored more than once. Therefore, measurements that differ significantly in the index i may refer to closely located measurement points (though the close values of i are correlated with the close location of measurement points). Moreover, the geographical coordinates do not directly inform of the distances expressed in commonly used units. To solve the problem, a new, local coordinate system was introduced. The axes of the new system are oriented north and east (like the GPS ones), but the units are expressed in meters. The origin of the new coordinate system was arbitrarily placed at the point defined by the lowest coordinate of longitude and latitude. The distances from each measurement point to the origin of the new coordinate system were calculated. The data were presented as the function of the distance calculated (see Figure 5). The basic statistical characteristics: minimum, maximum, mean and standard deviations were also calculated (see Table 1).
The charts were inspected for the zones, where measured values were higher than in the other measurements, which can be interpreted as background. A comparison was made between the data set gathered without the gas release and the fights taken with it. The difference is easily observed in Figure 5. The concentration’s range spans between 0 and 270 ppm × m for the first case, and is significantly narrower than ranges observed for the rest of the cases. The maximum value is much higher for the measurements with gas output turned on. It is worth noting, that aside from the measurements taken at flight altitude 3 m above the ground level, the standard deviation increased significantly but the difference is much lower than observed at maximum concentration. Based upon these observations, the following remarks were formulated:
- The measured values in the absence of a gas leakage have a shorter range than the ones registered when gas leakage was present.
- The measured values indicating leakage are spatially grouped together. They form a cluster with raised concentrations with a few high peaks.
- The higher the altitude of the UAV during the measurements, the lower the maximum values observed are.
The identification of the leaks in the measured data should therefore focus on the identification of the outlying measurement values. Next the vicinity of the peak values should be considered. The elevated concentrations suggest treating the area as a potential leakage place. Analysing the results obtained for different altitude, it can be noted, that the strongest signal was measured during the flights at 3 m above ground level. However, such low altitude resulted in large standard deviation and led to increased risk in UAV operation. Moreover, the airflow generated by UAV propellers may disturb the methane propagation and in that way influence the measurement’s result. It is suggested that flight altitude be no lower than 6 m. Unfortunately, the artificial source experiments were unable to assess the highest altitude limitation. The above conclusions were taken into account during the field tests.
3.2. In Situ Measurements
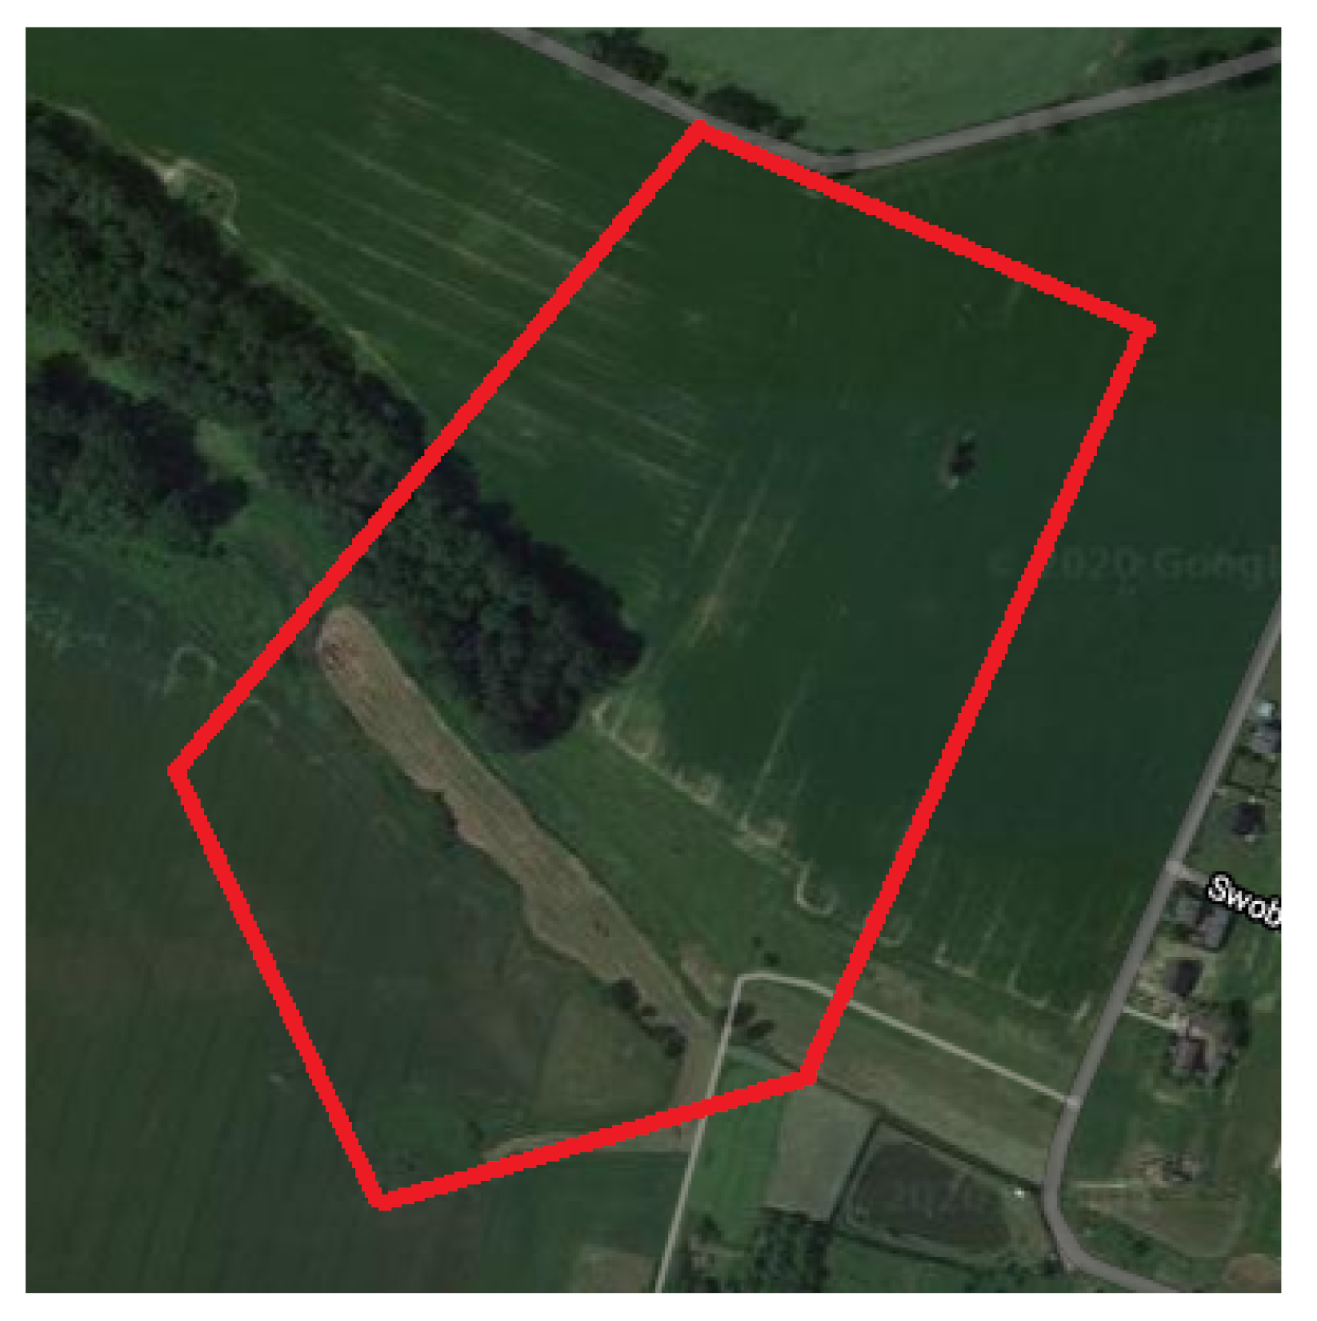
The field test was carried out in a rural area in the Silesian Voivodeship, Poland. The underground gas pipeline is located in a greenfield area, as shown in Figure 6. The gas pipeline lies approx. 1 m below ground level. The investigated segment of gas infrastructure was checked by the gas pipelines operating company workers revealing the existence of a leakage. The goal of the test was to identify the leakage using measurements taken by UAV.
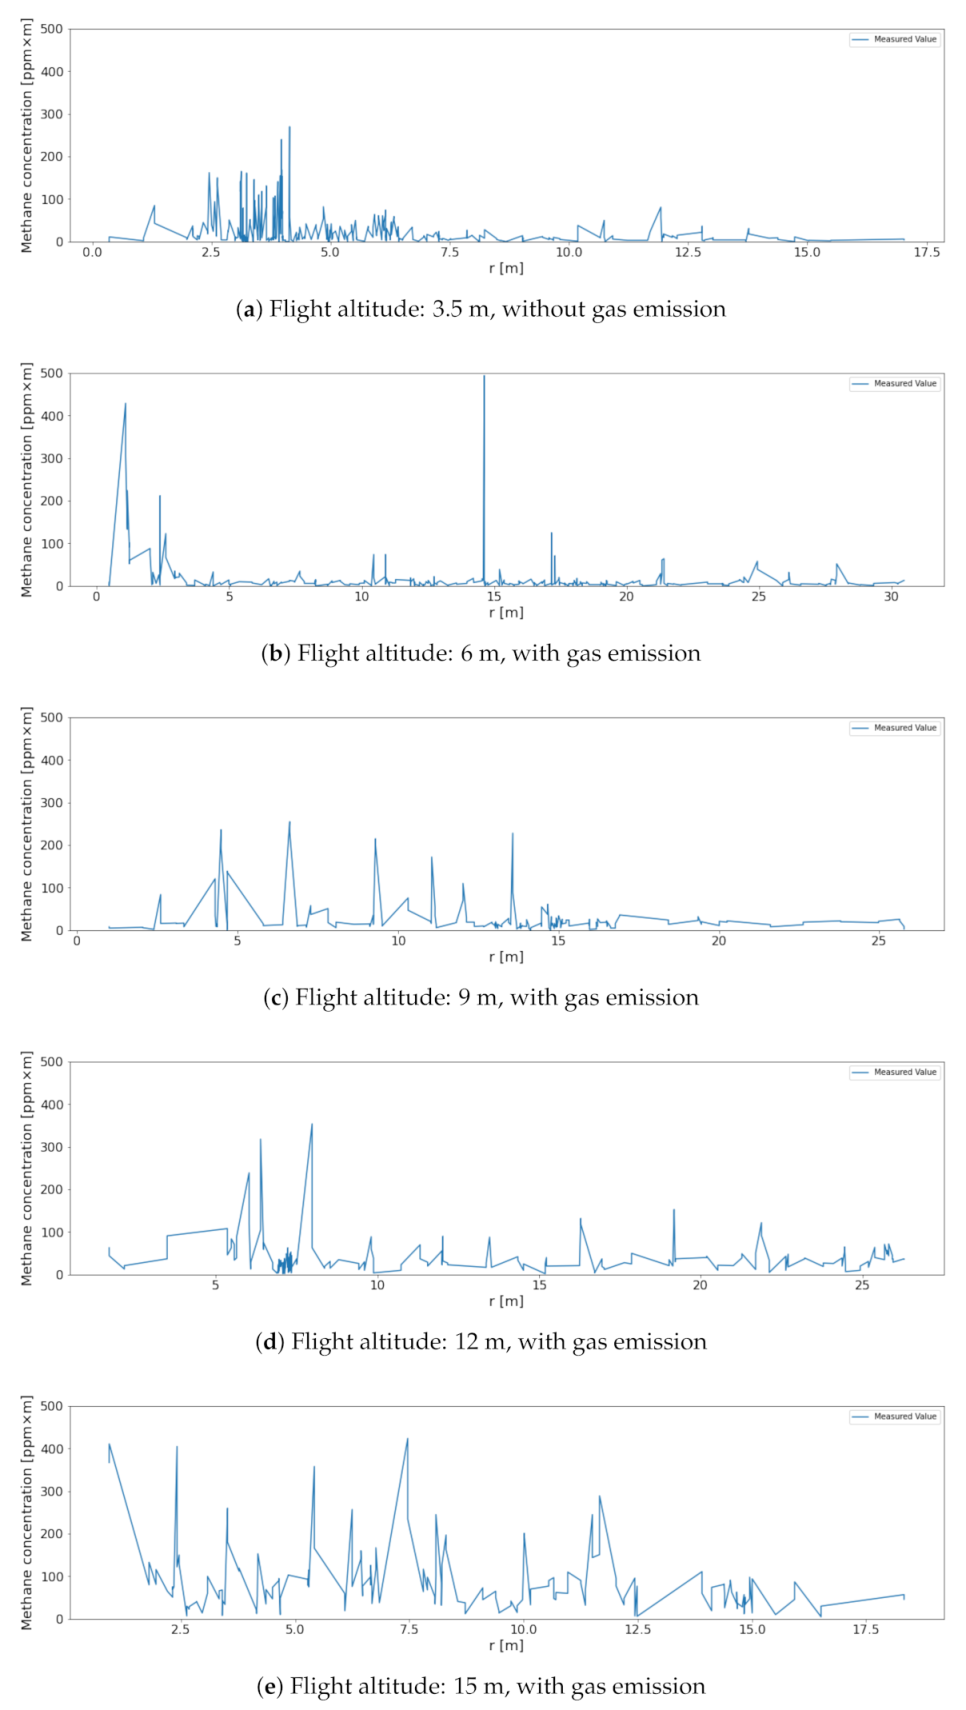
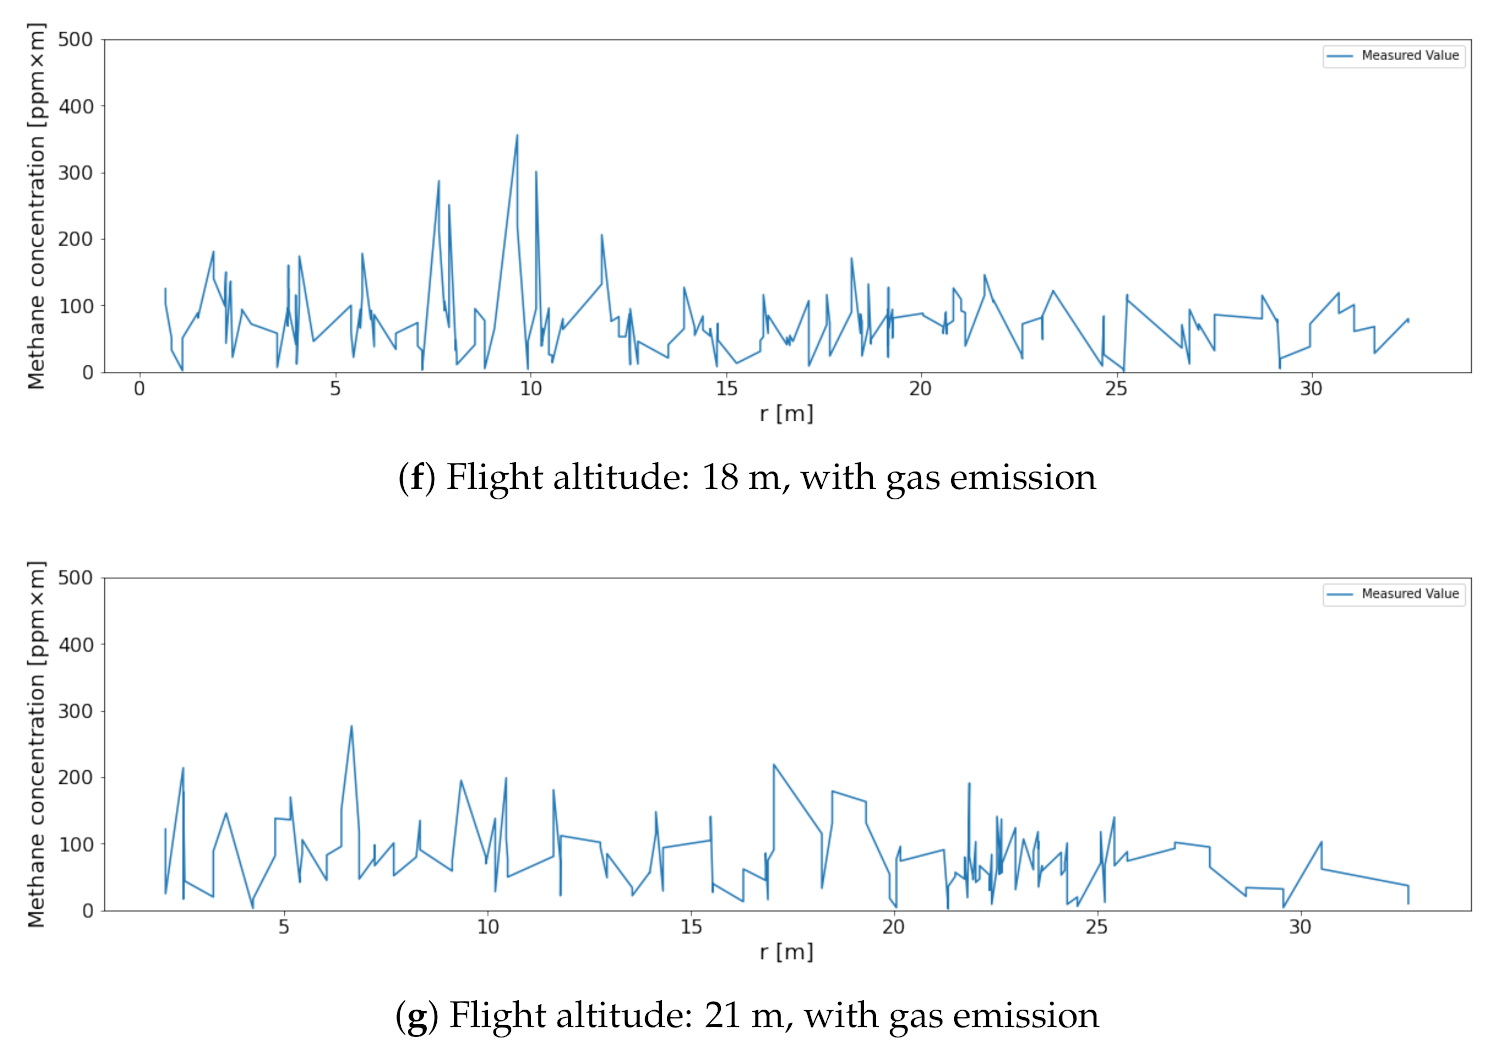
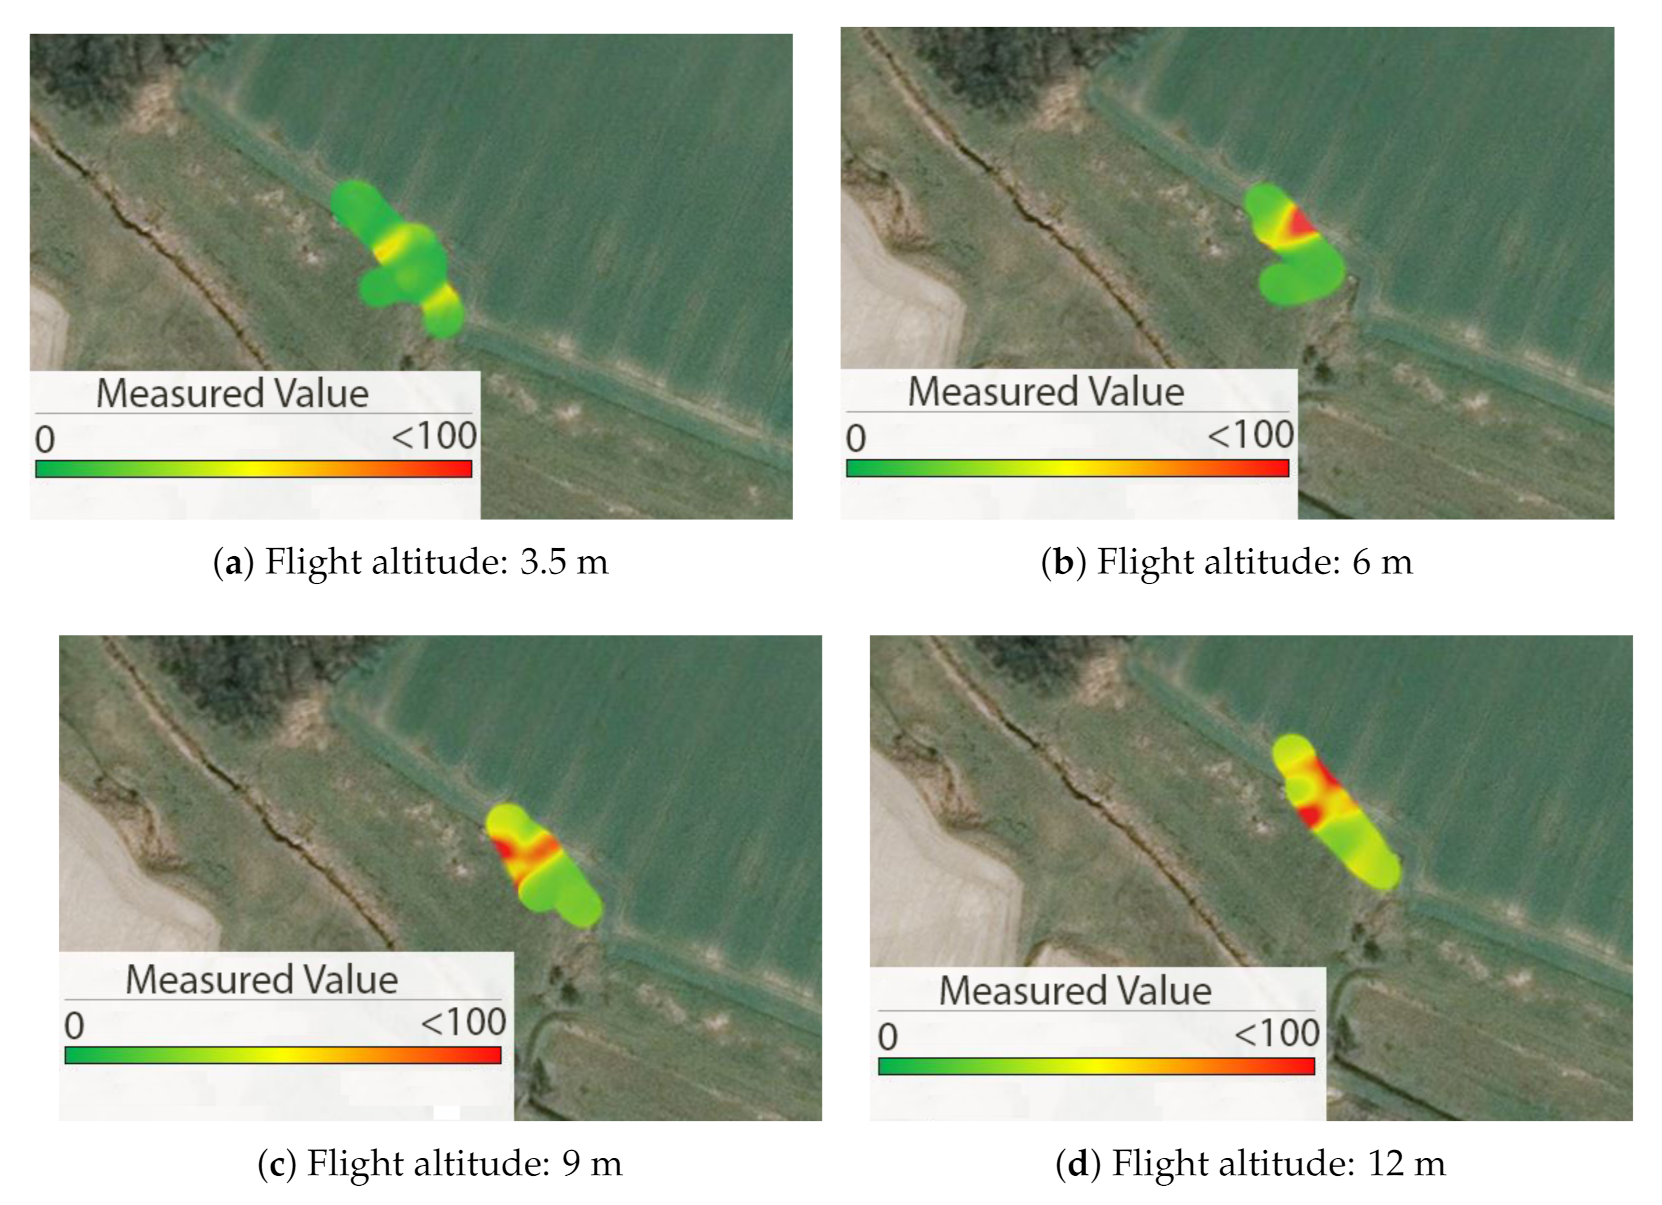
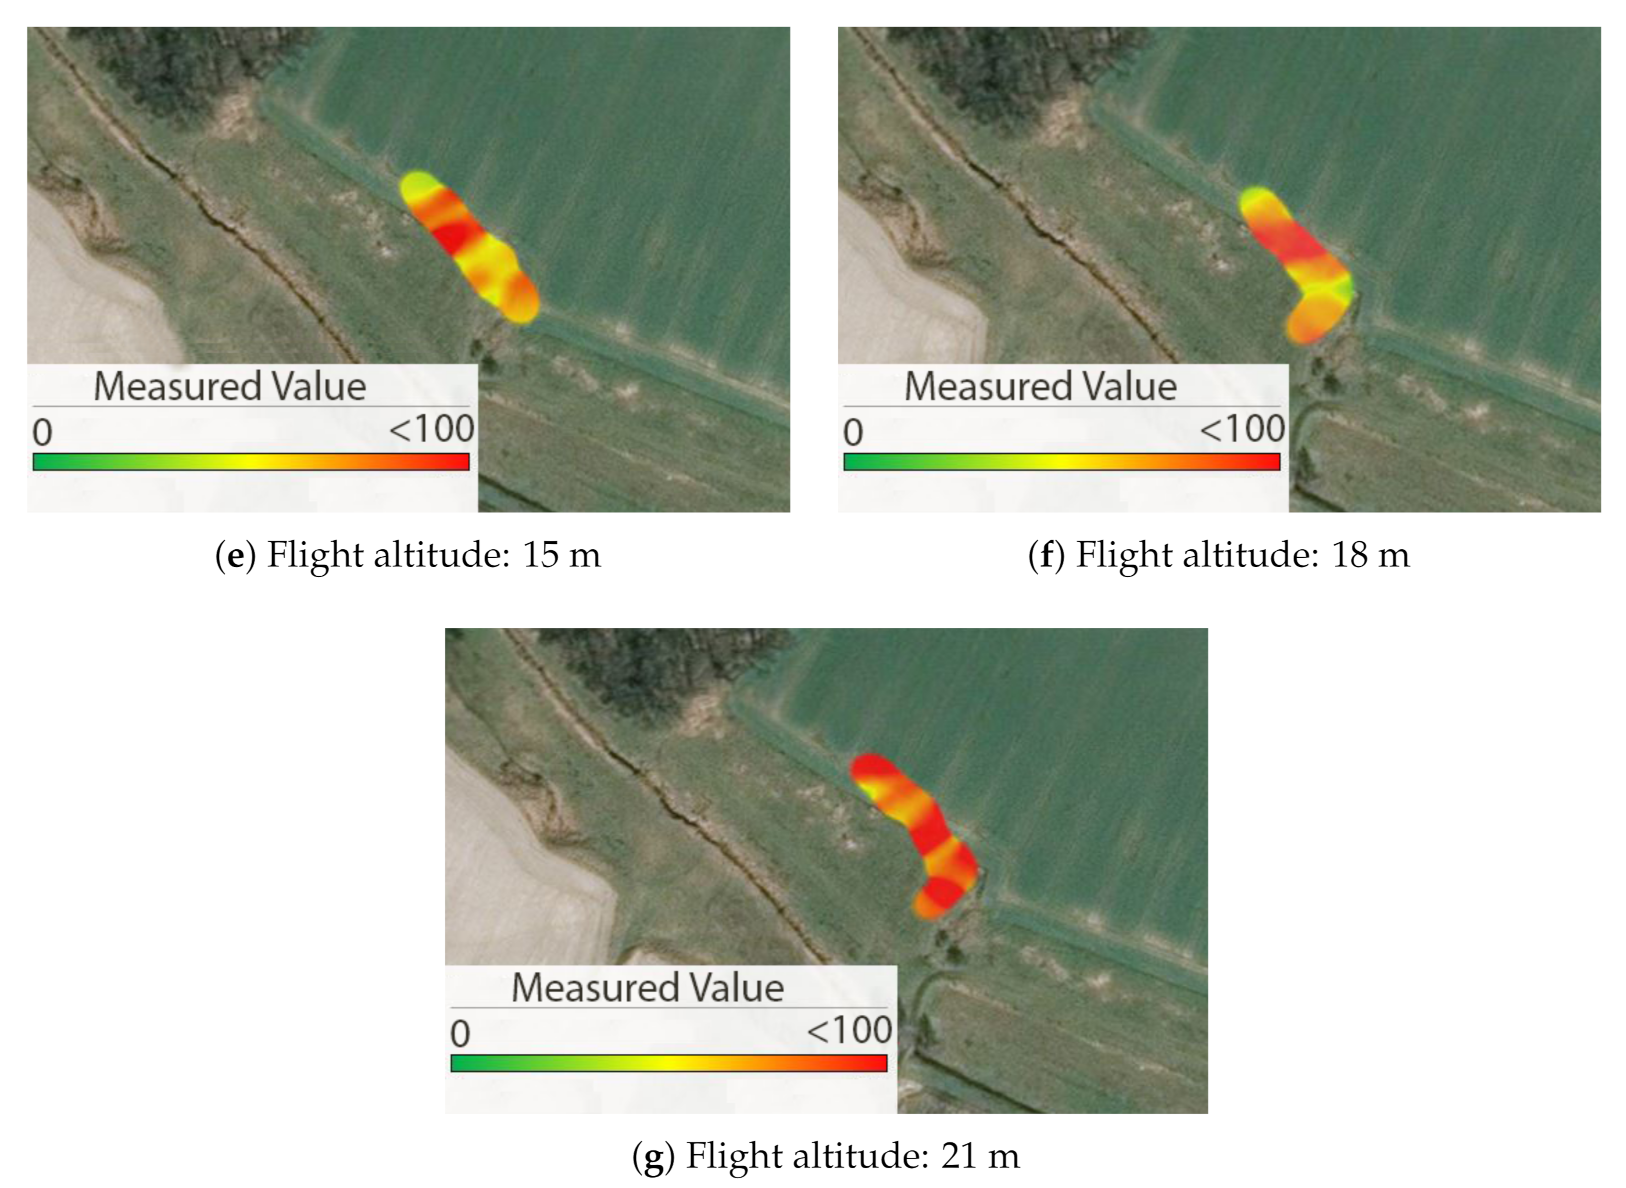
The flights took place at a series of altitudes, starting from 3.5 m. The other altitudes were 6, 9, 12, 15, 18 and 21 m. The route of the flights was located close to the point of the leakage. The measurement and data analysis procedure followed the one described in Section 3.1. All recorded measurements indicating error values were discarded. The remaining set for each series was processed to remove outliers. The DBSCAN, as before was used with minimum cluster size set to 40 and parameter equal to 0.3. The measurement’s coordinates were converted and expressed on a metric scale. The distances from the origin to the measurement points were calculated. The results of the measurements are presented in Figure 7. For each measurement flight, the basic statistical parameters were calculated (see Table 2).
4. Discussion
Both experiments revealed, that the methane leakages can be detected using airborne measurements. The UAV provides easiness in operation and can be used for flights performed at low altitudes, which turned out to be crucial in gas pipeline monitoring. The experiments with the artificial methane sources represent in fact the above the ground system. For the measurements taken while gas emission was turned on, the peaks showing highly elevated concentrations can be observed. Moreover, the measured background methane concentrations are much lower than detected in the leakage vicinity. The highest and the most prominent peaks showing the methane emission were observed at the lowest possible flight altitude (3 m above ground level). The effect was counter-intuitive, as at such a low altitude, disturbances caused by the air ejected by UAV rotors can be expected. The leakage zones are also clearly visible for measurements taken at 6 and 9 m above ground level. The used laser methane detector measures the methane concentration along the laser beam. For this reason, two aspects of the measurement should be taken into account. Firstly, it is important to properly direct the laser beam. If it hits the leakage point, high concentration values can be expected to be measured. Unfortunately, the placement of this point is not known during measurements. Secondly, the measurement concerns the column of air between the UAV and the ground, so its length affects the absolute values of the measurements. The higher the UAV flies and the longer the gas column is, the greater the share in the measurements of the scattered gas is expected. Because of that, the measurements are less sensitive to the precise aiming at the leakage point. However, this reduces the measured values (it is more difficult to distinguish between a leakage measurement and a background measurement). It also causes a loss in leakage location determination accuracy. On the basis of the measurements carried out, the optimal flight altitudes recommended for above the ground sources, vary from 6 to 9 m.
The results of in situ experiment were presented in Figure 8. The images show the spatial distribution of measured data. The underground leakage point can be easily spotted on the figures from Figure 8b–e as the red coloured shape. Such a zone can hardly be identified on the measurements taken for flight altitude 3.5 m and greater than 15 m above ground level.
The measurements’ results for the in situ tests differ from the ones gathered using the artificial, above the ground methane source. As the leakage is placed under the ground, the gas has to travel through the soil (a porous medium) before it is released into the atmospheric air. Therefore, hardly a single point of highly elevated concentrations can be observed. The source reveals itself as a surface one instead. The presented results show that it not only results in a wider area where increased concentrations are present, but also in the lowering of the maximum value. Nevertheless, the measurements revealed a similar pattern as was observed during measurements of the artificial, above ground methane source. The zones showing the potential location of leakage are wider, but still noticeable. One can also observe that the higher the altitude is, the more difficult it is to differentiate measurements potentially connected with the leakage from those of the background. The effect is caused by dispersion of the leakage gas in the air. On the other hand, UAV operation at low altitude is riskier. To summarize, it is recommended, that fields inspections are made by conducting flights at an altitude not lower than 4 m and not higher than 15 m. It is also recommended that flights over similar terrain far from the gas pipeline location is made to gather the measurements of the background concentrations. Such flights were conducted during the field experiment. The measured background concentrations were between 0 and 100 ppm×m. The values are in conformance with the data reported in the literature [21]. However, attention should be paid to other methane sources, such as decomposing organic matter. The experiments shows, that the UAV equipped with the laser detector can be used as a supporting tool for gas pipelines monitoring.
5. Conclusions
Experiments which aimed to determine the possibility of using a UAV to identify natural gas leakage from buried gas pipelines were carried out. The research results presented so far in the literature mainly concerned measurements of artificial sources of methane leakages and gas production areas. Our research mainly concerned experiments on the real leakage of natural gas from a buried pipeline.
The experiments were split into two phases. In the first a cylinder with nitrogen-methane gas composition placed above ground was used to simulate the leakage. This phase showed that the elevated, spatially correlated places of increased methane concentrations can easily be identified in the measurements’ results. The experiments also enabled the establishment of the data analysis procedure (removing outliers, visualizing). The experiences were utilized during the second phase, where field measurements were conducted. The results from the field experiments showed that regions of increased methane concentrations are significantly more difficult to identify, though they are still noticeable. The optimal flight altitude was established to be in the range of 4 to 15 m above ground level. If possible, lower altitudes should be chosen. The research showed that the aerial measurements based on UAV utilisation are precious sources of information allowing identification of gas leakages even for underground sources. The results are encouraging and very promising. Possible further research should aim at elaborating the technology capable of everyday usage for gas infrastructure operating companies.
Author Contributions
Conceptualization, S.I., P.K., M.S. and A.R.; methodology, S.I., P.K., M.S. and A.R.; software, S.I.; validation, P.K., M.S. and A.R.; formal analysis, S.I.; investigation, S.I. and P.K.; resources, A.R.; data curation, S.I. and M.S.; writing—original draft preparation, S.I. and P.K.; writing—review and editing, S.I., P.K. and A.R.; visualization, S.I., P.K. and M.S.; supervision, P.K.; project administration, P.K.; funding acquisition, S.I. and P.K. All authors have read and agreed to the published version of the manuscript.
Funding
This research was funded by Ministry of Science and Higher Education (Poland), grant number 11142018-132.
Institutional Review Board Statement
Not applicable.
Informed Consent Statement
Not applicable.
Data Availability Statement
Data sharing not applicable.
Conflicts of Interest
The authors declare no conflict of interest. The funders had no role in the design of the study; in the collection, analyses, or interpretation of data; in the writing of the manuscript, or in the decision to publish the results.
Abbreviations
The following abbreviations are used in this manuscript:
| GPS | Geographical Positioning System |
| OGI | Optical Gas Imaging |
| RMLD | Remote Methane Leak Detector |
| TDLAS | Tunable Diode Laser Absorption Spectroscopy |
| UAV | Unmanned Aerial Vehicle |
References
- Schwietzke, S.; Sherwood, O.A.; Bruhwiler, L.M.; Miller, J.B.; Etiope, G.; Dlugokencky, E.J.; Michel, S.E.; Arling, V.A.; Vaughn, B.H.; White, J.W.; et al. Upward revision of global fossil fuel methane emissions based on isotope database. Nature 2016, 538, 88–91. [Google Scholar] [CrossRef] [PubMed]
- Emran, B.; Tannant, D.; Najjaran, H. Low-altitude aerial methane concentration mapping. Remote Sens. 2017, 9, 823. [Google Scholar] [CrossRef] [Green Version]
- Gogola, K.; Rogala, T.; Magdziarczyk, M.; Smoliński, A. The mechanisms of endogenous fires occurring in extractive waste dumping facilities. Sustainability 2020, 12, 2856. [Google Scholar] [CrossRef] [Green Version]
- Chećko, J.; Urych, T.; Magdziarczyk, M.; Smoliński, A. Resource Assessment and Numerical Modeling of CBM Extraction in the Upper Silesian Coal Basin Poland. Energies 2020, 13, 2153. [Google Scholar] [CrossRef]
- Kalisz, P. Impact of Mining Subsidence on Natural Gas Pipeline Failures; IOP Conference Series: Materials Science and Engineering; IOP Publishing: Bristol, UK, 2019; Volume 471, p. 042024. [Google Scholar]
- Adegboye, M.A.; Fung, W.K.; Karnik, A. Recent advances in pipeline monitoring and oil leakage detection 422 technologies: Principles and approaches. Sensors 2019, 19, 2548. [Google Scholar] [CrossRef] [PubMed] [Green Version]
- Gómez, C.; Green, D.R. Small unmanned airborne systems to support oil and gas pipeline monitoring and mapping. Arab. J. Geosci. 2017, 10, 202. [Google Scholar] [CrossRef]
- Lu, B.; He, Y. Species classification using unmanned aerial vehicle (UAV)-acquired high spatial resolution imagery in a heterogeneous grassland. ISPRS J. Photogramm. Remote Sens. 2017, 128, 73–85. [Google Scholar] [CrossRef]
- Iwaszenko, S.; Kelm, M. Computer Software for Selected Plant Species Segmentation on Airborne Images. In Proceedings of the International Conference: Beyond Databases, Architectures and Structures, Poznan, Poland, 18–20 September 2018; Springer: Berlin/Heidelberg, Germany, 2018; pp. 309–322. [Google Scholar]
- Golston, L.; Aubut, N.; Frish, M.; Yang, S.; Talbot, R.; Gretencord, C.; McSpiritt, J.; Zondlo, M. Natural gas fugitive leak detection using an unmanned aerial vehicle: Localization and quantification of emission rate. Atmosphere 2018, 9, 333. [Google Scholar] [CrossRef] [Green Version]
- Yang, S.; Talbot, R.; Frish, M.; Golston, L.; Aubut, N.; Zondlo, M.; Gretencord, C.; McSpiritt, J. Natural gas fugitive leak detection using an unmanned aerial vehicle: Measurement system description and mass balance approach. Atmosphere 2018, 9, 383. [Google Scholar] [CrossRef] [Green Version]
- Martinez, B.; Miller, T.W.; Yalin, A.P. Cavity Ring-Down Methane Sensor for Small Unmanned Aerial Systems. Sensors 2020, 20, 454. [Google Scholar] [CrossRef] [PubMed] [Green Version]
- Barchyn, T.E.; Hugenholtz, C.H.; Fox, T.A. Plume detection modeling of a drone-based natural gas leak detection system. Elem. Sci. Anthropos. 2019, 7. [Google Scholar] [CrossRef]
- Bretschneider, T.R.; Shetti, K. UAV-based gas pipeline leak detection. In Proceedings of the Asian Conference on Remote Sensing, Nay Pyi Taw, Myanmar, 27–31 October 2014. [Google Scholar]
- Kamrat, W.; Ostrowski, T. Zastosowanie dronów w diagnostyce infrastruktury energetycznej. Przegląd Gazowniczy 2017, 4, 15–16. [Google Scholar]
- Tannant, D.; Zheng, W.; Smith, K.; Cahill, A. Evaluation of a Drone and Laser-Based Methane Sensor for Detection of a Surface Release of Methane; University of British Columbia: Vancouver, BC, Canada, 2018. [Google Scholar]
- Wang, M.L.; Lynch, J.P.; Sohn, H. Sensor Technologies for Civil Infrastructures, Volume 1: Sensing Hardware and Data Collection Methods for Performance Assessment; Elsevier: Amsterdam, The Netherlands, 2014. [Google Scholar]
- Li, H.Z.; Mundia-Howe, M.; Reeder, M.D.; Pekney, N.J. Gathering pipeline methane emissions in Utica shale using an unmanned aerial vehicle and ground-based mobile sampling. Atmosphere 2020, 11, 716. [Google Scholar] [CrossRef]
- Tannant, D.; Smith, K.; Cahill, A.; Hawthorne, I.; Ford, O.; Black, A.; Beckie, R. Evaluation of a Drone and Laser-Based Methane Sensor for Detection of Fugitive Methane Emissions; British Columbia Oil and Gas Research and Innovation Society: Vancouver, BC, Canada, 2018. [Google Scholar]
- Neumann, P.P.; Kohlhoff, H.; Hüllmann, D.; Lilienthal, A.J.; Kluge, M. Bringing Mobile Robot Olfaction to the next dimension—UAV-based remote sensing of gas clouds and source localization. In Proceedings of the 2017 IEEE International Conference on Robotics and Automation (ICRA), Singapore, 29 May–3 June 2017; IEEE: Piscataway, NJ, USA, 2017; pp. 3910–3916. [Google Scholar]
- Neumann, P.P.; Kohlhoff, H.; Hüllmann, D.; Krentel, D.; Kluge, M.; Dzierliński, M.; Lilienthal, A.J.; Bartholmai, M. Aerial-based gas tomography–from single beams to complex gas distributions. Eur. J. Remote. Sens. 2019, 52, 2–16. [Google Scholar] [CrossRef] [Green Version]
- Demusiak, G. Nowe metody kontroli szczelności sieci i instalacji gazu ziemnego z wykorzystaniem ręcznych detektorów laserowych do zdalnego wykrywania wycieków metanu. Nafta-Gaz 2010, 66, 287–296. [Google Scholar]
Figure 1.
The principle of measuring methane concentration using a flying platform with a laser detector.
Figure 1.
The principle of measuring methane concentration using a flying platform with a laser detector.

Figure 2.
The two phase experiments workflow.

Figure 3.
The test and data processing workflow.

Figure 4.
Comparison between raw and cleaned data.

Figure 5.
The measured methane concentrations for artificial gas source.

Figure 6.
The map of the area inspected for underground natural gas leakage.

Figure 7.
The measured methane concentrations for field tests.


Figure 8.
The areas with elevated methane concentration detected by unmanned aerial vehicle (UAV) platform during in situ experiments.
Figure 8.
The areas with elevated methane concentration detected by unmanned aerial vehicle (UAV) platform during in situ experiments.


Table 1.
The statistical parameters of the artificial gas source measurements (all values in ppm × m).
Table 1.
The statistical parameters of the artificial gas source measurements (all values in ppm × m).
| Case | Min | Max | Mean | Std. dev. |
|---|---|---|---|---|
| Flight altitude: 3 m, without gas | 0 | 270 | 58.63 | 43.346 |
| Flight altitude: 3 m, with gas emission | 0 | 3340 | 71.88 | 201.96 |
| Flight altitude: 6 m, with gas emission | 0 | 1507 | 42.34 | 66.77 |
| Flight altitude: 9 m, with gas emission | 0 | 1006 | 54.75 | 74.51 |
| Flight altitude: 12 m, with gas emission | 0 | 701 | 44.10 | 80.72 |
Table 2.
The statistical parameters of the natural gas pipeline leakage measurements (all values in ppm×m).
Table 2.
The statistical parameters of the natural gas pipeline leakage measurements (all values in ppm×m).
| Case | Min | Max | Mean | Std. dev. |
|---|---|---|---|---|
| Flight altitude: 3.5 m | 0 | 270 | 25.66 | 38.37 |
| Flight altitude: 6 m | 0 | 494 | 16.17 | 44.19 |
| Flight altitude: 9 m | 0 | 255 | 29.77 | 46.36 |
| Flight altitude: 12 m | 2 | 354 | 37.07 | 42.05 |
| Flight altitude: 15 m | 5 | 424 | 85.24 | 76.12 |
| Flight altitude: 18 m | 1 | 356 | 75.06 | 50.93 |
| Flight altitude: 21 m | 2 | 277 | 79.01 | 49.33 |
Publisher’s Note: MDPI stays neutral with regard to jurisdictional claims in published maps and institutional affiliations. |
© 2021 by the authors. Licensee MDPI, Basel, Switzerland. This article is an open access article distributed under the terms and conditions of the Creative Commons Attribution (CC BY) license (http://creativecommons.org/licenses/by/4.0/).
Share and Cite
MDPI and ACS Style
Iwaszenko, S.; Kalisz, P.; Słota, M.; Rudzki, A. Detection of Natural Gas Leakages Using a Laser-Based Methane Sensor and UAV. Remote Sens. 2021, 13, 510. https://0-doi-org.brum.beds.ac.uk/10.3390/rs13030510
AMA Style
Iwaszenko S, Kalisz P, Słota M, Rudzki A. Detection of Natural Gas Leakages Using a Laser-Based Methane Sensor and UAV. Remote Sensing. 2021; 13(3):510. https://0-doi-org.brum.beds.ac.uk/10.3390/rs13030510
Chicago/Turabian StyleIwaszenko, Sebastian, Piotr Kalisz, Marcin Słota, and Andrzej Rudzki. 2021. "Detection of Natural Gas Leakages Using a Laser-Based Methane Sensor and UAV" Remote Sensing 13, no. 3: 510. https://0-doi-org.brum.beds.ac.uk/10.3390/rs13030510
Note that from the first issue of 2016, this journal uses article numbers instead of page numbers. See further details here.