Article

Hyperspectral Reflectance and Indices for Characterizing the Dynamics of Crop–Weed Competition for Water

1
French Associates Institute for Agriculture and Biotechnology of Drylands, Sede Boqer Campus, Ben-Gurion University of the Negev, Beer Sheva 8499000, Israel
2
Department of Plant Pathology and Weed Research, Newe Ya’ar Research Center, Agricultural Research Organization (ARO)-Volcani Center, Ramat-Yishay 30095, Israel
3
Geography and Environmental Development, Ben-Gurion University of the Negev, Beer Sheva 8410501, Israel
4
Homeland Security Institute, Ben-Gurion University of the Negev, Beer Sheva 8410501, Israel
5
The Albert Katz International School for Desert Studies, Ben-Gurion University of the Negev, Sede Boqer Campus, Beer Sheva 8499000, Israel
*
Author to whom correspondence should be addressed.
Submission received: 8 December 2020 / Revised: 20 January 2021 / Accepted: 26 January 2021 / Published: 1 February 2021
(This article belongs to the Special Issue Remote and Proximal Assessment of Plant Traits)

Abstract

:
Understanding the spectral characteristics of crops in response to stress caused by weeds is a basic step in improving the precision of agricultural technologies that manage weeds in the field. This research focused on the competition between corn (Zea mays) and redroot pigweed (Amaranthus retroflexus), a common weed that strongly reduces corn yield. The aim of this research was to characterize the physiological changes that occur in corn during early growth because of crop–weed competition and to examine the ability to detect the effect of competition through hyperspectral measurements. A greenhouse experiment was conducted, and corn plants were examined during early growth, with and without weed competition. Hyperspectral measurements were combined with physiological measurements to examine the reflectance and photosynthetic activity of corn. Changes were expected to appear mainly in the short-wave infrared region (SWIR) due to competition for water. Relative water content (RWC), chlorophyll content, photosynthetic rate, and stomatal conductance were reduced in the presence of weeds, and intercellular CO2 levels increased. Deeper SWIR light absorption occurred in the weed treatment as expected, accompanied by spectral changes in the visible (VIS) and near infrared (NIR) ranges. The results highlight the potential of using spectral measurements as an indicator of competition for water.

Graphical Abstract

1. Introduction

The use of remote sensing technologies in agriculture is of great interest, enabling rapid and non-destructive measurements that can be used for research and field applications. Many studies have demonstrated the potential of spectral tools for the detection of plant responses to various biotic and abiotic stressors [1,2,3,4,5]. However, the specific spectral responses related to plant competition and weed stress are not widely addressed.
Among the many environmental variables that affect crops, weeds are thought to cause 9% of the world’s yield losses [6]. Proximal and remote sensing techniques are mostly used for automatic weed control and discrimination between crops and weeds for site-specific management [7,8]. Hyperspectral sensors are robust for these applications; however, characterization of the spectral reflectance features of important crops and weed species over a wide range of environmental conditions is still needed to apply these methods commercially [9]. While most studies focus on the detection of weeds in the field, only a few studies have demonstrated the use of remote sensing methods for the characterization and detection of crop responses to stress caused by weed interference, and this topic is addressed in this study.
This study focuses on corn (Zea mays) in the presence of the weed redroot pigweed (Amaranthus retroflexus), which is a common weed that strongly reduces corn yields [10]. A study on the effect of redroot pigweed density on corn yield demonstrated a 5% yield loss when redroot pigweed and corn were planted at the same time [10]. Yield losses in corn result primarily from weed interference and, therefore, corn has been the subject of much research investigating the mechanism of crop–weed competition [11]. To avoid major yield loss, weeds need to be removed shortly after crops emerge or even before emergence [12]. Hence, many studies have focused on investigating competition during the early growth stages of corn. Various processes during these critical stages lead to a reduction in yield, some of which are resource dependent and result from changes in water and nutrient availability [12].
Water is an essential resource for which plants compete, and its shortage causes stress, with various manifestations. Weedy conditions will cause crops to develop water stress symptoms, such as lower leaf water potential, reduced leaf stomatal conductance, and reduced photosynthetic rate at earlier stages [12]. Water stress occurring for a long time may lead to permanent damage to the photosynthesis process [12]. During the early vegetative stages of growth, water stress results in reduced height, biomass, and the rate of new leaf appearance [12]. Water deficit also stimulates stomatal closure through the changes in turgor pressure of guard cells and endogenous signals [13], leading to a reduction in mesophyll conductance and hence limiting photosynthesis [14]. Aside from stomatal regulation, stress affects the photosynthetic mechanism through changes in pigment concentrations; changes in chlorophyll-a and -b occur under drought [13]. When the rate of photosynthesis is reduced under stress, the plants become more sensitive to excessive light, which stimulates the production of reactive oxygen species, such as H2O2, which can cause photo-inhibition and oxidative damage to cell components [14]. Carotenoids and anthocyanins are pigments that play a role in the scavenging mechanism of reactive oxygen species and therefore accumulate in stressful conditions [13,15]. The water status of the leaf and concentration of these pigments are detectable and quantified by hyperspectral sensing, and different indices are developed for their estimation [1,16].
We predicted that the competition with weeds will affect the leaf biochemistry and photosynthetic activity and, therefore, will alter the reflectance of corn. Only few studies have focused on the spectral response of plants to resource competition [17,18]. In pine foliage, there are significant differences in the visible (VIS) range with high reflectance in young leaves grown under weak competition compared to those in leaves grown under strong competition [17]. These changes are primarily attributed to a decrease in water potential. However, reflectance in the infra-red regions was not significantly affected. Another study focused on the spectral response range, between 400 nm and 900 nm, to above- and belowground competition in Fraxinus mandshurica leaves [18]. For plants that were not exposed to competition, reflectance between 500 nm and 700 nm was lower due to higher pigment content. Hence, the spectral response is a good indicator of stress caused by competition.
These studies highlight the potential of detecting competition-related processes with hyperspectral measurements. However, the wide range of available spectral responses to a complex process such as competition is minimally understood, and is probably affected by the species involved in the competition and the environment [18]. Therefore, further research focusing on the spectral response expressing the competition between crop and weed species is necessary.
There is potential to differentiate crops under weed stress using spectral reflectance in purple and yellow nutsedge interference with cotton and soybean [19]. Soybeans that grow with and without weeds are classified based on their leaf reflectance measurements. However, the physiological changes that lead to the observed spectral signature differences were not discussed.
Understanding the link between spectral observation and plant physiology will allow better evaluation of the remote sensing capabilities for agriculture, as this link is not fully understood for crop–weed competition. The primary objective of the current study was to examine the potential of hyperspectral measurements to detect changes that result from crop–weed competition. The specific objectives were to (i) identify spectral regions and indices sensitive to weed stress and (ii) characterize the effect of competition on photosynthesis, pigments, and the plants’ water status.
A field experiment was conducted in which corn plants were grown with and without redroot pigweed. Physiological changes in corn were hypothesized to mainly affect the absorption in the short-wave infrared (SWIR) water absorption regions due to competition for water. Spectral measurements were combined with physiological measurements, attempting to physiologically explain changes in the hyperspectral signature.
This paper describes the experiment conducted and the different types of measurements, followed by the results of the physiological and the hyperspectral measurements and spectral analysis. The discussion integrates our findings and the link between the physiology and hyperspectral signature changes observed.

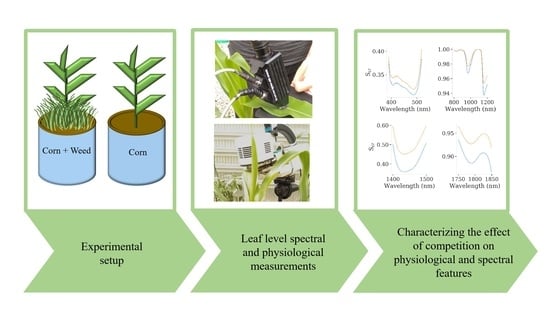
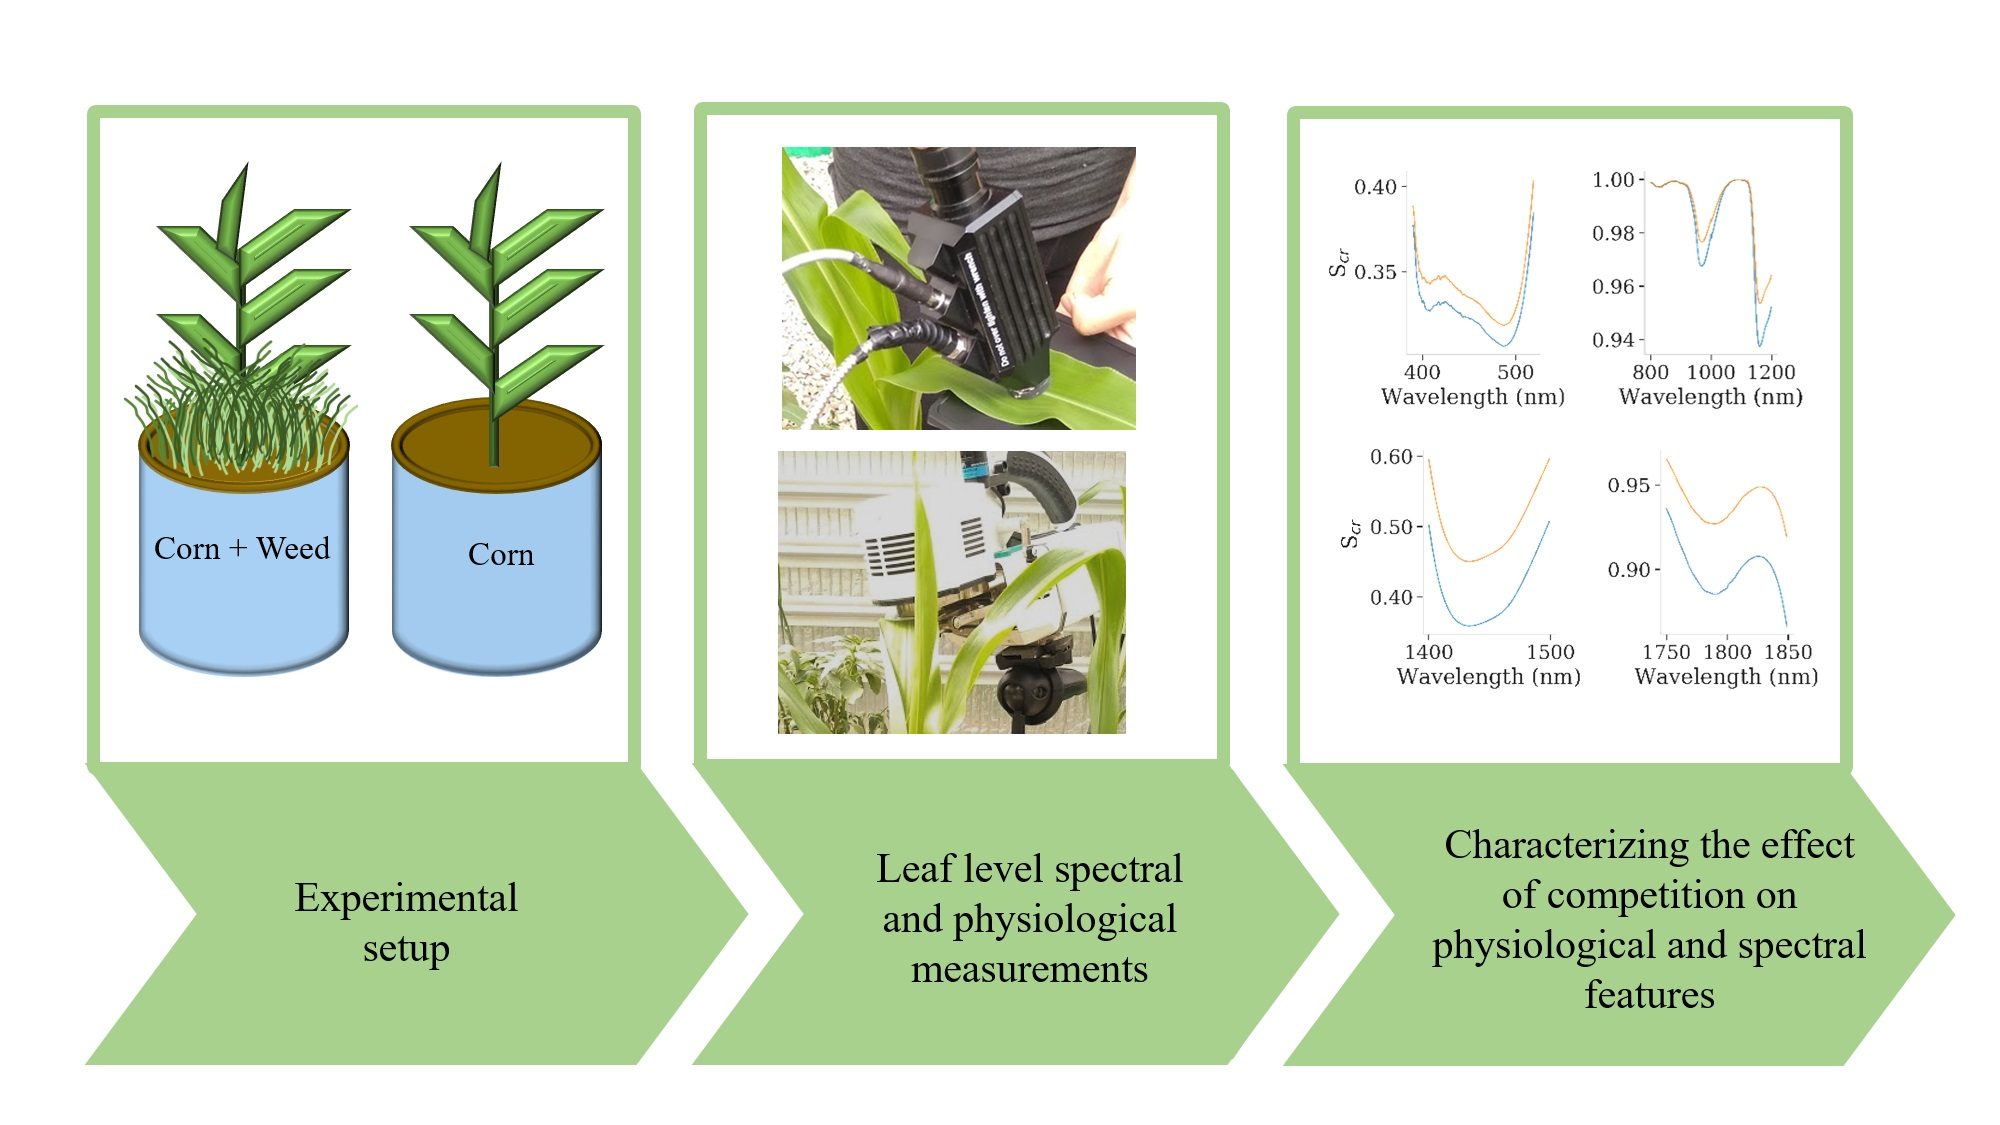
2. Materials and Methods

The experiment followed a random design. The treatments were randomly assigned to each pot. The setup included two levels of the treatment (weedy and weed-free corn), ten replications of each treatment, and a total of 20 experimental units. Heavy soil from Neve Ya’ar Research Center, Israel (Chromic Haploxererts, fine clayey; montmorillonite; thermic; 55% clay; 25% silt; 20% sand; 2% organic matter) was put into in 50 L pots. Each pot was irrigated to its field capacity. Following the irrigation stage, corn was sown with and without redroot pigweed seeds. The density of redroot pigweed seeds was equal in all the weed treatment pots (200 seeds per pot). Two corn seeds were sown at a depth of 2.5 cm with a 15 cm distance between the plants in all pots. The experiment was conducted in a greenhouse at Midreshet-Ben-Gurion Campus, Ramat-Hanegev, Israel, for 8 weeks between April and May 2020. According to [12], early vegetative stages of growth are the most critical regarding crop–weed competition. Therefore, the first measurements were taken when the corn sprouted 3–4 leaves, 29 days after sowing (DAS). The last day of measurements was conducted 57 DAS when 5–7 leaves emerged. The measurements were taken between 9:00 and 12:30. The measurements conducted on each day and the sample size are specified in Table 1. The greenhouse temperatures during the measurements ranged from 20.5–29.2 °C. Plants were irrigated manually once during the experiment 43 DAS.
Gas exchange measurements were taken using an infrared gas analyzer (Portable Photosynthetic System LI-6800, Licor, NE, USA). Measurements were taken from the uppermost fully expanded leaf of one corn plant in each pot at noon. CO2 was set to 400 ppm and photosynthetic photon flux density was set to 800 μmol m−2s−1.
Chlorophyll content was measured on the last day of measurements, 57 DAS (10 samples from every treatment), as described in [20]. Five leaf discs were cut from the middle section of the uppermost fully expanded leaf of one corn plant in each pot for chlorophyll measurement. The leaf discs were immediately placed into 1 mL of dimethyl sulfoxide (DMSO) and incubated in an oven at 65 °C overnight until the tissue was colorless. After incubation, the samples were diluted with DMSO at a ratio of 1:4, and the absorption was measured with a spectrophotometer at 665, 650, and 470 nm. Equations (1)–(3) were used to calculate chlorophyll-a, -b, and total carotenoid content, respectively [20]:
C h l   a = 13.34 × A 665 4.85 × A 650
C h l   b = 24.58 × A 650 6.65 × A 665
T o t a l   c a r t e n o i d s = ( 1000 × A 470 1.29 × C h l a 53.76 × C h l b ) ÷ 220
A leaf segment of ~9 cm2 was cut from the middle section of the uppermost fully expanded leaf from one corn plant in each pot to measure relative water content (RWC) (Equation (4)) [21]. The measurements were conducted 46 DAS (5 samples from every treatment) and on the last day of measurements, 57 DAS (10 samples from every treatment). The fresh weight was then measured shortly after cutting. The samples were then placed in de-ionized water in capped containers overnight to maintain approximately 100% relative humidity in the container for leaves to reach full hydration, at which point they were oven-dried at 65 °C, 48 h before measuring the dry weight. The relative water content was then calculated as follows [21]:
RWC ( % ) =   fresh   weight dry   weight Turgid   weight dry   weight
Adaxial leaf reflectance was measured with a field spectrometer (ASD FieldSpec-4, Analytical Spectral Devices, Inc., Boulder, CO, USA). The signatures were collected within the 350 to 2500 nm spectrum at a resolution of one nm. The probe was placed parallel to the leaf midrib and was turned 90 degrees to retrieve four measurements at different angles (0°, 90°, 180°, and 270°). The measurements were taken from the uppermost fully expanded leaf from one corn plant in each pot, and mean values of these four spectra were used for statistical analysis. White surface calibration was done before measuring the first plant, and again every time after sampling six plants. Measurements were taken with a black background placed on the abaxial side of the leaf. To normalize the reflectance spectra and allow comparison of individual absorption features from a common baseline, the continuum removal spectra (Scr) were calculated [22] with ViewSpec-Pro Software.
Ten common narrow-band indices (Table 2) related to different plant traits were calculated for each leaf measurement, including the structure insensitive pigment index (SIPI) [23], plant senescence reflectance index (PSRI) [24], modified anthocyanin reflectance index (mARI) [25], carotenoid reflectance indices (CRI1,CRI2) [26], photochemical reflectance index (PRI) [27], leaf water index (LWI) [28], moisture stress index (MSI) [29], normalized difference water index (NDWI) [30], and water band index (WBI) [31].
The variables were analyzed with two-way ANOVA using DAS and treatment as explanatory variables. The F-test assumption, normality of residuals, and homogeneity of variance were tested using the Shapiro–Wilk test and Levene’s test, respectively. In any case, where the ANOVA assumptions were not met, the data were log-transformed [32]. Hyperspectral data were analyzed in the same way on each of the 2150 wavelengths independently from 350 to 2500 nm. For the hyperspectral data, if the ANOVA assumptions were not met, an arc-sinus transformation was applied [32]. Following the ANOVA, a Student’s t-test was used to compare the means of the different treatments within each day of measurement. In any case, where the assumption of normality was not met, the non-parametric Mann–Whitney test was used instead and if variances were found not to be homogeneous, a t-test for unequal variances was used; if the two assumptions were not met, the data were log-transformed. Differences between days of measurements were examined using Tukey’s HSD (Honest significant differences) all pairwise comparisons test.
To better understand the relationship between spectral indices and the physiological measurements taken, Pearson correlation coefficients were calculated. All statistical analyses were performed using the Python programming language and “statsmodels” library [33].

3. Results

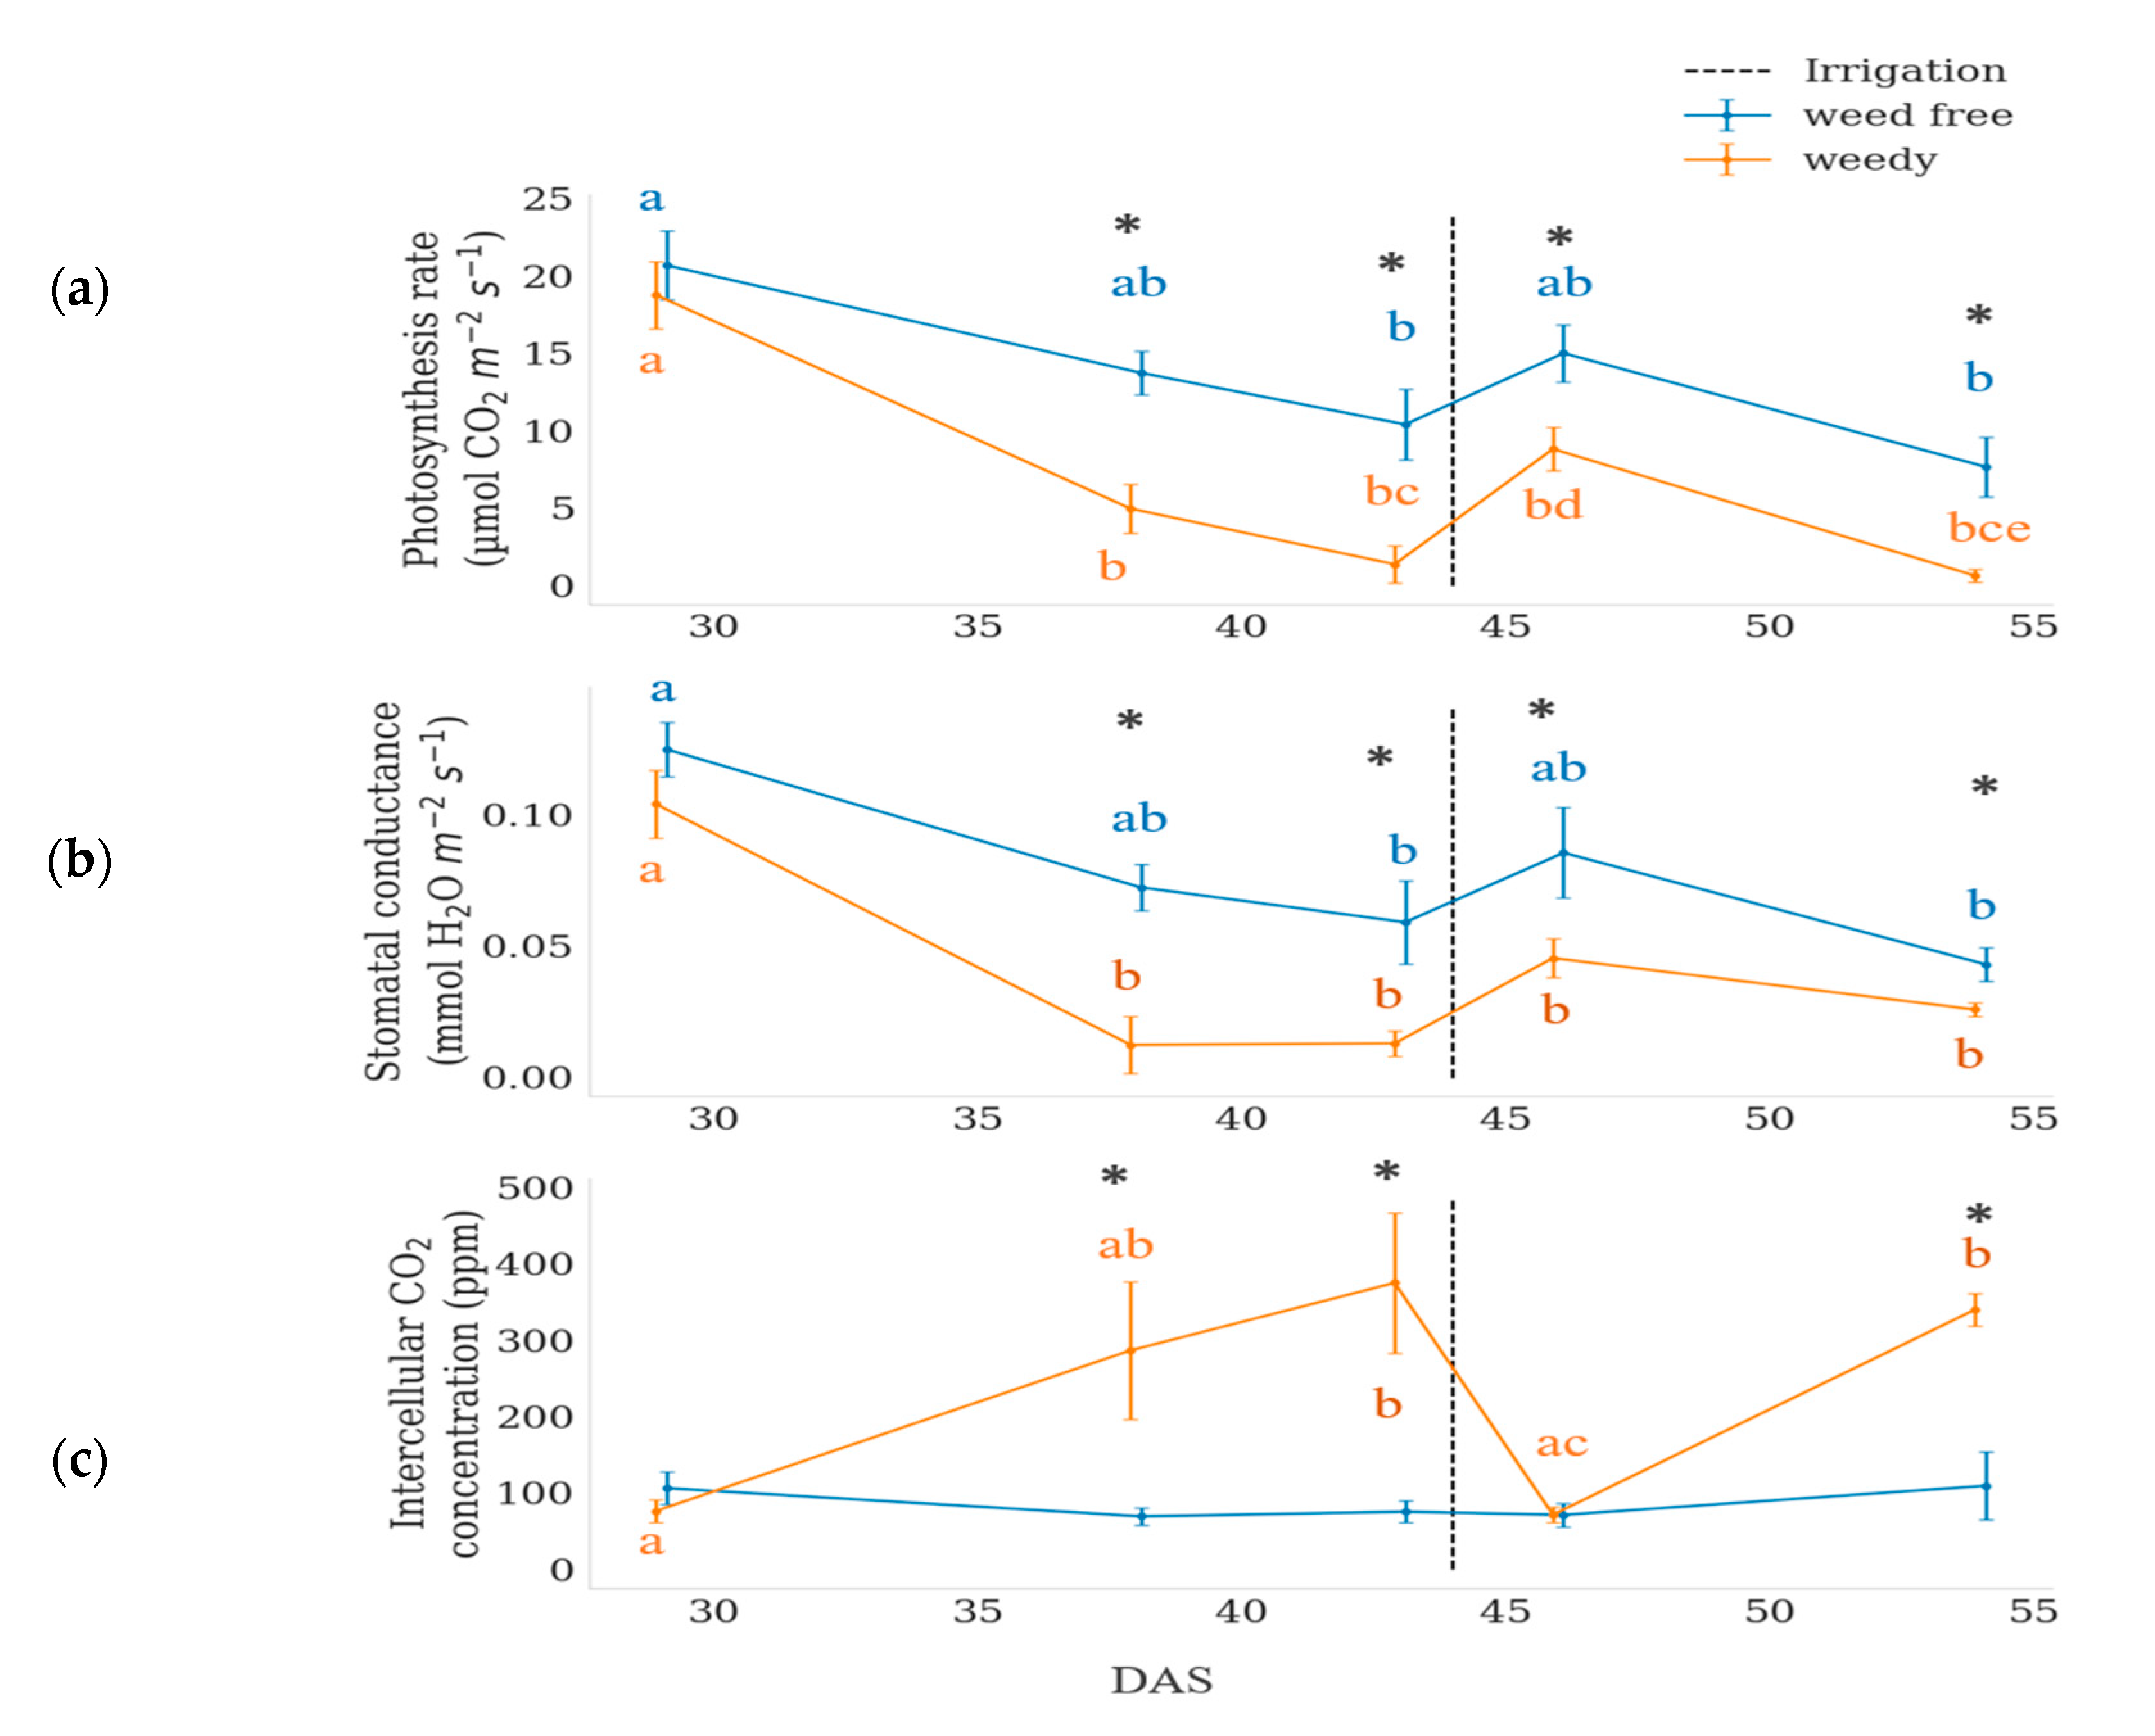
3.1. Physiological Measurments

Differences in photosynthetic rate and stomatal conductance between the weed and weed-free treatments were found on the second measurement of the first irrigation session (29–43 DAS) and the two measures remained different until the end of the experiment, regardless of irrigation 43 DAS (Table 3, Figure 1). The weed treatment resulted in a significantly lower photosynthetic rate (p < 0.001; Figure 1a), lower stomatal conductance (p < 0.001; Figure 1b), and higher intercellular CO2 (Ci; p < 0.001; Figure 1c). All variables were affected by the day of measurement (Table 3). The interaction between the day and the treatment effected photosynthetic rate (p < 0.001) and Ci (p < 0.001; Table 3).
The mean Ci remained relatively stable in the weed-free treatment throughout the experiment (Figure 1c). For the weed-treated corn, the mean Ci increased by 298.46 ppm during the first irrigation session (29 to 43 DAS), was reduced after irrigation 43 DAS to the same level as the weed-free corn (71.77 ppm), and then increased again in the following measurement (340.45 ppm), presenting a tight connection to the change in water availability resulting from weed competition (Figure 1c).
RWC was measured on the first day after irrigation (46 DAS) and the last day of measurements (57 DAS). RWC did not differ between the treatments 46 DAS (60%), and it was significantly lower in the presence of weeds (28%, p < 0.001) 57 DAS (Figure 2a). Pigment concentrations were measured on the last day of measurements (57 DAS) and revealed significantly lower chlorophyll-b (2.62 µmolm−2, p < 0.01) and higher carotenoid concentrations (1.22 µmolm−2, p < 0.05) in the weed treatment, with no significant changes in chlorophyll-a concentration (Figure 2b). The dry weight of the aboveground biomass of corn was significantly lower (2.56 g, p < 0.001) for the weed treatment (Figure 2c).

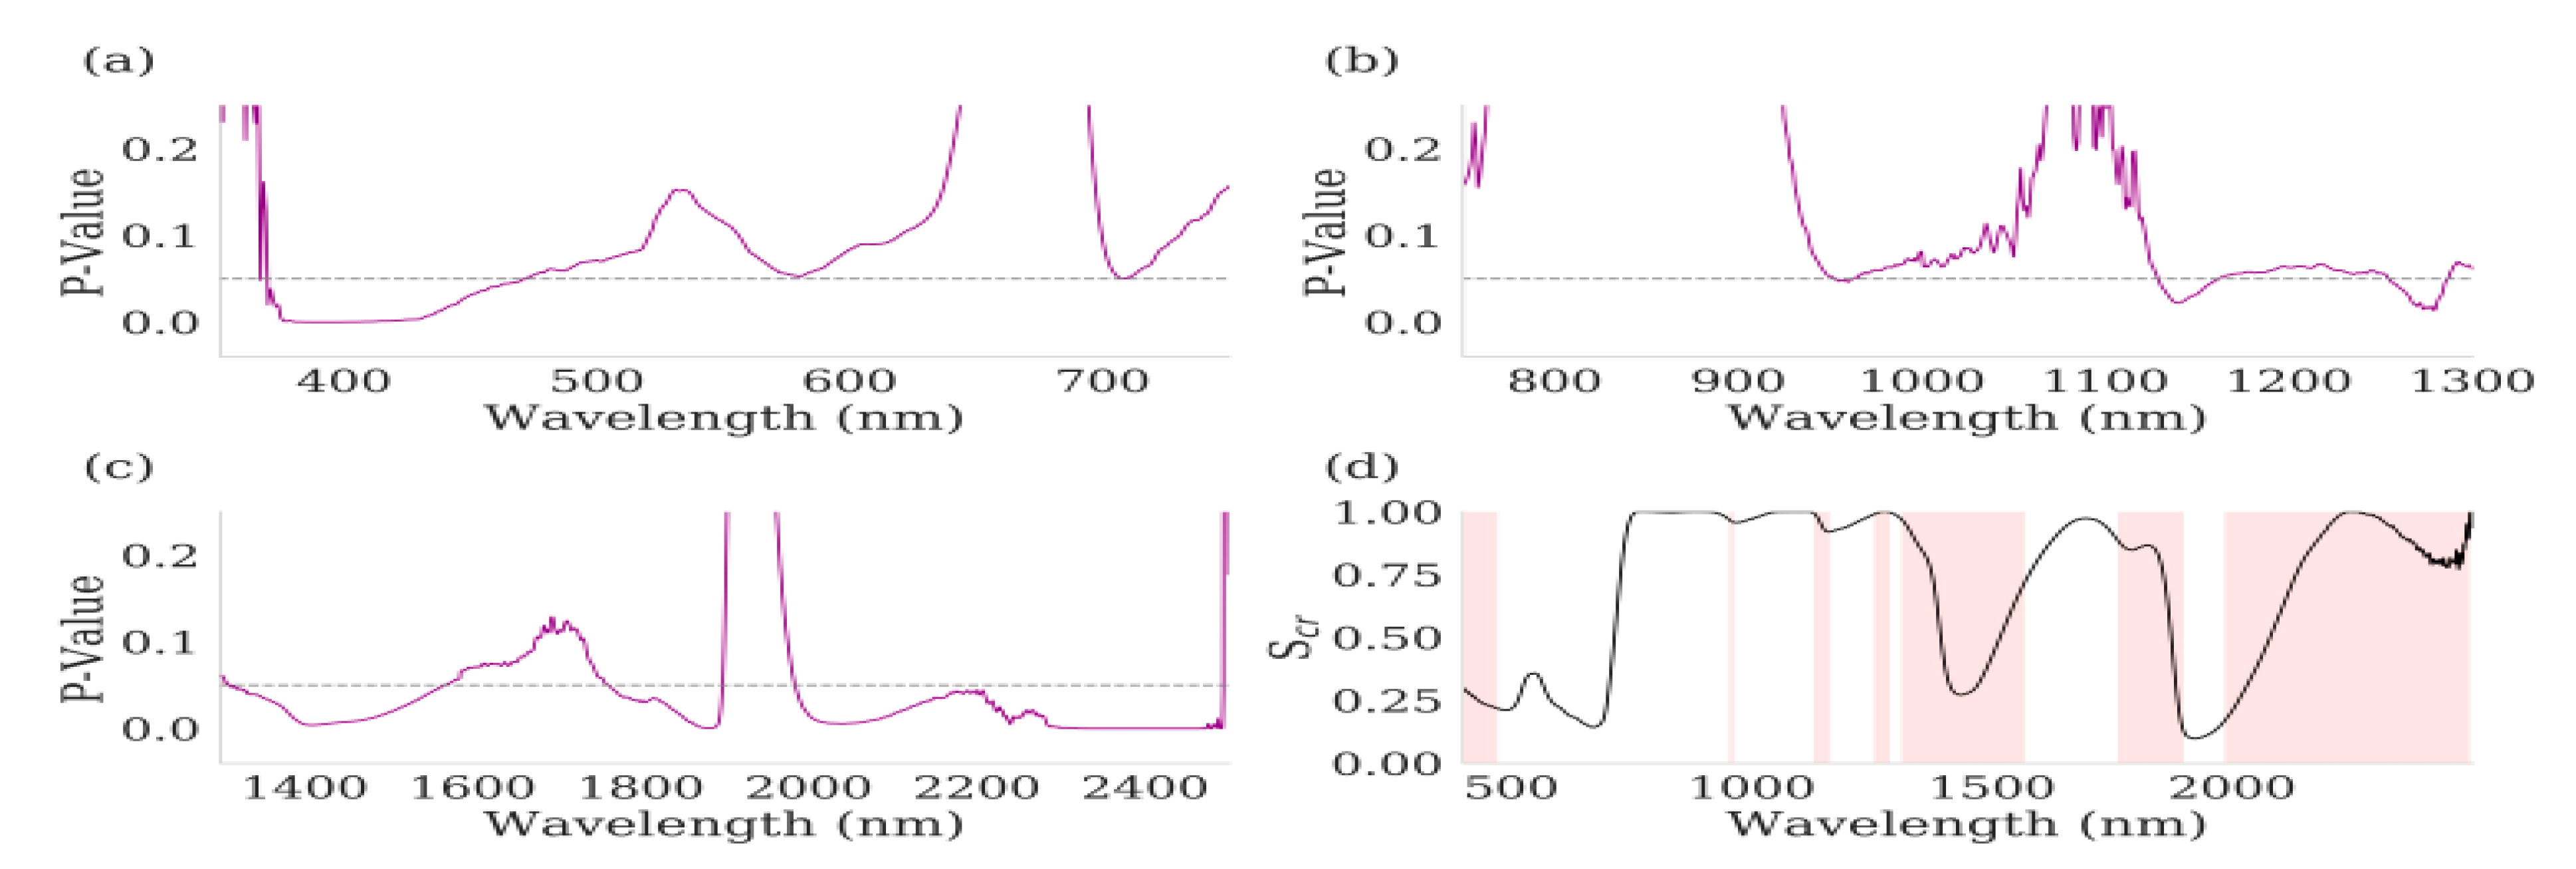
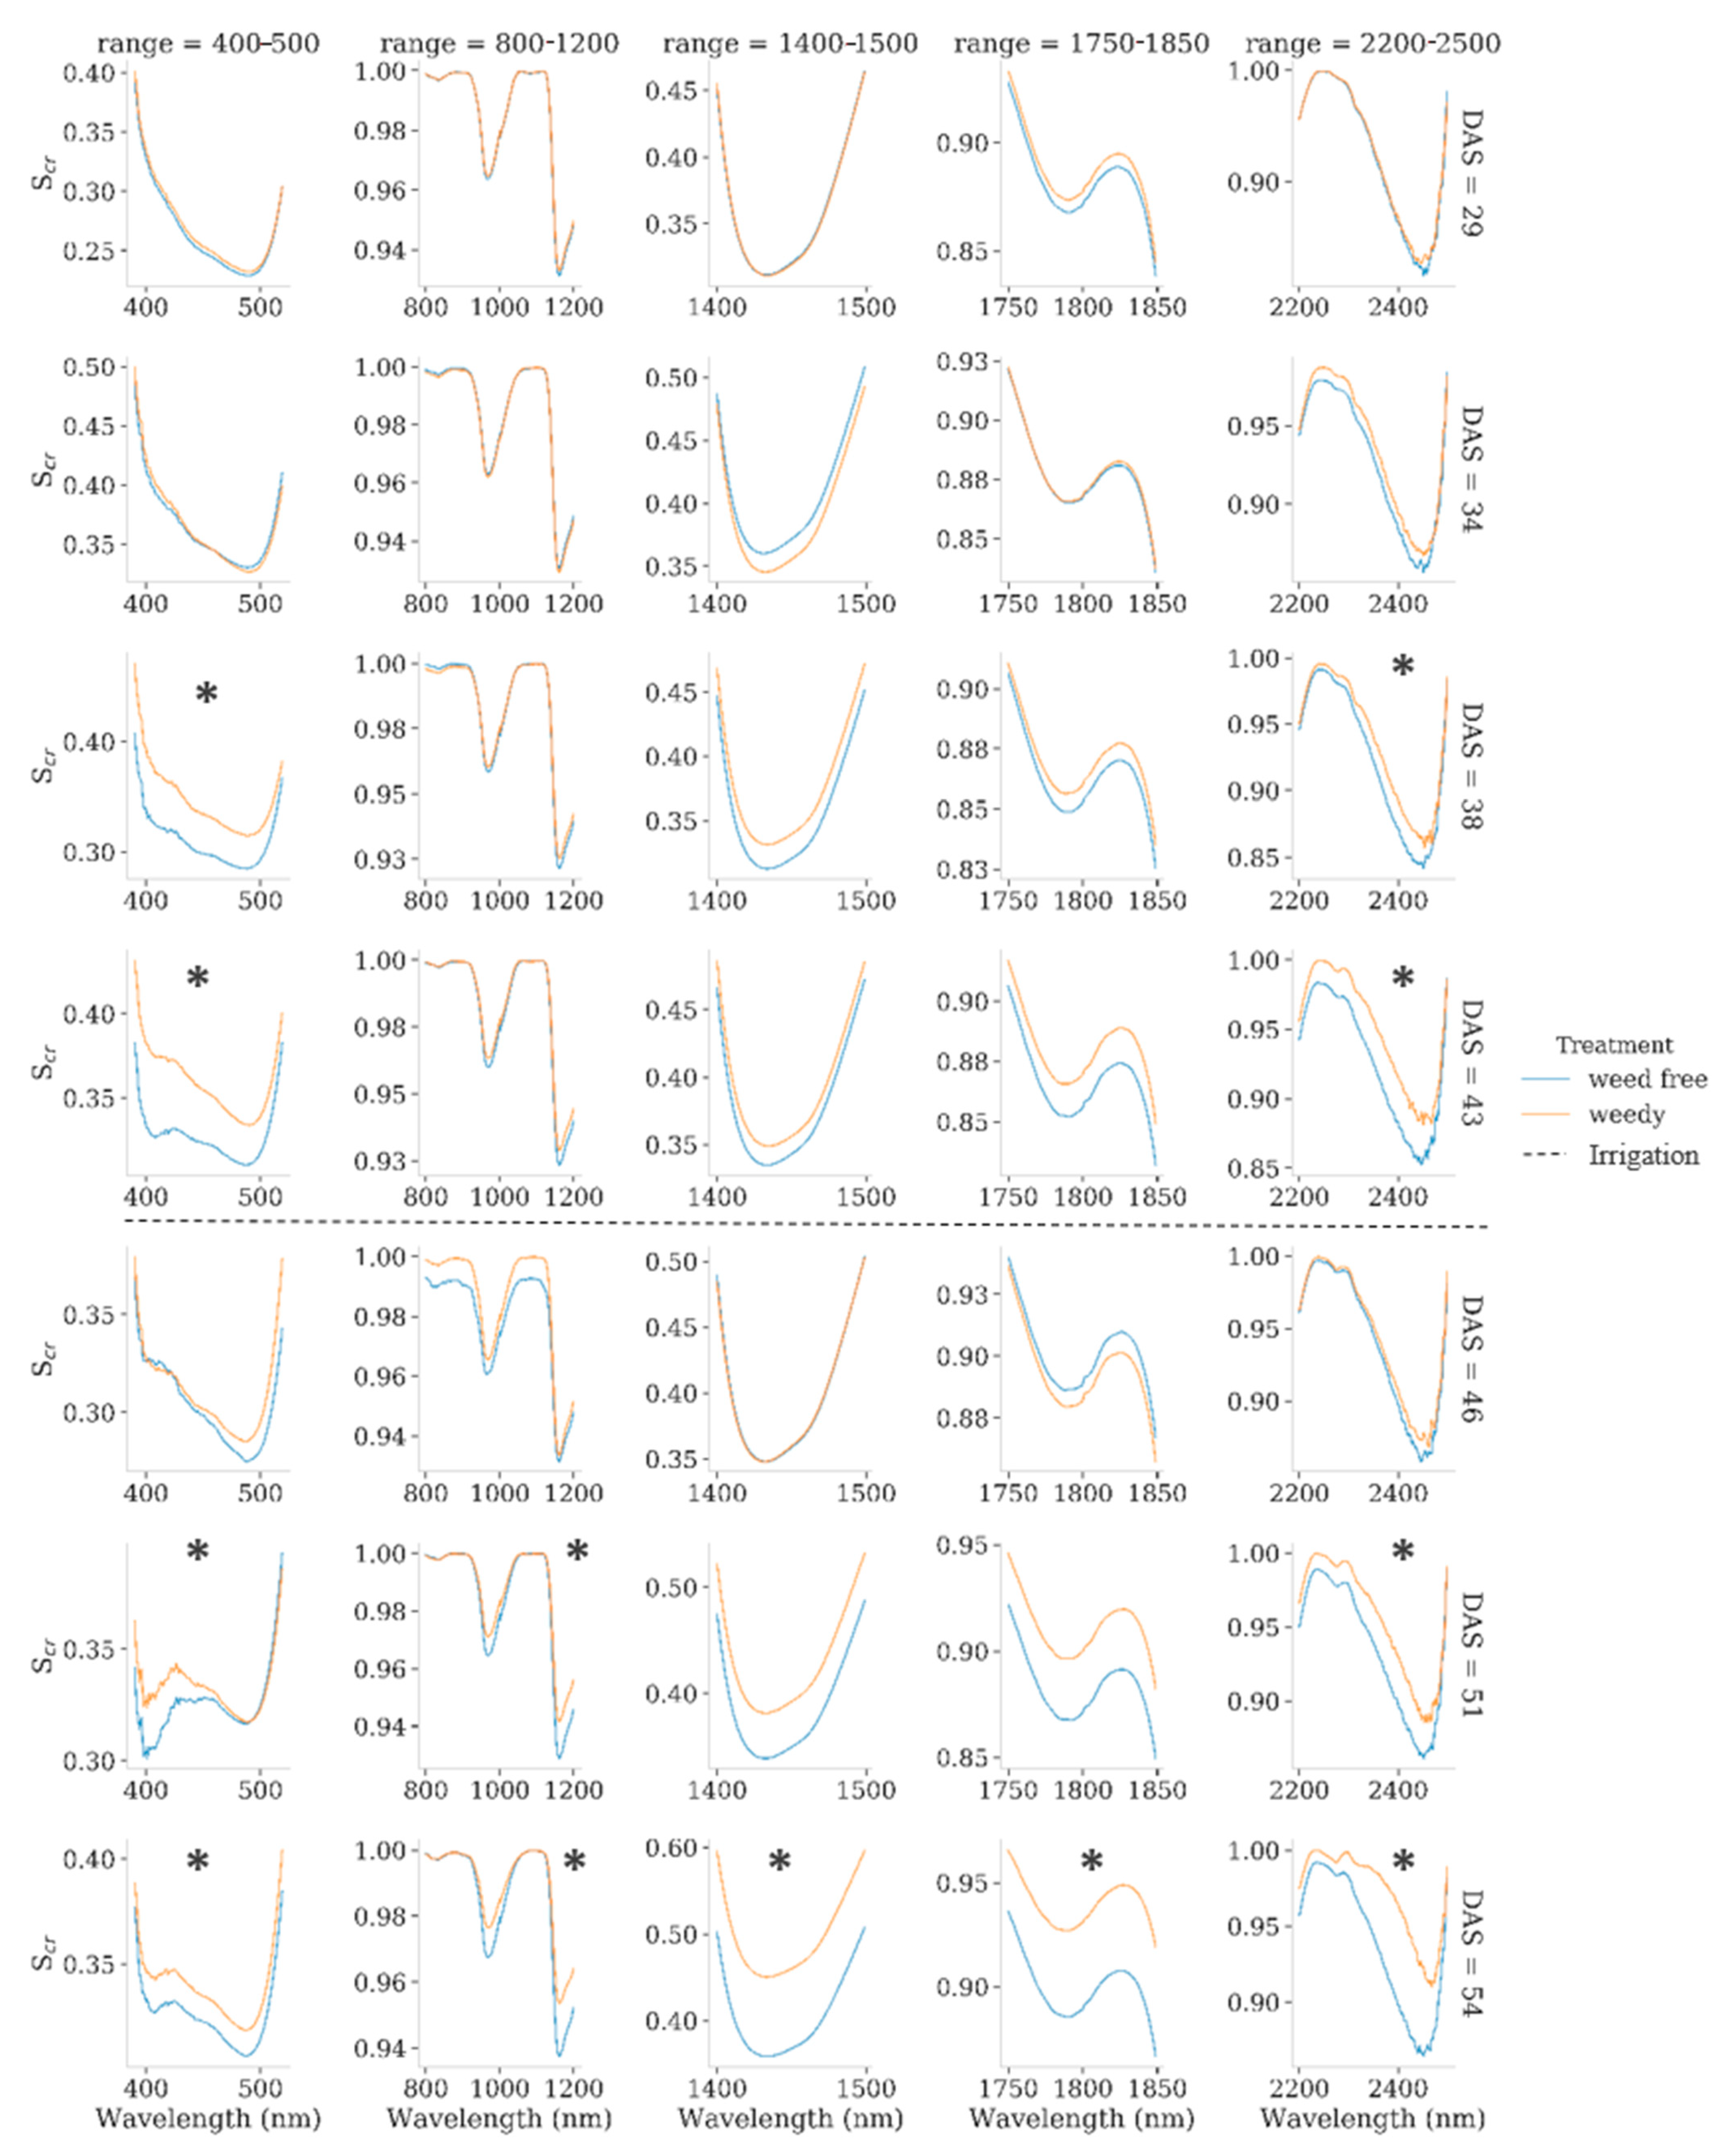
3.2. Hyperspectral Measurements

The Scr of the weed-free corn was compared to that of weed-treated corn to reveal spectral regions that were affected by the weeds. Figure 3a–c presents the treatment effect p-values at each wavelength, derived by two-way ANOVA. The analysis revealed a significant effect (α = 0.05) of the treatment in the VIS (370–470 nm, 604–612 nm), near infrared (NIR) (1129–1161 nm, 1255–1286 nm), and SWIR regions (1312–1567 nm, 1762–1897 nm, 1984–2493 nm). A more detailed examination of the regions revealed that the average Scr measured in those regions was consistently low for the weed-free corn on almost all days of measurements (Figure 4). A significant effect on SWIR absorption bands, with deeper absorption for weed-free corn, was expected due to the competition for water. The absorption features of weed-free corn were significantly deeper in the range of 2200–2500 nm on almost all days of measurements, excluding the first measurement after irrigation, and the first two measurements of the first irrigation session. This result signifies a tight bond between the changes in absorption during the drying process. Visible water stress symptoms (leaf rolling) were first found on the third day of measurement (38 DAS), where spectral differences occurred in the VIS region (~400–500 nm) and SWIR (~2300–2500 nm). After the plants were irrigated again (43 DAS), the same pattern appeared in the VIS region and SWIR. On the last two days of measurement, the weed-treated corn suffered from major water stress that was exacerbated by extreme weather. This enhanced the spectral differences between the treatments, and the number of ranges that were found to be significant on those two days was the largest (Figure 4).

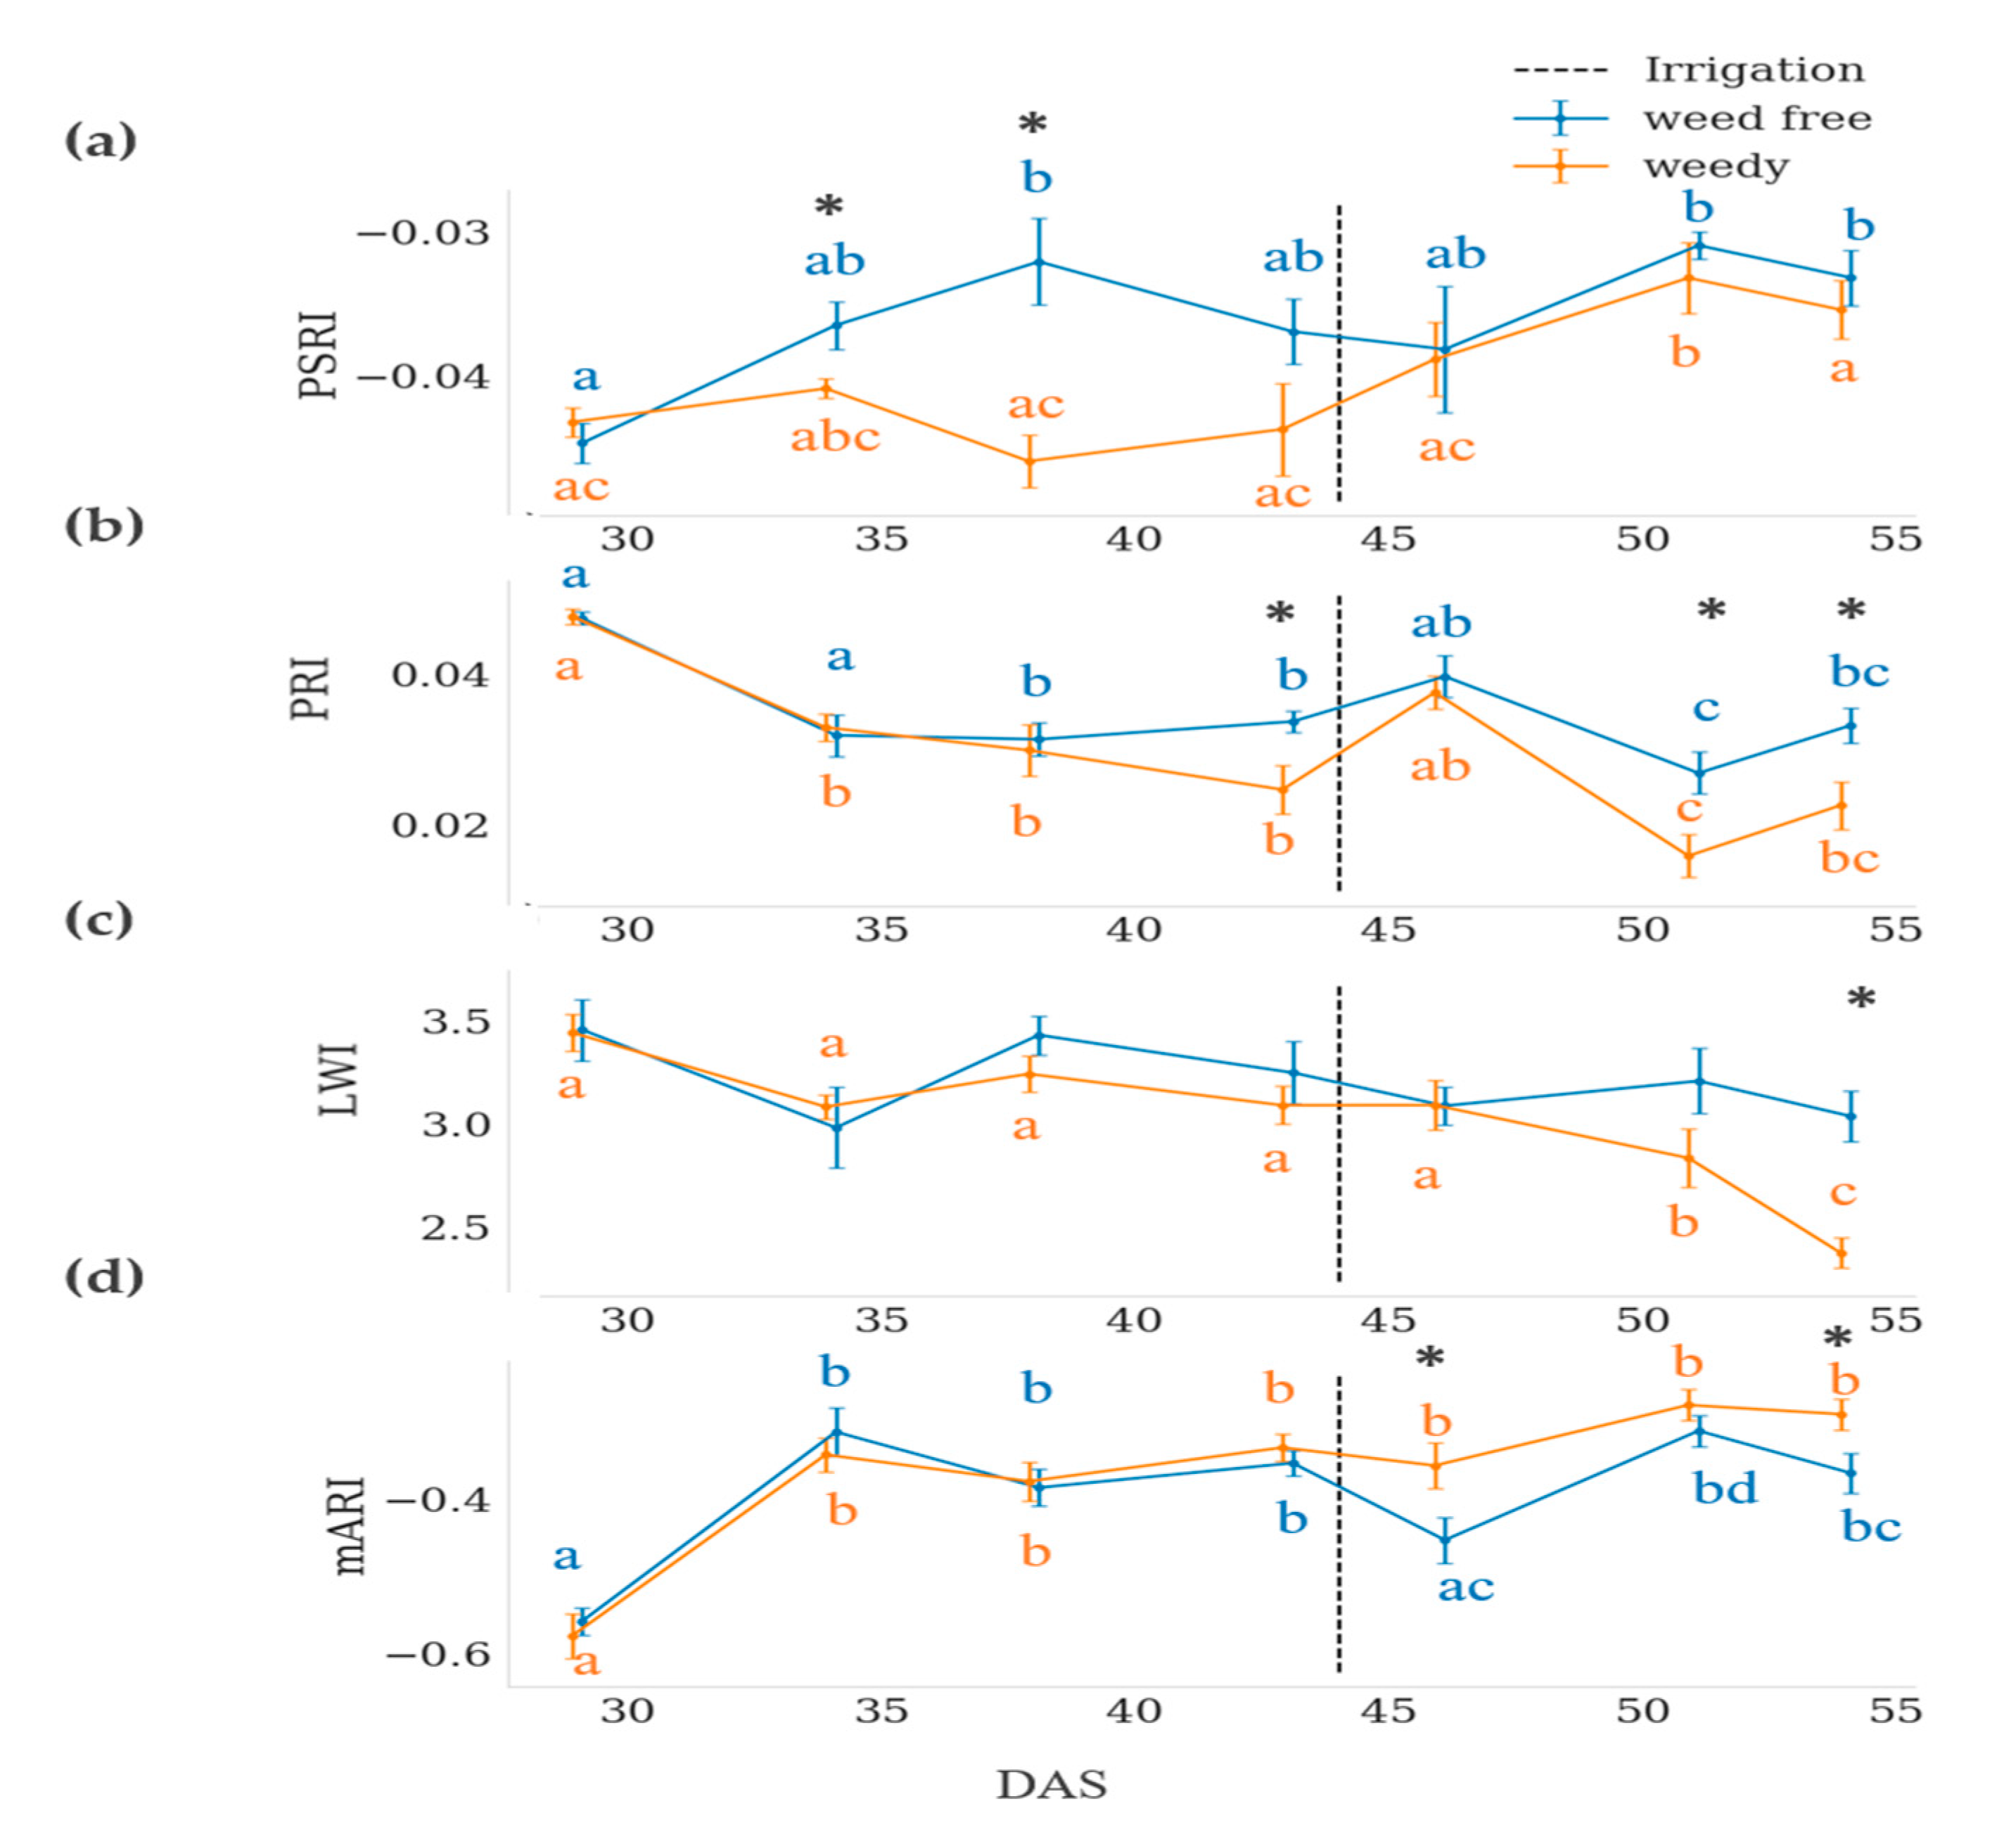
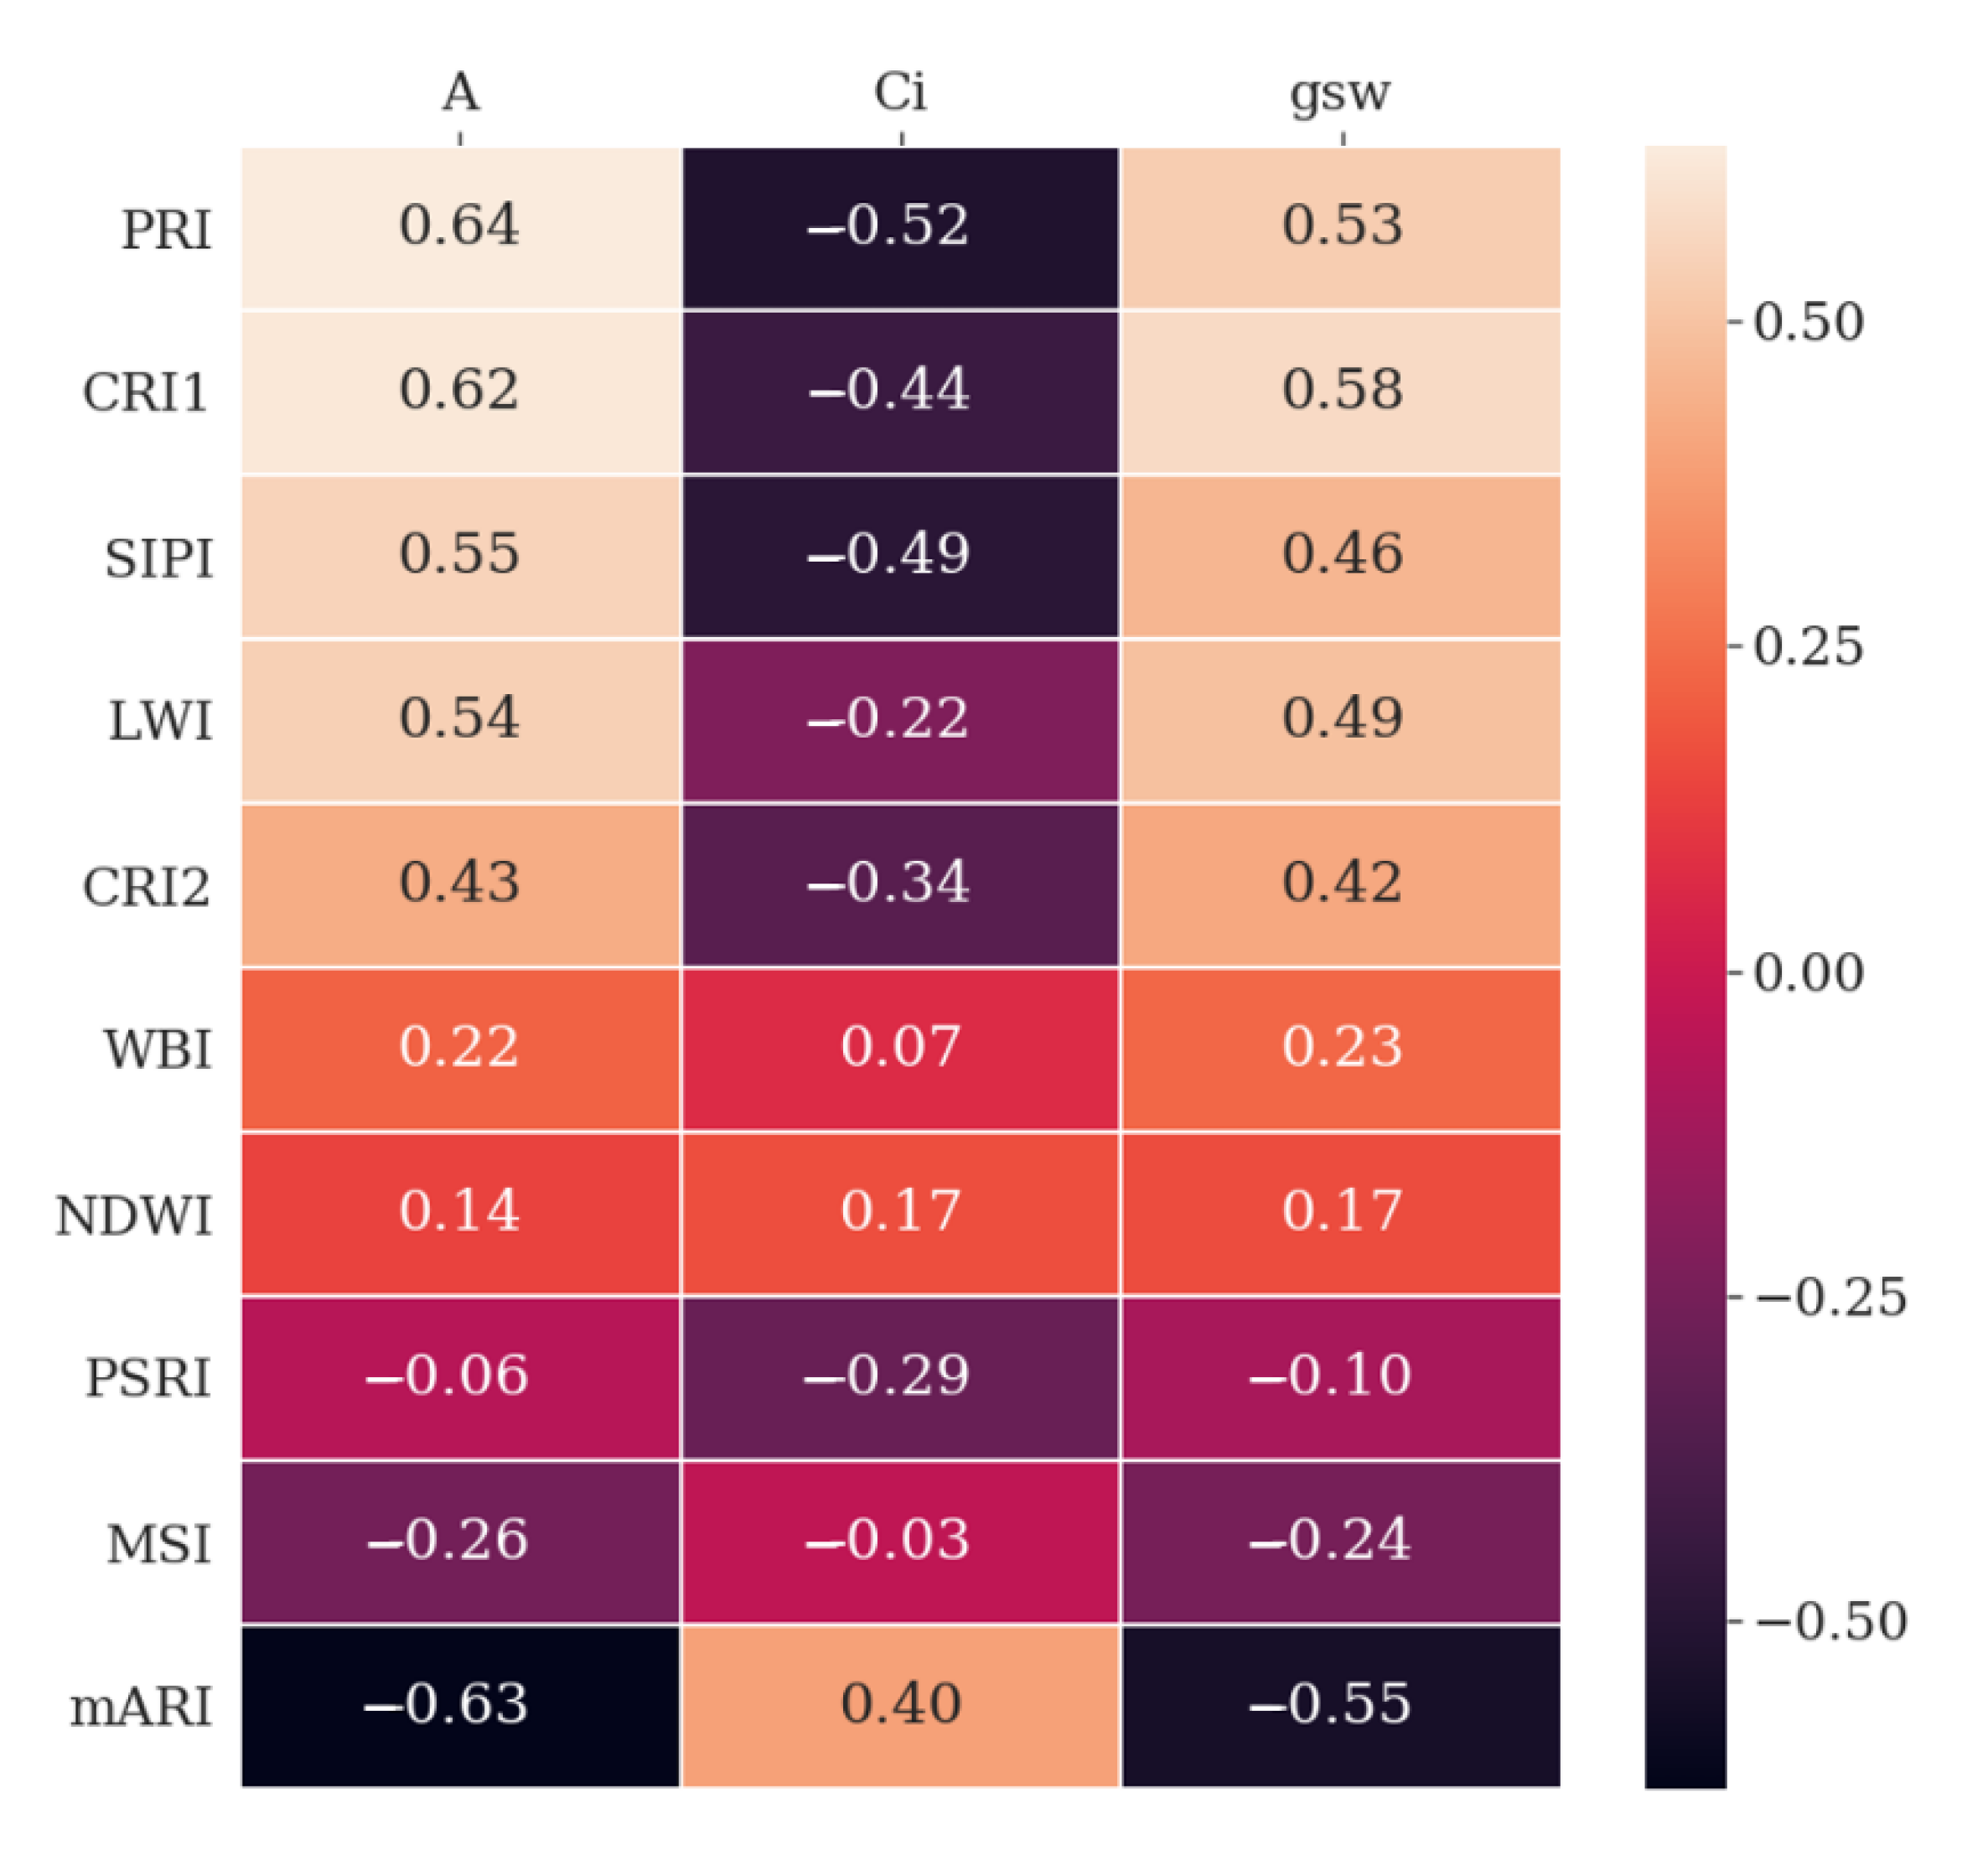
3.3. Hyperspectral Indices

Hyperspectral indices and simple band ratios associated with different plant traits were calculated. Four indices significantly differed between the treatments (Figure 5, Table 4): the leaf water index (LWI), plant senescence reflectance index (PSRI; p < 0.01), photochemical reflectance index (PRI; p < 0.001), and modified anthocyanin reflectance index (mARI, p < 0.05). All the indices were significantly affected by the day of measurement, and interaction between the treatments (except mARI; Table 4). PSRI detected the differences between treatments at the beginning of the first irrigation session (34, 38 DAS), with lower values in the presence of weeds (Figure 5a). The differences from 39 DAS until the end of the experiment were not significant. PRI was significantly reduced by the weeds from the end of the first irrigation session until the end of the experiment, excluding the first measurement after irrigating the plants (Figure 5b). LWI was the only water index that detected differences, presenting a significant reduction in the presence of weeds (Figure 5c). LWI changed significantly between different days of measurements only in the weed-treated corn (Figure 5c), suggesting relatively stable leaf water content in the weed-free corn throughout the experiment. However, differences between the treatments at the end of the experiment at the advanced stages of water competition were mainly detected. mARI was higher in the presence of weeds during the second irrigation session (46, 54 DAS), indicating high anthocyanin content in corn (Figure 5d). The correlation between the selected indices and the gas exchange measurements was tested using Pearson’s correlation (Figure 6). PRI was the best predictor of the photosynthetic rate and Ci concentration: a positive moderate correlation to photosynthetic rate (R = 0.64) and stomatal conductance (R = 0.53), negative moderate correlation to Ci (R = 0.5), mARI was moderately and negatively correlated with changes in photosynthetic rate (R = 0.63) and stomatal conductance (R = 0.55).

4. Discussion

4.1. Physiological Properties

Water deficit, soil salinity, and other plant stress inducers stimulate stomatal closure through changes in the turgor pressure of guard cells and endogenous signals [13]. The regulation of stomata is an important mechanism, preventing water loss and allowing CO2 supply for photosynthesis. Stomata closure under stress leads to a reduction in mesophyll conductance, limiting photosynthesis [14]. When CO2 fixation is reduced due to stressful conditions, Ci increases [34]. This is consistent with our results (Figure 1). Additionally, the stomatal guard cells are sensitive to changes in Ci. An increase in the Ci concentration leads to stomatal closure, which may lead to a decrease in nutrient uptake by the transpiration flow [35]. The chlorophyll measurement on the last day of the experiment provided evidence that the chlorophyll-b content decreased and carotenoid content increased due to the weeds (Figure 2). A larger reduction in chlorophyll-b compared to chlorophyll-a was reported previously in response to water stress [13].

4.2. Spectral Characteristics

The results demonstrated that bands in the VIS region and SWIR were the most sensitive to stress caused by the weeds (Figure 3). The reflectance in the VIS region is mostly affected by changes in pigment content. The regions that were significant in the experiment were mainly between 350 and 500 nm (Figure 3) where the major absorption bands of chlorophyll-a, chlorophyll-b, and β-carotene are located [35]. The abovementioned physiological processes may have contributed to the reduction in chlorophyll molecules that induced changes in the VIS region. The bands that were affected in the NIR region in this study were compatible with previously reported NIR water absorption minima [36]. Significant differences in the NIR occurred later than the differences in the VIS region and SWIR (only noticeable 54 DAS), suggesting that the development of water competition is expressed in the NIR, in which the absorption of water is weaker [1], at advanced stages of stress.
In the SWIR, bands between 2300 and 2500 nm were significantly affected (Figure 3) and presented differences at an early stage of stress development that lasted throughout the experiment. Wavelengths in this region were affected by plant stress [36]. As the stress developed, differences were also found between 1312–1567 nm and 1762–1897 nm. The absorption in the SWIR is affected by the stretching and bending of the O-H bond found in water molecules and other chemicals such as lignin, cellulose, proteins, and starch [37,38,39,40]. The pattern found in the SWIR in this experiment may be mainly attributed to changes in leaf water status that result from resource competition. This was supported by the gas exchange results and RWC measurements (Figure 1 and Figure 2a).
These results highlight the potential of observing diurnal changes related to the dynamics of crop–weed competition through spectral changes.

4.3. Spectral Indices

LWI, mARI, PSRI, and PRI were affected by the treatment. The PSRI detected symptoms that occurred at the beginning of the first irrigation session (Figure 5a) and the PRI index detected symptoms from the end of the first session until the end of the experiment (Figure 5b) and presented the highest correlation to the physiological variables measured (Figure 6). These two indices are affected by changes in carotenoid content [16]. As mentioned previously, the decrease in chlorophyll may be attributed to a reduction in nutrient uptake due to stomatal closure [35]. The increased Ci and closure of stomata under stress are accompanied by an increase in reactive oxygen species formation in the apoplast of guard cells and the chloroplast [35]. Xanthophyll cycle pigments and carotenoids are regulators of non-photochemical quenching, which is one of the mechanisms preventing damage by oxidative stress [41]. The observed changes in the mARI, PSRI, and PRI, in addition to the antioxidative role of xanthophyll and anthocyanin, raise the possibility that the spectral response in the VIS region during the early stages of stress and reduction in the photosynthetic rate were mainly driven by a reaction to oxidative stress that was enhanced by water competition. Even though the main driver of competition in the experiment was assumed to be water, indices related to changes in pigment content rather than the plant water status were found to be superior in detecting stress at earlier stages.

4.4. Limitations and Future Work

The results demonstrated the potential of hyperspectral measurements to detect stress caused by competition; however, a significant effect on the spectra was detected at the same time, in which visual symptoms and notable physiological changes started occurring. This suggests that earlier detection of symptoms may require a different approach, such as hyperspectral imaging, that will allow for focusing on the whole plant rather than just the leaf, and performing measurements from an earlier growth stage.
The combination of physiological observations during the experiment, together with the reduction in water availability in all pots, agrees with the assumption that the main driver of the observed results is water competition. In future research, to rule out the effect of competition for other resources (nutrients or light) and to determine that water is the main driver of the observed differences between the treatments, we recommend conducting an experiment that includes a fully irrigated control for both the weed and the weed-free treatment. Additionally, examination of the response to competition under field conditions will be beneficial for broad agricultural application as it will deliver a more realistic representation of the resulting spectral changes.
With the development of remote sensing for weed mapping using different classification methods, understanding the spectral variation of the crop that results from competition is necessary because it is likely to affect the results of the classification used. Additionally, the interaction of crops and weeds over resources may interrupt and add complexity to different models used for field management. Therefore, further study in this context may be beneficial to achieve better precision in future applications.

5. Conclusions

Hyperspectral and physiological measurements were combined in this study in an attempt to characterize the spectral response of corn leaves to water competition in the presence of weeds. The results supported the hypothesis that competition will lead to changes in the SWIR. As the competition developed, its effect was detected in several bands of the SWIR absorption minima (~1450, ~1800, ~2400 nm), presenting deeper light absorption for weed-free corn compared to that in corn grown with weeds.
The competition also affected bands in the VIS region (~400 nm). The spectral changes were attributed to physiological changes related to water stress, such as reduction in pigment concentration, reduction in relative water content, and decreased photosynthetic efficiency, supported by physiological measurements. Spectral indices that are used as pigment content estimators were superior to water indices in detecting stress. The PRI presented the highest correlations with photosynthetic activity. The results highlight the potential of hyperspectral measurements in observing diurnal changes related to the dynamics of water competition and detecting water competition-related physiological changes. Although the results obtained from this study need repetition, we present for the first time the measured spectral changes that result from crop–weed competition in the SWIR, showing a tight bond to water competition. These results concur with the findings of previous studies that highlight the potential of using spectral measurements as an indicator of plant competition [17,18].
It may be beneficial to use hyperspectral imaging in further studies to retrieve both spectral and spatial information. While having limitations, hyperspectral imaging taken from drones has a clear advantage of allowing quick data acquisition. Therefore, it will enable performing experiments with a larger number of samples. Additionally, to better understand the effect of the environment on the competition mechanism and spectral variability, questions regarding this topic should also be examined in field conditions, in various environmental conditions, in different types of soils, and for various plant species.

Author Contributions

Investigation and field work, I.R.; Supervision, S.M., D.G.B., H.E., and J.E.E. All authors have read and agreed to the published version of the manuscript.

Funding

This research received no external funding.

Acknowledgments

We thank the research team from the Earth and Planetary Image Facility (EPIF) for their collaborative effort during the data collection, with a special thanks to Adi Berman. We also thank the Albert Katz International School for Desert Studies (AKIS) for their scholarship.

Conflicts of Interest

The authors declare no conflict of interest.

References

  1. Thenkabail, P.S. Optical remote sening of vegetation water content. In Hyperspectral Remote Sensing of Vegetation; CRC Press: Boca Raton, FL, USA, 2012; pp. 227–244. [Google Scholar]
  2. Strachan, I.B.; Pattey, E.; Boisvert, J.B. Impact of nitrogen and environmental conditions on corn as detected by hyperspectral reflectance. Remote Sens. Environ. 2002, 80, 213–224. [Google Scholar] [CrossRef]
  3. Thenkabail, P.S.; John, G.; Lyon, A.H. Detecting Crop Mnagament, Plant Stress, and Disease. In Hyperspectral Remote Sensing of Vegetation; CRC Press: Boca Raton, FL, USA, 2012; pp. 561–570. [Google Scholar]
  4. Zarco-Tejada, P.J.; Camino, C.; Beck, P.S.A.; Calderon, R.; Hornero, A.; Hernández-Clemente, R.; Kattenborn, T.; Montes-Borrego, M.; Susca, L.; Morelli, M.; et al. Previsual symptoms of Xylella fastidiosa infection revealed in spectral plant-trait alterations. Nat. Plants 2018, 4, 432–439. [Google Scholar] [CrossRef] [PubMed]
  5. Prabhakar, M.; Prasad, Y.G.; Thirupathi, M.; Sreedevi, G.; Dharajothi, B.; Venkateswarlu, B. Use of ground based hyperspectral remote sensing for detection of stress in cotton caused by leafhopper (Hemiptera: Cicadellidae). Comput. Electron. Agric. 2011. [Google Scholar] [CrossRef]
  6. Neve, P.; Barney, J.N.; Buckley, Y.; Cousens, R.D.; Graham, S.; Jordan, N.R.; Lawton-Rauh, A.; Liebman, M.; Mesgaran, M.B.; Schut, M.; et al. Reviewing research priorities in weed ecology, evolution and management: A horizon scan. Weed Res. 2018, 58, 250–258. [Google Scholar] [CrossRef] [Green Version]
  7. Behmann, J.; Mahlein, A.K.; Rumpf, T.; Römer, C.; Plümer, L. A review of advanced machine learning methods for the detection of biotic stress in precision crop protection. Precis. Agric. 2015, 16, 239–260. [Google Scholar] [CrossRef]
  8. Wang, A.; Zhang, W.; Wei, X. A review on weed detection using ground-based machine vision and image processing techniques. Comput. Electron. Agric. 2019, 158, 226–240. [Google Scholar] [CrossRef]
  9. Westwood, J.H.; Charudattan, R.; Duke, S.O.; Fennimore, S.A.; Marrone, P.; Slaughter, D.C.; Swanton, C.; Zollinger, R. Weed Management in 2050: Perspectives on the Future of Weed Science. Weed Sci. 2018. [Google Scholar] [CrossRef] [Green Version]
  10. Knezevic, S.Z.; Weise, S.F.; Swanton, C.J. Interference of Redroot Pigweed (Amaranthus retroflexus) in Corn (Zea mays). Weed Sci. 1994. [Google Scholar] [CrossRef]
  11. Zimdahl, R.L. Weed-Crop Competition, 2nd ed.; Wiley-Blackwell: Hoboken, NJ, USA, 2004; ISBN 0813802792. [Google Scholar]
  12. Rajcan, I.; Swanton, C.J. Understanding maize-weed competition: Resource competition, light quality and the whole plant. Field Crop. Res. 2001. [Google Scholar] [CrossRef]
  13. Ashraf, M.; Harris, P.J.C. Photosynthesis under stressful environments: An overview. Photosynthetica 2013, 51, 163–190. [Google Scholar] [CrossRef]
  14. Osakabe, Y.; Osakabe, K.; Shinozaki, K.; Tran, L.S.P. Response of plants to water stress. Front. Plant Sci. 2014, 5, 1–8. [Google Scholar] [CrossRef] [PubMed] [Green Version]
  15. Landi, M.; Tattini, M. Multiple functional roles of anthocyanins in plant-environment interactions. Environ. Exp. Bot. 2015, 119, 4–17. [Google Scholar] [CrossRef]
  16. Ustin, S.L.; Gitelson, A.A.; Jacquemoud, S.; Schaepman, M.; Asner, G.P.; Gamon, J.A.; Zarco-Tejada, P. Retrieval of foliar information about plant pigment systems from high resolution spectroscopy. Remote Sens. Environ. 2009, 113, S67–S77. [Google Scholar] [CrossRef] [Green Version]
  17. Cartfr, G.A.; Paliwal, K.; Pathre, U. Effect of competition and leaf age on visible and infrared reflectance in pine foliage. Plant Cell Environ. 1989, 309–315. [Google Scholar] [CrossRef]
  18. Liu, W.; Fan, X.; Wang, J.; Zhang, C.; Lu, W.; Gadow, V.; Liu, W.; Fan, X.; Wang, J.; Zhang, C.; et al. Spectral reflectance response of Fraxinus mandshurica leaves to above- and belowground competition. Int. J. Remote Sens. 2012, 1161. [Google Scholar] [CrossRef]
  19. Leon, C.T.; Shaw, D.R.; Bruce, L.M.; Watson, C. Effect of purple (Cyperus rotundus) and yellow nutsedge (C. esculentus) on growth and reflectance characteristics of cotton and soybean. Weed Sci. 2006. [Google Scholar] [CrossRef]
  20. Sumanta, N.; Haque, C.I.; Nishika, J.; Suprakash, R. Spectrophotometric Analysis of Chlorophylls and Carotenoids from Commonly Grown Fern Species by Using Various Extracting Solvents. Res. J. Chem. Sci. 2014, 4, 2231–2606. [Google Scholar]
  21. Pietragalla, J.; Mullan, D. Leaf relative water content. In Physiological Breeding II: A Field Guide to Wheat Genotyping; The International Maize and Wheat Improvement Center, CIMMYT: Texcoco, Mexico, 2012. [Google Scholar]
  22. Clark, R.N.; Roush, T.L. Reflectance spectroscopy: Quantitative analysis techniques for remote sensing applications. J. Geophys. Res. 1984. [Google Scholar] [CrossRef]
  23. Penuelas, J.; Baret, F.; Filella, I. Semi-empirical indices to assess carotenoids/chlorophyll a ratio from leaf spectral reflectance. Photosynthetica 1995, 31, 221–230. [Google Scholar]
  24. Merzlyak, M.N.; Gitelson, A.A.; Chivkunova, O.B.; Rakitin, V.Y. Non-destructive optical detection of pigment changes during leaf senescence and fruit ripening. Physiol. Plant. 1999, 106. [Google Scholar] [CrossRef] [Green Version]
  25. Gitelson, A.A.; Keydan, G.P.; Merzlyak, M.N. Three-band model for noninvasive estimation of chlorophyll, carotenoids, and anthocyanin contents in higher plant leaves. Geophys. Res. Lett. 2006. [Google Scholar] [CrossRef] [Green Version]
  26. Gitelson, A.A.; Zur, Y.; Chivkunova, O.B.; Merzlyak, M.N. Assessing Carotenoid Content in Plant Leaves with Reflectance Spectroscopy. Photochem. Photobiol. 2002, 75. [Google Scholar] [CrossRef]
  27. Garbulsky, M.F.; Peñuelas, J.; Gamon, J.; Inoue, Y.; Filella, I. The photochemical reflectance index (PRI) and the remote sensing of leaf, canopy and ecosystem radiation use efficiencies: A review and meta-analysis. Remote Sens. Environ. 2011, 115, 281–297. [Google Scholar] [CrossRef]
  28. Hunt, E.R.; Rock, B.N. Detection of changes in leaf water content using Near- and Middle-Infrared reflectances. Remote Sens. Environ. 1989, 30. [Google Scholar] [CrossRef]
  29. Jackson, T.J.; Chen, D.; Cosh, M.; Li, F.; Anderson, M.; Walthall, C.; Doriaswamy, P.; Hunt, E.R. Vegetation water content mapping using Landsat data derived normalized difference water index for corn and soybeans. Remote Sens. Environ. 2004, 92. [Google Scholar] [CrossRef]
  30. Seelig, H.D.; Hoehn, A.; Stodieck, L.S.; Klaus, D.M.; Adams, W.W.; Emery, W.J. Relations of remote sensing leaf water indices to leaf water thickness in cowpea, bean, and sugarbeet plants. Remote Sens. Environ. 2008, 112. [Google Scholar] [CrossRef]
  31. Penuelas, J.; Filella, I.; Biel, C.; Serrano, L.; Save, R. The reflectance at the 950–970 nm region as an indicator of plant water status. Int. J. Remote Sens. 1993, 14. [Google Scholar] [CrossRef]
  32. McDonald, J.H. Handbook of Biological Statistics, 3rd ed.; Sparky House Publishing: Baltimore, MD, USA, 2014. [Google Scholar]
  33. Seabold, S.; Perktold, J. Statsmodels: Econometric and statistical modeling with python. In Proceedings of the 9th Python in Science Conference, Austin, TX, USA, 28 June–3 July 2010. [Google Scholar]
  34. Ehonen, S.; Yarmolinsky, D.; Kollist, H.; Kangasjärvi, J. Reactive Oxygen Species, Photosynthesis, and Environment in the Regulation of Stomata. Antioxid. Redox Signal. 2019, 30, 1220–1237. [Google Scholar] [CrossRef]
  35. Blackburn, G.A. Hyperspectral remote sensing of plant pigments. J. Exp. Bot. 2007. [Google Scholar] [CrossRef] [Green Version]
  36. Thenkabail, P.S.; John, G.; Lyon, A.H. Advances in Hyperspectral Remote Sensing of vegetation and Agricultural Cropland. In Hyperspectral Remote Sensing of Vegetation; CRC Press: Boca Raton, FL, USA, 2012; pp. 4–31. [Google Scholar]
  37. Fourty, T.; Baret, F.; Jacquemoud, S.; Schmuck, G.; Verdebout, J. Leaf Optical Properties with Explicit Description of Its Biochemical Composition: Direct and Inverse Problems. Remote Sens. Environ. 1995, 56, 104–117. [Google Scholar] [CrossRef]
  38. Buitrago, M.F.; Groen, T.A.; Hecker, C.A.; Skidmore, A.K. Spectroscopic determination of leaf traits using infrared spectra. Int. J. Appl. Earth Obs. Geoinf. 2018, 69, 237–250. [Google Scholar] [CrossRef]
  39. Kokaly, R.F.; Asner, G.P.; Ollinger, S.V.; Martin, M.E.; Wessman, C.A. Characterizing canopy biochemistry from imaging spectroscopy and its application to ecosystem studies. Remote Sens. Environ. 2009, 113, S78–S91. [Google Scholar] [CrossRef]
  40. Curran, P.J. Remote Sensing of Foliar Chemistry. Remote Sens. Environ. 1989, 278, 271–278. [Google Scholar] [CrossRef]
  41. Goss, R.; Lepetit, B. Biodiversity of NPQ. J. Plant Physiol. 2015, 172, 13–32. [Google Scholar] [CrossRef] [PubMed]
Figure 1. Physiological measurements results. (a) Photosynthetic rate and (b) stomatal conductance were significantly reduced by the treatment. (c) Intercellular CO2 was significantly increased by the treatment. Black dashed lines represent the irrigation performed on 43 days after sowing (DAS). Asterisks represent significant differences between treatments (Student’s t-test). Blue and Orange letters represent all pairwise comparison results between days of measurements within each treatment (Tukey’s HSD). Different letters of the same color are assigned to days that are significantly different. Weed-free: blue, weedy: orange. (blue ‘a’ is significantly different from blue ‘b’ while blue “ab” does not differ from both blue ‘a’ nor blue ‘b’. this is applied to all letters respectively) Weed-free corn: blue line, weed-treated corn: orange line. Error bars represent standard error of the mean.
Remotesensing 13 00513 g001
Figure 2. Relative water content (RWC), pigment concentration, and biomass. (a) No differences in RWC observed after irrigation 47 DAS, and RWC was significantly reduced by the treatment 57 DAS. (b) Chlorophyll-b content decreased significantly and carotenoid content increased. (c) The dry weight of corn decreased significantly. Asterisks represent significant differences between the treatments (Student’s t-test). Error bars represents standard error of the mean. DAS: days after sowing, RWC: relative water content, Chl: chlorophyll, Car: carotenoids.
Remotesensing 13 00513 g002
Figure 3. Spectral differences between the treatments. Y axis represents the p-value for the treatment effect on every wavelength, horizontal dashed lines show 0.05 significant level. Significant effect on the continuum removal spectra (Scr) in the (a) visible (VIS) region (b) near infrared region (NIR), and (c) short-wave infrared region (SWIR). (d) Pink bars represent wavelength that showed significant differences between the weed-free and weed-treated corn.
Remotesensing 13 00513 g003
Figure 4. Absorption trends. Mean Scr in spectral regions that were significantly affected by the treatment on different days during the experiment. Black dashed lines represent the irrigation performed on 43 DAS. Asterisks represent the regions and day of measurement where significant differences between treatments were observed (Student’s t-test). Weed-free corn (blue line) presented deeper absorption than weed-treated corn (orange line).
Remotesensing 13 00513 g004
Figure 5. A decrease seen in (a) plant senescence reflectance index (PSRI), (b) photochemical reflectance index (PRI), and (c) leaf water index (LWI) due to weed treatment. (d) An increase in the modified mARI index for anthocyanin. Black dashed lines represent the irrigation performed 43 days after sowing (DAS). Asterisks represent significant differences between treatments (Student’s t-test). Blue and orange letters represent all pairwise comparison results between days of measurements within each treatment (Tukey’s HSD). Different letters of the same color are assigned to days that are significantly different (blue ‘a’ is significantly different from blue ‘b’ while blue “ab” does not differ from both blue ‘a’ nor blue ‘b’. this is applied to all letters respectively) Weed-free: blue, weedy: orange. Error bars represent standard error of the mean.
Remotesensing 13 00513 g005
Figure 6. Correlation between physiological variables and spectral indices. Pearson correlation coefficients (R) between different spectral indices and the gas exchange measurements.
Remotesensing 13 00513 g006
Table 1. The measurements collected during the experiment, and the sample size for every treatment. DAS: days after sowing, w: weed treatment, wf: weed-free control.
Measurement29 DAS (3–4 Leaves)34 DAS
(4 Leaves)
38 DAS (4–5 Leaves)43 DAS
(4–5 Leaves)
46 DAS
(5–6 Leaves)
51 DAS
(5–6 Leaves)
54 DAS
(5–7 Leaves)
57 DAS
(5–7 Leaves)
w wfw wfw wfw wfw wfw wfw wfw wf
Hyperspectral1010101010109101010910910--
Gas exchange910--99910910--910--
Pigments--------------1010
Relative water content--------55----1010
Biomass----- 1010
Table 2. Summary of the spectral indices used in this study, R = reflectance value at a given wavelength.
IndexFormulaRelated VariablesReference
Structure insensitive pigment index (SIPI) R 800 R 445 R 800 + R 680 Total pigments[23]
Plant senescence reflectance index (PSRI) R 680 R 500 R 750 Total pigments[24]
Modified anthocyanin reflectance index (mARI) ( 1 R 530 570 1 R 690 710 ) R N I R Anthocyanins[25]
Carotenoid reflectance index 1 (CRI1) 1 R 510 1 R 550
C R I 1 = 1 R 510 1 R 550
Carotenoids[26]
Carotenoid reflectance index 2 (CRI2) 1 R 510 1 R 700 Carotenoids[26]
Photochemical reflectance index (PRI) R 531 R 570 R 531 + R 570 Carotenoids[27]
Leaf water index (LWI) R 1300 R 1450 Water content [28]
Moisture stress index (MSI) R 1599 R 819 Water content [29]
Normalized difference water index (NDWI) R 857 R 1241 R 857 + R 1241 Water content [30]
Water band index (WBI) R 970 R 900 Water content [31]
Table 3. Statistical analysis of physiological measurements—two-way ANOVA with DAS and treatment as explanatory variables (α = 0.05).
Treatment EffectDAS EffectInteraction Effect
Fp-ValueFp-ValueFp-Value
Photosynthesis61.8550.00029.8690.0005.6920.000
Stomata conductance30.5530.00020.1310.0001.5610.192
Intercellular CO218.9960.0002.8590.0285.9740.000
Table 4. Statistical analysis of spectral indices—two-way ANOVA with DAS and treatment as explanatory variables (α = 0.05).
Treatment EffectDAS EffectInteraction Effect
Fp-ValueFp-ValueFp-Value
SIPI0.3060.5816.5960.0000.9830.440
PSRI10.3710.0025.2760.0002.2590.042
mARI4.0310.04727.0720.0001.8130.102
CRI11.9780.16215.4680.0000.8400.542
CRI20.5180.4738.9710.0002.9190.011
PRI12.2710.00121.8930.0002.3190.037
LWI5.9250.0166.2720.0002.3830.033
MSI0.6220.4325.0850.0001.4020.219
NDWI0.0240.8786.6070.0001.4340.207
WBI0.8280.3654.3150.0011.1100.360
Publisher’s Note: MDPI stays neutral with regard to jurisdictional claims in published maps and institutional affiliations.

