Technical Note

Decreased Anthropogenic CO2 Emissions during the COVID-19 Pandemic Estimated from FTS and MAX-DOAS Measurements at Urban Beijing

1
Key Laboratory of Middle Atmosphere and Global Environment Observation, Institute of Atmospheric Physics, Chinese Academy of Science, Beijing 100029, China
2
University of Chinese Academy of Science, Beijing 100049, China
3
Department of Precision Machinery and Precision Instrumentation, University of Science and Technology of China, Hefei 230026, China
4
Jiangsu Key Laboratory of Atmospheric Environment Monitoring and Pollution Control, Collaborative Innovation Center of Atmospheric Environment and Equipment Technology, School of Environmental Science and Engineering, Nanjing University of Information Science & Technology (NUIST), Nanjing 210044, China
*
Author to whom correspondence should be addressed.
Submission received: 11 January 2021 / Revised: 27 January 2021 / Accepted: 28 January 2021 / Published: 1 February 2021
(This article belongs to the Special Issue Remote Sensing of Air Pollutants and Carbon Emissions in Megacities)

Abstract

:
The COVID-19 pandemic has led to ongoing reductions in economic activity and anthropogenic emissions. Beijing was particular badly affected by lockdown measures during the early months of the COVID-19 pandemic. It has significantly reduced the CO2 emission and toxic air pollution (CO and NO2). We use column-averaged dry-air mole fractions of CO2 and CO (XCO2 and XCO) observed by a ground-based EM27/SUN Fourier transform spectrometer (FTS), the tropospheric NO2 column observed by MAX-DOAS and satellite remote sensing data (GOSAT and TROPOMI) to investigate the variations in anthropogenic CO2 emission related to COVID-19 lockdown in Beijing. The anomalies describe the spatio-temporal enhancement of gas concentration, which relates to the emission. Anomalies in XCO2 and XCO, and XNO2 (ΔXCO2, ΔXCO, and ΔXNO2) for ground-based measurements were calculated from the diurnal variability. Highly correlated daily XCO and XCO2 anomalies derived from FTS time series data provide the ΔXCO to ΔXCO2 ratio (the correlation slope). The ΔXCO to ΔXCO2 ratio in Beijing was lower in 2020 (8.2 ppb/ppm) than in 2019 (9.6 ppb/ppm). The ΔXCO to ΔXCO2 ratio originating from a polluted area was significantly lower in 2020. The reduction in anthropogenic CO2 emission was estimated to be 14.2% using FTS data. A comparable value reflecting the slowdown in growth of atmospheric CO2 over the same time period was estimated to be 15% in Beijing from the XCO2 anomaly from GOSAT, which was derived from the difference between the target area and the background area. The XCO anomaly from TROPOMI is reduced by 8.7% in 2020 compared with 2019, which is much smaller than the reduction in surface air pollution data (17%). Ground-based NO2 observation provides a 21.6% decline in NO2. The NO2 to CO2 correlation indicates a 38.2% decline in the CO2 traffic emission sector. Overall, the reduction in anthropogenic CO2 emission relating to COVID-19 lockdown in Beijing can be detected by the Bruker EM27/SUN Fourier transform spectrometer (FTS) and MAX-DOAS in urban Beijing.

1. Introduction

An outbreak of a novel infectious coronavirus virus (COVID-19) was first identified in Wuhan, China, in December 2019 and it posed serious health hazards to the local population. To slow down the spread of the virus, the Chinese government imposed a mandatory lockdown to reduce the mobility of the population, including closing down industrial activity and transport networks. The dramatic reduction in economic activity affected the emissions of greenhouse gases, air quality, and the Earth’s climate [1]. The reduction in the consumption of fossil fuels was accompanied by a decrease in the atmospheric concentrations of short-lived air pollutants, such as particulate matter (PM2.5, PM10), carbon monoxide (CO), nitrogen dioxide (NO2), and sulfur dioxide (SO2) [2,3,4] and an increase in the concentration of ozone (O3) and the formation of secondary aerosols [5,6]. Beijing, the capital of China, is recognized as one of the most polluted regions in the country and it can therefore be used to determine the local atmospheric response to the COVID-19 lockdown. Measurements from the Tropospheric Monitoring Instrument (TROPOMI) on board the Copernicus Sentinel-5 Precursor satellite have shown that the NO2 column in Beijing decreased by about 25% during the COVID-19 lockdown [2].
COVID-19 outbreak provides a unique opportunity to investigate the response of CO2 emissions to the decreasing anthropogenic activities. As a result of the decrease in fossil fuel consumption and vehicular traffic, global daily emissions of carbon dioxide (CO2) decreased by about 17% in the first four months of 2020 compared with the same period in 2019 and the total emissions of CO2 in 2020 are estimated to have decreased by about 8% using 2019 as the baseline year [7]. The estimated emission of CO2 in China decreased by 10.3–11.5% in the first quarter of 2020 relative to 2019 [7,8,9].
These assessments of CO2 reductions are based primarily on bottom-up methods using statistical data from fossil fuel, industry, and traffic emissions. CO2 accumulates in the atmosphere due to its long residence time, so the decrease in CO2 emissions during the lockdown period was difficult to observe directly. However, the 2020 lockdown is a unique case to test whether the concentration changes relating to human activities can be separated from the atmospheric measurements. The column-averaged dry-air mole fractions of a gas (Xgas) are less sensitive to vertical transport, and the horizontal gradient of Xgas has a more direct relationship with the regional-scale flux than in situ measurements of gas concentrations near the Earth’s surface [10]. Sussmann and Rettinger [11] compared the long-term growth rates of XCO2 before 2019 at several background Total Carbon Column Observing Network (TCCON) sites with the reference forecast rate based on an 8% reduction in annual emissions for 2020 and found the forecast value (with the COVID-19 effect) was significantly lower than the observed value (without the COVID-19 effect), indicating a slowing down of the growth in CO2, related to COVID-19.
In this study, we focus on an analysis of anthropogenic CO2 emission over a large urban region (a megacity like Beijing) using Xgas measurements. We analysed the variation in CO2 and CO concentrations during the first four months of 2020 in the Beijing urban area using ground-based XCO2, XCO, and XNO2 measurements by collaborative analysis with satellite data. These measurements are acquired by a Fourier Transform spectrometer EM27/SUN and MAXDOAS. CO and NO2 are often used as tracers of CO2 from inefficient combustion. Then the observed CO–CO2 and NO2–CO2 correlations provide useful constraints for identifying source types. CO and NO2 last from hours to weeks in the atmosphere and can be transported regionally with a low background concentration, which makes them unique tracers for the transportation and redistribution of anthropogenic CO2. XCO2, XNO2, and XCO data from satellites (XCO2 from GOSAT, CO from TROPOMI) are also used to investigate the impact of the 2020 lockdown around Beijing.
This paper is structured as follows. Section 2 describes the methods and the datasets obtained from satellite and ground-based observations. Section 3.1 analyses the variation in the XCO2 anomaly measured by satellites over Beijing in the last three years. Section 3.2 presents the XCO anomaly observed by TROPOMI. The XCO2, XCO, and tropospheric NO2 column concentration time series in the first four months of 2019 and 2020 are presented in Section 3.3. Finally, the correlations of ΔXCO2 with ΔXCO and ΔXNO2 under different weather conditions are discussed in Section 3.4. Section 4 concludes the paper.

2. Materials and Methods

2.1. Ground-Based Observations

A Bruker EM27/SUN Fourier Transform spectrometer has been deployed at the Institute of Atmospheric Physics, Chinese Academy of Sciences, an urban site between the north 3rd and 4th ring roads in Beijing, since 1 January 2019. A WS500 weather station, which operates in conjunction with the EM27 spectrometer, records surface temperatures and pressures with accuracies of 0.2 °C and 0.5 h Pa, respectively. The EM27 spectrometer receives direct sunlight passively through a solar tracker and records the near-infrared spectra in the range 3800–14,000 cm−1 using an indium gallium arsenide detector. After analysis using a non-linear least-squares fitting retrieval algorithm (PROFFAST) [8], the recorded spectra yield column-averaged dry-air mole fractions of CO2 and CO (XCO2, XCO) (Formula (1)). Use of EM27 is limited under cloudy, rainy, and night-time conditions and it is therefore equipped with an automated clamshell cover, so that it is possible to obtain autonomous remote sensing of greenhouse gases and to maximize the amount of valid observational data.
  X g a s =   g a s   c o l u m n d r y   a i r   c o l u m n
The IFS 125 HR data used in the TCCON have been widely accepted as a standard to calibrate portable Fourier transform spectrometer data [9,10]. We calibrate the results from the EM27 spectrometer using the IFS 125 HR Fourier transform spectrometer in Xianghe, Hebei [11].
A ground-based multi axis differential optical absorption spectroscopy (MAX-DOAS) instrument was installed on the roof of the Chinese Academy of Meteorological Sciences building (CAMS, 39.9475°N, 116.3273°E) for continuous measurements of NO2. A full measurement sequence takes about 11 min. In this study, we use the tropospheric NO2 column (unit: molec/cm2) and convert it to column-averaged dry-air mole fractions of NO2 (XNO2, unit: ppb). We used the X-STILT (X-Stochastic Time-Inverted Lagrangian Transport model) to analyze the influences of the synoptic condition. X-STILT is a Lagrangian particle dispersion model and is an effective tool with which to track the backward footprint of column measurements, such as Orbiting Carbon Observatory-2 [12,13]. We adopted the X-STILT model driven by the ERA5 reanalysis datasets (0.25° spatial resolution and 1-h temporal resolution) to analyze the EM27 column observations from the perspective of the weather conditions. The X-STILT model was set to release particles every 100 m within 3 km and every 500 m from 3 to 6 km relative to the observation level, which tends to be denser near the surface. The column footprint (unit: ppm (µmol (m2 s)−1)−1), as the output of the X-SILT model, represents the residence time of air in a given area.

2.2. Satellite Observations

The Greenhouse Gases Observing Satellite (GOSAT) has a target mode over Beijing and is suitable for studying regional variations in XCO2. The Thermal and Near Infrared Sensor for Carbon Observation (TANSO) Fourier transform spectrometer on board the satellite GOSAT records both shortwave infrared (SWIR) and thermal infrared (TIR) spectra with a 10.5-km diameter footprint at the nadir. The National Institute for Environmental Studies (NIES) algorithm was developed to retrieve GOSAT data. To reduce the errors from undersampling, we selected only those days with at least five GOSAT XCO2 pixels located in the Beijing area. GOSAT data before 2016 were not used because of the very limited number of daily samples. We used the GOSAT XCO2 products from NIES v02.81 (https://data2.gosat.nies.go.jp) obtained within the study area during the past four years (2017–2020).
The XCO over Beijing can readily be observed using data from TROPOMI on board the Sentinel-5 Precursor satellite, which was successfully launched by the European Space Agency (ESA) in October 2018. The spatial resolution of TROPOMI was 7 × 7 km2 before August 2019 and 7.2 × 5.6 km2 afterwards The vertical column concentration of CO (unit: mol/m2), which is sensitive to the tropospheric boundary layer, is a primary product of TROPOMI and can be retrieved from the 2.3-µm spectral range of the SWIR part of the solar spectrum using the Shortwave Infrared CO Retrieval (SICOR) algorithm [14,15]. To ensure the quality of the data, we selected the CO product pixels associated with a quality value (qa_value) > 0.5. To obtain the XCO values (units: ppb), the CO column values from the TROPOMI were divided by the dry air column values calculated from the European Centre for Medium-Range Weather Forecast analysis data.

3. Results

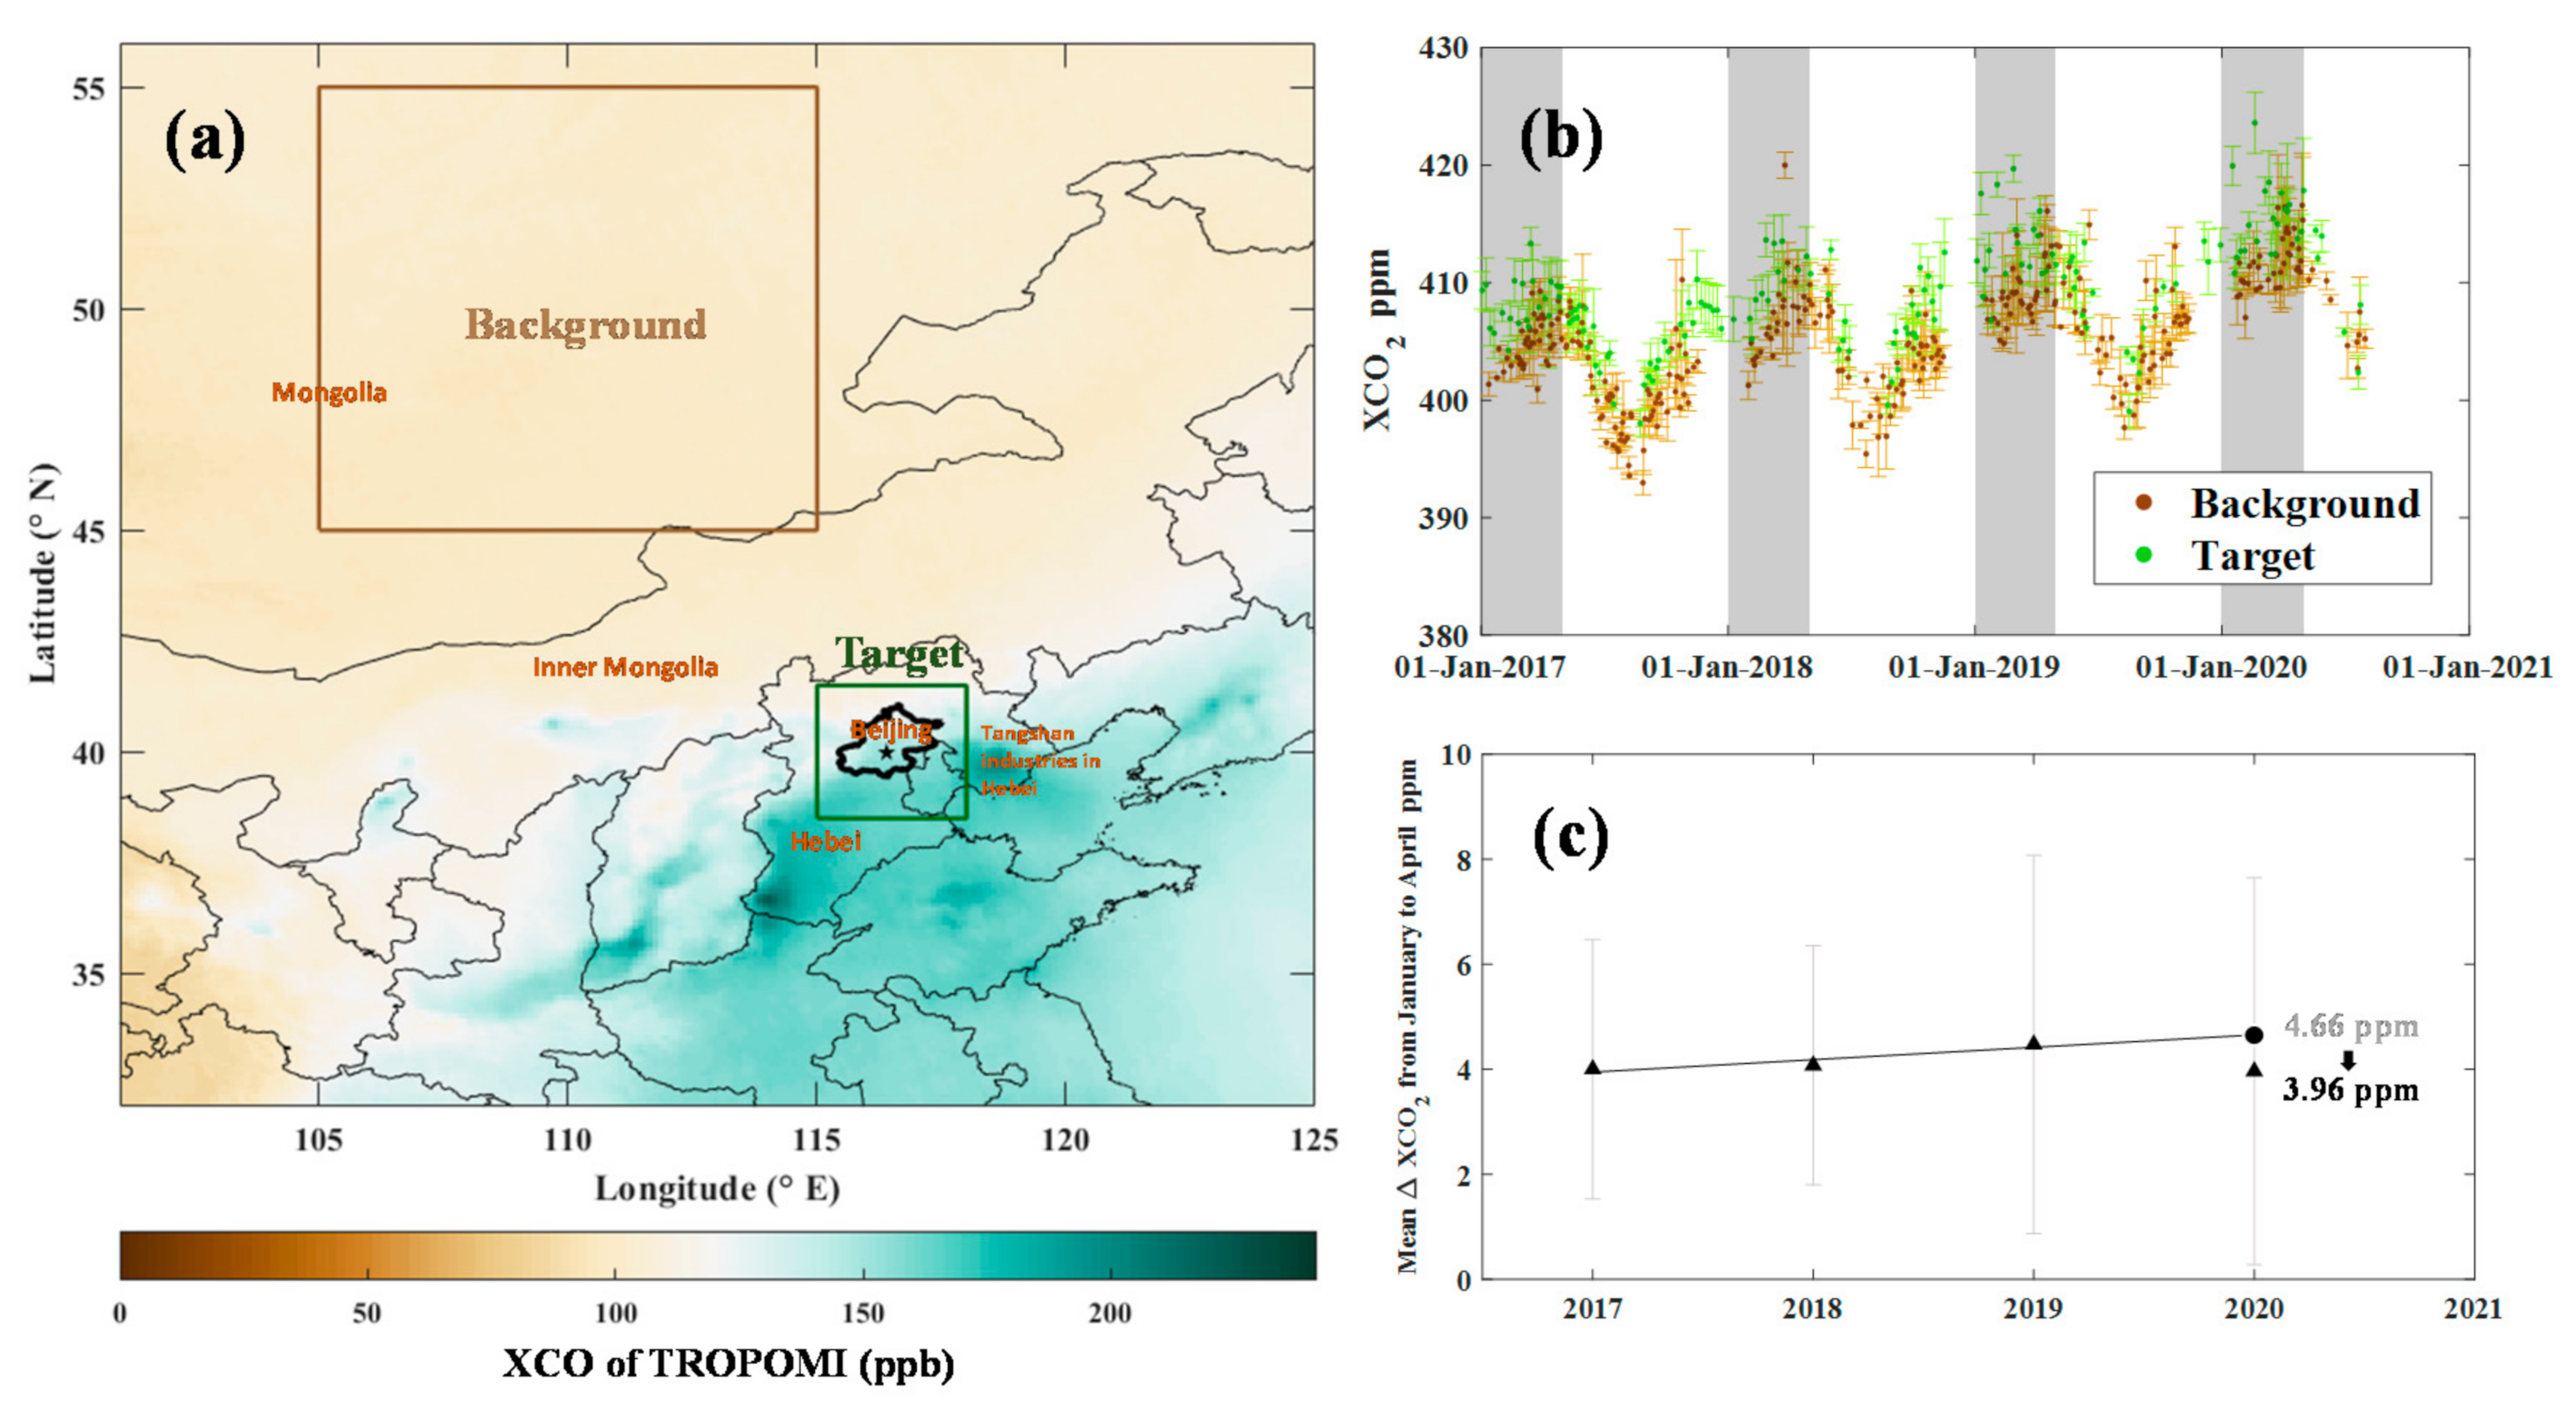
3.1. XCO2 Anomaly from GOSAT

The most recent research [16], which has estimated the daily emission inventories, shows a significant decrease in global CO2 emissions (8.8%) in the first half of 2020. The decline in emissions from China in the first half of 2020 compared with baseline year of 2019 over the same period is 3.7%, with a maximum in February (18.4%) but they recovered after March. The atmospheric CO2 column-averaged CO2 concentration (XCO2) observed by space-based and ground-based instruments is a weak signal superimposed on the background abundance, so we focus on the anomaly in XCO2 rather than on XCO2 itself in Beijing during the abnormal event due to COVID-19 lockdown. In winter and early spring, the photosynthetic uptake of CO2 and biomass burning are minimal in the north China region, while domestic heating and traffic contribute significantly to fossil fuel consumption.
This study focuses on a megacity, Beijing, with a population of more than 20 million. The prevailing winds around Beijing were from the northwestern and southwestern directions. GOSAT provides targeted observations at Beijing, making it possible to collect enough data to study changes in XCO2 in a small region. Because there are very limited data from GOSAT, no filter of wind direction for a single day was applied. We assume that the observed XCO2 variations result from a superposition of anthropogenic emissions and background variabilities. As a consequence, the XCO2 anomaly or enhancement for the target region (38.5–41.5°N;115 to 118°E, the green area in Figure 1a) could be calculated by subtracting the averaged value for the background region (45–55°N from 105 to 115°E, the brown area in Figure 1a) from January 2017 to April 2020 from the GOSAT measurements. The center of Mongolia where population densities are lower and less affected by the COVID-2019 lockdown, was selected as the background region to minimize the biogenic CO2 emission contribution to the CO2 enhancement in Beijing. Figure 2 shows the daily averaged XCO of the background region. The negligible daily variations in the averaged XCO indicate there is little effect from human activities.
Figure 1b shows the variation in XCO2 from 2017 to the end of April 2020 and the first four months in each year are marked by grey shading. XCO2 around Beijing was often higher than that of the background region, indicating the high anthropogenic CO2 emissions from Beijing and surrounding areas. Figure 1c shows that ΔXCO2 in the first four months of each year increased from 2017 to 2019 and was predicted by extrapolation to be 4.65 ± 1.64 ppm in 2020. The uncertainty is calculated from the square root mean of 2017 to 2019. The observed enhancement from GOSAT in 2020 was 3.96 ± 3.68 ppm, and it is plausible to assume that the reduction of 0.7 ± 2.01 ppm (15%) is a result of the drop in anthropogenic CO2 in the atmosphere due to the economic disruption during the COVID-19 outbreak. This reduction in XCO2 growth, as estimated from the target–background difference, reveals that the related atmospheric concentration changes can be detected by column measurement from the satellite; however, the method is too simplified to quantify the reduction in anthropogenic emission. The reduction is a bit higher than the average reduction in China (11.5%) inferred by sector-specific ratio maps of CO2 to NOx emissions, where the latter was estimated from TROPOMI NO2 reduction [17]. These estimations are higher than the bottom-up estimation (6.6%) from the traffic data in Beijing [18] or the average reduction in China estimated from all inventories (~10%). It should be noted that the chosen background area as well as selection of days will alter the estimated reduction in XCO2 growth. There could also be biases due to the limited numbers of satellite observations.

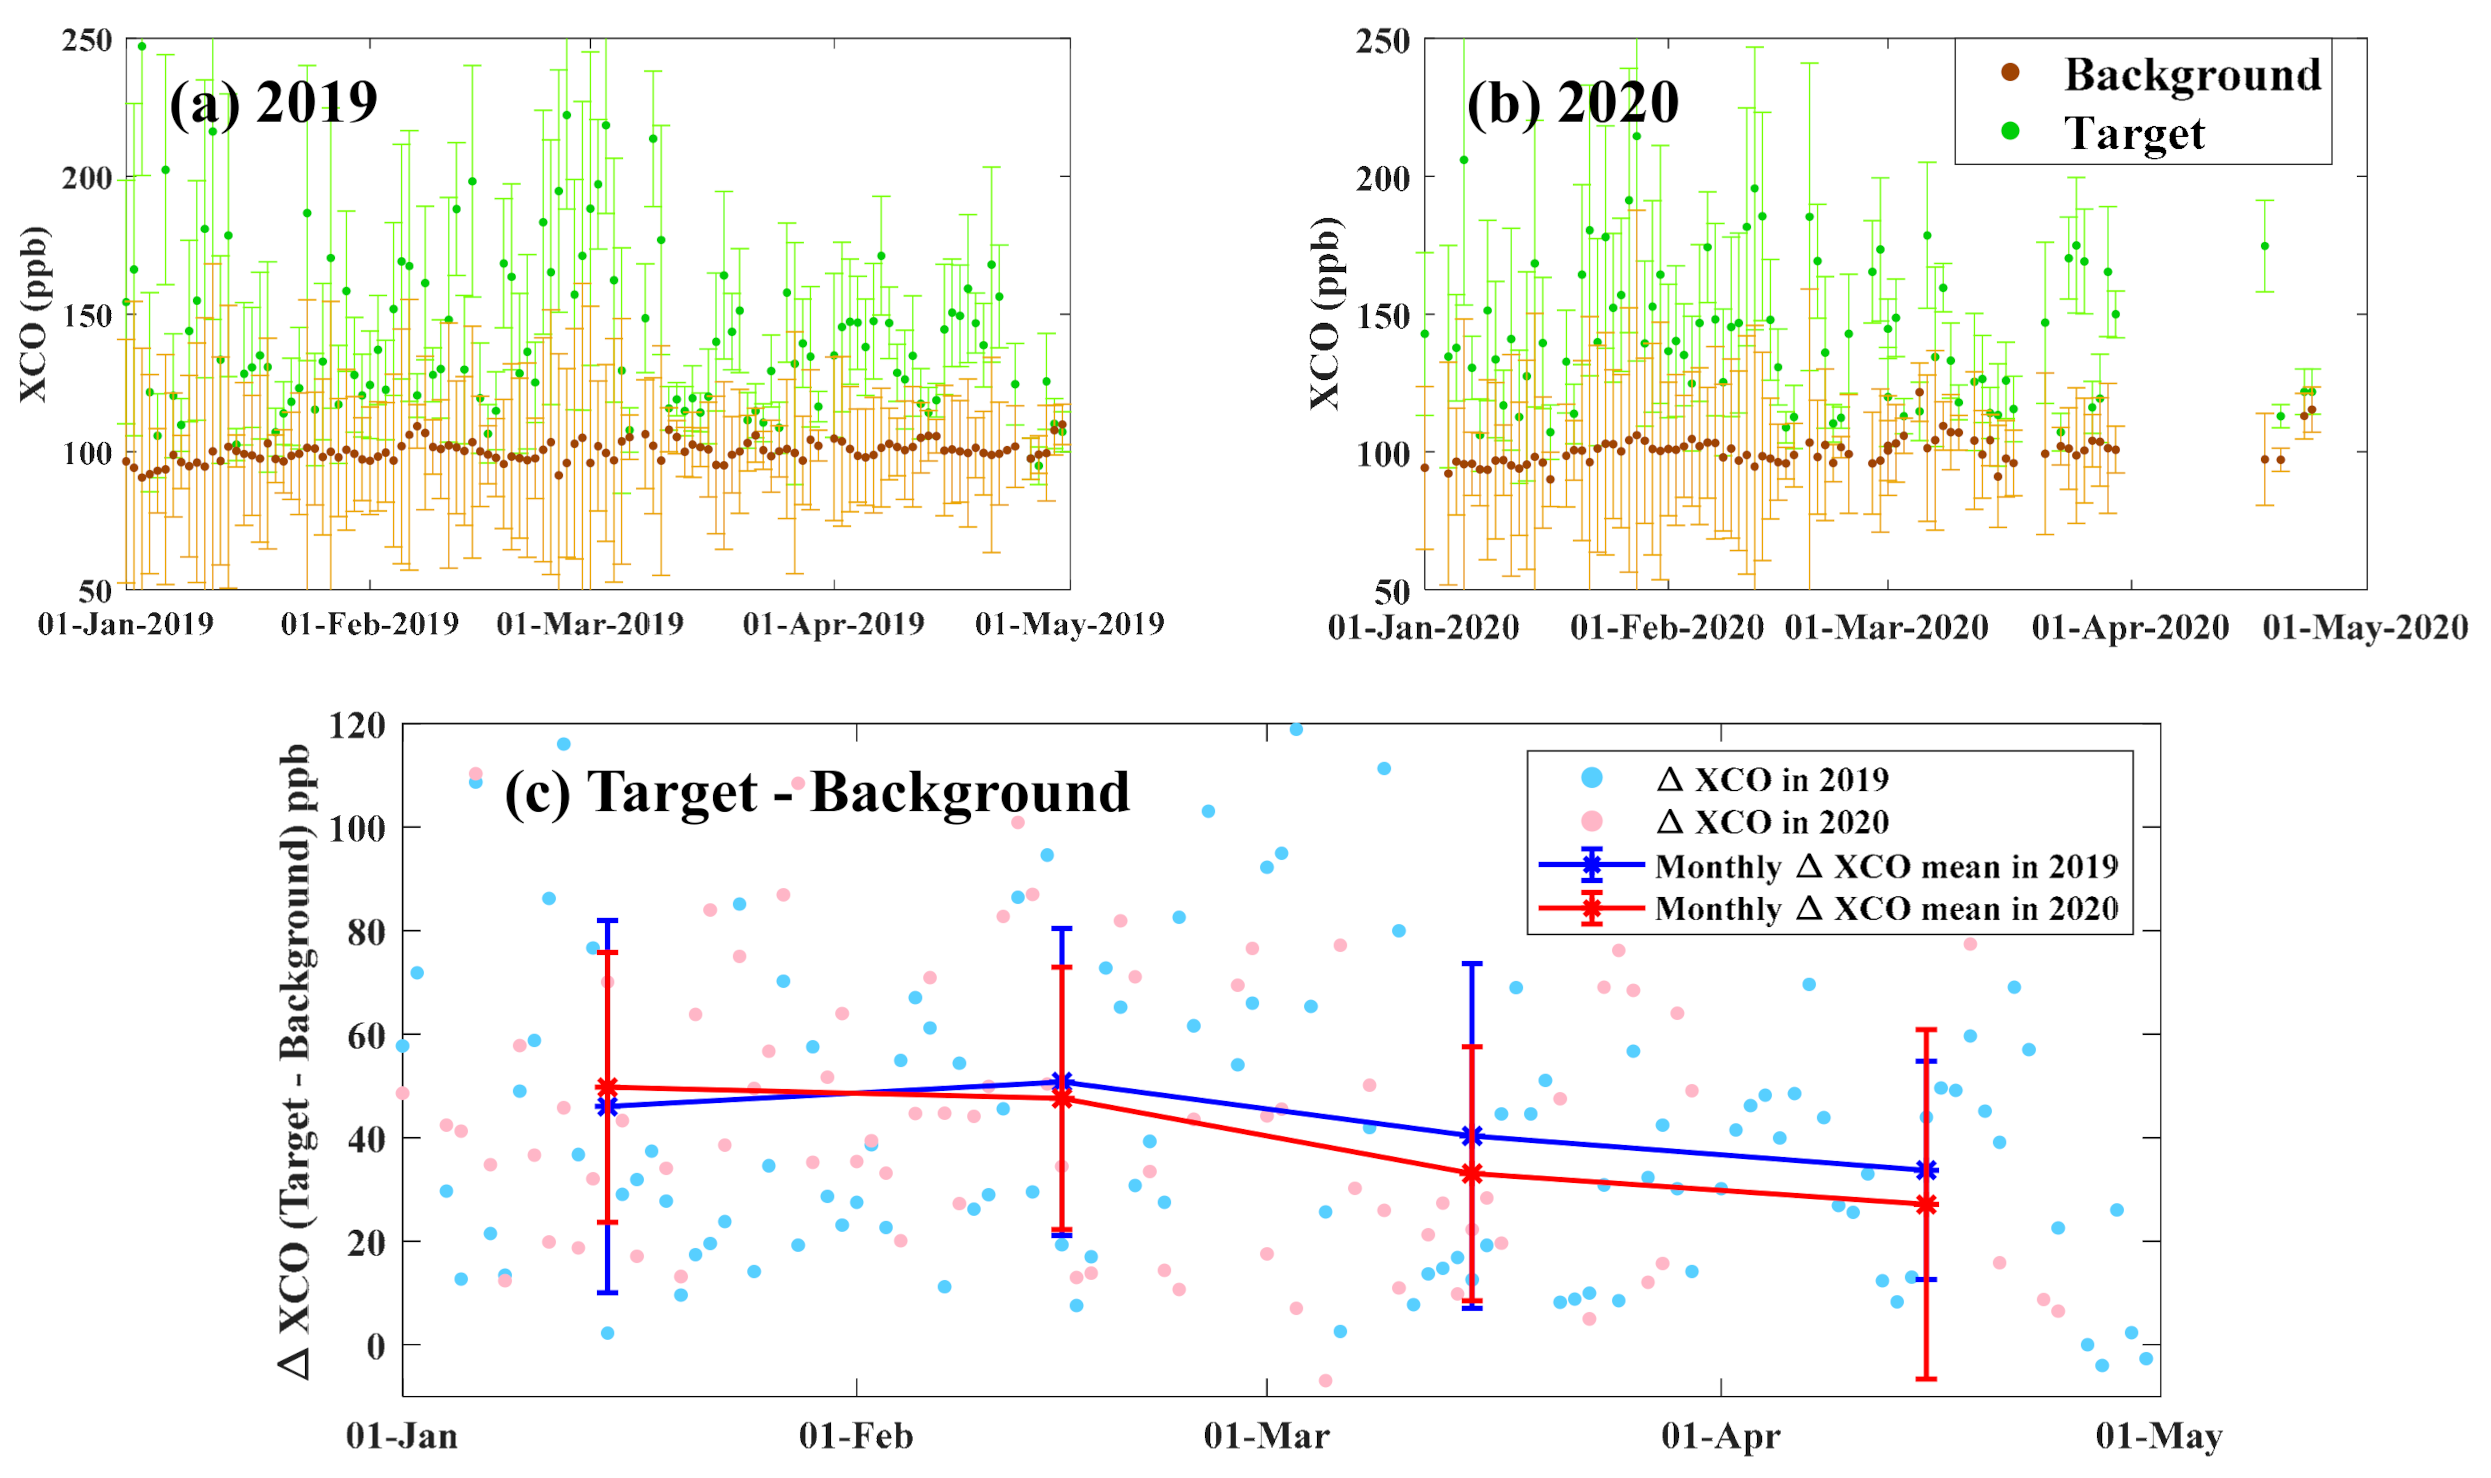
3.2. XCO Anomaly from TROPOMI

Based on the TROPOMI observations, Figure 2a,b show the XCO of the background and the target regions in the first four months of 2019 and 2020, respectively. The background and target regions are shown in Figure 1. The averaged XCO of the background region is stable with values of around 100 ppb, and the target XCO shows much higher values and apparent daily variations as a result of the local emission and synoptic-scale advections.
Figure 2c compares the monthly ΔXCO (target minus background) during the first four months of 2019 and 2020. Compared with the baseline year of 2019, monthly averaged ΔXCO in 2020 was 8.1% higher in January, but 6.3%, and 18.0% lower in February and March, respectively. The 2020 lockdown in China started on 23rd January 2020, resulting in a sharp decrease from the high XCO value in January during the following three months (Figure 2b). There are TROPOMI CO products for only a few days in April, so the ΔXCO for April 2020 is not calculated. The XCO anomaly (ΔXCO) decreased by 6.7% on average in the first quarter of 2020, which is comparable to the CO anomalies (6.5%) over north-central China from January to April 2020 by subtracting its long-term trends as observed by the Atmospheric Infrared Sounder on board NASA’s Aqua satellite [19].

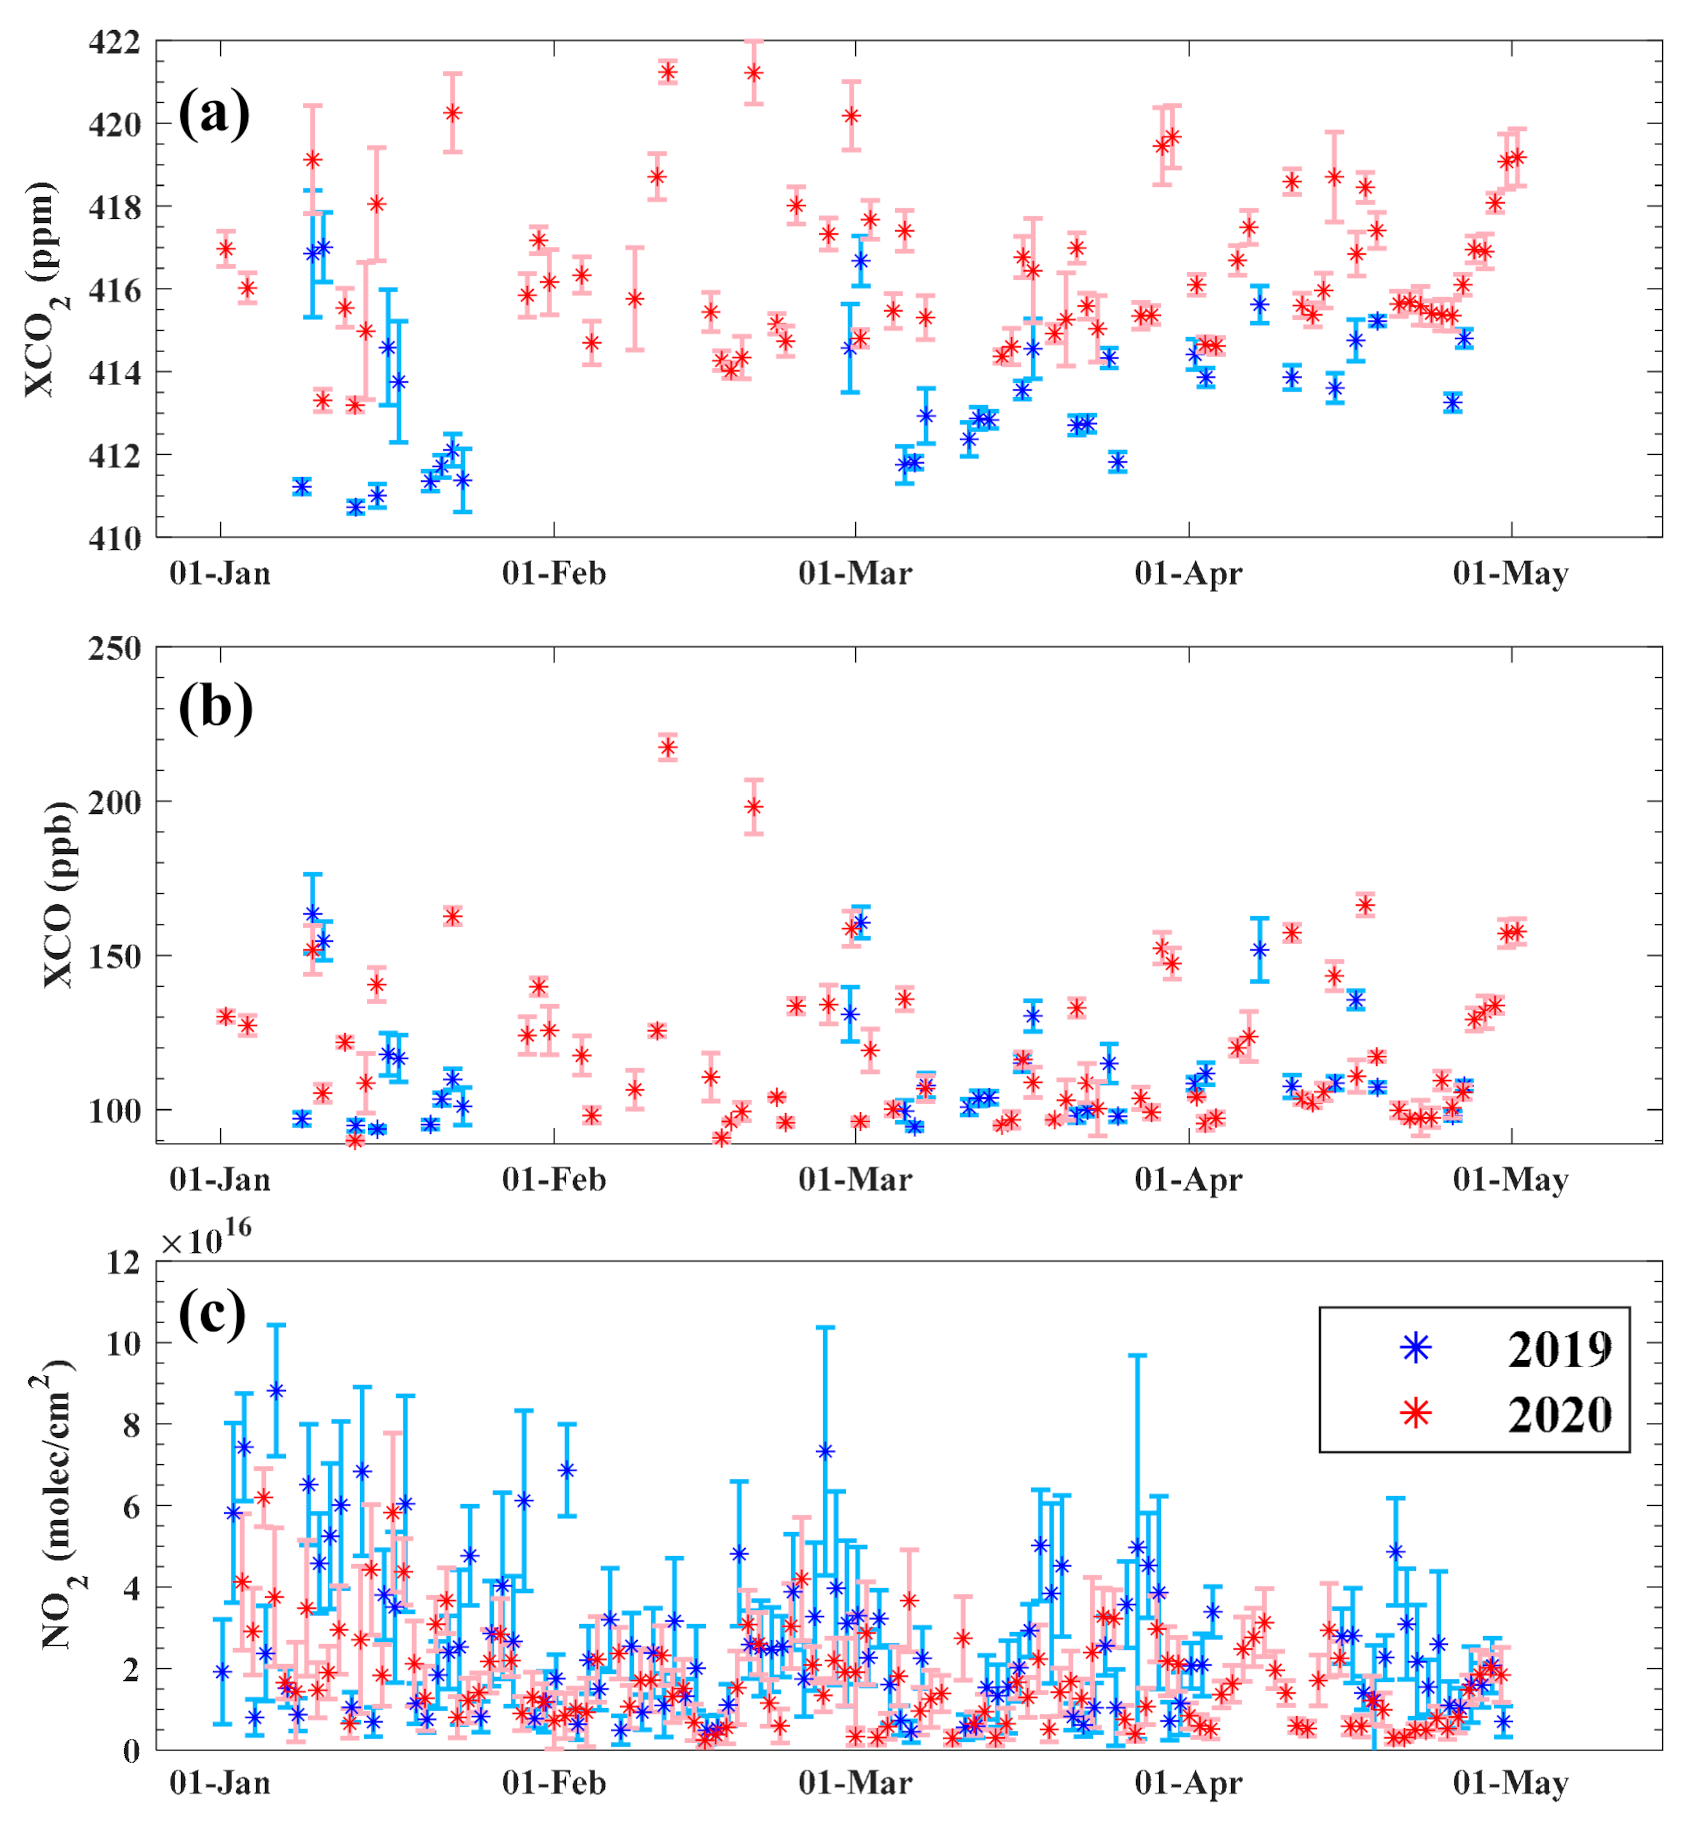
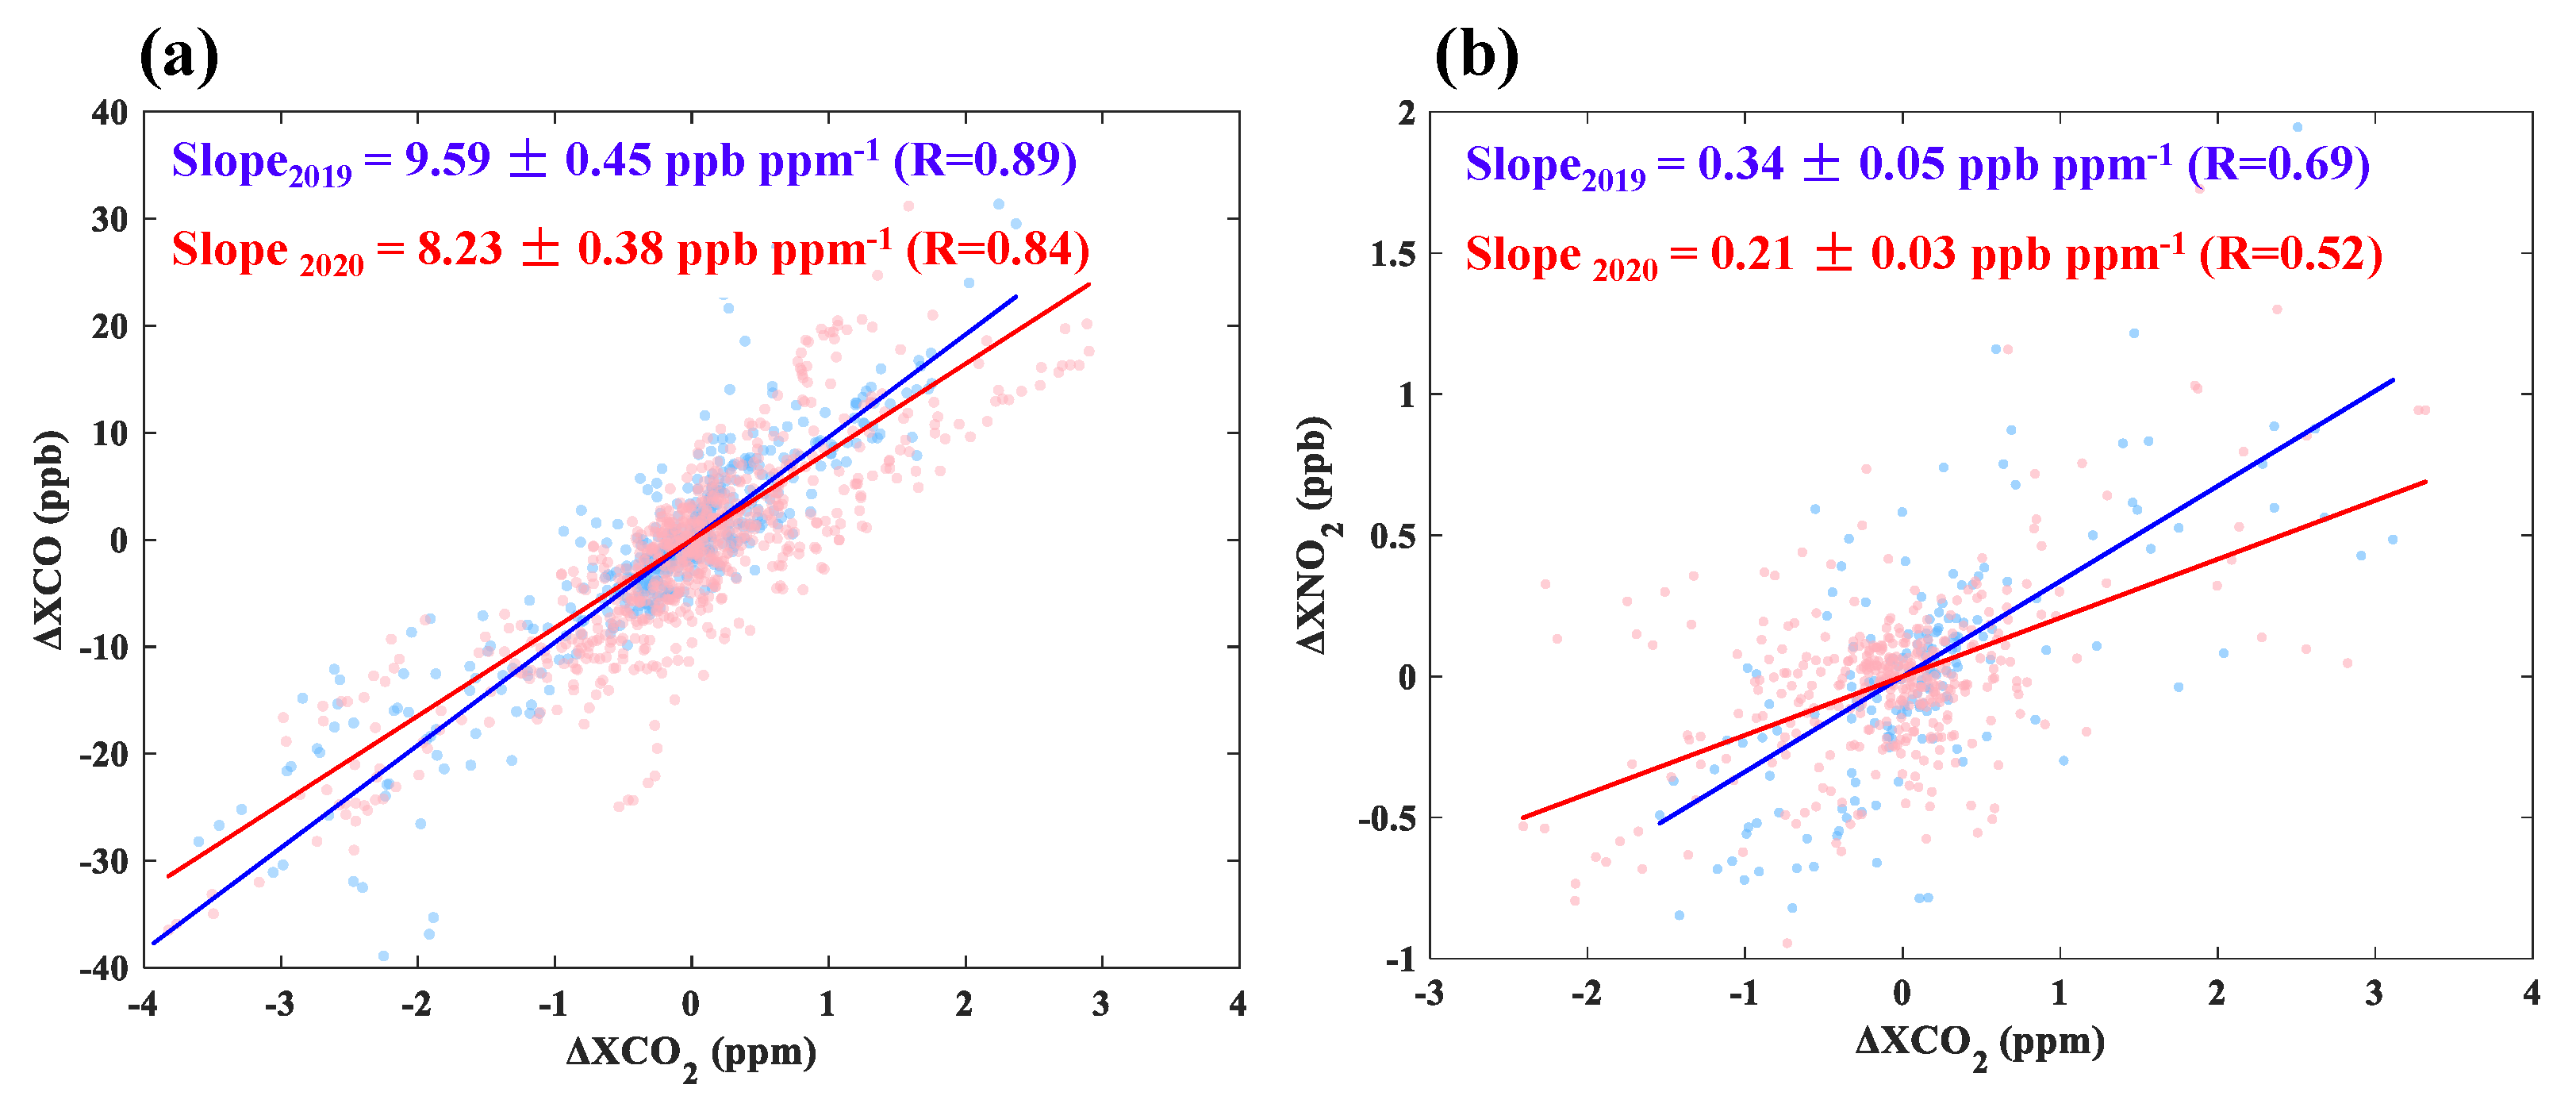
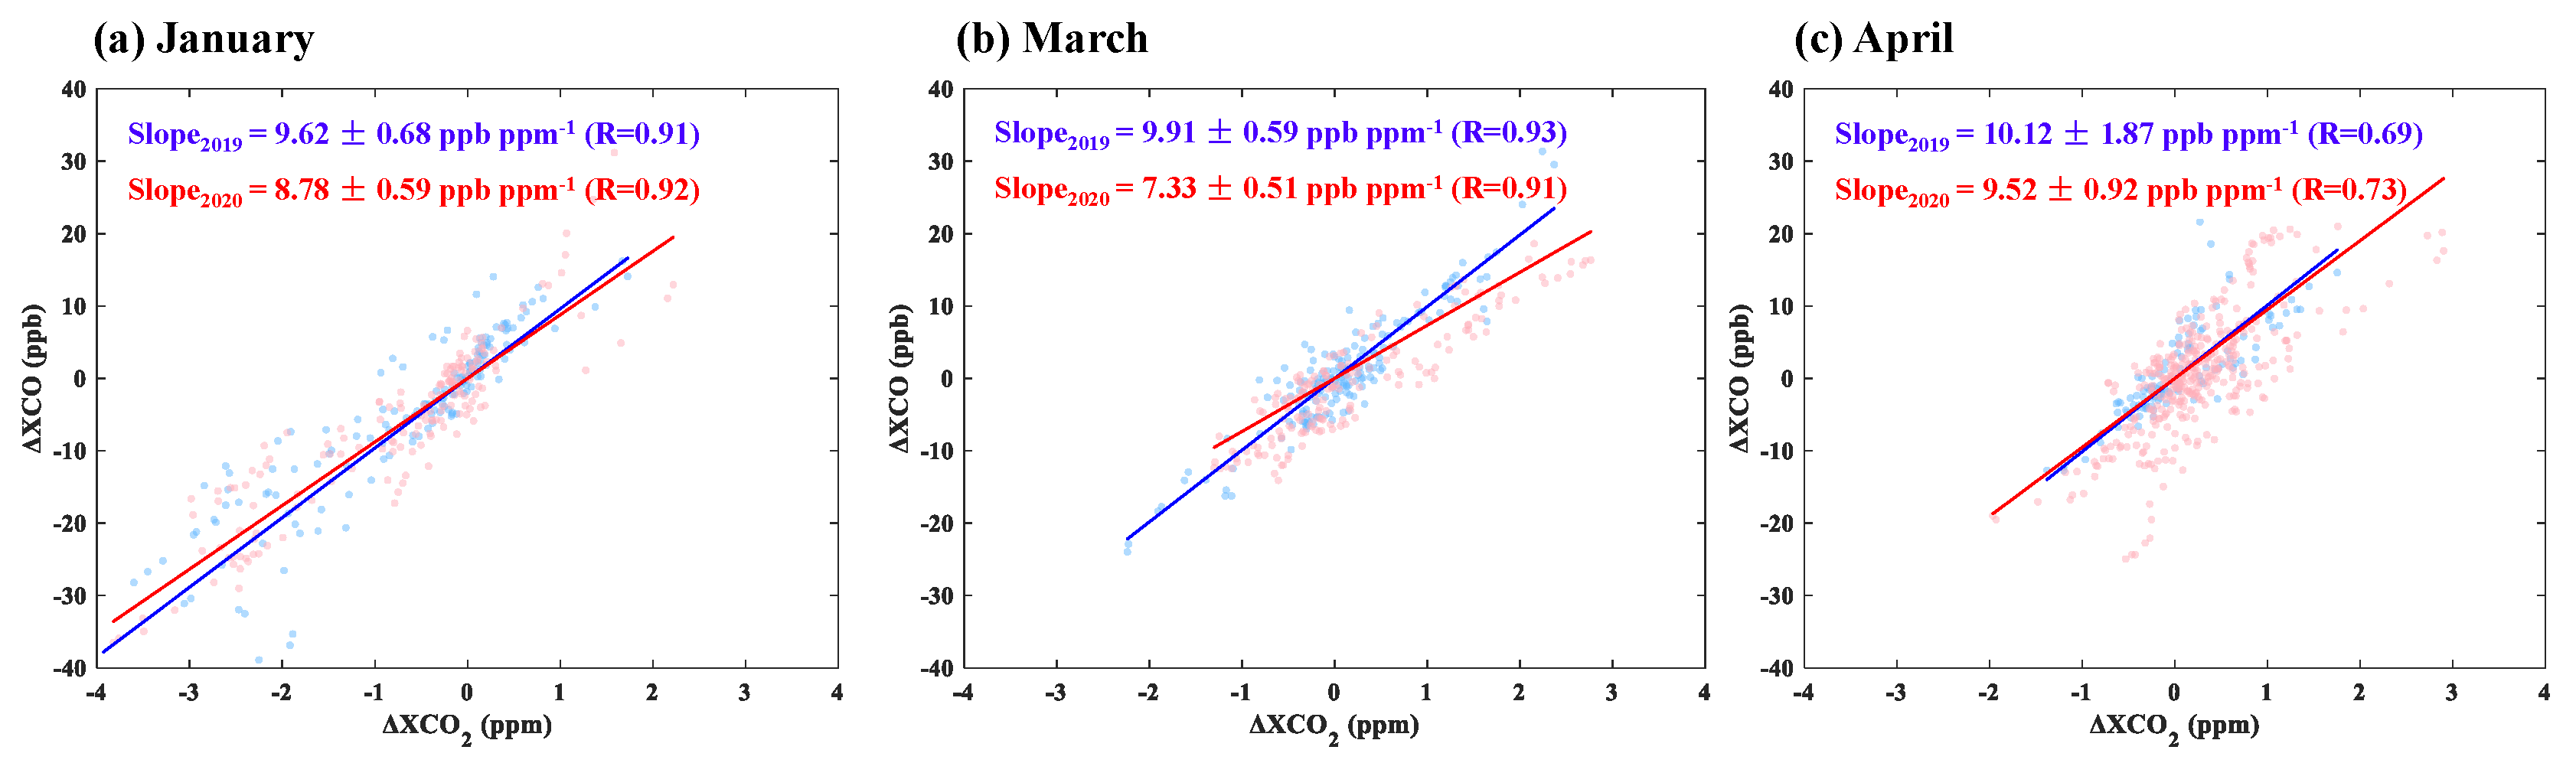
3.3. The Correlations of ΔXCO, ΔXNO2, and ΔXCO2

Based on the satellite measurements, notable reductions in XCO2 and XCO in Beijing could be identified; however, it is hard to comprehensively evaluate the contribution of human activity, even though XCO could be used as tracer for the anthropogenic contribution. It is too difficult to collect enough coincident GOSAT and TROPOMI data for both the target and background areas to build up a meaningful relationship between XCO and XCO2 anomalies. Another option is to use ground-based FTS measurements which collect XCO and XCO2 data simultaneously. Ground-based portable FTS provides XCO2 and XCO data with higher temporal resolution (1 min) than the satellite from the morning to the afternoon for a specific observation site in urban Beijing. Figure 3 shows the time series of XCO2 and XCO observed by EM27 and NO2 by MAX-DOAS from January to April in 2019 and 2020. Data for February 2019 were missing due to instrument maintenance. XCO2 in the January to April period in 2020 is higher than in the baseline year of 2019 (2.9 ppm on average). The 2020–2019 difference in XCO is approximately 5.7 ppb, which shows similar overall characteristic to the TROPOMI observations, as described in Section 3.2. On average, NO2 dropped by 31.2% compared to 2019 in the first four months, and it dropped by more than the average decrease in NO2 value of 20.2 % of China from the first five months of 2020 [16].
CO is a precursor of CO2 and is co-emitted with CO2 in combustion activities, thus causing a significant positive correlation between them. The correlation in diurnal variations in XCO2 and XCO is due to the diurnal changes in the polluted urban environment though the morning to the afternoon. To better distinguish the variation in anthropogenic CO2 from its background signal, we take CO as the tracer gas and calculate the correlations between XCO2 and XCO, assuming that the observed diurnal changes are confined to the boundary layer. The correlation slopes derived by linear regression on daily anomalies (noted as ΔCO and ΔCO2) are independent of transport and other atmospheric effects that are common to both gases [20]. The Xgas anomaly from EM27 (noted as ΔXgas) was calculated by subtracting the morning Xgas at a particular solar zenith angle from its counterpart in the afternoon, in order to eliminate solar zenith angle dependent errors from the forward model [20,21]. To account for the sensitivity of the retrieved column measurement to actual variations at the surface, the anomalies are divided by the averaging kernel value at the surface. Data in February 2020 are excluded because there is no data in February 2019, it should be noted that including these data does not change the overall correlation in 2020. The original EM27 spectra was sampled in a timestep of one minute, to reduce the random noise, the retrieved XCO2 and XCO data was averaged for 10 min.
ΔXCO and ΔXCO2 for all cloud-free days (27 days for 2019 and 34 days for 2020) show very high positive correlations (the correlation coefficient of 0.89 and 0.84, respectively) in winter and early spring when the biospheric influence is weak and less variable in northern China (Figure 4a). The strong correlation allows us to separate the anthropogenic signature in CO2 robustly and indicates the strong influence of combustion emissions on CO2. The regression slope of ΔXCO against ΔXCO2 (ΔXCO:ΔXCO2) in 2020 (α2020 = 8.2 ± 0.4 ppb/ppm) is lower than for 2019 (α2019 = 9.6 ± 0.5 ppb/ppm), indicating that less combustion-related CO2 was emitted into the atmosphere during the 2020 lockdown. The proportion of anthropogenic CO2 in the atmosphere declined by 14.2% from the differences in the regression slopes. This value is close to the estimation from GOSAT data in Section 3.1. Both the satellite and ground-based XCO2 measurements present a larger reduction than the bottom-up estimates [16,18].
Anthropogenic CO2 and NO2 emissions usually come from the same combustion processes, especially in the traffic combustion sector. We use the same enhancement calculation method as for CO:CO2. Compared to CO, NO2 correlates more with vehicle emissions and has a shorter lifetime, which makes it fall rather more noticeably. As can be seen from Figure 4b, ΔXNO2:ΔXCO2 (0.34 ± 0.05 ppb/ppm) in 2019 is noticeably higher than in 2020 (0.21 ± 0.03 ppb/ppm) and the correlation coefficient for 2020 (0.52) is significantly lower than for 2019 (0.69). ΔXNO2:ΔXCO2 drops by approximately 38.2%, assisted by the decrease in transportation in China (37.2%) reported by Liu et al. [16].
The CO:CO2 slopes for January, March, and April in year 2019 and 2020 are shown in Figure 5. The correlation coefficients for January and March are larger than 0.9 for both years, while the reduced correlation coefficients in April indicated the increasing biogenic influence. In January and April, the slope in 2020 is slightly less than that in 2020 (8.73% and 5.9%). The slope for March reduces by 26.0% in 2020 than in 2019.

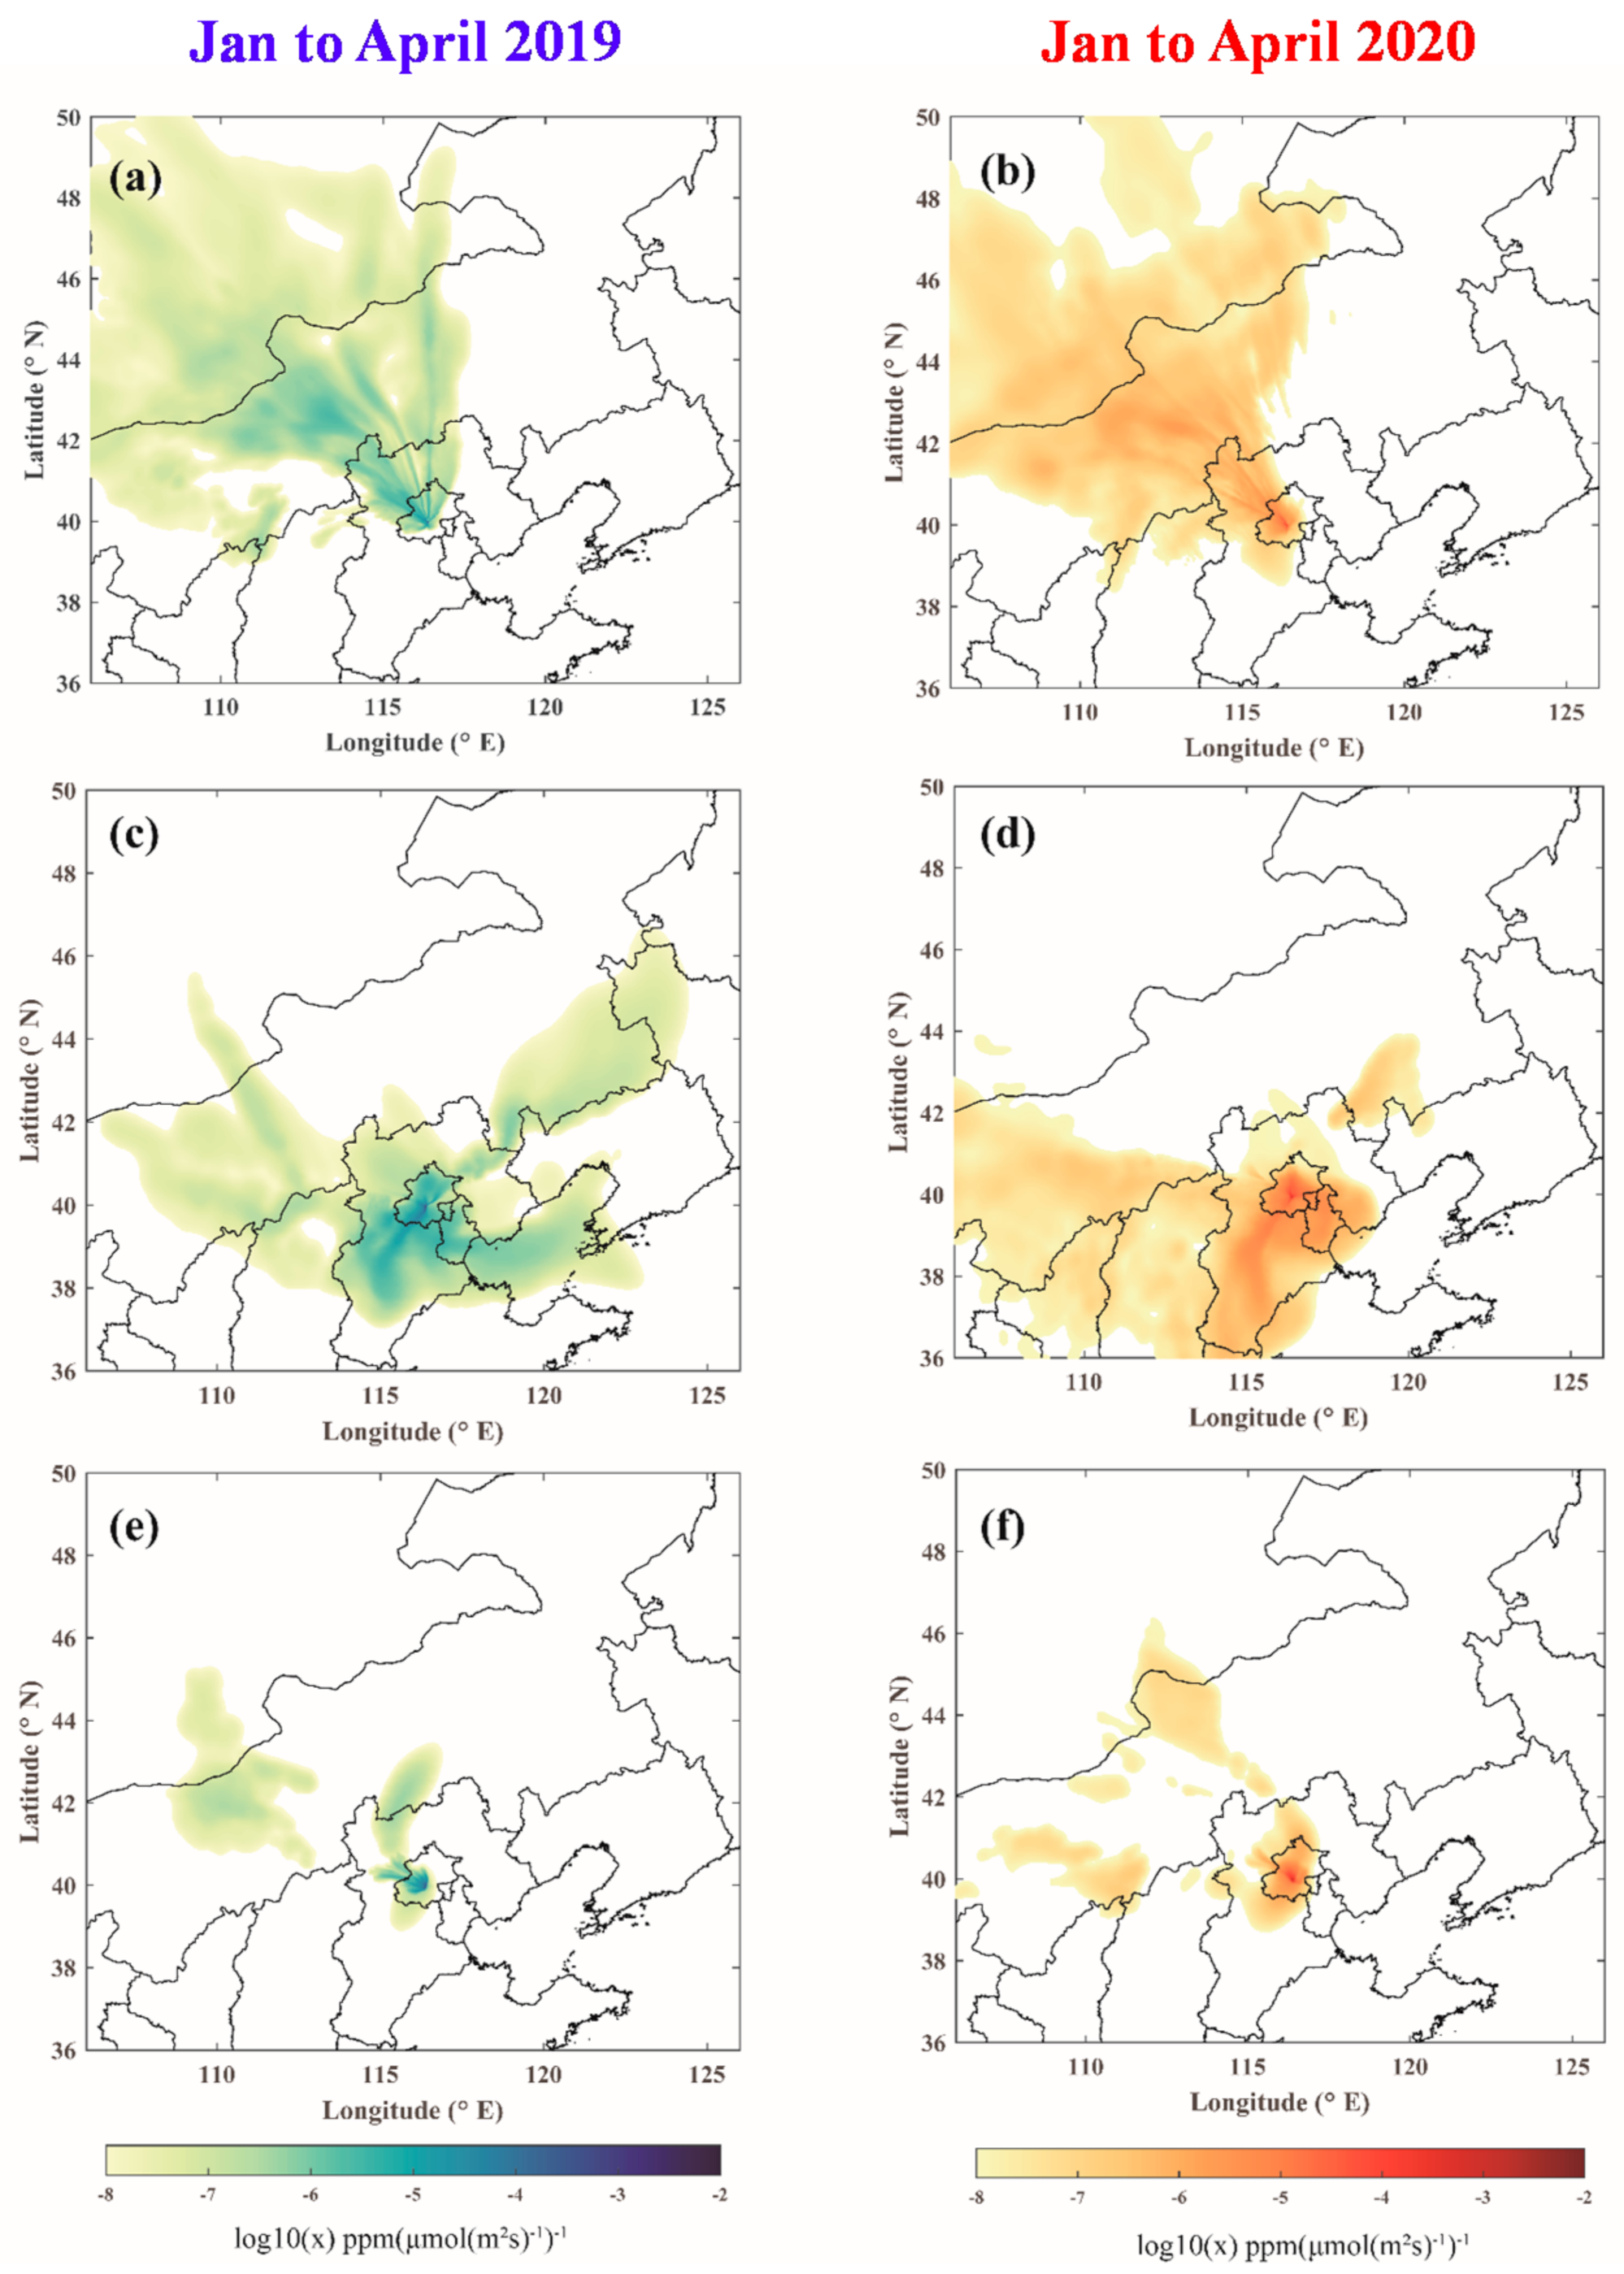
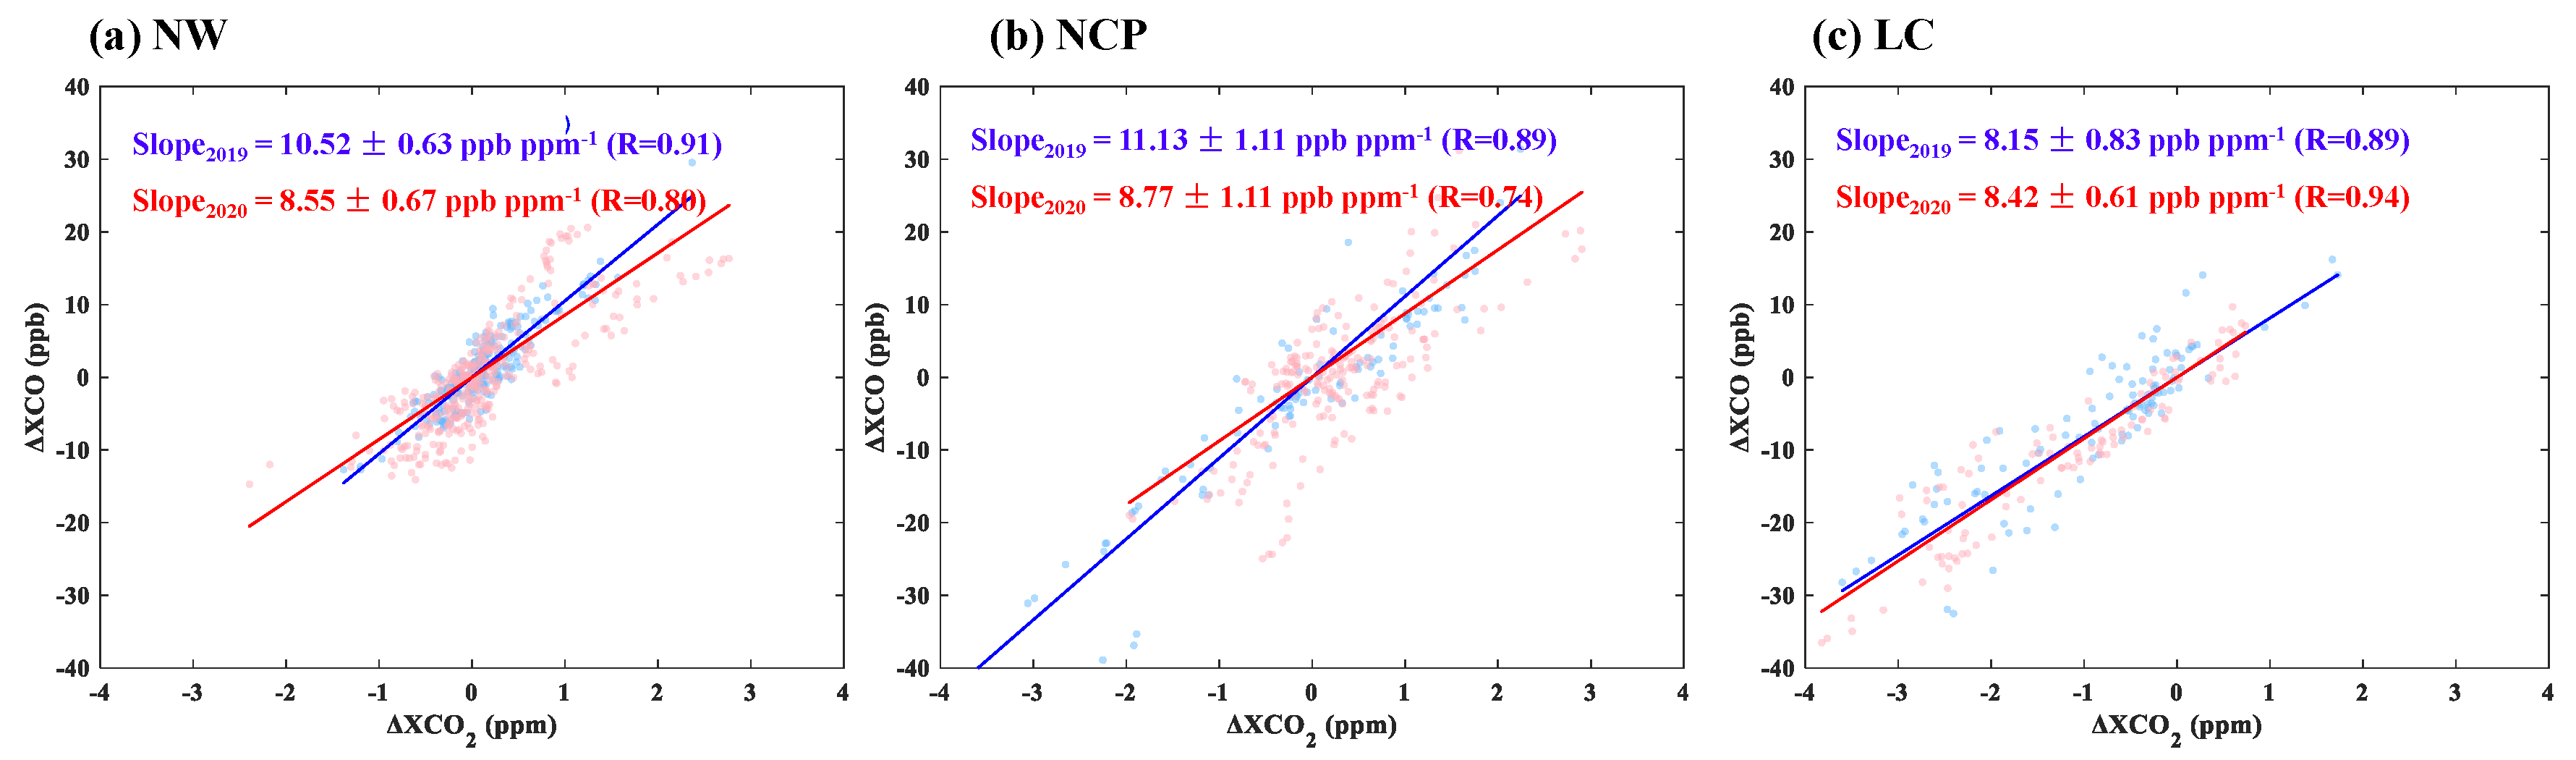
3.4. The Correlations of ΔXCO, and ΔXCO2 of Different Sources

The variations in XCO and XCO2 are strongly affected by regional transportation driven by different wind directions and wind speeds. The CO–CO2 correlation slope provides characterizations of the combustion efficiency signature of the source regions. To show the regional effect, we present a more specific interpretation of the observed ΔXCO:ΔXCO2 slope using a simple dispersion model (STILT). STILT was driven by ERA-5 reanalysis data. Column footprints, which represent the sensitivity of the column measurements to the upstream and downstream surface–atmosphere fluxes, are calculated for 2019 and 2020. Please refer to Wu et al. [12] for more details about the footprint calculation. According to the footprints of 2019 and 2020 (Figure 6), the observation site was most influenced by the northwest source (NW source), the north China plain source (NCP source), and the locally confined source (LC source). The NW footprint originated in the relatively clean region which is mostly influenced by the Siberian high. The NCP footprint originated from northern China (mainly Hebei and Shanxi provinces). Most of the LC footprint is located in the Beijing area. The NW, NCP, and LC groups account for 54%, 23%, and 23%, respectively, of all days in 2019, and for 48%, 32%, and 19%, respectively, in 2020. FTS measurements are subjected to strong-wind days and weak-wind days: the former is selected when 80% of 24-h backward footprints lie outside the Beijing area (NW and NCP sources) and the latter are selected when 80% of footprints fall within the Beijing area (LC source).
The large correlation coefficients of ΔXCO and ΔXCO2 in Figure 7 indicates that the airmass originates from different sources are dominated by anthropogenic emission. The CO2/CO correlation slope provides a characteristic signature of the source region’s overall combustion efficiency. ΔXCO:ΔXCO2 originating from different upwind sources in January to April 2019 and 2020 are distinguished. As seen from Figure 7, ΔXCO:ΔXCO2 from the NW source in 2020 (Nday = 15 d, slope = 8.7 ppb/ppm) is flatter than ΔXCO:ΔXCO2 in 2019 (Nday = 14 d, slope = 10.5 ppb/ppm). Meanwhile, ΔXCO:ΔXCO2 from the NCP source in 2020 (Nday = 10 d, slope = 8.8 ppb/ppm) is much smaller than in 2019 (Nday = 6 d, slope = 11.1 ppb/ppm). The slope from the LC source presents lower than the value in other sources (NW, NCP) in 2019 and shows flatten in 2020, which indicates higher combustion efficiency in the Beijing area than in the surroundings during 2019. The ratio of CO emission to CO2 emission derived from emission inventories, Emission Database for Global Atmospheric Research (EDGAR) and Peking University(PKU), also indicate that the value for the Beijing area is lower than for the surroundings. This brings agreement that air transported from a clean background (the NW source) was little affected during the 2020 lockdown; on the contrary, the reduction in the correlation slope of the air originating from the NCP suggests a significant reduction in anthropogenic CO2 emission in the polluted area.

4. Conclusions

Economic activity in China was reduced during the COVID-19 lockdown and Beijing experienced a reduction in carbon emissions and toxic air pollution (CO and NO2) during this time period. The COVID-related decreases in CO2 emissions have been estimated from bottom-up emission inventories in China and globally. The tropospheric nitrogen dioxide (NO2) column concentration data observed by satellite and the surface air quality data in China have also shown considerable declines during the lockdown period [16]. We have investigated the responses of anthropogenic CO2 and CO emissions in Beijing during the 2020 lockdown using the dry-air-column measurements observed by ground-based FTS (EM27/Sun) in urban Beijing supplemented by satellite data (GOSAT and TROPOMI). The dry-air-column measurements have the advantage that they are less impacted by boundary layer transport on the data. We set up a simple method to identify the reduction in XCO2 and XCO from an anomaly analysis of these data, through both observed XCO2 and XCO being increased in the Beijing area. We set up a simple method to derive the XCO2 anomaly from GOSAT and the XCO anomaly from TROPOMI over Beijing from the differences between the target area and the background area. XCO and XCO2 anomalies of FTS data are derived from morning–afternoon differences.
Based on FTS data, the highly correlated daily XCO and XCO2 anomalies allow the proportion of XCO2 concentration in the atmosphere related to anthropogenic emission to be estimated from the correlation slope. The correlation slope in the first four months of 2020 is reduced by 14.2% compared with 2019, giving an opportunity to estimate the reduction in anthropogenic emissions. Based on GOSAT data, the averaged XCO2 anomaly in January to April 2020 in contrast to the predicted value from an extrapolation of the years 2017–2019 over the same period declines by 15%. A similar reduction in CO2 emission of 15.6% in China was inferred by sector-specific ratio maps of CO2 to NOx emissions using TROPOMI NO2 data [17]. As for using NO2 as a tracer, the correlation slope of NO2 to CO2 shows a 38.2% decline in the first quarter of 2020 compared to 2019, corresponding to reduction in the traffic-related CO2 emission reported by a previous study. The consistent results from both ground-based data and satellite data confirm the significant decline in anthropogenic CO2 emissions. Overall, these atmospheric-data-driven estimations are higher than the bottom-up estimations. In addition, all days of FTS data are classified into three categories (air transported from a cleaner background, from a polluted area, and local) according to the backward footprint analysis. The reduced correlation slopes of the three sources show significant differences and a maximum reduction is obtained from NCP and a flatter slope from a cleaner background. Based on TROPOMI, the XCO anomaly shows a 7.8% decrease in the first four months of 2020 compared to 2019, which is consistent with that estimated from Atmospheric InfraRed Sounder (AIRS) data.
Our results show that atmospheric CO2 concentration changes as well as the anthropogenic emission changes related to COVID-19 can be detected by the ground-based FTS measurements by collaborative analysis with XCO. However, our results are also subject to some uncertainties and limitations: there is a need to undertake an in-depth analysis of the uncertainties inherent in the observations and transportation. Currently, there is crucial limitation for verifying bottom-up estimates. Resolving these limitations (e.g., exploiting flux from the information contained in these measurements) and investigating the local source contribution require further study using state-of-the-art inverse modelling.

Author Contributions

Conceptualization: Z.C.; Methodology: Z.C.; Formal analysis: Z.C., K.C.; Writing–original draft: Z.C.; Writing–Review and Editing: X.Y.; Funding acquisition: Z.C., Y.L., D.Y.; Validation: K.C., Y.L., D.Y., C.L.; Investigation: K.C., Y.L., D.Y., C.L.; Resources: D.Y. All authors have read and agreed to the published version of the manuscript.

Funding

This study is supported by grants from the National Key Research and Development Program of China (No. 2016YFA0600203, 2017YFB0504000), the National Natural Science Foundation of China (No. 41875043, No. 41905029), The Key Research Program of the Chinese Academy of Sciences (ZDRW-ZS-2019-1), External Cooperation Program of the Chinese Academy of Science (GJHZ1802), and Youth Innovation Promotion Association, Chinese Academy of Sciences.

Informed Consent Statement

Informed consent was obtained from all subjects involved in the study.

Data Availability Statement

The data used to support the findings of this study are available from the corresponding author upon request.

Acknowledgments

We thank the GOSAT team for providing GOSAT data and the TROPOMI team for providing TROPOMI data. We also thank the X-STILT model provider and ECMWF for ERA-5 reanalysis data.

Conflicts of Interest

The authors declare no conflict of interest.

References

  1. Diffenbaugh, N.S.; Field, C.B.; Appel, E.A.; Azevedo, I.L.; Baldocchi, D.D.; Burke, M.; Burney, J.A.; Ciais, P.; Davis, S.J.; Fiore, A.M.; et al. The COVID-19 lockdowns: A window into the Earth System. Nat. Rev. Earth Environ. 2020, 1, 470–481. [Google Scholar] [CrossRef]
  2. Bauwens, M.; Compernolle, S.; Stavrakou, T.; Müller, J.-F.; van Gent, J.; Eskes, H.; Levelt, P.F.; van der A, R.; Veefkind, J.P.; Vlietinck, J.; et al. Impact of coronavirus outbreak on NO2 pollution assessed using TROPOMI and OMI observations. Geophys. Res. Lett. 2020, 47, e2020GL087978. [Google Scholar] [CrossRef]
  3. Chauhan, A.; Singh, R. Decline in PM2.5 Concentrations over Major Cities around the World Associated with COVID-19. Environ. Res. 2020, 187, 109634. [Google Scholar] [CrossRef]
  4. Shi, X.; Brasseur, G. The Response in Air Quality to the Reduction of Chinese Economic Activities During the COVID-19 Outbreak. Geophys. Res. Lett. 2020, 47, e2020GL088070. [Google Scholar] [CrossRef]
  5. Le, T.; Wang, Y.; Liu, L.; Yang, J.; Yung, Y.L.; Li, G.; Seinfeld, J.H. Unexpected air pollution with marked emission reductions during the COVID-19 outbreak in China. Science 2020, 369, eabb7431. [Google Scholar] [CrossRef]
  6. Yuan, Q.; Qi, B.; Hu, D.; Wang, J.; Zhang, J.; Yang, H.; Zhang, S.; Liu, L.; Xu, L.; Li, W. Spatiotemporal variations and reduction of air pollutants during the COVID-19 pandemic in a megacity of Yangtze River Delta in China. Sci. Total Environ. 2020, 751, 141820. [Google Scholar] [CrossRef]
  7. Wunch, D.; Toon, G.C.; Blavier, J.F.L.; Washenfelder, R.A.; Notholt, J.; Connor, B.J.; Griffith, D.W.T.; Sherlock, V.; Wennberg, P.O. The Total Carbon Column Observing Network. Philos. Trans. R. Soc. A 2011, 369, 2087–2112. [Google Scholar] [CrossRef] [Green Version]
  8. Hase, F.; Hannigan, J.W.; Coffey, M.T.; Goldman, A.; Höpfner, M.; Jones, N.B.; Rinsland, C.P.; Wood, S.W. Intercomparison of retrieval codes used for the analysis of high-resolution, ground-based FTIR measurements. J. Quant. Spectrosc. Radiat. 2004, 87, 25–52. [Google Scholar] [CrossRef]
  9. Frey, M.; Sha, M.K.; Hase, F.; Kiel, M.; Blumenstock, T.; Harig, R.; Surawicz, G.; Deutscher, N.M.; Shiomi, K.; Franklin, J.E.; et al. Building the COllaborative Carbon Column Observing Network (COCCON): Long-term stability and ensemble performance of the EM27/SUN Fourier transform spectrometer. Atmos. Meas. Technol. 2019, 12, 1513–1530. [Google Scholar] [CrossRef] [Green Version]
  10. Velazco, V.; Deutscher, N.; Morino, I.; Uchino, O.; Bukosa, B.; Ajiro, M.; Kamei, A.; Jones, N.B.; Paton-Walsh, C.; Griffith, D.W.T. Satellite and ground-based measurements of XCO2 in a remote semiarid region of Australia. Earth Syst. Sci. Data 2019, 11, 935–946. [Google Scholar] [CrossRef] [Green Version]
  11. Yang, Y.; Zhou, M.; Langerock, B.; Sha, M.; Hermans, C.; Wang, T.; Ji, D.; Vigouroux, C.; Kumps, N.; Wang, G.; et al. New ground-based Fourier-transform near-infrared solar absorption measurements of XCO2, XCH4 and XCO at Xianghe, China. Earth Syst. Sci. Data 2020, 12, 1679–1696. [Google Scholar] [CrossRef]
  12. Wu, D.; Lin, J.; Fasoli, B.; Oda, T.; Ye, X.; Lauvaux, T.; Yang, E.G.; Kort, E.A. A Lagrangian approach towards extracting signals of urban CO2 emissions from satellite observations of atmospheric column CO2 (XCO2): X-Stochastic Time-Inverted Lagrangian Transport model (“X-STILT v1”). Geosci. Model Dev. 2018, 11, 4843–4871. [Google Scholar] [CrossRef] [Green Version]
  13. Wu, D.; Lin, J.C.; Oda, T.; Kort, E.A. Space-based quantification of per capita CO2 emissions from cities. Environ. Res. Lett. 2020, 15, 035004. [Google Scholar] [CrossRef]
  14. Borsdorff, T.; Aan de Brugh, J.; Hu, H.; Aben, I.; Hasekamp, O.; Landgraf, J. Measuring Carbon Monoxide With TROPOMI: First Results and a Comparison With ECMWF-IFS Analysis Data. Geophys. Res. Lett. 2018, 45, 2826–2832. [Google Scholar] [CrossRef]
  15. Borsdorff, T.; aan de Brugh, J.; Pandey, S.; Hasekamp, O.; Aben, I.; Houweling, S.; Landgraf, J. Carbon monoxide air pollution on sub-city scales and along arterial roads detected by the Tropospheric Monitoring Instrument. Atmos. Chem. Phys. 2019, 19, 3579–3588. [Google Scholar] [CrossRef] [Green Version]
  16. Liu, Z.; Ciais, P.; Deng, Z.; Lei, R.; Davis, S.J.; Feng, S.; Zheng, B.; Cui, D.; Dou, X.; Zhu, B.; et al. Near-real-time monitoring of global CO2 emissions reveals the effects of the COVID-19 pandemic. Nat. Commun. 2020, 11, 5172. [Google Scholar] [CrossRef]
  17. Zheng, B.; Geng, G.; Ciais, P.; Davis, S.J.; Martin, R.V.; Meng, J.; Wu, N.; Chevallier, F.; Broquet, G.; Boersma, F.; et al. Satellite-based estimates of decline and rebound in China’s CO2 emissions during COVID-19 pandemic. Sci. Adv. 2020, 6, eabd4998. [Google Scholar] [CrossRef]
  18. Han, P.; Cai, Q.; Oda, T.; Zeng, N.; Shan, Y.; Lin, X.; Liu, D. Assessing the recent impact of COVID-19 on carbon emissions from China using domestic economic data. Sci. Total Environ. 2020, 750, 141688. [Google Scholar] [CrossRef]
  19. Metya, A.; Dagupta, P.; Halder, S.; Chakraborty, S.; Tiwari, Y.K. COVID-19 Lockdowns Improve Air Quality in the South-East Asian Regions, as Seen by the Remote Sensing Satellites. Aerosol Air Qual. Res. 2020, 20, 1772–1782. [Google Scholar] [CrossRef]
  20. Wunch, D.; Wennberg, P.O.; Toon, G.C.; Keppel-Aleks, G.; Yavin, Y.G. Emissions of greenhouse gases from a North American megacity. Geophys. Res. Lett. 2009, 36, L15810. [Google Scholar] [CrossRef] [Green Version]
  21. Wunch, D.; Jones, D.B.A.; Toon, G.C.; Deutscher, N.M.; Maasakkers, J.D. Emissions of methane in Europe inferred by total column measurements. Atmos. Chem. Phys. 2019, 19, 3963–3980. [Google Scholar] [CrossRef] [Green Version]
Figure 1. (a) Map of TROPOMI XCO averaged from January to April 2019. The region (38.5–41.5°N, 115–118°E) was selected as the target area (green shading) and the region (45–55°N, 105–115°E) was selected as the background region (brown shading). Beijing is outlined by the bold black line and the EM27/SUN Fourier transform spectrometer observation site in urban Beijing is marked by the black star. (b) Daily error bars and mean values of XCO2 measured by GOSAT from 2017 to 2020 over the target (green) and background (brown) regions. The Error bar presents the standard deviation for each day. The first quarter of each year is indicated by gray shading. (c) Error bars and mean values of XCO2 for the first quarter of each year. The estimated trend from 2017 to 2019 is plotted as the black line. The estimated increase in XCO2 (ΔXCO2) in 2020 is shown with black circle and the observed ΔXCO2 with black triangle. The Error bar presents the standard deviation for each year.
Remotesensing 13 00517 g001
Figure 2. Daily error bars and mean values of XCO over the background and target regions for (a) 2019 and (b) 2020. Error bar shows the standard deviation of XCO enhancement (ΔXCO) for each day in background and target region. (c) Daily and monthly increases in XCO (ΔXCO) in 2019 (blue) and 2020 (red). Error bar presents the monthly standard deviation of ΔXCO in 2019 and 2020.
Remotesensing 13 00517 g002
Figure 3. Time series of XCO2 (a), XCO (b), and NO2 (c) columns from January to April 2019 (blue) and 2020 (red). The asterisk present the daily mean of XCO2, XCO, and NO2 columns and error bars show the standard deviation.
Remotesensing 13 00517 g003
Figure 4. Correlations of ΔXCO (a), ΔXNO2 (b), and ΔXCO2 in 2019 (blue) and 2020 (red); slope2019 and slope2020 represent the regression fitted slopes for 2019 and 2020, R is the correlation coefficient.
Remotesensing 13 00517 g004
Figure 5. Correlations of ΔXCO and ΔXCO2 in (a) January, (b) March and (c) April of 2019 (blue) and 2020 (red); slope2019 and slope2020 represent the regression fitted slopes for 2019 and 2020, R is the correlation coefficient.
Remotesensing 13 00517 g005
Figure 6. Maps of the average 24 h backward footprint (ppm (µmol (m2 s)−1)−1), log10 (x)) at the Institute of Physics, Beijing, starting at 12:00 local time in different upwind sources from January to April 2019 (blue) and 2020 (red). (a,b): The area to the northwest of the observation site is defined as the northwest source (NW source), (c,d): the areas to the south and northwest are defined as the north China plain source (NCP source). (e,f): stable weather conditions are classified as the locally confined source (LC source).
Remotesensing 13 00517 g006
Figure 7. Correlations of ΔXCO and ΔXCO2 in 2019 originating from (a) NW, (b) NCP, and (c) LC.
Remotesensing 13 00517 g007
Publisher’s Note: MDPI stays neutral with regard to jurisdictional claims in published maps and institutional affiliations.

