
A Method for Detection of Small Moving Objects in UAV Videos
by
 , , , , , and
Vladan Stojnić
1 ,
,
Vladimir Risojević
1,*,
Mario Muštra
2 ,
,
Vedran Jovanović
1,
Janja Filipi
3,
Nikola Kezić
4 and
Zdenka Babić
1 1
Faculty of Electrical Engineering, University of Banja Luka, Patre 5, 78000 Banja Luka, Bosnia and Herzegovina
2
Faculty of Transport and Traffic Sciences, University of Zagreb, Vukelićeva 4, 10000 Zagreb, Croatia
3
Department of Ecology, Agronomy and Aquaculture, University of Zadar, Trg Kneza Višeslava 9, 23000 Zadar, Croatia
4
Faculty of Agriculture, University of Zagreb, Svetošimunska Cesta 25, 10000 Zagreb, Croatia
*
Author to whom correspondence should be addressed.
Remote Sens. 2021, 13(4), 653; https://0-doi-org.brum.beds.ac.uk/10.3390/rs13040653
Submission received: 31 December 2020
/
Revised: 2 February 2021
/
Accepted: 5 February 2021
/
Published: 11 February 2021
(This article belongs to the Section AI Remote Sensing)
Abstract
:Detection of small moving objects is an important research area with applications including monitoring of flying insects, studying their foraging behavior, using insect pollinators to monitor flowering and pollination of crops, surveillance of honeybee colonies, and tracking movement of honeybees. However, due to the lack of distinctive shape and textural details on small objects, direct application of modern object detection methods based on convolutional neural networks (CNNs) shows considerably lower performance. In this paper we propose a method for the detection of small moving objects in videos recorded using unmanned aerial vehicles equipped with standard video cameras. The main steps of the proposed method are video stabilization, background estimation and subtraction, frame segmentation using a CNN, and thresholding the segmented frame. However, for training a CNN it is required that a large labeled dataset is available. Manual labelling of small moving objects in videos is very difficult and time consuming, and such labeled datasets do not exist at the moment. To circumvent this problem, we propose training a CNN using synthetic videos generated by adding small blob-like objects to video sequences with real-world backgrounds. The experimental results on detection of flying honeybees show that by using a combination of classical computer vision techniques and CNNs, as well as synthetic training sets, the proposed approach overcomes the problems associated with direct application of CNNs to the given problem and achieves an average F1-score of 0.86 in tests on real-world videos.
1. Introduction
Convolutional neural networks (CNNs) have improved state of the art results on tasks of object detection in images and videos [1,2]. However, the majority of these algorithms are oriented towards detection of objects that are large compared to the size of a frame and have distinctive visual features that can be used for learning discriminative object representations. However, when target objects are small, e.g., less than pixels, the obtained results are considerably worse [3]. The main reason for this discrepancy is the lack of distinctive shape and texture on small objects. It precludes learning useful representations of small objects resulting in worse detection performance. Furthermore, general purpose object detectors are trained to predict bounding boxes of objects in image or video, while for small objects only the object coordinates, , are required in most applications.
Small object detection is an important task with applications that include: surveillance of insects or small animals, detection of small and/or distant objects in search and track systems, sense and avoid functionality in unmanned aerial vehicles (UAVs), traffic monitoring, and detection of dangerous or unusual behavior in overhead imagery and videos etc. In this paper we propose a method for the detection of small moving objects in videos recorded using UAVs and demonstrate its effectiveness for flying honeybee detection. Possible applications of the proposed method include monitoring of flying insects, studying their foraging behavior, using insect pollinators to monitor flowering and pollination of crops, surveillance of honeybee colonies, and tracking the movement of honeybees for various applications, such as humanitarian demining. [4,5]. While in this paper we primarily present experiments with honeybees, the proposed method is applicable to other types of flying insects and small blob-like moving objects in general.
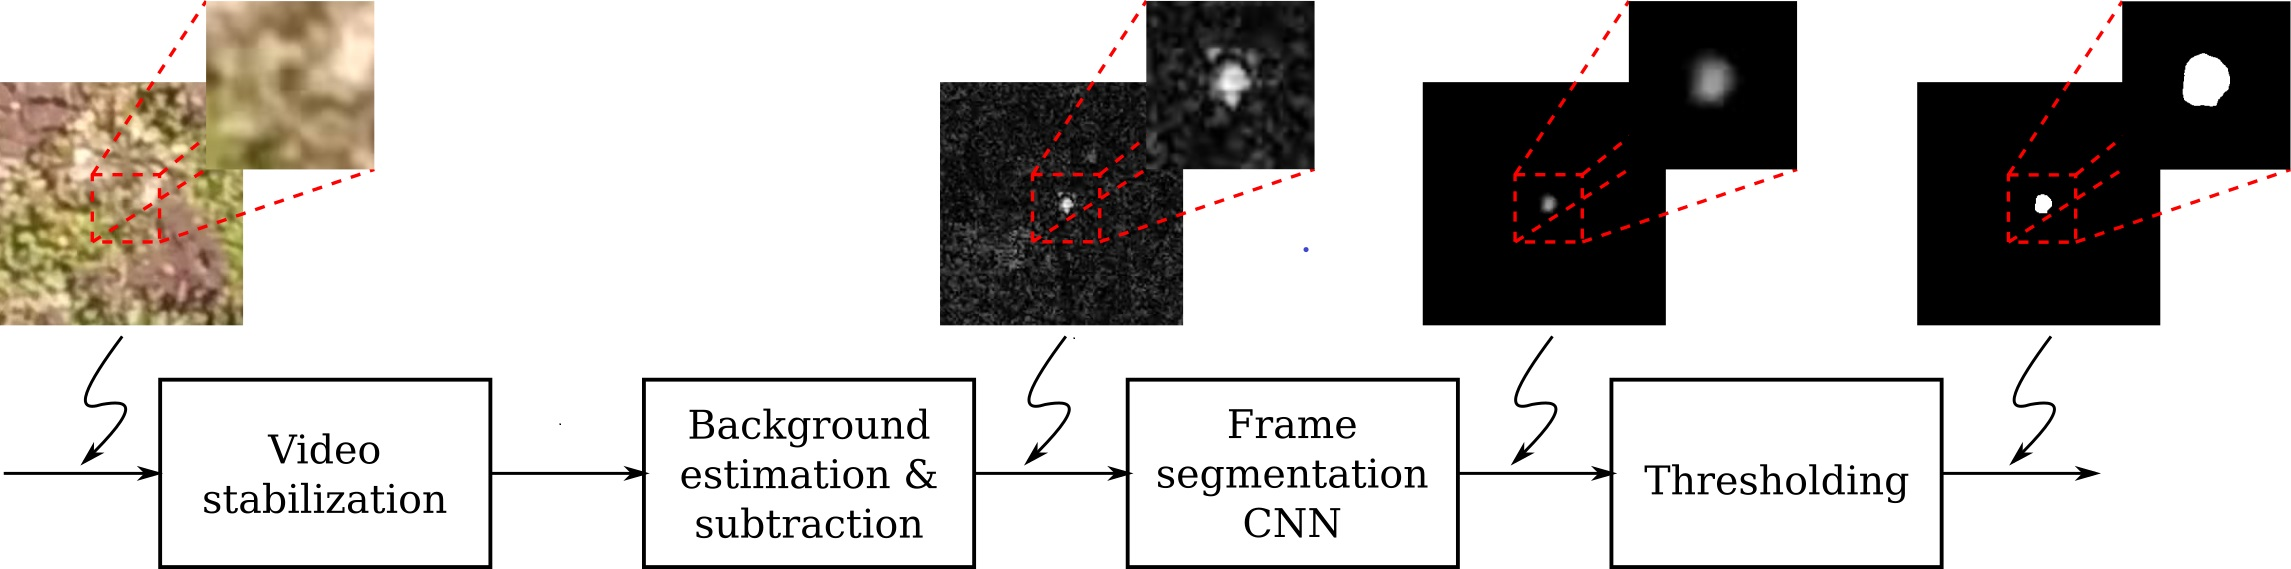
There are a number of challenges associated with building an effective system for detection of small moving objects. For example, in the case of honeybees, a detection method must be non-invasive, meaning that it must not interfere with honeybees flying during recording. Therefore, UAVs must be flown at higher altitudes. As a result, honeybees in recorded video sequences will be very small, with a blob-like shape, and without a readily noticeable texture, as shown in Figure 1a. In addition, the appearance of flying honeybees may change during the sequence due to flapping of wings, shadows, camera gain variations etc. Furthermore, honeybees are fast targets and individual honeybees may appear in only one or two consecutive frames. Finally, backgrounds in video sequences recorded from UAVs in natural conditions usually contain grass or other vegetation moving due to wind or air flow produced by an UAV. Consequently, the foreground/background contrast ratio in frames will be low and there will be motion that does not originate from flying honeybees. As a result, it is hard, even for human observers, to spot honeybees in recorded videos, and almost impossible in still images. However, as can be seen by comparing Figure 1a,b, it is possible to notice the change of appearance at a particular location due to honeybee motion. Similar problems could be identified in other applications involving detection of small moving objects. Based on this, we decided to work with videos and detection of small moving objects based on a fusion of information about their appearance and motion.
Although many algorithms for moving object detection exist [6], due to the presence of motion in the background, their direct application is limited and results in a large number of false positive detections. To filter out these false positive detections, we propose using a CNN trained on groups of consecutive frames, which learns a representation of appearance and motion of small objects and outputs confidence maps of presence of moving objects in the middle frame for each group of frames given as an input to it.
Since it is difficult for human observers to detect small moving objects in recorded videos, manual labelling of a large number of videos, necessary to train a detector based on a CNN, is a difficult and error-prone task. Because of that, there are no available training datasets that can be used for this purpose. To solve this problem, we generated a synthetic training dataset, with video sequences containing real-world backgrounds and artificially generated small moving objects.
We use synthetic video sequences to train a CNN model and perform a series of experiments with both synthetic and real-world video sequences. The goal of the experiments with synthetic sequences is to investigate the impact of the parameters used for generation of training data, as well as other design choices on performance of the detector. Most notably, we vary the contrast ratio between artificial objects and background to find the optimal contrast ratio in the training data that will give good results on a range of contrast ratio values in the test sequences. At the task of detection of flying honeybees in real-world videos our CNN-based method, trained on synthetic videos, achieves the average F1-score of 0.86. To the best of our knowledge, this is the first method to use synthetic data for training a small moving object detector and also the first method for detection of small moving objects applied to the detection of flying honeybees in videos recorded using UAVs.
The main contributions of this paper are: (1) An approach that effectively uses both appearance and motion information to detect small moving objects in videos captured using UAVs. (2) Usage of synthetic data for training a CNN-based detector. (3) Evaluation of the impact of the parameters used for generating synthetic training videos, as well as other design choices on performance of the detector. (4) Investigation whether the detector performance on synthetic data can be used as a proxy for performance on real-world video sequences.
This paper is organized in the following way. In Section 2 we review the related work. Section 3 contains descriptions of the datasets used for training and testing the approach. In Section 4, a detailed description of the method for detection of small moving objects is presented. The experimental results are presented in Section 5. In Section 6 we discuss the obtained experimental results. Finally, Section 7 concludes the paper. The data used in this study is publicly available at https://0-doi-org.brum.beds.ac.uk/10.5281/zenodo.4400650. The code used for the experiments is publicly available at https://github.com/vladan-stojnic/Detection-of-Small-Flying-Objects-in-UAV-Videos.
2. Related Work
In general purpose object detection, in the past years the state of the art results have been obtained using approaches based on CNNs. The most well known approaches include region proposal based R-CNN [2,7,8,9] and YOLO [1,10,11,12] families of models. However, these object detection methods are oriented towards larger objects and learn models based on their shape and appearance, which are not noticeable in small objects. A modification of region proposal based CNN for small object detection is presented in [13] but it does not use motion information.
In detection of objects in videos, motion is an important cue that can be used for discriminating objects from the background. Moving objects detection, also known as foreground detection or background subtraction is a classical computer vision task with a rich history. For comprehensive reviews of the methods, interested readers are refered to [6,14], and [15]. In addition, in [16] background subtraction in various real-world applications is reviewed. Special attention is devoted to applications in intelligent visual observation of animals and insects, most notably honeybee surveillance.
Taking into account the absence of distinguishing visual features in very small objects, in [3] both appearance and motion information are used to improve state of the art in object detection in wide area motion imagery. Similarly, in [17] a deep learning based approach for joint detection and tracking of small flying objects is proposed. These methods also use CNNs for detection, making them similar to our approach. However, for training they use manually labeled real-world video frames, which are not easily obtained in our case. Noting that visual systems of insects are naturally evolved to perceive small moving targets, some papers investigate biologically inspired approaches to small moving target detection in cluttered environments, [18,19,20,21,22].
The problem of detection of small targets is very important in infrared search and track systems. Consequently, there is a considerable body of work dealing with detection of small targets in infrared videos, such as [23,24,25,26,27,28]. Unfortunately, comparison of these algorithms is difficult because, due to security restrictions, there are no publicly available datasets of infrared videos featuring small targets.
In the past years, monitoring honeybees at the hive entrance [29,30,31,32,33,34,35,36], as well as in a hive [37,38], has received considerable attention. Although closely related to the given problem, these approaches are not applicable in our case, because honeybees in the videos captured at hive entrance or inside a hive are larger and have noticeable color, texture, and shape features.
Generally, the literature on detection of flying honeybees is rather scarce, but some experiments, which are usually goal-oriented and where honeybees are used as detectors of some property, could be found. Honeybees have a very developed olfactory system and are able to recognize and detect scents from a large distance. With their ability of spatial orientation, using the Sun as a light source, honeybees proved to be very good detectors for sources of scents of interest. Because of that, researchers in [39,40,41] used detection of flying honeybees in the context of locating land mines, by performing detection of their movement on recordings obtained using a LiDAR. Application of short-time Fourier transform to pixel intensities in high-frame rate video for honeybee activity sensing is proposed in [42]. The main drawback of these methods is their reliance on special imaging techniques, namely LiDAR and high frame rate video. In contrast, the method proposed in this paper is based on videos captured using imaging in the visible part of the spectrum and common frame rates.
A system for detection and tracking of individual animals in videos recorded without using special imaging techniques, named idtracker.ai, is presented in [43]. However, it uses CNNs trained on videos captured in laboratory conditions, with uniform background and good contrast between targets and background, which is not the case in our usage scenario. Visual tracking of individual small animals in natural environments using a freely moving camera is presented in [44]. More similar to our work, the approach for honeybee tracking proposed in [45] uses RGB videos recorded using a fixed-position camera in less controlled conditions, with tree foliage in the background. For moving object detection, frame differencing and background modelling using a recursively updated model are used. However, only qualitative experimental results are presented. As already mentioned, traditional moving object detection methods, such as frame differencing and background subtraction, result in many false positive detections which need to be filtered out, so an important part of our work is devoted to solving this problem.
3. Materials
3.1. Training Data
To circumvent the lack of labeled data suitable for training the detector, we generate synthetic training data with backgrounds from real-world videos captured using UAV-mounted camera to which we add artificially generated blob-like objects. For the purpose of the experiments in this paper, the movement of the artificially generated objects was derived, under the supervision of an expert, from manually selected and traced honeybees in UAV videos, with small random variations. The resulting objects, named “artificial honeybees” were created in a way to mimic the appearance and flight patterns of honeybees in search for food near the known location of food sources. It should be noted that the described method for generating synthetic training data can be easily adapted to different type of target objects and different real-world backgrounds.
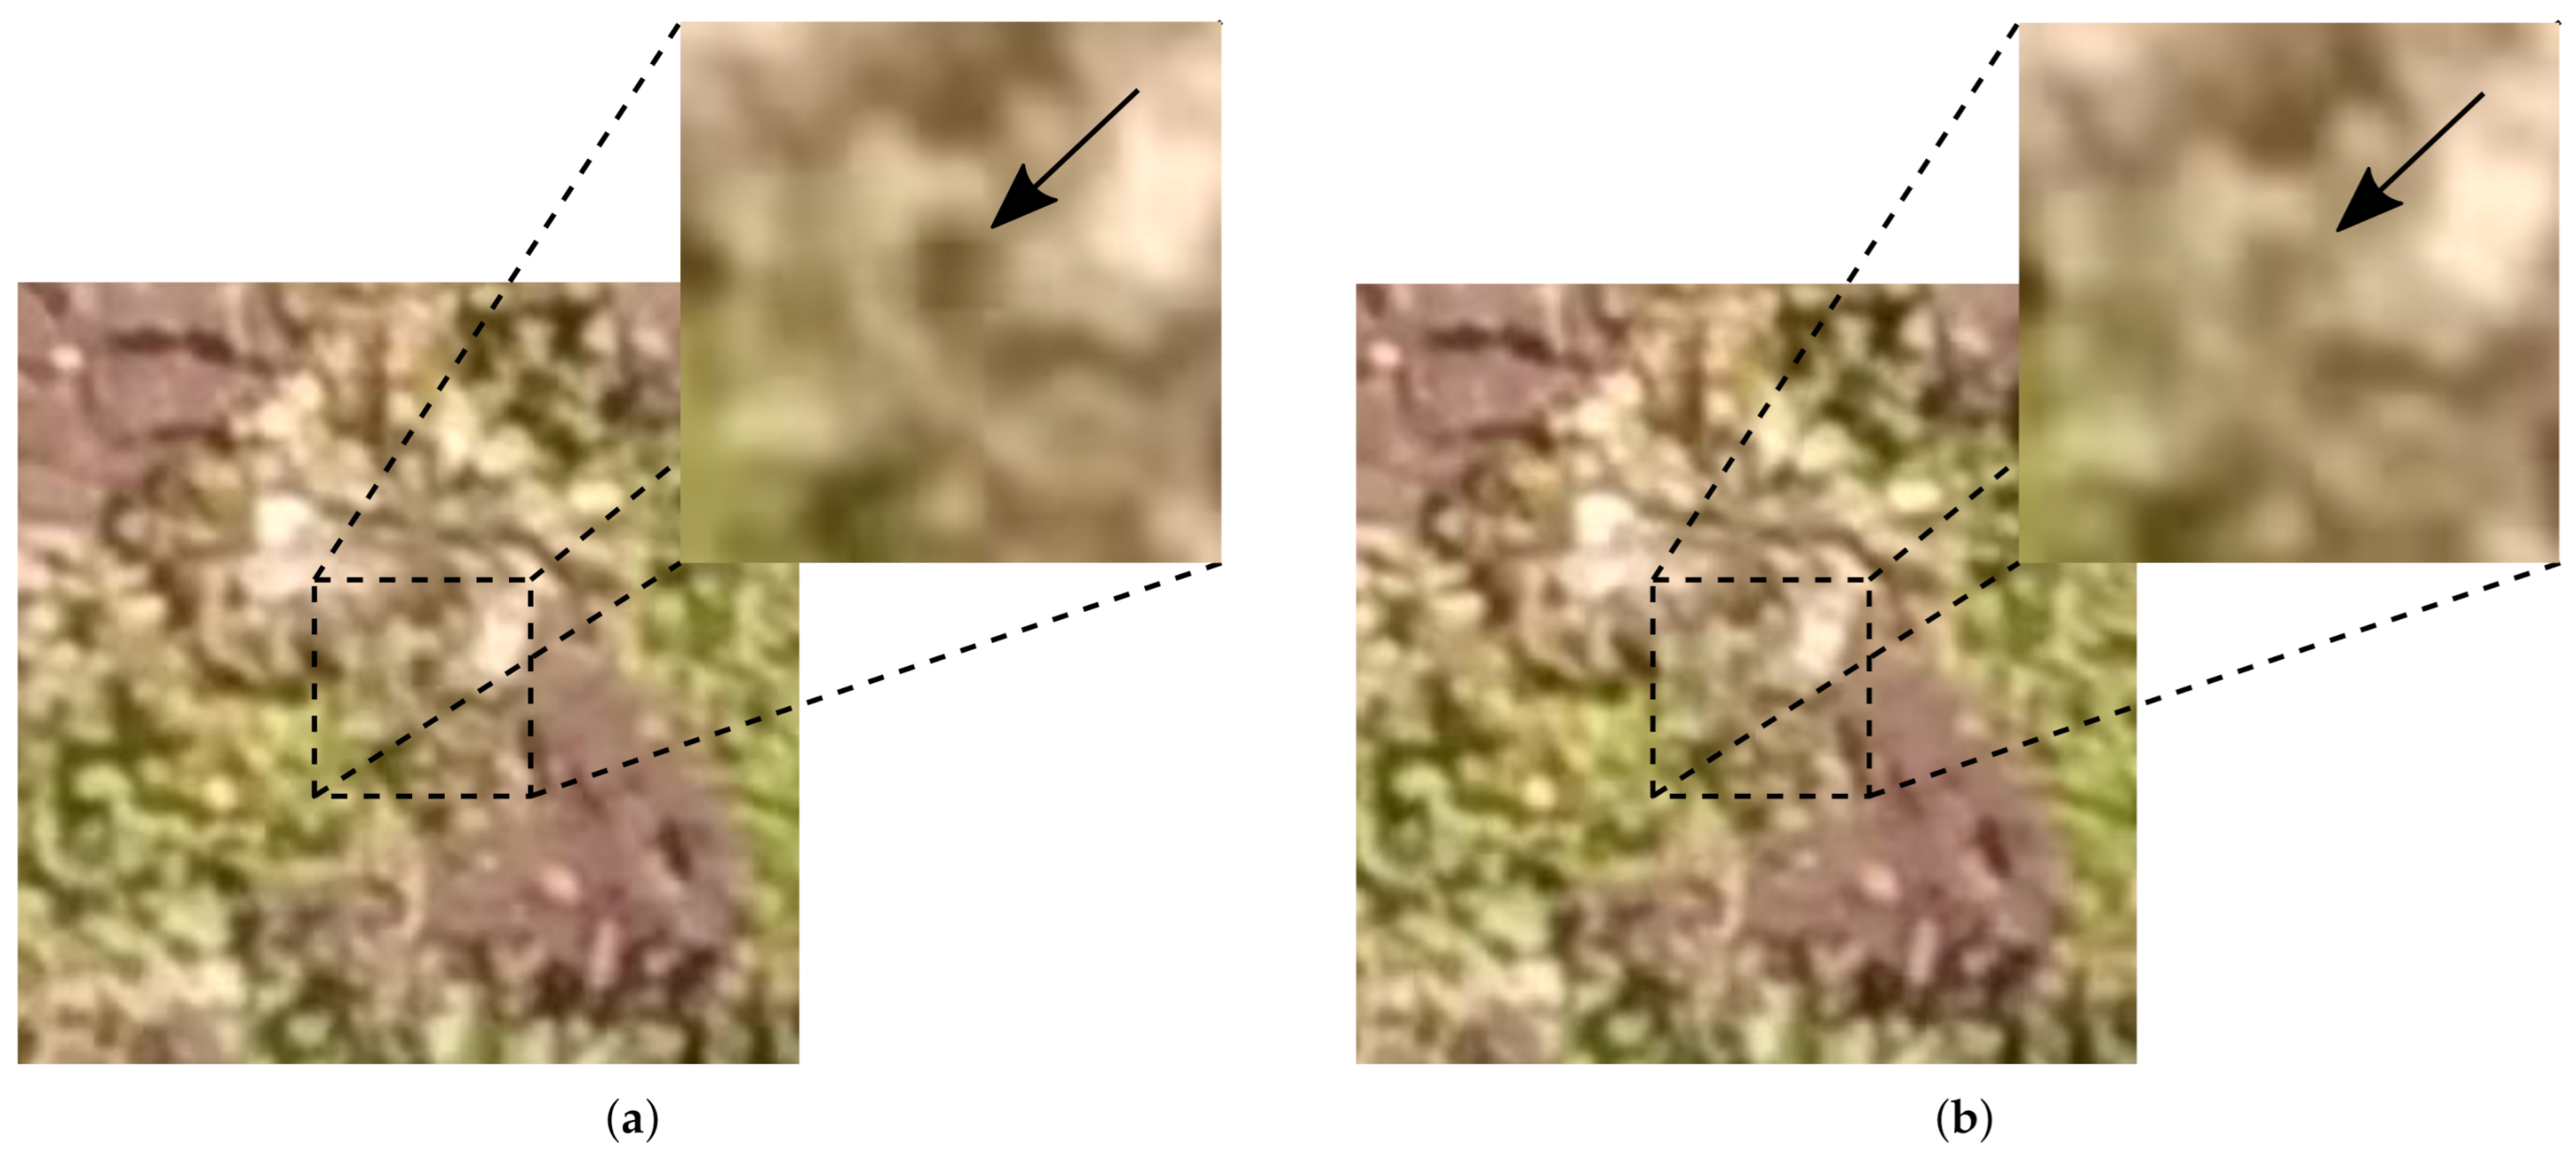
To make the method invariant to background appearance, we captured 3 videos at locations in Croatia. For capturing the videos used as backgrounds, as well as for testing the proposed method, we flew UAVs at altitudes between 7 and 15 meters. We used two very different UAVs, one quadcopter, DJI Inspire 1, and one large, proprietary-built, hexacopter equipped with high-accuracy positioning system: Real-Time Kinematic (RTK) GPS. RTK system, Figure 2, allows a very precise hovering and provides a better output after automatic video-stabilization process. A limitation of this system is its requirement for a base station in the relative vicinity of the rover station, in our case UAV, but for covering a small area this limitation did not cause us problems. DJI Inspire 1 was equipped with Zenmuse 5R digital camera, allowing recording of 4K uncompressed videos with the possibility of using interchangeable lenses. For this purpose we used a 25 mm (equivalent to 50 mm in 35 mm systems) lens. The hexacopter was equipped with a modified GoPro Hero 6 camera with a 47 mm equivalent lens. These two setups provide similar recording performance with the usage of different aerial vehicles to eliminate any equipment-bias and provide different conditions for reproducibility of the experiment. Different lighting conditions were eliminated using automatic camera settings and did not impose problems in automatic processing of the recorded videos. Because of the nature of experiments, we needed to have rather good atmospheric conditions with dry weather and almost no wind, because honeybees avoid foraging in unfavorable weather conditions. All recorded videos have 4K resolution with frame rate of 25 fps.
The choice of the parameters for recording real-world videos, were chosen in such a way as to strike a balance between the ability of human observers to detect flying objects in the recorded sequences and not interfering with flying honeybees. Since honeybees are small targets, it is desirable to fly at lower altitudes to obtain as much information about their appearance as possible. However, flying at low altitudes results in a considerable amount of wind produced by the rotors of UAVs, which could interfere with flying honeybees, as well as create moving artifacts from, for example, grass or other vegetation. Furthermore, flying at low altitudes results in covering only a small part of the surface area in a frame, thereby reducing the ability of both human observers and the system to detect a flying honeybee at several locations in the frame and use its motion as a cue for detection.
From the available recordings we selected only parts without visible honeybees or other insects in order to obtain representative examples of backgrounds. However, since it is very hard to detect small flying objects in videos, it is possible that some residual flying insects exist in several frames of the selected videos. Nevertheless, we do not expect that a small number of residual insects will negatively impact the performance of the detector, since CNNs can tolerate a certain amount of labeling noise [46].
In order to remove global camera motion, i.e., to stabilize the video sequence, we fit the affine transform between each frame in the sequence and the first frame, and then warp all frames into a common reference frame. For estimation of the affine transform between two frames, we first detect keypoints in both frames and compute their descriptors using ORB detector and descriptor [47]. Then, we find matching pairs of keypoints by comparing the descriptors using Hamming distance. Finally, the matches are used for robust transform estimation using RANSAC algorithm.
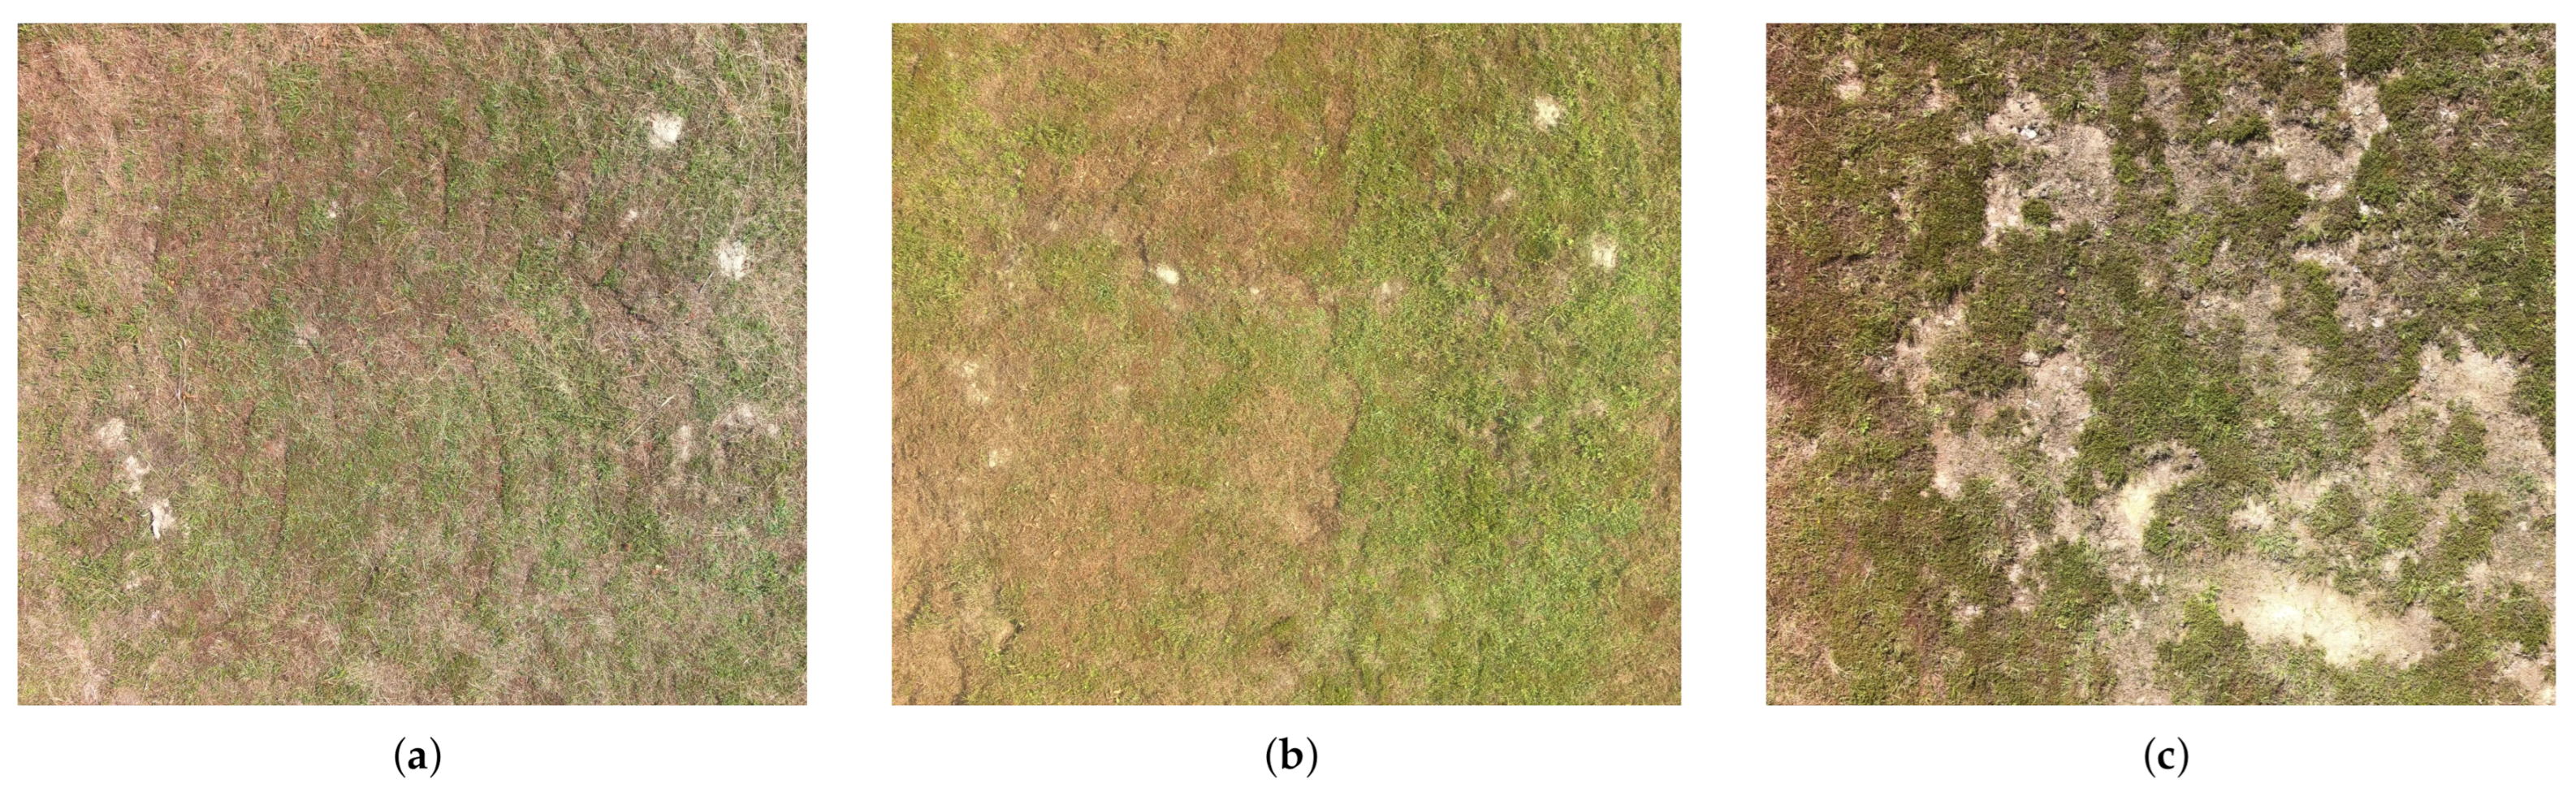
We crop the frames of the stabilized videos into blocks of pixels with 200 pixels overlap between successive blocks, and we skip 200 pixels from each side to eliminate border effects caused by stabilization. After this procedure we are left with 96 background video sequences with frames of pixels in size. Each background sequence is 3 s long. Some examples of frames from the background sequences are shown in Figure 3.
In the next step we add artificial honeybees to the obtained background sequences. Examining the appearance and behavior of real-world honeybees in videos captured using the same setup as described for the background sequences, we decided to represent artificial honeybees as elliptical blobs modelled using 2D Gaussian kernels with standard deviations randomly chosen from the intervals [2, 4.5] and [1, 3.5] for x and y axes, respectively. The number, sizes, initial locations, initial flight directions, and initial velocities of the artificial honeybees are also chosen randomly by sampling from uniform distributions with minimum and maximum values given in Table 1. The texture of artificial honeybees is modelled using Gaussian noise. We create several datasets with varying means of Gaussian noise (texture means) to assess the impact of this hyperparameter on overall detection accuracy. Specific values are given in Section 5 and discussed in the context of the obtained detection results. We use the same value of 0.07 for standard deviation of Gaussian noise in all datasets. In each frame new velocity and flight direction of each honeybee from the previous frame are calculated as
where and are sampled from normal distributions with zero mean and standard deviations 2 and 30, respectively, and and are honeybee velocity and direction in the previous frame. New positions of honeybees are then calculated using projections of their velocities onto x and y axes. If the new position of a honeybee is outside of the visible part of the scene we do not add it to the frame. To simulate honeybees flying out of and returning to the visible part of the scene we keep track of the positions of those honeybees but do not add them to the frame. When adding artificial honeybees to a frame we use their pixel values as alpha channel for blending between the background and black pixels. Therefore, artificial honeybees with lower values of the texture mean will appear lighter, i.e., will have low contrast ratio compared to the background, while artificial honeybees with higher values of texture mean will have high contrast ratio compared to the background.
Simultaneously, with generating frames for the training sequence, we generate the ground truth frames that will be used as training targets. Ground truth frames are grayscale frames with black background and artificial honeybees added in the same locations as in the training frames. In this case, we add artificial honeybees by setting the pixel values of the ground truth frame in the neighborhood of the honeybee location to the pixel values of an artificial honeybee. In total, 1000 sequences with frames of pixels containing artificial honeybees are created using the described procedure. Of those, we use 500 sequences for training, 250 sequences for validation, and we retain 250 sequences for testing.
We train the network by feeding it with sequences consisting of 5 consecutive frames of pixels in size cropped randomly from the synthetic training sequences. For each of these sequences the network is trained to predict the ground truth frame corresponding to the middle frame of the sequence. Since the number of honeybees in a single sequence is relatively small, a majority of cropped frames will contain a small number of honeybees or no honeybees at all. Therefore, including the cropped sequences into the training set with uniform probability would result in pronouncedly imbalanced numbers of honeybees present in each sequence. Bearing in mind difficulties of training the network with an imbalanced training set, we decided to include the cropped sequences into the training set with probabilities proportional to the number of honeybees present in the cropped part of the frame. In this way, sequences with a large number of honeybees, although sampled less frequently, will be more often included into the training set. In contrast, more frequently sampled sequences with little or no honeybees will be less frequently included into the training set. By sampling from the cropped sequences in this fashion, we obtain a training set with 53,760, a validation set with 12,800, and a test set with 12,800 samples.
3.2. Test Data
Besides testing on synthetic videos, we also evaluated the proposed method on real-world videos captured using the same setup as described previously for capturing the background sequences. We placed six hives near the examined area so the expected number of honeybees was significantly larger than the number of other flying insects of similar dimensions, the grass was cut and there were no flowers attractive to other pollinators. In addition, during the recording we monitored the area and did not notice significant presence of other flying insects and, in the labeling phase, we used knowledge about honeybee flying patterns. Therefore, we can assume that the flying objects in the test sequences are honeybees.
To quantitatively assess the performance of the proposed method on real-world videos, we developed a tool for manual labeling of small moving objects in video sequences. The developed tool enables users to move forward and backward through the video frame by frame, and mark locations of target objects in each frame. Since objects of interest are very small in comparison to the frame size, and it is of interest only to detect whether an object is present at a particular location, its spatial extent is disregarded. Therefore, bounding boxes or outlines of target objects are not recorded and only their locations in each frame are saved and used as ground truth in performance assessment.
For testing, we extracted three sequences with durations of around 3 seconds from the available recordings, performed their stabilization, and cropped a part of the frame of pixels. The cropped regions were selected on basis of honeybee appearances, i.e., we cropped those regions where it was possible for human observers to spot honeybees. More specifically, during manual labeling of honeybees in these sequences, we noted that it is hard for human observers to equally focus on all parts of a large frame, especially with small target objects. This led us to choose the size of the cropped region in such a way as to strike a balance between the desire to use as large region as possible in order to obtain more information about the behavior of honeybees, and the human ability to analyze large frames. We manually labeled all honeybees in these sequences and used the obtained annotations to evaluate the performance of the trained detectors. To conclude, the labeled test sequences contain frames with one to 4 honeybees, as well as frames without honeybees.
4. Method for Detection of Small Moving Objects
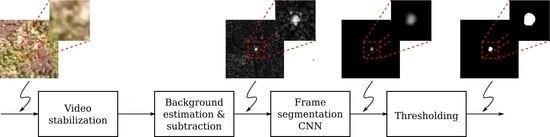
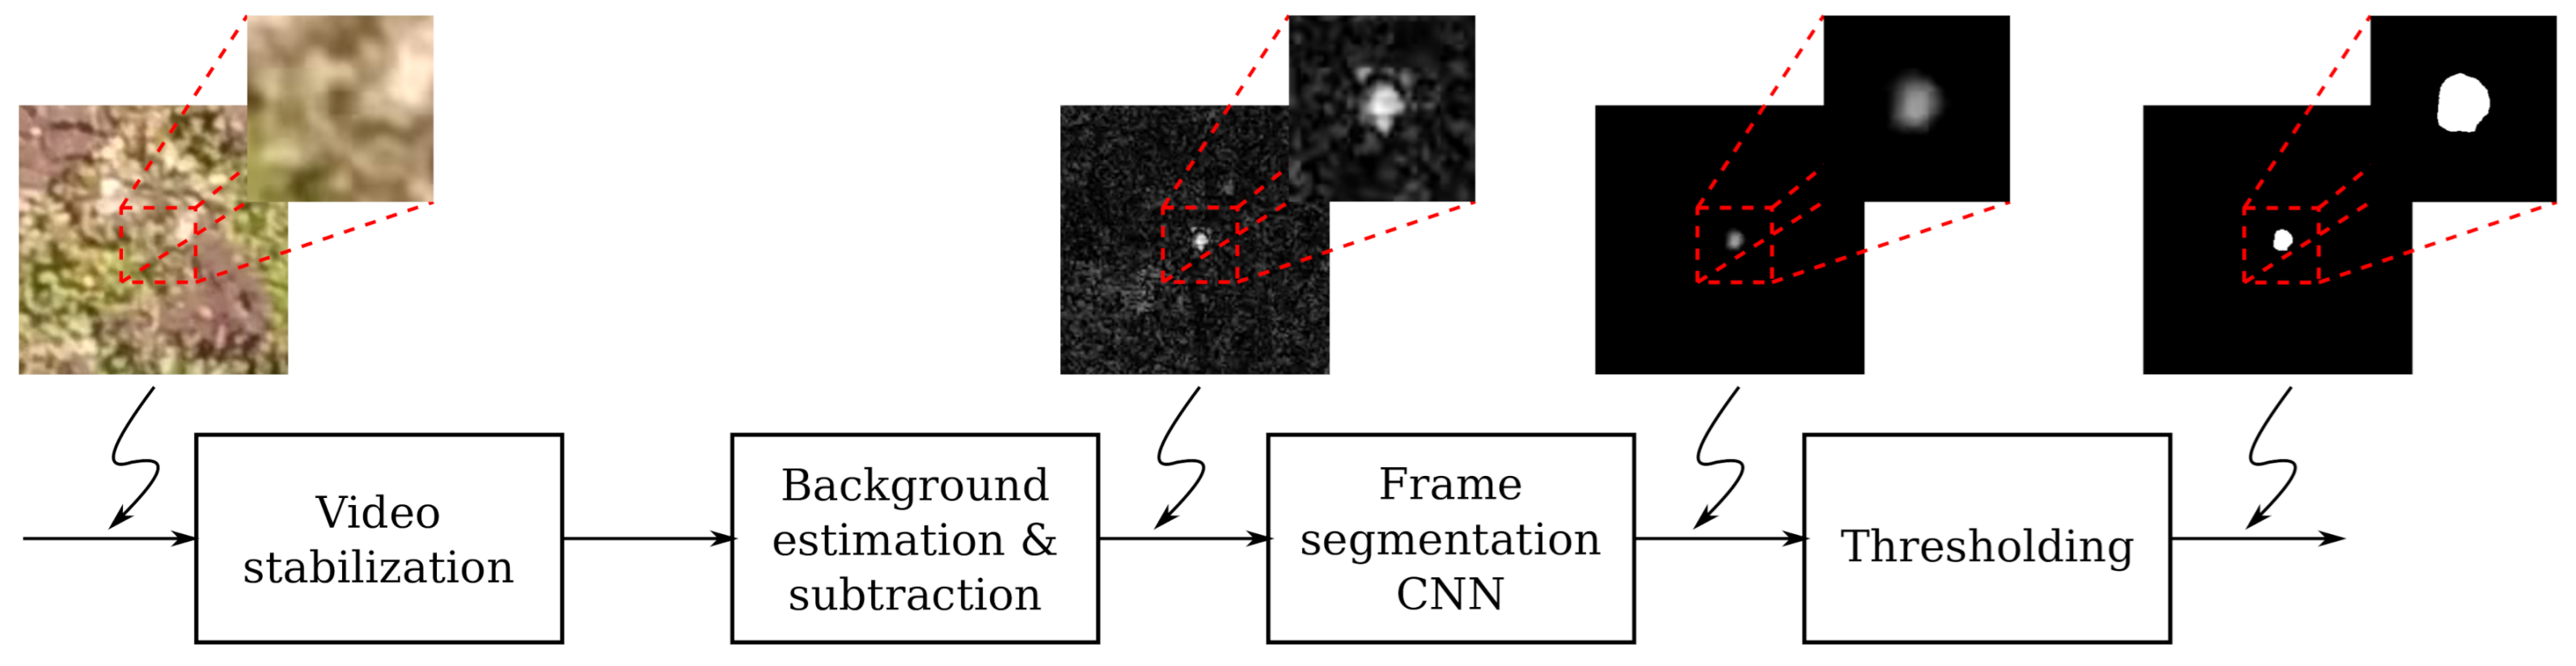
The main steps of the proposed method are shown in Figure 4 and include video stabilization, background estimation and subtraction, frame segmentation using the CNN, and thresholding the output of the CNN. As we already discussed video stabilization in Section 3, here we present the subsequent processing steps.
4.1. Background Estimation and Subtraction
In order to emphasize moving objects in each frame, we first estimate means and standard deviations of the pixel values in a temporal window of previous frames. The pixel-wise mean of the frames in a temporal window can be regarded as background estimation, since small moving objects are filtered out by time averaging the frames in the window. In this step, we essentially fit a Gaussian probability distribution function, characterized by its mean and standard deviation, to the values of each pixel in a window of previous frames. Let be the frame at time instant t and N the number of frames in the temporal window. We obtain the pixel-wise mean, i.e., background estimation, as
and standard deviation as
We subtract the estimated pixel-wise mean from each frame and divide the result with the estimated pixel-wise standard deviation
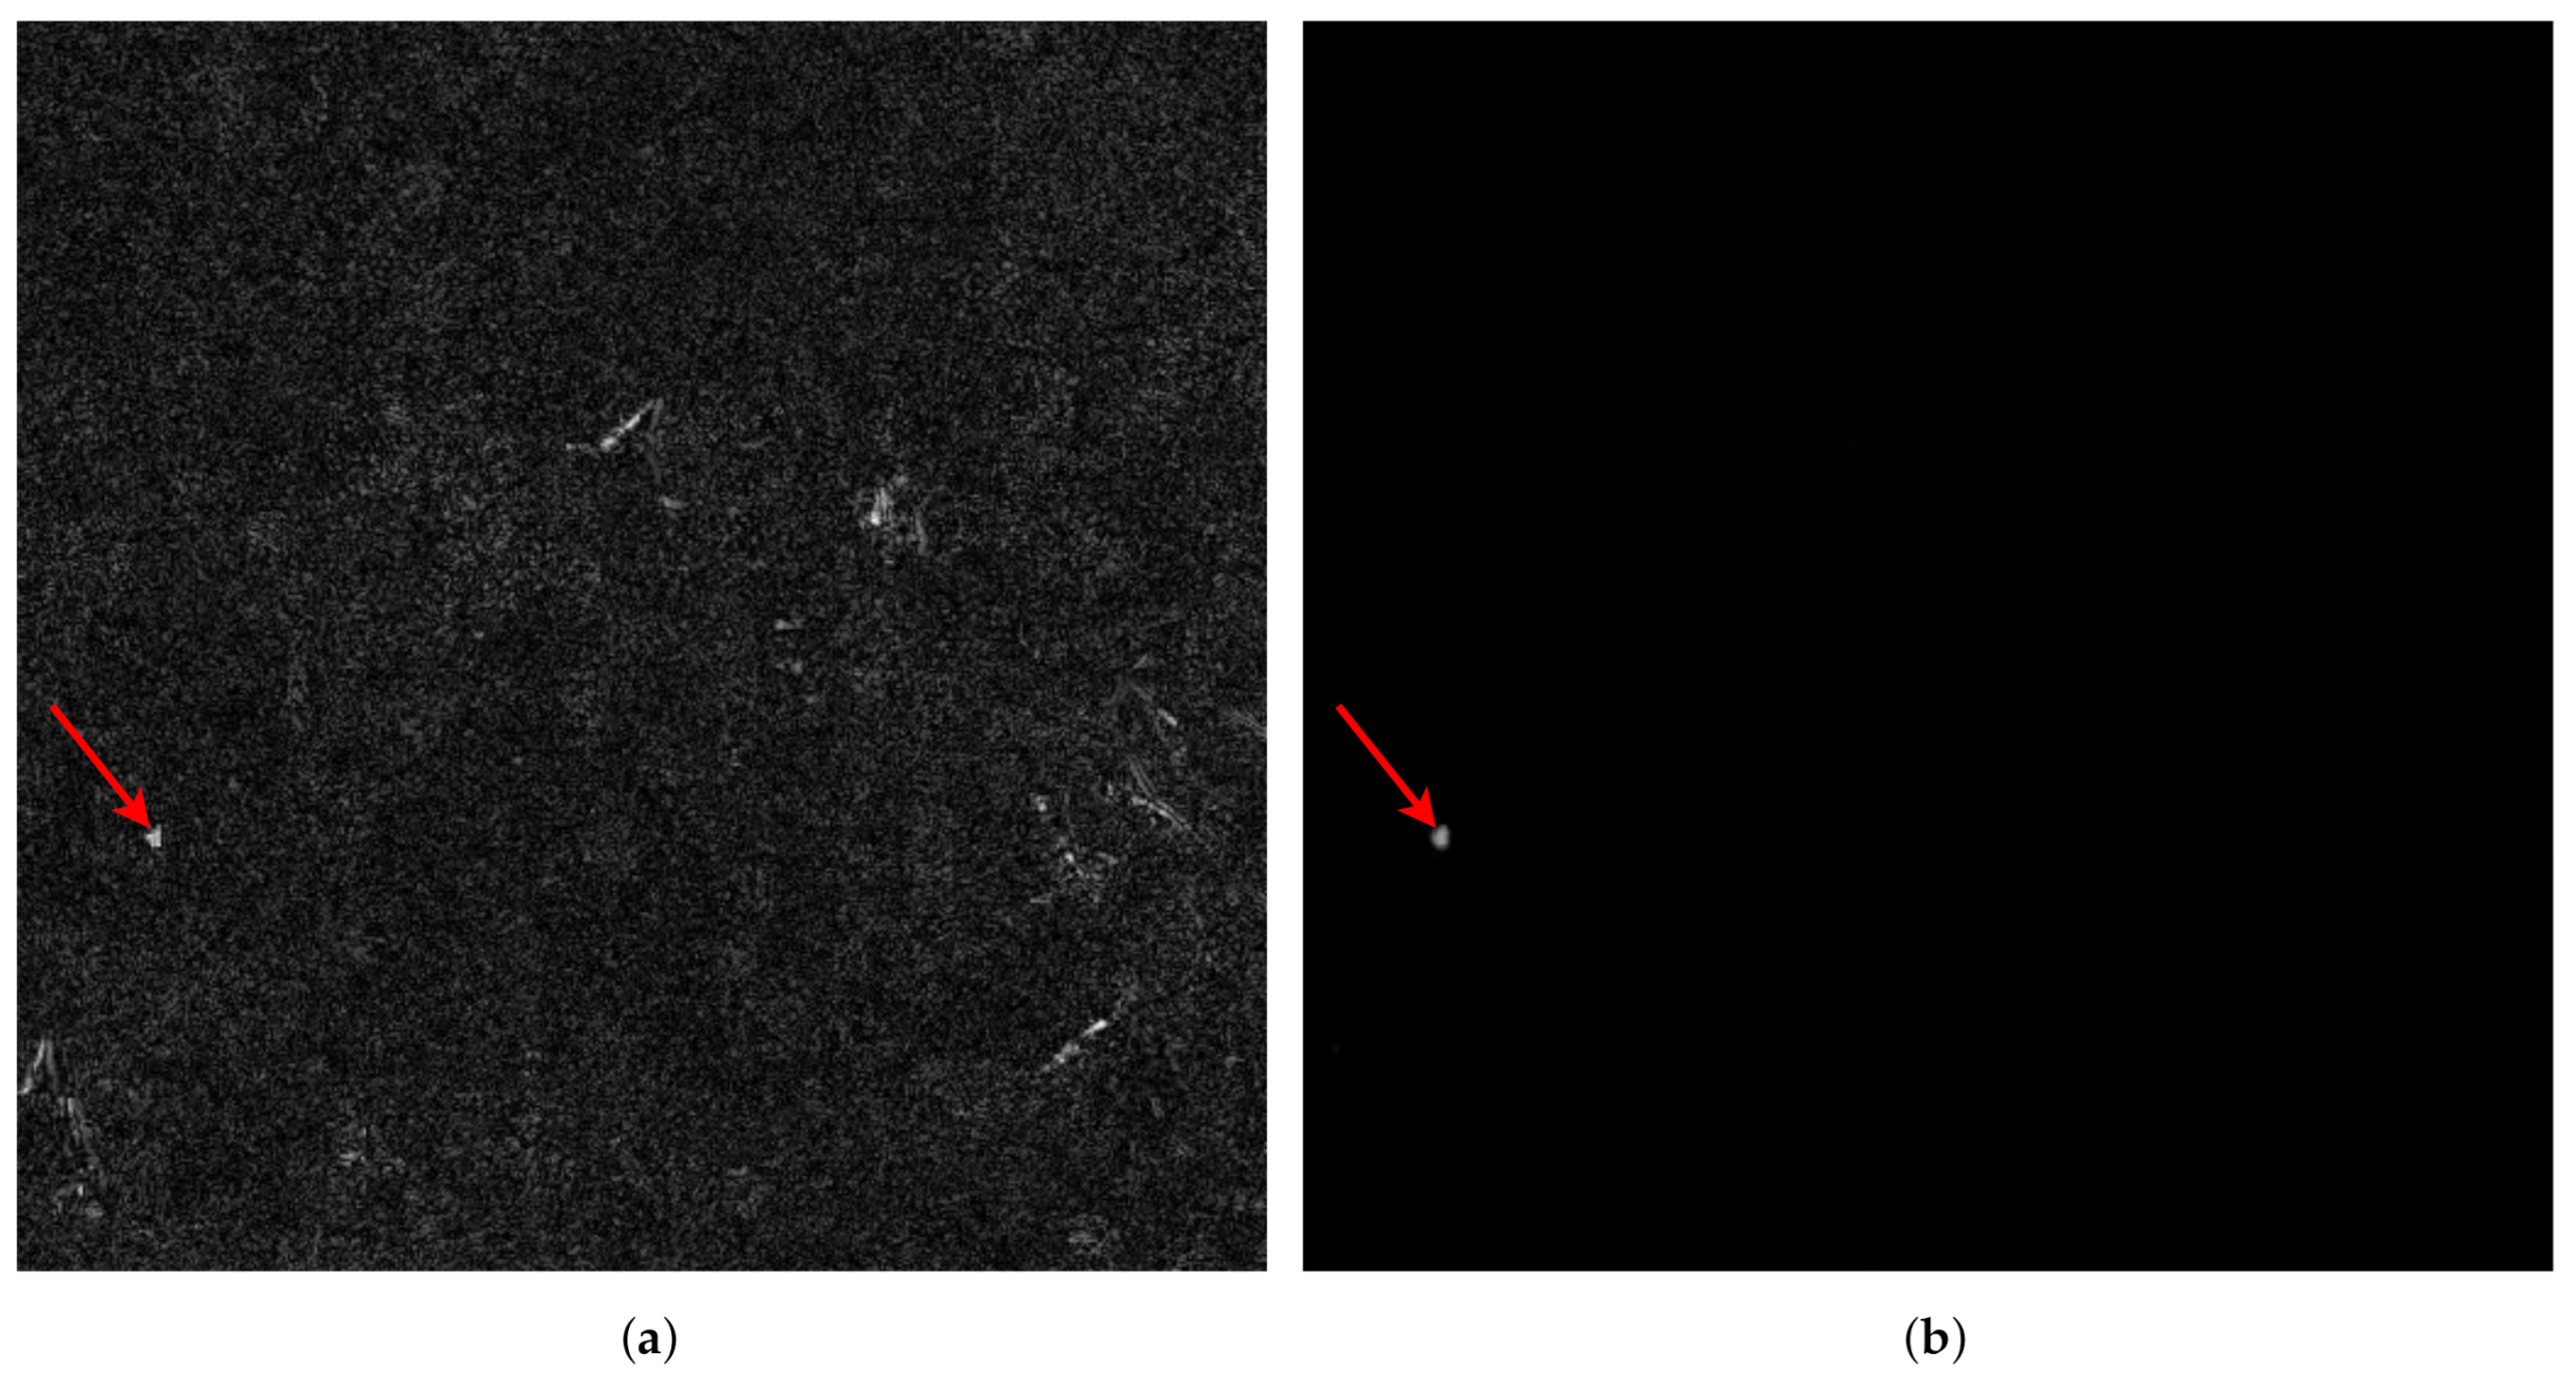
After this step, moving objects in the resulting frames will have larger pixel values than the background, as shown in Figure 4. By subtracting the mean and dividing with standard deviation we obtain a measure of dissimilarity of the current pixel value from the mean of the Gaussian normalized by its width, i.e., standard deviation. It is expected that the values of stationary background pixels will be closer to the mean compared to the values of pixels belonging to moving objects so the differences between moving objects and background estimation will be large. This procedure is usually referred to as background subtraction. Thresholding the obtained differences was previously proposed for foreground detection in video [48]. However, as discussed before, frames can contain moving artifacts, such as grass moving due to wind. An example of the result of background subtraction from a frame is shown in Figure 5a. We can see that a simple thresholding of this frame would result in too many false positive detections, which is the reason why we feed the preprocessed frames into a CNN and train it to segment moving objects. As it can be seen in Figure 5b our CNN segmentation model is able to detect a small moving object and remove the unwanted noise, such as grass moving due to wind.
4.2. CNN Topology
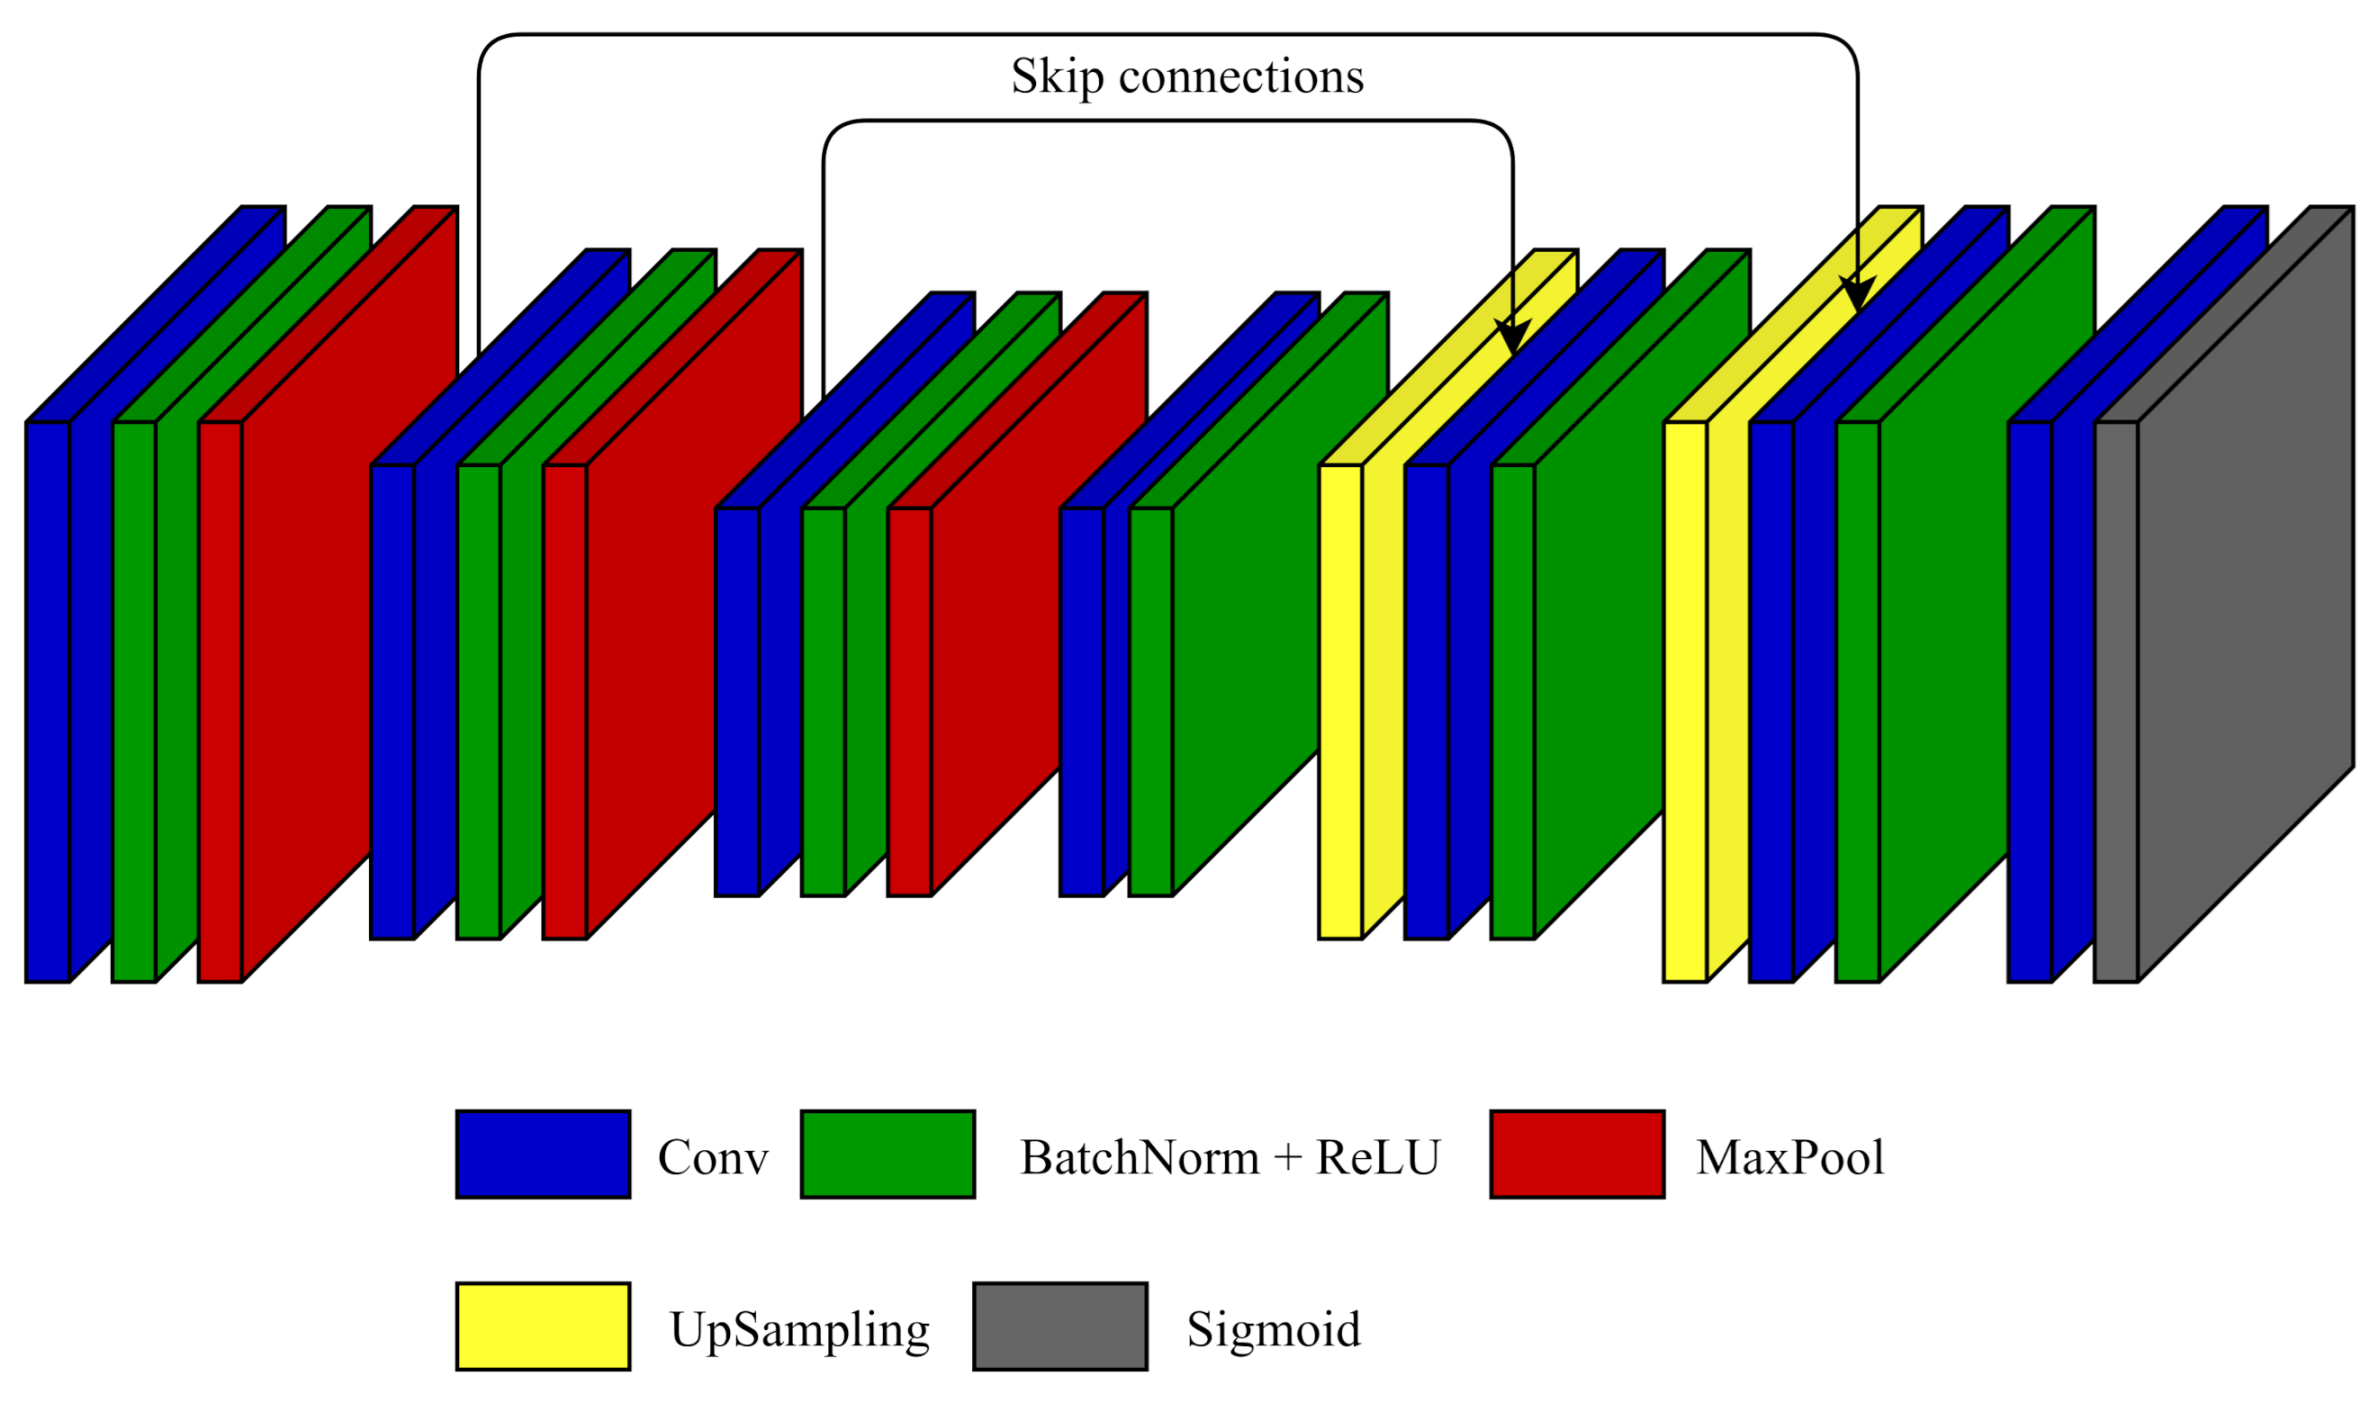
The frame segmentation CNN performs segmentation of the middle frame of a sequence of 5 consecutive frames into moving objects and background. The CNN topology used in this paper is given in Figure 6, and the hyperparameters of layers are given in Table 2. Inspired by the U-Net CNN topology with skip connections, proposed for medical image segmentation in [49], we chose fully convolutional CNN, which made possible using input images of different sizes. The used CNN model can be divided into two parts: the encoder responsible for learning a representation of input data, and the decoder used for obtaining the output segmentation map of the desired size based on the representation learned by the encoder. The encoder consists of 3 blocks of convolutional layers with kernels, batch normalization layers, and ReLU activations. Each block is followed by a max-pooling layer. The last layer of the encoder is a convolution layer, also followed by batch normalization layer and ReLU activation. The output of the encoder is used as input of the decoder. In the decoder the obtained feature maps are upsampled using nearest neighbor interpolation and then fed to the convolutional layer with kernel, batch normalization layer and ReLU activation. Identical blocks with convolutional layer, batch normalization layer and ReLU activation are repeated two more times. Given that the target objects are small, it is important to make sure that fine details, present in input frames, are used in segmentation. To achieve this, we use symmetric skip connections between outputs of convolutional layers in the encoder and the decoder with feature maps of the same size, as shown in Figure 6. The final layer of the decoder is a convolutional layer with only one kernel and sigmoid activation. The obtained segmentation map is two times smaller than the original frame. However, we decided not to add another block with upsampling and convolutional layer, because that would increase the number of trainable parameters and computational complexity. Instead, we just upsample the obtained segmentation map using bilinear interpolation. The experimental results show that this simplification does not negatively impact the results. Finally, to obtain an object detection map, we threshold output of the CNN.
4.3. CNN Training
During the training we optimize L2 loss between the model outputs and training targets. Training targets are grayscale frames with synthetic honeybees at same locations as in the training frames but with uniform black background. The CNN is fed with 5 consecutive frames and trained to segment the honeybees in the middle frame.
5. Experimental Results
In order to evaluate the proposed method on the task of detection of flying honeybees, we perform two experiments. In the first experiment, we evaluate our trained model on synthetic videos with honeybees whose texture is modelled using Gaussian noise with different means, as described in Section 3. For the second experiment, we used real-world sequences with manually labeled locations of honeybees.
In both experiments we trained one CNN for each dataset with a specific honeybee mean texture value. We used mean texture values from the set {0.25, 0.5, 0.75, 1.0}, as well as combined mean texture values of 0.25 and 0.5, and randomly chosen mean texture values from the interval [0.25, 0.5]. In this way we obtained 6 different frame segmentation CNN models.
Since we are interested only in detections of honeybees, we threshold the CNN output and compute the centroids of the resulting connected components. These centroids are considered as locations of detected honeybees. To evaluate the performance of the detector, we compare these detections with ground truth honeybee positions. If the distance between the detection and labeled position is less than 10 pixels, it is considered that the honeybee is correctly detected. We chose 10 pixels based on the average size of a honeybee and to introduce a degree of tolerance to imprecise human annotations. The performance of the detector is expressed in terms of recall
and precision
where is the number of true positive detections, is the number of false negative detections, and is the number of false positive detections, aggregated from all frames in a sequence. We also compute the F1-score as
5.1. Testing on Synthetic Videos
In the first experiment, we test the trained CNNs on synthetic test videos with varying mean values of honeybee texture. By varying the texture mean in the test set, we vary the contrast ratio between the moving objects and background thus making the detection easier or harder. The goal was to create a controlled environment which would enable us to examine the influence of the artificial honeybee model in training data to detection accuracy when different honeybee models are used for testing, find the best honeybee model for generating training data, and find the test honeybee model which can serve as a good proxy for tests with real-world honeybee videos. To find out whether the proposed detection algorithm benefits from background subtraction, we train and test CNNs, both without and with this step, and compare the obtained results.
In order to find the best value of detection threshold applied to the output of the frame segmentation CNN, we evaluate the performance of the detector on synthetic video sequences for different values of the threshold. The training and testing sequences both contain artificial honeybees generated with texture mean of 0.25. By varying the threshold value, the values of recall and precision vary, resulting in the Precision-Recall curve given in Figure 7. For threshold values above 0.6, no honeybees are detected so recall is zero and precision is not defined. Based on this curve, for subsequent experiments we select the threshold value of 0.1.
The obtained experimental results, when synthetic bees are used for both training and testing, are shown in Table 4 and Table 5, for the cases without and with background subtraction, respectively. We can see that, for detectors trained on synthetic videos with a single texture mean, overall F1-scores are higher when background subtraction is used, irrespective of the texture mean used for testing. Moreover, when background subtraction is not used, the detector performance deteriorates in cases when texture means of the training and test honeybees differ significantly. This deterioration is somewhat less pronounced when background subtraction is used. Overall, when a single texture mean value is used for creating training sequences, the best results are obtained when it is set to the smallest value of 0.25. In these sequences the contrast ratio between the moving objects and background is low, which enables the frame segmentation CNN to successfully segment out both low and high contrast moving objects. When the contrast ratio between the moving objects and background in the training sequences is high, the frame segmentation CNN cannot segment low contrast objects, resulting in lower detection rates.
When combinations of texture means are used for training, the obtained results improve when no background subtraction is applied but are mostly unchanged in the other case. Furthermore, compared to the case without background subtraction, we can see that the performances are similar or even slightly better when background subtraction is not used. However, the resulting difference in performance is very small and may very well be a consequence of stochasticity in training the CNN. We may conclude that, when testing on synthetic videos, both background subtraction and combinations of texture means are effective in reducing the dependence of the detector performance on honeybee texture mean value used in training sequences.
5.2. Testing on Real-World Videos
In the second experiment we tested all the trained models using real-world videos with manually annotated flying honeybees. The obtained results are given in Table 6, for the case without background subtraction, and in Table 7, when background subtraction was used. Similarly to the tests with synthetic video sequences, we can see that, when a single value of texture mean is used for modelling honeybees in the training sequences, the overall results are better when background subtraction is used. Furthermore, we can see that, again, the best results are obtained when the texture mean of 0.25 is used for training. Increasing the texture mean results in decreasing recall and increasing precision of the detector. A possible explanation is that the network trained on high contrast artificial honeybees is not able to detect low contrast honeybees, resulting in more false negative and less false positive detections, i.e., higher precision and lower recall. However, training the frame segmentation CNN using low contrast synthetic honeybees results in higher recall, indicating that more honeybees are detected, without a significant decrease of precision. We conclude that, by using the frame segmentation CNN, we succeeded in reducing the number of false positive detections, which is one of the main drawbacks of the classical moving object detection methods based on background subtraction.
6. Discussion
The results on real-world sequences, shown in Table 6 and Table 7, indicate that it is always beneficial to use background subtraction as a preprocessing step. From the results in TTable 4 and Table 5, we can see that the tests on synthetic sequences benefit from background subtraction only in cases when a single contrast value is used in training sequences. Nevertheless, given that the differences in performances on synthetic test sequences are small, and probably caused by the stochasticity of training a CNN, we may conclude that background subtraction is a useful preprocessing step resulting in improved detection performance.
The results on both synthetic and real-world sequences show that, with background subtraction, the best results are obtained when low-contrast artificial honeybees with mean texture value of 0.25 are used. Therefore, we may conclude that low-contrast artificial honeybees better model the appearance of real-world honeybees than those with higher contrast values and are, thus, better suited for training the frame segmentation CNN. This conclusion is supported by visual inspection of the enlarged portion of the frame containing a real-world honeybee, shown in the top row of Figure 8a. We can see that the contrast ratio between the real-world honeybee and background is very low. Although honeybees have vivid colors in UAV videos they appear featureless and with low contrast because of the large distance from the camera compared to the size of a honeybee and motion blur originating from their quick movements.
We expected that using combinations of texture means would act as a form of training set augmentation and result in better detection performance. Surprisingly, when training sequences contain honeybees with combinations of texture means, the results on real-world sequences are worse than when a single texture mean is used, while when synthetic test sequences are used, the performance of the detector stays unchanged. Since we trained the segmentation CNN and tuned the hyperparameters of our detector on synthetic sequences, this gap between the performances on synthetic and real-world test sequences indicates that the detector has overfit to the training data, resulting in lower real-world detection performance. A possible explanation is that the used model of a honeybee has shortcomings and does not capture all variations that can arise in the appearance of real-world honeybees. We plan to investigate this finding in more detail in future work.
Concerning the question whether tests on synthetic video sequences can be used as a proxy for performance on real-world sequences, we observed that, when synthetic video sequences are used for testing, tests on sequences with a single contrast value are not a good proxy for performance on real-world sequences. However, the average performance obtained using test sequences with different contrast values are better correlated with results on real-world video sequences.
In Figure 8, enlarged portions of frames with true positive, false positive, and false negative detections are shown. To get a better insight into the visual features of these three outcomes of detection, we show both the raw original frames and the same frames after background subtraction. It can be seen that it is very hard to detect honeybees in raw frames but that background subtraction highlights changes in frames in comparison with the estimated background. These changes are visible as bright spots in the bottom row of Figure 8. Visual features of the background subtracted frames in Figure 8a (true positive) and Figure 8b (false positive) correspond well to the elliptical blob honeybee model, used for artificial honeybees, which explains why they were obtained as positive detections. Based on this example, we can conclude that modelling honeybee appearance alone is not enough to achieve high precision and that motion information should be given more significance. A possible approach to achieve this is to consider a larger temporal context by, for example, using recurrent neural network for frame segmentation. However, visual features of the background subtracted frame in Figure 8c do not fit into the elliptical blob model, which suggests that, for avoiding false negatives, the honeybee appearance model should take into account changes of honeybee appearance during flight.
Due to the lack of texture, it is difficult for both human observers and the proposed detector to distinguish honeybees from other flying insects based solely on the information contained in a video. Nevertheless, we believe that the proposed approach could still be useful in applications involving honeybees because often we can safely assume that the number of other flying insects is small enough to not significantly influence the results. Such a detector can also remove the burden of detection of small flying objects from users, enabling them to focus on their flight patterns and discriminate between e.g., honeybees and other flying insects [51].
7. Conclusions
In this paper we presented a CNN-based method for detection of small moving objects trained on synthetic video sequences with real-world backgrounds and artificially generated moving targets. The proposed approach uses both the appearance and the motion information to detect small moving objects. We tested the trained detector on detection of flying honeybees in both synthetic and real-world video sequences and obtained promising results. In addition, we examined the influence of the parameters used for generating synthetic training sequences and hyperparameters of the detector on detection performance.
An important feature of our work is that it demonstrates the possibility of training an efficient small moving object detector using synthetic training video sequences. This makes usage of CNNs, in applications such as insect video surveillance, in which manually annotating training data is difficult or expensive, possible. Nevertheless, our experiments showed that testing on synthetic data can provide some insights, but cannot be completely relied on to serve as a proxy for the expected effectiveness on real-world data.
Since we train the frame segmentation CNN and tune the hyperparameters of the detector on synthetic sequences, it is essential that the artificial objects in the training sequences mimic the appearance of real-world objects as closely as possible. Therefore, we chose the parameters for generating training data, namely the sizes and other parameters used for generation of artificial objects based on the analysis of real-world recordings. Consequently, it could be expected that the changes in the real-world data caused by different properties of the target objects or different choices of the lenses, flying altitude, etc. would result in a deterioration of detection performance. Although in this work we chose the parameters for generating training data based on visual inspection of real-world sequences, it would be an interesting avenue for future research to explore the possibility to make the system more robust with respect to these parameters. Nevertheless, it should be noted that the methodology presented in this paper may be used to generate synthetic training and test sequences, which can be used to train and validate a small moving object detector adapted to the requirements of a specific real-world problem.
The proposed method for detection of small moving objects in videos captured using UAVs opens up the possibility of its application to various honeybee surveillance tasks such as pollination monitoring or land mine detection. In the future work we plan to investigate possibilities of these applications in more detail.
Author Contributions
Conceptualization, V.S., V.R., M.M., N.K. and Z.B.; methodology, V.S. and V.R.; software, V.S., V.R. and V.J.; validation, N.K. and Z.B.; formal analysis, V.S. and V.R.; investigation, V.S., V.R., M.M., J.F. and N.K.; resources, M.M., J.F. and N.K.; data curation, V.S., V.R., M.M., J.F. and N.K.; writing—original draft preparation, V.S., V.R. and M.M.; writing—review and editing, V.S., V.R., M.M., V.J., J.F., N.K. and Z.B.; supervision, N.K. and Z.B.; funding acquisition, N.K. and Z.B. All authors have read and agreed to the published version of the manuscript.
Funding
This research was funded in part by NATO Science for Peace and Security (SPS) Programme, project number SPS 985355, “Biological Method (Bees) for Explosive Detection” and in part by the Ministry of Scientific and Technological Development, Higher Education and Information Society of the Republic of Srpska under contract 19.032/961-102/19, “Service for Classification of Remote Sensing Images”.
Institutional Review Board Statement
No approval of research ethics committees was required to accomplish the goals of this study because experimental work was conducted with an unregulated invertebrate species and non-invasive surveillance using UAVs was performed.
Data Availability Statement
The data presented in this study are openly available in Zenodo at https://0-doi-org.brum.beds.ac.uk/10.5281/zenodo.4400650. The code used for the experiments is openly available at https://github.com/vladan-stojnic/Detection-of-Small-Flying-Objects-in-UAV-Videos.
Acknowledgments
The authors would like to thank Ross Gillanders and Mitar Simić, who carefully read the manuscript and whose comments have further improved the final version of the paper, as well as Slavica Gajić, Vanja Starčević, and Aleksej Avramović for their help in labeling flying honeybees in video sequences and HCR-CTRO for managing the project and providing access to the test minefields where video capturing took place.
Conflicts of Interest
The authors declare no conflict of interest. The funders had no role in the design of the study; in the collection, analyses, or interpretation of data; in the writing of the manuscript, or in the decision to publish the results.
Abbreviations
The following abbreviations are used in this manuscript:
| UAV | Unmanned Aerial Vehicle |
| CNN | Convolutional Neural Network |
| GPS | Global Positioning System |
| ReLU | Rectified Linear Unit |
| RTK | Real-Time Kinematic |
References
- Redmon, J.; Divvala, S.; Girshick, R.; Farhadi, A. You only look once: Unified, real-time object detection. In Proceedings of the IEEE Conference on Computer Vision and Pattern Recognition, Las Vegas, NV, USA, 27–30 June 2016; pp. 779–788. [Google Scholar]
- Girshick, R.; Donahue, J.; Darrell, T.; Malik, J. Rich feature hierarchies for accurate object detection and semantic segmentation. In Proceedings of the IEEE Conference on Computer Vision And pattern Recognition, Columbus, OH, USA, 23–28 June 2014; pp. 580–587. [Google Scholar]
- LaLonde, R.; Zhang, D.; Shah, M. Clusternet: Detecting small objects in large scenes by exploiting spatio-temporal information. In Proceedings of the IEEE Conference on Computer Vision and Pattern Recognition, Salt Lake City, UT, USA, 18–23 June 2018; pp. 4003–4012. [Google Scholar]
- Bromenshenk, J.; Henderson, C.; Seccomb, R.; Rice, S.; Etter, R.; Bender, S.; Rodacy, P.; Shaw, J.; Seldomridge, N.; Spangler, L.; et al. Can honey bees assist in area reduction and landmine detection? J. Conv. Weapons Destr. 2003, 7, 5. [Google Scholar]
- Simić, M.; Gillanders, R.; Avramović, A.; Gajić, S.; Jovanović, V.; Stojnić, V.; Risojević, V.; Glackin, J.; Turnbull, G.; Filipi, J.; et al. Honeybee Activity Monitoring in a Biohybrid System for Explosives Detection. In International Conference on Medical and Biological Engineering; Springer: Berlin/Heidelberg, Germany, 2019; pp. 185–192. [Google Scholar]
- Bouwmans, T. Traditional and recent approaches in background modeling for foreground detection: An overview. Comput. Sci. Rev. 2014, 11, 31–66. [Google Scholar] [CrossRef]
- Girshick, R. Fast r-cnn. In Proceedings of the IEEE International Conference on Computer Vision, Santiago, Chile, 7–13 December 2015; pp. 1440–1448. [Google Scholar]
- Ren, S.; He, K.; Girshick, R.; Sun, J. Faster r-cnn: Towards real-time object detection with region proposal networks. In Proceedings of the Advances in Neural Information Processing Systems, Montreal, Canada, 7–12 December 2015; pp. 91–99. [Google Scholar]
- He, K.; Gkioxari, G.; Dollár, P.; Girshick, R. Mask r-cnn. In Proceedings of the IEEE International Conference on Computer Vision, Venice, Italy, 22–29 Ocotber 2017; pp. 2961–2969. [Google Scholar]
- Redmon, J.; Farhadi, A. YOLO9000: Better, faster, stronger. In Proceedings of the IEEE Conference on Computer Vision and Pattern Recognition, Venice, Italy, 22–29 Ocotber 2017; pp. 7263–7271. [Google Scholar]
- Redmon, J.; Farhadi, A. Yolov3: An incremental improvement. arXiv 2018, arXiv:1804.02767. [Google Scholar]
- Bochkovskiy, A.; Wang, C.Y.; Liao, H.Y.M. YOLOv4: Optimal Speed and Accuracy of Object Detection. arXiv 2020, arXiv:2004.10934. [Google Scholar]
- Bosquet, B.; Mucientes, M.; Brea, V.M. STDnet: A ConvNet for Small Target Detection. In Proceedings of the British Machine Vision Conference (BMVC), Newcastle, UK, 3–6 September 2018; p. 253. [Google Scholar]
- Yazdi, M.; Bouwmans, T. New trends on moving object detection in video images captured by a moving camera: A survey. Comput. Sci. Rev. 2018, 28, 157–177. [Google Scholar] [CrossRef]
- Bouwmans, T.; Javed, S.; Sultana, M.; Jung, S.K. Deep neural network concepts for background subtraction: A systematic review and comparative evaluation. Neural Netw. 2019, 117, 8–66. [Google Scholar] [CrossRef] [Green Version]
- Garcia-Garcia, B.; Bouwmans, T.; Silva, A.J.R. Background subtraction in real applications: Challenges, current models and future directions. Comput. Sci. Rev. 2020, 35, 100204. [Google Scholar] [CrossRef]
- Yoshihashi, R.; Trinh, T.T.; Kawakami, R.; You, S.; Iida, M.; Naemura, T. Differentiating objects by motion: Joint detection and tracking of small flying objects. arXiv 2018, arXiv:1709.04666. [Google Scholar]
- Bagheri, Z.M.; Wiederman, S.D.; Cazzolato, B.S.; Grainger, S.; O’Carroll, D.C. Performance of an insect-inspired target tracker in natural conditions. Bioinspiration Biomim. 2017, 12, 025006. [Google Scholar] [CrossRef] [PubMed]
- Wang, H.; Peng, J.; Yue, S. A feedback neural network for small target motion detection in cluttered backgrounds. In International Conference on Artificial Neural Networks; Springer: Berlin/Heidelberg, Germany, 2018; pp. 728–737. [Google Scholar]
- Wang, H.; Peng, J.; Yue, S. A directionally selective small target motion detecting visual neural network in cluttered backgrounds. IEEE Trans. Cybern. 2018, 50, 1541–1555. [Google Scholar] [CrossRef]
- Wang, H.; Peng, J.; Zheng, X.; Yue, S. A robust visual system for small target motion detection against cluttered moving backgrounds. IEEE Trans. Neural Networks Learn. Syst. 2019, 31, 839–853. [Google Scholar] [CrossRef] [PubMed] [Green Version]
- Wang, H.; Peng, J.; Fu, Q.; Wang, H.; Yue, S. Visual cue integration for small target motion detection in natural cluttered backgrounds. In Proceedings of the 2019 International Joint Conference on Neural Networks (IJCNN), Budapest, Hungary, 14–19 July 2019; pp. 1–7. [Google Scholar]
- Liu, Q.; Lu, X.; He, Z.; Zhang, C.; Chen, W.S. Deep convolutional neural networks for thermal infrared object tracking. Knowl.-Based Syst. 2017, 134, 189–198. [Google Scholar] [CrossRef]
- Wang, X.; Peng, Z.; Kong, D.; He, Y. Infrared dim and small target detection based on stable multisubspace learning in heterogeneous scene. IEEE Trans. Geosci. Remote Sens. 2017, 55, 5481–5493. [Google Scholar] [CrossRef]
- Ryu, J.; Kim, S. Heterogeneous Gray-Temperature Fusion-Based Deep Learning Architecture for Far Infrared Small Target Detection. J. Sens. 2019, 1–15. [Google Scholar] [CrossRef] [Green Version]
- Zhang, P.; Wang, X.; Wang, X.; Fei, C.; Guo, Z. Infrared Small Target Detection Based on Spatial-Temporal Enhancement Using Quaternion Discrete Cosine Transform. IEEE Access 2019, 7, 54712–54723. [Google Scholar] [CrossRef]
- Wu, L.; Ma, Y.; Fan, F.; Wu, M.; Huang, J. A Double-Neighborhood Gradient Method for Infrared Small Target Detection. IEEE Geosci. Remote. Sens. Lett. 2020, 1–5. [Google Scholar] [CrossRef]
- Guan, X.; Zhang, L.; Huang, S.; Peng, Z. Infrared Small Target Detection via Non-Convex Tensor Rank Surrogate Joint Local Contrast Energy. Remote Sens. 2020, 12, 1520. [Google Scholar] [CrossRef]
- Campbell, J.; Mummert, L.; Sukthankar, R. Video monitoring of honey bee colonies at the hive entrance. Vis. Obs. Anal. Anim. Insect Behav. ICPR 2008, 8, 1–4. [Google Scholar]
- Chiron, G.; Gomez-Krämer, P.; Ménard, M. Detecting and tracking honeybees in 3D at the beehive entrance using stereo vision. EURASIP J. Image Video Process. 2013, 2013, 59. [Google Scholar] [CrossRef] [Green Version]
- Babic, Z.; Pilipovic, R.; Risojevic, V.; Mirjanic, G. Pollen Bearing Honey Bee Detection in Hive Entrance Video Recorded by Remote Embedded System for Pollination Monitoring. ISPRS Ann. Photogramm. Remote Sens. Spat. Inf. Sci. 2016, 3, 51. [Google Scholar] [CrossRef] [Green Version]
- Rodríguez, I.; Branson, K.; Acuña, E.; Agosto-Rivera, J.; Giray, T.; Mégret, R. Honeybee detection and pose estimation using convolutional neural networks. In Proceedings of the Congres Reconnaissance des Formes, Image, Apprentissage et Perception (RFIAP), Marne-la-Vallée, France, 25–28 June 2018. [Google Scholar]
- Rodriguez, I.F.; Mégret, R.; Acuna, E.; Agosto-Rivera, J.L.; Giray, T. Recognition of pollen-bearing bees from video using convolutional neural network. In Proceedings of the 2018 IEEE Winter Conference on Applications of Computer Vision (WACV), Lake Tahoe, NV, USA, 12–15 March 2018; pp. 314–322. [Google Scholar]
- Schurischuster, S.; Remeseiro, B.; Radeva, P.; Kampel, M. A Preliminary Study of Image Analysis for Parasite Detection on Honey Bees. In International Conference Image Analysis and Recognition; Springer: Berlin/Heidelberg, Germany, 2018; pp. 465–473. [Google Scholar]
- Yang, C.; Collins, J.; Beckerleg, M. A Model for Pollen Measurement Using Video Monitoring of Honey Bees. Sens. Imaging 2018, 19, 2. [Google Scholar] [CrossRef]
- Marstaller, J.; Tausch, F.; Stock, S. Deepbees-building and scaling convolutional neuronal nets for fast and large-scale visual monitoring of bee hives. In Proceedings of the IEEE International Conference on Computer Vision Workshops, Seoul, Korea, 27 October–2 November 2019. [Google Scholar]
- Kimura, T.; Ohashi, M.; Okada, R.; Ikeno, H. A new approach for the simultaneous tracking of multiple honeybees for analysis of hive behavior. Apidologie 2011, 42, 607. [Google Scholar] [CrossRef] [Green Version]
- Bozek, K.; Hebert, L.; Mikheyev, A.S.; Stephens, G.J. Towards dense object tracking in a 2D honeybee hive. In Proceedings of the IEEE Conference on Computer Vision and Pattern Recognition, Salt Lake City, UT, USA, 18–22 June 2018; pp. 4185–4193. [Google Scholar]
- Repasky, K.S.; Shaw, J.A.; Scheppele, R.; Melton, C.; Carsten, J.L.; Spangler, L.H. Optical detection of honeybees by use of wing-beat modulation of scattered laser light for locating explosives and land mines. Appl. Opt. 2006, 45, 1839–1843. [Google Scholar] [CrossRef] [Green Version]
- Hoffman, D.S.; Nehrir, A.R.; Repasky, K.S.; Shaw, J.A.; Carlsten, J.L. Range-resolved optical detection of honeybees by use of wing-beat modulation of scattered light for locating land mines. Appl. Opt. 2007, 46, 3007–3012. [Google Scholar] [CrossRef] [PubMed] [Green Version]
- Carlsten, E.S.; Wicks, G.R.; Repasky, K.S.; Carlsten, J.L.; Bromenshenk, J.J.; Henderson, C.B. Field demonstration of a scanning lidar and detection algorithm for spatially mapping honeybees for biological detection of land mines. Appl. Opt. 2011, 50, 2112–2123. [Google Scholar] [CrossRef]
- Shimasaki, K.; Jiang, M.; Takaki, T.; Ishii, I.; Yamamoto, K. HFR-Video-Based Honeybee Activity Sensing. IEEE Sens. J. 2020, 20, 5575–5587. [Google Scholar] [CrossRef]
- Romero-Ferrero, F.; Bergomi, M.G.; Hinz, R.C.; Heras, F.J.; de Polavieja, G.G. Idtracker. ai: Tracking all individuals in small or large collectives of unmarked animals. Nat. Methods 2019, 16, 179–182. [Google Scholar] [CrossRef]
- Risse, B.; Mangan, M.; Del Pero, L.; Webb, B. Visual tracking of small animals in cluttered natural environments using a freely moving camera. In Proceedings of the IEEE International Conference on Computer Vision Workshops, Venice, Italy, 22–29 October 2017; pp. 2840–2849. [Google Scholar]
- Estivill-Castro, V.; Lattin, D.; Suraweera, F.; Vithanage, V. Tracking bees-a 3d, outdoor small object environment. In Proceedings of the 2003 International Conference on Image Processing, Barcelona, Spain, 14–17 September 2003; Volume 3, p. III-1021. [Google Scholar]
- Rolnick, D.; Veit, A.; Belongie, S.; Shavit, N. Deep learning is robust to massive label noise. arXiv 2017, arXiv:1705.10694. [Google Scholar]
- Rublee, E.; Rabaud, V.; Konolige, K.; Bradski, G. ORB: An efficient alternative to SIFT or SURF. In Proceedings of the 2011 International Conference on Computer Vision, Barcelona, Spain, 6–13 November 2011; pp. 2564–2571. [Google Scholar]
- Wren, C.; Azarbayejani, A.; Darrell, T.; Pentland, A.P. Pfinder: Real-time tracking of the human body. IEEE Trans. Pattern Anal. Mach. Intell. 1997, 19, 780–785. [Google Scholar] [CrossRef] [Green Version]
- Ronneberger, O.; Fischer, P.; Brox, T. U-net: Convolutional networks for biomedical image segmentation. In International Conference on Medical Image Computing and Computer-Assisted Intervention; Springer: Berlin/Heidelberg, Germany, 2015; pp. 234–241. [Google Scholar]
- Kingma, D.P.; Ba, J. Adam: A method for stochastic optimization. arXiv 2014, arXiv:1412.6980. [Google Scholar]
- Menzel, R.; Greggers, U.; Smith, A.; Berger, S.; Brandt, R.; Brunke, S.; Bundrock, G.; Hülse, S.; Plümpe, T.; Schaupp, F.; et al. Honey bees navigate according to a map-like spatial memory. Proc. Natl. Acad. Sci. USA 2005, 102, 3040–3045. [Google Scholar] [CrossRef] [PubMed] [Green Version]
Figure 1.
(a) A part of a frame with a honeybee present captured from a height of 10 m using a 50 mm lens equivalent in 35 mm system, where size of a pixel is roughly mm. Honeybee location is marked with an arrow in the enlarged portion of the frame. To make the honeybee visible in the original frame we scaled it with a factor of 2, so the size of a pixel is mm. The enlarged portion of the frame is additionally scaled with a factor of 4. (b) Same part of the frame as in (a) but without a honeybee present. The previous location of the honeybee is marked with an arrow in the enlarged portion of the frame.

Figure 2.
GPS system with RTK consisted of Base and Rover station for enhanced positioning accuracy.
Figure 2.
GPS system with RTK consisted of Base and Rover station for enhanced positioning accuracy.

Figure 3.
(a–c) Examples of frames from the used background sequences.

Figure 4.
Block diagram of the proposed method for detection of flying honeybees.

Figure 5.
(a) Result of background subtraction from a frame with grass moving due to wind. Location of a small moving object is marked with an arrow. (b) Same part of the frame as in (a) but after processing with our CNN segmentation model. Location of a small moving object is marked with an arrow.
Figure 5.
(a) Result of background subtraction from a frame with grass moving due to wind. Location of a small moving object is marked with an arrow. (b) Same part of the frame as in (a) but after processing with our CNN segmentation model. Location of a small moving object is marked with an arrow.

Figure 6.
CNN topology used for detection of honeybees.

Figure 7.
P-R diagram for tests on synthetic honeybees with background subtraction and varying thresholds. The shown annotations are threshold values. For threshold values above 0.60 no honeybees are detected.
Figure 7.
P-R diagram for tests on synthetic honeybees with background subtraction and varying thresholds. The shown annotations are threshold values. For threshold values above 0.60 no honeybees are detected.

Figure 8.
Enlarged portions of example raw frames (top row) and frames after background subtraction (bottom row). (a) True positive detection. (b) False positive detection. (c) False negative detection.
Figure 8.
Enlarged portions of example raw frames (top row) and frames after background subtraction (bottom row). (a) True positive detection. (b) False positive detection. (c) False negative detection.


Table 1.
Parameters used for generation of artificial honeybees.
| Parameter | Min. Value | Max. Value |
|---|---|---|
| Number of honeybees | 5 | 15 |
| Initial location | (4, 4) | (1020, 1020) |
| Initial flight direction (degrees) | 0 | 360 |
| Initial velocity (pix/frame) | −28 | 28 |
Table 2.
Hyperparameters of CNN layers.
| Layer Name | Number of Filters | Kernel Size | Stride | Padding |
|---|---|---|---|---|
| conv1 | 64 | (3, 3) | (1, 1) | same |
| pool1 | - | (2, 2) | (2, 2) | valid |
| conv2 | 128 | (3, 3) | (1, 1) | same |
| pool2 | - | (2, 2) | (2, 2) | valid |
| conv3 | 256 | (3, 3) | (1, 1) | same |
| pool3 | - | (2, 2) | (2, 2) | valid |
| conv4 | 512 | (1, 1) | (1, 1) | same |
| conv5 | 256 | (3, 3) | (1, 1) | same |
| conv6 | 128 | (3, 3) | (1, 1) | same |
| detect | 1 | (1, 1) | (1, 1) | same |
Table 3.
Optimizer hyperparameters.
| Hyperparameter | Value |
|---|---|
| learning rate | |
| 0.9 | |
| 0.999 | |
| weight decay | 0.0 |
| batch size | 64 |
Table 4.
Detection results (recall/precision/F1-score) on synthetic honeybees without background subtraction for various combinations of training and test mean texture values. 0.25 & 0.50 denotes using mean texture values of 0.25 and 0.50. [0.25, 0.50] denotes using mean texture values randomly chosen from that interval. The average results with best F1 scores are marked in bold.
| Mean Texture Value of Test Honeybees | Mean Texture Value of Training Honeybees | |||||
|---|---|---|---|---|---|---|
| 0.25 | 0.50 | 0.75 | 1.00 | 0.25 & 0.50 | [0.25, 0.50] | |
| 0.25 | 0.96/0.98/0.97 | 0.55/0.99/0.70 | 0.02/0.97/0.04 | 0.00/0.83/0.00 | 0.94/0.98/0.96 | 0.93/0.99/0.96 |
| 0.30 | 0.98/0.98/0.98 | 0.83/0.99/0.90 | 0.07/0.99/0.13 | 0.00/0.98/0.01 | 0.97/0.98/0.98 | 0.97/0.98/0.97 |
| 0.50 | 0.99/0.98/0.98 | 0.99/0.99/0.99 | 0.90/0.99/0.94 | 0.40/0.99/0.57 | 0.99/0.98/0.99 | 0.99/0.98/0.99 |
| 0.75 | 0.96/0.98/0.97 | 1.00/0.99/0.99 | 1.00/0.99/0.99 | 0.99/0.99/0.99 | 1.00/0.98/0.99 | 1.00/0.98/0.99 |
| 1.00 | 0.74/0.98/0.84 | 0.99/0.98/0.99 | 1.00/0.99/0.99 | 1.00/0.99/0.99 | 0.98/0.98/0.98 | 0.98/0.98/0.98 |
| Average | 0.93/0.08/0.95 | 0.87/0.99/0.91 | 0.60/0.99/0.62 | 0.48/0.96/0.51 | 0.98/0.98/0.98 | 0.97/0.98/0.98 |
Table 5.
Detection results (recall/precision/F1-score) on synthetic honeybees with background subtraction for various combinations of training and test mean texture values. 0.25 & 0.50 denotes using mean texture values of 0.25 and 0.50. [0.25, 0.50] denotes using mean texture values randomly chosen from that interval. The average results with best F1 scores are marked in bold.
| Mean Texture Value of Test Honeybees | Mean Texture Value of Training Honeybees | |||||
|---|---|---|---|---|---|---|
| 0.25 | 0.50 | 0.75 | 1.00 | 0.25 & 0.50 | [0.25, 0.50] | |
| 0.25 | 0.94/0.97/0.95 | 0.83/0.98/0.90 | 0.70/0.99/0.82 | 0.54/0.99/0.70 | 0.91/0.98/0.94 | 0.89/0.98/0.93 |
| 0.30 | 0.96/0.97/0.97 | 0.89/0.98/0.94 | 0.80/0.99/0.89 | 0.68/0.99/0.80 | 0.95/0.97/0.96 | 0.93/0.98/0.96 |
| 0.50 | 0.99/0.97/0.98 | 0.99/0.98/0.98 | 0.97/0.98/0.98 | 0.95/0.98/0.97 | 0.99/0.97/0.98 | 0.99/0.98/0.98 |
| 0.75 | 1.00/0.97/0.98 | 1.00/0.98/0.99 | 1.00/0.99/0.99 | 0.99/0.99/0.99 | 1.00/0.97/0.99 | 1.00/0.98/0.99 |
| 1.00 | 1.00/0.97/0.98 | 1.00/0.98/0.99 | 1.00/0.99/0.99 | 1.00/0.99/0.99 | 1.00/0.97/0.99 | 1.00/0.98/0.99 |
| Average | 0.98/0.97/0.97 | 0.94/0.98/0.96 | 0.89/0.99/0.93 | 0.83/0.99/0.89 | 0.97/0.98/0.97 | 0.96/0.98/0.97 |
Table 6.
Detection results (recall/precision/F1-score) on real-world honeybees without background subtraction for various training mean texture values. 0.25 & 0.50 denotes using mean texture values of 0.25 and 0.50. [0.25, 0.50] denotes using mean texture values randomly chosen from that interval. In cases marked with X no honeybees were detected. The average results with best F1 scores are marked in bold.
| Test Sequence | Mean Texture Value of Training Honeybees | |||||
|---|---|---|---|---|---|---|
| 0.25 | 0.50 | 0.75 | 1.00 | 0.25 & 0.50 | [0.25, 0.50] | |
| test_seq1 | 0.61/0.97/0.75 | 0.19/1.00/0.33 | 0.01/1.00/0.02 | X | 0.56/0.97/0.71 | 0.51/0.98/0.67 |
| test_seq2 | 0.41/0.95/0.57 | 0.11/0.96/0.20 | 0.00/1.00/0.01 | X | 0.38/0.96/0.55 | 0.34/0.97/0.51 |
| test_seq3 | 0.82/0.78/0.80 | 0.34/0.82/0.48 | 0.07/1.00/0.13 | 0.04/1.00/0.08 | 0.71/0.86/0.78 | 0.76/0.89/0.82 |
| Average | 0.61/0.91/0.71 | 0.21/0.93/0.34 | 0.03/1.00/0.05 | 0.04/1.00/0.08 | 0.55/0.93/0.68 | 0.54/0.95/0.67 |
Table 7.
Detection results (recall/precision/F1-score) on real-world honeybees with background subtraction for various training mean texture values. 0.25 & 0.50 denotes using mean texture values of 0.25 and 0.50. [0.25, 0.50] denotes using mean texture values randomly chosen from that interval. The average results with best F1 scores are marked in bold.
| Test Sequence | Mean Texture Value of Training Honeybees | |||||
|---|---|---|---|---|---|---|
| 0.25 | 0.50 | 0.75 | 1.00 | 0.25 & 0.50 | [0.25, 0.50] | |
| test_seq1 | 0.89/0.95/0.92 | 0.78/0.96/0.86 | 0.76/0.98/0.86 | 0.58/0.99/0.73 | 0.82/0.95/0.88 | 0.81/0.97/0.88 |
| test_seq2 | 0.85/0.83/0.84 | 0.78/0.92/0.84 | 0.71/0.95/0.81 | 0.55/0.97/0.70 | 0.81/0.88/0.84 | 0.76/0.89/0.82 |
| test_seq3 | 0.77/0.90/0.83 | 0.54/0.95/0.68 | 0.45/0.90/0.60 | 0.34/0.92/0.50 | 0.60/0.94/0.73 | 0.56/0.95/0.70 |
| Average | 0.84/0.89/0.86 | 0.70/0.94/0.79 | 0.64/0.94/0.76 | 0.49/0.96/0.64 | 0.74/0.92/0.82 | 0.71/0.94/0.80 |
Publisher’s Note: MDPI stays neutral with regard to jurisdictional claims in published maps and institutional affiliations. |
© 2021 by the authors. Licensee MDPI, Basel, Switzerland. This article is an open access article distributed under the terms and conditions of the Creative Commons Attribution (CC BY) license (http://creativecommons.org/licenses/by/4.0/).
Share and Cite
MDPI and ACS Style
Stojnić, V.; Risojević, V.; Muštra, M.; Jovanović, V.; Filipi, J.; Kezić, N.; Babić, Z. A Method for Detection of Small Moving Objects in UAV Videos. Remote Sens. 2021, 13, 653. https://0-doi-org.brum.beds.ac.uk/10.3390/rs13040653
AMA Style
Stojnić V, Risojević V, Muštra M, Jovanović V, Filipi J, Kezić N, Babić Z. A Method for Detection of Small Moving Objects in UAV Videos. Remote Sensing. 2021; 13(4):653. https://0-doi-org.brum.beds.ac.uk/10.3390/rs13040653
Chicago/Turabian StyleStojnić, Vladan, Vladimir Risojević, Mario Muštra, Vedran Jovanović, Janja Filipi, Nikola Kezić, and Zdenka Babić. 2021. "A Method for Detection of Small Moving Objects in UAV Videos" Remote Sensing 13, no. 4: 653. https://0-doi-org.brum.beds.ac.uk/10.3390/rs13040653
Note that from the first issue of 2016, this journal uses article numbers instead of page numbers. See further details here.