Article

Using Long-Term Earth Observation Data to Reveal the Factors Contributing to the Early 2020 Desert Locust Upsurge and the Resulting Vegetation Loss

1
State Key Laboratory of Severe Weather, Chinese Academy of Meteorological Sciences, Beijing 100081, China
2
College of Earth Science, Chengdu University of Technology, Chengdu 610059, China
3
Collaborative Innovation Centre on Forecast and Evaluation of Meteorological Disasters, Nanjing University of Information Science & Technology, Nanjing 210044, China
4
National Meteorological Center of China, Beijing 100081, China
5
Numerical Weather Prediction Center of Chinese Meteorological Administration, Beijing 100081, China
*
Author to whom correspondence should be addressed.
Submission received: 5 January 2021 / Revised: 6 February 2021 / Accepted: 7 February 2021 / Published: 13 February 2021
(This article belongs to the Special Issue Remote Sensing for Future Food Security and Sustainable Agriculture)

Abstract

:
Massive desert locust swarms have been threatening and devouring natural vegetation and agricultural crops in East Africa and West Asia since 2019, and the event developed into a rare and globally concerning locust upsurge in early 2020. The breeding, maturation, concentration and migration of locusts rely on appropriate environmental factors, mainly precipitation, temperature, vegetation coverage and land-surface soil moisture. Remotely sensed images and long-term meteorological observations across the desert locust invasion area were analyzed to explore the complex drivers, vegetation losses and growing trends during the locust upsurge in this study. The results revealed that (1) the intense precipitation events in the Arabian Peninsula during 2018 provided suitable soil moisture and lush vegetation, thus promoting locust breeding, multiplication and gregarization; (2) the regions affected by the heavy rainfall in 2019 shifted from the Arabian Peninsula to West Asia and Northeast Africa, thus driving the vast locust swarms migrating into those regions and causing enormous vegetation loss; (3) the soil moisture and NDVI anomalies corresponded well with the locust swarm movements; and (4) there was a low chance the eastwardly migrating locust swarms would fly into the Indochina Peninsula and Southwest China.

Graphical Abstract

1. Introduction

The desert locust (Schistocerca gregaria) has been among the most devastating and notable pests that threaten local food security in Africa, the Middle East and Southwest Asia since the beginning of recorded history [1]. Various large-scale crop protection strategies and preventive management strategies for desert locusts, such as chemical pesticides, field assessments and early warning systems, have been implemented by researchers and institutions since the 1950s [2]. Among them, the Food and Agriculture Organization of the United Nations (FAO) has played an important role in monitoring the timing, scale and location of invasions and breeding through its global Desert Locust Information Service (DLIS) (http://www.fao.org/ag/locusts/en/activ/DLIS/index.html). Therefore, locust outbreaks and plagues have been successfully controlled, and the frequency of intense and widespread locust infestations has declined significantly in the past several decades [3]. The locust upsurge in early 2020 has been recognized as the worst infestation in several decades for some East Africa and West Asia countries, such as Kenya, Ethiopia and Pakistan, and the hectares of damaged forests and farmlands are still increasing [4]. It is widely acknowledged that climatic conditions strongly influence locust outbreaks and upsurge processes [5,6,7,8]. Knowledge of the climatic drivers behind this unusual locust crisis is essential to further improve the early warning accuracy of outbreaks and potentially assist with socioeconomic loss assessments during the vastly damaging and lasting locust upsurge.
Desert locust upsurges are initiated from a large number of contemporaneous outbreaks, which are supported by favorable conditions, including high rainfall, green vegetation, moistened soil, low-speed wind and appropriate land surface temperature [9]. Large-scale and long-term environmental variables over the seasonal breeding areas of locusts are necessary to forecast the spatial–temporal dynamics of locust outbreaks and develop effective control strategies [10]. Many previous studies have highlighted the advantages and efficiency of satellite platforms for collecting meteorological parameters and land surface observations at national and global scales. Satellite-based time series data, such as precipitation, land surface temperature and soil moisture, have been increasingly applied to estimate the location of desert locust breeding and recession areas and have been used to provide effective preventive management [11,12,13,14,15,16].
A deep understanding of the roles of various climatic features in desert locust breeding, multiplication, concentration and gregarization is needed to improve the reliability of the detection, prediction and simulation of the presence of locust outbreaks [5,17]. In general, the affecting factors vary during different life stages of the desert locust, and rainfall and temperature are commonly recognized as two of the most relevant parameters. According to Symmons, Cressman [18], the period of egg incubation and development decreases rapidly from approximately 26 to 10 days with increases in soil temperature from 24 to 37 ℃, and hopper development occurs more quickly at high air temperatures, which indicates that high temperatures (approximately 30–37 ℃) provide appropriate conditions for rapid desert locust population growth. Apart from the air and soil temperatures, rainfall events usually produce adequate soil moisture associated with egg laying and abundant herbaceous vegetation for increased survival of hoppers to the winged adult stage [13,19]. A longer and favorable rainy season in the breeding area drives the rapid maturation of populations, and two or three generations can be produced in rapid succession [20].
Vegetation coverage has remarkable effects on the associated changes in behavior, color, and shape as well as the formation of hopper bands and swarms when the population density of locusts is high [21]. The less uniform regions with relatively dense vegetation patches separated by extensive areas of bare land are likely to favor locust concentration and gregarization [13]. The migration of locust swarms occurs only when there are appropriate take-off wind speeds and wind directions. Generally, locust swarms take off when the wind speed is lower than 6 m/s, and the flight direction is downwind [18]. In addition, in high mountains and dense vegetation, locust swarms settle because their maximum flight height is 1700 m, and the swarms continue flying only when there is little or no vegetation [19].
The desert locust upsurge during 2019–2020 originated from the breeding areas in Northeast Africa and Southwest Asia and severely destroyed natural vegetation, food crops and forage in East Africa countries, especially Kenya, Ethiopia, and Somalia, as well as in the Indo-Pakistan border area, and the upsurge may threaten West Africa, East India, the Indochina Peninsula and Southwest China. This study aims (1) to identify the contributing factors of desert locust swarm formation and migration by collecting various environmental observations, including precipitation, soil moisture, air temperature and vegetation coverage; (2) to evaluate the impacts of locust swarms on local vegetation in the most damaged areas, mainly the border area of the Kenya, Ethiopia, and Somalia (K-E-S) and the Indo-Pakistan border area based on satellite remotely sensed vegetation indices; and (3) to identify the growing trend of locust swarms and estimate the chances of the desert locusts invading the Indochina Peninsula and eastern areas outside the current invasion border in the future considering that the desert locust swarms are still expanding and threatening neighboring countries and regions. For this purpose, the historical precipitation, soil moisture, vegetation coverage and elevation data in those areas were mapped.

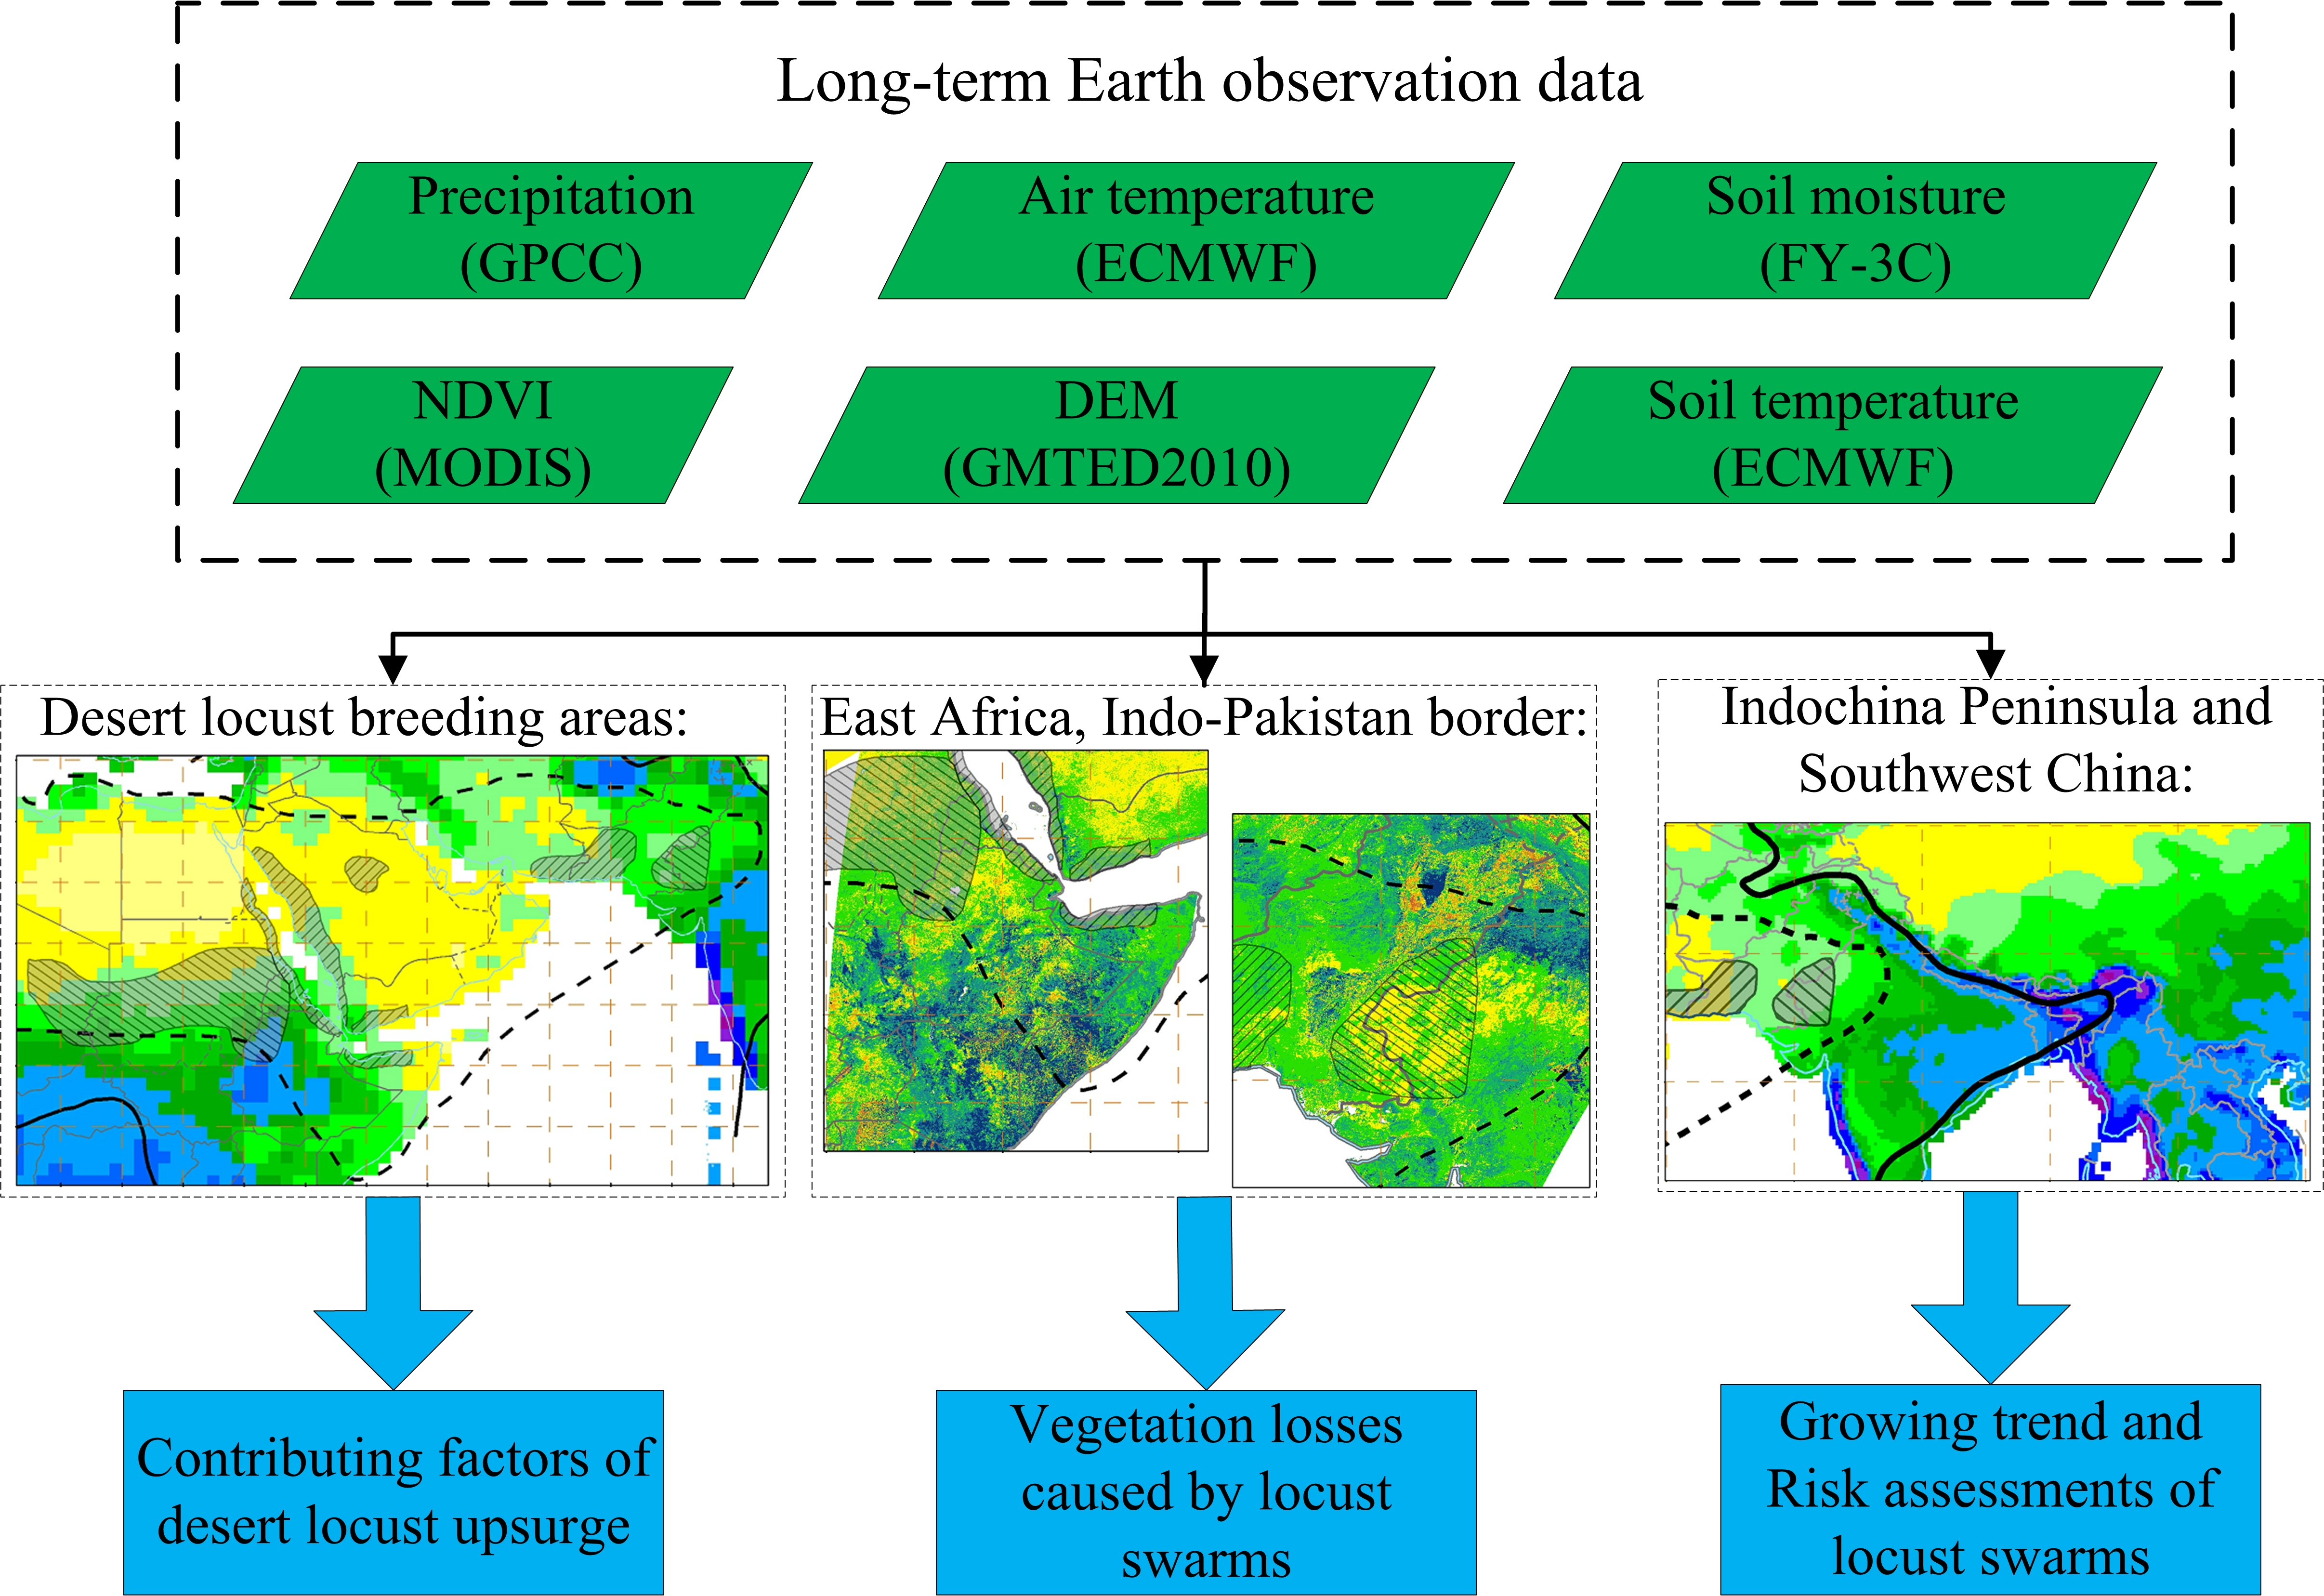
2. Materials and Methods
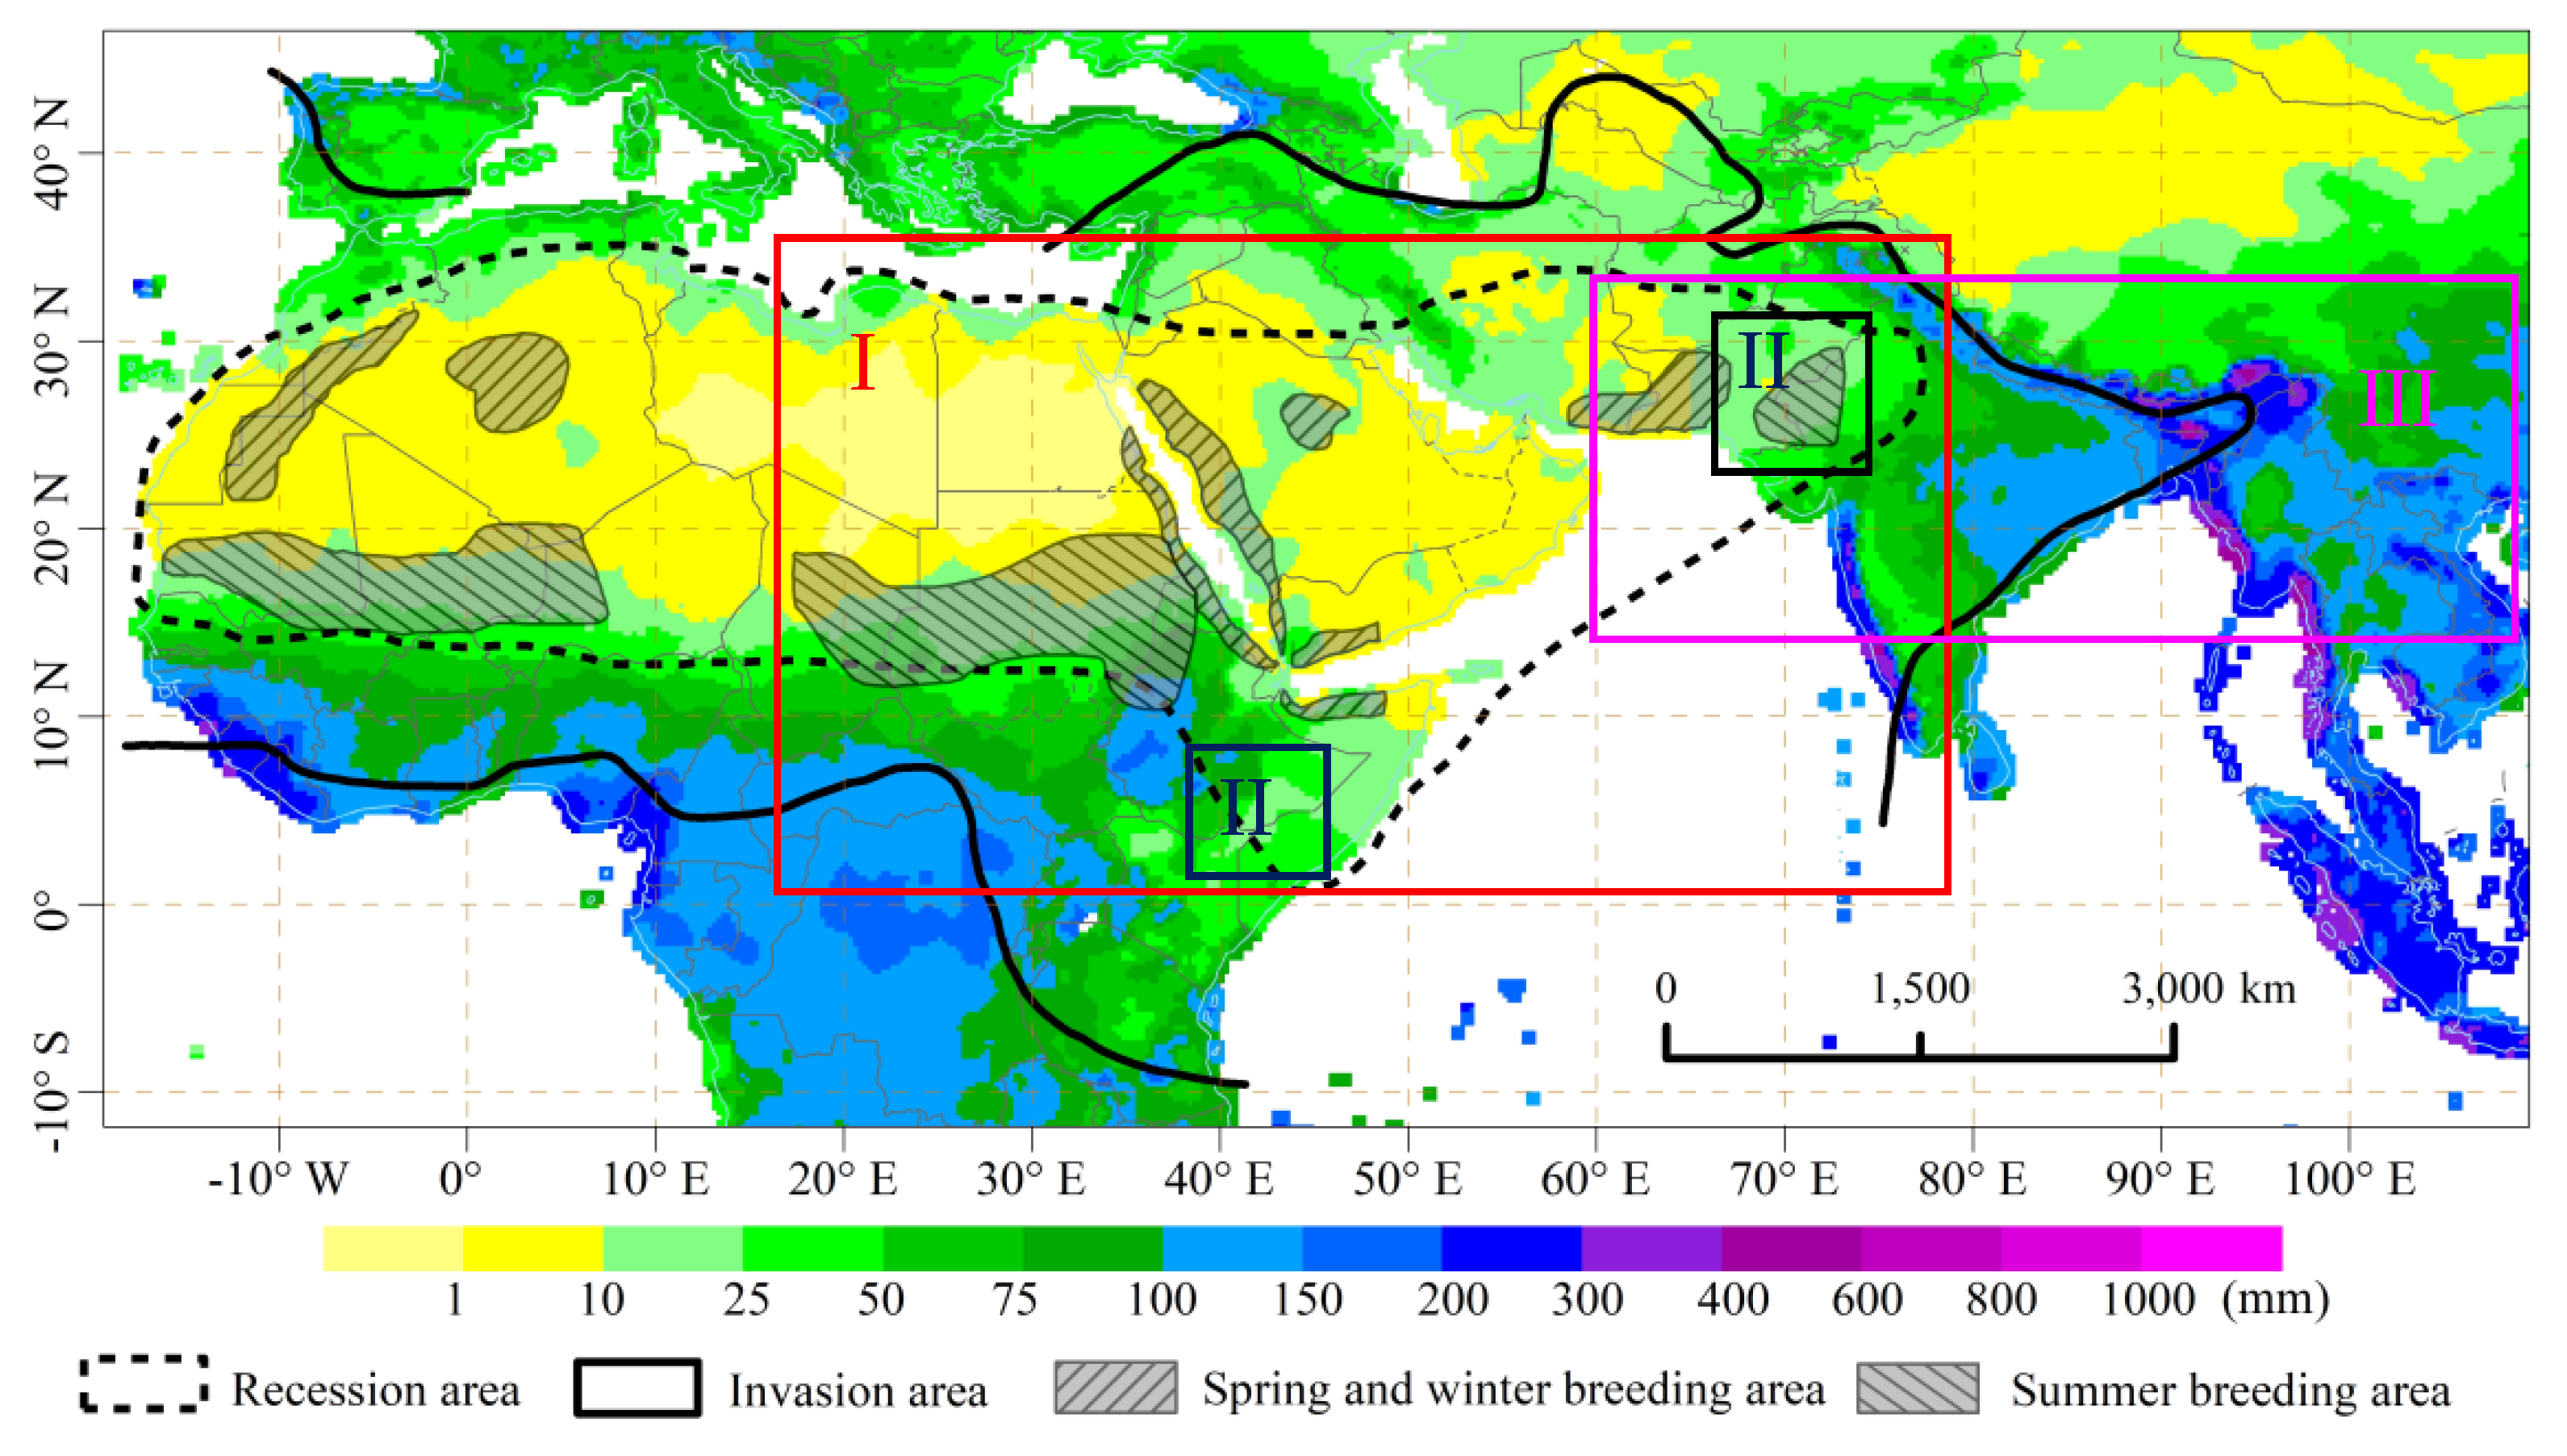
2.1. Study Area

The study area is located in East Africa and West Asia, and the region was separated into three parts (Figure 1) to analyze the contributing factors of the locust upsurge, evaluate the locust’s impacts and identify the possibility of East India, the Indochina Peninsula and Southwest China being affected by eastwardly migrating locust swarms in the future. Part I includes the spring, summer and winter breeding areas of the desert locust in Northeast Africa and Southwest Asia. These breeding areas are located in the arid and semi-arid areas of the Sahara Desert, mainly on both sides of the Red Sea, the middle of the Arabian Peninsula, southwest Yemen, northern Somalia, southern Pakistan and the Indo-Pakistan border area. The boundaries of the winter/spring and summer breeding areas, as well as the invasion and recession areas, were acquired from the desert locust guidelines [18], and mapped as Figure 1. This region is under the influence of arid and semiarid climates, with an annual rainfall lower than 200 mm [22]. Part II includes the severely damaged countries and regions, which include the summer breeding area near the Indo-Pakistan border and the area near the border of three countries (Kenya, Ethiopia and Somalia) in East Africa. Part III includes the breeding areas of locust near the Indo-Pakistan border and the South Iran, East India, Southwest China and several Southeast Asian countries, which have recently been threatened by highly mobile and eastwardly migrating desert locust swarms.

2.2. Meteorological Observations

2.2.1. Precipitation Data from the GPCC

The Global Precipitation Climatology Centre (GPCC) provides more than ten precipitation datasets with long temporal coverage (1891–present) and four spatial resolutions (1.0°, 2.5°, 0.25°, and 0.5°) (https://opendata.dwd.de/). The GPCC products have been widely applied in drought monitoring, analysis of trends and extreme climatic conditions, calibration of satellite data and hydrological studies. Their sampling error of gridded monthly precipitation data has been quantified by World Meteorological Organization (WMO) and investigated by GPCC for various regions of the world. The relative sampling error of gridded monthly precipitation is between ±5 to 20% if five rain gauges are used [23]. In addition, the GPCC’s approach of interpolating the anomalies instead of absolute values is more efficient to reduce the sampling error than the choice of the interpolation method itself [24]. In this study, the GPCC full data monthly product (version 2018) during 1891–2016 at 0.25° generated by Schneider, Becker [25] was used as the historical reference as the most accurate in situ precipitation re-analysis data set of GPCC. The GPCC first-guess monthly product at 1.0° created by Ziese, Becker [26] was applied to map the precipitation of the study area (part I) in 2018 and 2019. The percentage ratio of the precipitation (PRP) was calculated using the following equation:
PRP = Precip/Precip_histor × 100%
where Precip represents the monthly precipitation, and Precip_histor represents the historical reference of precipitation. PRP > 100% indicates greater rainfall than the average value, and PRP < 100% indicates relatively low precipitation in the current month of the year.

2.2.2. Land Surface Data from the ECMWF

Various forecast models and assimilation systems were developed and employed to archive the historical meteorological data and re-analysis datasets by the European Centre for Medium-Range Weather Forecasts (ECMWF) (https://www.ecmwf.int/). The ERA5 dataset produced by the ECMWF provides detailed and near-real-time estimates of atmospheric, land surface, and oceanic climate variables from 1950 onwards at one-hour intervals, and its spatial resolutions are 31 km at the global level and 62 km for the ensemble of data assimilation (EDA). The spatial–temporal resolution has been significantly enhanced, and uncertainty estimates are also included in the ERA5 dataset, compared with the ERA-Interim dataset [27]. This study applied the ERA5 land monthly averaged data to calculate and map the 2 m air temperature, 10 m wind speed, soil temperature (Level 1) and soil moisture (Level 1) in the recent decade of the study area (part III). Moreover, the 2 m air temperature dataset was used to calculate the anomaly percentage of the air temperature (APat) over the study area (part I) using the following equation:
APat = (ATiAT_ave)/AT_ave × 100%
where ATi represents the monthly air temperature (°C) in the ith year, and AT_ave represents the average air temperature over the past decade. APat > 0 means that the current air temperature is higher than that in normal years, and APat < 0 demonstrates a relatively lower air temperature in the current month of the year.

2.3. Remotely Sensed Data

2.3.1. Soil Moisture Data from the Fengyun Satellite

In recent years, passive microwave remote sensing has been widely applied as an effective approach to measure soil moisture dynamics over large areas under all weather conditions [28]. Currently, a large number of microwave-based satellite missions have been frequently employed for global soil moisture monitoring. Among them, the Microwave Radiometer Imager (MWRI) onboard the Fengyun-3C (FY-3C) satellite launched by the National Satellite Meteorological Center (NSMC) of China have been frequently employed to monitor the regional soil moisture, and its retrievals have been proven to have good consistency with the measured soil data [29]. The monthly FY-3C/MWRI soil moisture products (FY-3C VSM) with a spatial resolution of 25 km and presented on the global equal-area scalable earth (EASE) Grid 2.0 are available from May 2014 to the present on the website of the NSMC (satellite.nsmc.org.cn/). This study collected and generated those products to map the spatial–temporal variation patterns of the land surface soil moisture in the latter half of 2019 and early 2020 across the locust invasion and recession areas.

2.3.2. MODIS NDVI

The normalized difference vegetation index (NDVI) products derived from Moderate Resolution Imaging Spectroradiometer (MODIS) are the most mature and widely used source for monitoring vegetation status [30,31]. In this study, the monthly MODIS NDVI products (MOD13A3, v006) at a 1 km spatial resolution for 2010-2020 were downloaded from the NASA website (https://ladsweb.modaps.eosdis.nasa.gov/). Ten tiles (h21v07, h21v08, h21v09, h22v07, h22v08, h22v09, h23v05, h23v06, h24v05 and h24v06) of the NDVI products were reprojected and mosaicked to calculate the NDVI anomaly and map the vegetation status in East Africa and the Indo-Pakistan border area during 2019-2020. The NDVI anomaly (NA) was defined as the difference between the current NDVI and the average NDVI in recent years:
N A i = N D V I i i = 1 n N D V I i / n
where NAi represents the NDVI anomaly in the ith month, NDVIi represents the NDVI in the ith month, and n is the number of years and equals 11 (2010–2020) in the study.

2.3.3. DEM Data

There are several existing digital elevation models (DEMs), including the Advanced Space-borne Thermal Emission and Reflection Radiometer (ASTER) Global DEM (G-DEM), the Shuttle Radar Topographic Mission (SRTM) DMEs, and the Global Multi-resolution Terrain Elevation Data (GMTED2010) dataset, which are freely available for terrain analysis [32,33]. The GMTED2010 was jointly published by the U.S. Geological Survey (USGS) and the U.S. National Geospatial-Intelligence Agency (NGA), at spatial resolutions of 1 km, 450 m and 225 m. The consistency and vertical accuracy of the GMTED2010 dataset has been significantly enhanced over the former GTOPO30 elevation model [33]. In addition, the GMTED2010 dataset is set as the default DEM data by the Environment for Visualizing Images (ENVI), and it is convenient to load and apply GMTED2010 for elevation data visualization and image processing workflows. Here, the GMTED2010 data were applied to map the geomorphic conditions over East India and Southwest China.

2.4. Analysis of the Climatic Anomalies’ Contributions to the Desert Locust Upsurge

Generally, desert locust upsurges and plagues occur after several successful locust breeding events with appropriate climatic conditions [5]. The desert locust upsurge in early 2020 can be traced back to the formation of locust generations and the expansion of locust swarms during 2018 and 2019 [4]. Here, the precipitation and the percentage ratio of precipitation during 2018–2019 over the study area (part I) were mapped to analyze how the precipitation anomalies contributed to the successive multiplication and migration of locusts. Apart from precipitation, favorable land surface air temperature and soil moisture drive a sequence promoting successful breeding and growth of desert locust populations. In this paper, the spatial–temporal characteristics of those variables were depicted to indicate the relationship between the variables’ anomalies and the locust outbreaks and upsurge.

2.5. Evaluation of Impacts and Growing Trends of Desert Locust Upsurge

Here, the MODIS NDVI and NDVI anomaly data across the two severely damaged regions, i.e., the Indo-Pakistan border and East Africa countries, including Kenya, Ethiopia, and Somalia, were generated to assess the impacts on the local vegetation caused by desert locust swarms. In addition, it has been widely acknowledged that tropical cyclones and tropical depressions over western India are closely related to climatic condition anomalies. In this study, the frequencies and variation trends of tropical cyclones and depressions in the past 30 years were analyzed to identify the potential risk of future desert locust outbreaks, upsurges and plagues.

3. Results

3.1. The Contribution of Climatic Conditions to the 2020 Desert Locust Upsurge

3.1.1. Precipitation and Its Anomalies

The precipitation anomalies during 2018–2019 were caused by several rare cyclones and tropical storms, mainly cyclone Mekunu in May 2018, cyclone Luban in October 2018 and cyclonic storm Pawan in December 2019 [4]. Here, the precipitation and precipitation percentage ratio compared with the historical reference over the breeding areas of the desert locust are shown in Figure 2. According to Figure 2a,b, the precipitation in West Oman and East Yemen was between 100 and 300 mm, and the percentage ratio of the precipitation reached 500%, indicating significant abnormal precipitation amounts across the South Arabian Peninsula. As a result, several lakes formed in the interior along the border between Yemen and Oman and in the edges of the Empty Quarter (http://www.fao.org/ag/locusts/en/info/info/index.html), thus providing favorable conditions for locust breeding and reproduction. Figure 2c,d indicate a remarkable precipitation anomaly over the most parts of the Empty Quarter, the interior of Sudan and Eritrea and the Red Sea coastal plains in October 2018, which strongly supported the formation of desert locust groups in these areas. Furthermore, the remarkable precipitation anomaly in the Empty Quarter, where the control operations for the growing desert locusts were unavailable, have significantly augmented the locusts’ development. The heavy rain brought by the two cyclones in May 2018 and October 2018 provided favorable breeding conditions beginning in June 2018 and enabled the continuous and successful breeding of multiple desert locust generations. In 2019, the total precipitation across the central of the Arabian Peninsula sharply declined to approximately 50% of the annual precipitation in normal years, while the precipitation percentage ratio in the Somalian Peninsula and West Asian countries, including the southwest Iran, Afghanistan, Pakistan and West India, reached 125%~500% compared with the historical reference (Figure 2e,f). Among those areas, the southwest Iran, with the precipitation over 75 mm (Figure 2e) and the precipitation anomaly reaching 125% (Figure 2f) allowed a westward extension of the spring breeding area of the locusts, thus strongly supported the locusts’ breeding in spring and the invasion process of the swarms towards the Indo-Pakistan border at the beginning of the summer. In general, the abundant rain in those areas around the Arabian Peninsula forced the desert locusts from the Arabian Peninsula migrated towards northwest to the southwest Iran in early 2019, and then migrated to the Indo-Pakistan border after the successful spring breeding. In addition, it supported the southwardly migrated swarms into the East Africa in 2019. Then the numerous locust swarms appeared around the East Africa and the Indo-Pakistan border, thus triggering the locust upsurge in East Africa and West Asia. The swarms have been invading, spreading and laying eggs in the East Africa during 2020, and the swarms are expected to lay eggs and growing in numbers in north Somalia, which received heavy rainfalls from cyclone Gati in November 2020, as well as the other east African countries with sufficient rainfalls (Figure 2g,h), thus increasing the risk of prolonging the desert locust upsurge in the area.

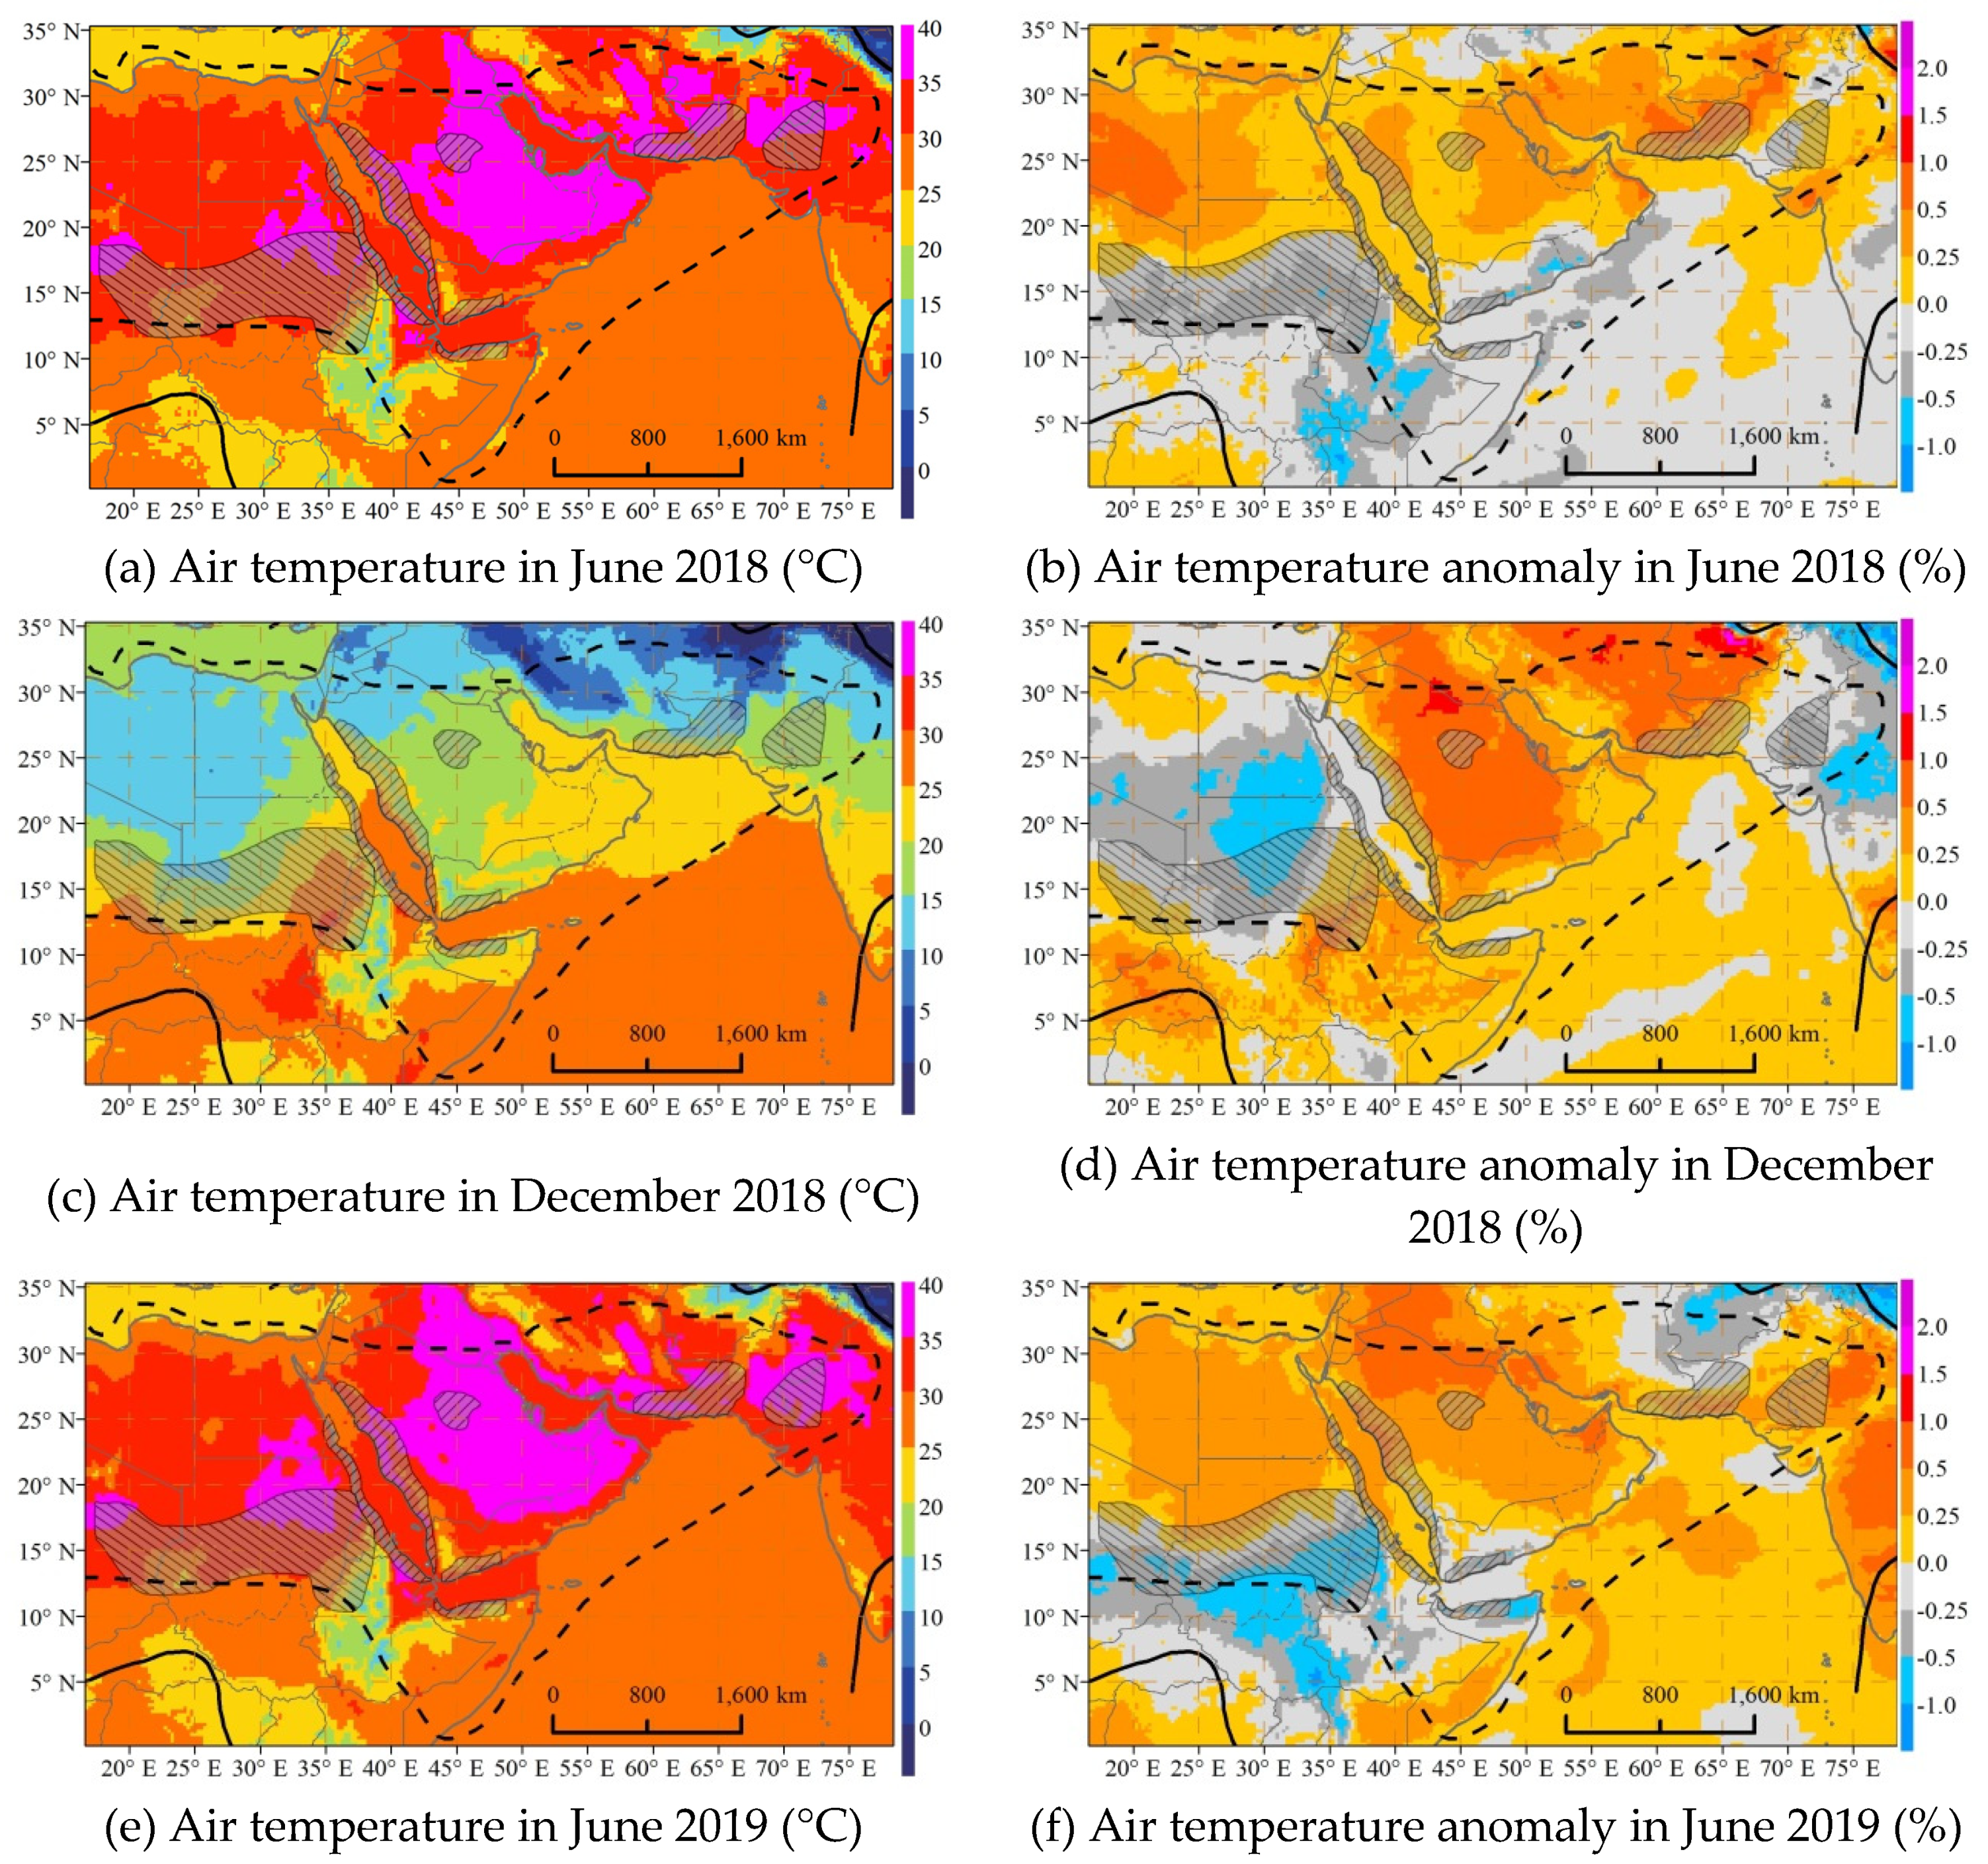
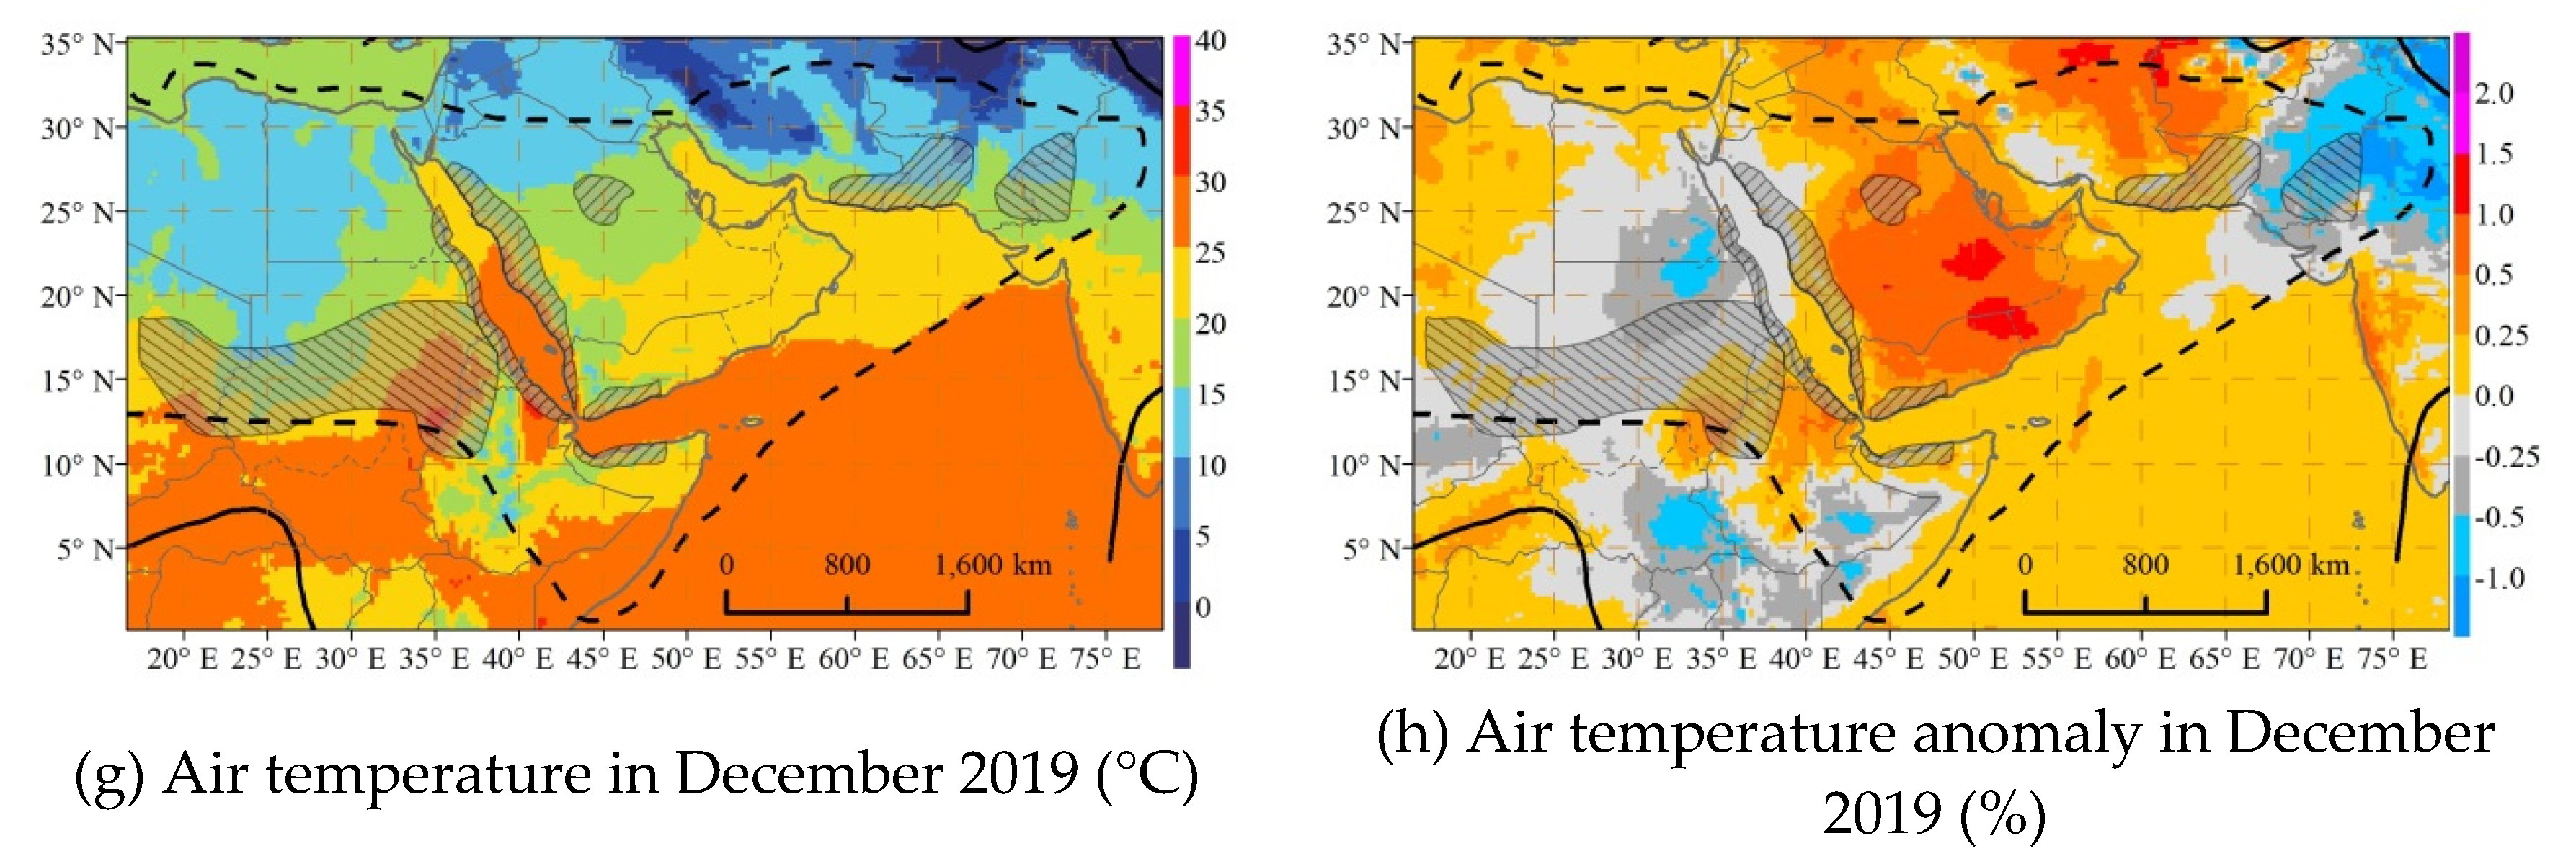
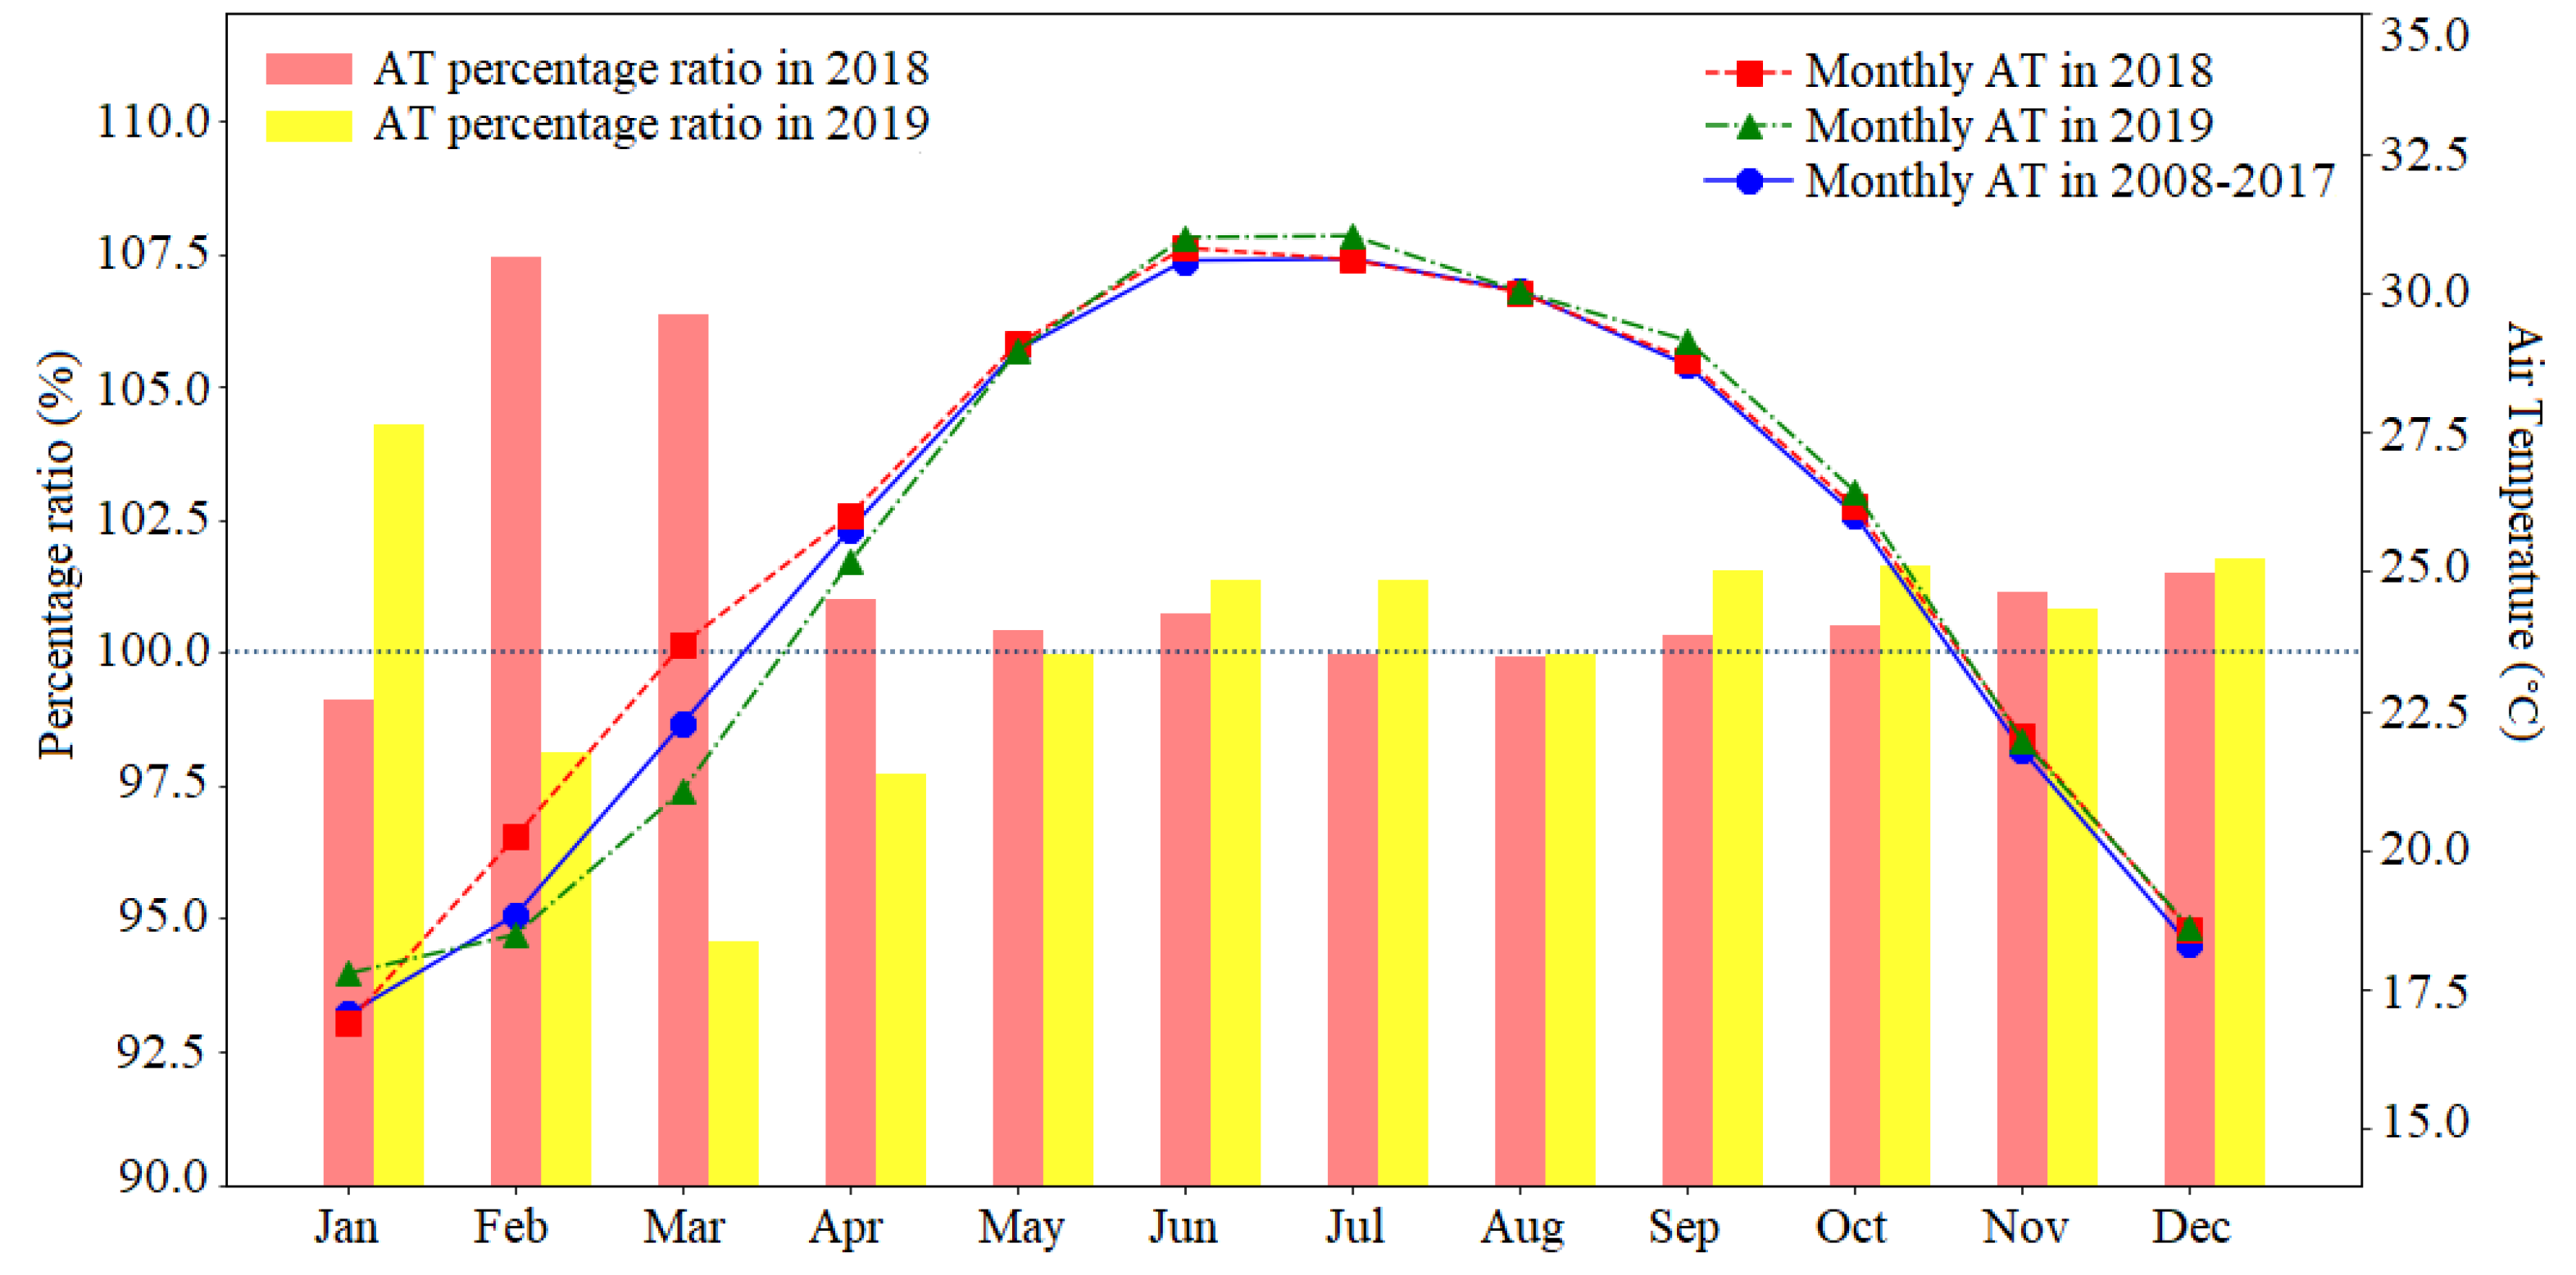
3.1.2. Air Temperature and Its Anomalies

Apart from rainfall events, a high air temperature and land surface soil temperature, especially the high temperatures in months from April to December, will significantly decrease the period of egg incubation and hopper development, thus providing appropriate conditions for the rapid development of each desert locust generation. Here, the 2-m air temperature as well as its anomaly compared to the past decade across the study area in the warmest month (June) and coldest month (December) in 2018 and 2019 are mapped as Figure 3. According to Figure 3, the study area in June 2018 and 2019 has experienced a high and favorable air temperature (30~40 °C) in the entire Arabian Peninsula, summer and spring breeding areas in the West Asia and the both sides of the Red Sea (Figure 3a,e), thus accelerating the locust breeding, development and migration. In December 2018 and 2019, a large proportion of the study area, including the south Arabian Peninsula, the winter breeding areas in both sides of the Red Sea and the north Somalia, still have an air temperature higher than 20 °C (Figure 3c,g), which continued the locust production and migration in winter. Additionally, the study area has experienced slightly higher air temperatures in most parts compared with the averaging monthly air temperature of the past ten years under the influence of global climate change. In 2018, the south and west of the study area showed a negative air temperature anomaly in June (Figure 3b) and December (Figure 3d), respectively. The air temperatures in other areas were higher than the norms, especially the Arabian Peninsula, whose air temperature anomalies in December was generally more than 0.5%. The area with a higher air temperature in 2019 (Figure 3f,h) was enlarged than 2018.
In order to examine the variation trend of the air temperature during 2018-2019, the monthly average of the air temperature and its percentage ratio compared to the past decade across the locusts breeding area, including the Empty Quarter and the southwest Iran, in 2018 and 2019 were calculated and graphed as Figure 4. According to this figure, the months from April to October have a favorable air temperature (25~30℃) for the breeding and migration of the locusts, as well as the development of the vegetation, during 2018–2019. Additionally, the study area has experienced a similar or higher air temperature in most of months compared with the averaging air temperature in the past ten years under the influence of global climate change. In 2018, only one month (January) out of twelve has a slightly lower air temperature percentage ratio than 100%, and the other monthly air temperature values in the months from February to December are close to or higher than the averaged air temperature, especially in the February and March 2018, with the air temperature percentage ratios greater than 106.0%. In 2019, the monthly air temperature percentage ratios in February, March and April are lower than 100%, while the air temperature s of the other nine months are greater than or equal to the air temperature norms in the past ten years. It is likely that a favorable and higher air temperature in the study area promotes and accelerates desert locust population maturation, the production of multiple generations and locust swarm migration, especially during the spring period.

3.1.3. Land Surface Soil Moisture

In general, the desert locusts tend to breed in and migrate between their summer and winter/spring breeding areas, such as the Red Sea coast, interior of the Saudi Arabia, South Sudan, South Iran and the Indo-Pakistan border, and they migrate between the regions with continuous rainfall. The continuous heavy rainfalls during the latter half of 2019 and early 2020 greatly increased the land surface soil moisture over the surrounding regions outside the Arabian Peninsula, thus providing favorable soil conditions and lush vegetation for the migration of desert locust swarms into West Asia and East Africa. The land surface soil moisture (0~5 cm) from March 2019 to February 2020 retrieved from the Fengyun-3C/MWRI soil moisture products and the movement of the desert locusts are shown in Figure 5. A large proportion of the Arabian Peninsula had a low soil moisture and experienced a drought condition during 2019 (Figure 5a–j). Therefore, the vast Arabian Peninsula desert locust swarms had to migrate to find more green vegetation as food and more favorable soil conditions for egg laying and hopper development.
Unlike the Arabian Peninsula, the West Asia and East Africa, including the summer locust breeding area near the Indo-Pakistan border and the winter locust breeding area in the Somalia Peninsula, had a favorable soil moisture (between 0.05~0.20 cm3/cm3) for the egg laying of locust from the spring 2019 to early 2020 (Figure 5), thus provided adequate food and environmental conditions for breeding and the development of the newly arrived locust swarms. Therefore, vast locust swarms gathered in the Indo-Pakistan border area since the spring 2019 (Figure 5a–c) and expanded gradually until January 2020 (Figure 5l). Then, the number of locust swarms decreased dramatically in February 2020 due to the local and international preventive and controlling strategies, as well as the lower soil moisture than the earlier months (Figure 5k). Regarding East Africa, the areas with soil moisture distributed between 0.10~0.20 cm3/cm3 were located in Somalia, North Kenya and East Ethiopia from October to November 2019 (Figure 5h,i), thus allowing the swarms to move southeastwardly into the Somalia Peninsula and conduct successful production subsequently. The Somalia and East Ethiopia had become dry since January 2020 (Figure 5k), and the drought conditions had been worsened in the next two months. The appropriate and moist regions had passed southwestwardly to South Kenya and Ethiopia during January and February 2020 (Figure 5k,l). Accordingly, the Somalia and East Ethiopia desert locust swarms moved towards the southwest to those regions since the early 2020. Additionally, the area with a soil moisture between 0.10~0.15 cm3/cm3 in the winter breeding area in the Arabian Peninsula and the south Yemen was significantly enlarged than the previous months in the early 2020, which led to the reappearance of vast swarms in this region (Figure 5k). It is obvious that the soil moisture distribution was highly relevant to the distribution and movements of desert locust swarms. The spatial–temporal variation patterns of the soil moisture across West Asia and East Africa corresponded well with the migration routine of the desert locust swarms.

3.2. The Impact Assessment of Desert Locust Swarms on the Local Vegetation

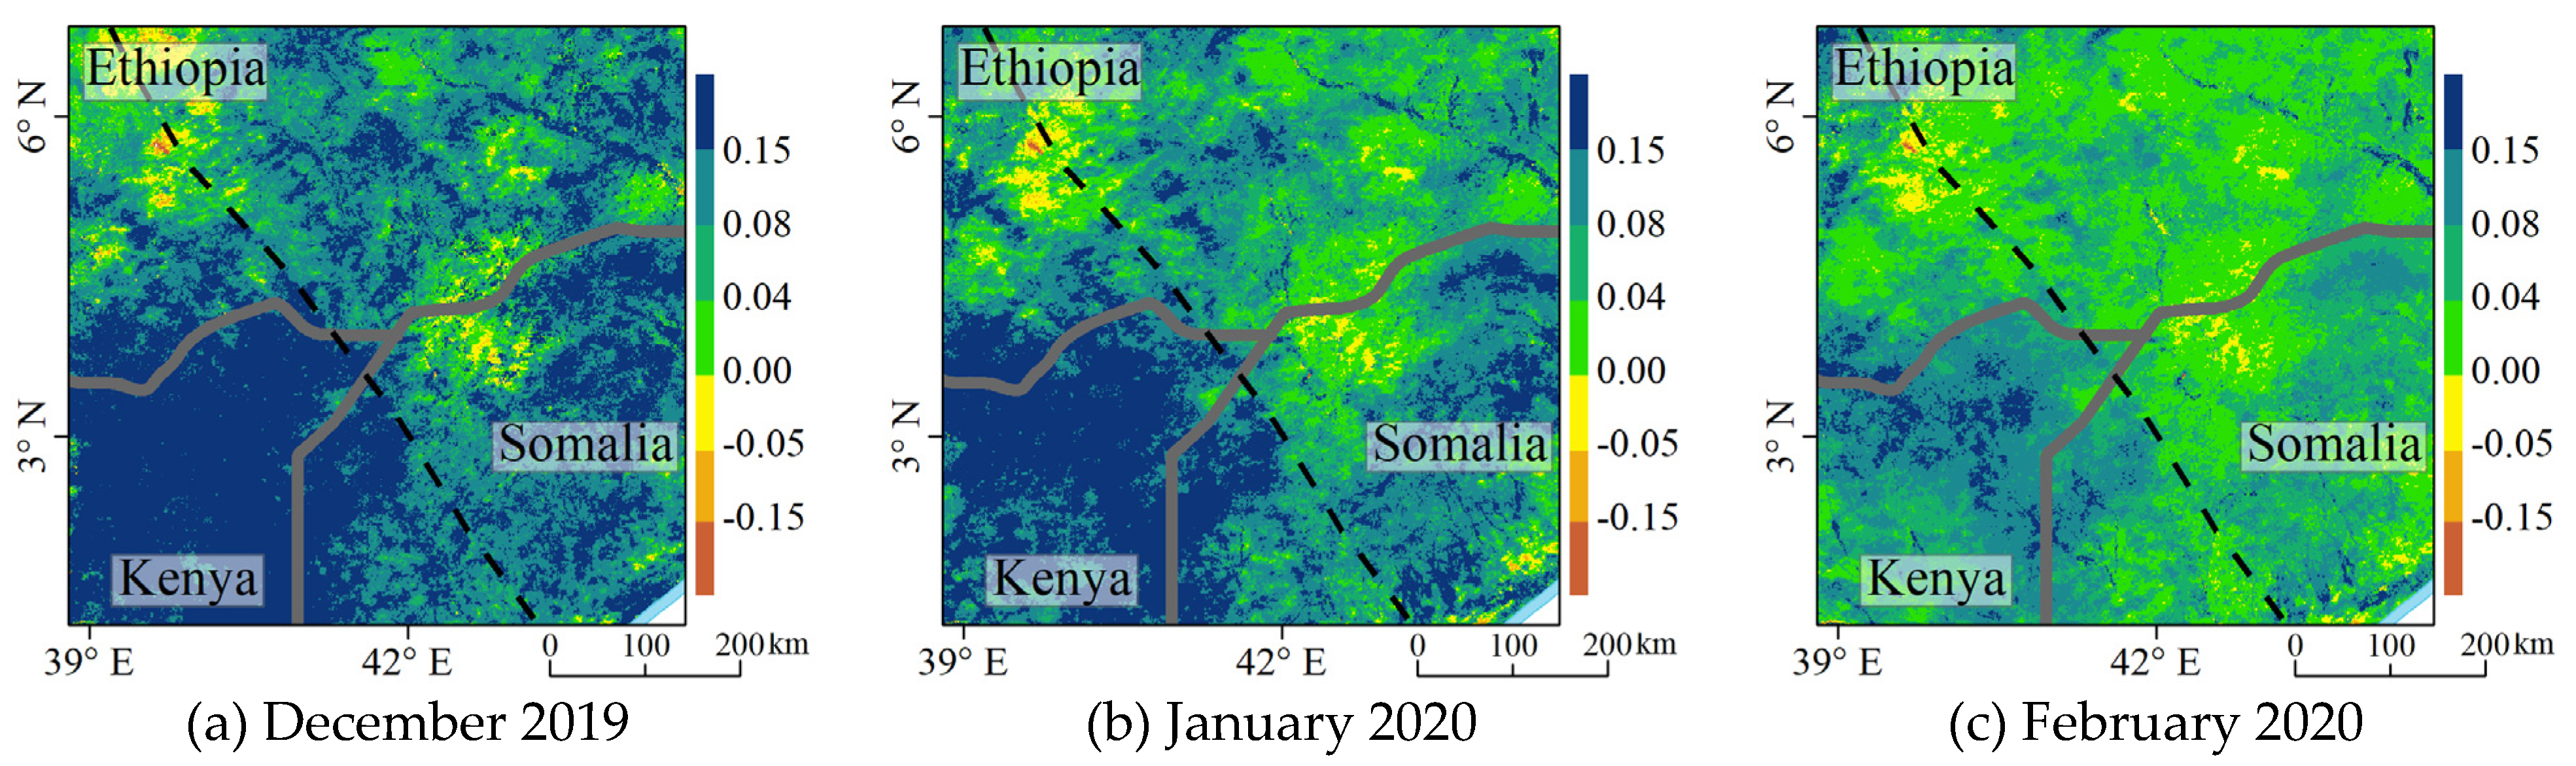
3.2.1. NDVI Anomalies in East Africa

Kenya, Ethiopia and Somalia are important agricultural countries in East Africa, where forages, crops and food security have been seriously threatened by the vast desert locust swarms that have migrated from the Arabian Peninsula since the end of 2019. Figure 6 shows that the swarms have been gathered near the borders of Ethiopia, Somalia and Kenya (E-S-K border region) for a long time since December 2019. Therefore, in this study, the NDVI anomaly variation patterns across this region from December 2019 to May 2020 were mapped, to assess the impacts on local vegetation caused by this locust crisis, as shown in Figure 6. Considering that the vegetation loss caused by the desert locust swarms cannot be detected in the NDVI anomaly maps until the vast locust swarms have settled the area for a long time, the locust swarm distributions and movement were analyzed one or two months prior (http://www.fao.org/ag/locusts/en/info/info/index.html) to identify the areas destroyed by the locust swarms. According to the movement of the swarms, scattered locust bands and groups showed up in north Somalia and East Ethiopia since November 2019, and a number of swarms became visible and moved southwardly into Kenya in December 2019, which corresponded well with the areas exhibiting the negative NDVI anomalies from December 2019 to February 2020 (Figure 6a–c). The desert locust swarms grew dramatically and severely damaged East Africa beginning in January 2020, and the swarms in Somalia migrated towards southwest to Kenya and South Ethiopia in January, and then moved eastward to North Uganda in February 2020, respectively. Thus, the vast migrated desert locust swarms have been causing great vegetation losses in this area by March 2020, especially the South Ethiopia, where a large proportion have a NDVI anomaly lower than −0.05 (Figure 6d). The proportion of the areas with negative NDVI anomalies increased significantly in Kenya during April and May 2020 (Figure 6e,f), which corresponded well to the distribution and southwestwards movement of the desert locust swarms at earlier times, and with the subsequent onset of the monsoon rains.

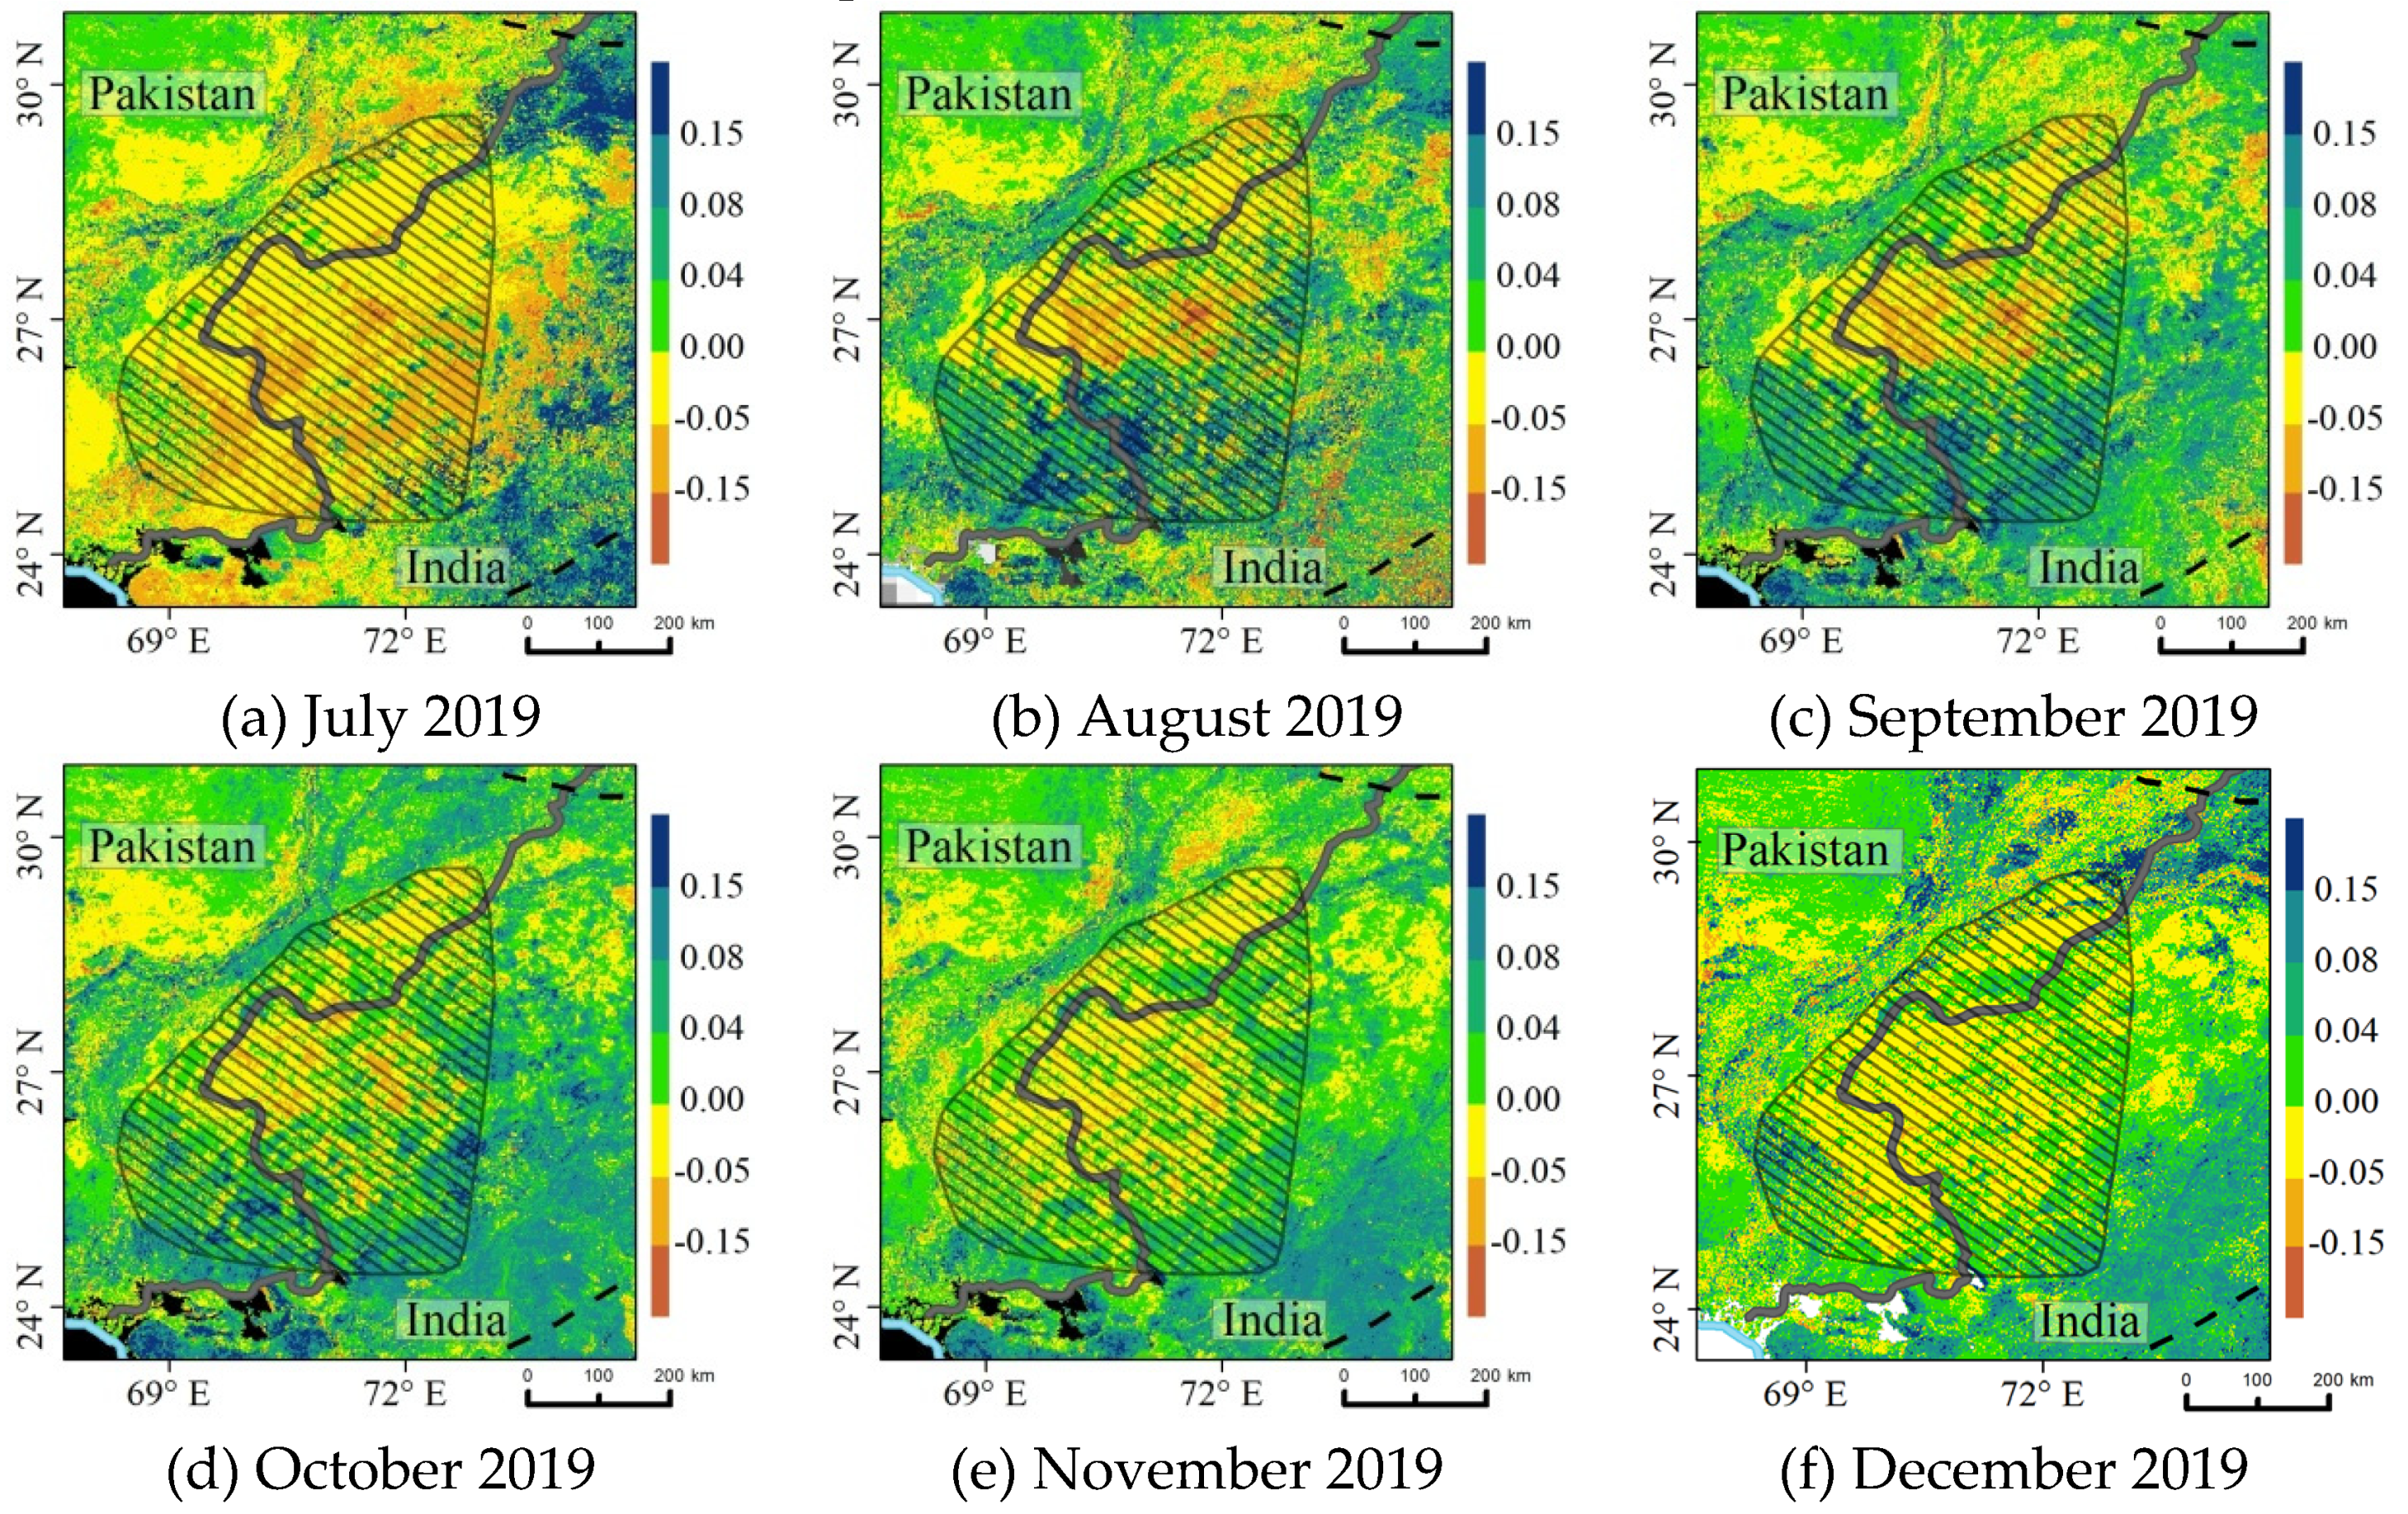
3.2.2. NDVI Anomalies in the Indo-Pakistan Border Area

According to the investigation conducted and published by the FAO (http://www.fao.org/ag/locusts/en/info/info/index.html), the locust swarms started to form and increased rapidly beginning in the middle of 2019 in the breeding area around the Indo-Pakistan border. The NDVI anomalies during July 2019 and May 2020 (Figure 7a–k) indicated that the most damaged vegetation was mainly located in the summer locust breeding area, where the NDVI values were widely lower than those in normal years. Figure 7 demonstrates severe vegetation losses in the summer breeding area during July 2019 and February 2020 (Figure 7a–h), and the vegetation conditions has been improved since May 2020 in this area (Figure 7f) because the number of locust swarms declined rapidly since February 2020 (Figure 5l), due to the intense and successful control strategies. To conclude, the NDVI anomalies can used to reflect the impacts of the desert locust swarms when prior movements are considered.

3.3. Possibility Analysis of Desert Locust Swarms Migrating into the Indochina Peninsula and Southwest China

Because the expanding and eastwardly migrating desert locust swarms have been threatening East India, the Indochina Peninsula and Southwest China, this study mapped the spatial distribution patterns of the average soil moisture and high vegetation coverage during 2008-2019, as well as the elevation across the study area (part III) (Figure 8), to analyze the possibility of desert locust swarms flying to the Indochina Peninsula and Southwest China. According to the biological characteristics of desert locust, desert locust swarms take off under suitable climatic conditions, such as air temperature (20~40 °C) and wind speed (<6 m/s). Generally, the maximum flight height is no more than 1700 m, and they are easily restrained by heavy rain and flourishing vegetation [18]. According to Figure 8a, the desert locust swarms cannot continue moving northward across the Himalayas and other high mountains due to the restrictions caused by elevation (>2000 m). East India has a significantly higher precipitation (>100 mm) than that in the locust breeding areas (Figure 8b) and is widely covered by dense vegetation (Figure 8c), which will inhibit the eastward migration of locust swarms. The countries and regions near the locust swarms’ historical invasion borders, such as Nepal, Bhutan, Burma, Thailand and Yunnan Province of China, have high precipitation (>200 mm) and perennial vegetation coverage as high as 0.9 (Figure 7b,c). Thus, the arrival of locust swarms is likely to be stopped by heavy rainfall and scattered by dense vegetation. In addition, the desert locusts are likely to perish even after they migrated into the Nepal, east India and further eastwards due to the fungal growth and the natural infection promoted by the local humid tropical conditions. In this case, the chance that the desert locust swarm will migrate across the region with a high density of vegetation and continue flying into the Indochina Peninsula and Southwest China is very low. In addition, the reproduction of desert locust requires appropriate soil moisture. Figure 8d demonstrates a much moister soil in the eastern area outside the invasion border and Figure 8d demonstrates a much moister soil in this area (>0.3 m3/m3) than in the summer and winter desert locust breeding areas (<0.2 m3/m3). Besides the appropriate soil moisture, the reproduction of the desert locusts has to be in the open areas of sandy soil with very low air humidity, which are not broadly exist beyond the east India. In conclusion, there is little chance that the desert locust swarms will migrate into the Indochina Peninsula, Southeast China and the eastern areas outside the locusts’ historical invasion borders.

4. Discussion

4.1. The Importance of Long-Term Earth Observations

In this study, long-time series Earth observation data, such as remotely sensed FY-3C soil moisture images, precipitation data from GPCC and air temperature data from ECMWF, played important roles in the detection of the dynamic patterns of climatic conditions during 2018–2020 across desert locust breeding and invasion areas. In other words, a large amount of freely available Earth data provided a convenient way to map the spatial–temporal patterns of those environmental factors and then revealed the driving factors dominating the process of desert locust upsurges. Additionally, the vegetation anomalies and the average environmental variables, including precipitation, soil temperature, and vegetation coverage, in the past decade were derived and generated from long-term Earth observation data and significantly benefited the evaluation of the impacts on local vegetation and the potential risk of this desert locust upsurge. It is very likely that the increasing amount of satellite remote sensing data and meteorological observations will greatly facilitate the analysis of desert locust upsurges and other natural disasters in the future.
Despite of those advantages of the long-term Earth observation dataset and products, there are still some limitations and need to be further improved to achieve better estimates in the future. For example, the FY-3C soil moisture products are likely to overestimate the soil moisture in those areas covered by dense vegetation [30], thus different models should be established and compared to achieve more consistent soil moisture estimates in areas with green plants. There are still omissions errors with the MODIS NDVI images with a 250 m spatial resolution and could be improved using filters to better reflect the regional vegetation status. The precipitation and land surface parameters at the daily scale can be derived from the GPCC and re-analysis datasets from ECMWF. However, the spatial resolution of some commonly used datasets is low, such as the spatial resolution of the GPCC first-guess monthly product is 1.0°. Therefore, the downscaling and multivariate-based models should be developed to improve the applicability of those meteorological datasets and remotely sensing products.

4.2. Implications of This Study on Desert Locust Control

A deep understanding of desert locust upsurge mechanisms is of utmost importance for improving the accuracy of desert locust detection and building control operations to prevent locust upsurges in the future. The results of this study suggest that the frequent and heavy rainfall is likely to play a major role in the formation and migration of locust swarms. During the 2019–2020 desert upsurges, the exceptional heavy rainfalls in southwest Iran in early 2019 has strongly supported the earlier and successful spring breeding of locust swarms than normal years. The Horn of Africa also received unusually late rainfall in December 2019, which was brought by the cyclonic storm Pawan, thus promoted the breeding and multiplication of the desert locusts. Apart from that, the interior of Yemen and the south west Asia has received continuous rains under the impact of the cyclones and monsoon in 2019, respectively. Besides, the lack of in-time and effective survey and control operations in those remote areas also forced the recent locust upsurge, which indicated that the desert locust management should be further enhanced in those regions with unusual and continuous rainfalls.
Desert locusts usually gather in areas with high soil moisture and good vegetation coverage before moving to the surrounding areas when their current habitat becomes dry. This information could be considered to create more effective locust management strategies. Moreover, there is a time difference between the timing of rainfall and the swarm movement, which indicates that accurate precipitation predictions may help detect potential swarm outbreaks in advance and should be applied in future research.

4.3. Future Conditions for Desert Locust Outbreaks and Upsurges

Many researchers have linked the risk of fires and pest and pathogen outbreaks to the frequency and severity of extreme climatic events [1,34]. Considering that desert locust upsurges are closely related to climatic condition anomalies caused by more frequent tropical cyclones and depressions, we analyzed the trends in tropical cyclone and depression frequencies around the Arabian Peninsula and western India during 1990–2019 using the five-year moving average method, as shown in Figure 9. The annual frequency of cyclonic disturbances (maximum wind speed of 17 knots or more), cyclones (34 knots or more) and severe cyclones (48 knots or more) over the Bay of Bengal (BOB), Arabian Sea (AS) and land surface of India was published by the website of the India Meteorological Department (IMD) (www.imd.gov.in). According to Figure 9, an increasing trend is observed in the frequency of tropical cyclones and tropical depressions around the Arabian Peninsula and the West Indian Ocean, which will lead to more precipitation and environmental anomalies in the breeding areas of the desert locusts. If this trend continues as part of climate change, conditions are likely to become increasingly suitable for desert locust upsurges, which means that the sensitivity of the disaster warning system should be enhanced, and more effective prevention and control measures will need to be developed.

4.4. Study Limitations and Uncertainty

Although multiple environmental factors associated with desert locust breeding, development, multiplication, gregarization and migration, as well as the biological characteristics of desert locusts, have been analyzed in this study, our current analyzes and results are qualitative. The numerical analysis between the locusts’ activities and those climatic conditions were not conducted in this study, due to the fact that the movement and population of the desert locust was comprehensively affected by many other factors, especially the control and management strategies. Besides, there was an uncertain time lagging, which could be two or three months, between the arrival of locusts and the visible vegetation losses on the satellite images. Those issues could cause uncertainties for the quantitative correlation analysis in this study. Apart from those uncertainties, the quantitative analysis was also limited by the lack of high-quality and long-term survey data. More survey data, such as egg density, which is closely related to swarm size, should be considered to accurately and quantitatively assess the impact of desert locust swarms. The accuracy and resolution of various Earth observation datasets should be further improved as input variables. Meanwhile, some factors, such as the complex mechanism by which desert locusts respond and adapt to extreme climatic events, were not considered when evaluating the chances of desert locusts migrating to the Indochina Peninsula and Southwest China. Hence, genetically evolved desert locusts or extreme drought events outside the invasion boundary would undisputedly promote the expansion of the swarms. Therefore, a deep understanding of the relationship between locust upsurges and multiple variables is needed, and a comprehensive time series analysis approach should be employed to forecast the occurrence and potential risk from desert locust upsurges in the future and support global food security measures.

5. Conclusions

This study applied heterogeneous Earth observation data to analyze the contributions of climatic anomalies, impacts on the local vegetation and the growing trend of the recent desert locust upsurge. The results showed that a sequence of higher-than-normal precipitation, air temperature and soil moisture during 2018-2020 provided a favorable environment for a number of successive generations of desert locust breeding that led to the observed locust upsurge in East Africa and West Asia in early 2020. Among those regions affected by desert locust swarms, Kenya, Ethiopia, Somalia and the Indo-Pakistan border areas have suffered the most. The vegetation losses in East Africa countries have greatly worsened since March 2020, and South and West Africa are still being threatened. The desert locust crisis in West Asia originated from the summer breeding area along the Indo-Pakistan border and destroyed numerous vegetation in this region from December 2019 to February 2020, although the situation has been alleviated since March 2020. The biological characteristics of the desert locust, along with the historical climatic condition patterns across the study area (part III), were comprehensively analyzed. The results show that locust swarms are likely to be restrained by high mountains, heavy rainfall, dense vegetation and unfavorable soil moisture; thus, have little chance of entering the Indochina Peninsula and Southwest China. In addition, the frequencies of tropical cyclones and depressions in the western Indian Ocean have fluctuated over the past 30 years and showed an increasing trend in recent years, which demonstrated that East Africa may be threatened and affected by severe desert locust outbreaks and upsurges more often in the future.

Author Contributions

Conceptualization, L.W. and S.F.; methodology, S.F.; software, L.W.; formal analysis, L.W.; resources, W.H.; data curation, Z.P. and X.T.; writing—original draft preparation, L.W.; writing—review and editing, S.F.; visualization, W.Z.; supervision, S.F.; funding acquisition, S.F. All authors have read and agreed to the published version of the manuscript.

Funding

This research was funded by Ministry of Science and Technology of the People’s Republic of China, grant number 2019YFC1510205. The APC was funded by Chinese Academy of Meteorological Sciences, grand number 2019Z010.

Institutional Review Board Statement

Not applicable.

Informed Consent Statement

Not applicable.

Data Availability Statement

Not applicable.

Acknowledgments

This manuscript was supported by the National Key Research and Development Programs of China under Grant 2019YFC1510205 and the Fundamental Research Fund of Chinese Academy of Meteorological Sciences under Grant 2019Z010.

Conflicts of Interest

The authors declare no conflict of interest.

References

  1. Middleton, N.J.; Sternberg, T. Climate hazards in drylands: A review. Earth-Sci. Rev. 2013, 126, 48–57. [Google Scholar] [CrossRef]
  2. Zhang, L.; Lecoq, M.; Latchininsky, A.; Hunter, D. Locust and Grasshopper Management. Ann. Rev. Entomol. 2019, 64, 15–34. [Google Scholar] [CrossRef] [PubMed]
  3. Arnold, v.H.; Cressman, K.; Magor, J.I. Preventing desert locust plagues: Optimizing management interventions. Entomol. Experiment. Appl. 2007, 122, 191–214. [Google Scholar] [CrossRef]
  4. Madeleine, S. A Plague of Locusts has Descendedon East Africa. Climate Change May Be to Blame. Available online: https://www.nationalgeographic.com/science/2020/02/locust-plague-climate-science-east-africa/ (accessed on 1 January 2021).
  5. Vallebona, C.; Genesio, L.; Crisci, A.; Pasqui, M.; Vecchia, A.D.; Maracchi, G. Large-scale climatic patterns forcing desert locust upsurges in West Africa. Clim. Res. 2008, 37, 35–41. [Google Scholar] [CrossRef]
  6. Wang, B.; Deveson, E.D.; Waters, C.; Spessa, A.; Lawton, D.; Feng, P.; Liu, D.L. Future climate change likely to reduce the Australian plague locust (Chortoicetes terminifera) seasonal outbreaks. Sci. Total. Environ. 2019, 668, 947–957. [Google Scholar] [CrossRef]
  7. Tian, H.; Stige, L.C.; Cazelles, B.; Kausrud, K.L.; Svarverud, R.; Stenseth, N.C.; Zhang, Z. Reconstruction of a 1,910-y-long locust series reveals consistent associations with climate fluctuations in China. Proc. Natl. Acad. Sci. USA 2011, 108, 14521–14526. [Google Scholar] [CrossRef] [PubMed] [Green Version]
  8. Meynard, C.N.; Lecoq, M.; Chapuis, M.P.; Piou, C. On the relative role of climate change and management in the current desert locust outbreak in East Africa. Glob. Chang. Biol. 2020, 26, 3753–3755. [Google Scholar] [CrossRef] [PubMed]
  9. Tratalos, J.A.; Cheke, R.A.; Healey, R.G.; Stenseth, N.C. Desert locust populations, rainfall and climate change: Insights from phenomenological models using gridded monthly data. Clim. Res. 2010, 43, 229–239. [Google Scholar] [CrossRef]
  10. Veran, S.; Simpson, S.J.; Sword, G.A.; Deveson, E.; Piry, S.; Hins, J.E.; Berthier, K. Modeling spatiotemporal dynamics of outbreaking species: Influence of environment and migration in a locust. Ecology 2015, 96, 737–748. [Google Scholar] [CrossRef] [Green Version]
  11. Dinku, T.; Ceccato, P.; Cressman, K.; Connor, S.J. Evaluating Detection Skills of Satellite Rainfall Estimates over Desert Locust Recession Regions. J. Appl. Meteorol. Clim. 2010, 49, 1322–1332. [Google Scholar] [CrossRef]
  12. Gómez, D.; Salvador, P.; Sanz, J.; Casanova, C.; Taratiel, D.; Casanova, J.L. Machine learning approach to locate desert locust breeding areas based on ESA CCI soil moisture. J. Appl. Remote Sens. 2018, 12, 036011. [Google Scholar] [CrossRef] [Green Version]
  13. Escorihuela, M.J.; Merlin, O.; Stefan, V.; Moyano, G.; Eweys, O.A.; Zribi, M.; Kamara, S.; Benahi, A.S.; Ebbe, M.A.B.; Chihrane, J.; et al. SMOS based high resolution soil moisture estimates for desert locust preventive management. Remote Sens. Appl. Soc. Environ. 2018, 11, 140–150. [Google Scholar] [CrossRef]
  14. Piou, C.; Gay, P.-E.; Benahi, A.S.; Ebbe, M.A.O.B.; Chihrane, J.; Ghaout, S.; Cisse, S.; Diakite, F.; Lazar, M.; Cressman, K.; et al. Soil moisture from remote sensing to forecast desert locust presence. J. Appl. Ecol. 2018, 45, 966–975. [Google Scholar] [CrossRef]
  15. Latchininsky, A.V. Locusts and remote sensing: A review. J. Appl. Remote Sens. 2013, 7, 075099. [Google Scholar] [CrossRef] [Green Version]
  16. Hielkema, J.U.; Roffey, J.; Tucker, C.J. Assessment of ecological conditions associated with the 1980/81 desert locust plague upsurge in West Africa using environmental satellite data. Int. J. Remote Sens. 1986, 7, 1609–1622. [Google Scholar] [CrossRef]
  17. Meynard, C.N.; Gay, P.E.; Lecoq, M.; Foucart, A.; Piou, C.; Chapuis, M.P. Climate-driven geographic distribution of the desert locust during recession periods: Subspecies’ niche differentiation and relative risks under scenarios of climate change. Glob. Chang. Biol. 2017, 23, 4739–4749. [Google Scholar] [CrossRef] [PubMed]
  18. Symmons, P.M.; Cressman, K. Desert Locust Guidelines; Food Agriculture Organization of the United Nations: Rome, Italy, 2001. [Google Scholar]
  19. Shroder, J.F.; Sivanpillai, R. Biological and Environmental Hazards, Risks, and Disasters; Elsevier: Amsterdam, The Netherlands, 2015; Chapter 4. [Google Scholar]
  20. Roffey, J.; Popov, G. Environmental and Behavioural Processes in a Desert Locust Outbreak. Nature 1968, 219, 446–450. [Google Scholar] [CrossRef]
  21. Pener, M.P.; Simpson, S.J. Locust Phase Polyphenism: An Update. Adv. Insect Physiol. 2009, 36, 1–272. [Google Scholar] [CrossRef]
  22. Kiage, L.M.; Liu, K. Palynological evidence of climate change and land degradation in the Lake Baringo area, Kenya, East Africa, since AD 1650. Palaeogeogr. Palaeoclim. Palaeoecol. 2009, 279, 60–72. [Google Scholar] [CrossRef]
  23. Schneider, U.; Becker, A.; Finger, P.; Meyer-Christoffer, A.; Ziese, M.; Rudolf, B. GPCC’s new land surface precipitation climatology based on quality-controlled in situ data and its role in quantifying the global water cycle. Theor. Appl. Climatol. 2014, 115, 15–40. [Google Scholar] [CrossRef] [Green Version]
  24. Becker, A.; Finger, P.; Meyer-Christoffer, A.; Rudolf, B. A description of the global land-surface precipitation data products of the Global Precipitation Climatology Centre with sample applications including centennial (trend) analysis from 1901 Cpresent. Earth Syst. Sci. Data Discuss. 2013, 5. [Google Scholar] [CrossRef] [Green Version]
  25. Schneider, U.; Becker, A.; Finger, P.; Meyer-Christoffer, A.; Ziese, M. GPCC Full Data Monthly Product Version 2018 at 0.25°: Monthly Land-Surface Precipitation from Rain-Gauges built on GTS-based and Historical Data. 2018. Available online: https://www.dante-project.org/datasetPages/gpcc (accessed on 18 April 2019).
  26. Ziese, M.; Becker, A.; Finger, P.; Meyer-Christoffer, A.; Rudolf, B.; Schneider, U. GPCC First Guess Product at 1.0°: Near Real-Time First Guess monthly Land-Surface Precipitation from Rain-Gauges based on SYNOP Data. Available online: https://opendata.dwd.de/climate_environment/GPCC/html/download_gate.html (accessed on 18 April 2019).
  27. Hersbach, H.; Bell, B.; Berrisford, P.; Hirahara, S.; Horanyi, A.; Munoz-Sabater, J.; Nicolas, J.; Peubey, C.; Radu, R.; Schepers, D.; et al. The ERA5 global reanalysis. Q. J. R. Meteorol. Soc. 2020, 1–51. [Google Scholar] [CrossRef]
  28. Sabaghya, S.; Walker, J.P.; Renzullo, L.J.; Jackson, T.J. Spatially enhanced passive microwave derived soil moisture: Capabilities and opportunities. Remote Sens. Environ. 2018, 209, 551–580. [Google Scholar] [CrossRef]
  29. Zhu, Y.; Li, X.; Pearson, S.; Wu, D.; Sun, R.; Johnson, S.; Wheeler, J.; Fang, S. Evaluation of Fengyun-3C soil moisture products using in-Situ data from the Chinese Automatic Soil moisture Observation Stations: A case study in Henan Province, China. Water 2019, 11, 248. [Google Scholar] [CrossRef] [Green Version]
  30. Wang, L.; Fang, S.; Pei, Z.; Zhu, Y.; Dao Nguyen, K.; Han, W. Using FengYun-3C VSM Data and Multivariate Models to Estimate Land Surface Soil Moisture. Remote Sens. 2020, 12, 1038. [Google Scholar] [CrossRef] [Green Version]
  31. Brown, J.F.; Howard, D.; Wylie, B.; Frieze, A.; Ji, L.; Gacke, C. Application-Ready Expedited MODIS Data for Operational Land Surface Monitoring of Vegetation Condition. Remote Sens. 2015, 7, 16226–16240. [Google Scholar] [CrossRef] [Green Version]
  32. Hayakawa, Y.S.; Oguchi, T.; Zhou, L. Comparison of new and existing global digital elevation models: ASTER G-DEM and SRTM-3. Geophys. Res. Lett. 2008, 35. [Google Scholar] [CrossRef]
  33. Danielson, J.; Gesch, D. Global Multi-Resolution Terrain Elevation Data 2010 (GMTED2010); U.S. Geological Survey Open-File Report 2011-1073; US Department of the Interior, US Geological Survey: Washington, DC, USA, 2011; 26p.
  34. Easterling, W.E.; Aggarwal, P.K.; Batima, P.; Brander, K.M.; Erda, L.; Howden, S.M.; Kirilenko, A.; Morton, J.; Soussana, J.-F.; Schmidhuber, J.; et al. Food, fibre and forest products. In Climate Change 2007: Impacts, Adaptation and Vulnerability. Contribution of Working Group II to the Fourth Assessment Report of the Intergovernmental Panel on Climate Change; Parry, M.L., Canziani, O.F., Palutikof, J.P., van der Linden, P.J., Hanson, C.E., Eds.; Cambridge University Press: Cambridge, UK, 2007; pp. 273–313. [Google Scholar]
Figure 1. The spatial distribution of the annual rainfall in the breeding area, recession area and invasion area of the African desert locust.
Remotesensing 13 00680 g001
Figure 2. Precipitation and its percentage ratio over part I of the study area during 2018–2020.
Remotesensing 13 00680 g002
Figure 3. Air temperature and its anomaly over part I of the study area during 2018–2019.
Remotesensing 13 00680 g003aRemotesensing 13 00680 g003b
Figure 4. Air temperature and its percentage ratio over part I of the study area during 2018–2019.
Remotesensing 13 00680 g004
Figure 5. Soil moisture over part I of the study area during 2019–2020.
Remotesensing 13 00680 g005aRemotesensing 13 00680 g005bRemotesensing 13 00680 g005c
Figure 6. Spatial–temporal patterns of NDVI anomalies in E-S-K border region from December 2019 to May 2020.
Remotesensing 13 00680 g006aRemotesensing 13 00680 g006b
Figure 7. Spatial–temporal patterns of the NDVI anomalies near the Indo-Pakistan border from July 2019 to May 2020.
Remotesensing 13 00680 g007aRemotesensing 13 00680 g007b
Figure 8. The spatial distribution of climatic factors near the southwest border of China during 2008–2019.
Remotesensing 13 00680 g008
Figure 9. Trend in tropical cyclone and depression frequencies during 1990–2019; the trend line is the five-year moving average.
Remotesensing 13 00680 g009
Publisher’s Note: MDPI stays neutral with regard to jurisdictional claims in published maps and institutional affiliations.

