
An Assessment of the Filling Process of the Grand Ethiopian Renaissance Dam and Its Impact on the Downstream Countries

 ,
,  ,
,  ,
,  , ,
, ,
Abstract
:
1. Introduction
2. Data and Methods
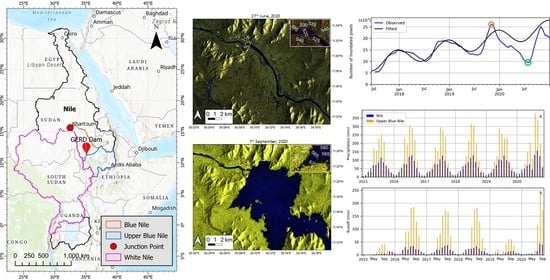
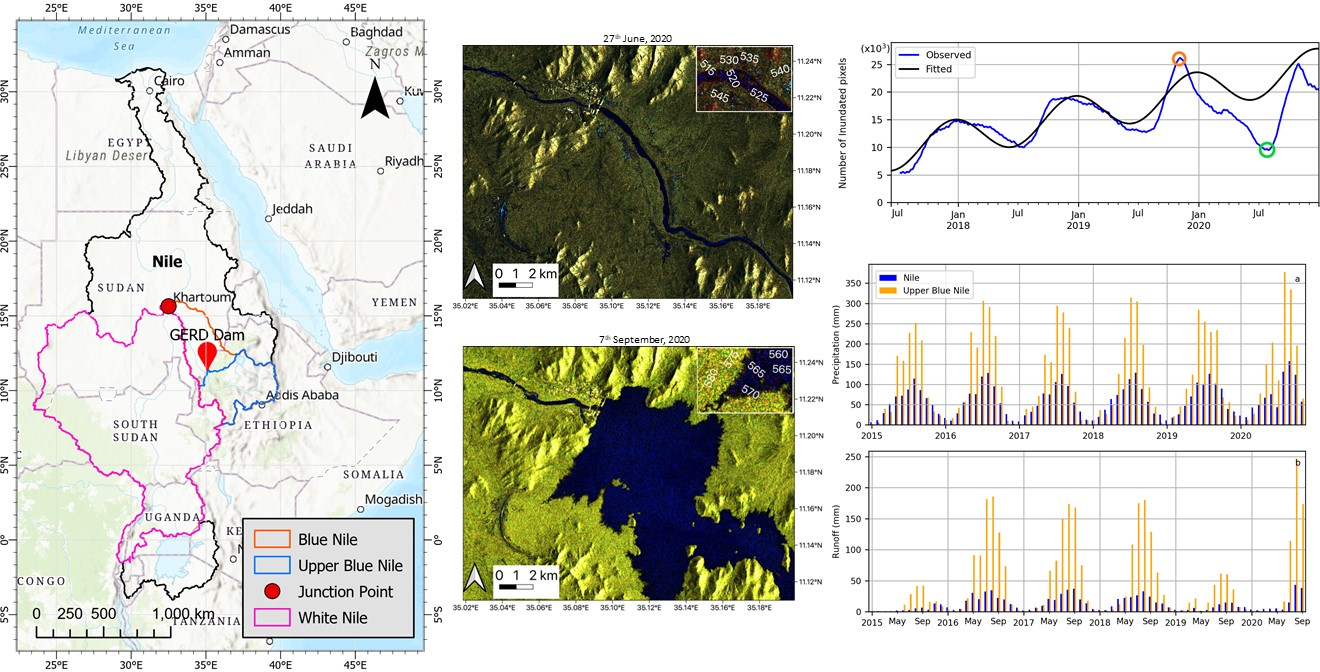
2.1. Study Area
2.2. Data
2.2.1. Satellite Synthetic Aperture Radar and Optical Imagery
2.2.2. SRTM DEM
2.2.3. GPM Precipitation
2.2.4. GRACE Total Water Storage
2.2.5. GLDAS Runoff
2.3. Methods
2.3.1. SAR Image Processing
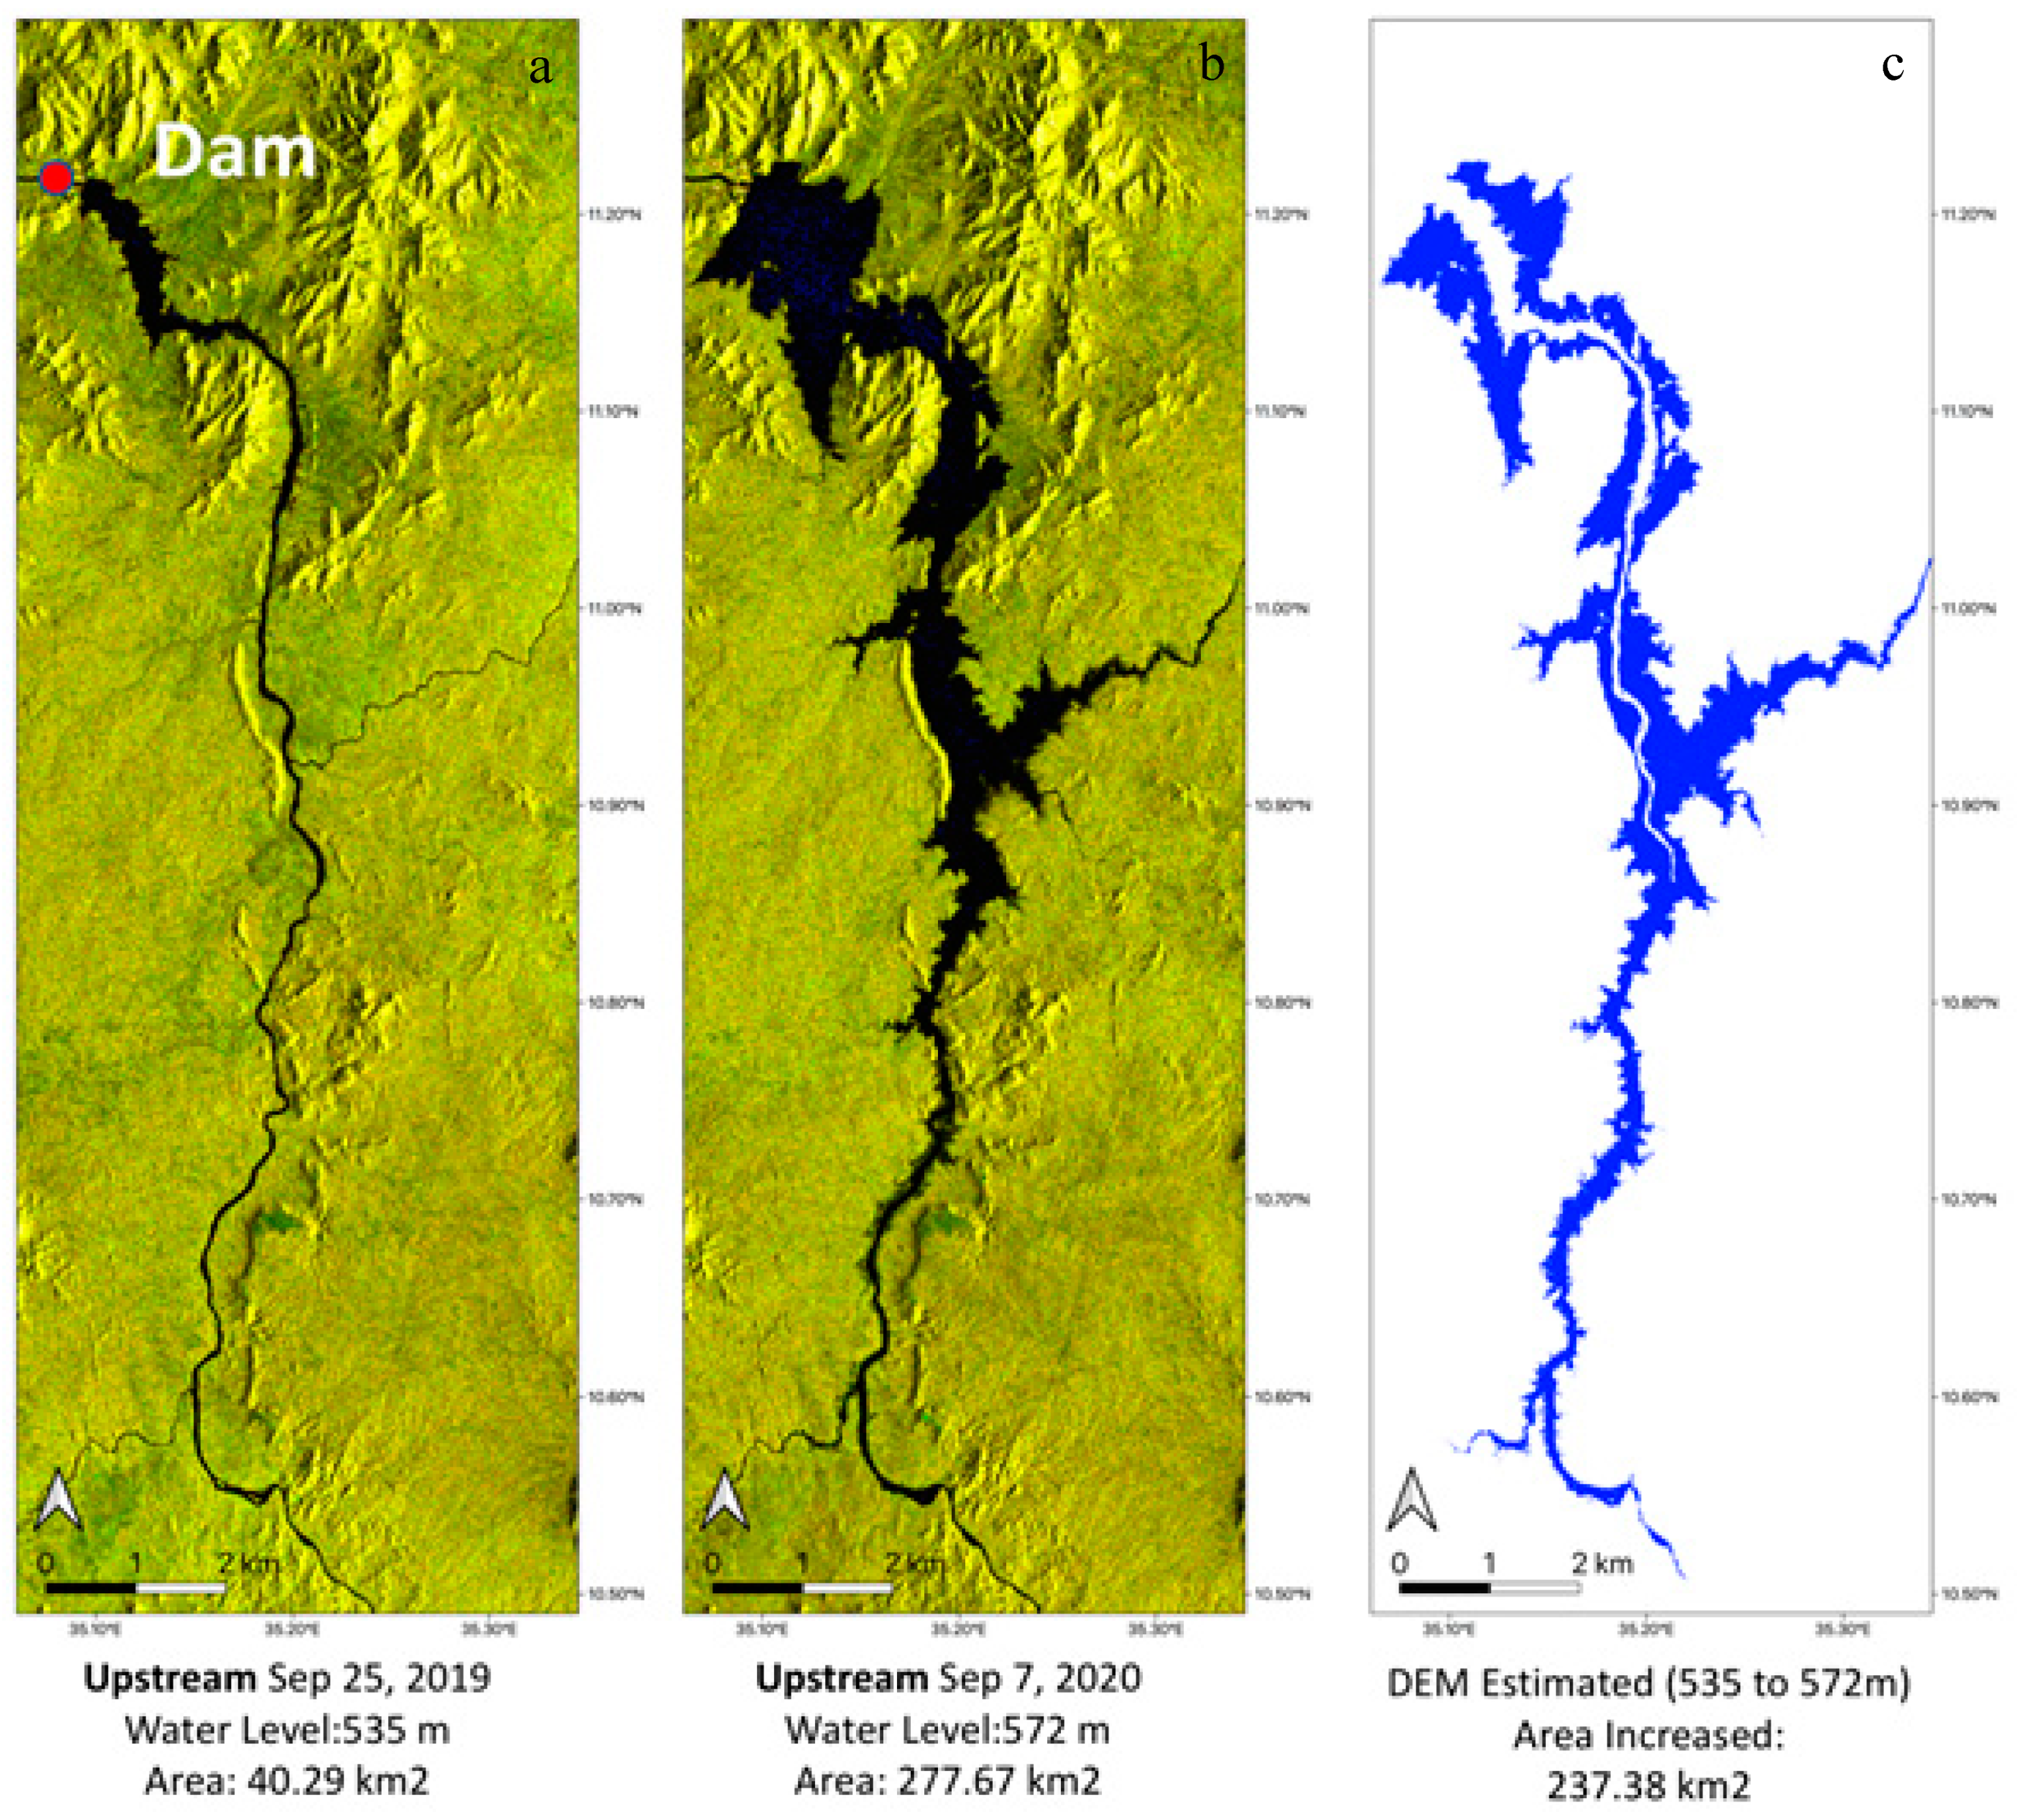
2.3.2. DEM-Based Estimation of Reservoir Extent
2.3.3. Precipitation, Runoff and LWE (GRACE) Analysis
3. Results
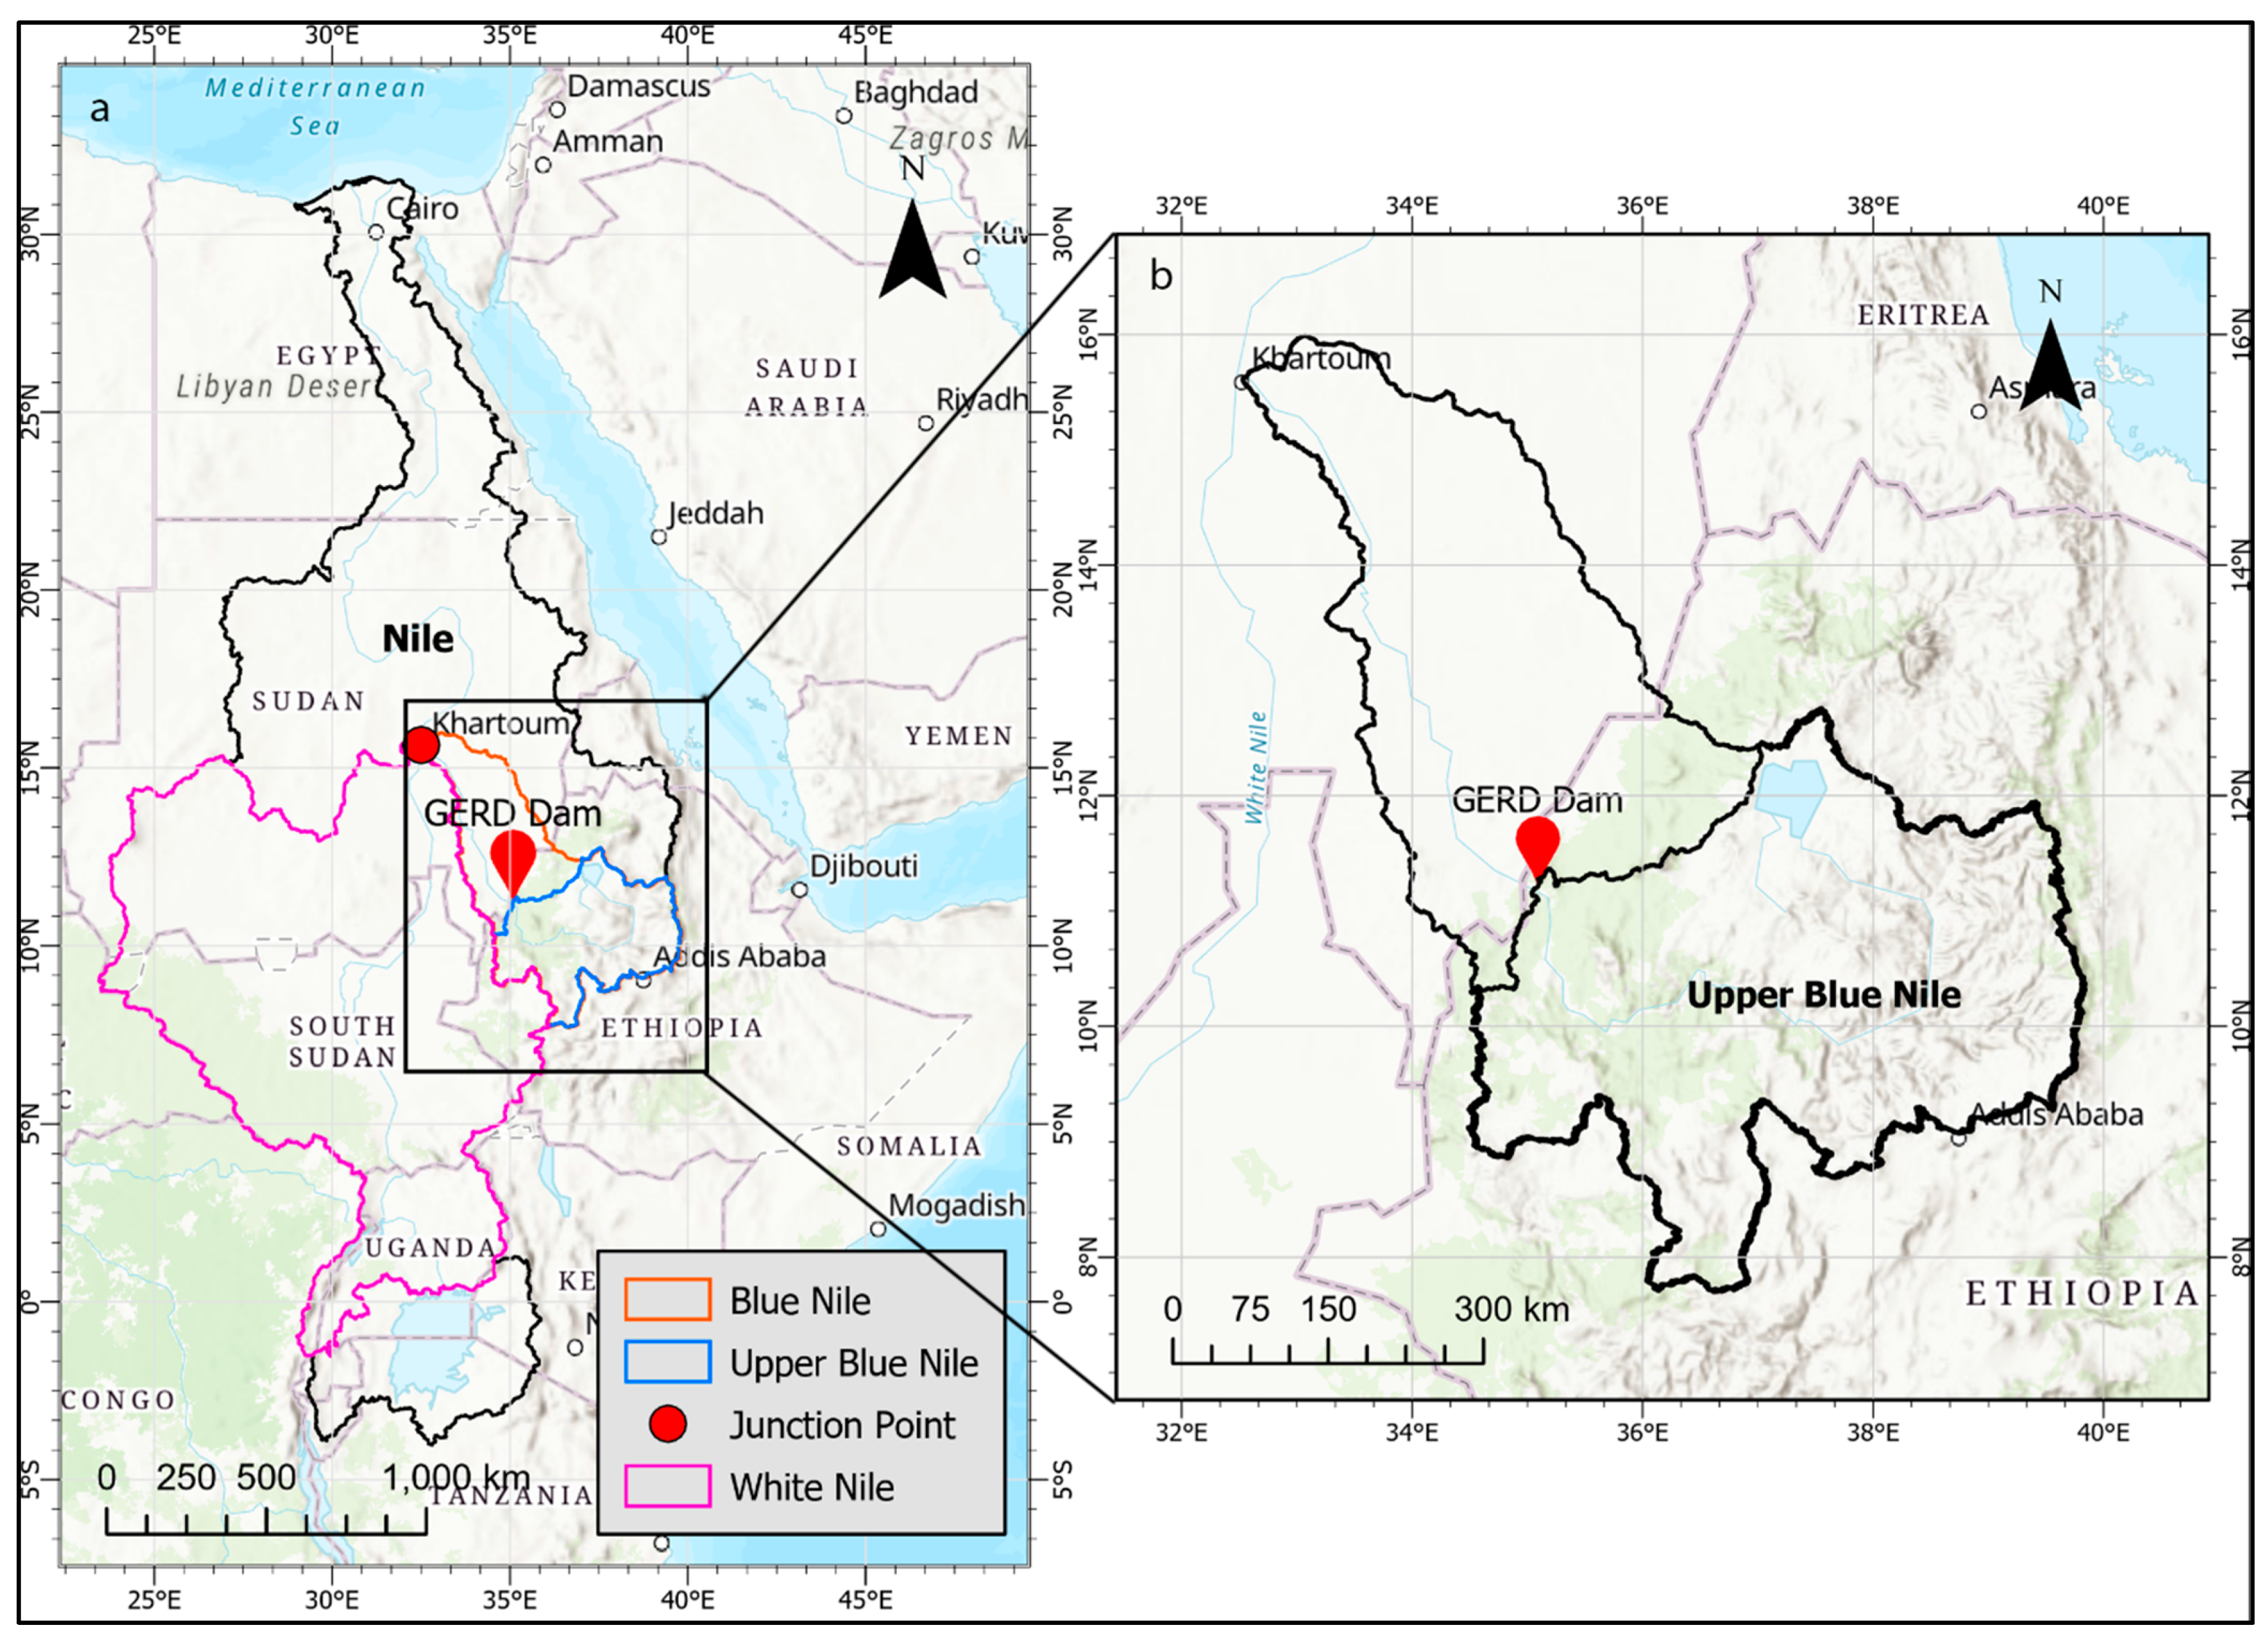
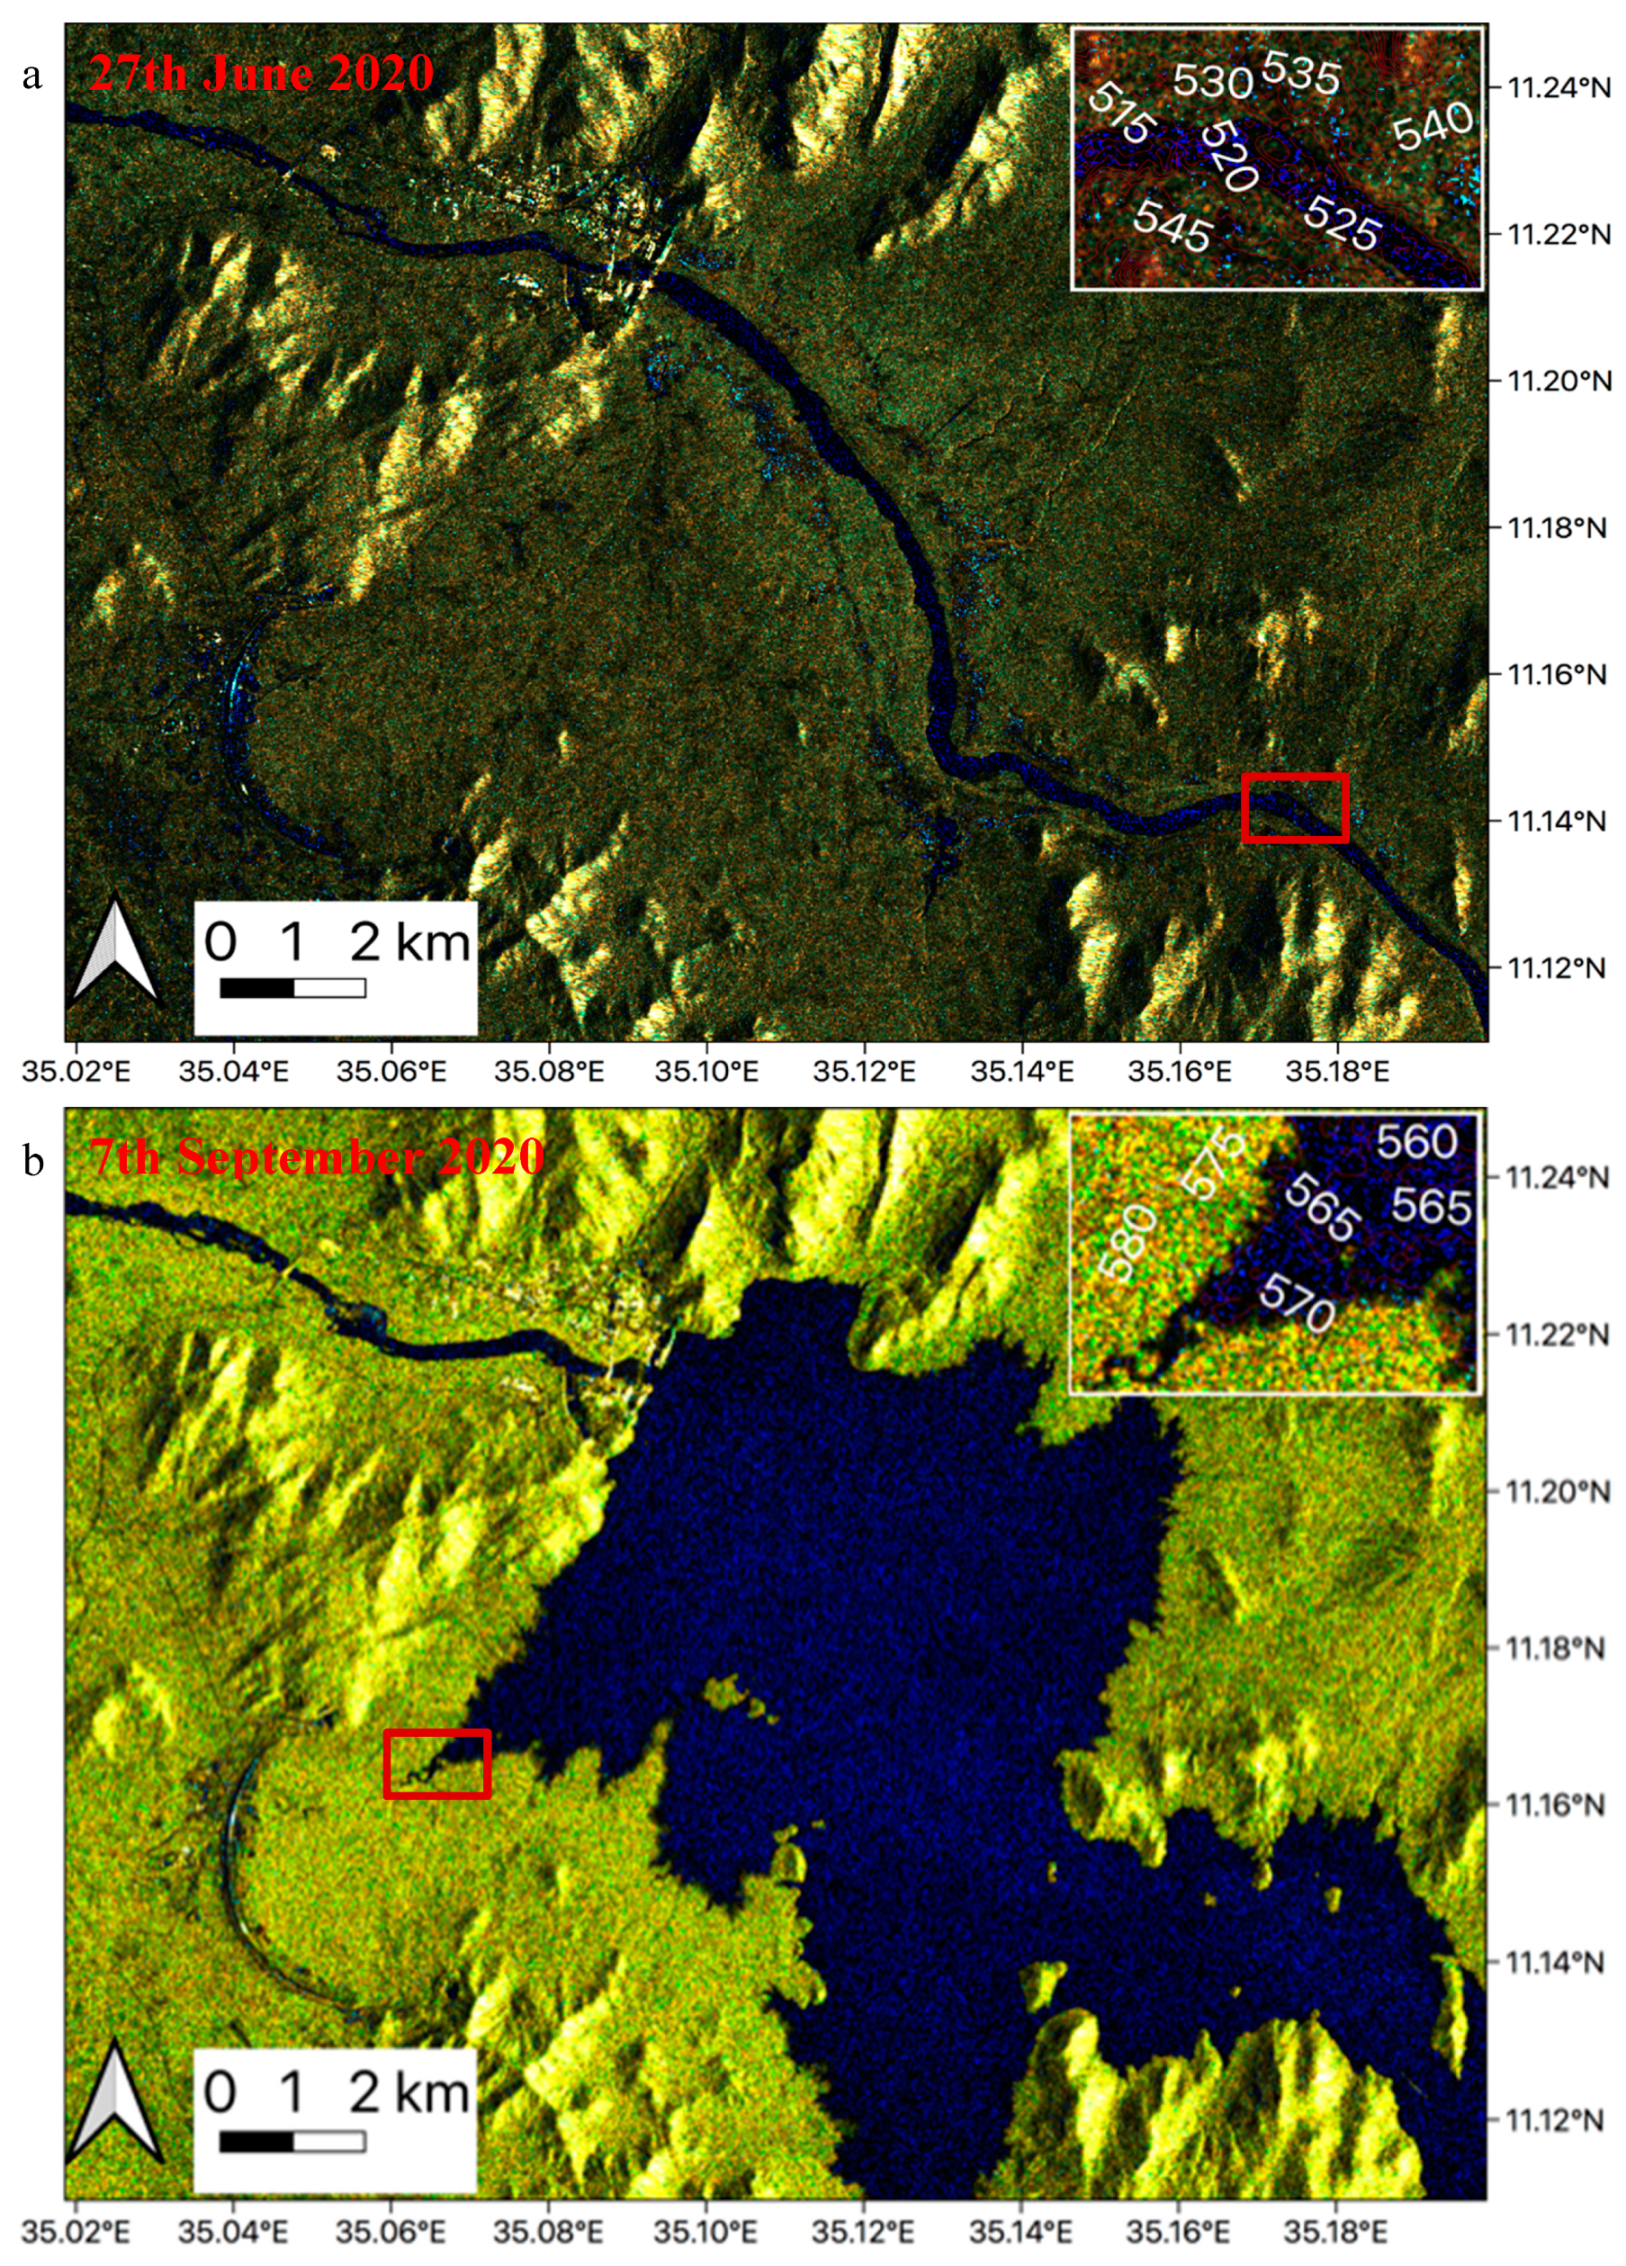
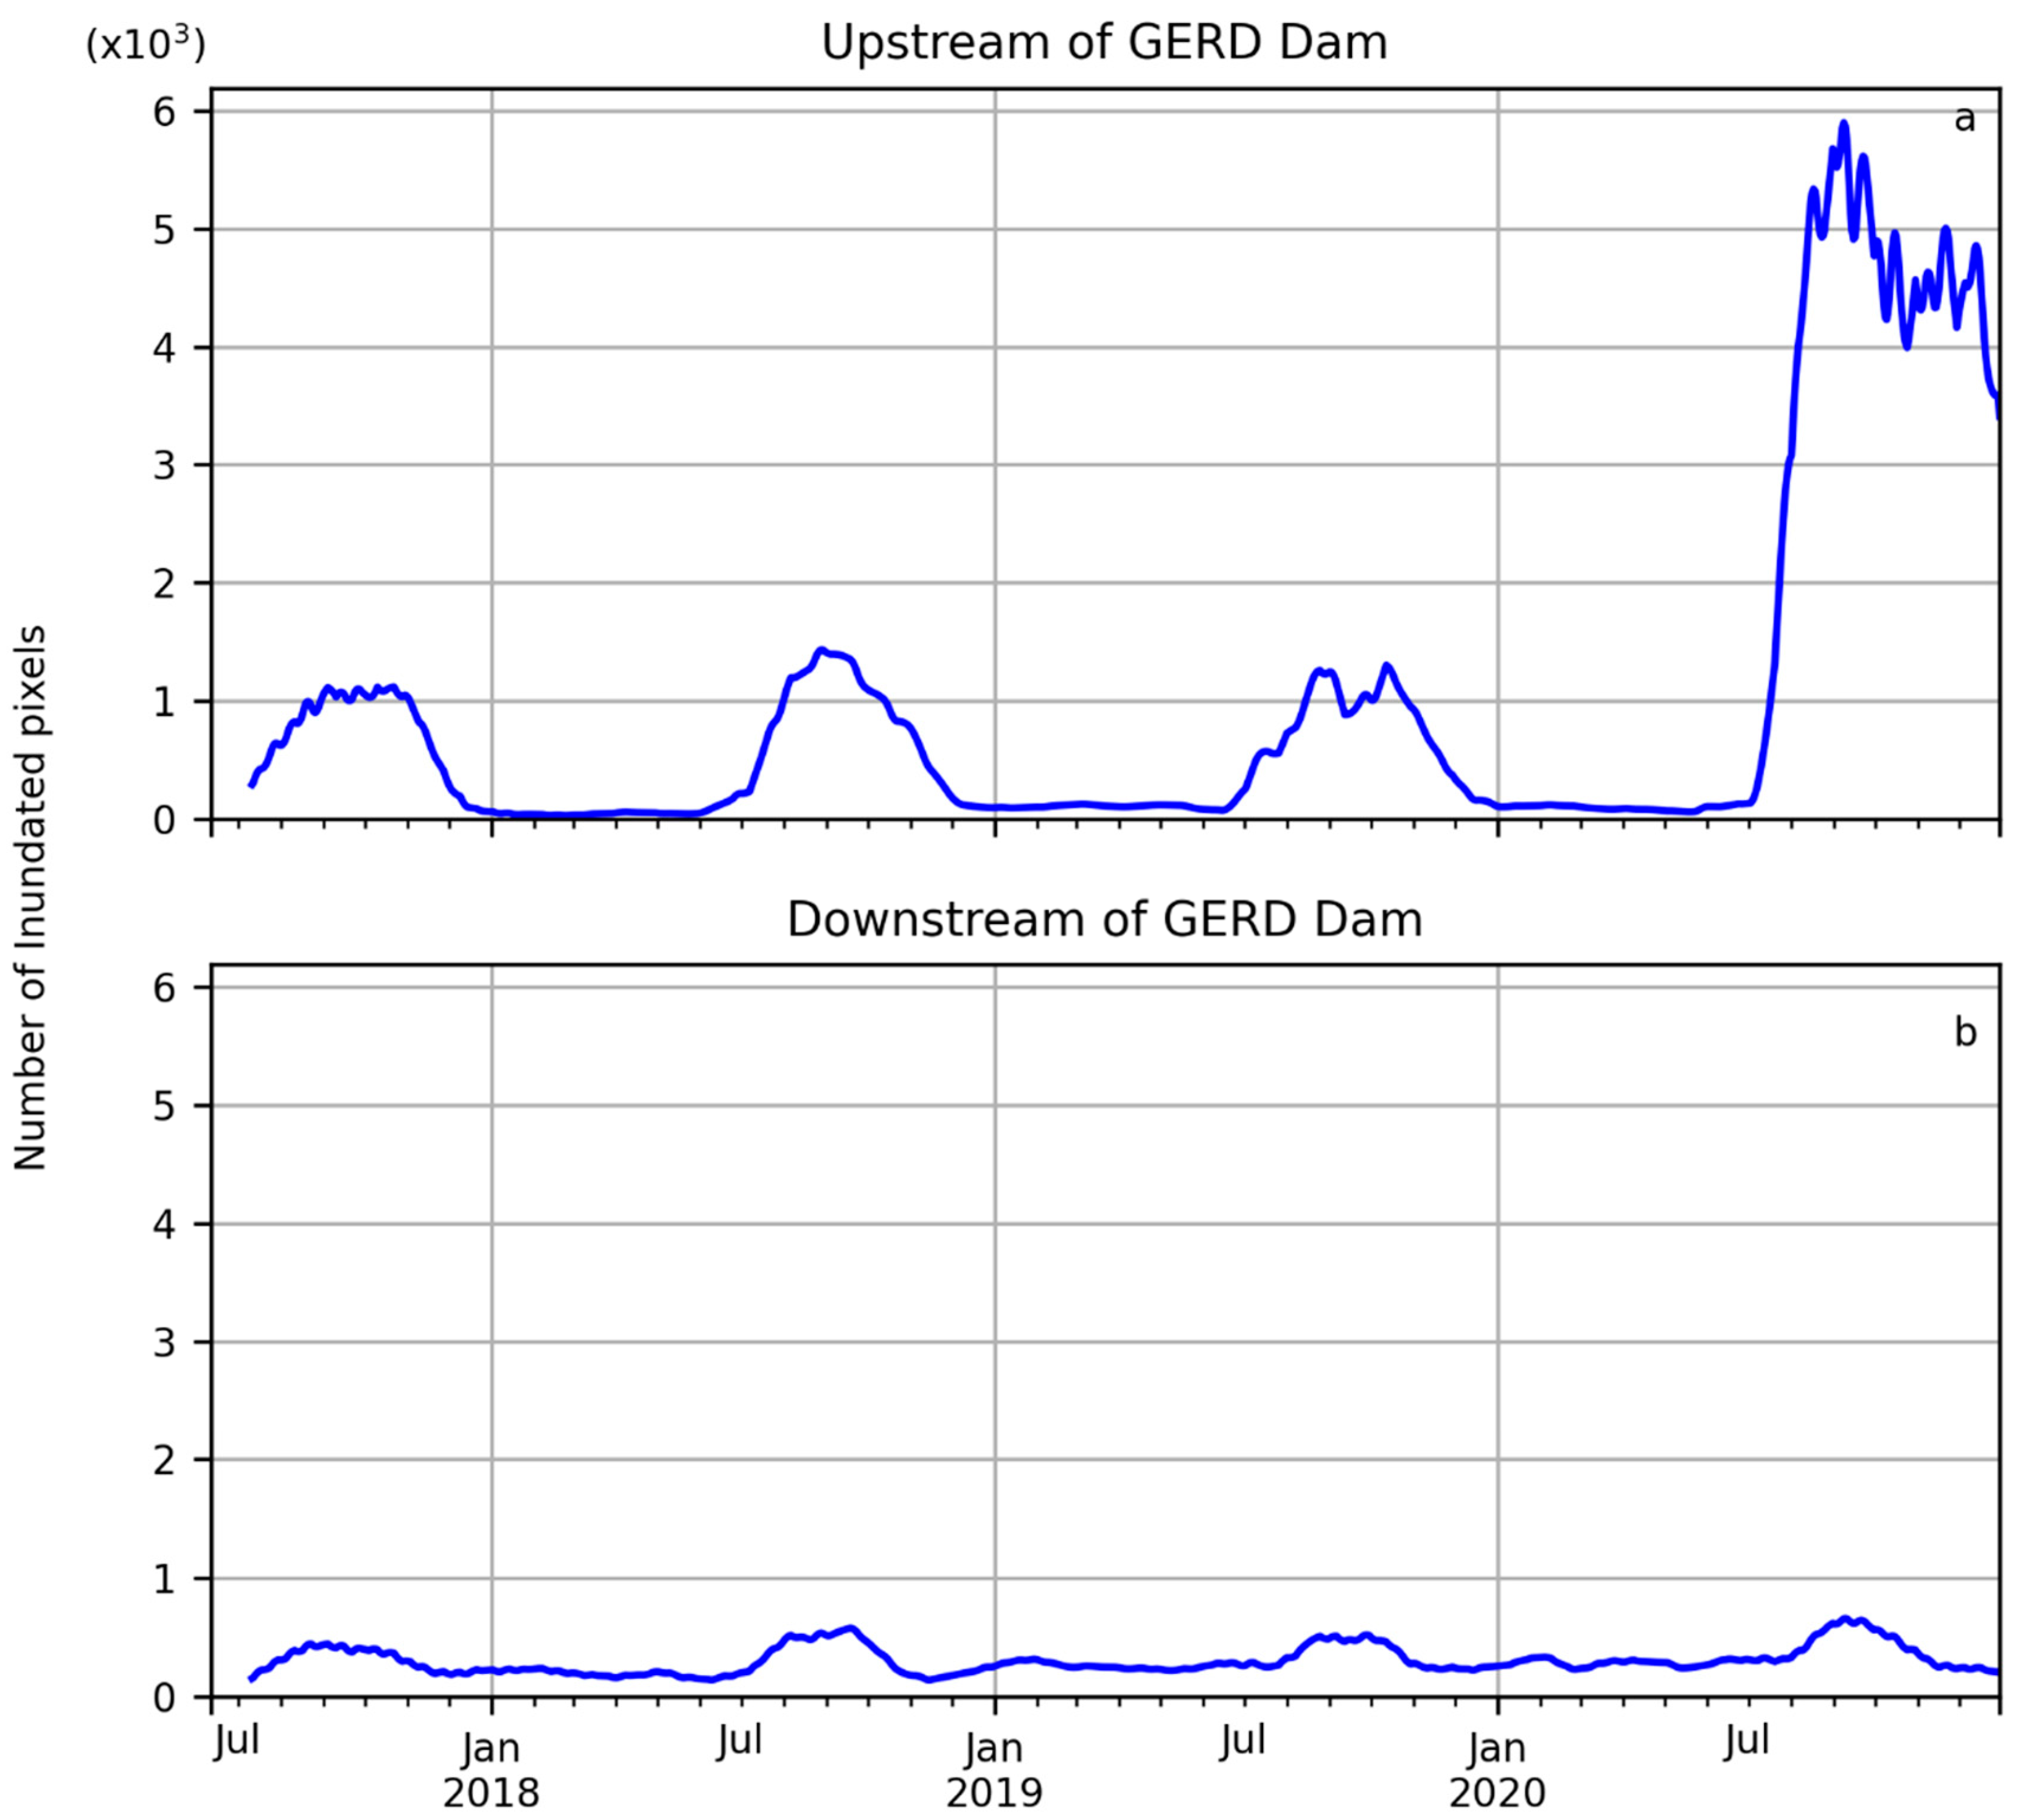
3.1. The Monitoring of the Dam Filling
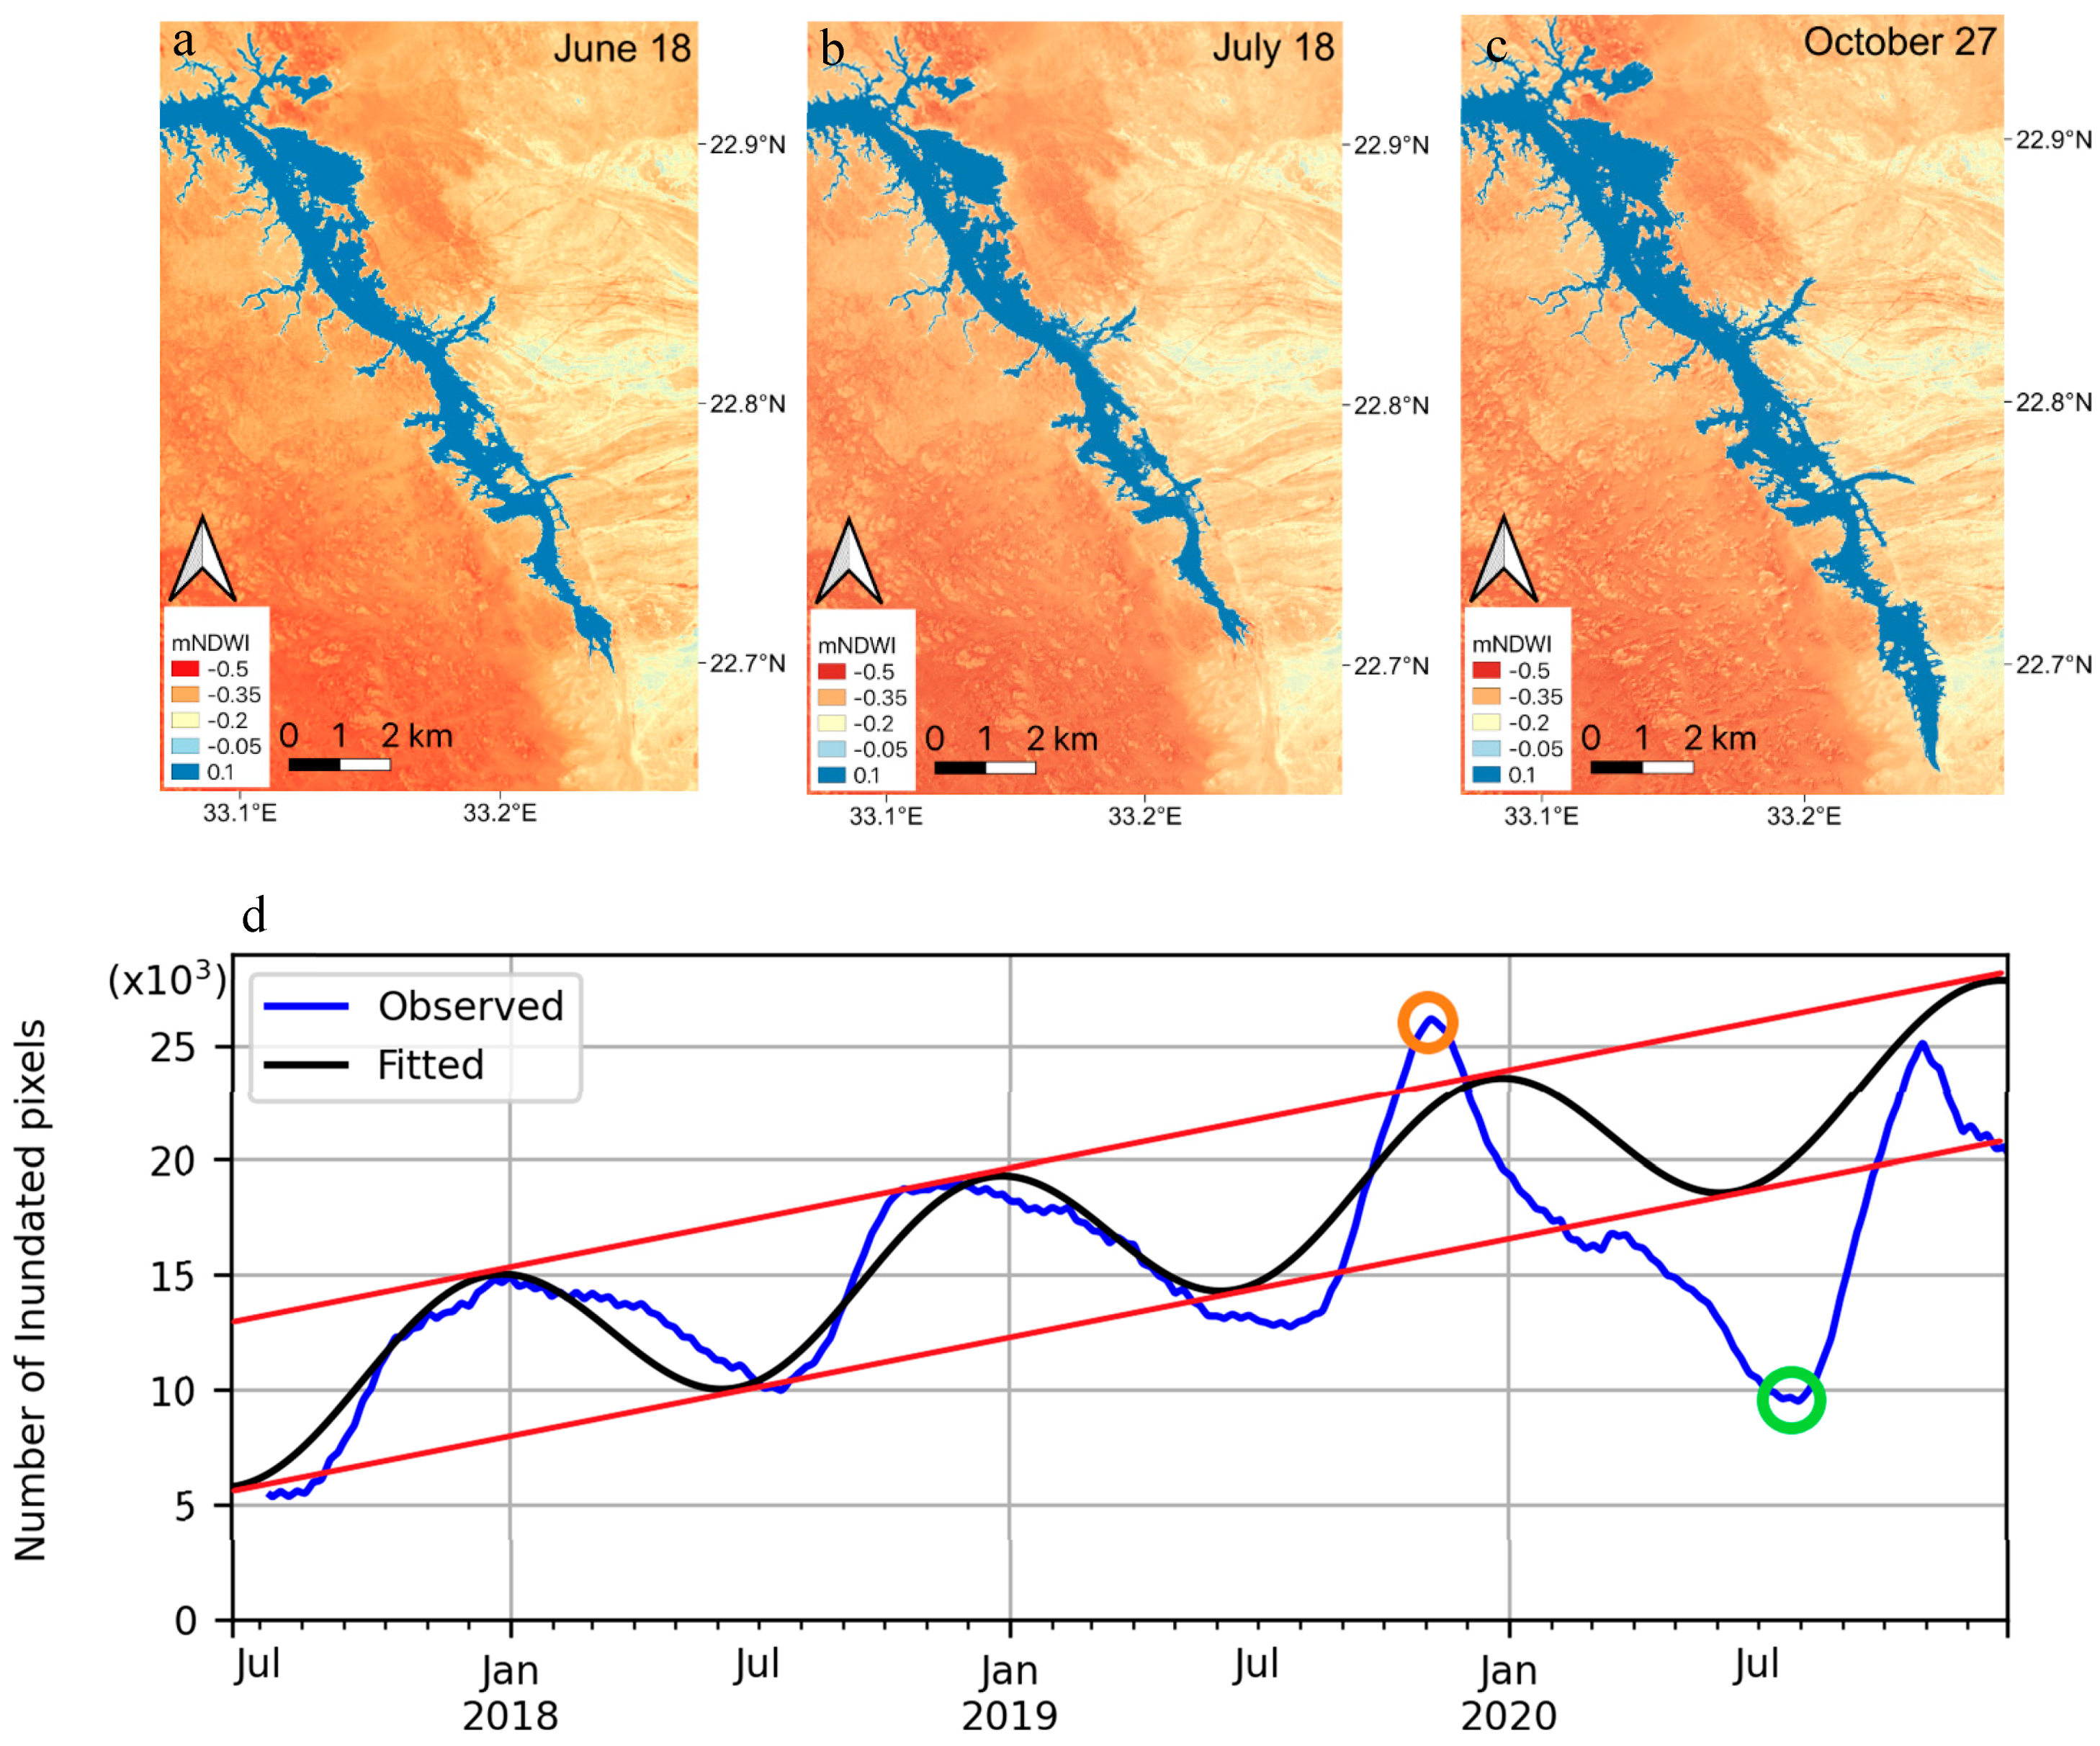
3.2. Downstream Impact of Dam Filling
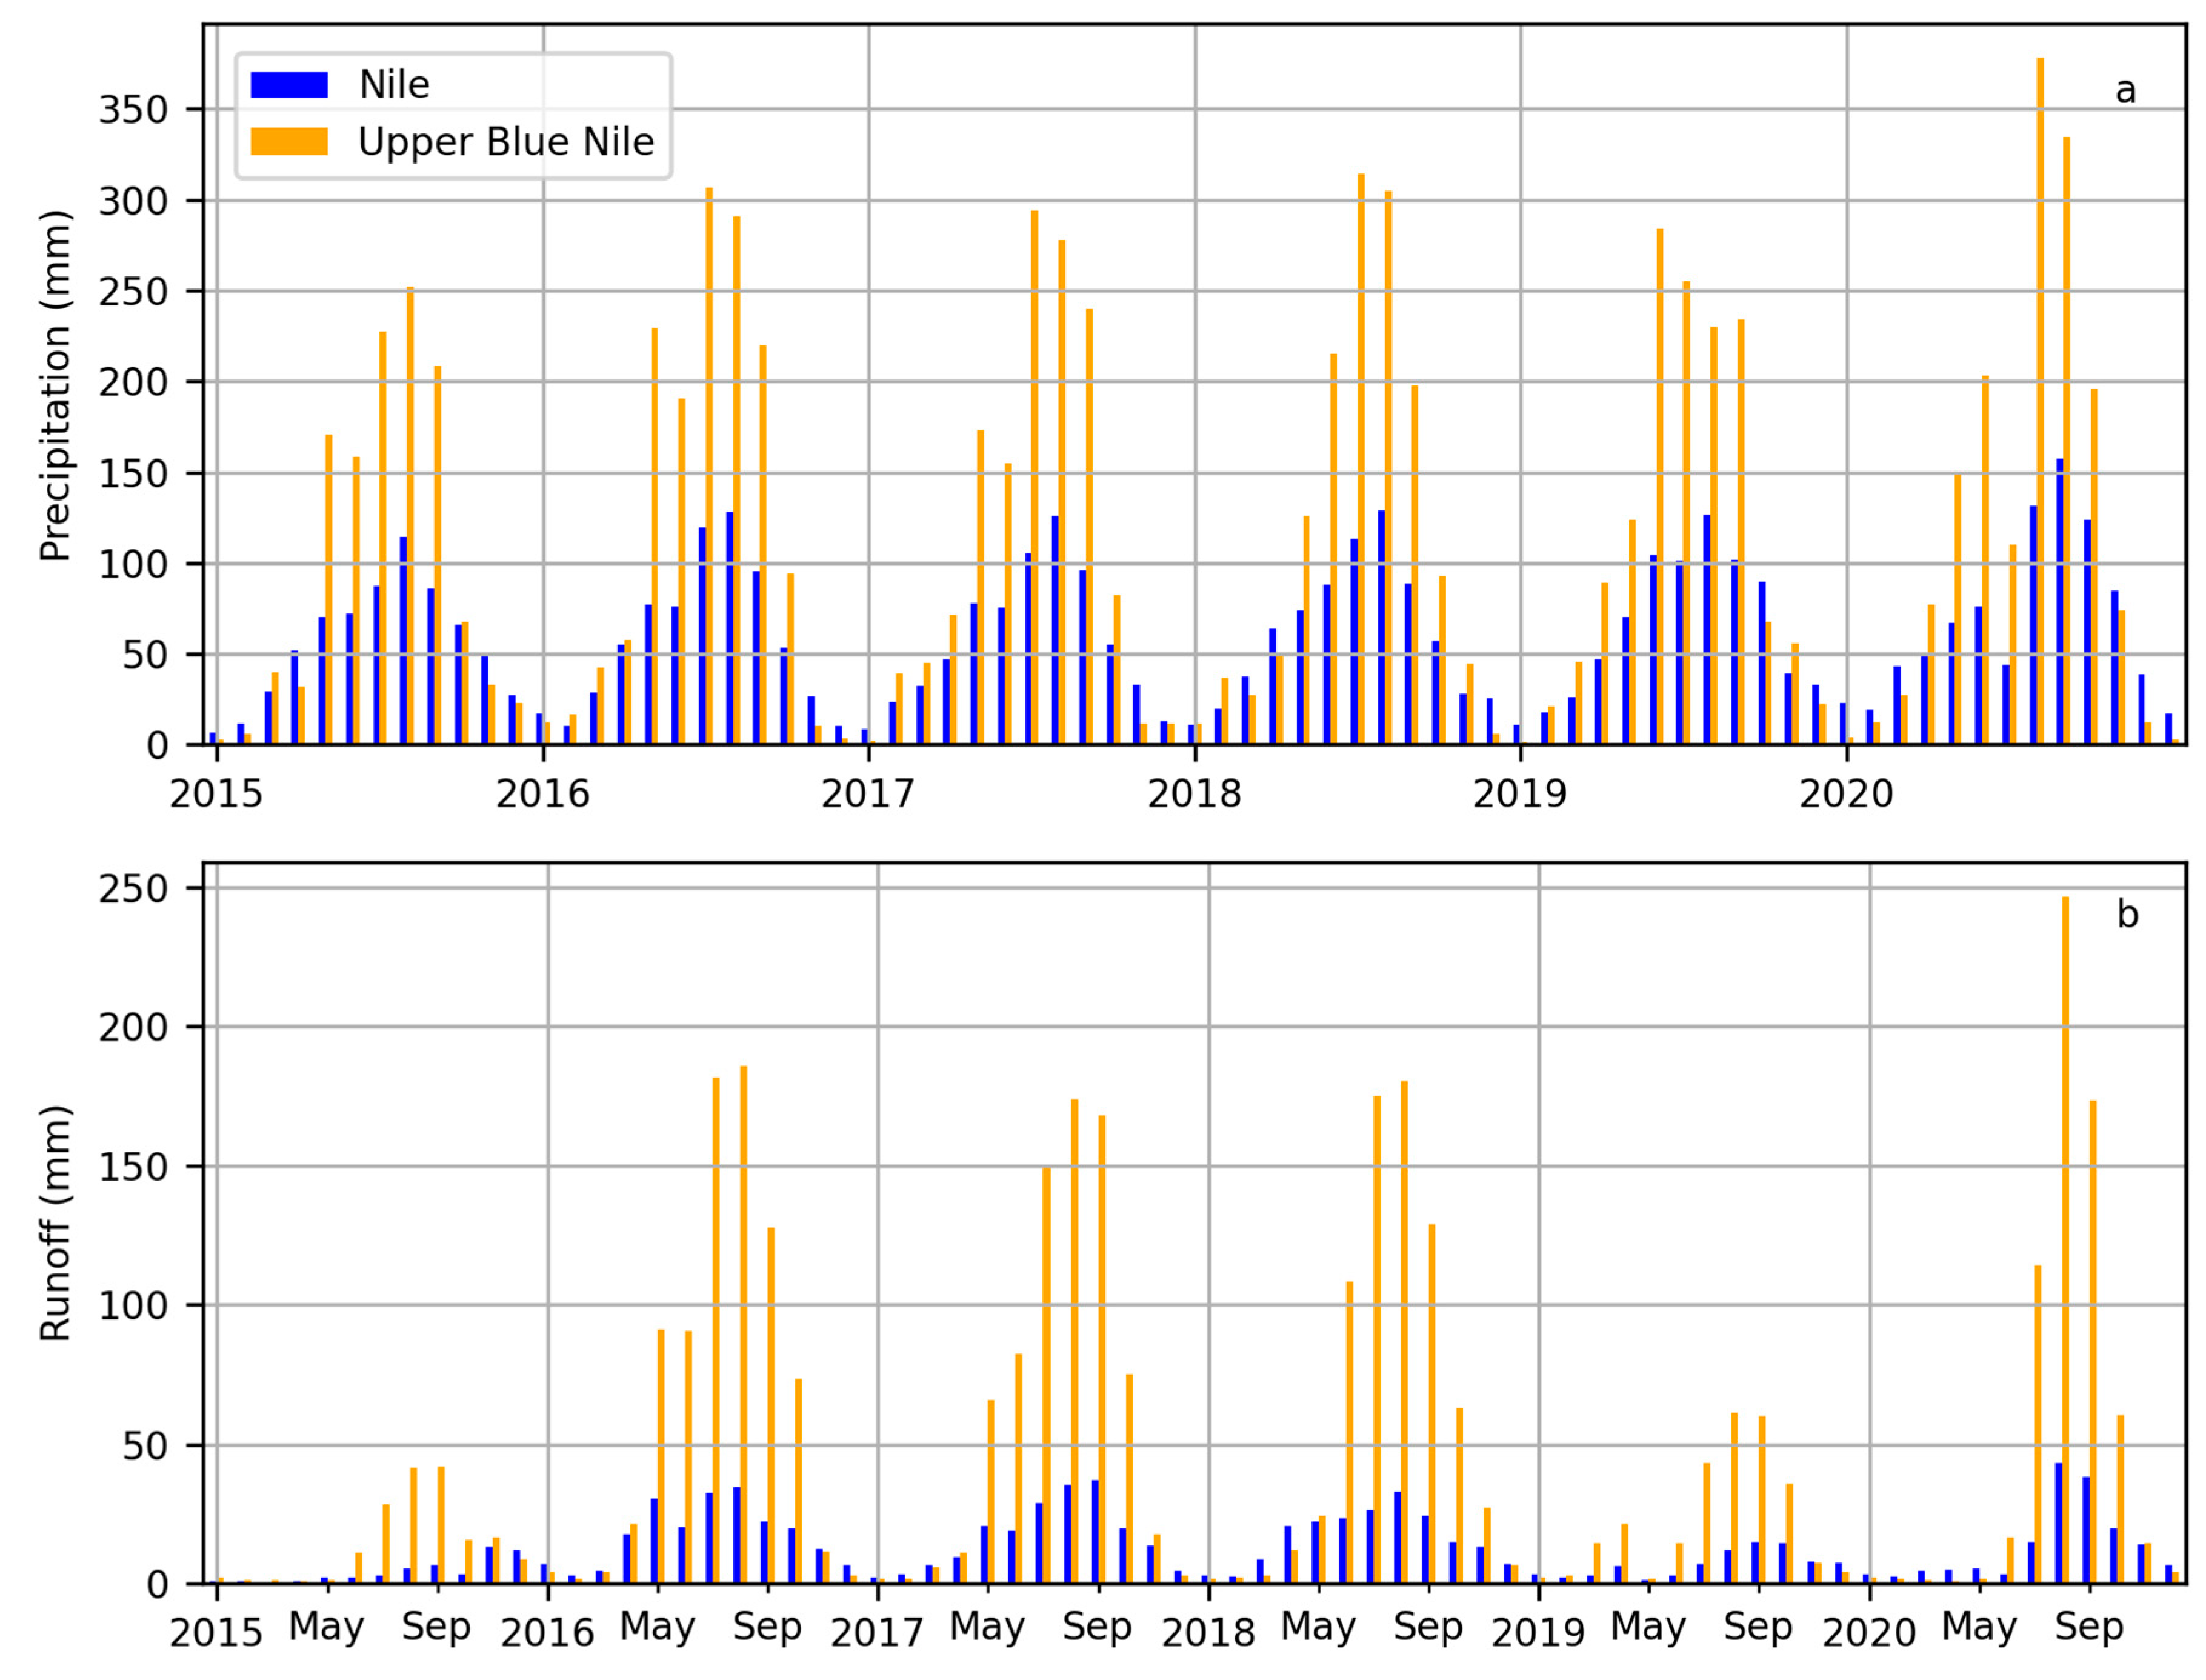
3.3. Analysis of Hydrological Variability
4. Discussion
5. Conclusions
Supplementary Materials
Author Contributions
Funding
Data Availability Statement
Acknowledgments
Conflicts of Interest
References
- Madson, A.; Sheng, Y. Reservoir Induced Deformation Analysis for Several Filling and Operational Scenarios at the Grand Ethiopian Renaissance Dam Impoundment. Remote Sens. 2020, 12, 1886. [Google Scholar] [CrossRef]
- Elsayed, H.; Djordjević, S.; Savić, D.A.; Tsoukalas, I.; Makropoulos, C. The Nile Water-Food-Energy Nexus under Uncertainty: Impacts of the Grand Ethiopian Renaissance Dam. J. Water Resour. Plan. Manag. 2020, 146, 04020085. [Google Scholar] [CrossRef]
- Siddig, K.; Basheer, M.; Luckmann, J.; Grethe, H. Long-Term Economy-Wide Impacts of the Grand Ethiopian Renaissance Dam on Sudan. In Proceedings of the 22nd Annual Conference on Global Economic Analysis, Warsaw, Poland, 19–21 June 2019. [Google Scholar]
- Salman, S.M.A. The Grand Ethiopian Renaissance Dam: The road to the declaration of principles and the Khartoum document. Water Int. 2016, 41, 512–527. [Google Scholar] [CrossRef]
- Kahsay, T.N.; Kuik, O.; Brouwer, R.; Van Der Zaag, P. Estimation of the transboundary economic impacts of the Grand Ethiopia Renaissance Dam: A computable general equilibrium analysis. Water Resour. Econ. 2015, 10, 14–30. [Google Scholar] [CrossRef]
- Zhang, Y.; Erkyihum, S.T.; Block, P. Filling the GERD: Evaluating hydroclimatic variability and impoundment strategies for Blue Nile riparian countries. Water Int. 2016, 41, 593–610. [Google Scholar] [CrossRef]
- Zhang, Y.; Block, P.; Hammond, M.; King, A. Ethiopia’s Grand Renaissance Dam: Implications for Downstream Riparian Countries. J. Water Resour. Plan. Manag. 2015, 141, 05015002. [Google Scholar] [CrossRef]
- Gebreluel, G. Ethiopia’s Grand Renaissance Dam: Ending Africa’s Oldest Geopolitical Rivalry? Wash. Q. 2014, 37, 25–37. [Google Scholar] [CrossRef]
- Basheer, M.; Wheeler, K.G.; Elagib, N.A.; Etichia, M.; Zagona, E.A.; Abdo, G.M.; Harou, J.J. Filling Africa’s Largest Hydropower Dam Should Consider Engineering Realities. One Earth 2020, 3, 277–281. [Google Scholar] [CrossRef]
- Dandrawy, M.E.; Omran, E.-S.E. Environmental Remote Sensing in Egypt; Springer: Cham, Switzerland, 2020; pp. 533–574. [Google Scholar] [CrossRef]
- Wheeler, K.G.; Jeuland, M.; Hall, J.W.; Zagona, E.; Whittington, D. Understanding and managing new risks on the Nile with the Grand Ethiopian Renaissance Dam. Nat. Commun. 2020, 11, 1–9. [Google Scholar] [CrossRef] [PubMed]
- Amitrano, D.; Di Martino, G.; Iodice, A.; Mitidieri, F.; Papa, M.N.; Riccio, D.; Ruello, G. Sentinel-1 for Monitoring Reservoirs: A Performance Analysis. Remote Sens. 2014, 6, 10676–10693. [Google Scholar] [CrossRef] [Green Version]
- Pipitone, C.; Maltese, A.; Dardanelli, G.; Brutto, M.L.; La Loggia, G. Monitoring Water Surface and Level of a Reservoir Using Different Remote Sensing Approaches and Comparison with Dam Displacements Evaluated via GNSS. Remote Sens. 2018, 10, 71. [Google Scholar] [CrossRef] [Green Version]
- Li, W.; El-Askary, H.; Lakshmi, V.; Piechota, T.; Struppa, D. Earth Observation and Cloud Computing in Support of Two Sustainable Development Goals for the River Nile Watershed Countries. Remote Sens. 2020, 12, 1391. [Google Scholar] [CrossRef]
- Farr, T.G.; Rosen, P.A.; Caro, E.; Crippen, R.; Duren, R.; Hensley, S.; Kobrick, M.; Paller, M.; Rodriguez, E.; Roth, L.; et al. The Shuttle Radar Topography Mission. Rev. Geophys. 2007, 45. [Google Scholar] [CrossRef] [Green Version]
- Huffman, G.J.; Bolvin, D.T.; Nelkin, E.J. IMERG Technical Documentation. Available online: https://gpm.nasa.gov/sites/default/files/document_files/IMERG_doc_190909.pdf (accessed on 26 January 2020).
- Tang, G.; Ma, Y.; Long, D.; Zhong, L.; Hong, Y. Evaluation of GPM Day-1 IMERG and TMPA Version-7 legacy products over Mainland China at multiple spatiotemporal scales. J. Hydrol. 2016, 533, 152–167. [Google Scholar] [CrossRef]
- Tapley, B.D.; Bettadpur, S.; Ries, J.C.; Thompson, P.F.; Watkins, M.M. GRACE Measurements of Mass Variability in the Earth System. Science 2004, 305, 503–505. [Google Scholar] [CrossRef] [PubMed] [Green Version]
- Cheng, M. Correction to “Variations in the Earth’s oblateness during the past 28 years”. J. Geophys. Res. Space Phys. 2005, 110. [Google Scholar] [CrossRef]
- Swenson, S.; Chambers, D.P.; Wahr, J. Estimating geocenter variations from a combination of GRACE and ocean model output. J. Geophys. Res. Solid Earth 2008, 113, 08410. [Google Scholar] [CrossRef] [Green Version]
- Landerer, F.W.; Swenson, S.C. Accuracy of scaled GRACE terrestrial water storage estimates. Water Resour. Res. 2012, 48, 48. [Google Scholar] [CrossRef]
- Syed, T.H.; Famiglietti, J.S.; Rodell, M.; Chen, J.; Wilson, C.R. Analysis of terrestrial water storage changes from GRACE and GLDAS. Water Resour. Res. 2008, 44, 44. [Google Scholar] [CrossRef]
- Rodell, M.; Houser, P.R.; Jambor, U.; Gottschalck, J.; Mitchell, K.; Meng, C.-J.; Arsenault, K.; Cosgrove, B.; Radakovich, J.; Bosilovich, M.; et al. The Global Land Data Assimilation System. Bull. Am. Meteorol. Soc. 2004, 85, 381–394. [Google Scholar] [CrossRef] [Green Version]
- Xu, H. Modification of normalised difference water index (NDWI) to enhance open water features in remotely sensed imagery. Int. J. Remote Sens. 2006, 27, 3025–3033. [Google Scholar] [CrossRef]
- Li, W. Code for SAR Imagery Processing. Available online: https://code.earthengine.google.com/a794cd8260c2fe1e6f8ce9ff780616c7 (accessed on 25 November 2020).
- Lv, M.; Lu, H.; Yang, K.; Xu, Z.; Lv, M.; Huang, X. Assessment of Runoff Components Simulated by GLDAS against UNH–GRDC Dataset at Global and Hemispheric Scales. Water 2018, 10, 969. [Google Scholar] [CrossRef] [Green Version]
- Zheng, D.; Van Der Velde, R.; Su, Z.; Wen, J.; Wang, X. Assessment of Noah land surface model with various runoff parameterizations over a Tibetan river. J. Geophys. Res. Atmos. 2017, 122, 1488–1504. [Google Scholar] [CrossRef]
- Lakshmi, V.; Fayne, J.; Bolten, J. A comparative study of available water in the major river basins of the world. J. Hydrol. 2018, 567, 510–532. [Google Scholar] [CrossRef] [PubMed]
- Le, J.A.; El-Askary, H.M.; Allali, M.; Sayed, E.; Sweliem, H.; Piechota, T.C.; Struppa, D.C. Characterizing El Niño-Southern Oscillation Effects on the Blue Nile Yield and the Nile River Basin Precipitation using Empirical Mode Decomposition. Earth Syst. Environ. 2020, 4, 699–711. [Google Scholar] [CrossRef]


| Date (dd/mm/yy) | Estimated Level (m) | Total Increased Storage (×109 m3) |
|---|---|---|
| 27/6/20 | 520 | - |
| 8/7/20 | 545 | 0.904 |
| 9/7/20 | 550 | 1.345 |
| 11/7/20 | 555 | 1.922 |
| 14/7/20 | 560 | 2.664 |
| 20/7/20 | 565 | 3.584 |
| 2/8/20 | 570 | 4.719 |
| 14/8/20 | 575 | 6.109 |
| 7/9/2020 | 570 | 4.719 |
| 25/10/2020 | 567 | 4.009 |
| 30/11/2020 | 565 | 3.584 |
Publisher’s Note: MDPI stays neutral with regard to jurisdictional claims in published maps and institutional affiliations. |
© 2021 by the authors. Licensee MDPI, Basel, Switzerland. This article is an open access article distributed under the terms and conditions of the Creative Commons Attribution (CC BY) license (http://creativecommons.org/licenses/by/4.0/).
Share and Cite
Kansara, P.; Li, W.; El-Askary, H.; Lakshmi, V.; Piechota, T.; Struppa, D.; Abdelaty Sayed, M. An Assessment of the Filling Process of the Grand Ethiopian Renaissance Dam and Its Impact on the Downstream Countries. Remote Sens. 2021, 13, 711. https://0-doi-org.brum.beds.ac.uk/10.3390/rs13040711
Kansara P, Li W, El-Askary H, Lakshmi V, Piechota T, Struppa D, Abdelaty Sayed M. An Assessment of the Filling Process of the Grand Ethiopian Renaissance Dam and Its Impact on the Downstream Countries. Remote Sensing. 2021; 13(4):711. https://0-doi-org.brum.beds.ac.uk/10.3390/rs13040711
Chicago/Turabian StyleKansara, Prakrut, Wenzhao Li, Hesham El-Askary, Venkataraman Lakshmi, Thomas Piechota, Daniele Struppa, and Mohamed Abdelaty Sayed. 2021. "An Assessment of the Filling Process of the Grand Ethiopian Renaissance Dam and Its Impact on the Downstream Countries" Remote Sensing 13, no. 4: 711. https://0-doi-org.brum.beds.ac.uk/10.3390/rs13040711