
Mid-Infrared Compressive Hyperspectral Imaging
by
 , , ,
, , ,
Shuowen Yang
1,† ,
,
Xiang Yan
1,*,†,
Hanlin Qin
1,
Qingjie Zeng
1,
Yi Liang
2,
Henry Arguello
3 and
Xin Yuan
4 1
School of Physics and Optoelectronic Engineering, Xidian University, Xi’an 710071, China
2
National Laboratory of Radar Signal Processing, Xidian University, Xi’an 710071, China
3
Department of Computer Science, Universidad Industrial de Santander, Bucaramanga 680002, Colombia
4
Bell Labs, 600 Mountain Avenue, Murray Hill, NJ 07974, USA
*
Author to whom correspondence should be addressed.
†
These authors contributed equally to this work.
Remote Sens. 2021, 13(4), 741; https://0-doi-org.brum.beds.ac.uk/10.3390/rs13040741
Submission received: 22 January 2021
/
Revised: 9 February 2021
/
Accepted: 13 February 2021
/
Published: 17 February 2021
(This article belongs to the Special Issue Remote Sensing Image Denoising, Restoration and Reconstruction)
Abstract
:Hyperspectral imaging (HSI) has been widely investigated within the context of computational imaging due to the high dimensional challenges for direct imaging. However, existing computational HSI approaches are mostly designed for the visible to near-infrared waveband, whereas less attention has been paid to the mid-infrared spectral range. In this paper, we report a novel mid-infrared compressive HSI system to extend the application domain of mid-infrared digital micromirror device (MIR-DMD). In our system, a modified MIR-DMD is combined with an off-the-shelf infrared spectroradiometer to capture the spatial modulated and compressed measurements at different spectral channels. Following this, a dual-stage image reconstruction method is developed to recover infrared hyperspectral images from these measurements. In addition, a measurement without any coding is used as the side information to aid the reconstruction to enhance the reconstruction quality of the infrared hyperspectral images. A proof-of-concept setup is built to capture the mid-infrared hyperspectral data of 64 pixels × 48 pixels × 100 spectral channels ranging from 3 to 5 μm, with the acquisition time within one minute. To the best of our knowledge, this is the first mid-infrared compressive hyperspectral imaging approach that could offer a less expensive alternative to conventional mid-infrared hyperspectral imaging systems.

1. Introduction
In recent years, infrared hyperspectral imaging have been widely used in remote sensing [1,2,3], planetary exploration [4,5] and industrial emissions monitoring [6,7], which is attributed to the advantage that infrared hyperspectral imaging can obtain three-dimensional (3D) data cube of the object, namely the 2D spatial dimension and the spectral dimension . Due to the different absorption and reflection/emission spectra of different substances, the characteristic spectra of different substances are different. Thus, infrared hyperspectral imaging can identify and distinguish the substance with high confidence. Existing hyperspectral imaging systems mostly use dispersive elements (e.g., prisms or diffraction gratings) [8], filters [9,10] or the Fourier transform infrared spectroscopy technique [11,12] to decompose lights into various wavelengths followed by an infrared focal plane array (IRFPA) to record them separately. Despite different principles and setups are used for the above mentioned hyperspectral imaging methods, one common idea is that photons are detected separately either in the spatial or spectral domain using a costly IRFPA. Therefore, in most imaging systems, the trade-off among cost, spatial resolution and spectral resolution is challenging. Furthermore, some systems require to capture the entire hyperspectral data cube of the target, making it difficult for systems to store and transmit the data.
Nevertheless, “compressive sensing" (CS) makes it possible to break the trade-off between the spatial-spectral resolution and cost. CS can be effectively used to reconstruct complete target information by sampling only a small amount of data from the target, which is far less than the data required by Nyquist sampling [13]. In 2008, an imaging technology based on CS, single-pixel imaging (SPI), was proposed [14]. The SPI uses a spatial light modulator (SLM) and a single-pixel detector to multiplex the two-dimensional (2D) information of the target and capture the compressed measurement, respectively. Then reconstruction algorithms are employed to retrieve the 2D information of the target, i.e., recovering the 2D image.
Inspired by this, the SPI framework was extended to 3D hyperspectral imaging. In [15], a single-pixel hyperspectral imager (SPHI) was developed based on the Hadamard Transform. The proposed SPHI worked in the pushbroom mode and employed both spatial and spectral encoding to acquire the hyperspectral data cube over a visible spectral range of 450–750 . A digital micromirror device (DMD) was used for slow spatial encoding and a resonant scanning mirror in combination with a fixed Hadamard mask was used for fast spectral encoding. Based on a similar SPHI, a new CS algorithm, which can discriminate plant species from the rest of a scene and identify biologically contrasted areas within a leaf, was developed in [16]. In [17], the authors designed a near-infrared hyperspectral single-pixel imager for chemical characterization within the broad spectral range of 1.5–2.2 μm, in which they used a Fabry-Pérot tunable filter spectrometer and a DMD to achieve the high spectral and spatial resolution of hyperspectral imaging, respectively. All the single-pixel hyperspectral imaging systems described above were achieved by modulating intensity of the imaging target. Here, the “intensity” usually contains the reflected or radiant intensity. In particular, these SPHI approaches only have been executed from the visible up to the short-infrared spectral range, approximately 2.2 μm [18,19,20,21,22], by modulating the reflected intensity of the imaging object. Applying this technology to thermal target imaging remains a significant challenge in terms of, e.g., modulating the radiant intensity of the target in the mid-infrared (MIR) spectral range. To the best of our knowledge, there is no existing work on MIR hyperspectral imaging based on the compressive imaging approach.
To extend the application domain of MIR-DMD, in this study, we devise a MIR compressive hyperspectral imaging (MIR-CHI) system with a modified MIR-DMD, which can modulate the intensity of radiation of the imaging object in the MIR spectral range, i.e., 3–5 μm. Specifically, we leverage a fully integrated infrared spectroradiometer in combination with a modified MIR-DMD to capture the spatial modulated and compressed measurements at different spectral channels. Compared to traditional imaging systems using a costly IRFPA, the MIR-DMD offers significantly larger pixel numbers and superior modulation rate (above 20 kHz), and the compressive sensing scheme provides a less expensive alternative. However, the commercially available DMD cannot be used directly in our imaging approach, because the optical window of the DMD cannot transmit the infrared radiation. To address this key bottleneck, we modify DMD by replacing the optical window with an infrared material window, which ensures that the infrared radiation emitted by targets is modulated favourably by the DMD. In this manner, the proposed imaging approach can achieve infrared hyperspectral imaging without scanning by making full use of the advantages of the modified MIR-DMD and the infrared spectroradiometer. We summarize the main contributions of this paper as follows:
- A mid-infrared compressive hyperspectral imaging system is built, in which a modified MIR-DMD is employed to implement coded modulation.
- A sensing model based on randomly coded measurement and the other without any coding (side information), along with a dual-stage reconstruction algorithm are proposed to recover high quality MIR hyperspectral images.
- Encouraging results are obtained using CS image reconstruction on the measurements captured by our MIR-CHI system. The results demonstrate that the proposed MIR-CHI system is a feasible method, which presents a less expensive alternative to conventional MIR hyperspectral imaging systems.
2. Principle and Design
2.1. Concept and System Design
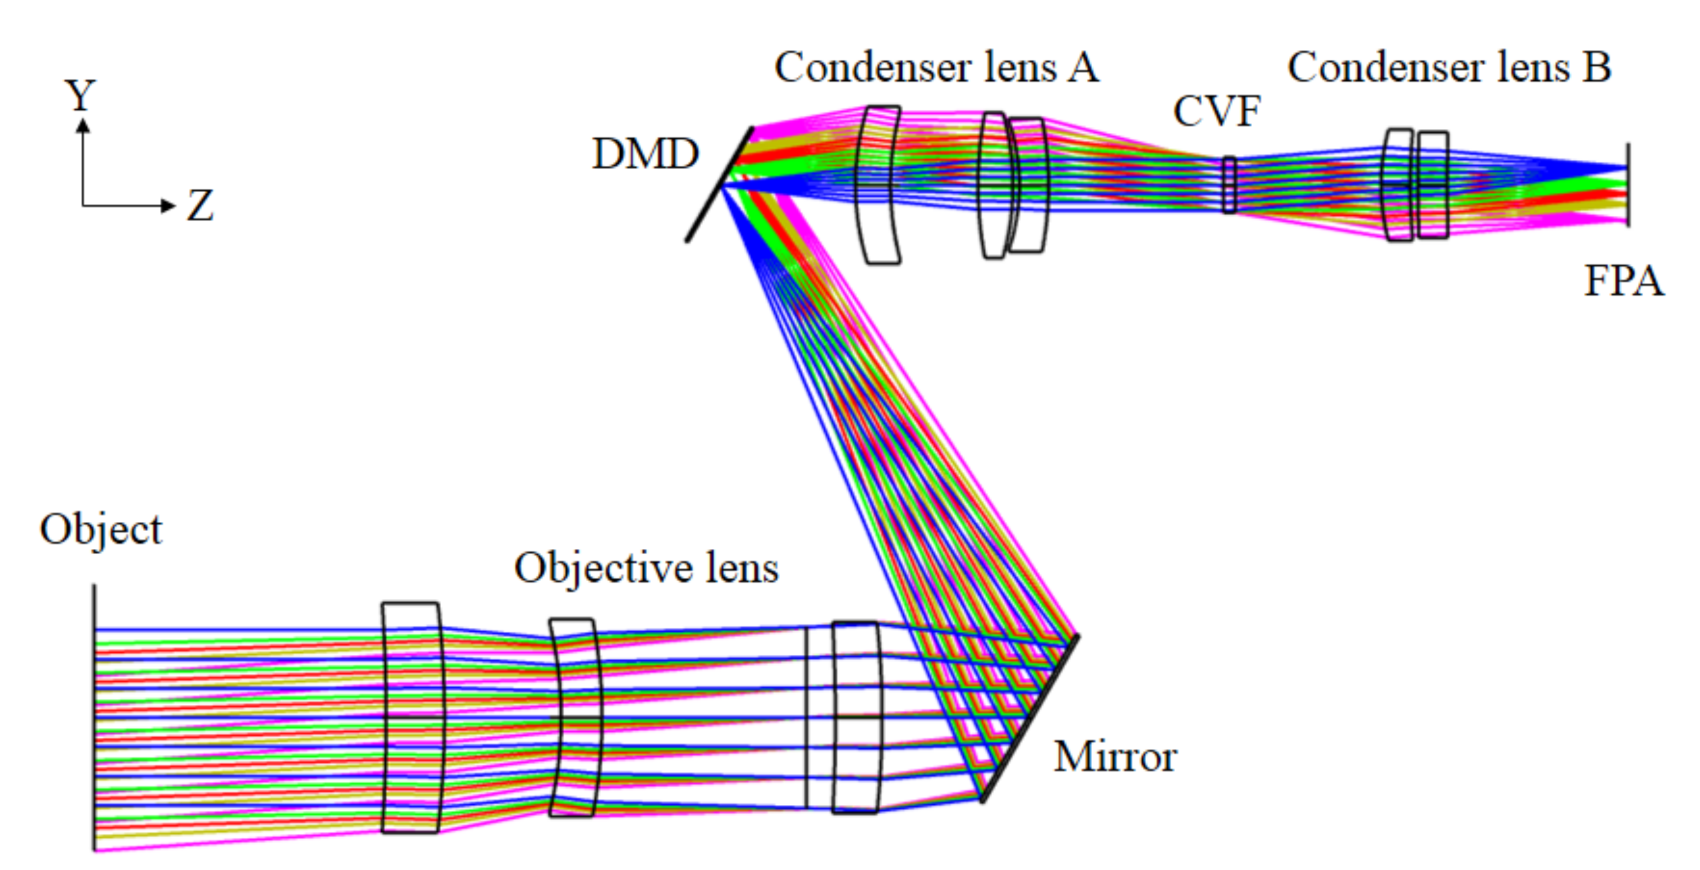
The framework of the proposed MIR-CHI system is illustrated in Figure 1. It primarily consists of two subsystems, i.e., a spatial modulation subsystem and a spectral dispersion subsystem. The former consists of an objective lens, a reflecting mirror, and a spatial light modulator implemented by a modified MIR-DMD, which is used to encode the infrared radiation of the target. The latter is composed of a condenser lens and an off-the-shelf infrared spectroradiometer. This radiometer is used to acquire the compressive spectral information by dispersing coded information of the target; it mainly comprises a circular variable filter (CVF), condenser lens A and B, and a linear detector array.
The underlying principle of the proposed MIR-CHI system is described as follows. Firstly, the infrared radiation of the target is focused onto the MIR-DMD by the objective lens followed with a reflecting mirror. Subsequently, the MIR-DMD of predefined coding patterns is used to randomly reflect the infrared radiation of the target to obtain the random combination information of it. Thereafter, the reflected infrared radiation of the target modulated by the MIR-DMD passes the condenser lens A, CVF, and condenser lens B in sequence to converge the infrared radiation into the detector. The detector captures the spectral intensity of the modulated radiation corresponding to the sequential coding patterns. Finally, we use this spectral information along with the knowledge of the known forward model specified by the coding patterns to solve the desired MIR hyperspectral images.
2.2. MIR-DMD
The DMD is a key component required to ensure that the proposed MIR-CHI system works properly in the MIR spectral range from 3 to 5 μm. However, commercially available DMDs have efficiency in the spectral range from about 0.35 to 2.5 μm because the native encapsulation for the optical window of a DMD is the corning 7056 glass. Thus, it has been widely used only in the visible to short-wave infrared spectral imaging so far. This, unfortunately, makes the existing DMD incapable of being directly used in our imaging system. To address this challenge, we propose to employ the infrared material ZnSe to re-design the optical window of the DMD being used, named MIR-DMD, and it has a superior efficiency in the spectral range from 1 to 14 μm. In this study, we assemble the MIR-DMD based on a 0.7 XGA DMD produced by Texas Instrument with a standard glass window and aluminum coated micromirrors. The diffraction efficiency was measured for testing and evaluation of hyperspectral imaging sensors in [23], where they drew a conclusion that the DMD diffraction, while it must be taken into account, was not a major problem.
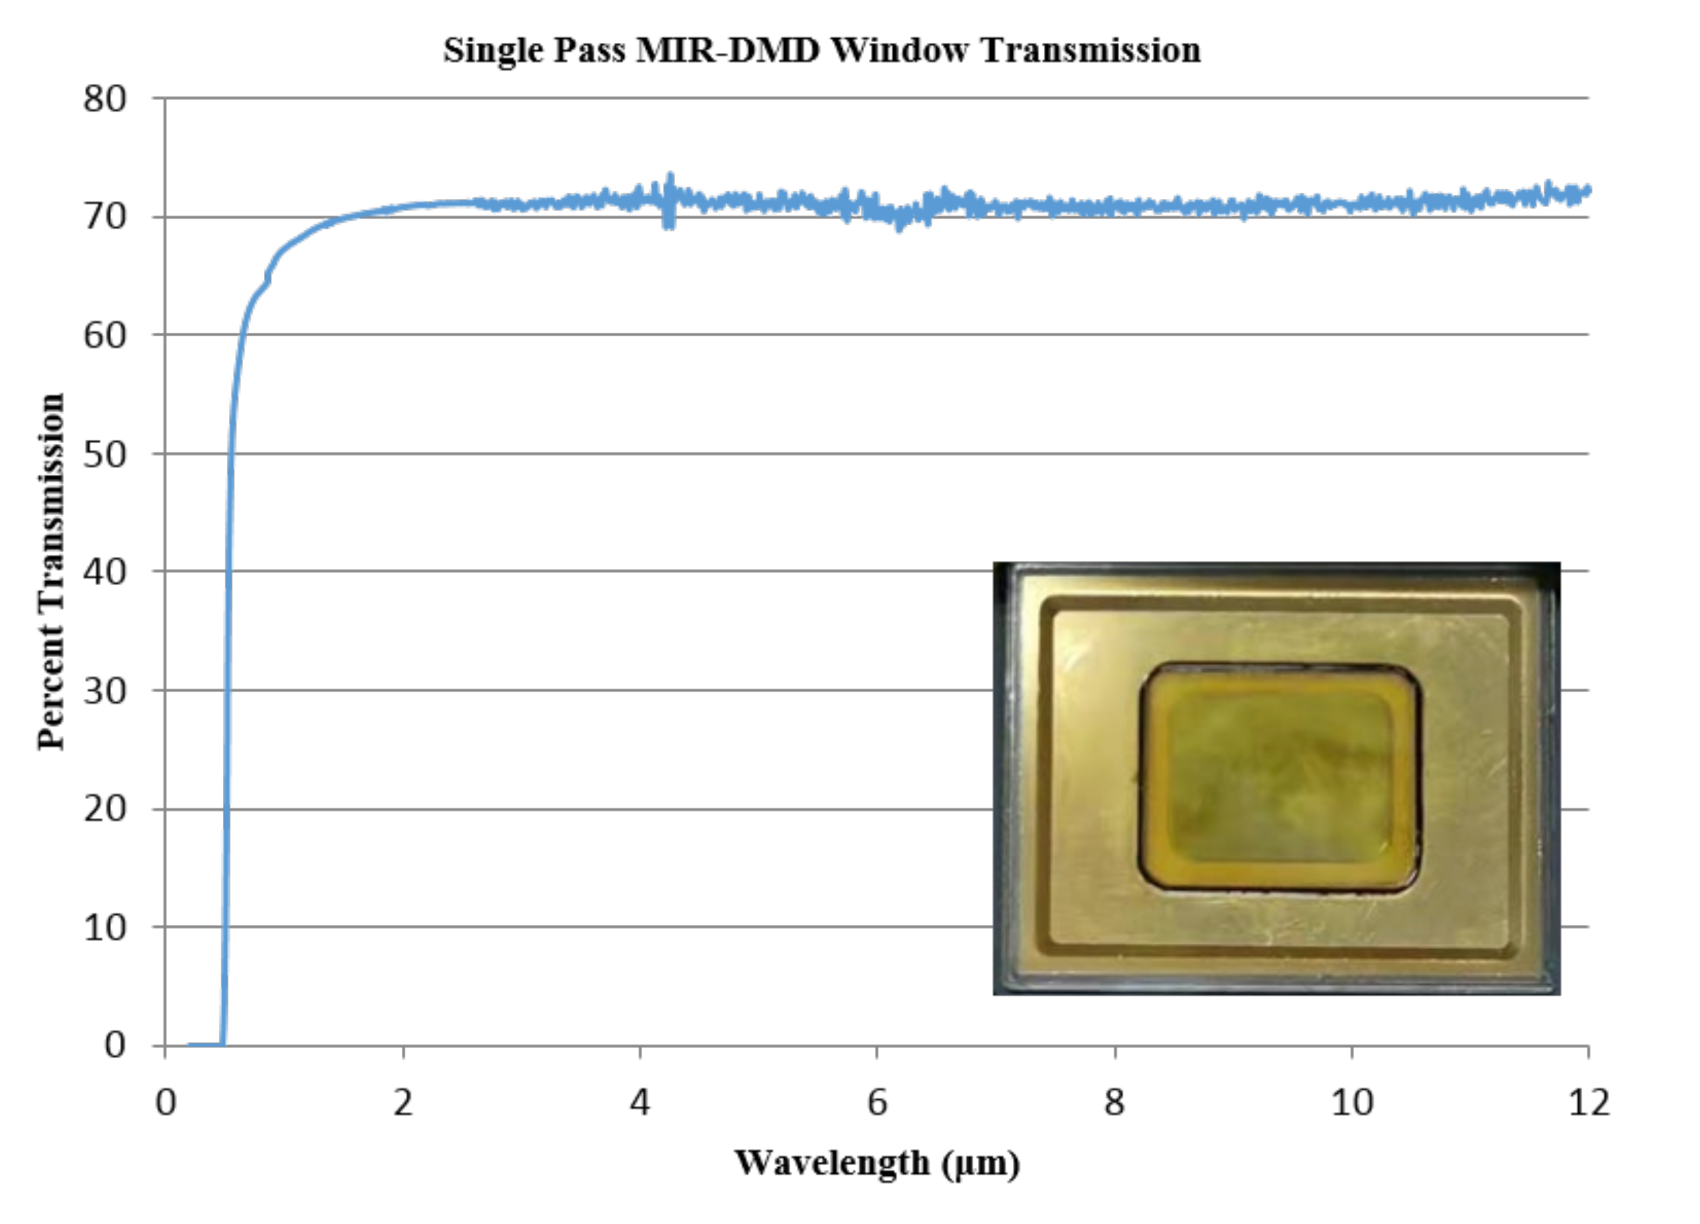
The DMD is a high precision device that its micromirrors are easy to damage, and improper encapsulation can cause the hinge of the micromirrors to fail. Therefore, it requires a strict environment to modify a MIR-DMD. The steps of MIR-DMD manufacture are described as follows: First, we cut the native optical window of original DMD in dry and dust-free environment. Second, the infrared optical window will be obtained by welding the infrared material ZnSe to the surface of the original metal protective cover, which requires melting the ZnSe material. Moreover, to improve the infrared radiation transmittance of the designed infrared optical window, anti-reflecting (AR) coating of the 3 to 12 μm is plated. Subsequently, we install the infrared window to the DMD under a vacuum condition of 150 C and fulling of N. The modified MIR-DMD will be assembled into our imaging system, the window transmission of which is depicted in Figure 2.
2.3. Simulation Using ZEMAX
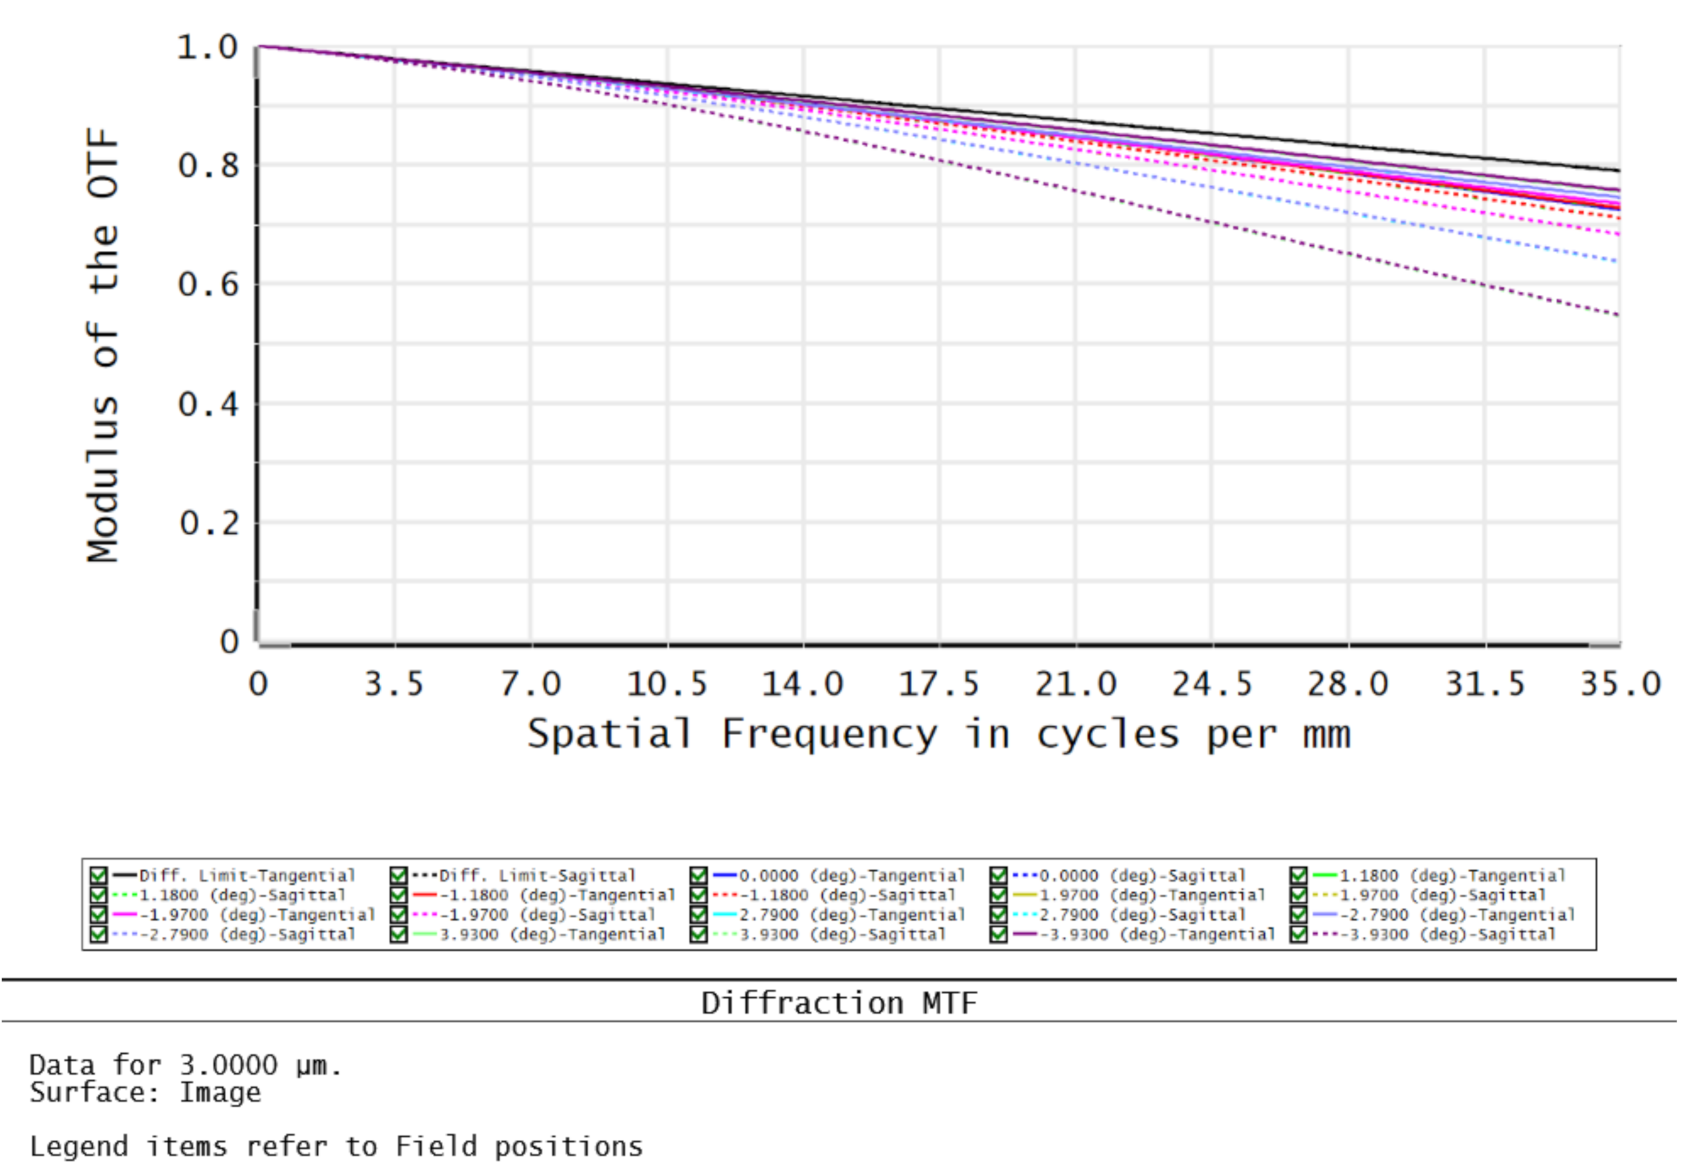
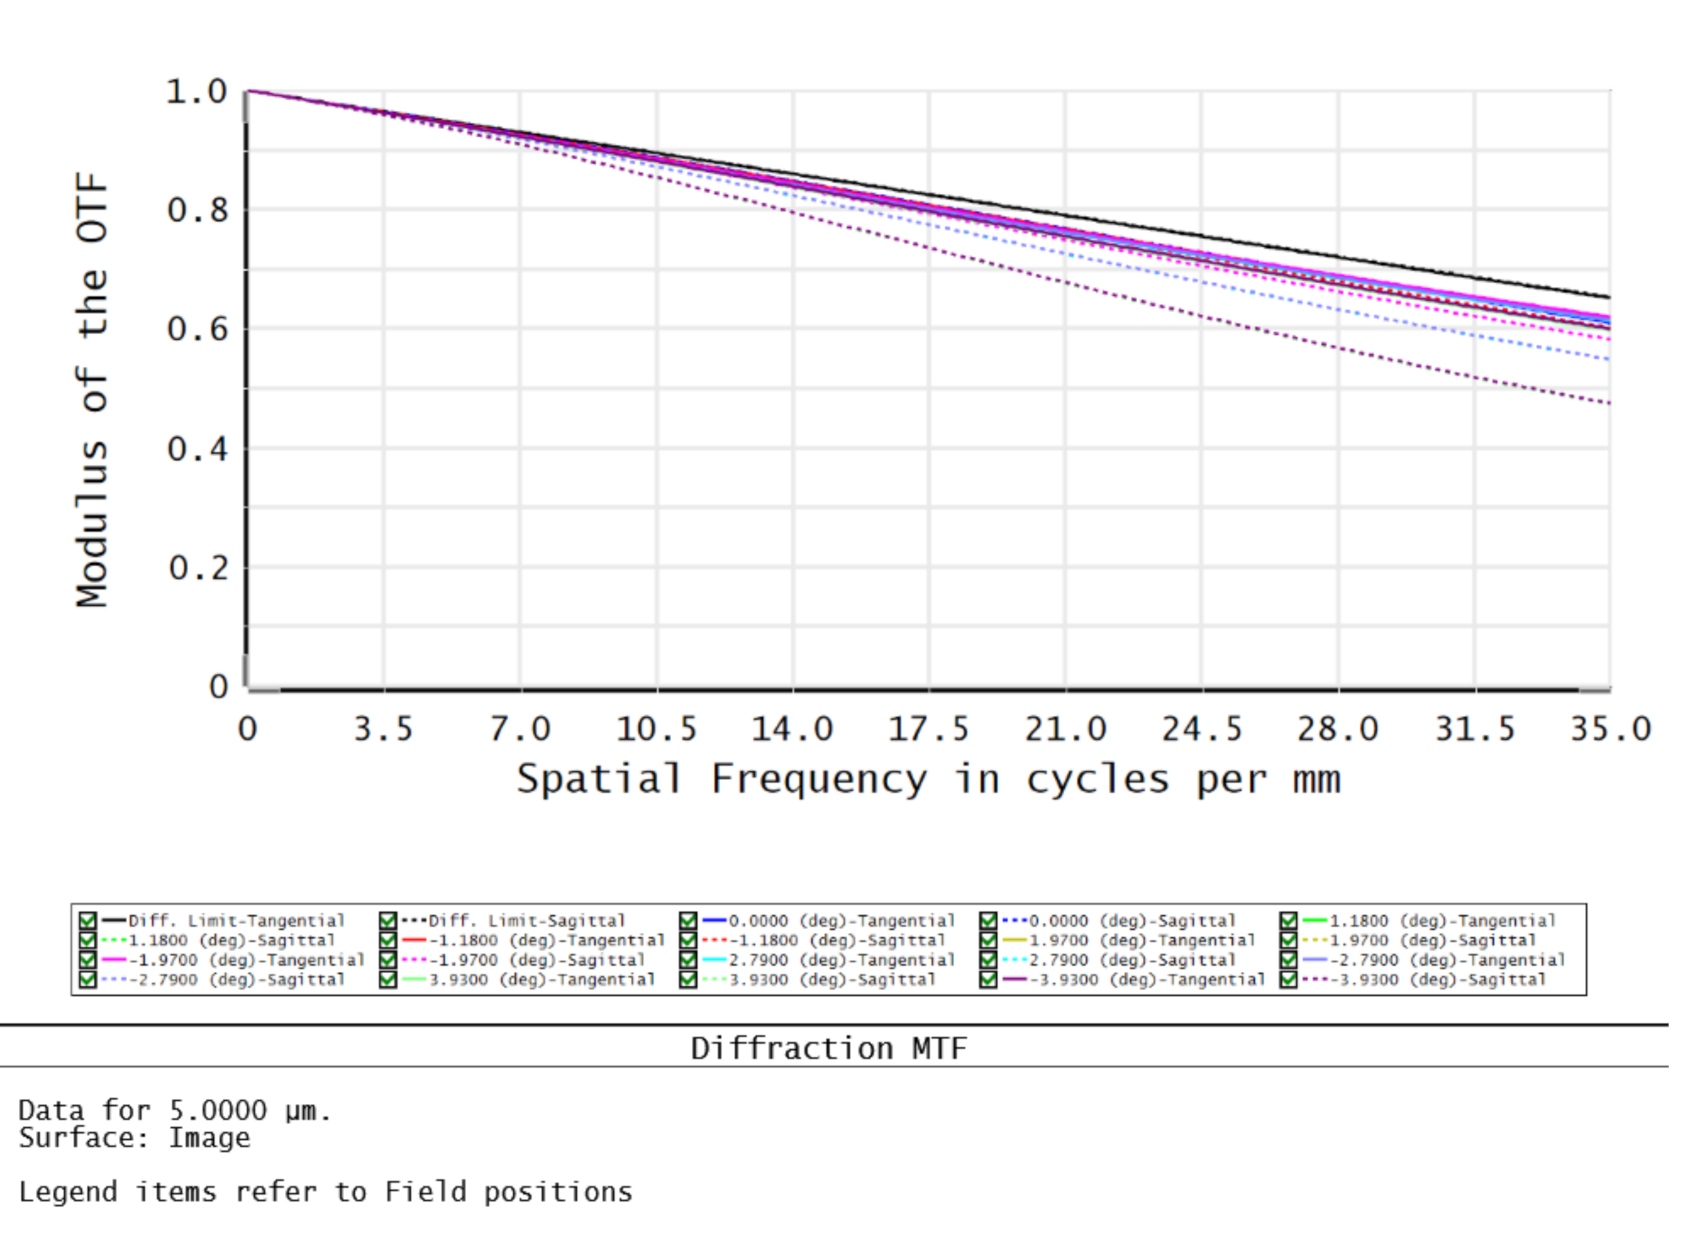
Based on the preceding discussion, we now evaluate the optical system of our proposed MIR-CHI. It is designed by ZEMAX using the ray-tracing method and modulation transfer function (MTF) of three different wavelengths, as depicted in Figure 3, Figure 4, Figure 5 and Figure 6. We can clearly see that the MTFs approach the diffraction limit, which indicates accurate measurements can be obtained by the designed MIR-CHI system.
We present the design specifications of our system in Table 1. It has a working F-number of 2, cross-track FOV of , and a spectral range of 3–5 μm. The spectral resolution and number of channels are 0.02 and 100, respectively. The spatial resolution is tunable based on the principle of SPI [24]. Furthermore, the spectroradiometer’s recording and the modulation of the MIR-DMD are precisely synchronized. It is worth mentioning that, in our system, the highest frame rate of the MIR-CHI is determined by the frame rate of the spectroradiometer being used.
2.4. Optical Sensing Model of the Proposed Architecture
In this section, we describe the mathematical model of the proposed MIR-CHI system, illustrated in Figure 1. First, the infrared radiation of the target is focused on the coded aperture using an objective lens, where denotes the spatial coordinate and is the wavelength. MIR-DMD is used as the coded aperture to modulate the infrared radiation. Here, the coded aperture is a binary pattern that each element being equal to 0 (blocking the radiation) or 1 (passing the radiation). This modulation can be represented by
The spatially modulated scene is then concentrated in a single point by a condenser lens, where it is captured by a MIR sensor. Specifically, an infrared spectroradimeter is used as the sensor such that all the incoming modulated spectral source is captured in a single measurement as function of
The acquired spectrum is discretized by the spectroradimeter according to the pixel pitch of the detector. For the l-th spectral band, this process can be mathematically expressed as
where is the pixel size of the detector and is rectangular sampling function.
Since the DMD is programmed to pixelized patterns, hereby we use the discrete matrix to denote the K different patterns with spatial size of , meaning M rows and N columns. Correspondingly, we assume that the infrared hyperspectral image is , where M and N are the spatial dimensions (same as the mask pattern) and L is the number of spectral channels. Please note that for each measurement, i.e., the sensor capturing once, we impose one pattern on the scene across all the spectral channels (for every channel, the patterns are the same) and for l-th channel, the captured value is
where is the -th element in and is the -th element in . This is the conventional single-pixel imaging model but rather than capturing only a single measurement one time, hereby our sensor captures L measurements and each one corresponding to one spectral channel.
Let and
We thus can re-write the formulation of Equation (4) as
Considering all the K measurements corresponding to K patterns
where
This can be further denoted as
by considering all the L channels, where
and denotes the measurement noise. The compression ratio in our model can be represented by for . Following this, each spectral channel of the signal can be reconstructed based independently on Equation (8) or jointly on Equation (11).
However, the reconstruction of MIR hyperspectral images is challenging at a low compression ratio, inspired by the findings in [25,26,27], better reconstruction quality or faster convergence can be achieved with an additional measurement as the side information at the same compression ratio. Thus, we here consider using the measurement without any coding as side information to aid the reconstruction. In our system, the side information of the same scene can be obtained easily by imposing the all “1" pattern on the MIR-DMD. This is
where is the intensity of the side information. The side information model is now
but now with the last row being all 1, and with the last measurement being in Equation (14).
Reconstruction from compressive measurements can be obtained by solving Equation (15). Since the proposed model observes the side information of the same scene as the hyperspectral images, this side information will facilitate the algorithm to improve the reconstruction quality.
3. Proposed Reconstruction Algorithm
Apparently, Equation (15) is an ill-posed problem and several CS algorithms have been developed to solve it by employing different prior information such as sparsity, total variation and low-rank [28,29,30,31,32,33,34] (We do notice that deep learning methods have recently been used in CS of spectral images [35,36]. However, this is out of the scope of this paper. The main contribution of this paper is the MIR-CHI design). To improve the sparsity of signal to obtain better results, we hereby propose a dual-stage reconstruction algorithm involving nuclear norm minimization. The former stage aims to promote the sparsity of the signal in the learned dictionary using the K-singular value decomposition (KSVD) [37] and the latter stage optimizes the results obtained in the first stage.
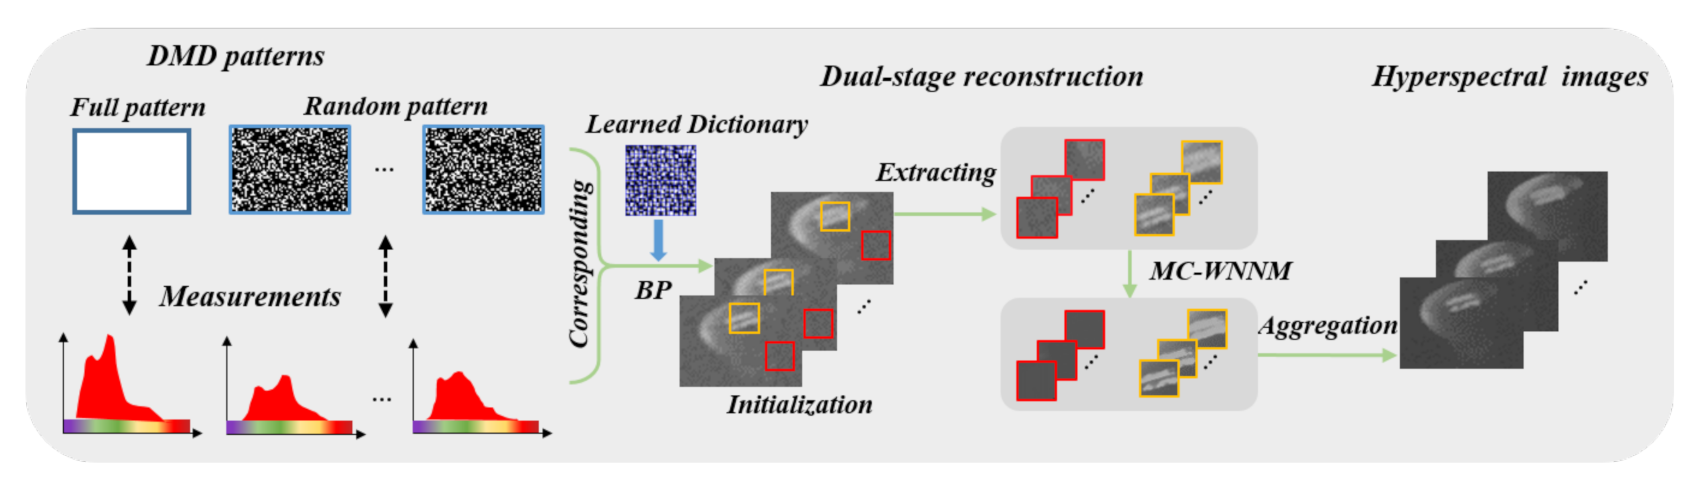
A flowchart representing the proposed algorithm for MIR-CHI reconstruction is depicted in Figure 7. After the side information and compressive coded measurements are captured by the MIR-CHI system (left part in Figure 7), the dual-stage reconstruction algorithm (middle part in Figure 7) proceeds the initial reconstruction by basis pursuit (BP) [30], where the over-completed dictionary as sparse matrix is learned by KSVD on the external infrared dataset. It is followed by extended multi-channel weighted nuclear norm minimization (MC-WNNM) optimizing for the initial reconstruction images to obtain clearer hyperspectral images (right part in Figure 7).
Reconstruction Implementation
To boost the correctness of solution of from its compressive measurements, CS theory demands the use of sparsity promoting prior. Then its sparse representation can be denoted by
where is the dictionary (sparse representation basis) and denotes the sparse coefficients of the signal under the basis. Under this transformation, the reconstruction problem can be written as
where is a regularization parameter, and represents the -norm used to impose the sparsity.
As mentioned before, the dictionary is learned by KSVD. In particular, each image patch can be represented as a sparse linear combination of a small number of atoms which are selected from an appropriately over-complete dictionary with V atoms (). Each image patch is represented as a column vector , where U is the number of pixels within the patch. Then, this sparse representation process seeks the most informative representation of the patch that minimizes the reconstruction error, i.e.,
where denotes the sparse coefficients vetor. The -norm is the objective function used to reduce the representation error. The -norm counts the nonzero entries of a vector.
As our desired HSI is of the spatial size pixels, we train the dictionary by treating the entire image at each channel as one patch. Specifically, a dictionary is learned using the KSVD method on the training images from the infrared dataset [38]. The choice 6144 come from the requirement that the number of columns in the dictionary is much larger than the number of rows in the dictionary. 12000 patches of size from the training images randomly selected are used as the training set. The orthogonal matching pursuit (OMP) [30] algorithm is used for the atoms selection in the dictionary learning step because of its simplicity and fast execution.
Then the sparse coding of in Equtaion (17) is conducted by BP. After the estimation, the reconstruction can be obtained by
The recovery performance of such a convex optimization will degrade in the presence of noise, and the solution can seriously deviate from the original solution of the inverse problem. Inspired by the work in [39], which has been successfully used in visible image denoising, we build a spatial-spectral model by extending the weighted matrix from the RGB channels to the spectral channels. Since the matrix formed by nonlocal similar patches in hyperspectral images is of low rank, low rank matrix approximation can be used to recover the potential low rank structure of a matrix from its degraded observation. Therefore, we propose a dual-stage reconstruction model to boost the reconstruction quality via exploiting the high-dimensional structure of the desired signal. Specifically, by integrating the compressive sampling model in first stage with the extended multi-channel weighted nuclear norm minimization in the second stage for hyperspectral image patch groups, a joint model for hyperspectral images reconstruction is constructed.
In this model, the hyperspectral images are initially reconstructed in the first stage. Then for each reference patch, the patches in local neighbourhood with size are searched and most similar patches to it by the Euclidean distance are grouped into a patch-group. Note that this patch grouping is conducted across L spectral channels. As all the patches in the matrix (with each patch being a column) have similar structures, the constructed data matrix should be a low-rank matrix. Based on this assumption, the redundant information and noise can be effectively removed from the reconstructed data using low-rank minimization as a constraint. Let being the patch group for a reference patch with spatial-size for L spectral channels and similar patches are being collected. We formulate the MC-WNNM denoising as follows:
where denotes the denoised hyperspectral images, denotes patch groups of the desired hyperspectral images, denotes the Frobenius norm, is the weighted nuclear norm of matrix , is the weight vector, and is the i-th singular value of . The weighting matrix is introduced to balance the noise in the spectral channels.
where denote the standard deviation of the noise in the l-th spectral channel and is an identity matrix. Equation (20) can be solved using the alternating direction method of multipliers (ADMM) [40] framework.
Specifically, we set the patch size as , the number of spectral channels across the patch and non-local similar patches as , , respectively, the window size for searching similar patches as . The number of iterations in solving Equation (20) via ADMM is set to 10. After we solved Equation (20), the patch groups are aggregated to form the denoised hyperspectral images.
4. Simulation Results and Analysis
In this section, we conduct simulation to verify the hardware principle and the proposed reconstruction algorithm. Infrared spectral images were obtained using scanning spectral imaging system with a spectroradiometer (MR170). We randomly generate the binary mask with equal probability of zeros and ones. The sensing process is simulated to generate the measurements . With these measurements as input, we perform the reconstruction algorithms to get the reconstructed hyperspectral images. The peak signal-to-noise ratio (PSNR) and structural similarity (SSIM) are employed as metrics to evaluate the quality of reconstructed images. In all the simulations, the regularization parameters are adjusted to provide the optimal results.
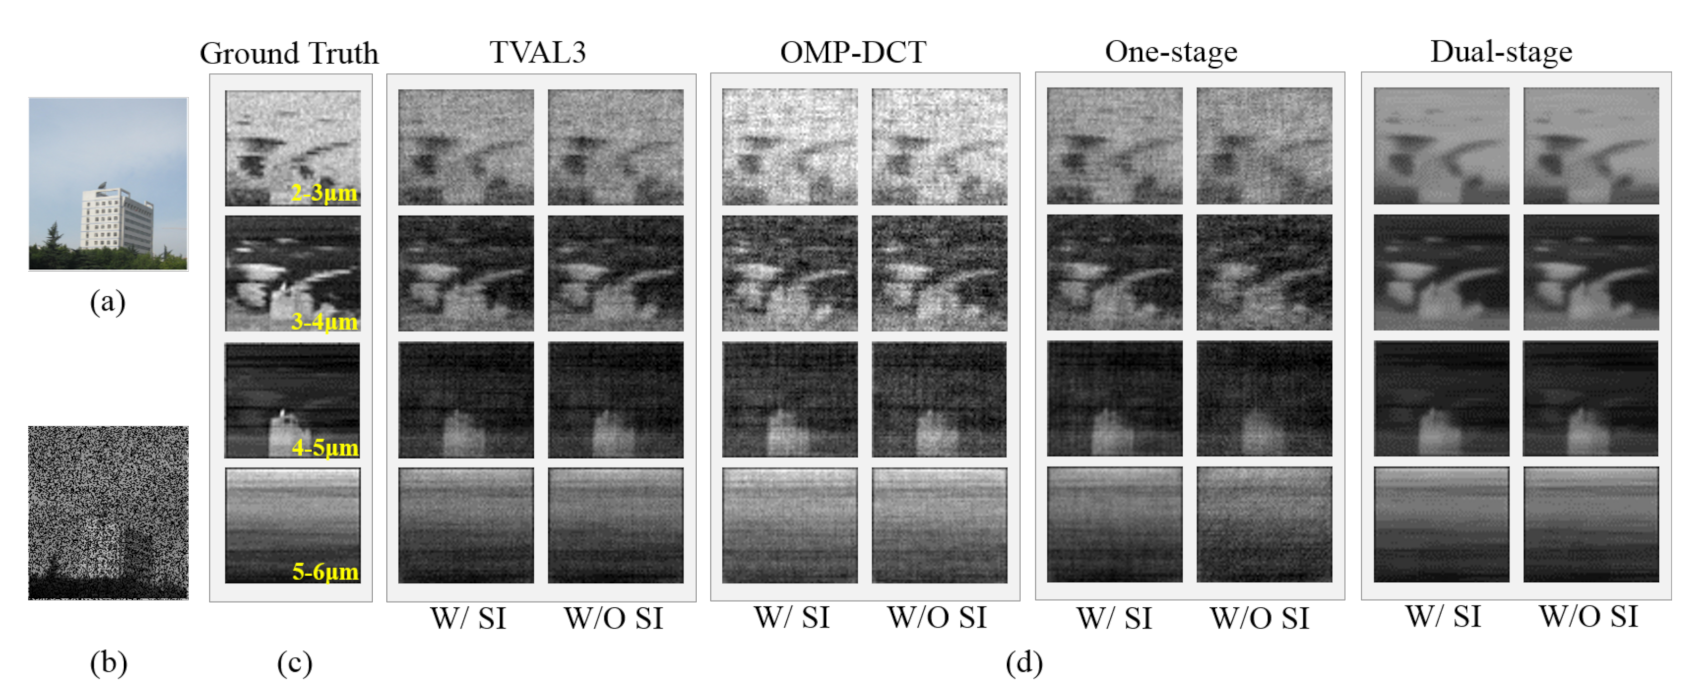
We test the proposed MIR-CHI system and reconstruction algorithms with the captured infrared spectral images with ground truth, as shown in Figure 8. Three classical reconstruction algorithms, OMP [30] using fixed sparse basis DCT, total variation (TVAL3) [31] and one-stage without denoising process (BP using learned dictionary) are chosen as comparison methods. The compression ratio is fixed at the same value as = . It can be seen that Figure 8a is an RGB scene with building, and Figure 8b is the coded scene. The spectral images is of spatial size as shown in Figure 8c. Reconstructed spectral images using different algorithms with and without side information (SI) are shown in Figure 8d, and the PSNR and SSIM are summarized in Figure 9. In addition, for all four algorithms, the reconstructed spectral images with SI have higher PSNRs and SSIMs than the reconstructed spectral images without SI, which is in agreement with our analysis. Furthermore, we notice that the dual-stage reconstruction algorithm with SI always performs best in terms of PSNR and SSIM.
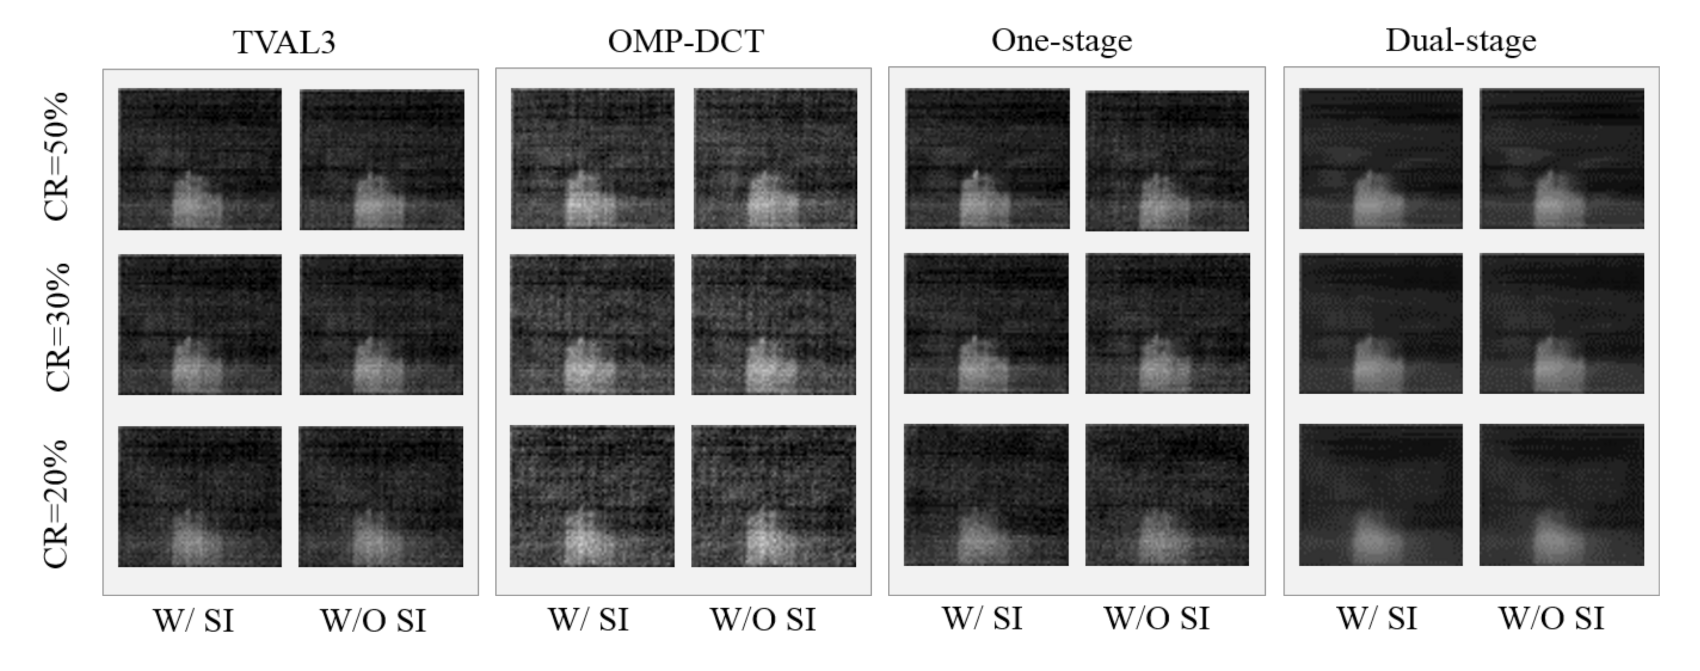
To evaluate the impact of the compression ratio on the quality of reconstruction, we perform a set of reconstructed results at different compression ratios such as , , and for the selected spectral channel at 4–5 μm, depicted in Figure 10. We again use PSNR and SSIM to evaluate the reconstructed results presented in Table 2 and Table 3. Through increasing the measurement number, it provides more information about the target and therefore would perform higher quality of reconstruction. Furthermore, in contrast, the proposed dual-stage reconstruction algorithm can produce clearer imaging results at every compression ratio.
5. Experiment Results and Analysis
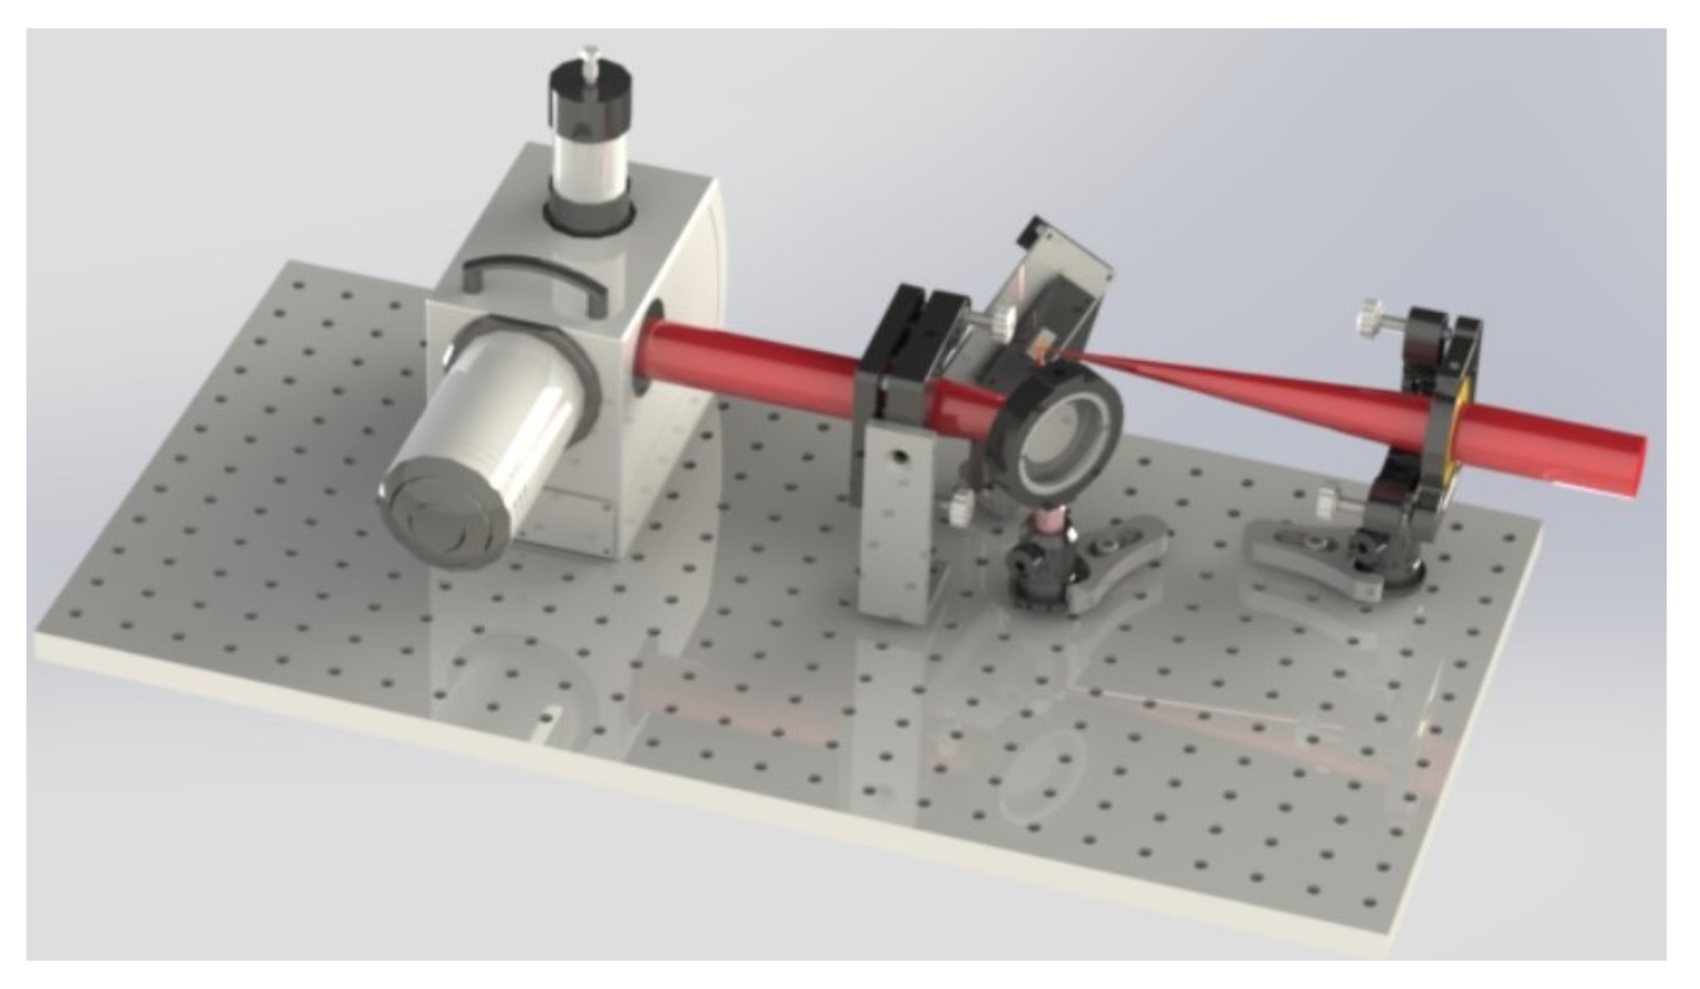
To experimentally verify the effectiveness of the proposed imaging architecture and the dual-stage reconstruction algorithm, we build a proof-of-concept MIR-CHI system, as depicted in Figure 11. The basic components as follows: the objective lens is made of ZnSe with a focal length of 127 . The modified MIR-DMD with numbers of 1024 × 768 pixels is commanded by 16 × 16 “super pixels" to create random masks of 64 × 48 spatial resolution. Thus, all the results of our experiment are of 64 × 48 pixels. The condenser lens is made of ZnSe with a focal length of 190 , and the infrared spectroradiometer is SR-5000N with 50 spectra/sec. Therefore, in our experiment, the acquisition time is less than 1 minute when the compression ratio is fixed as = (1000 samples). We calibrate our system using an infrared monochromator () before it captures data.
Subsequently, we apply the proposed MIR-CHI system prototype to acquire compressive spectral information about blackbody target and validate our reconstruction algorithm. The target is a carved “X" on a panel (in Figure 12a). The measurement captured by our MIR-CHI system is shown in Figure 12b. The reconstructed images from the measurements with and without SI are shown in Figure 12c. Since the ground truth is not available for this real target, we evaluate it by visual perception and the spectral angular mapper (SAM) [41], which is used to quantitatively demonstrate the spectral reconstruction effect. The SAM is defined as follows:
where represents the dot product between the reference image and its approximation. A smaller value of SAM suggests the better reconstruction.
It can be seen from Figure 12c that the acquisition of side information alleviates the poor performance attained without side information. In addition, it can be observed that some visual artifacts are still visible in all competing methods. By constrast, our proposed method significantly removes undesirable artifacts across all the hyperspectral images.
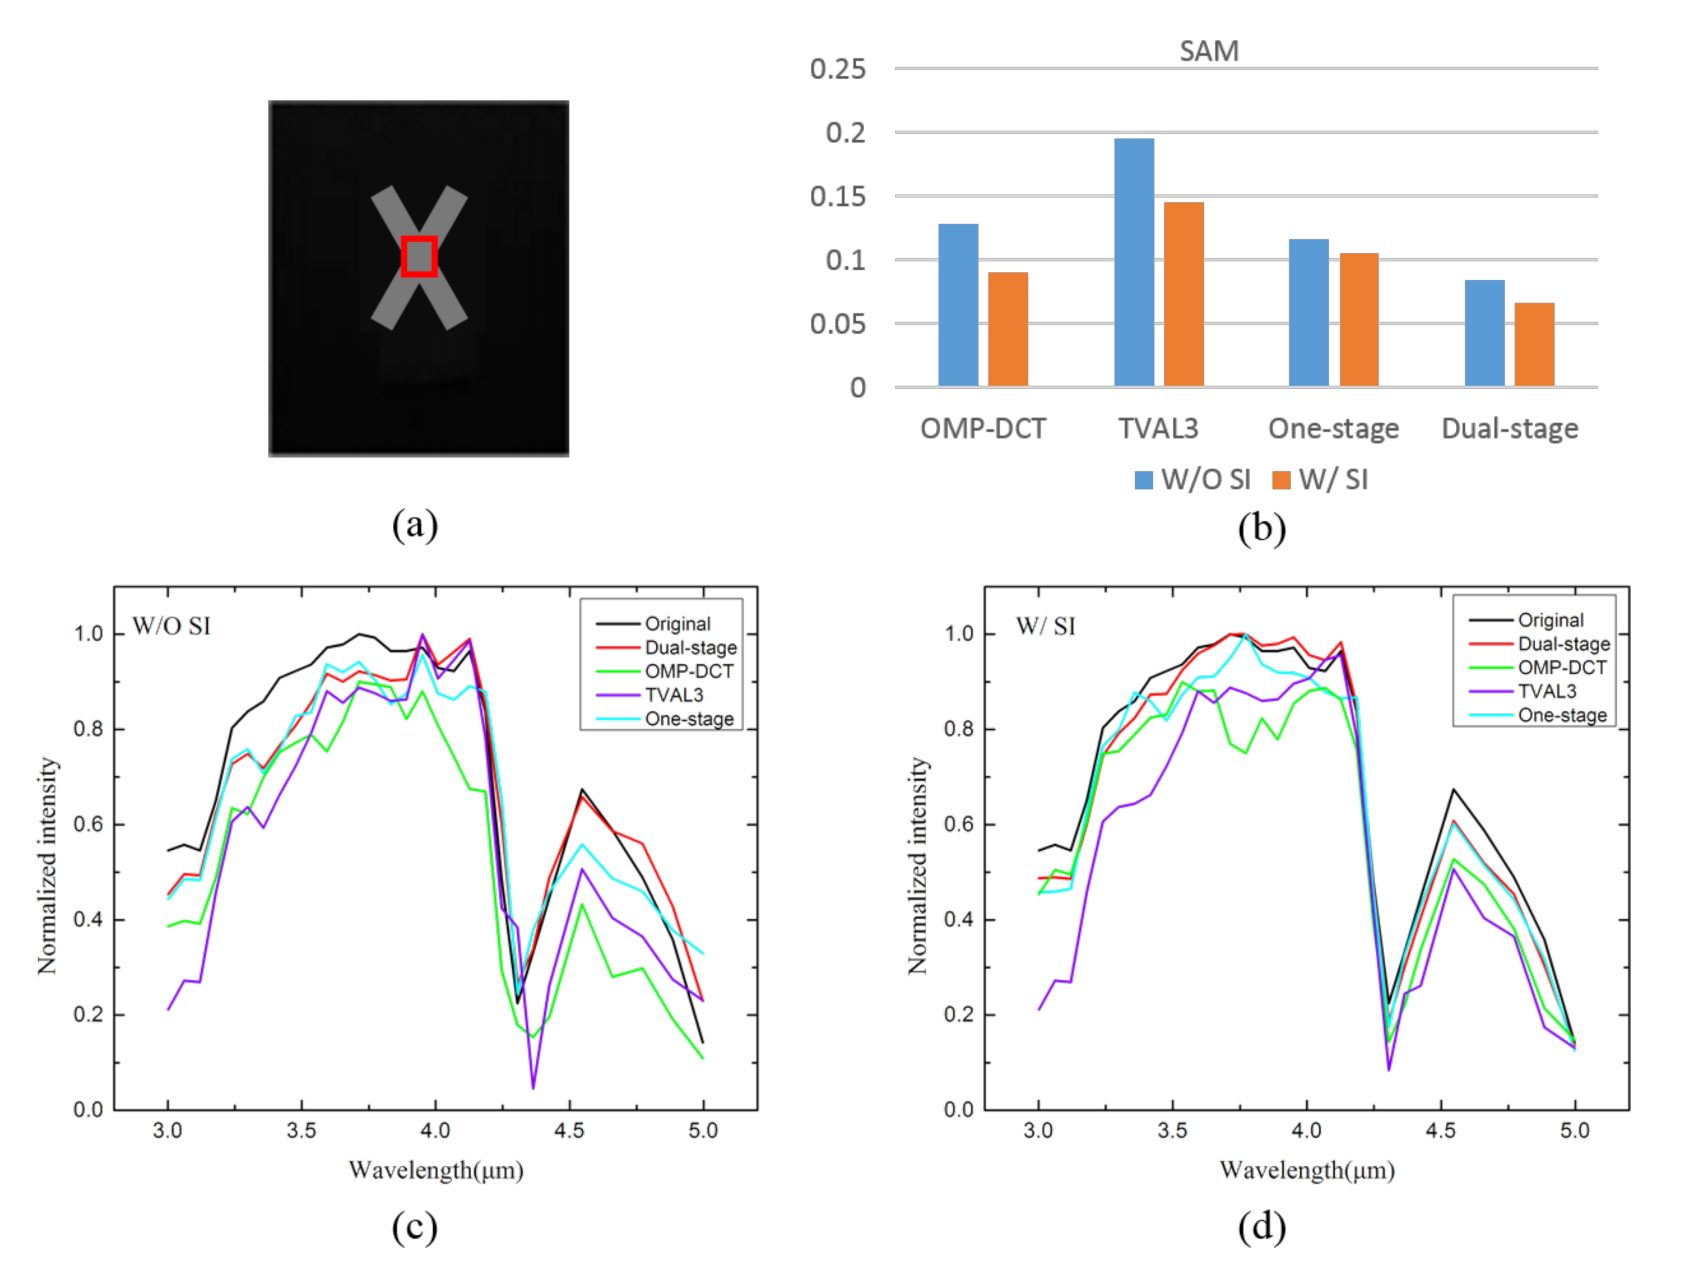
Furthermore, to verify the spectral fidelity of the proposed system, we compare the spectral reconstruction results with the reference spectra depicted in Figure 13c,d. In particular, the spectral signatures of the reference spectra acquired directly with the spectroradiometer (SR-5000N) at selected point highlighted in Figure 13a. And the recovered spectra are extracted from 30 reconstructed hyperspectral images (The 30 wavelengths are 3.002 μm, 3.061 μm, 3.120 μm, 3.180 μm, 3.239 μm, 3.298 μm, 3.357 μm, 3.417 μm, 3.476 μm, 3.535 μm, 3.594 μm, 3.653 μm, 3.713 μm, 3.772 μm, 3.831 μm, 3.890 μm, 3.950 μm, 4.009 μm, 4.068 μm, 4.127 μm, 4.186 μm, 4.246 μm, 4.305 μm, 4.364 μm, 4.423 μm, 4.546 μm, 4.659 μm, 4.771 μm, 4.884 μm, and 4.996 μm.) at the same point. It can be seen that the spectra of all algorithms with SI have a good match with the ground truth, and the proposed algorithm gives the best results, which can be further demonstrated by the SAM (in Figure 13b). From the reconstructed results of the referable blackbody target, we can derive a conclusion that designed MIR-CHI system with different reconstruction algorithms can obtain accurate hyperspectral images and spectral information. Moreover, it can be seen clearly that our proposed method with side information provides the best reconstructed results with respect to both image clarity and spectral accuracy. Without the use of side information, the proposed model yields less clear images and reconstructs the spectra poorly. This verified the benefit of the side information in real data.
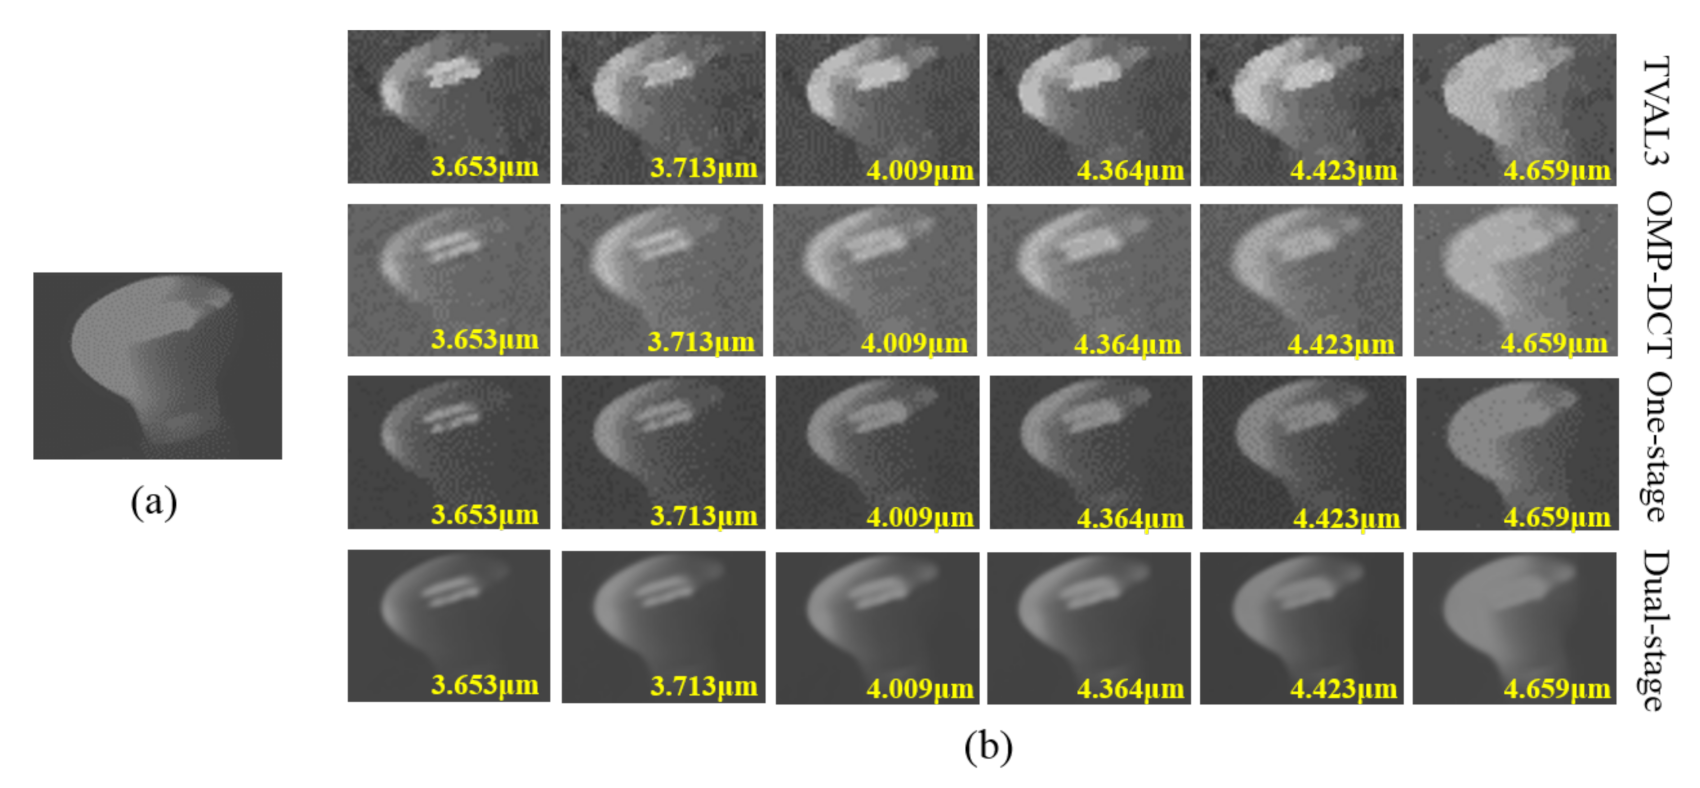
In another experiment, an incandescent located from the MIR-CHI system is used as the thermal target. The reconstructed spectral images with SI of six selected channels using different algorithms are shown in Figure 14b. It can be seen clearly that there is still some artificial noise in the results of OMP-DCT and one-stage methods, while the TVAL3 tends to oversmooth the details of images. However, our proposed method presents the best reconstructed results that not only preserves fine image details, but also removes the visual artifacts significantly. Furthermore, we also found that the incandescent filament cannot be recognized in its broadband MIR image (in Figure 14a), because it is so hot that it saturates the detector, while in the spectral images the incandescent filament can be clearly seen in Figure 14b, and its image features is also changed with the spectral channels. Furthermore, it can also be found that the incandescent filament has stronger spectral characteristics around 3.653 μm. Similarly, there are different spectral characteristics in other substances, which would be useful in applications for distinguishing thermal targets.
6. Conclusions
In this study, we reported a MIR-CHI system that addresses the MIR hyperspectral imaging problem using CS. As a key component, DMD was successfully modified as MIR-DMD to adapt to infrared radiation modulation, which is implemented through both randomly coded measurement and the other without any coding. To promote the quality of reconstruction results, the correlation in hyperspectral images is leveraged to develop a dual-stage reconstruction algorithm to recover infrared hyperspectral images from these measurements. The simulation and experiment results demonstrated improved performance of the reconstructed hyperspectral images with the SI, and the proposed dual-stage reconstruction presents the best results. These results demonstrate that the proposed MIR-CHI system is a feasible method, and presents a less expensive alternative to conventional MIR hyperspectral imaging systems. Our system can be applied to identify thermal targets with different spectrum characteristic such as recognizing the elements of flammable material from its corresponding flames and gas elements from its corresponding plumes. A direction for future work is to extend our hyperspectral imaging framework to other infrared spectral applications.
Author Contributions
S.Y. designed the system, made the experiments and wrote the manuscript; X.Y. (Xiang Yan) wrote and review; H.Q. assisted in the prepared work; Q.Z. designed the methodology; Y.L. discussed the results; H.A. gave some comments; X.Y. (Xin Yuan) review and editing. All authors contributed to the improvement of the manuscript’s presentation. All authors have read and agreed to the published version of the manuscript.
Funding
This research was funded by the National Natural Science Foundation of China (No. 61901330), the Natural Science Foundation of Shaanxi Province (No. 2020JQ-322), and the China Postdoctoral Science Foundation (No. 2019M653566).
Institutional Review Board Statement
Not applicable.
Informed Consent Statement
Not applicable.
Data Availability Statement
The data used in this research are available from the authors upon reasonable requests.
Acknowledgments
The authors would like to thank the China Scholarship Council for their financial support and help.
Conflicts of Interest
The authors declare no conflict of interest.
References
- Tang, F.; Xu, H. Impervious surface information extraction based on hyperspectral remote sensing imagery. Remote Sens. 2017, 9, 550. [Google Scholar] [CrossRef] [Green Version]
- Kim, S. Novel Air Temperature Measurement Using Midwave Hyperspectral Fourier Transform Infrared Imaging in the Carbon Dioxide Absorption Band. Remote Sens. 2020, 12, 1860. [Google Scholar] [CrossRef]
- Leonarski, L.; C-Labonnote, L.; Compiègne, M.; Vidot, J.; Baran, A.J.; Dubuisson, P. Potential of Hyperspectral Thermal Infrared Spaceborne Measurements to Retrieve Ice Cloud Physical Properties: Case Study of IASI and IASI-NG. Remote Sens. 2021, 13, 116. [Google Scholar] [CrossRef]
- Russell, C.; Raymond, C.; Coradini, A.; McSween, H.; Zuber, M.T.; Nathues, A.; De Sanctis, M.C.; Jaumann, R.; Konopliv, A.; Preusker, F.; et al. Dawn at Vesta: Testing the protoplanetary paradigm. Science 2012, 336, 684–686. [Google Scholar] [CrossRef] [Green Version]
- Diener, R.; Tepper, J.; Labadie, L.; Pertsch, T.; Nolte, S.; Minardi, S. Towards 3D-photonic, multi-telescope beam combiners for mid-infrared astrointerferometry. Opt. Express 2017, 25, 19262–19274. [Google Scholar] [CrossRef] [PubMed]
- Tratt, D.M.; Young, S.J.; Hackwell, J.A.; Rudy, D.J.; Warren, D.W.; Vore, A.G.; Johnson, P.D. MAHI: An airborne mid-infrared imaging spectrometer for industrial emissions monitoring. IEEE Trans. Geosci. Remote Sens. 2017, 55, 4558–4566. [Google Scholar] [CrossRef]
- Scafutto, R.D.M.; de Souza Filho, C.R. Detection of methane plumes using airborne midwave infrared (3–5 m) hyperspectral data. Remote Sens. 2018, 10, 1237. [Google Scholar] [CrossRef] [Green Version]
- Wen, M.; Wang, Y.; Yao, Y.; Yuan, L.; Zhou, S.; Wang, J. Design and performance of curved prism-based mid-wave infrared hyperspectral imager. Infrared Phys. Technol. 2018, 95, 5–11. [Google Scholar] [CrossRef]
- Wu, K.; Luo, Z.; Feng, Y.; Yu, G.; Liu, L.; Xiong, Y.; Li, F. 2D visualization of hot gas based on a mid-infrared molecular Faraday imaging filter. Opt. Lett. 2018, 43, 3686–3689. [Google Scholar] [CrossRef]
- He, Z.; Li, J.; Li, C.; Xu, R. Measurement and Correction Model for Temperature Dependence of an Acousto-Optic Tunable Filter (AOTF) Infrared Spectrometer for Lunar Surface Detection. Appl. Spectrosc. 2020, 74, 81–87. [Google Scholar] [CrossRef]
- Chen, L.; Lopez-Garcia, M.; Taverne, M.P.; Zheng, X.; Ho, Y.L.D.; Rarity, J. Direct wide-angle measurement of a photonic band structure in a three-dimensional photonic crystal using infrared Fourier imaging spectroscopy. Opt. Lett. 2017, 42, 1584–1587. [Google Scholar] [CrossRef] [PubMed] [Green Version]
- Köhler, M.H.; Naßl, S.S.; Kienle, P.; Dong, X.; Koch, A.W. Broadband static Fourier transform mid-infrared spectrometer. Appl. Opt. 2019, 58, 3393–3400. [Google Scholar] [CrossRef]
- Donoho, D.L. Compressed sensing. IEEE Trans. Inf. Theory 2006, 52, 1289–1306. [Google Scholar] [CrossRef]
- Duarte, M.F.; Davenport, M.A.; Takhar, D.; Laska, J.N.; Sun, T.; Kelly, K.F.; Baraniuk, R.G. Single-pixel imaging via compressive sampling. IEEE Signal Process. Mag. 2008, 25, 83–91. [Google Scholar] [CrossRef] [Green Version]
- Yi, Q.; Heng, L.Z.; Liang, L.; Guangcan, Z.; Siong, C.F.; Guangya, Z. Hadamard transform-based hyperspectral imaging using a single-pixel detector. Opt. Express 2020, 28, 16126–16139. [Google Scholar] [CrossRef] [PubMed]
- Ribes, M.; Russias, G.; Tregoat, D.; Fournier, A. Towards Low-Cost Hyperspectral Single-Pixel Imaging for Plant Phenotyping. Sensors 2020, 20, 1132. [Google Scholar] [CrossRef] [Green Version]
- Gattinger, P.; Kilgus, J.; Zorin, I.; Langer, G.; Nikzad-Langerodi, R.; Rankl, C.; Gröschl, M.; Brandstetter, M. Broadband near-infrared hyperspectral single pixel imaging for chemical characterization. Opt. Express 2019, 27, 12666–12672. [Google Scholar] [CrossRef]
- Shibuya, K.; Minamikawa, T.; Mizutani, Y.; Yamamoto, H.; Minoshima, K.; Yasui, T.; Iwata, T. Scan-less hyperspectral dual-comb single-pixel-imaging in both amplitude and phase. Opt. Express 2017, 25, 21947–21957. [Google Scholar] [CrossRef]
- Rousset, F.; Ducros, N.; Peyrin, F.; Valentini, G.; D’andrea, C.; Farina, A. Time-resolved multispectral imaging based on an adaptive single-pixel camera. Opt. Express 2018, 26, 10550–10558. [Google Scholar] [CrossRef]
- Garcia, H.; Correa, C.V.; Arguello, H. Multi-resolution compressive spectral imaging reconstruction from single pixel measurements. IEEE Trans. Image Process. 2018, 27, 6174–6184. [Google Scholar] [CrossRef] [PubMed]
- Bentley, A.; Rowe, J.E.; Dehghani, H. Single pixel hyperspectral bioluminescence tomography based on compressive sensing. Biomed. Opt. Express 2019, 10, 5549–5564. [Google Scholar] [CrossRef] [PubMed]
- Edgar, M.P.; Gibson, G.M.; Padgett, M.J. Principles and prospects for single-pixel imaging. Nat. Photonics 2019, 13, 13–20. [Google Scholar] [CrossRef]
- Rice, J.P.; Neira, J.E.; Kehoe, M.; Swanson, R. DMD diffraction measurements to support design of projectors for test and evaluation of multispectral and hyperspectral imaging sensors. In Proceedings of the Emerging Digital Micromirror Device Based Systems and Applications, San Jose, CA, USA, 14–16 February 2009. [Google Scholar]
- Phillips, D.B.; Sun, M.J.; Taylor, J.M.; Edgar, M.P.; Barnett, S.M.; Gibson, G.G.; Padgett, M.J. Adaptive foveated single-pixel imaging with dynamic super-sampling. Sci. Adv. 2017, 3, e1601782. [Google Scholar] [CrossRef] [Green Version]
- Yuan, X.; Tsai, T.; Zhu, R.; Llull, P.; Brady, D.; Carin, L. Compressive Hyperspectral Imaging with Side Information. IEEE J. Sel. Top. Signal Process. 2015, 9, 964–976. [Google Scholar] [CrossRef] [Green Version]
- Renna, F.; Wang, L.; Yuan, X.; Yang, J.; Reeves, G.; Calderbank, R.; Carin, L.; Rodrigues, M.R. Classification and reconstruction of high-dimensional signals from low-dimensional features in the presence of side information. IEEE Trans. Inf. Theory 2016, 62, 6459–6492. [Google Scholar] [CrossRef] [Green Version]
- Yuan, X.; Sun, Y.; Pang, S. Compressive video sensing with side information. Appl. Opt. 2017, 56, 2697–2704. [Google Scholar] [CrossRef]
- Figueiredo, M.A.; Nowak, R.D.; Wright, S.J. Gradient projection for sparse reconstruction: Application to compressed sensing and other inverse problems. IEEE J. Sel. Top. Signal Process. 2007, 1, 586–597. [Google Scholar] [CrossRef] [Green Version]
- Bioucas-Dias, J.M.; Figueiredo, M.A. A new TwIST: Two-step iterative shrinkage/thresholding algorithms for image restoration. IEEE Trans. Image Process. 2007, 16, 2992–3004. [Google Scholar] [CrossRef] [PubMed] [Green Version]
- Tropp, J.A.; Gilbert, A.C. Signal recovery from random measurements via orthogonal matching pursuit. IEEE Trans. Inf. Theory 2007, 53, 4655–4666. [Google Scholar] [CrossRef] [Green Version]
- Li, C.; Yin, W.; Jiang, H.; Zhang, Y. An efficient augmented Lagrangian method with applications to total variation minimization. Comput. Optim. Appl. 2013, 56, 507–530. [Google Scholar] [CrossRef] [Green Version]
- Huggins, P.S.; Zucker, S.W. Greedy basis pursuit. IEEE Trans. Signal Process. 2007, 55, 3760–3772. [Google Scholar] [CrossRef]
- Yuan, X. Generalized alternating projection based total variation minimization for compressive sensing. In Proceedings of the 2016 IEEE International Conference on Image Processing (ICIP), Phoenix, AZ, USA, 25–28 September 2016; pp. 2539–2543. [Google Scholar]
- Liu, Y.; Yuan, X.; Suo, J.; Brady, D.J.; Dai, Q. Rank Minimization for Snapshot Compressive Imaging. IEEE Trans. Pattern Anal. Mach. Intell. 2019, 41, 2990–3006. [Google Scholar] [CrossRef] [PubMed] [Green Version]
- Miao, X.; Yuan, X.; Pu, Y.; Athitsos, V. λ-net: Reconstruct Hyperspectral Images from a Snapshot Measurement. In Proceedings of the IEEE International Conference on Computer Vision, Seoul, Korea, 27 October–2 November 2019; pp. 4058–4068. [Google Scholar]
- Meng, Z.; Ma, J.; Yuan, X. End-to-End Low Cost Compressive Spectral Imaging with Spatial-Spectral Self-Attention. Proceedings of European Conference on Computer Vision, Glasgow, UK, 23–28 August 2020; pp. 187–204. [Google Scholar]
- Aharon, M.; Elad, M.; Bruckstein, A. K-SVD: An algorithm for designing overcomplete dictionaries for sparse representation. IEEE Trans. Signal Process. 2006, 54, 4311–4322. [Google Scholar] [CrossRef]
- Xu, H.; Ma, J.; Le, Z.; Jiang, J.; Guo, X. FusionDN: A Unified Densely Connected Network for Image Fusion. In Proceedings of the AAAI Conference on Artificial Intelligence, New York, NY, USA, 7–12 February 2020; pp. 12484–12491. [Google Scholar]
- Xu, J.; Zhang, L.; Zhang, D.; Feng, X. Multi-channel weighted nuclear norm minimization for real color image denoising. In Proceedings of the IEEE International Conference on Computer Vision, Venice, Italy, 22–29 October 2017; pp. 1105–1113. [Google Scholar]
- Boyd, S.; Parikh, N.; Chu, E.; Peleato, B.; Eckstein, J. Distributed Optimization and Statistical Learning via the Alternating Direction Method of Multipliers. Found. Trends Mach. Learn. 2010, 3, 1–122. [Google Scholar] [CrossRef]
- Kruse, F.A.; Lefkoff, A.; Boardman, J.; Heidebrecht, K.; Shapiro, A.; Barloon, P.; Goetz, A. The spectral image processing system (SIPS)-interactive visualization and analysis of imaging spectrometer data. Remote Sens. Environ. 1993, 44, 145–163. [Google Scholar] [CrossRef]
Figure 1.
Framework of proposed MIR-CHI system.

Figure 2.
Modified MIR-DMD and transmission through its window.

Figure 3.
The layout of the complete optical system.

Figure 4.
The diffraction MTF of optical system for 3 μm.

Figure 5.
The diffraction MTF of optical system for 4 μm.
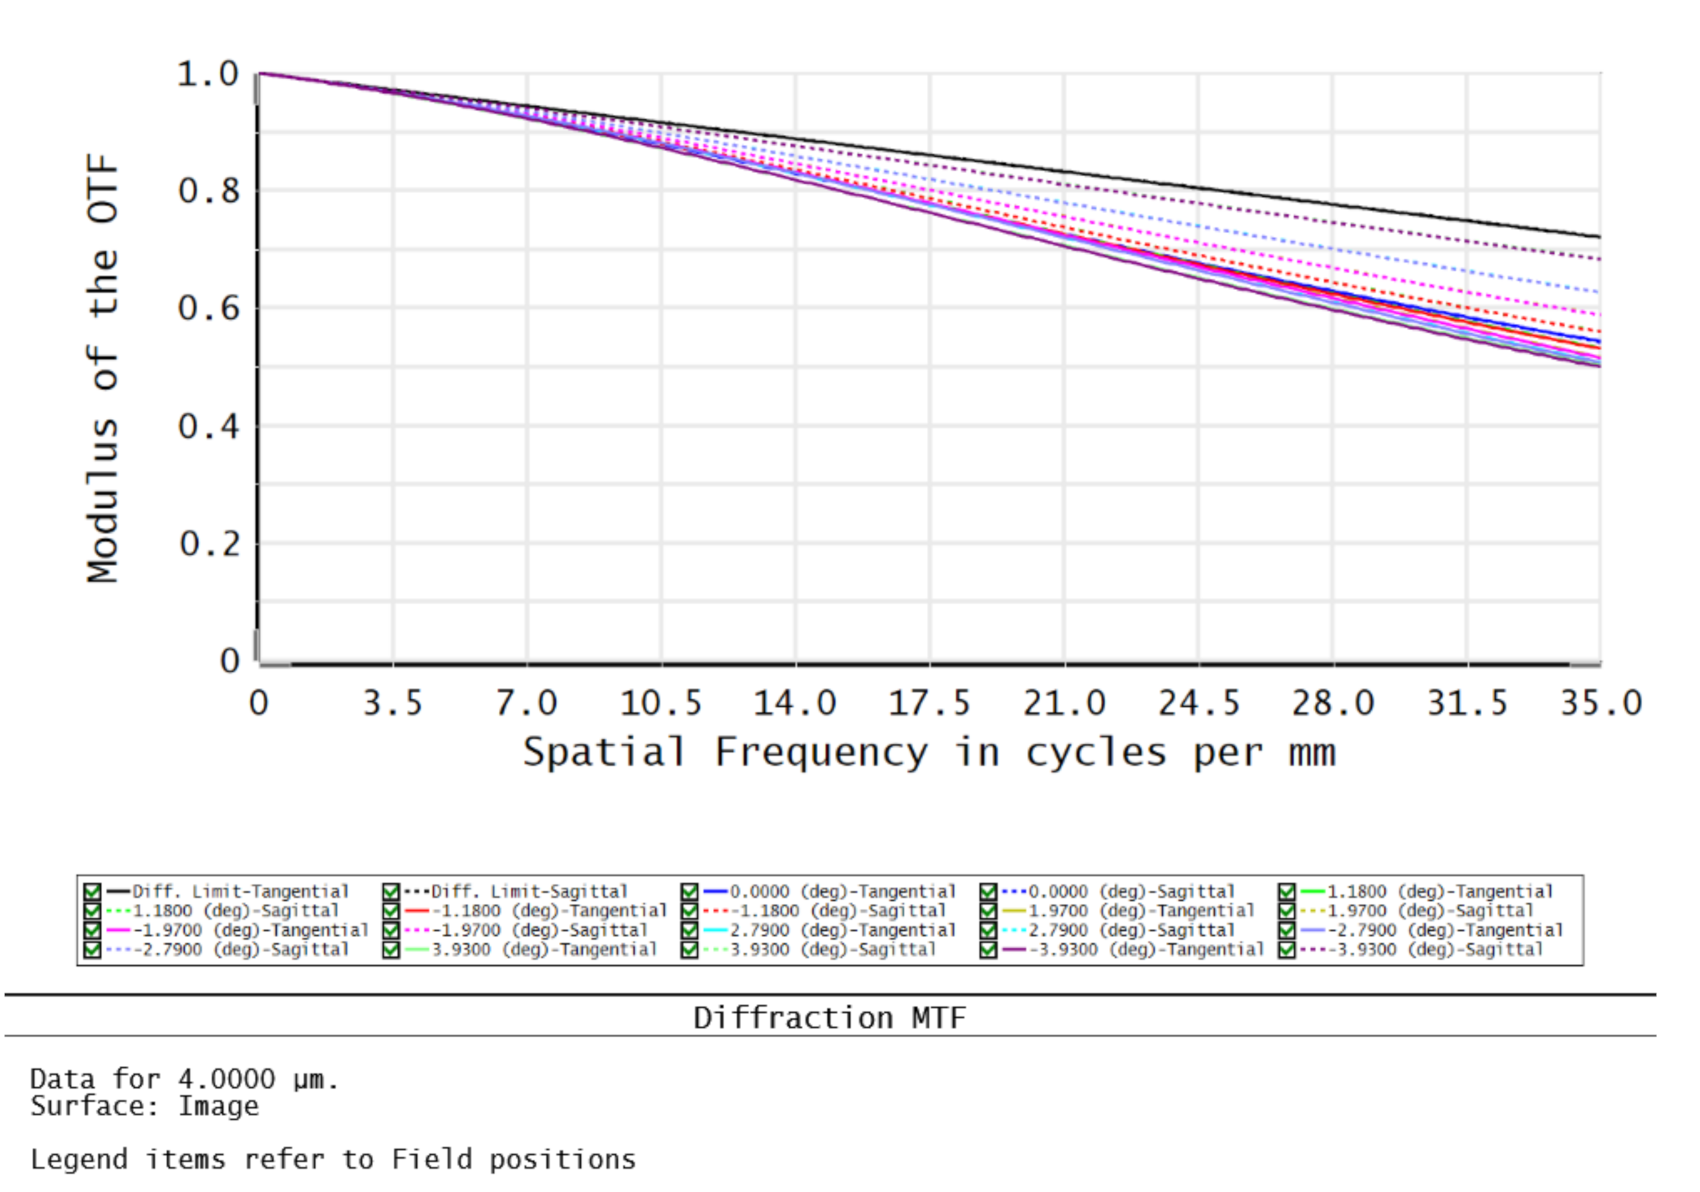
Figure 6.
The diffraction MTF of optical system for 5 μm.

Figure 7.
Flowchart of the algorithm for hyperspectral image reconstruction. Left: Input of coding patterns and corresponding spectral measurements, and learned dictionary. Middle: First stage of reconstruction based on BP, following by the second stage of optimizing using MC-WNNM. Right: Output of the reconstructed hyperspectral images.

Figure 8.
Coded and reconstructed spectral images with different algorithms compared with ground truth. (a) Original scene; (b) Coded scene; (c) Original spectral images in the spectral range of 2–3 μm, 3–4 μm, 4–5 μm, and 5–6 μm; (d) Reconstructed spectral images with different algorithms.
Figure 8.
Coded and reconstructed spectral images with different algorithms compared with ground truth. (a) Original scene; (b) Coded scene; (c) Original spectral images in the spectral range of 2–3 μm, 3–4 μm, 4–5 μm, and 5–6 μm; (d) Reconstructed spectral images with different algorithms.

Figure 9.
PSNR and SSIM of reconstructed spectral images with different algorithms.
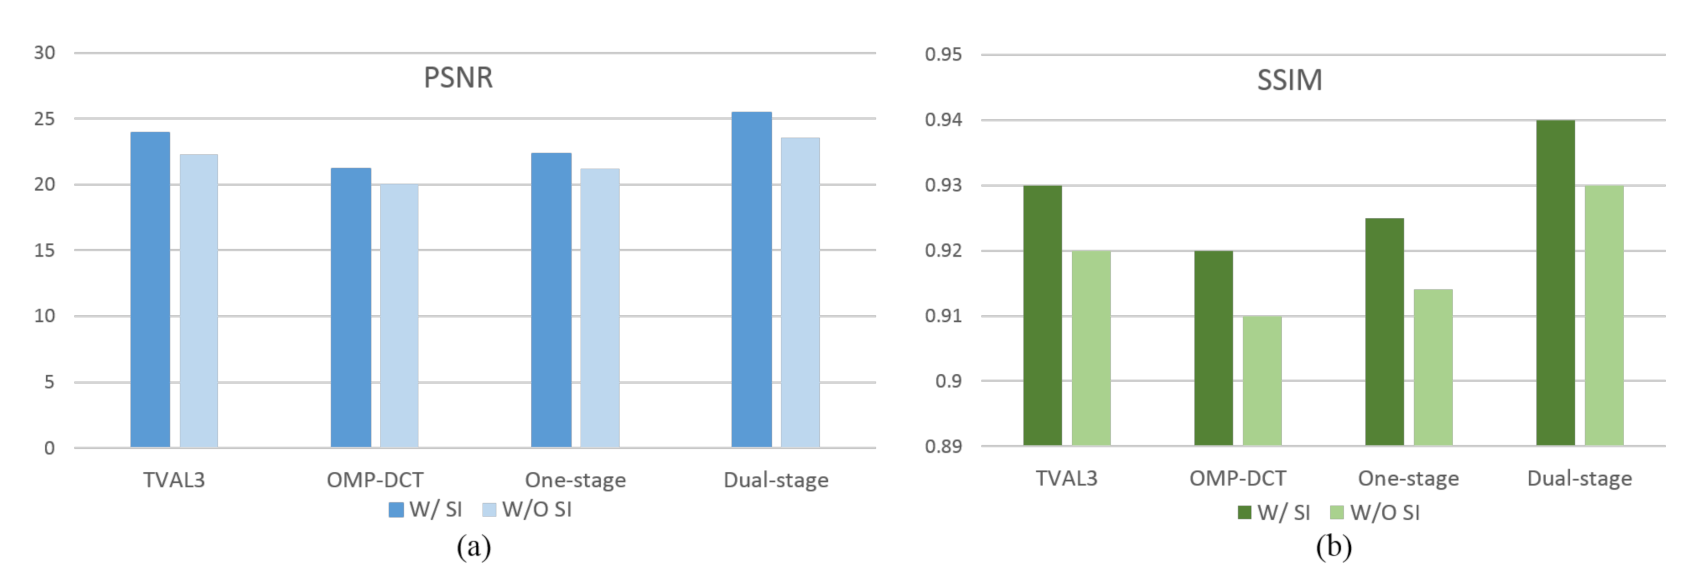
Figure 10.
Reconstructed spectral images with different algorithms for different compression ratios.
Figure 10.
Reconstructed spectral images with different algorithms for different compression ratios.

Figure 11.
The prototype of proposed MIR-CHI system.

Figure 12.
Blackbody target and reconstructed spectral images with different algorithms. (a) Original target; (b) Measurement curve captured by our MIR-CHI system; (c) Reconstructed spectral images with different algorithms.
Figure 12.
Blackbody target and reconstructed spectral images with different algorithms. (a) Original target; (b) Measurement curve captured by our MIR-CHI system; (c) Reconstructed spectral images with different algorithms.
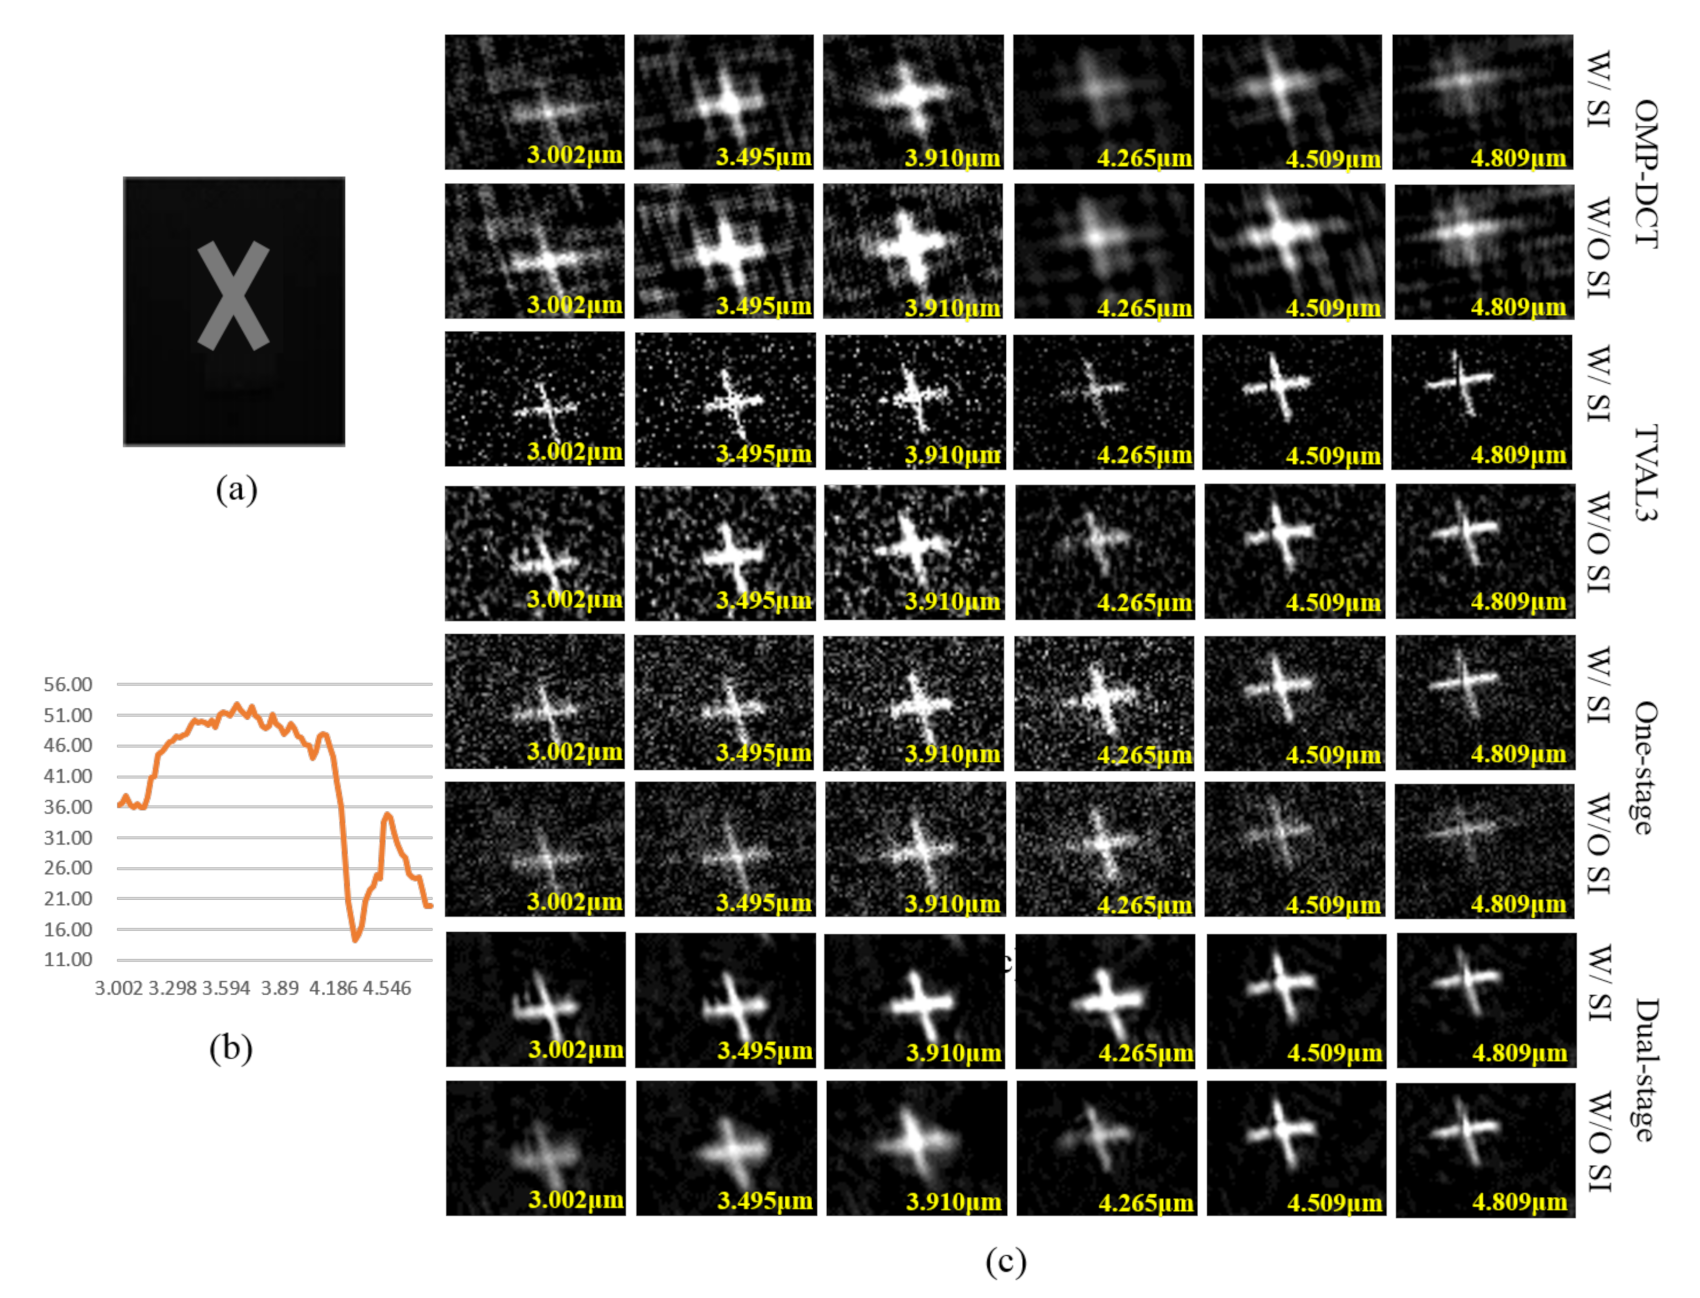
Figure 13.
Reconstructed spectra with various algorithms compared to reference. (a) Original target with selected point; (b) The SAM comparison of spectral reconstructed results with different algorithms; (c) The spectral reconstructed results by different algorithms without SI; (d) The spectral reconstructed results by different algorithms with SI.

Figure 14.
Incandescent target and reconstructed spectral images with different algorithms. (a) Original incandescent target; (b) Reconstructed spectral images with different algorithms with SI.
Figure 14.
Incandescent target and reconstructed spectral images with different algorithms. (a) Original incandescent target; (b) Reconstructed spectral images with different algorithms with SI.

Table 1.
MIR-CHI system design specifications and performance
| Parameter | Value |
|---|---|
| Scan type | gaze |
| Spectral range (m) | 3–5 |
| Spectral sampling (m) | 0.02 |
| Channels | 100 |
| Working F-number | 2 |
| Cross-track-FOV () | |
| Instantaneous FOV (mrad) | 0.107 |
| DMD array size (length×width) | |
| DMD pixel size (m) | |
| Detector array type | InSb |
Table 2.
PSNR of reconstructed spectral images with different algorithms for different compression ratios (CR).
Table 2.
PSNR of reconstructed spectral images with different algorithms for different compression ratios (CR).
| CR | TVAL3 | OMP-DCT | One-Stage | Dual-Stage | ||||
|---|---|---|---|---|---|---|---|---|
| W/SI | W/O SI | W/SI | W/O SI | W/SI | W/O SI | W/SI | W/O SI | |
| 50% | 26.3892 | 25.9950 | 24.8401 | 22.7719 | 25.1046 | 24.2007 | 27.7788 | 26.5584 |
| 30% | 25.5676 | 24.9654 | 23.4370 | 22.7518 | 23.2535 | 21.2978 | 26.3541 | 25.1254 |
| 20% | 20.5205 | 20.2104 | 21.6010 | 21.1771 | 21.3790 | 19.3972 | 23.4204 | 23.3864 |
Table 3.
SSIM of reconstructed spectral images with different algorithms for different compression ratios (CR).
Table 3.
SSIM of reconstructed spectral images with different algorithms for different compression ratios (CR).
| CR | TVAL3 | OMP-DCT | One-Stage | Dual-Stage | ||||
|---|---|---|---|---|---|---|---|---|
| W/SI | W/O SI | W/SI | W/O SI | W/SI | W/O SI | W/SI | W/O SI | |
| 50% | 0.9599 | 0.9472 | 0.9533 | 0.9470 | 0.9578 | 0.9516 | 0.9623 | 0.9536 |
| 30% | 0.9103 | 0.9025 | 0.9269 | 0.9188 | 0.9248 | 0.9194 | 0.9363 | 0.9265 |
| 20% | 0.8698 | 0.8259 | 0.8404 | 0.8163 | 0.8462 | 0.8114 | 0.8930 | 0.8785 |
Publisher’s Note: MDPI stays neutral with regard to jurisdictional claims in published maps and institutional affiliations. |
© 2021 by the authors. Licensee MDPI, Basel, Switzerland. This article is an open access article distributed under the terms and conditions of the Creative Commons Attribution (CC BY) license (http://creativecommons.org/licenses/by/4.0/).
Share and Cite
MDPI and ACS Style
Yang, S.; Yan, X.; Qin, H.; Zeng, Q.; Liang, Y.; Arguello, H.; Yuan, X. Mid-Infrared Compressive Hyperspectral Imaging. Remote Sens. 2021, 13, 741. https://0-doi-org.brum.beds.ac.uk/10.3390/rs13040741
AMA Style
Yang S, Yan X, Qin H, Zeng Q, Liang Y, Arguello H, Yuan X. Mid-Infrared Compressive Hyperspectral Imaging. Remote Sensing. 2021; 13(4):741. https://0-doi-org.brum.beds.ac.uk/10.3390/rs13040741
Chicago/Turabian StyleYang, Shuowen, Xiang Yan, Hanlin Qin, Qingjie Zeng, Yi Liang, Henry Arguello, and Xin Yuan. 2021. "Mid-Infrared Compressive Hyperspectral Imaging" Remote Sensing 13, no. 4: 741. https://0-doi-org.brum.beds.ac.uk/10.3390/rs13040741
Note that from the first issue of 2016, this journal uses article numbers instead of page numbers. See further details here.