1. Introduction
Unmanned aerial vehicles (UAVs), commonly named drones, have recently become widely used to study and monitor several earth surfaces processes. The increasing interest is mainly due to the wide variety of devices that can be carried on drones alongside their affordability, which results in remarkable products obtained in reasonable time and costs. This is particularly true for the use of UAV-acquired imagery, processed with digital photogrammetry technique, that allows for the reconstruction of topographic information and the obtaining of orthophotos, by using light and low-cost optical cameras.
Fluvial geomorphology is one of the main fields where aerial imagery has been increasingly used in combination with traditional techniques, since it can have a fundamental role in understanding processes that shape the landscape [
1,
2]. Former observations on the behavior of dynamic river channels were performed mainly through detailed within-channel traditional analysis [
3,
4], and more recently several studies have highlighted the direct monitoring of channel topography as a useful tool to better comprehend the relationship between river forms and processes for flood protection and river management purposes [
5,
6,
7]. Remote sensing techniques such as UAV photogrammetry have started to be a well-suited alternative to the conventional in situ activities, especially for multitemporal investigations. Similarly, satellite-based optical imagery has been applied in fluvial systems modeling and monitoring. However, these space-based systems have significant drawbacks in monitoring small areas that have dynamic changes and require highly detailed information [
8]. Furthermore, their temporal resolution can be extremely low (since same areas are not frequently revisited by satellites), limiting the possibility to perform multitemporal analysis in short periods [
9,
10]. Satellite optical imagery remains an optimal solution for the monitoring of wide areas, for which highly detailed spatial resolution is generally not required. On the other hand, UAV-based photogrammetry allows for the acquisition of data at sufficient resolution to represent channel geometry in fully three dimensions [
11,
12], and the low cost and easiness of the surveys make it possible to frequently investigate the area of interest [
13]. This led to a wide use of this technology in fluvial geomorphology, and several studies pointed out its suitability for both quantitative and qualitative analysis on channel dynamic changes [
14,
15,
16,
17], as well as riverbed sediment [
18,
19,
20,
21,
22]. Chandler et al. (2002) [
6] demonstrated the value of oblique digital photogrammetry for monitoring planform, topography, and changes in braided river channels, and used it as an input for computational flow models. Marteau et al. (2017) [
1] used photogrammetry to identify the geomorphic changes that occurred in a river channel in northwest England over time and proved its suitability to assess the effectiveness of river restoration measures. Riparian and riverbed vegetation are a pervasive feature of all river landscapes, providing habitat, aesthetics, and food and erosion control. It reduces flow velocity close to the banks increasing geomorphic stability [
23] and increases bank material strength via root reinforcement [
24,
25]. Vegetation in a fluvial environment can both promote deposition of coarse sediment and localized erosion due to piping and local turbulent scour [
26]. It can also impact flooding due to bridge occlusion and increased flow resistance [
23,
27]. Watanabe et al. (2016) [
7] carried out UAV photogrammetry before and after a man-made flood occurred in a Japanese river, showing the potentiality of their survey in morphological mapping and observing the dependency of vegetation density on the accuracy of the obtained models.
By means of both large- and small-scale analysis, this paper addresses the question of how we can best use high resolution UAV-based photogrammetry to model and monitor a river helping decision makers to correctly maintain it. One of the novelties consist of the rarity in obtaining high-resolution models that allow for the identification of processes on the order of centimeters in vast areas. Furthermore, the possibility to realize a complex survey in a short time with a single drone entirely designed, patented, and constructed form a university is discussed. Different photogrammetric techniques such as the nadiral and oblique perspectives have been compared to assess the optimal approach in a complex environment as here presented. Finally, both channel dynamic and riparian vegetation changes are recorded.
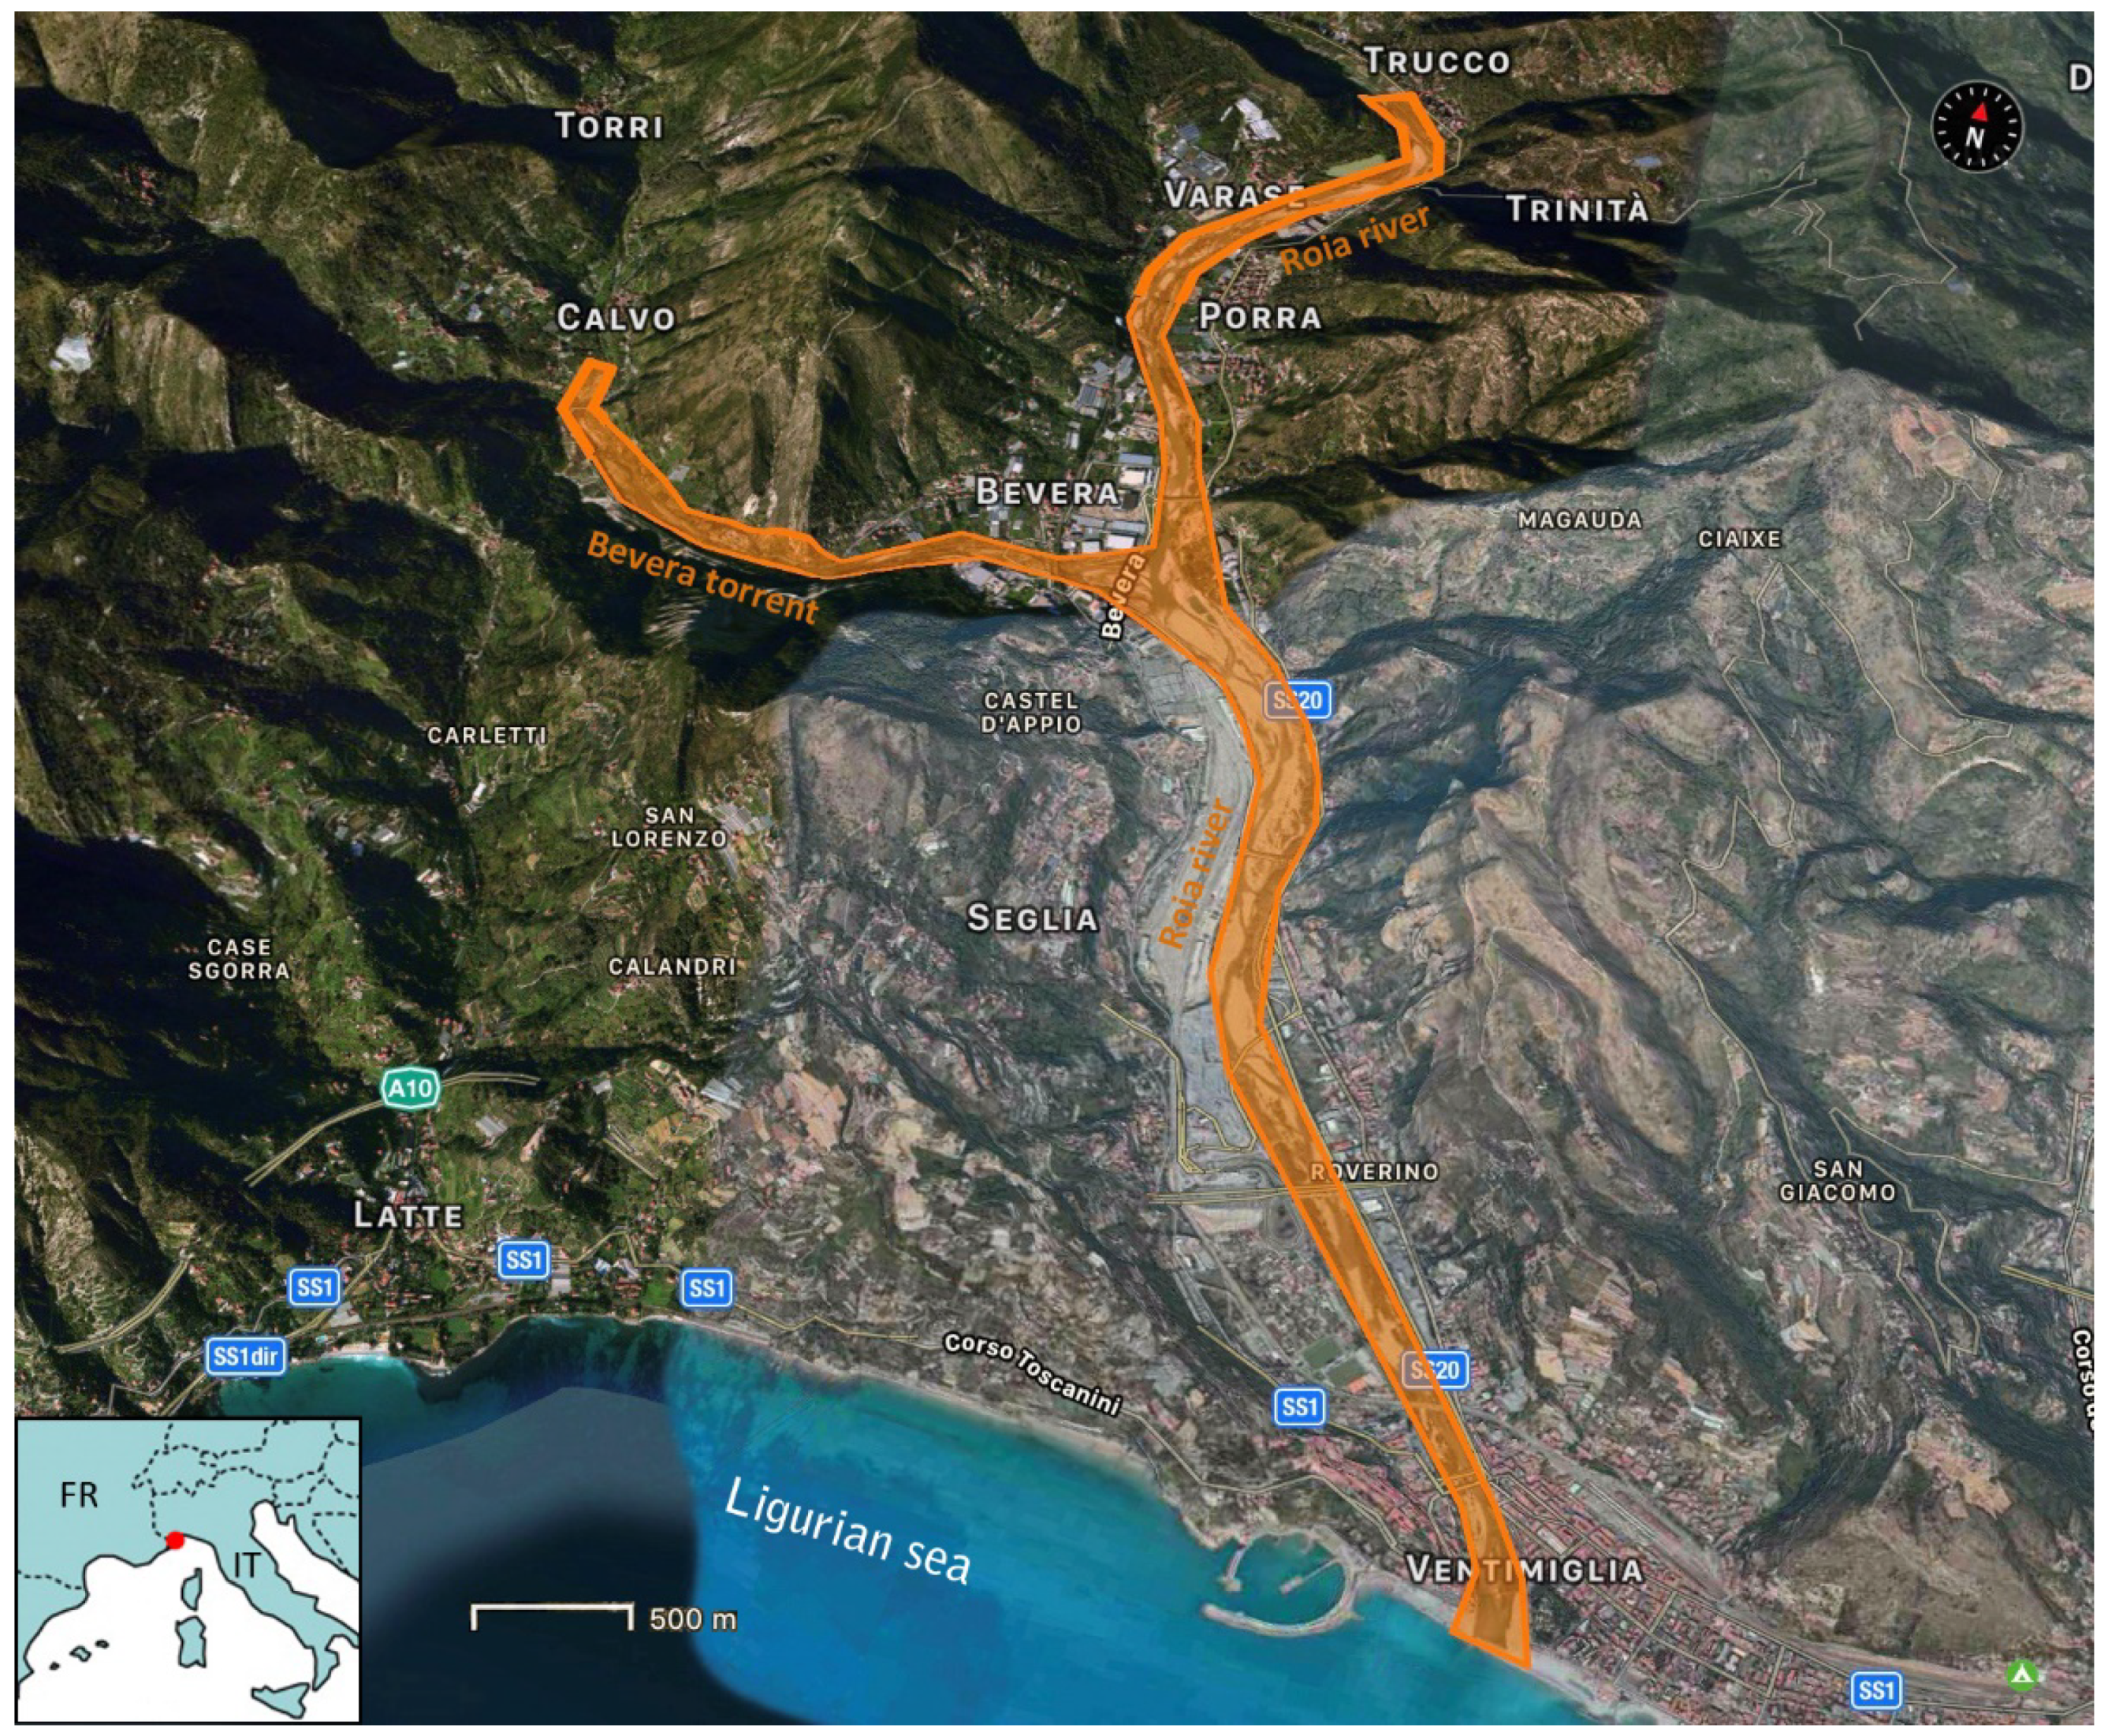
This study arises from an Interreg Alcotra “Concert Eaux” project, wherein a multitemporal survey on the Roia river was carried out. The river is a French–Italian river characterized by a torrential regime that evolves in a wide riverbed in its last stretch. The survey, repeated twice one year apart, focused on the last 12 km to the mouth, which is the Ligurian Sea.
Study Area
The Roia River is a 59 km long French–Italian river that originates at Colle di Tenda (FR (France), 1908 m) and flows into the Ligurian sea in Ventimiglia (IT (Italy)). Its first stretches are characterized by a steep riverbed carved in deep canyons that gives origin to suggestive shapes such as the famous Saorge Gorges, which contribute to increased water turbulence. The major part of its flow resembles a mountain torrent, but once in Trucco (IT), it flows in a valley and it creates a wide riverbed that becomes even larger when it meets the Bevera Torrent, its major tributary [
28,
29]. Hence, it crosses the city of Ventimiglia until it flows into the Ligurian Sea. Even though it shows a certain consistency of flow even during the dry season, the river has a markedly torrential regime, with significant flood episodes in autumn and late spring, and low water level in summer and winter. The riverbed study area is 7 km in the north–south direction and an average width of 150 m.
The study here presented is focused on the last 12 km of the river, composed of the main course of the Roia River from Trucco (where it has its maximum elevation of 41 m a.g.l.) to its mouth, plus a stretch of 2.5 km of the Bevera tributary (
Figure 1). Throughout this length, the riverbed is characterized by a strong presence of gravel deposits and riparian vegetation.
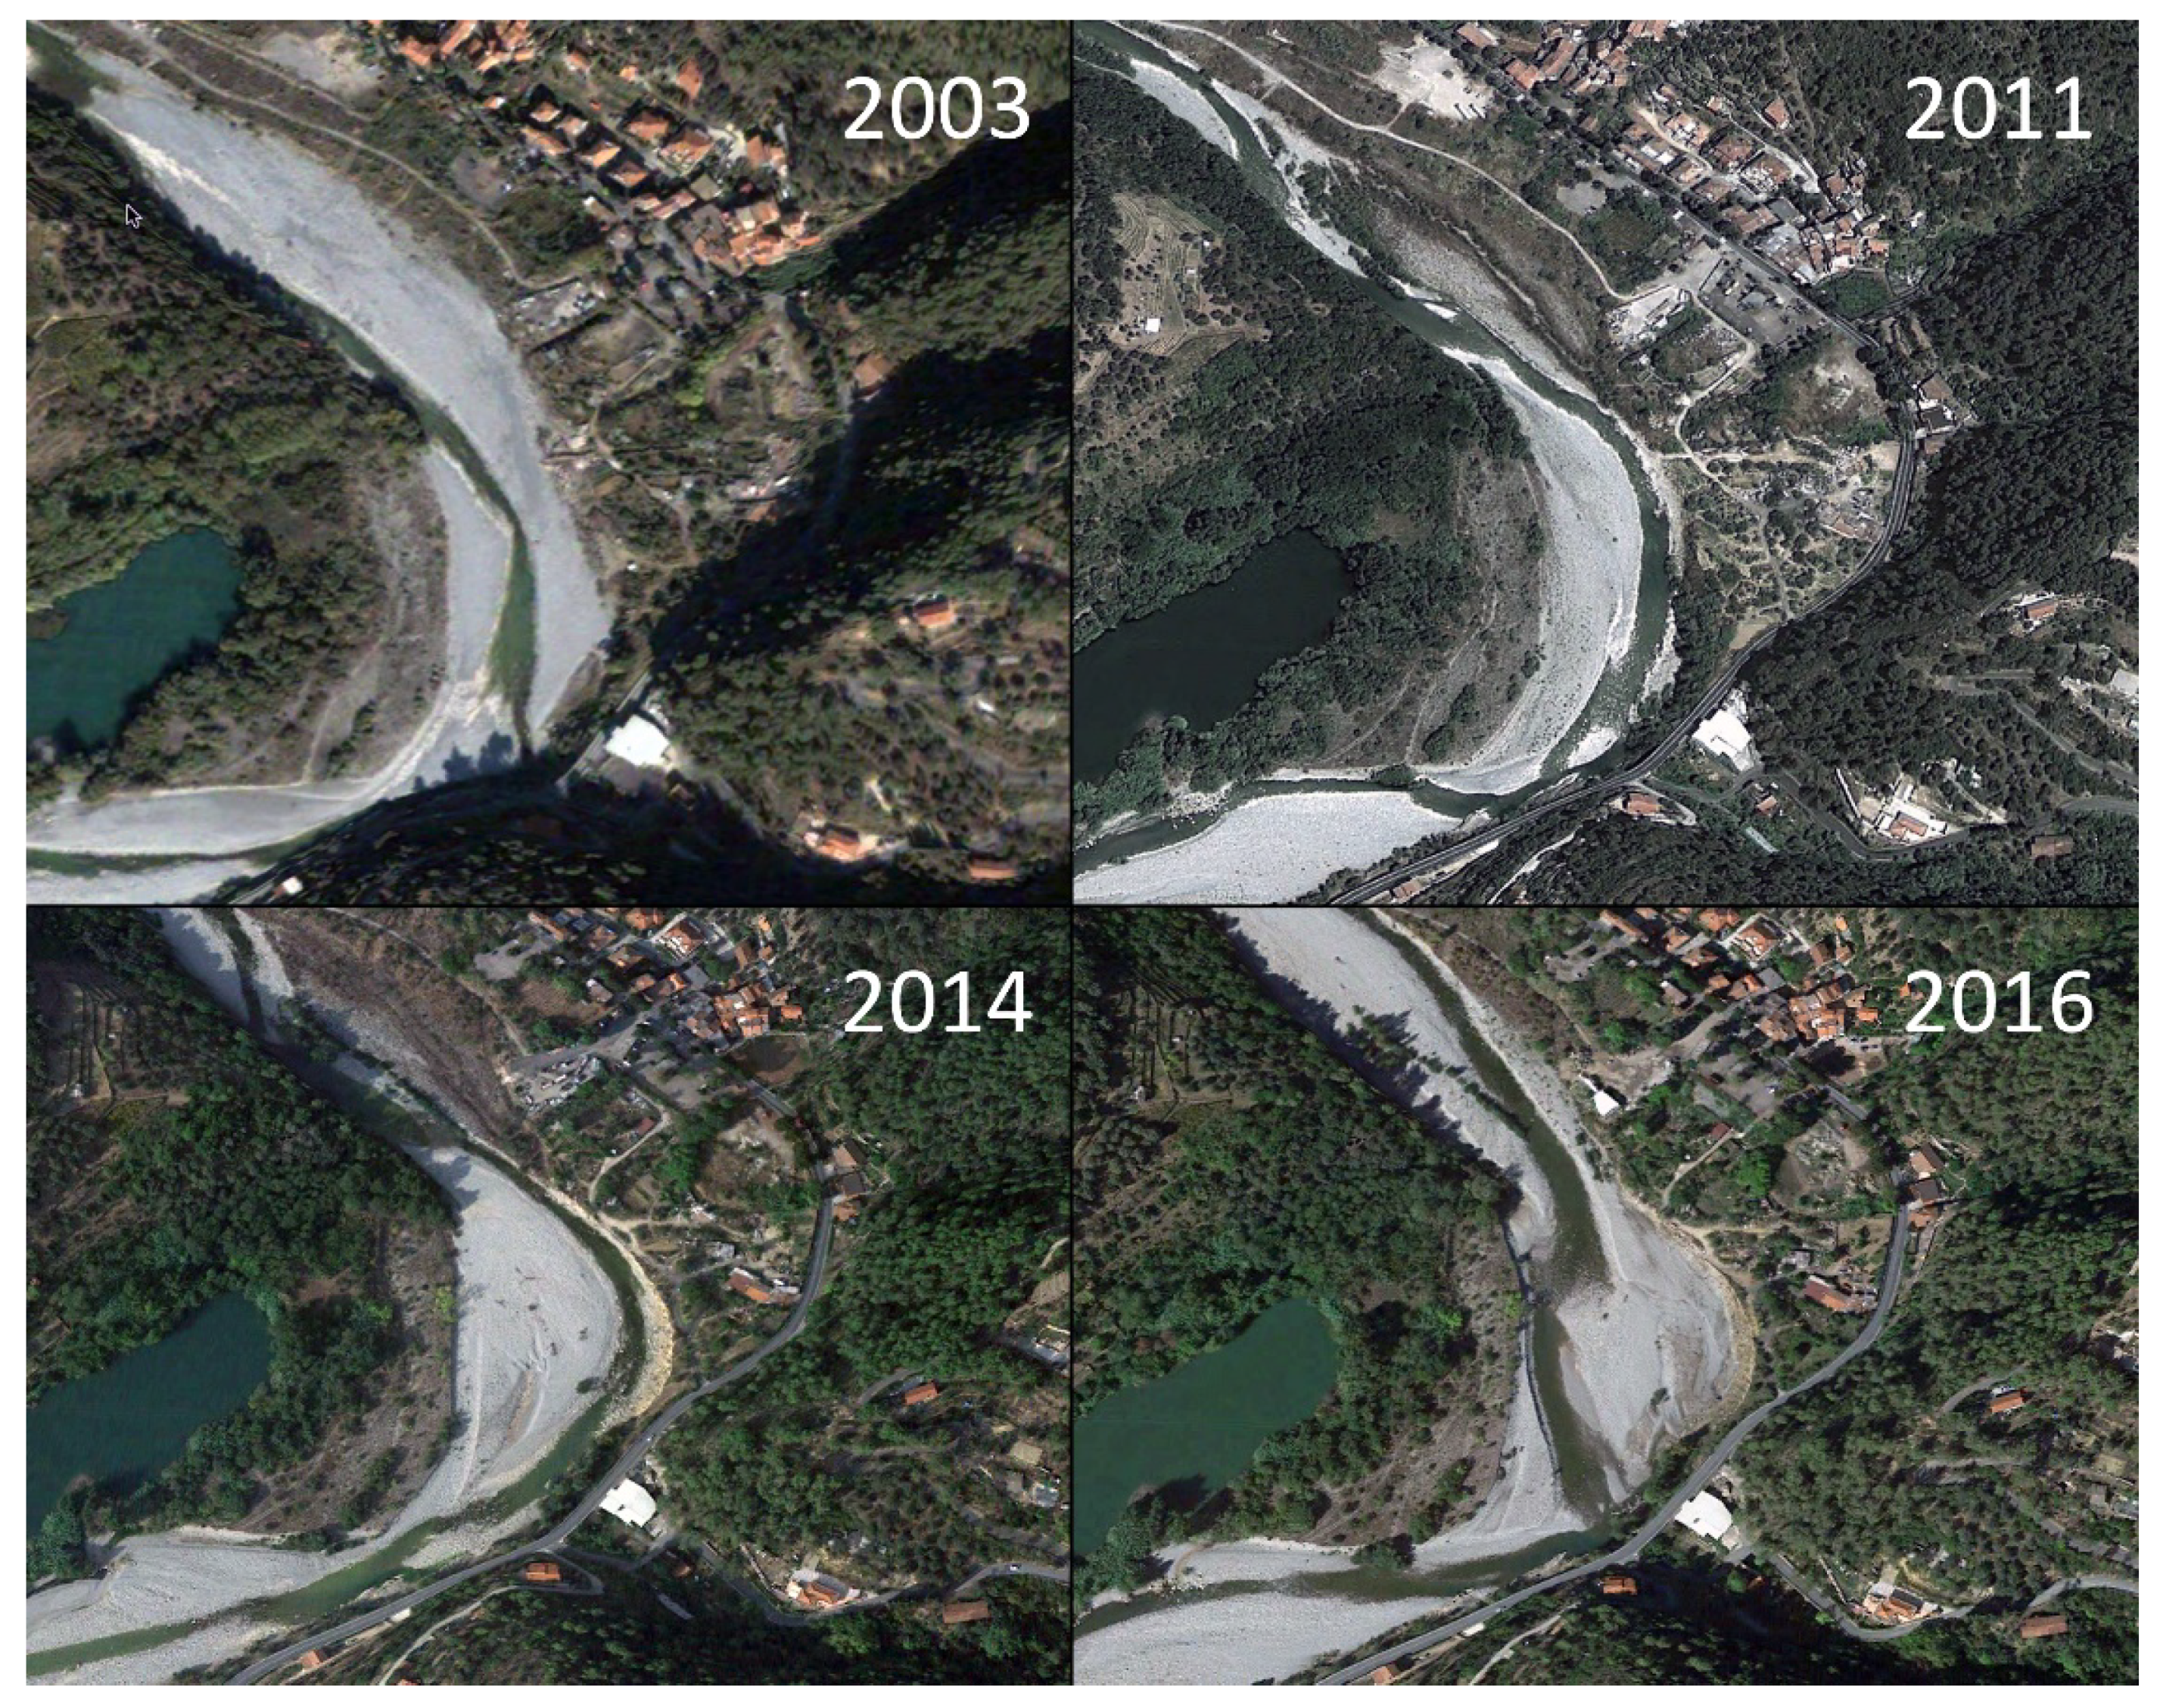
Over years, due to rapid urban development along with the proliferation of illegal artificial landfills and farming, the width of the riverbed has been dramatically reduced with respect to its natural width. Moreover, an intense withdrawal of gravel material from the riverbed, mainly for beach nourishment, has caused a remarkable alteration of the natural sediment balance of the river, contributing to making the delicate dynamic equilibrium of the stream even more unstable.
2. Materials and Methods
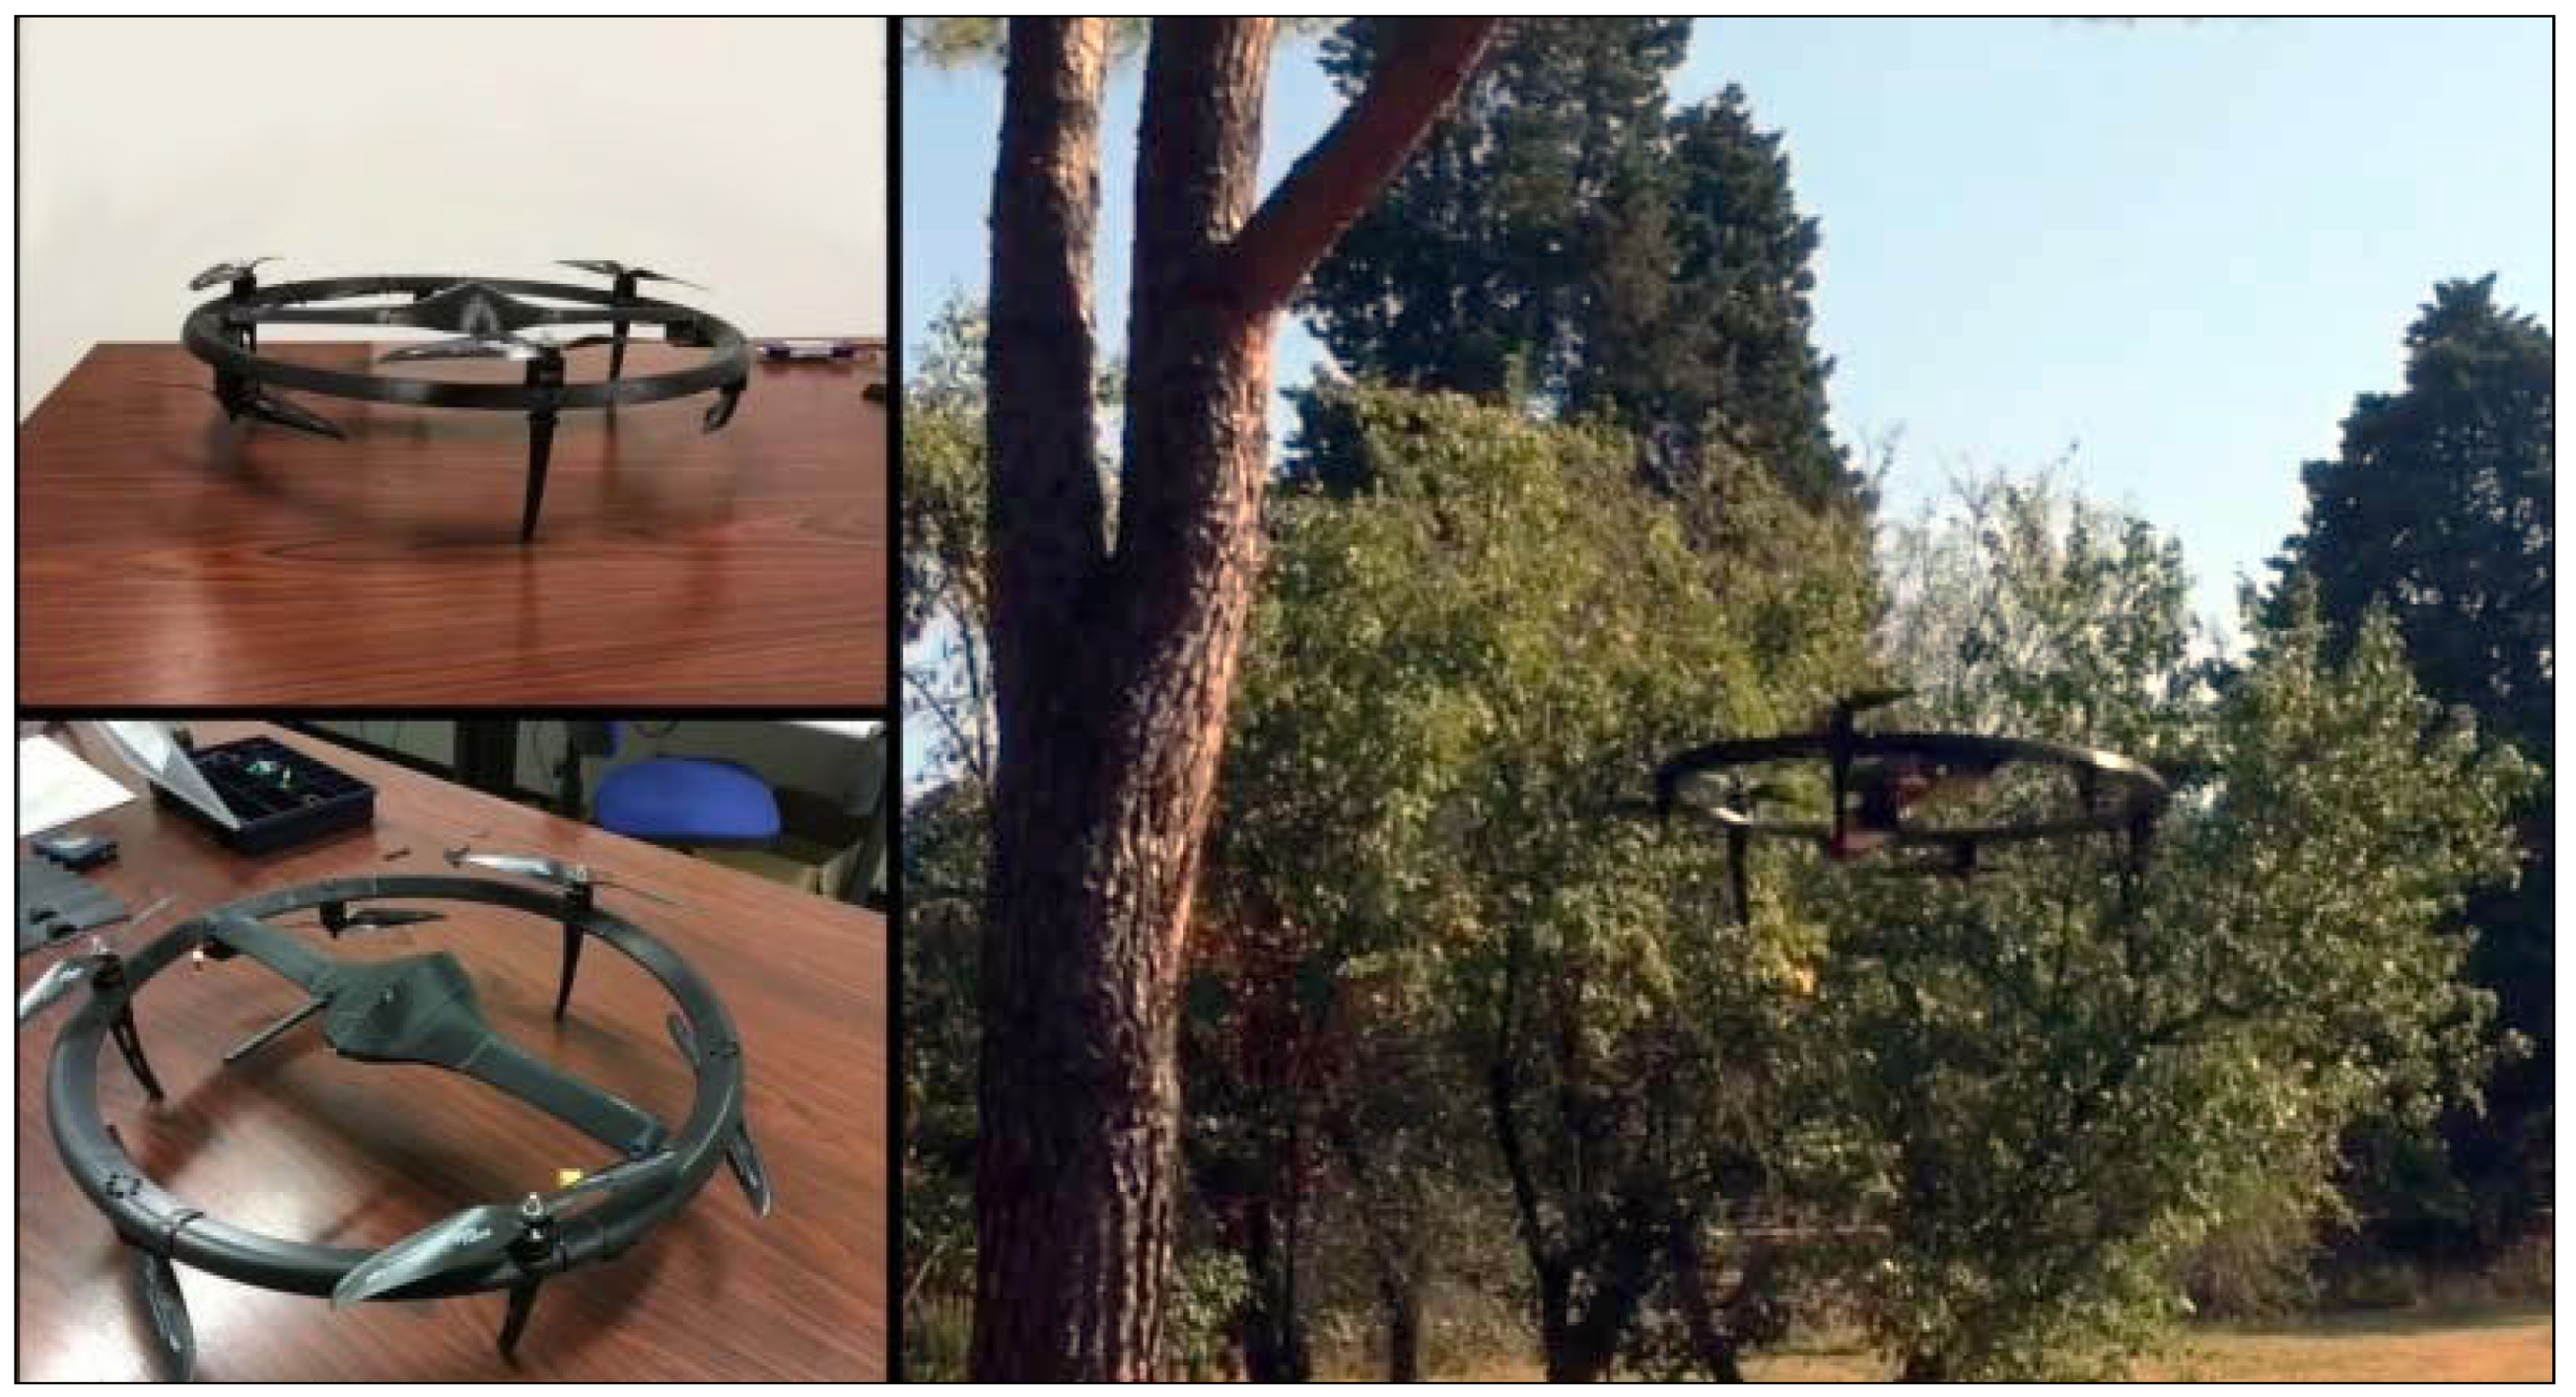
2.1. The Multi-Copter Saturn
Battery life, payload capacity, and flight safety are key and critical characteristics for a UAV. According to these points, the Earth Sciences Department and the Center of Civil Protection of the University of Florence (Italy) developed a new multi-copter concept to overcome some drawbacks of traditional drone configuration. The patented Saturn drone is designed with an innovative ring perimeter airframe that reduces the weight of multi-rotor configurations, thus improving the load capacity and flight autonomy. The rigid connection between the motors, crucial for a correct flight dynamic, is substituted by a ring perimeter frame avoiding the central structure and cutting down the vibrations spreading to the sensors and the flight instruments. Within the Saturn patent, flight safety of the drone is enhanced through the use of an automatic engine positioning system along the chassis that allows a reconfiguration of the engines even during the flight—in the event of an engine failure, it is possible to rebalance the flight attitude during an emergency landing without payload damage or an uncontrolled fall that could harm people.
The ring perimeter frame patent led to the development of a drone that has a configuration with 6 motors, whose propulsive redundancy reduces the chances of falling during emergency situations or limiting the ground impact in case of failure of up to 2 engines. The extremely rigid frame and the aerodynamics of the Saturn drone allows for remarkable performance both during ascent and descent. The descent rate is a critical parameter of the multi-rotors, which offers the capacity to handle rapid altitude losses without an uncontrolled fall. The control radio frequencies are redundant and differentiated to increase operational safety, even in the case of strong radio interference. A third frequency is dedicated to the pilot camera placed in the bow of the drone with very low latency. The dedicated pilot camera allows for safe operation even during flights that require the aiming of the sensors in different directions to those of the vehicle’s progress. This configuration is extremely practical during nadiral acquisitions in confined spaces within gorges or with vertical walls. The landing gear is a tripod that guarantees stability on takeoff but above all on landing even in rough terrain and in case of sustained winds and gusts.
The Saturn Mini drone (
Figure 2) has a diameter of 55 cm, maximum payload of 1.5 kg, and take-off operating mass under 4 kg, with a maximum autonomy of 30 min. The frame is entirely produced by 3D printing techniques in Acrylonitrile Butadiene Styrene (ABS) plastic polymer, resulting in an affordable solution and offering a high integration with instruments and sensors. The low maximum take-off weight means it is classified in a less restrictive category and, together with the payload capacity, make it suitable for a wide range of scenarios.
The maximum speed of the Saturn mini is about 90 km/h, giving it an excellent resistance to wind and possible gusts. The extreme maneuverability and the reduced flight restrictions make it particularly suitable for photogrammetric survey during rapid intervention for emergency or in areas with limited accessibility.
The drone GNSS receiver is a multi-constellation, single frequency, non-RTK capable device. All these characteristics have contributed to electing the Saturn drone as the best performing and most economically advantageous solution in such an extended survey in a mixed urban and critical area—several bridges cross the river (railway, highway, high traffic street), and the banks are surrounded by buildings and streets.
The flight time of Saturn Mini is enough to cover the vast areas of the Roia River in a few flights. A fixed-wing drone could perform the same survey in 1 or 2 flights, but its use in an urban context is strongly limited by the regulations of the national and international aviation safety agency. In several countries, including in Italy, fixed-wing drones cannot cross primary transportation infrastructures—the survey must be divided in several flights, and often the same take off area cannot be used for two adjacent flight plans. Moreover, the flight speed and flight altitude of fixed-wing drones are not compatible with a narrow “buffer area” between the operations area and critical areas (buildings, streets, people, etc.) required by the regulations. The “buffer area” is a space that surrounds the operations area and is the last safe place where the drone must be killed if it is out of control—the extension of this area is dependent on speed and altitude and for a fixed plane can be wider than the same riverbed. A multi-rotor can fly slow and at low altitude, and the buffer area can be very narrow and variable in precise sectors of the flight plan.
Saturn Mini was developed to optimize the remote sensing capabilities in types of scenarios where it is crucial to complete the survey in the shortest time in order to have a temporal snapshot of the area. Fast deployment and takeoff in any terrain conditions thanks to the tripod landing gear and high wind resistance increase the daily operation time.
The camera of the drone is actively stabilized with a 2-axis gimbal completely developed by the Civil Protection Centre. The gimbal without camera weighs less than 80 g and is tailored for each camera used. The axes are moved by 2 digital servo motors that can achieve a fluidity and rate of rotation (1 ms/degree of rotation) comparable to a brushless motor gimbal but offer more wind resistance at a high torque level. As a result, images are acquired in a stable pointing direction at all speeds and in all wind conditions.
All cameras used in the survey (
Table 1) with the Saturn Mini have a global shutter that avoids the typical distortion of the rolling ones—the entire image is taken in the same moment when the shutter opens. Rolling shutters are mainly used by low-cost and light cameras with complementary metal oxide semiconductor (CMOS) sensor that are mainly designed to acquire video footage. The image is read continuously line by line and not all parts of the scene are taken in the same instant introducing distortion as wobble, skew, and spatial and temporal aliasing that can affect the precision of the photogrammetric survey.
2.2. The UAV Surveys
Multiple aerial surveys were performed over the study area to carry out a multi-temporal analysis based on 3D modeling of both the riverbed morphology and the vegetation coverage. In particular, 2 photogrammetric surveys were made 1 year apart, using the Saturn Mini drone. The first, carried out on 1–4 August 2017 using a 16.1 Megapixel Canon digital camera, required a preliminary planning phase according to which the total area was covered in 16 different flights, which were carried out by setting acquisition streaks parallel to the course of the river. For each flight, an optimal trajectory was planned using the ArduPilot Mission Planner software (version 1.3.48) considering strategic image points to obtain an optimized overlap between the images, which was set as no less than 70% along the flight direction (overlap) and no less than 55% between frames belonging to contiguous flight lines (sidelap). During the flight phase, mainly nadiral frames were acquired at a constant altitude of approximately 60 m a.g.l. In addition, to optimize the survey near bridges, we took some shots with an oblique geometry. Given the flight altitude, the height of the structures from the riverbed, and the strong contrast between shaded areas (under the bridges) and directly illuminated areas, the technique allowed only a partial reconstruction of surfaces under the main bridges and overpasses.
The 2018 survey was carried out between 6 and 10 August 2018 using a 20 Megapixel Canon digital camera. In this case, the survey was expanded to cover a wider area and improve the coverage of riverbanks and partially hidden areas, especially below road overpasses and bridges. To achieve this, 18 flights were carried out and the number of shots with oblique geometry was considerably increased. Furthermore, differently from what was done in 2017, the entire river mouth area was covered, making the terminal portion of the Roia River in correspondence of the town of Ventimiglia, whereas the flight altitude remained unchanged and equal to 60 m AGL.
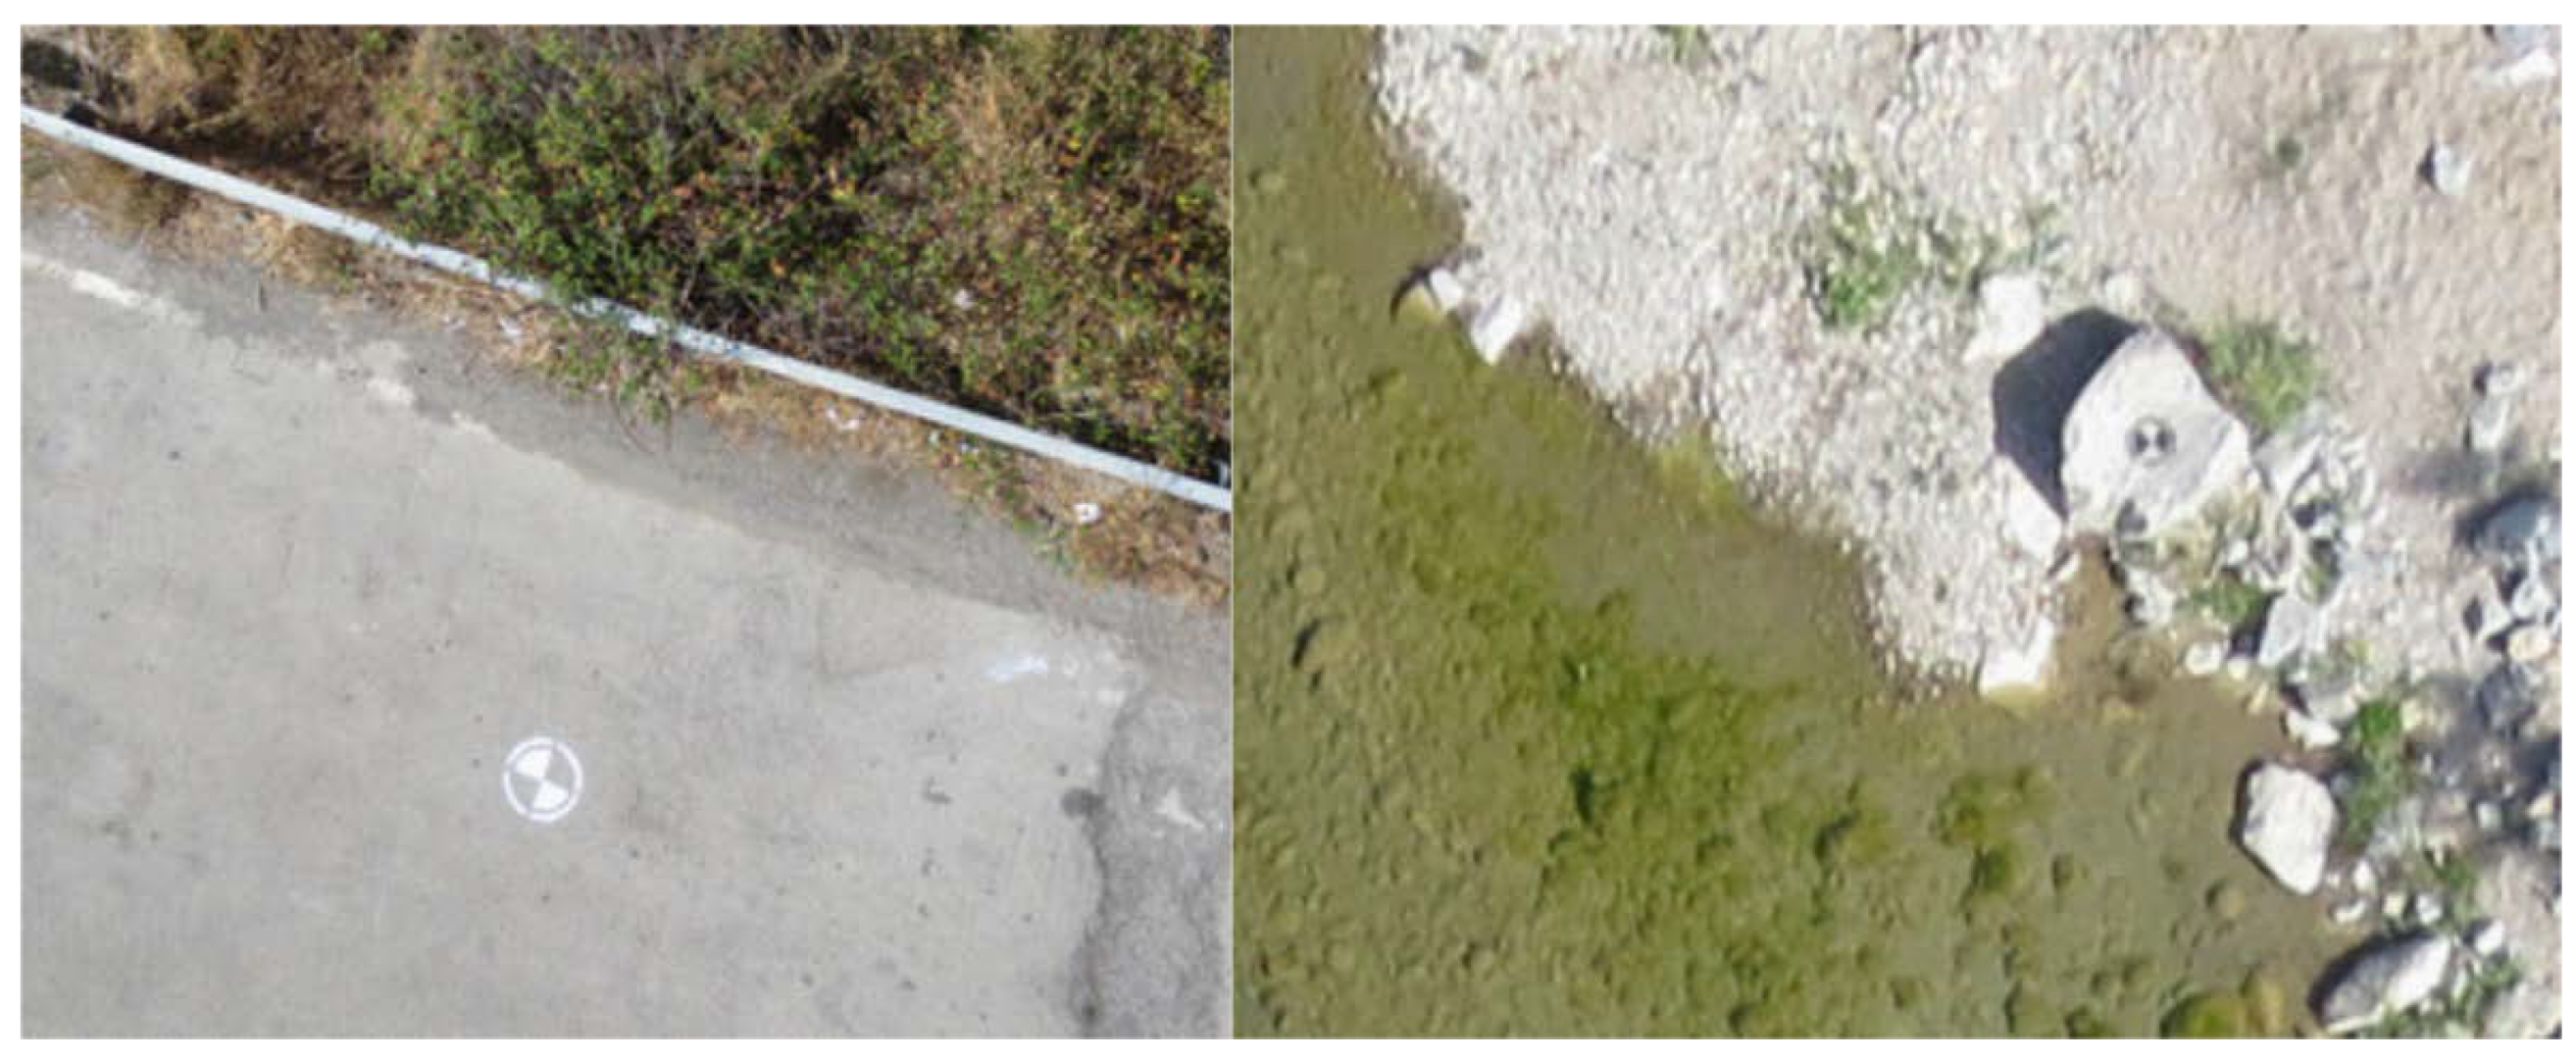
Since the camera system does not have an RTK-GPS module, the GNSS campaigns were carried out with an Emlid Reach RS GPS in a base-rover configuration with RTK correction via Italpos service less than 8 km from the base to measure the coordinates of 97 Ground Control Points (GPCs) in 2017 and 148 in 2018, respectively (
Figure 3). Such GCPs were used for the georeferencing and validation of the three-dimensional models obtained from the aerial photogrammetric surveys and to assess the accuracy of the resulting data. The main characteristics of the 2 surveys are summarized in
Table 1.
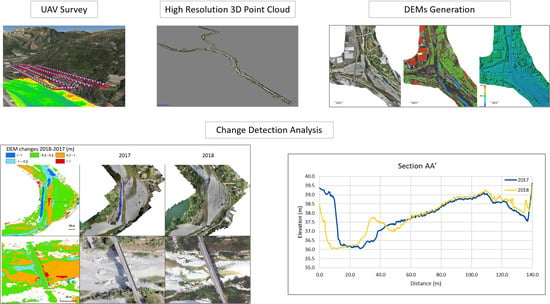
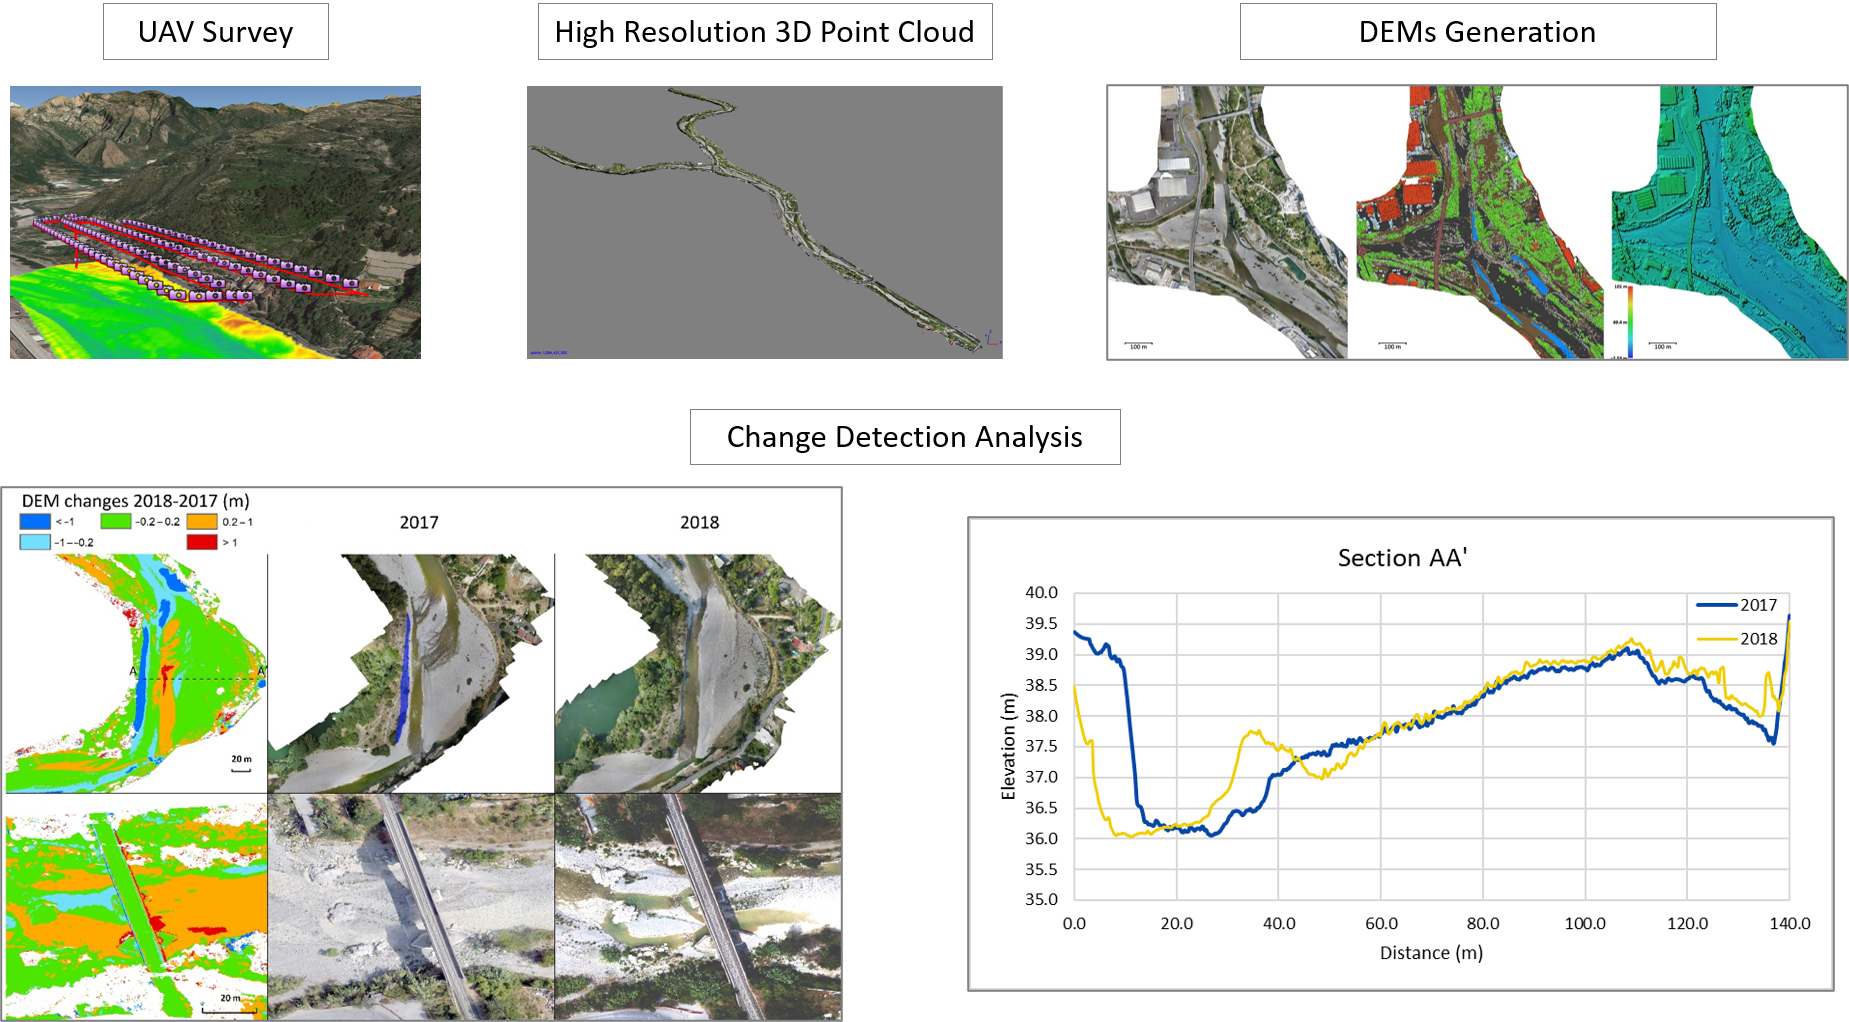
2.3. Digital Terrain Model Generation
The acquired images were processed with the Agisoft Metashape Pro Structure-from-Motion (SfM) software (version 1.5.2 build 7838, [
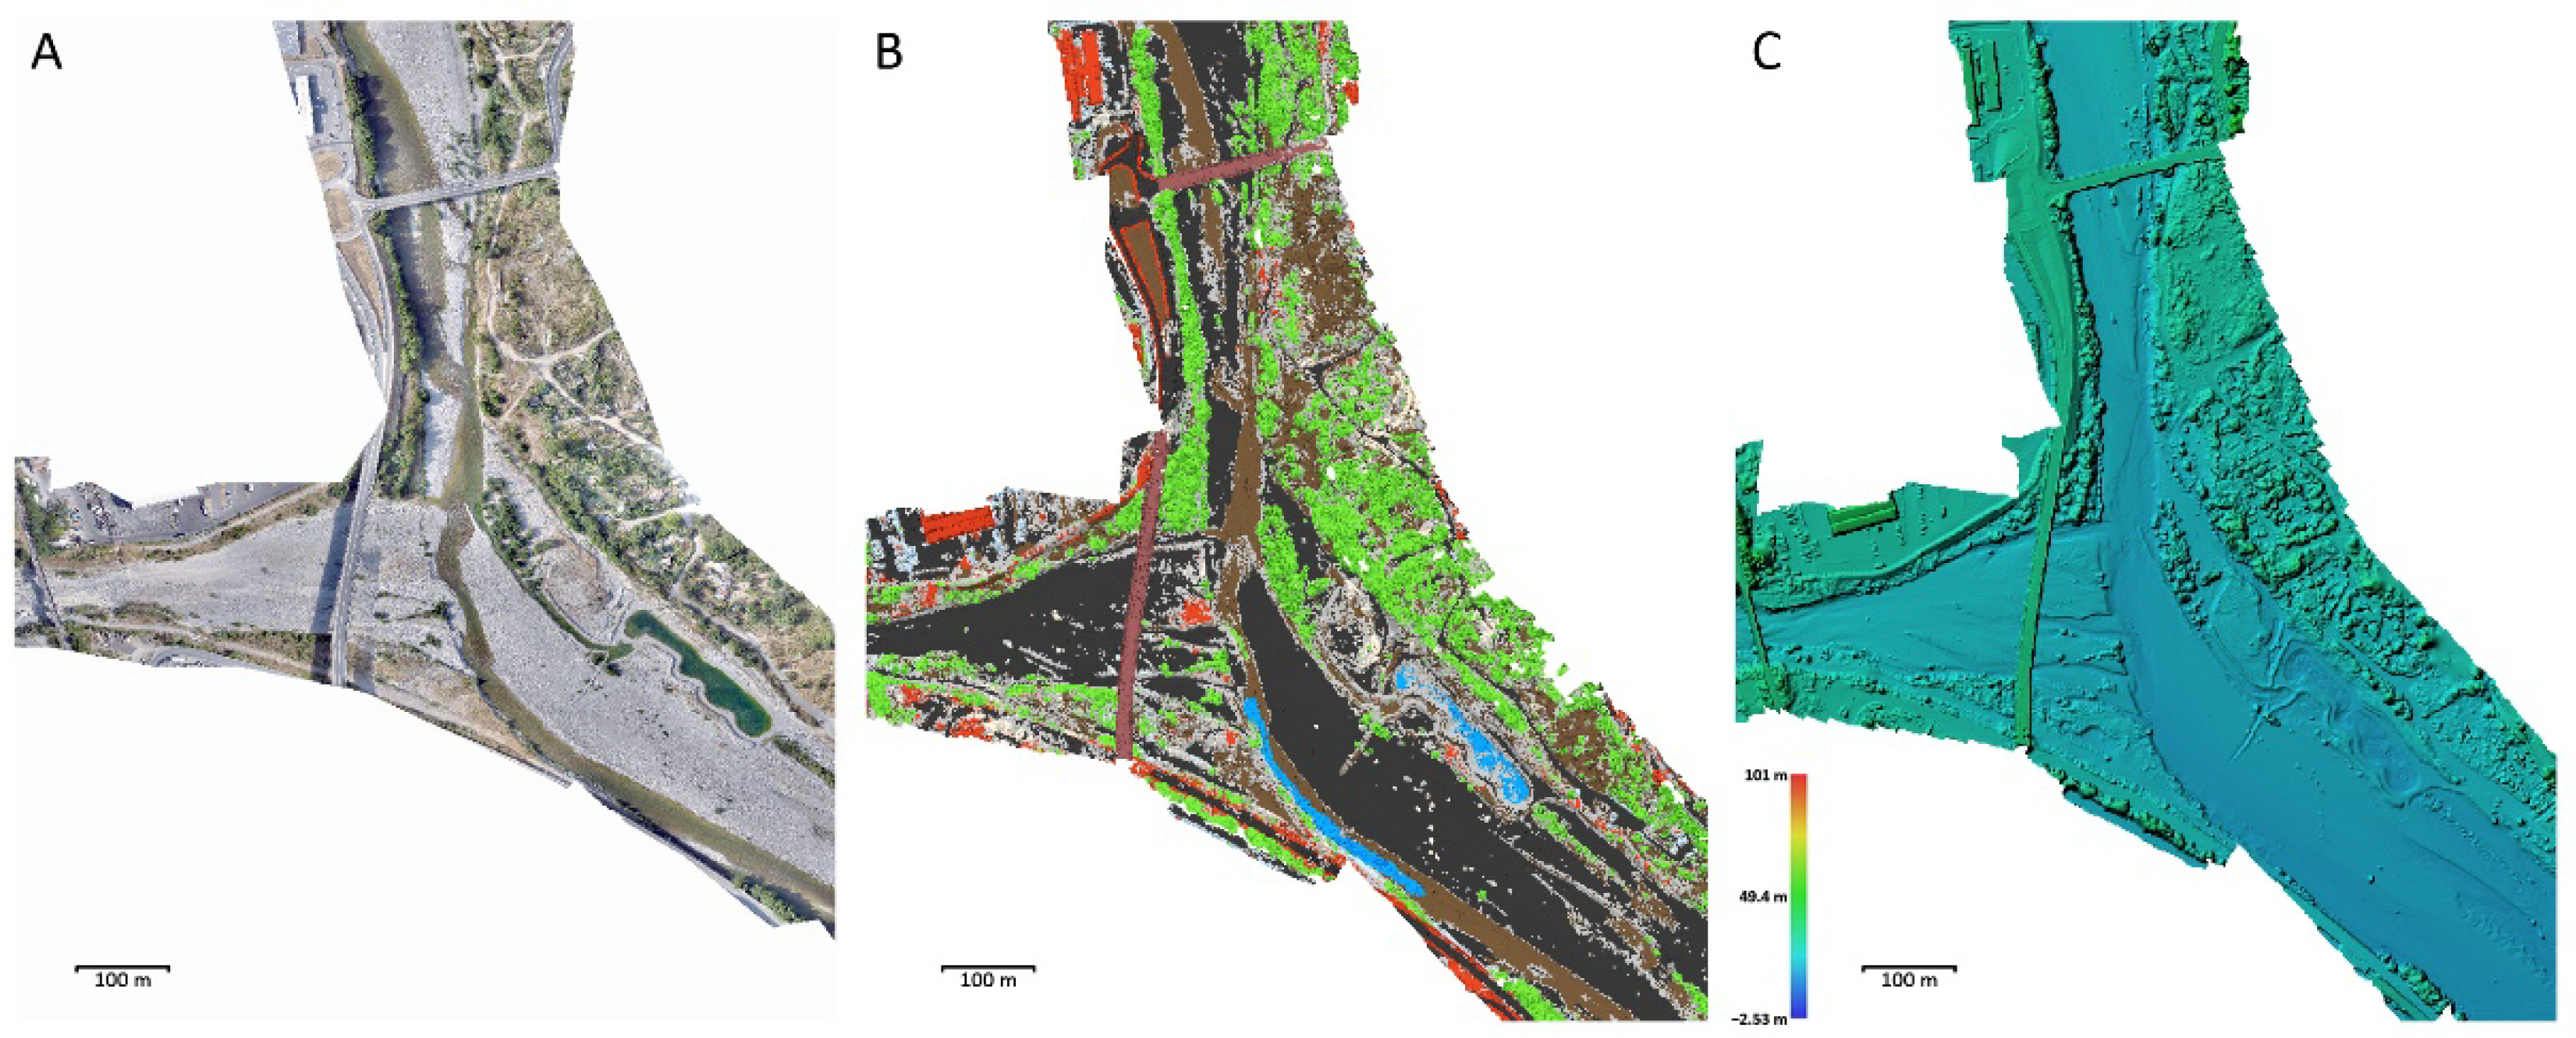
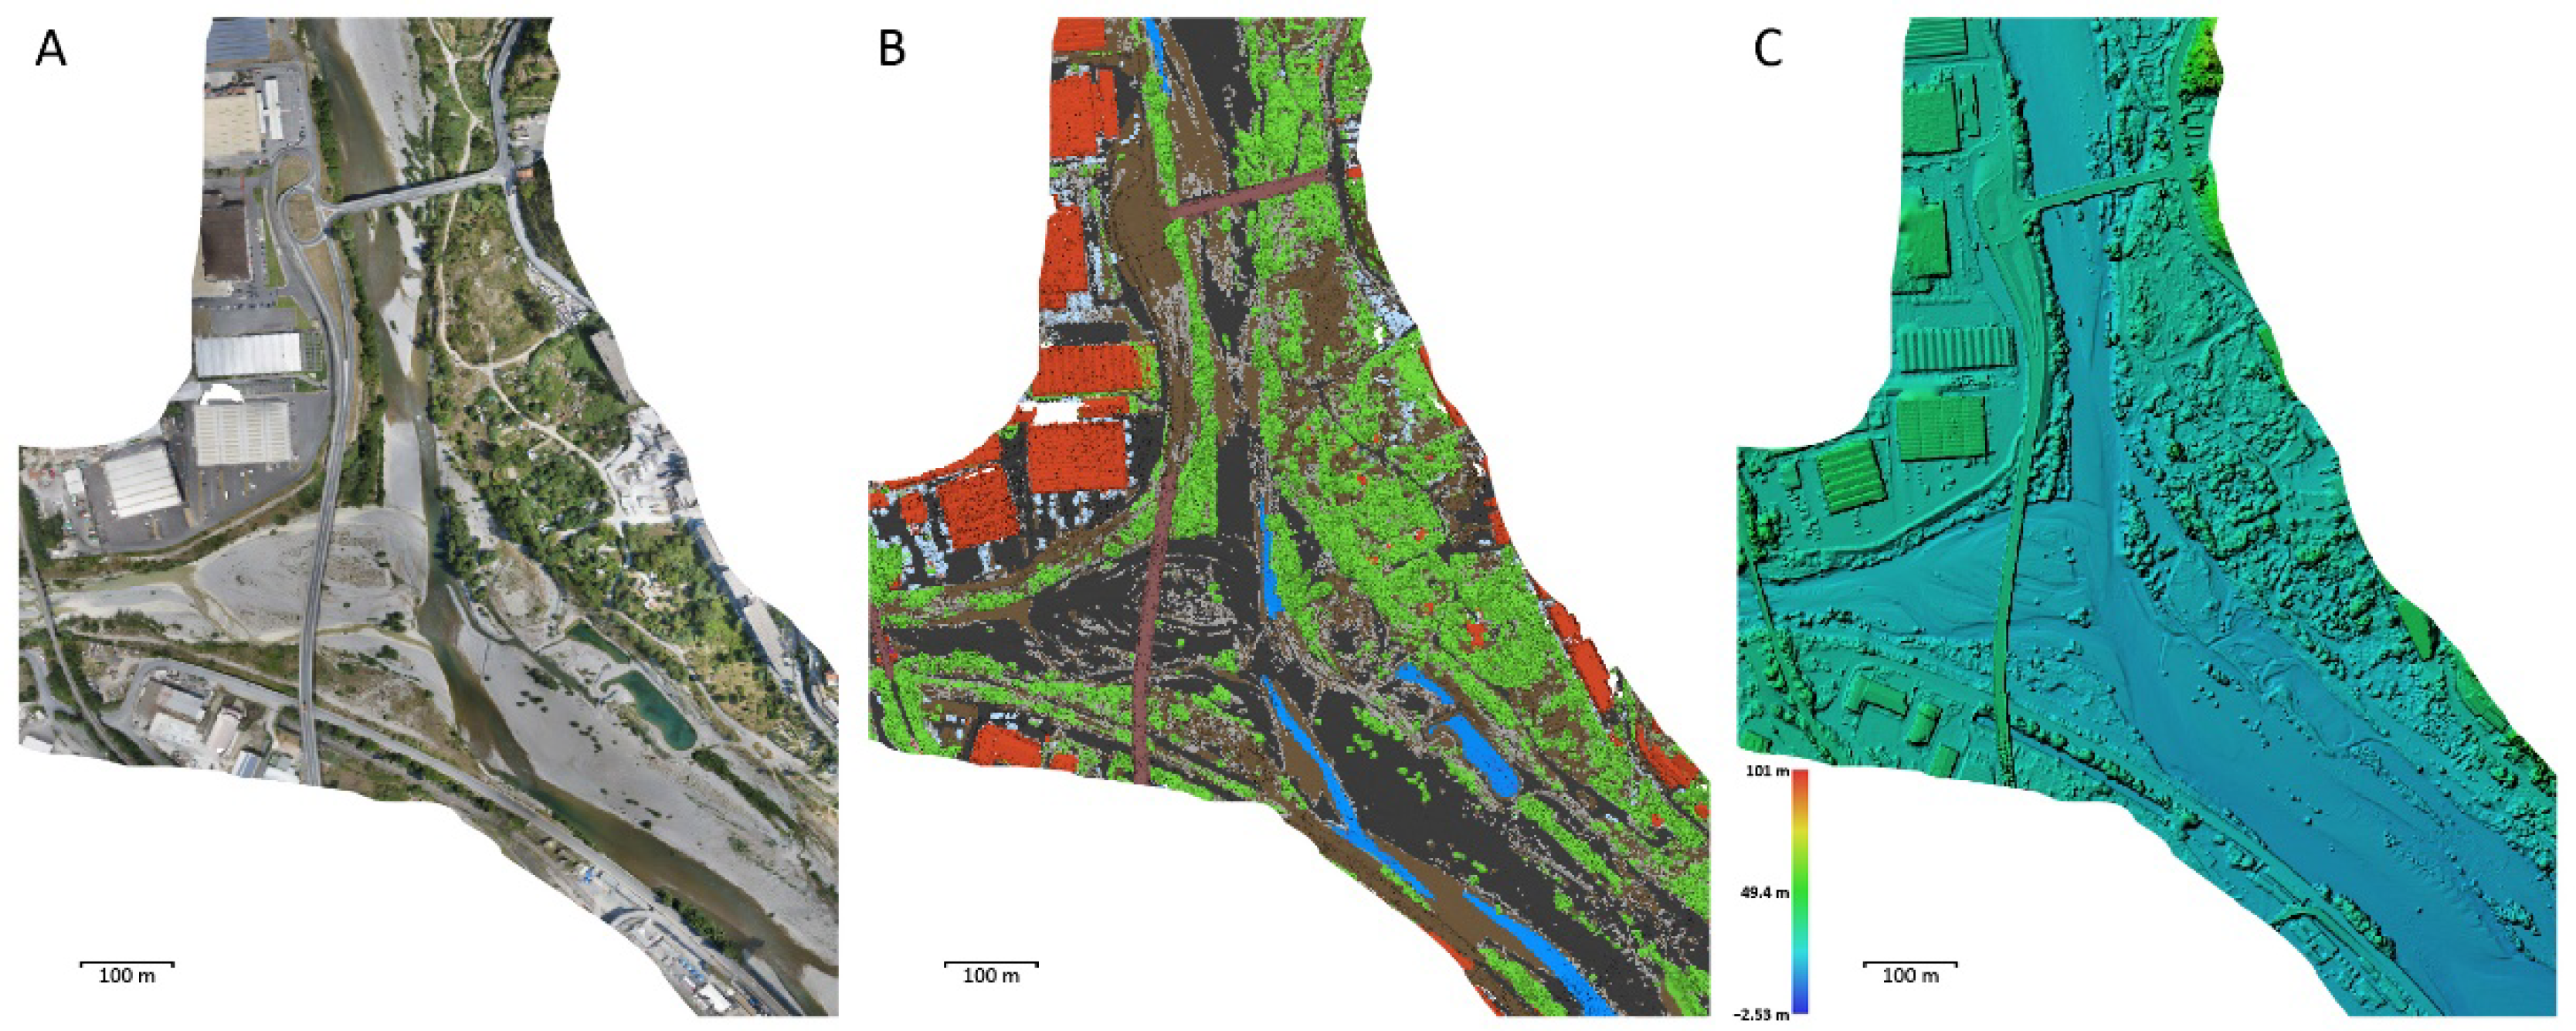
30]) to obtain the three-dimensional representations of the visible surfaces in point clouds format, 3D polygonal models (Mesh), digital terrain models (DTMs), digital surface models (DSMs), and high-definition mosaic orthophotos (
Figure 4 and
Figure 5). The main features of the obtained products are listed in
Table 2.
Images were aligned at maximum resolution by using the drone’s geotagging data (WGS 84 EPSG: 4326) having sub-metric accuracy and lens calibrations, and by identifying homologous points on the ground visible on several contiguous images. Once the alignment between flights and images was refined, a high-density point cloud was created starting from the images at maximum resolution. To each of the points of the obtained 3D point clouds, we assigned an identity class (Land, Buildings, Bridges, Vegetation, Noise, etc.). The classification process was obtained with the automatic dense cloud multi-class classification available in the software used, setting a confidence parameter of 0.25. However, the automatic classification is affected by some errors, and therefore, once classified, the 3D point clouds were entirely rechecked. All the automatic classification errors were corrected, and classes were manually re-assigned. This second step ensures the reliability of the classification and an optimal reconstruction of the DTMs (that requires only ground points as opposed to DSMs), consequently avoiding the underestimation and/or the overestimation of volumes involved in the following change detection analysis. In this phase, deep water (i.e., deeper than 20 cm) was also manually classified, since it generated strong noise in the 3D point clouds and would thus have created artifacts in the three-dimensional models. The DTMs and DSMs were therefore generated interpolating points by means of the inverse distance weighting (IDW) method and in particular:
DSM: considering all the points of the cloud to represent all the surfaces visible by drone at the time of survey. Only deep water was excluded due to noise problems.
DTM: points classified as vegetation, buildings, deep water, or cars were not considered. The resulting holes were filled through interpolation.
These operations have also undergone a second phase of manual control to prevent the presence of vegetation as well as artifacts in the DSMs.
3. Results and Discussion
The extension improvement of about 45% of products obtained in 2018 (
Figure 4 and
Figure 5) was due to the increase of shots with oblique perspective, as discussed in
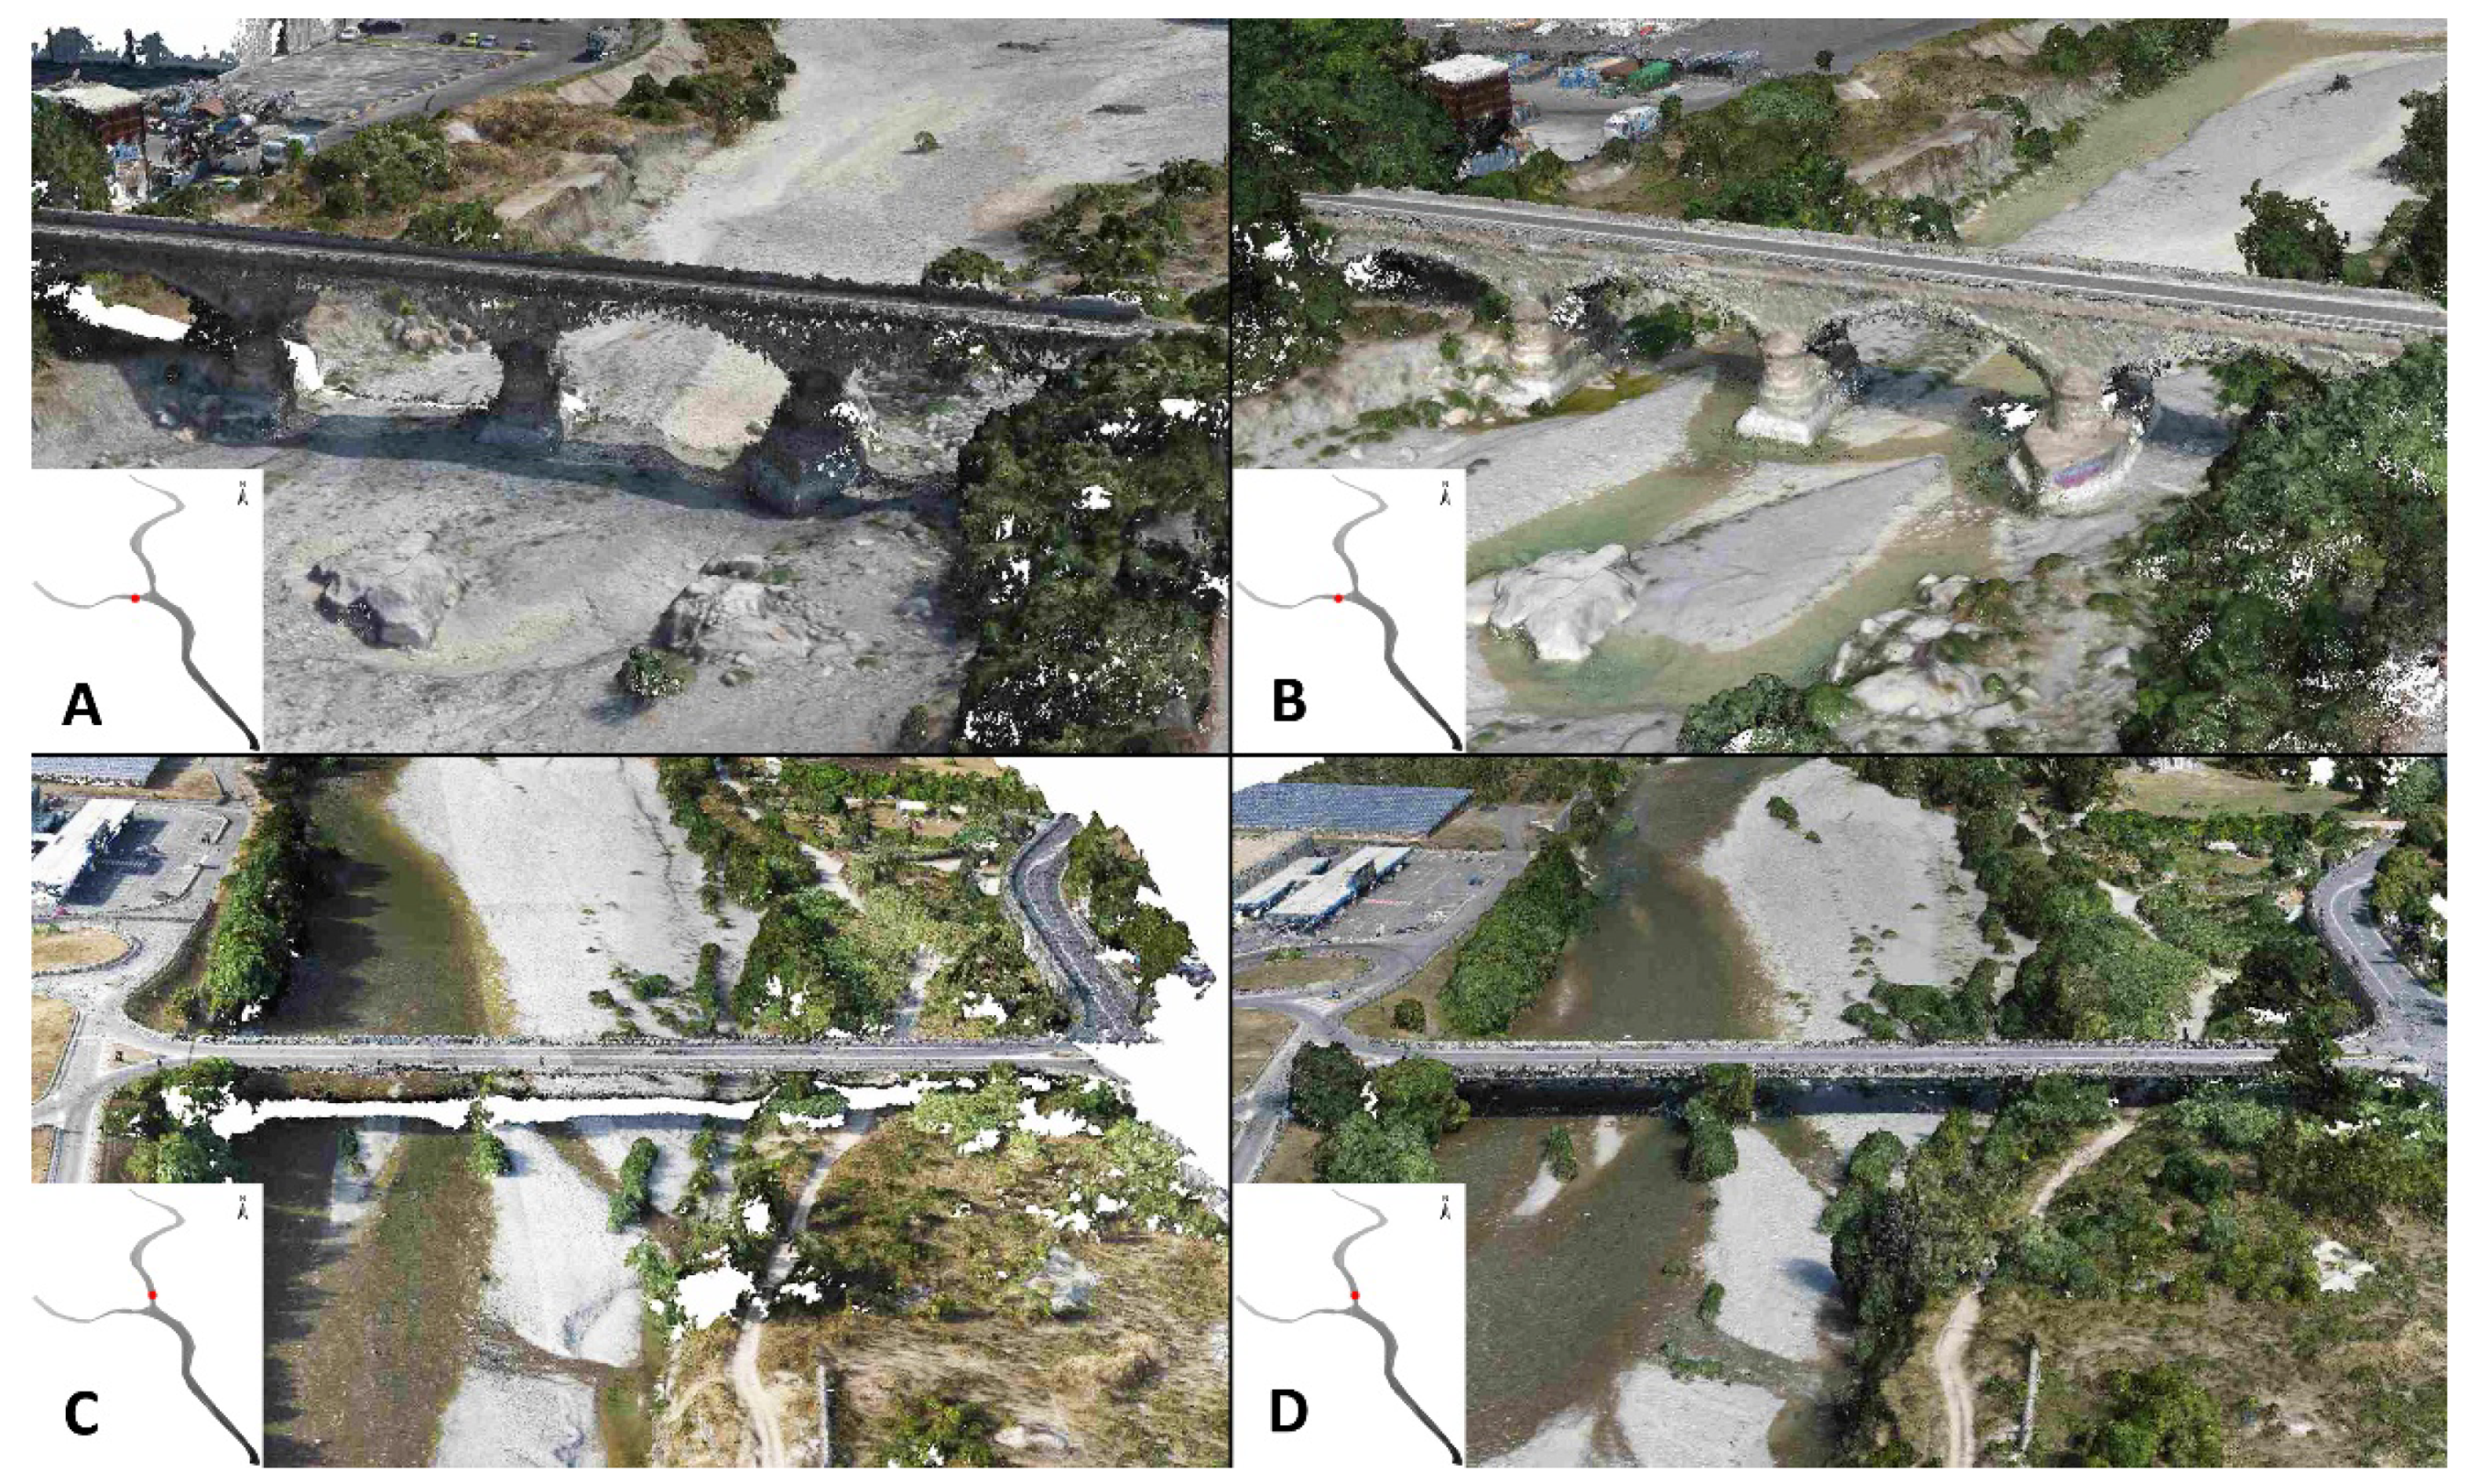
Section 2.2. Thanks to this technique, it was also possible to reach new portions of the riverbed and to avoid several shadowed areas (
Figure 6). Firstly, the higher quality of the areas reconstructed under the bridges made it possible to obtain fundamental information such as the actual span between pillars. Furthermore, the acquisition of shots from multiple directions also allowed for more complete reconstruction of the densely vegetated areas (
Figure 6).
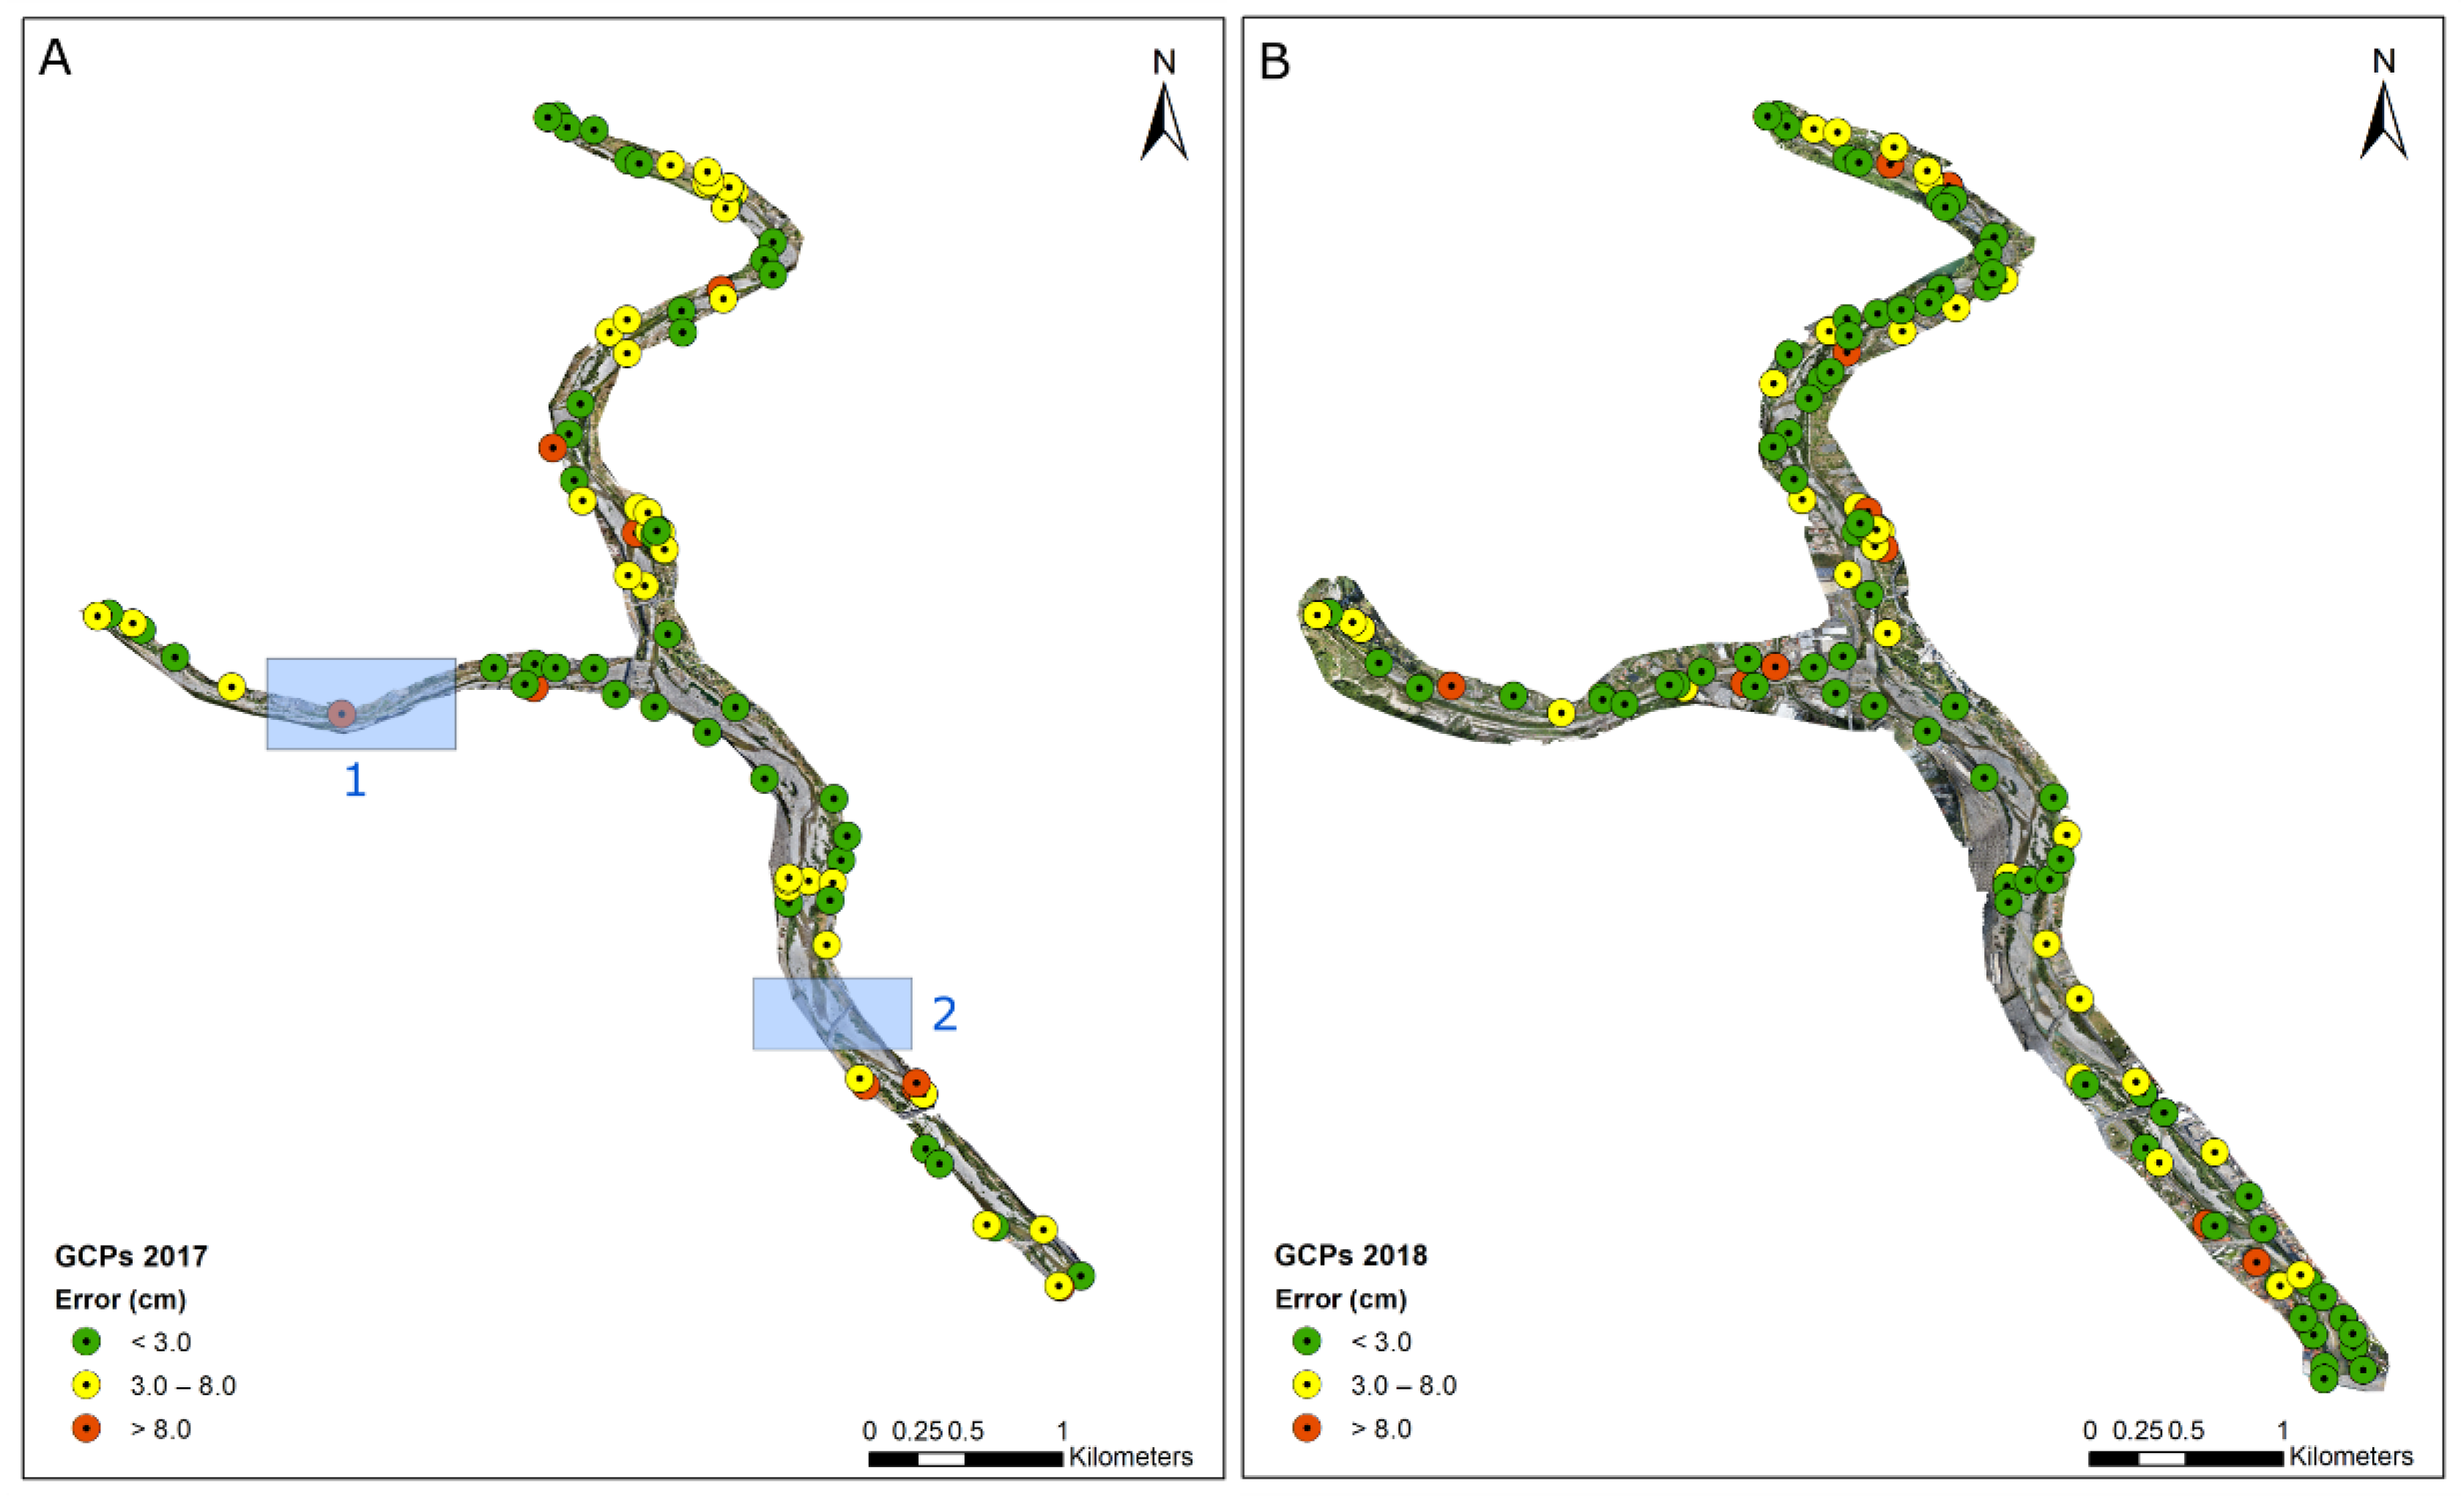
Figure 7 shows the distribution of the GCPs. The related mean error is less than 3 cm in almost the entire survey area, with only some spots with an error higher than 8 cm. Compatibly with the morphology of the area, the accessibility of private properties, and the satellite coverage, we tried to homogenously place the markers throughout the riverbanks. However, some areas were unreachable, such as the ones highlighted as 1 and 2 in
Figure 7A. The limit was overcome during the second survey in 2018 (
Figure 7B) since the investigated area was wider and allowed the positioning of suitable markers alongside the neighboring riverbanks, where the GPS signal was preferable. If in area 2 of
Figure 7 the absence of GCPs for a long segment did not compromise the final result, in area 1, the presence of only 1 GCP with a high error (>8 cm) locally invalidated the accuracy of the survey.
As a consequence, the difference between DTMs generated in 2017 and 2018 did not show reliable results in that area. There is indeed a strong mismatch between the two models that cannot be justified by changes in the morphology of the area.
On the other hand, the comparison between the two surveys in the remaining areas showed interesting results (
Figure 8). Firstly, the perfect overlap between stable areas (such as bridges and streets) pointed out the reliability of the survey. The areas where the differences of the two DTMs were between 0.2 and −0.2 m, compatible with the sum of the errors related to the used technique and for this reason comparable to unchanged areas, covered 54% of the total riverbed surface. Moreover, since the difference computation was carried out between the DTMs obtained in 2017 and 2018 (therefore keeping out the vegetation), the areas showing higher differences were areas that underwent erosion or sedimentation. As explained in the previous paragraphs, deep water (i.e., deeper than 20 cm) was not considered for the DTM generation. The remaining shallow water was therefore compatible with the error (±20 cm) and did not compromise the reliability of the analysis. The percentage distribution of the range of elevation differences is shown in
Table 3.
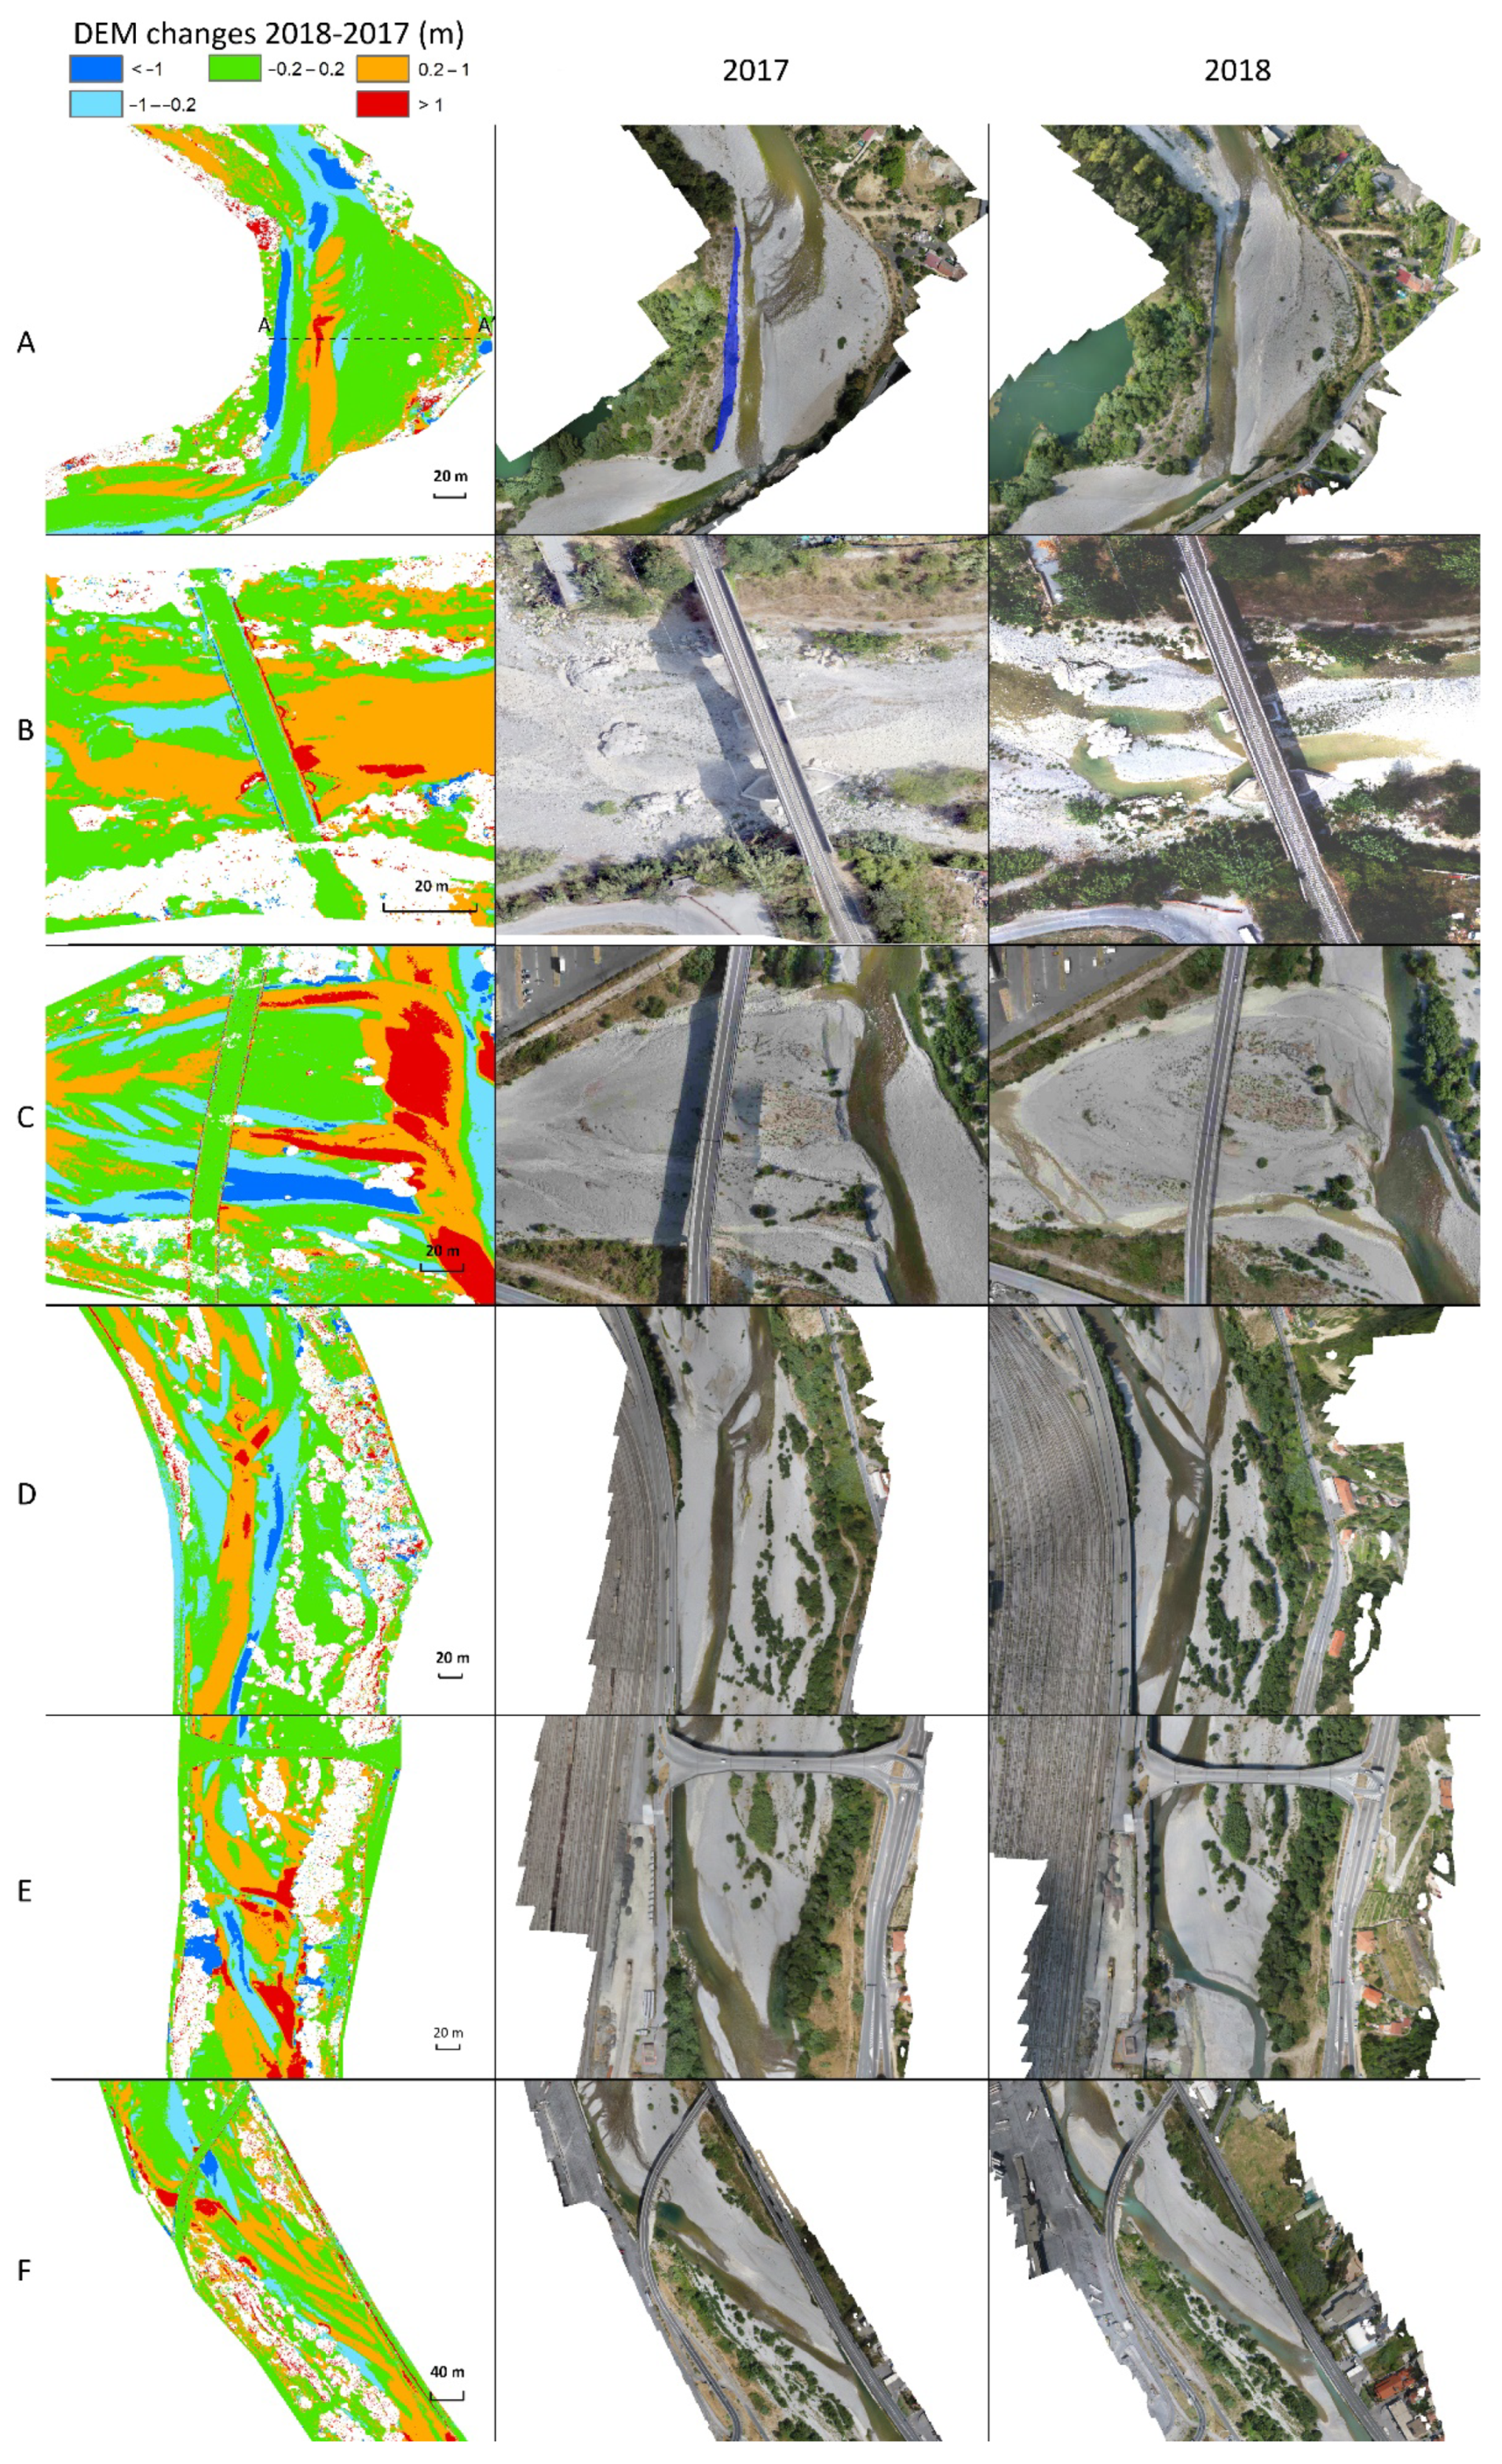
Figure 9 shows the detail of some areas where erosion and deposition were more evident. In all of them, both areas showing changes over time and spots with no differences were detectable.
Within one of the most interesting cases, the technique allowed for the identification of the retreat of a river bank of 4 m caused by the erosive action of a channel migration that occurred a few meters upstream in
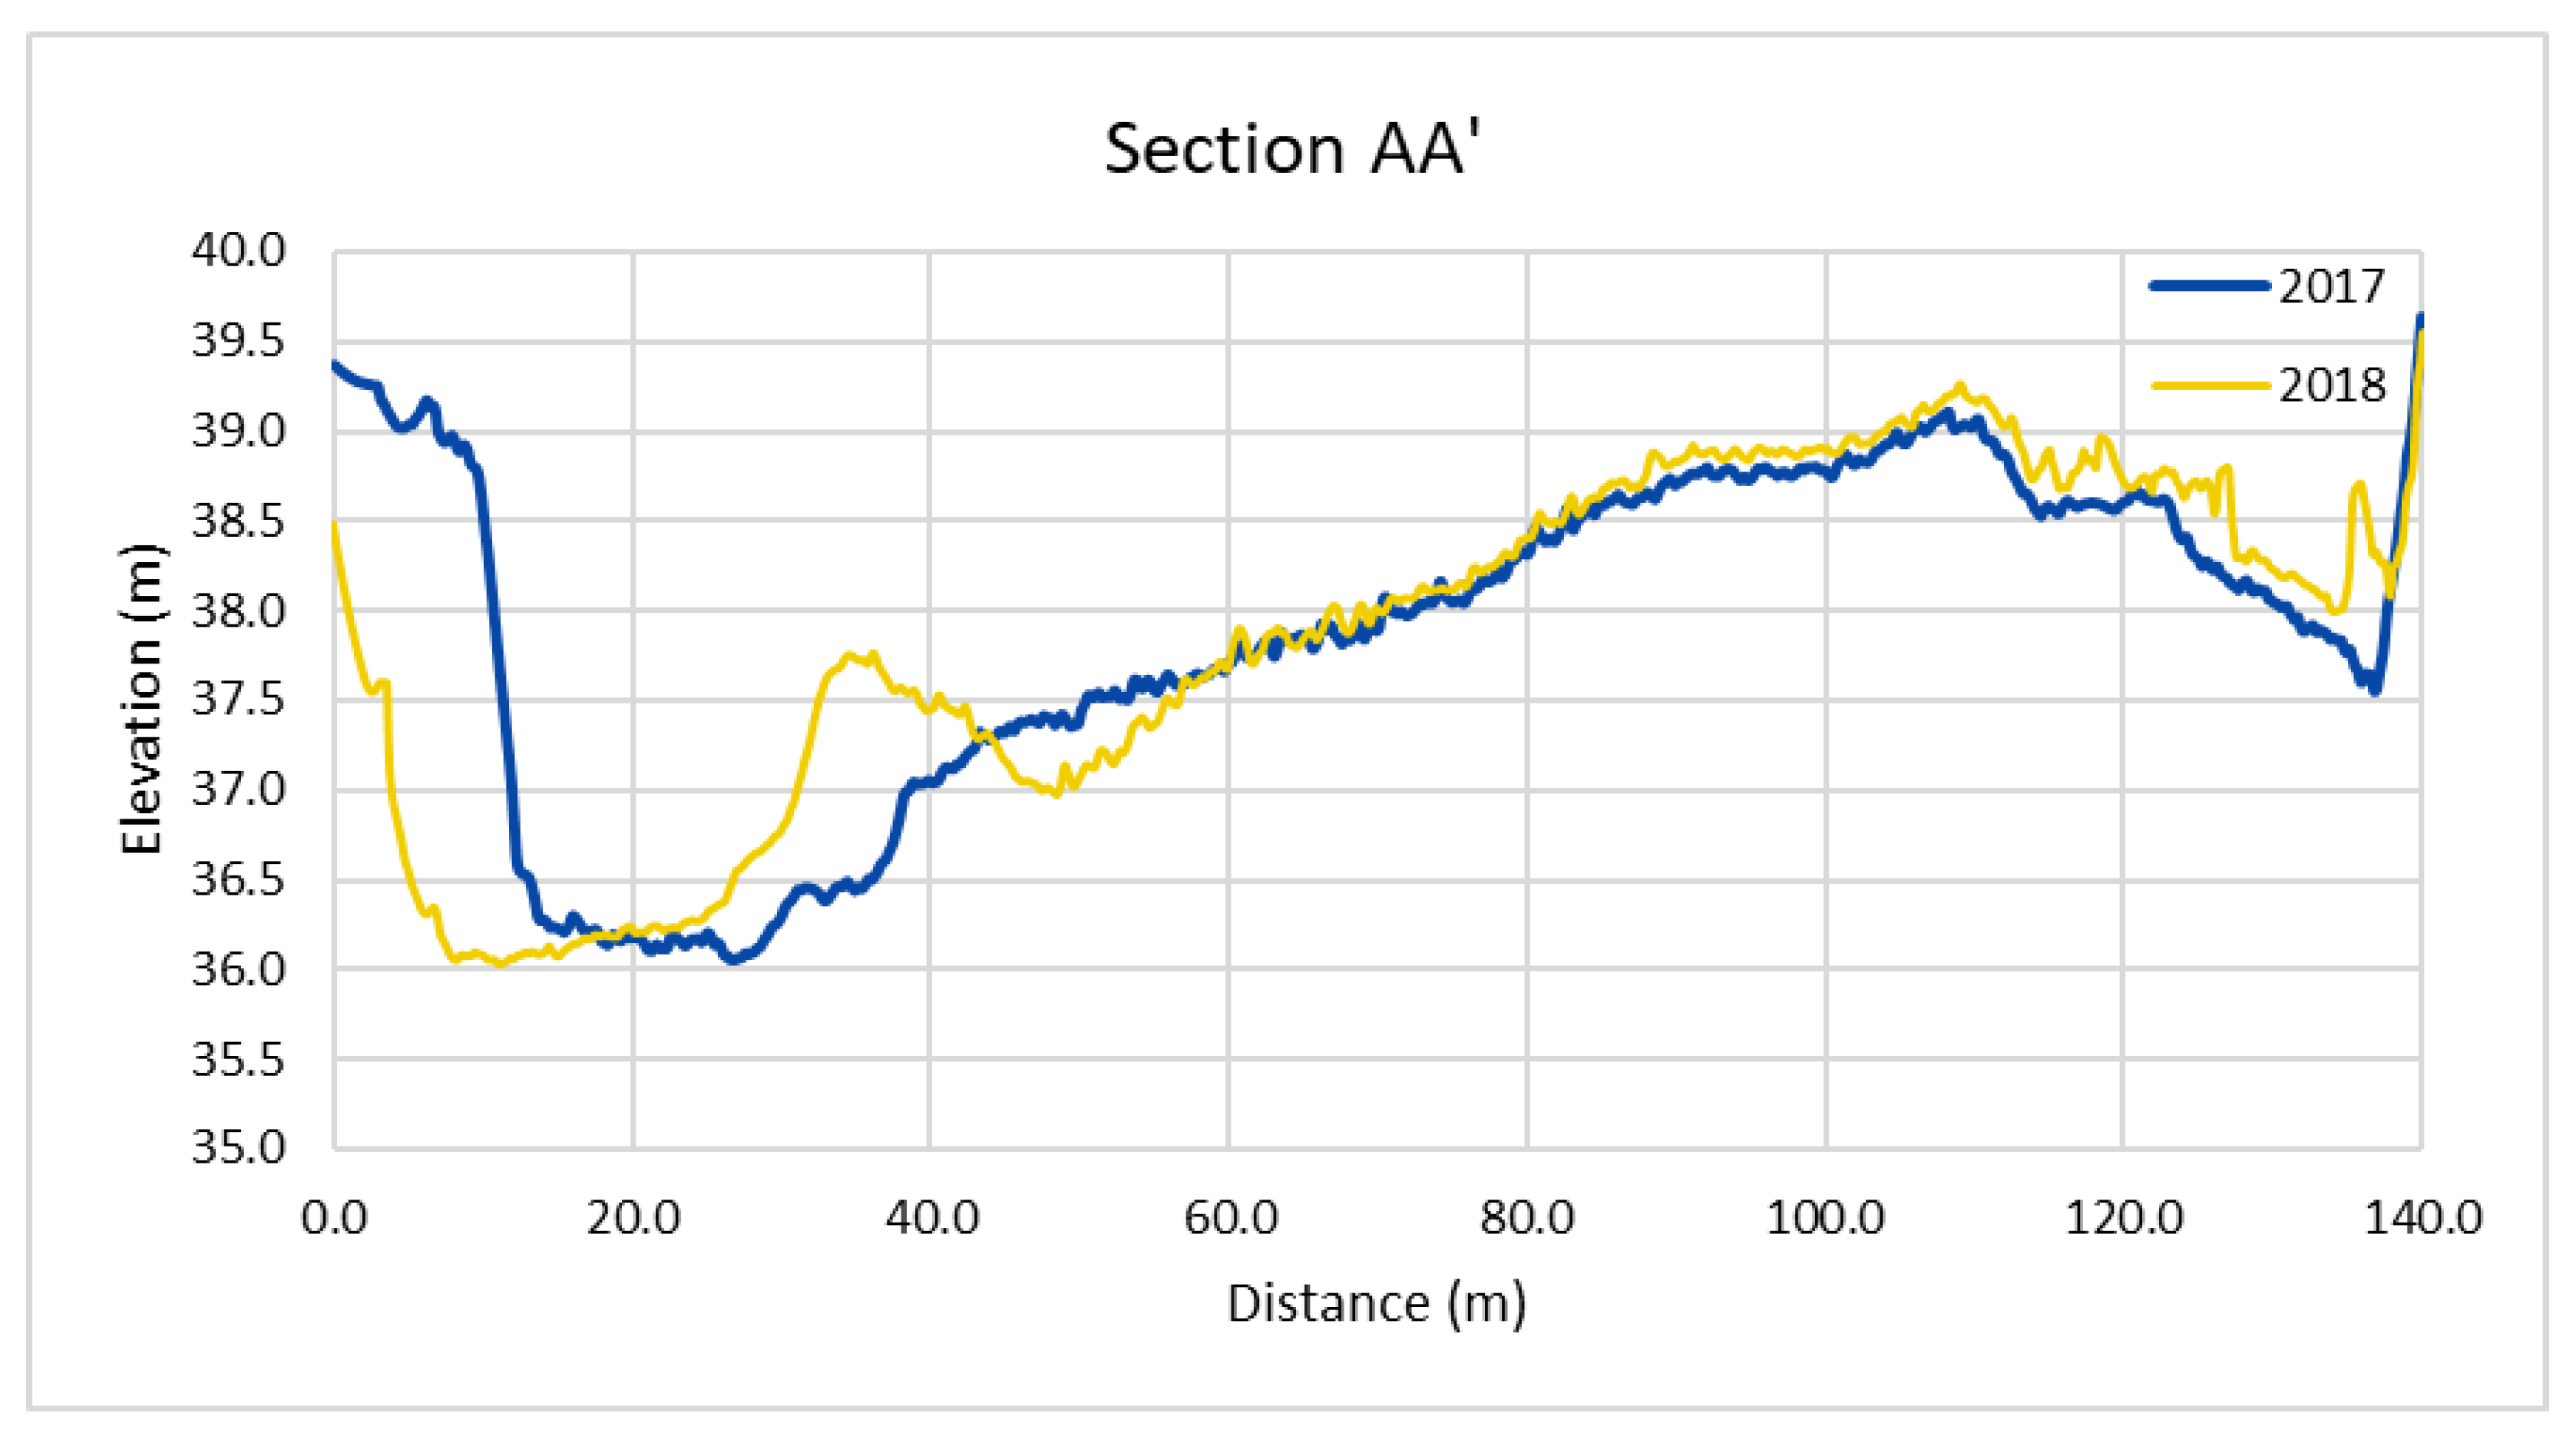
Figure 9A (where the blue polygon shows the eroded area in the 2017 orthophoto) and suggesting a point of the riverbank vulnerable to future erosions. The retreatment was evident in the terrain profile of
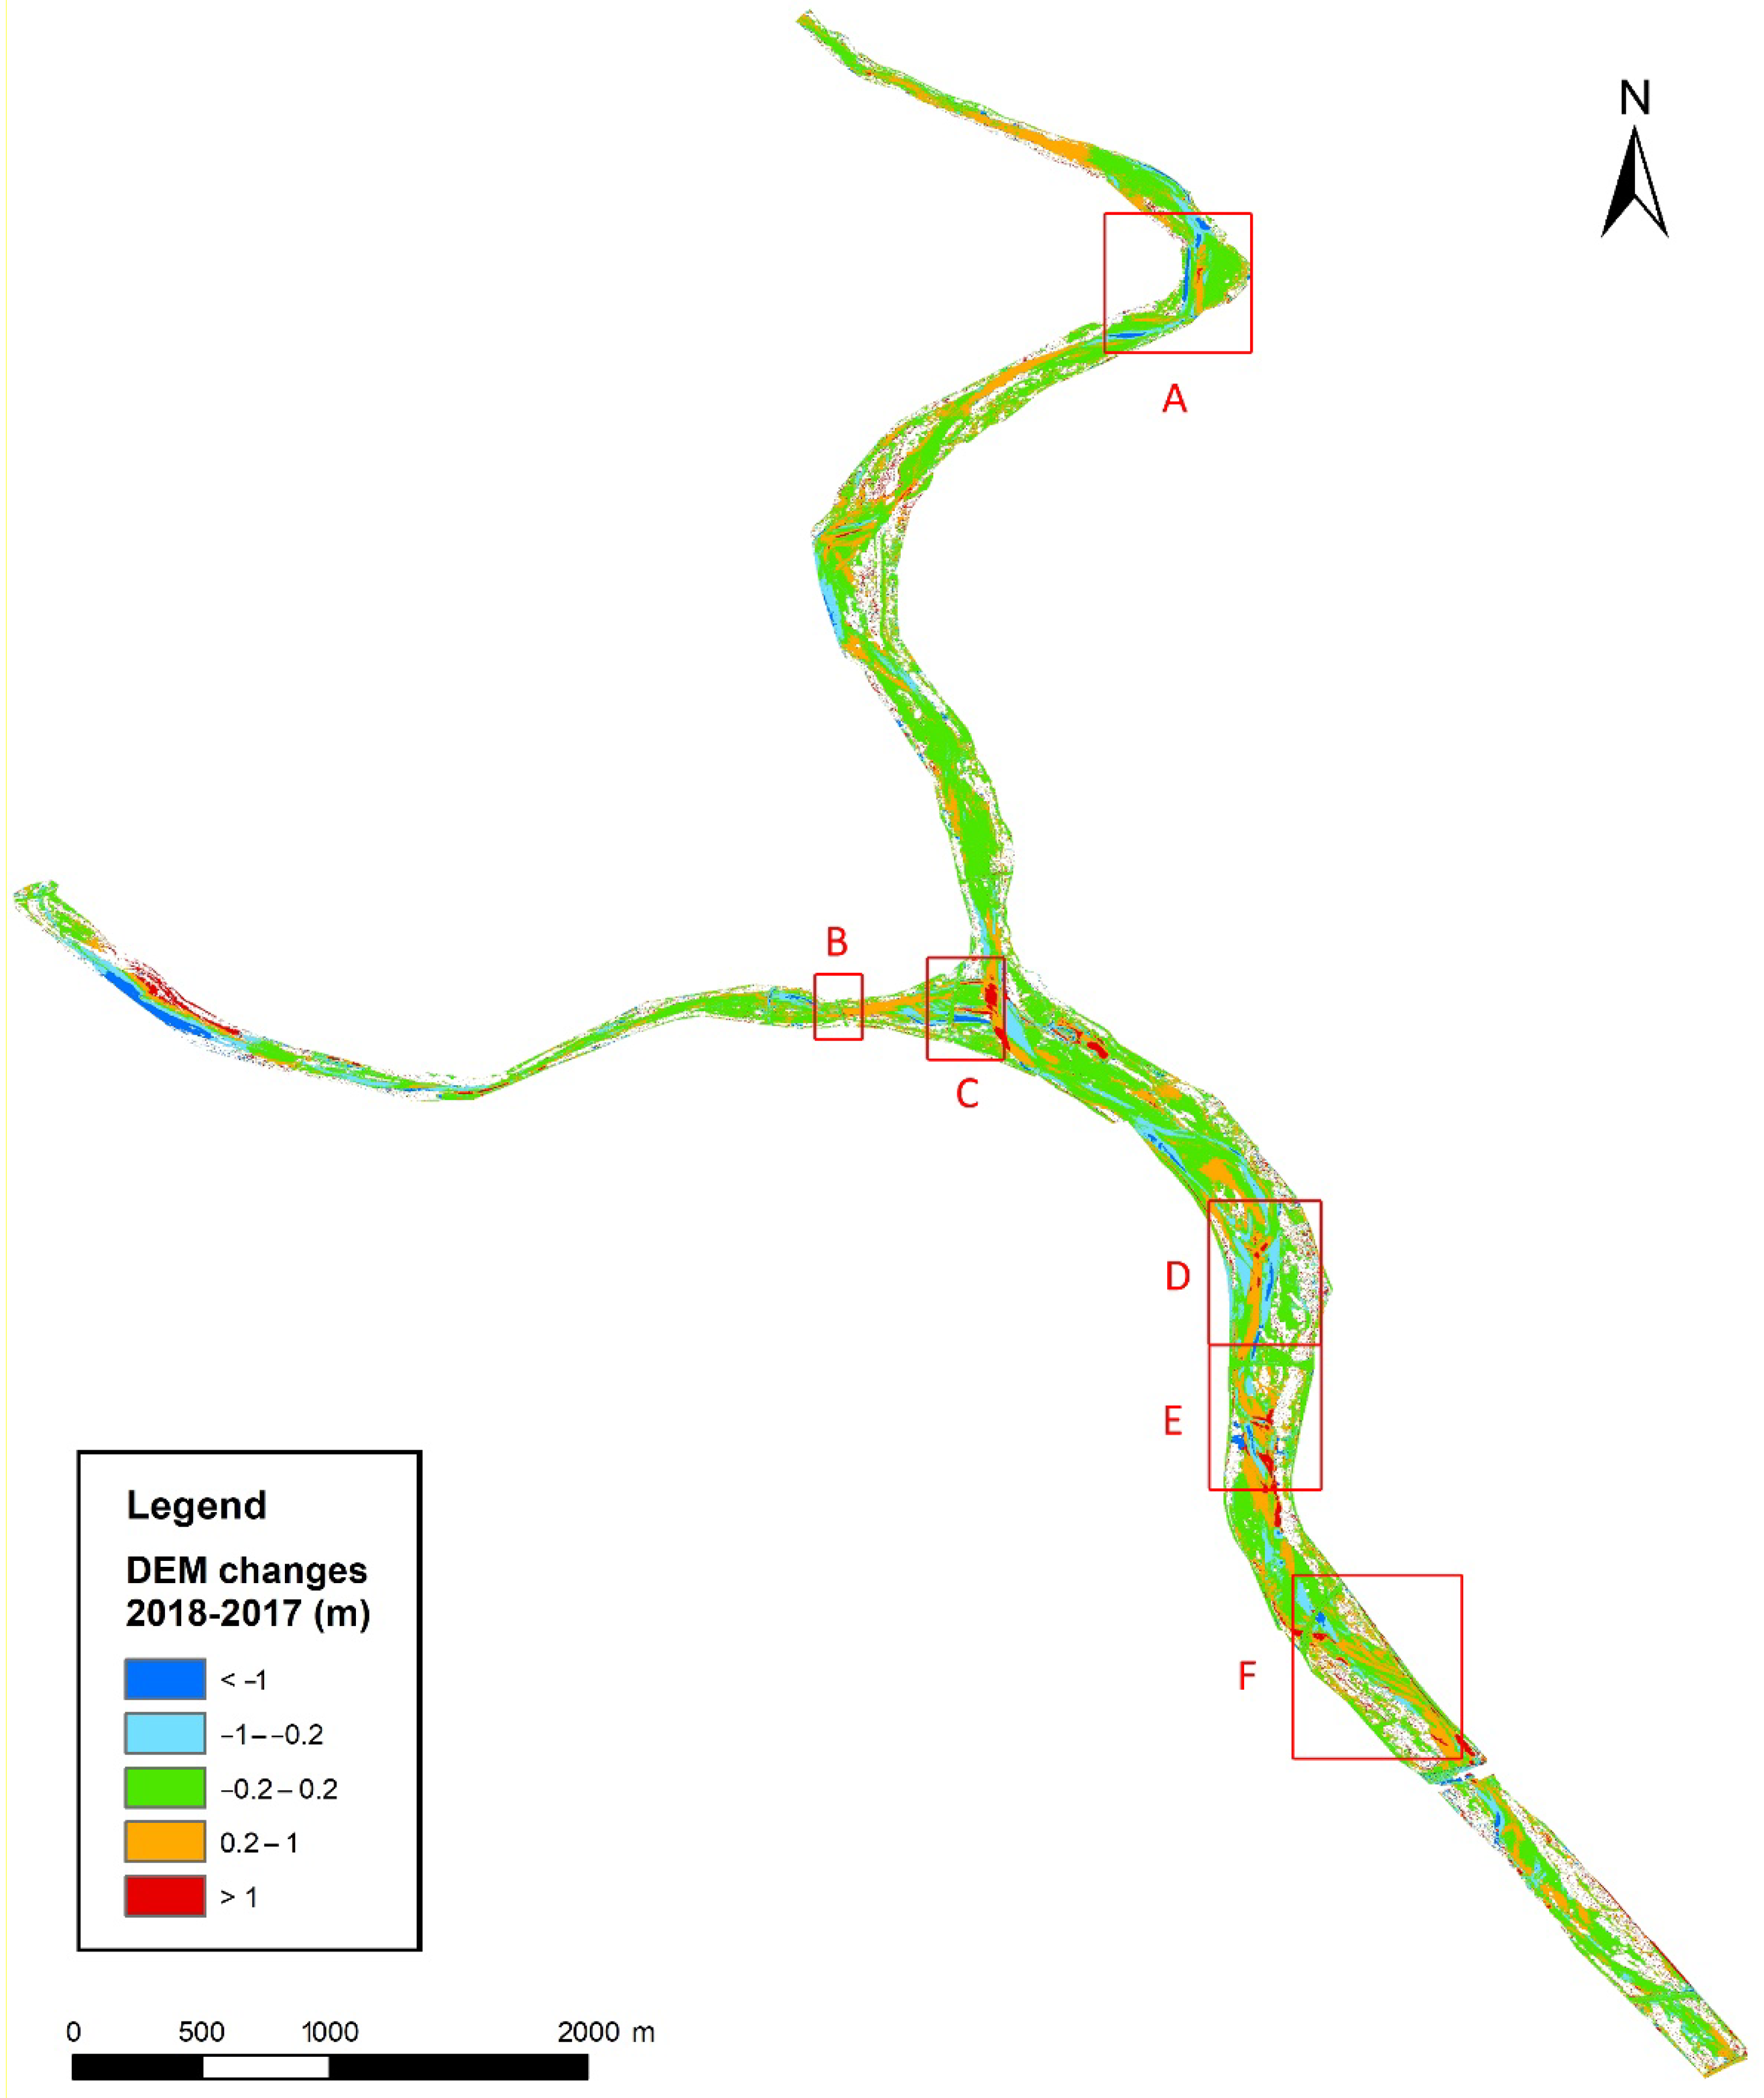
Figure 10, followed by a deposit, a minor area of erosion, and then by the overlapping of the two DTMs, since the differences were within the error (±20 cm). Channel migration is a clear process made by continuous changes over decades, and the most prone areas can be easily detected (
Figure 11).
Even if these processes are known, thanks to the drone survey and therefore to the DTM differences, riverbank retreat can be quantified and can be controlled with mitigation measures.
Analyzing the differences between the DTMs throughout the survey, we were also able to observe the behavior of the river in proximity of bridges, identifying areas that could require maintenance (
Figure 9B,C) due to erosion or deposition.
As an example, focusing on
Figure 9B, the accumulation of sediments between the pillars could reduce the cross sectional area, increasing the flood risk of the area. Conversely,
Figure 9C points out the riverbed erosion under the infrastructure, showing possible weaknesses in the bridge supports. This spot is also the closest to the point where the Bevera Torrent flows into the Roia River. There, material exchanges typically occur, and a change detection analysis may be strategic. Sedimentation was clearly visible along the flow direction, followed by the migration of the river (as observable in the orthophotos) and the consequent erosion of the riverbed on the southern bank. Please note that red points that mark the bridge’s borders (corresponding to the guardrails) were caused by some outliers of the 3D point clouds from which the DTMs were originated. Due to their irregularities, these kinds of structures can indeed produce some noise in the photogrammetric process (
Figure 9B,C).
Throughout the river, it is interesting to note the general trend of deposition (about 30% of the riverbed surface), in contrast with small areas of erosion. The accumulation occurred, sometimes generating thick deposits where river flow direction changes (
Figure 9D,E), and sometimes in a slighter way, shown in
Figure 9F, where sediment only filled old depressions formed during flood periods.
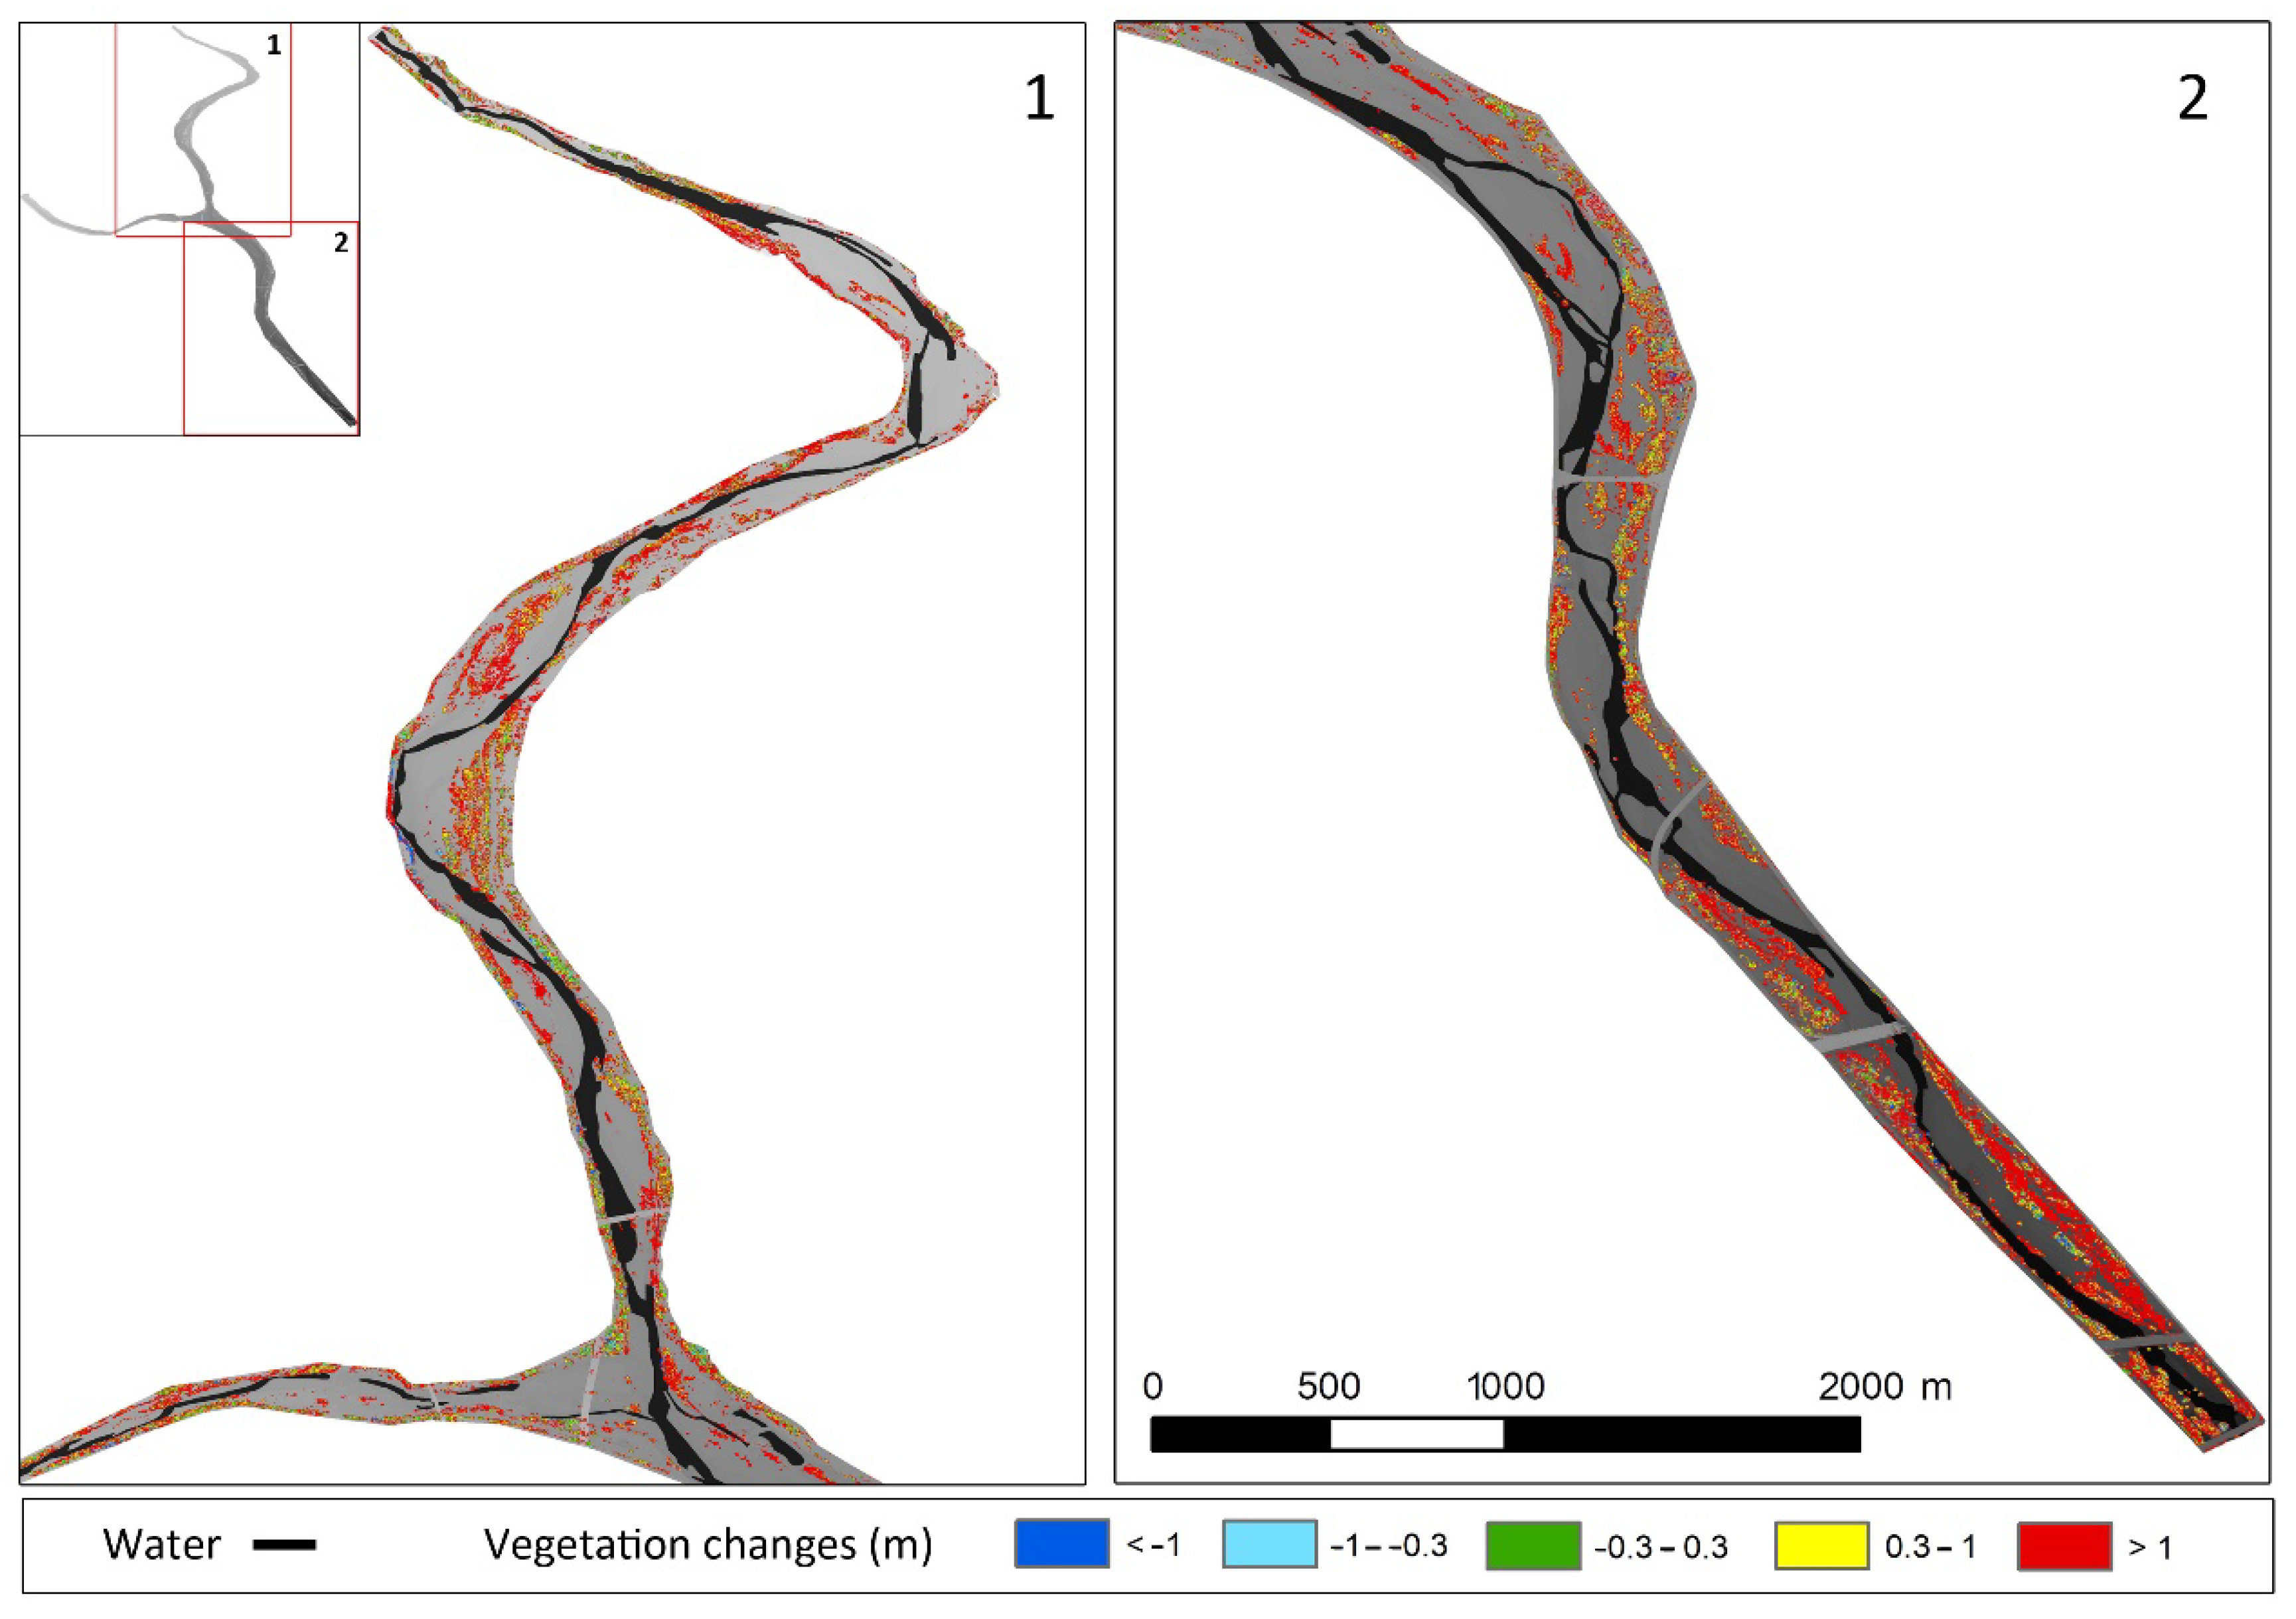
In all the river area, height vegetation growth was observed, as shown in
Figure 12, where the elevation values of the vegetated areas in the DSMs from 2017 and 2018 were compared. An average value higher than 1 m of growth on the overall area was measured.
Nevertheless, the photogrammetry technique had some intrinsic limitations due to the Structure From Motion method and the non-static nature of the tree branches and bushes moved by the wind. For these reasons, a volumes reconstruction of the vegetation has many holes and gaps that affect the possibility of an accurate distributed volumetric calculation. A possible quantitative calculation minimally affected by these factors is the perimeter reconstruction of the vegetated bodies. Exploiting the classification of the 3D points cloud identified as Vegetation, and carefully controlled by a manual process, we extracted a mask of the vegetated areas for both the 2017 and 2018 surveys. In this way, more information about the vegetation coverage spread in the riverbed area was obtained, showing that the vegetated area grew about 33% from 2017 (about 270.00 m2) to 2018 (about 360.000 m2).
This information can be very important in congested points, where the riverbed area is smaller and the vegetation denser, in order to plan the time of river cleaning from vegetation.
4. Conclusions
The advent of UAVs has recently transformed the way to investigate various natural processes. The high-resolution products achievable with this technique let it overcome the limits that characterize satellite and airborne-based optical imagery such as temporal and spatial resolution. The success is largely dependent on the sensor used as well as the UAV features. In this study, the drone Saturn Mini (developed by the University of Florence, Italy) allowed optimal flights in maximum security, essential due to the proximity of the area with urban structures in compliance with the Italian flight regulations. Moreover, the drone optimization allowed us to carry out the survey of a 12 km long stretch of the French–Italian Roia River in only two days, despite the area extension and the number of flight plans required (
Table 1). These characteristics (large extension, high resolution, high execution speed) and a multi-temporal survey provided key information on the riverbed morphometry evolution of the Roia River.
The activities were appropriately prepared with a strategic positioning of GCPs and accurate flight plans, analyzing the effect of shots with oblique perspective to cover shadow areas. These allowed the reconstruction of shadow areas out of reach for satellite and airborne-based techniques (such as under bridges), among the key zones for risk analysis studies. By means of a change detection analysis, we were able to observe the channel changes of some significant segments, such as zones in proximity of bridges or close to a river confluence area. There, riverbank erosion and several channel bed areas under erosion or sedimentation were identified quantitatively through the DTM difference. Only deep water (deeper than 20 cm) was excluded in the analysis since the shallow areas were comparable to the error and allowed the interpretation of some of the identified processes. The drone method can be applied even at a smaller scale and with a higher resolution, aimed for example at inspections.
The extension of the same procedure to vegetation showed a strong increase in its growth, highlighting the feasibility of the methodology for the monitoring of a river in all its aspects. Therefore, the photogrammetric technique allowed for the identification of the vegetation and the possibility to manage it separately, helping in the identification of the areas needing maintenance or most at risk.
New surveys conducted at regular intervals could play a key role in monitoring, understanding, and maintaining the river in order to support decisionmakers, thus avoiding predictable natural disasters.


 ,
, 


