Article

Exploring the Variation Trend of Urban Expansion, Land Surface Temperature, and Ecological Quality and Their Interrelationships in Guangzhou, China, from 1987 to 2019

1
Key Laboratory of Guangdong for Utilization of Remote Sensing and Geographical Information System, Guangdong Open Laboratory of Geospatial Information Technology and Application, Guangzhou Institute of Geography, Guangdong Academy of Sciences, Guangzhou 510070, China
2
Southern Marine Science and Engineering Guangdong Laboratory (Guangzhou), Guangzhou 511458, China
3
School of Geography and Remote Sensing, Guangzhou University, Guangzhou 510006, China
4
School of Geography, South China Normal University, Guangzhou 510631, China
*
Author to whom correspondence should be addressed.
Submission received: 23 January 2021 / Revised: 2 March 2021 / Accepted: 5 March 2021 / Published: 8 March 2021
(This article belongs to the Special Issue Understanding Urban Systems Using Remote Sensing)

Abstract

:
This study explored the model of urban impervious surface (IS) density, land surface temperature (LST), and comprehensive ecological evaluation index (CEEI) from urban centers to suburbs. The interrelationships between these parameters in Guangzhou from 1987 to 2019 were analyzed using time-series Landsat-5 TM (Thematic Mapper), Landsat-8 OLI (Operational Land Imager), and TIRS (Thermal Infrared Sensor) images. The urban IS densities were calculated in concentric rings using time-series IS fractions, which were used to construct an inverse S-shaped urban IS density function to depict changes in urban form and the spatio-temporal dynamics of urban expansion from the urban center to the suburbs. The results indicated that Guangzhou experienced expansive urban growth, with the patterns of urban spatial structure changing from a single-center to a multi-center structure over the past 32 years. Next, the normalized LST and CEEI in each concentric ring were calculated, and their variation trends from the urban center to the suburbs were modeled using linear and nonlinear functions, respectively. The results showed that the normalized LST had a gradual decreasing trend from the urban center to the suburbs, while the CEEI showed a significant increasing trend. During the 32-year rapid urban development, the normalized LST difference between the urban center and suburbs increased gradually with time, and the CEEI significantly decreased. This indicated that rapid urbanization significantly expanded the impervious surface areas in Guangzhou, leading to an increase in the LST difference between urban centers and suburbs and a deterioration in ecological quality. Finally, the potential interrelationships among urban IS density, normalized LST, and CEEI were also explored using different models. This study revealed that rapid urbanization has produced geographical convergence between several ISs, which may increase the risk of the urban heat island effect and degradation of ecological quality.

Graphical Abstract

1. Introduction

As a benefit of China’s reform and opening-up policy in 1978, the Chinese national economy has developed rapidly, and the urbanization rate has increased dramatically [1,2]. With rapid urbanization, urban land use and landscape patterns have changed significantly [3,4,5]. A large proportion of natural land areas have been converted to impervious surface (IS) areas, which has led to the substantial expansion of IS areas and a dramatic decrease in the amount of natural land, including forests, farmland, soil, wetlands, grasslands, and rivers. The resulting expansion and aggregation of ISs are likely to aggravate the deterioration of the urban ecological environment through air pollution, urban heat island effects, landscape fragmentation, and water quality degradation [6,7,8,9,10,11]. The quality of urban environments is attracting significant worldwide attention in light of the distinct urbanization process in China compared with that in western countries [12,13,14,15]. It is urgent to analyze and evaluate urban growth and its ecological and environmental effects to support urban planning and design [16]. Thus, it is essential to perform spatiotemporal analysis of urban expansion patterns and dynamics and to determine their contribution to the changes in the ecological environment for understanding and mitigating the ecological and environmental deterioration resulting from urbanization [17].
Based on the land use/land cover changes extracted from remote sensing data, previous studies have quantified and analyzed the spatial and temporal characteristics of urban expansion, revealing the spatio-temporal dynamics of urban growth [18,19,20,21,22]. Combining landscape analysis and urban growth type analysis methods, Fei and Zhao [18] analyzed the spatio-temporal expansion dynamics of six megacities (Beijing, Chongqing, Guangzhou, Shanghai, Shenzhen, and Tianjin) and the temporal coevolution of their urban attributes over the past four decades, using multi-temporal Landsat images from 1978 to 2015. Considering spatio-temporal interdependences and global–local interactions, Xu et al. [23] investigated and analyzed the macro patterns and micro dynamics of urban expansion using an S-shaped urban land density function and the proximity expansion index, respectively. The S-shaped urban land density function proposed by Jiao [16] has been applied to urban land use data to characterize urban forms and changes and to measure urban growth; this function can illustrate the spatial attenuation and trend in urban land density variation from the urban center to the suburbs. Based on the S-shaped function, both the mean land surface temperature (LST) and the urban land density were modeled as a function of the distance from the city center, which depicts the spatio-temporal patterns of LST and urban sprawl [24]. In addition, the interrelationship between these parameters was also determined, and it indicated that urban expansion significantly affected LST [24]. However, the urban land density function based on pixel-scale land-use data may introduce errors in the spatiotemporal analysis of urban growth. The IS fraction could provide continuous spatial data at a subpixel scale, which has been widely applied for determining the spatiotemporal dynamics and changes in urban growth and analyzing urban eco-environment effects [25,26,27].
Many researchers have used different indicators, methods, and models to explore the relationships between urban expansion, LST, and ecological quality evolution in different areas [28,29,30]. Besides, a remote sensing-based ecological index (RSEI) has been developed for monitoring and assessing regional ecological changes [31]. The results suggest that RSEI could effectively determine regional ecological quality. Xu et al. [32] explored the relationships between the IS area and the improved RSEI in Xiong’an New Area; their results show that IS has a considerable negative impact on ecological quality. To determine the spatiotemporal characteristics of ecological quality evolution under the pressure of urbanization in the Guangdong–Hong Kong–Macau Greater Bay Area (GBA), following the research of Xu [31] and Xu et al. [32], a comprehensive ecological evaluation index (CEEI) was developed to detect changes in the urban ecological quality of an entire region by integrating VC (vegetative cover), VHI (vegetative health index), NDBSI (normalized difference built-up and soil index), LSM (land surface moisture), and LST [33]; the results showed that the proposed CEEI may yield effective results in the GBA.
As a city that has undergone comprehensive innovative reform in the GBA, Guangzhou has experienced transformed and upgraded development patterns, shifting from an extensive to an intensive pattern [34]. With rapid urbanization, the fragile ecology has been seriously damaged because of the expansion of IS areas. Time-series IS maps, gravity center analysis, and standard deviational ellipse methods have been combined to analyze all the spatio-temporal expansion characteristics of urban development at different scales [35]. However, the spatio-temporal dynamic characteristics of urban expansion from the urban center to the suburbs and its influence on the LST and ecological quality have not been determined. Further investigations are needed to deepen the understanding of urban expansion and to elucidate its effect on LST and urban ecological quality [36,37,38].
The main purpose of this study was to make a detailed description and analysis of the spatiotemporal change in urban growth from urban centers to suburbs and its influence of urban expansion on the urban thermal environment and ecological quality in Guangzhou during the period of 1987 to 2019. To this end, multi-temporal Landsat remote sensing data from 1987, 1999, 2009, and 2019 were used. This study included (1) an analysis of the expansion trend of urban IS density from the urban center to the suburbs based on time-series IS fraction data, using an inverse S-shaped function; (2) an exploration of the spatiotemporal trends of land surface temperature (LST) and comprehensive ecological evaluation index (CEEI) versus distance through modeling of the LST and CEEI functions with distance from the urban center; and (3) an analysis of the potential interrelationship among urban IS density, LST, and CEEI, to highlight the impact of urban expansion on the urban heat environment and urban ecological quality.

2. Data Sources

2.1. Remote Sensing Data

In this study, four Landsat images from the Landsat-5 TM and Landsat-8 OLI/TIRS, captured between 1987 and 2019, were selected to extract the ISs and retrieve the LST and CEEI. Two Landsat images (Path 122/Row 43 and Path 122/Row 44) were required to cover the study area completely. Only a small part of northern Guangzhou is included in the Landsat image of Path 122/Row 43. Time-series Landsat images with 0% cloud cover from Path 122/Row 44 were selected for this study. The 30-m Landsat-5 and Landsat-8 images were downloaded from the United States Geological Survey (USGS) Earth Resources Observation and Science (EROS) Center Science Processing Architecture (ESPA) on Demand Interface (https://espa.cr.usgs.gov/ (accessed on 2 March 2021)). The downloaded Landsat-5 and Landsat-8 surface reflectance products were processed using the LDEAPS [39] and LASRC [40] algorithms, respectively. The downloaded 30-m thermal infrared products from Landsat-8 band 10 and Landsat-5 band 6 have been resampled from the original 100-m Landsat-8 and 120-m Landsat-5 thermal infrared data using the cubic convolution algorithm. Finally, all the Landsat surface reflectance and thermal infrared products were geometrically adjusted to the Universal Transverse Mercator (UTM) projection system (zone 49 N). The dates of the Landsat images are listed in Table 1.

2.2. Study Area

Guangzhou is located at 112 o 57   E 114 o 30   E and 22 o 26   N 23 o 56   N in southcentral Guangdong Province, southern China, as shown in Figure 1. As one of the five national central cities, Guangzhou is the capital of Guangdong Province and is recognized as the political, economic, cultural, technological, and transportation center of China’s famous open coastal cities and national comprehensive reform pilot area, with a long development history of more than 2000 years [13]. It is the core city of the Guangdong–Hong Kong–Macao GBA and the Pan-Pearl River Delta Economic Zone, and the hub city along the Belt and Road [41]. Guangzhou contains nine administrative districts—Liwan, Yuexiu, Haizhu, Tianhe, Baiyu, Huangpu, Huadu, Panyu, and Nansha—and two county-level cities—including Zengcheng and Chonghua—with a total area of 7434.4 km2. It is situated in the coastal subtropical zone, which has a subtropical monsoon climate characterized by warm and rainy conditions. The annual average temperature is approximately 20–22 °C, and the annual rainfall is up to 1720 mm. The DEM of Guangzhou is from 0 to 1153 m. Furthermore, Guangzhou is well-known as the “Flower City” because of its evergreen plants [41]. The study area contained six types of land covers, i.e., impervious surfaces (containing building and road), forests, shrubs, woods, grassland, and water bodies.
Figure 1c shows a red circle and grey circular rings. The red circle with a radius of 1 km is identified as the starting center of urban IS expansion, which is located at the junction between Liwan, Yuexiu, and Haizhu [35]. The grey circular rings are concentric and represent a series of 1-km equidistant buffer rings from the urban center to the city boundaries of Guangzhou. The concentric rings cover almost the entire urban land, as shown in Figure 1c.

3. Methods

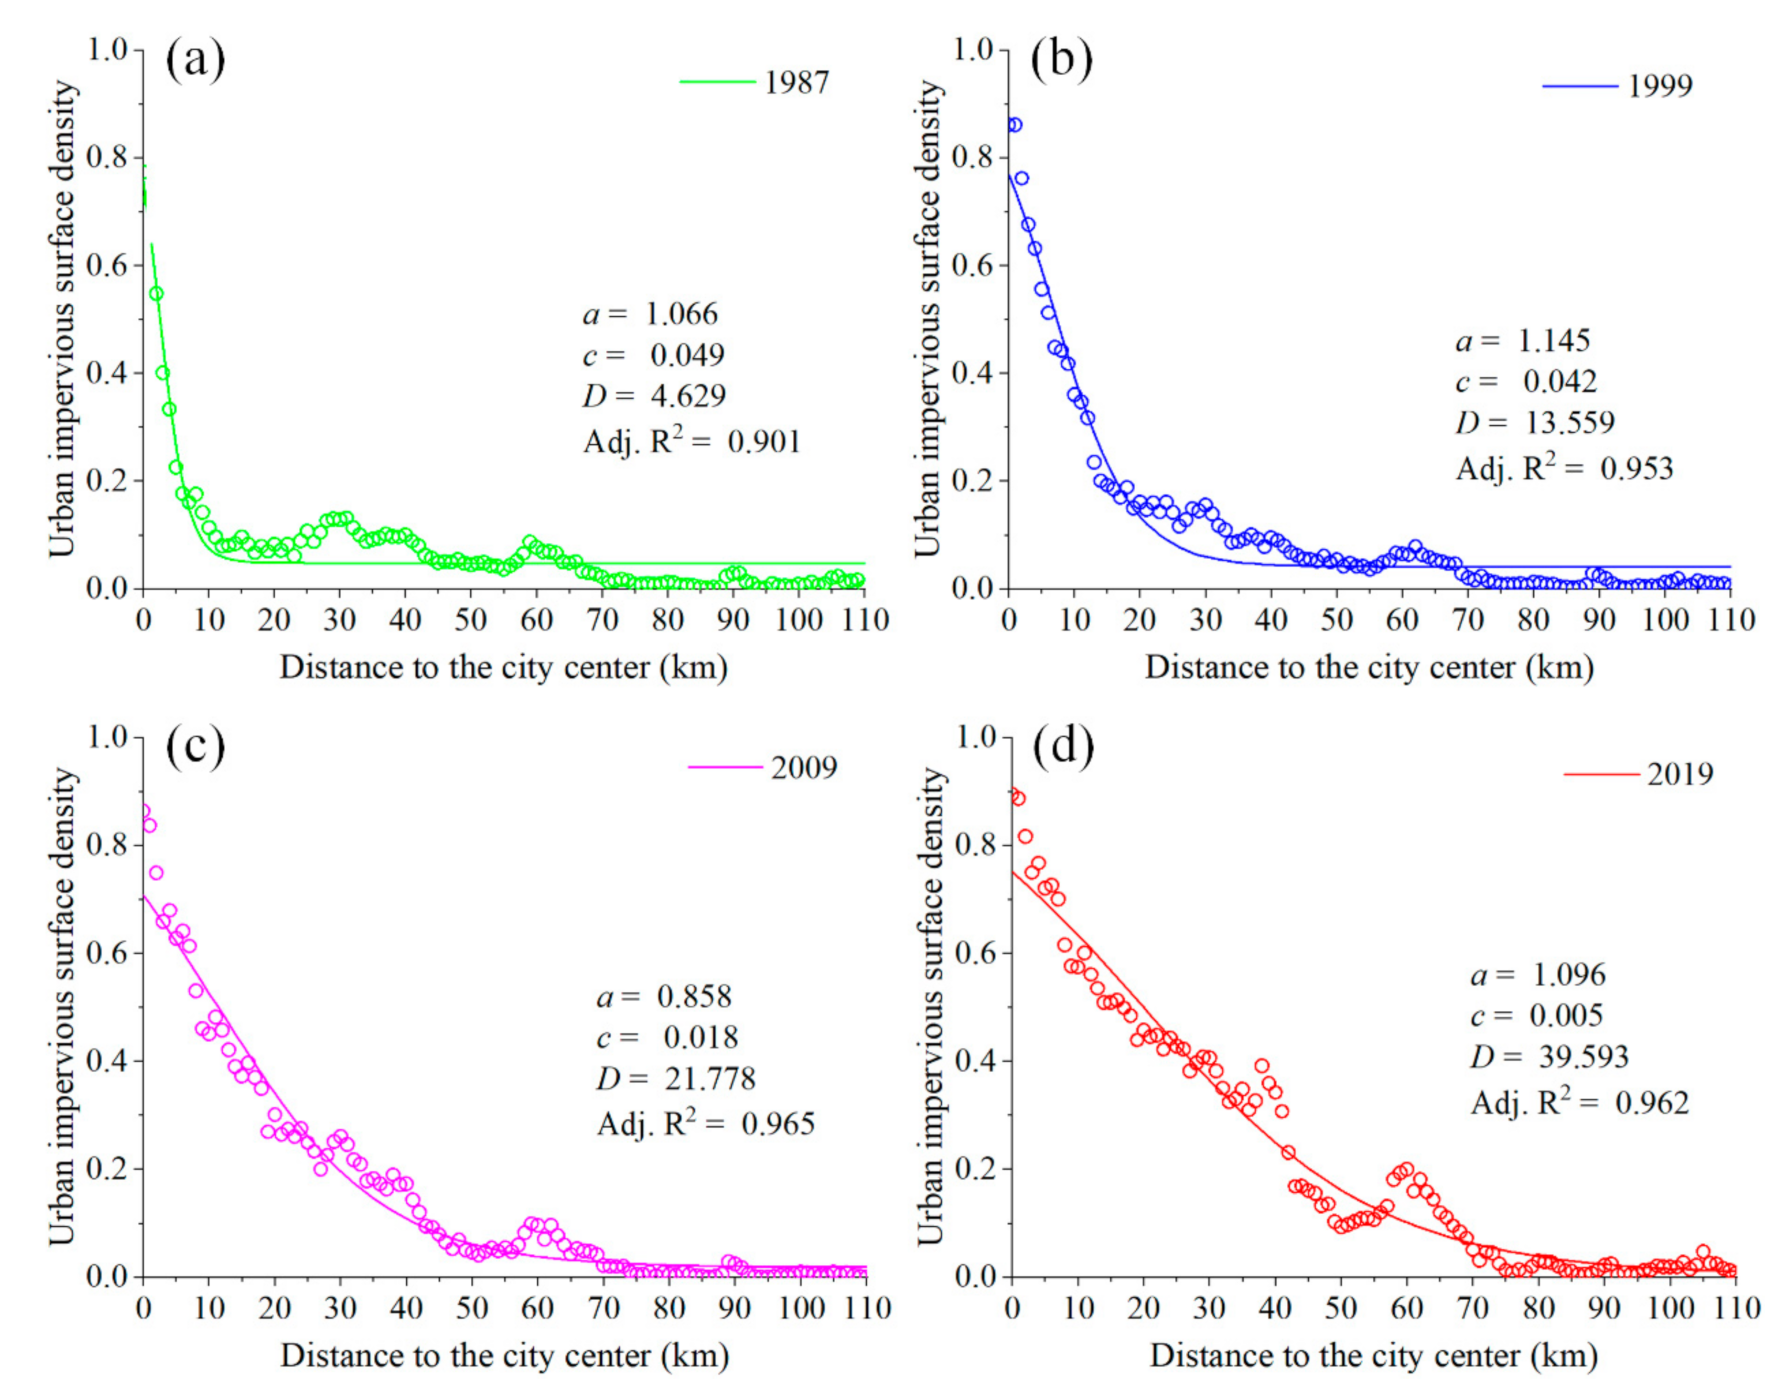
3.1. Urban IS Density Function

To characterize the spatial patterns of urban land density in a city, a modified sigmoid function with an inverse S-shape, proposed by Jiao [16], was applied to the pixel-based land use maps [23,24]. In this study, instead of land use data, we used subpixel-based urban IS fractions extracted from Landsat imagery to calculate the urban IS density. The urban IS fractions in a time series at the subpixel scale were extracted using a modified linear spectral mixture analysis (MLSMA) model, which satisfied the practical accuracy requirements for analyzing the spatial patterns of urban sprawl [42]. Referred to the research of Jiao [16], a total of 112 rings with a 1-km equidistance were generated from the urban center in Guangzhou, as shown in Figure 1c. Based on a study conducted by Jiao [16], the urban IS density within concentric rings was defined as the ratio between urban IS and the area of buildable land for each ring. The formula for urban IS density is as follows:
IS _ Den = S IS S ,
where IS _ Den is the urban IS density, and S IS is the urban IS area in a ring, which is estimated using the MLSMA IS fractions with the Landsat images. S is the total land area excluding water bodies in a ring. In this study, the water bodies in Landsat imageries were first masked using the modified normalized difference water index (MNDWI).
After calculating the urban IS densities in a series of concentric rings in 1987, 1999, 2009, and 2019 in Guangzhou city, an urban IS density function with an inverse S-shape was used to describe the spatial patterns of urban IS density; the function is defined as follows:
f r = 1 c / 1 + e a 2 r / D 1 + c ,
where f r is the urban IS density in the rings, which is calculated using Equation (1); r is the distance to the urban center; and a , c , and D are constants, which vary between the different dates. Parameter c denotes the background value of the urban IS density in the hinterland of the city, and parameter D represents the boundary distance of the main urban area for a city, which can be defined by the variation in urban IS density. Parameter D increases with time, which indicates the expansion of urban IS areas. Parameter a controls the slope of the curve of the urban IS density function.
Furthermore, the compactness of Guangzhou was measured using the following formula:
k s = 0.57735 1 c a 1.316957 D ,
k p = 1.316957 a ,
where a , c , and D are the parameters of the urban IS density function from Equation (1); k s is the slope of the function f r , which reflects the overall urban IS density. A high k s value denotes compact cities, while a low k s value indicates sprawling cities. Thus, the k s value tends to decrease when a city exhibits expansive urban growth. The k p value can be used to measure the degree of dispersion of different cities over time [16].

3.2. LST Retrieval from Landsat Imageries

In this study, thermal infrared band 10 of Landsat-8 TIRS and band 6 of Landsat-5 TM were used for retrieving the LST from 1987 to 2019. First, the thermal band data of Landsat-8 TIRS and Landsat-5 TM were be converted from spectral radiance to the at-satellite brightness temperatures ( T b ) using the thermal constants.
T b = K 2 ln K 1 L λ + 1 ,
where T b is the at-sensor brightness temperature (K), L λ is TOA the spectral radiance (W/m2srμm), K 1 and K 2 are the thermal conversion constant. For Landsat-5 TM, K 1 is 607.76 W/m2srμm and K 2 is 1260.56 K; for band 10 of Landsat-8 TIRS, K 1 is 774.89 W/m2srμm and K 2 is 1321.08 K.
Land surface emissivity ( ε ) varied with land covers on ground surfaces, which was highly correlated with NDVI. Thus, emissivity values of this study area were obtained with the simplified NDVI method. Integrated with NDVI calculated with the reflectance of NIR and R bands, the land surface emissivity ε is calculated using NDVI as follows [43,44,45]:
ε = { 0.9925           NDVI < 0 0.923           0 NDVI < 0.15 1.0094 + 0.047 l n NDVI           0.15 NDVI 0.727 0.986           NDVI > 0.727
where, the emissivity ε of water ( NDVI < 0 ) is assigned a value of 0.9925, the emissivity ε of impervious surface and bare soil ( 0 NDVI < 0.15 ) is assigned a value of 0.923, the emissivity ε of vegetation ( NDVI > 0.727 ) is assigned a value of 0.986, and the emissivity ε of other land cover is calculated with Equation (7).
Finally, by combining T b thermal infrared bands from Landsat images, the LST was retrieved by combining land surface emissivity, which has been widely used to retrieve LST over urban areas [43]. Integrated with the land surface emissivity ε , the at-sensor brightness temperatures were used to retrieve LST from 1987 to 2019, based on the following formula [46]:
LST = T b 1 + λ × T b / α ln ε ,
where LST is retrieved from Landsat imagery with a spatial resolution of 30 m in kelvin (K); T b is the at-sensor brightness temperature of the thermal band (K); λ is the center wavelength, which is 10.9 and 11.45 μm for band 10 of Landsat-8 and band 6 of Landsat-5 TM, respectively; and α is a constant with a value of 1.438 × 10⁻² mK.

3.3. Comprehensive Ecological Evaluation Index

To quantitatively evaluate ecological quality during the progress of rapid urbanization, Yang et al. [33] introduced a CEEI by integrating five remote sensing-based parameters—VC, VHI, NDBSI, LSM, and LST. The five parameters were first standardized between 0 and 1 using Equations (8) and (9):
X i = x i x min / x max x min
X i = x max x i / x max x min
where X i stands for the normalized value of x i , and x max and x min are the maximum and minimum values of x , respectively. In this study, VC, VHI, and LSM were standardized using Equation (8), and other parameters, including NDBSI and LST, were standardized using Equation (9). Then, the standardized VC, VHI, NDBSI, LSM, and LST were integrated to extract the first principal component (PC1) using principal component analysis (PCA). Finally, PC1 was also standardized and normalized between 0 and 1; the normalized value was identified as CEEI.
PC 1 = PCA VC std ,   VHI std , NDBSI std , LSM std , LST std
CEEI = PC 1 PC 1 min / PC 1 max PC 1 min .
where PC1 is the first component of PCA, and PC 1 max and PC 1 min are the maximum and minimum values of the first component, respectively. Integrating NDVI, nitrogen reflectance index [47], and normalized difference senescent vegetative index [48], the VHI parameter was estimated using PCA. NDBSI was calculated by averaging the index-based built-up index (IBI) [49] and soil index (SI) [50]. LSM was estimated using the wetness component of the tasseled cap transformation. More detailed information about the estimation of VHI, NDBSI, and LSM can be found in a report by Yang et al. [33]. Unlike Yang et al. [33], we estimated LST using Equations (6) and (7), and the vegetation fractions were extracted using the MLSMA model developed by Zhao et al. [42]. These fractions were used as the VC parameter in this study. To describe the spatio-temporal feature patterns of ecological quality under the rapid urbanization of Guangzhou city, the CEEIs were calculated using time-series Landsat images from four periods: (1) 1987, (2) 1999, (3) 2009, and (4) 2019.

4. Results

4.1. Urban IS Densities in Concentric Rings

The time-series urban impervious surface (IS) fractions were extracted using the MLSMA model of Zhao et al. [42], as shown in Figure 2. It can be seen from Figure 2 that the IS areas were significantly increased from 1987 to 2019. In 1987, most impervious surfaces were mainly concentrated on northern Liwan, western Yuexiu, and northwest Haizhu, and only partial impervious surfaces were dispersed in other regions. Then, the ISs were expanding outwards from the old heart of Guangzhou. From 1987 to 1999, several IS clusters mainly appeared in Liwan, Yuexiu, and Haizhu. In 2009, most incremental increases in impervious surfaces were concentrated in Baiyun, Tianhe, and Huangpu. In 2019, impervious surfaces almost covered the whole region, except the forest and agricultural areas.
Base on the time-series urban IS fractions, we calculated the urban IS densities in each concentric ring for 1987, 1999, 2009, and 2019. The variations in urban IS density with the distance from the urban center to the suburbs are shown in Figure 3.
The urban IS density decreases from the urban center to the urban fringe in general. It decreases rapidly within 25 km of the urban center, increases slowly from 25 to 30 km, decreases from 30 to 50 km, increases slowly again, and then decreases gradually to a more sustainable level. No evident differences in the urban IS density were observed 70 km from the center during any of the four periods. Furthermore, the urban IS density in each concentric ring increased significantly from 1987 to 2019. This indicates that an apparent but differentiated development of urban space occurred in each concentric ring within 70 km of the urban center during the past 32 years. However, the urban density 30 km from the urban center barely increased in 1987 and 1999. This is understandable because the regions within 30 km of the urban center were mainly covered by the impervious surface (Figure 2). Except for the central districts, all regions are zoned as urban fringe with pockets of planting. Figure 3 shows that the urban IS density increased significantly in 2009 and 2019, and the increase rate of urban IS density in 2019 was higher than that in 2009.
Based on the urban IS density in the concentric rings, the fitted curves of Equation (2), which were calculated using the nonlinear least squares method in OriginPro 2018C, are shown in Table 2 and Figure 4. All the fitting accuracy (R2) of the modified inverse S-shaped models was higher than 0.9, which proves the feasibility and validity of this model. In Table 2 and Figure 4, parameter D significantly increased with time, which represents a significant trend of urban expansion in Guangzhou overall with time. The radius of the main urban area of Guangzhou is up to 39.6 km.
The urban IS density curves in Figure 4 indicate that the urban expansion of Guangzhou was non-monocentric, showing clear polycentric characteristics, especially in the transformation (2000–2010) and upgrading (2010–present) stages of rapid growth, as shown in Figure 2 and Figure 4. It can be clearly inferred from Figure 2 and Figure 4 that the urban spatial structure changed from a single-center to a multi-center structure during the 32-year rapid development of Guangzhou. This result is similar to that of the research of Jiao [16].
To measure the compactness of Guangzhou city, two parameters— k s and k p —were calculated using the parameters obtained from the urban IS density functions, as shown in Table 3. The k s value tended to decrease gradually as from 1987 to 2019, demonstrating that Guangzhou experienced expansive urban growth. The k p values of Guangzhou city for different periods are listed in Table 3. The k p value for 2009 is the highest among the four values, which indicates that Guangzhou experienced more dispersed urban development in 2009 than in the other years. This may be because the urban IS densities in the Baiyun, Huangpu, and Panyu districts, which are near the inner urban area of Guangzhou, simultaneously increased during the transitional period of expansive urban development (2000–2010). In other words, the urban built-up areas in these districts expanded significantly during the rapid urban sprawling of 1999–2009.

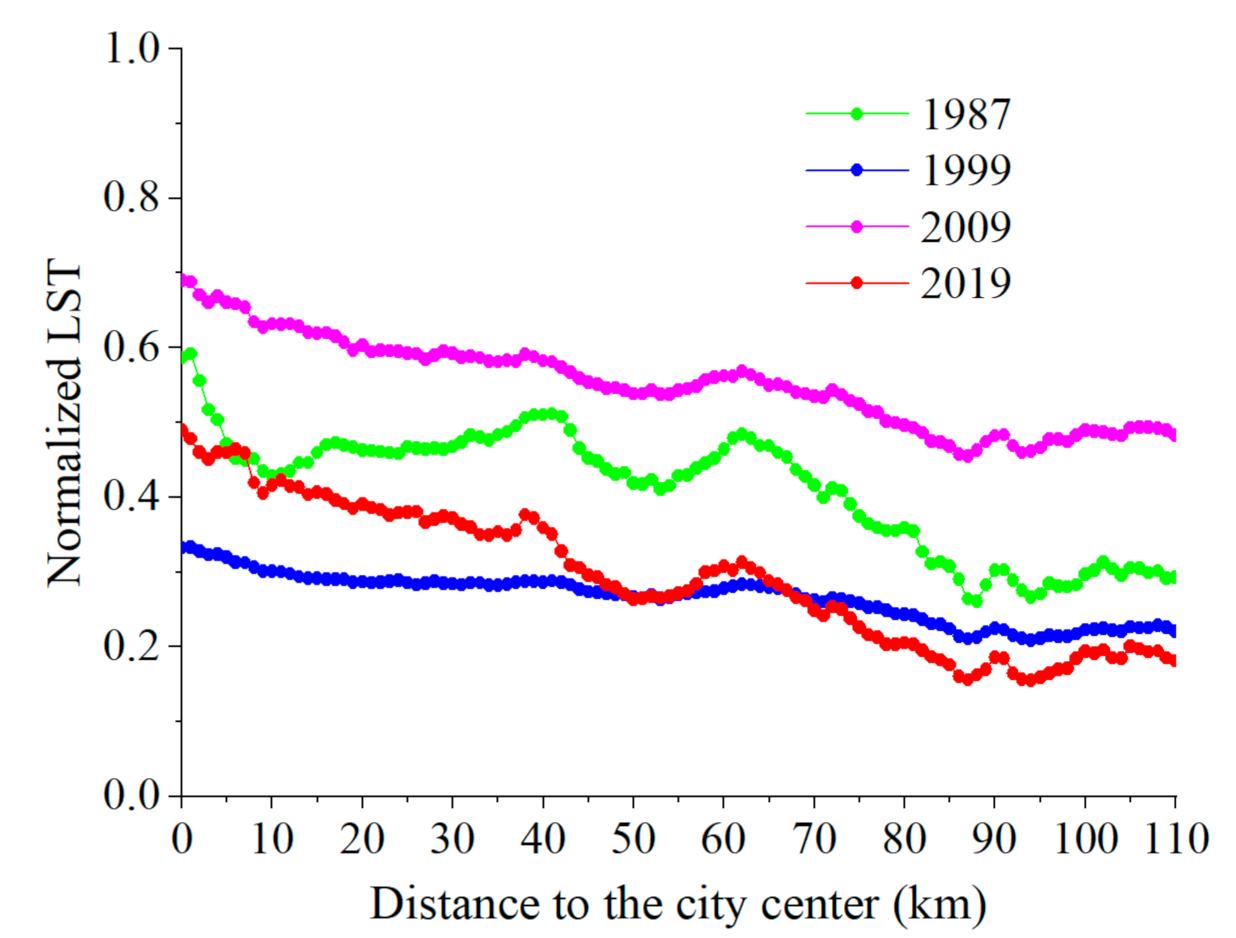
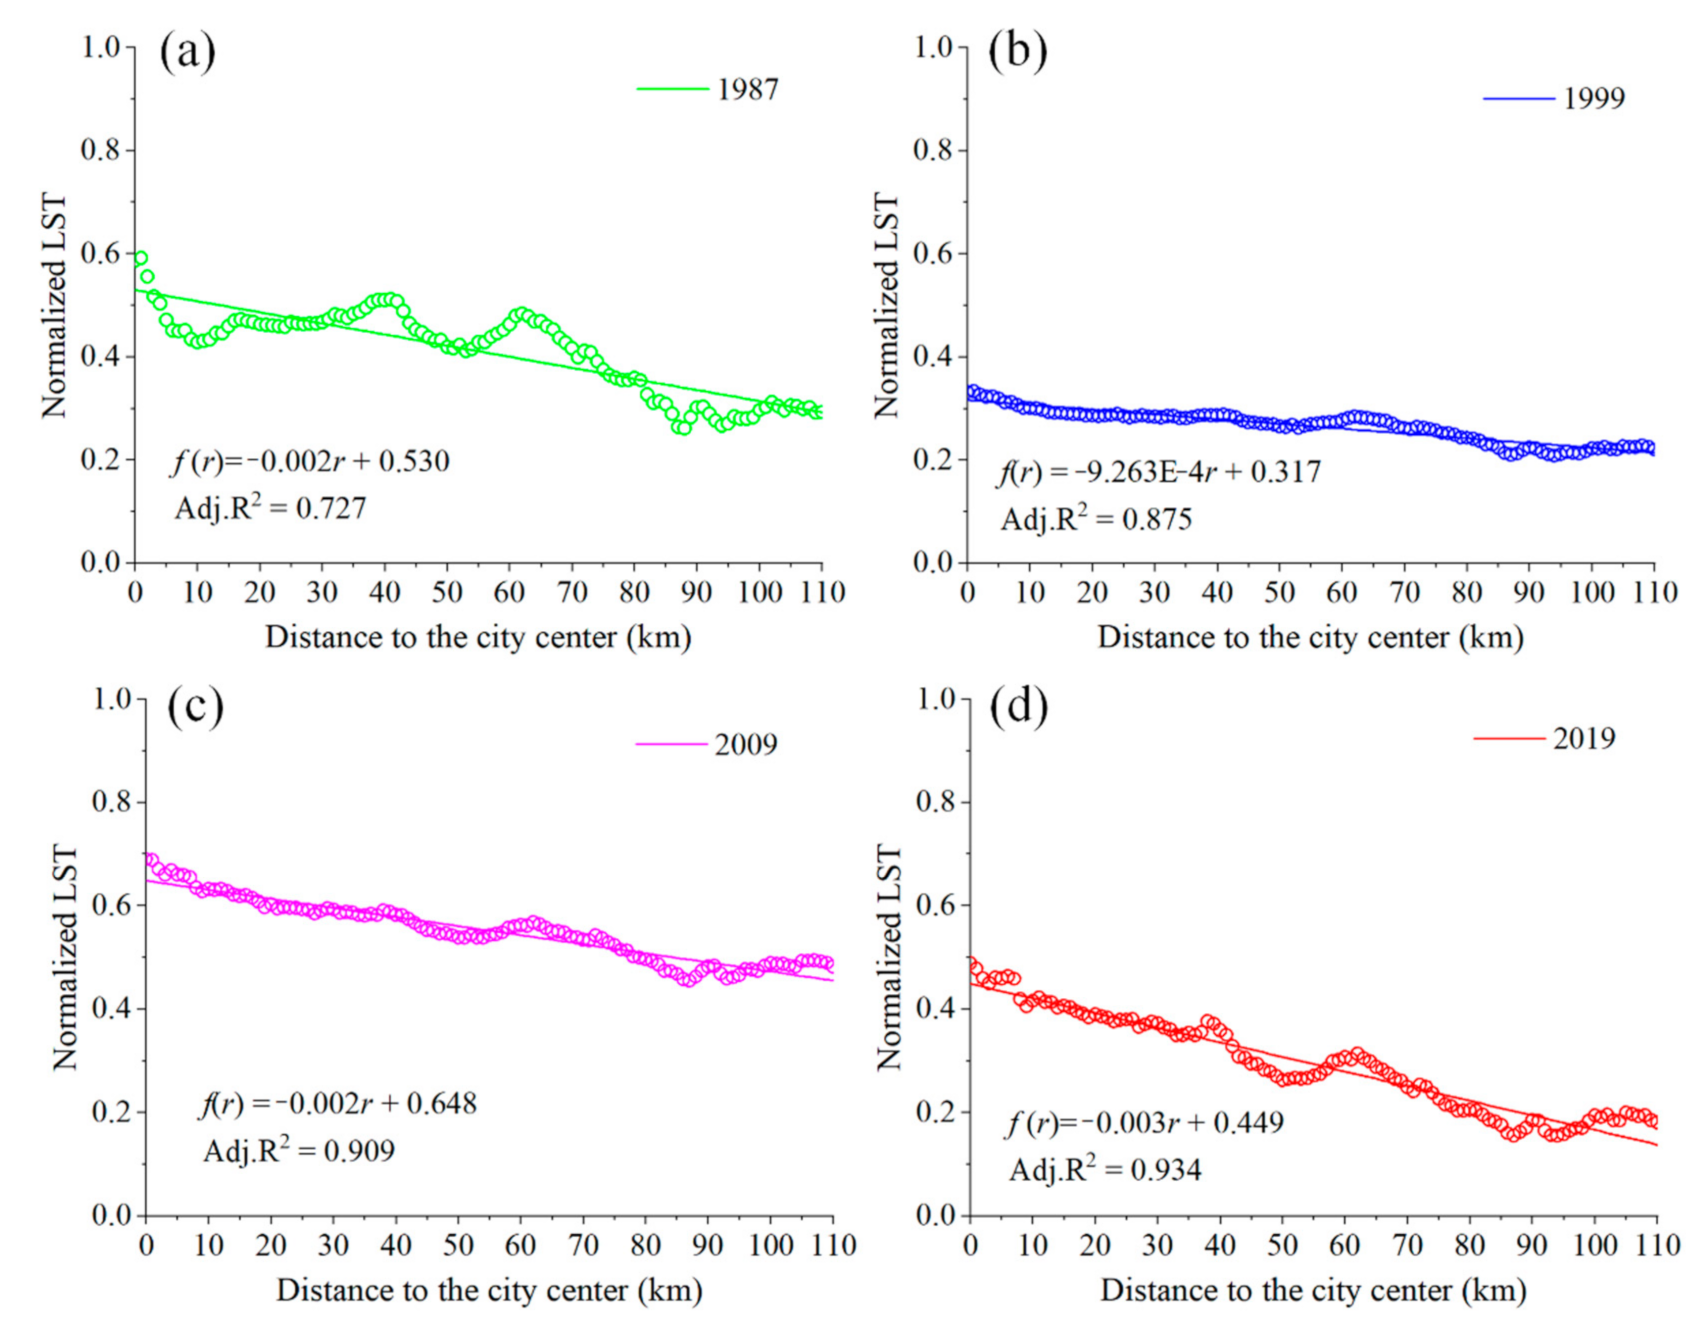
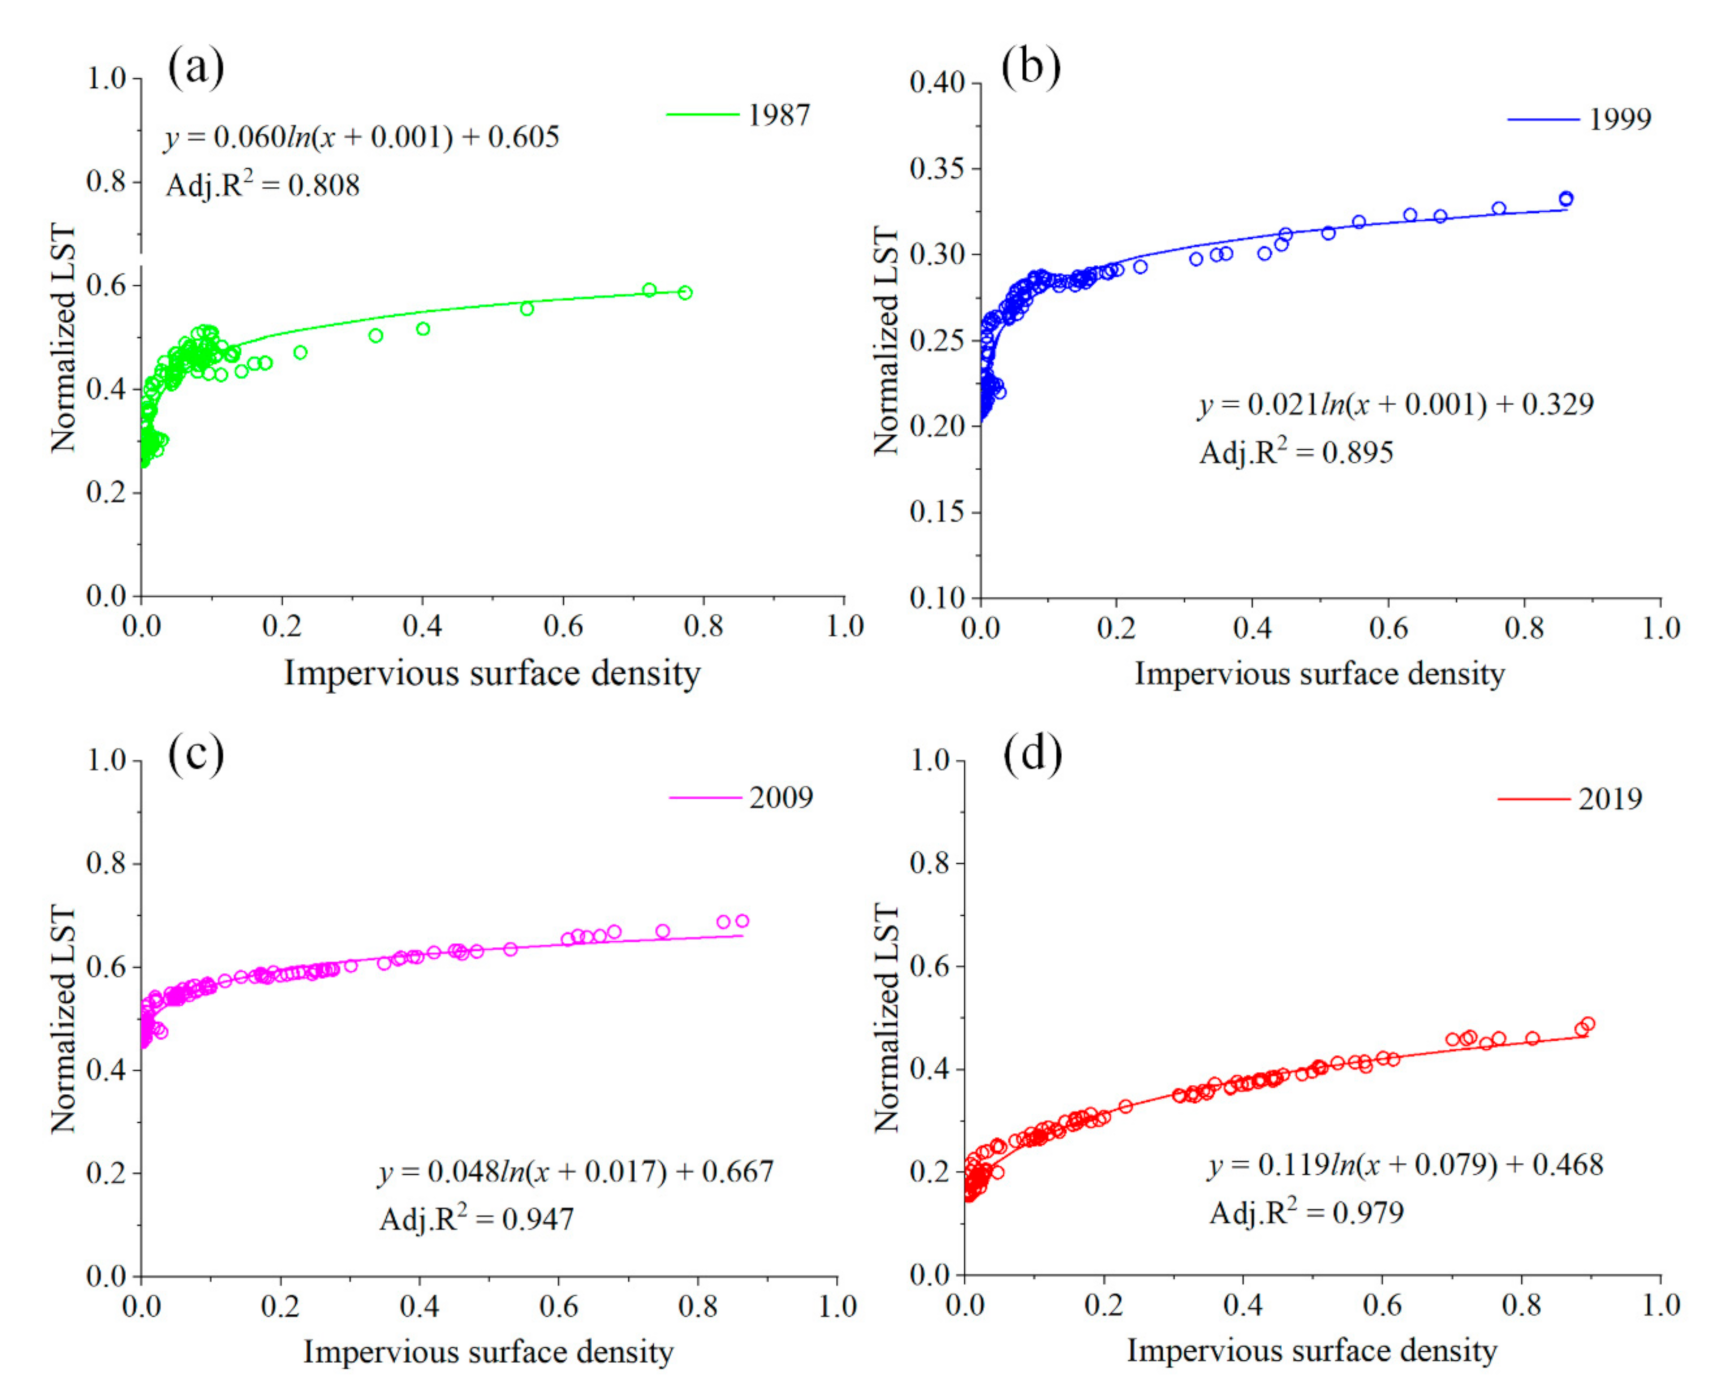
4.2. Normalized LST in Concentric Rings

Based on Equations (6) and (7), the time-series LSTs were calculated using the thermal bands of Landsat imagery in 1987, 1999, 2009, and 2019. Then, the time-series LSTs were normalized between 0 and 1. The average normalized LST in each concentric ring is shown with the distance to the urban center in Figure 5.
As seen in Figure 5, the normalized LST decreases from the urban center to the suburbs for all four periods. There were several relatively large fluctuations in the normalized LST in 1987. In that year, the normalized LST, which ranged from 0.59 to 0.29, decreased rapidly within 10 km of the urban center, increased from 10 to 40 km, decreased from 30 to 50 km, increased over a short distance again, and then decreased significantly to a more sustainable level after 95 km. In 1999, the LST was not significantly different between urban and rural areas. However, the significant LST difference between urban and rural areas could be identified in 2019, with the maximum difference being 0.3. In general, the LST differences between urban and rural areas showed a gradual ascending trend from 1999 to 2019. The increasing trend of LST differences during 1999–2019 was similar to the trend of the urban IS density, as shown in Figure 3 and Figure 5. In other words, the uneven development between urban and rural IS areas may have led to significant LST differences during the stage of expansive urban growth.
Table 2 and Figure 6 show that the mathematical models of the normalized LST with the distance to the urban center were linear regression models for 1987, 1999, 2009, and 2019. The determination coefficients of the four models were greater than 0.87, except for the 1987 model; in 1987, the normalized LST fluctuated with the distance to the urban center. Thus, the 1987 model had the minimum determination coefficient. Nevertheless, the coefficient was still greater than 0.727 (Table 2), which is significantly high. The fitting results of these linear regression model indicate that the normalized LST is significantly correlated with the distance to the urban center. Furthermore, Figure 6 shows that all four linear regression models had a negative slope. This indicates that the normalized LST gradually decreased from the urban center to the suburbs during 1987–2019.

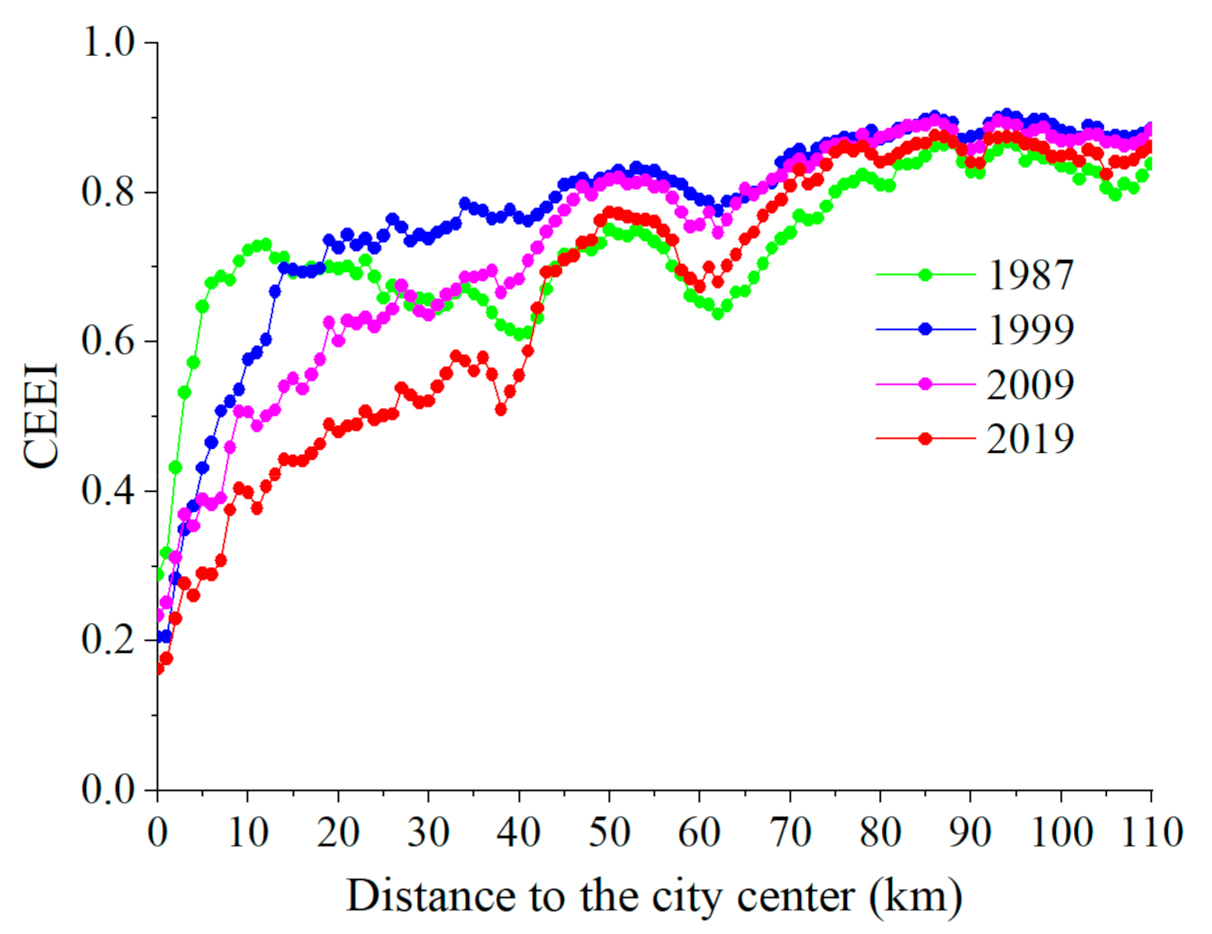
4.3. CEEI in Concentric Rings

The variations in CEEI with the distance to the urban center are shown in Figure 7. The CEEI value reflects the variation trend of ecological quality in time and space from the urban center to suburbs in 1987–2019. In space, the CEEI value significantly increased with the distance to the urban center. This indicated that the ecological quality of Guangzhou tended to degrade from the urban center to the suburbs during the past 32 years, especially for the period from 1999 to 2019. In 2019, the minimum CEEI of less than 0.2 in the urban center indicated a poor ecological quality. The CEEI in 1987 followed a different trend from those in the other years. The CEEI in 1987 was higher than other years within 15 km of the city center and lower than other years over 50 km. Between 15 and 50 km, the CEEI showed a significantly decreasing trend with distance. Figure 7 shows that the ecological quality of Guangzhou generally decreased with time during rapid urbanization, especially in urban areas. Furthermore, the ecological quality of Guangzhou exhibited a trend opposite from that of the urban IS density in space and time, as shown in Figure 3 and Figure 7. In other words, urban centers with a high IS density may have poor ecological quality.
The nonlinear models of the CEEI with distance during 1987–2019 are shown in Table 2 and Figure 8. In Table 2, the CEEI has a hyperbolic model for 1987 and 1999, a second-order polynomial model for 2009 and 2019. These nonlinear models can achieve a satisfactory fit with a determination coefficient greater than 0.949 for 1999, 2009, and 2019. However, the hyperbolic model for 1987 was poorly fitted with a low determination coefficient of 0.487. This may have been caused by the fluctuation of the CEEI with distance.

5. Discussion

In this study, the time-series impervious surface (IS) fractions extracted with four Landsat-5 and Landsat-8 images were used to analyze the expansion trend of urban IS density from the urban center to the suburbs in Guangzhou from 1987 to 2019. In this period, the development of urban space firstly expanded along the Pearl River, and then expanded in both the northeast and southeast directions simultaneously. During the process of rapid urbanization, Tianhe district has gradually come into being a new city center. This may lead to a multi-center urban spatial structure. It can be clearly inferred that Guangzhou has experienced an urban expansion with clear polycentric characteristics from 1987 to 2019, as shown in Figure 2 and Figure 4.
The urban IS density significantly decreased from the urban center to the urban fringe. This suggests that urban and rural differences had emerged, and these differences increased particularly after 1999. Since 2000, China has been in the transformation (2000–2010) and upgrading (2010–present) stages of rapid urbanization and in the key phase of social and economic change between urban and rural areas, which has led to urban land growth in Guangzhou at a dramatic rate [51]. This finding can also be confirmed from Figure 2 and Figure 3.
In order to analyze an urban sprawl and an outskirt growth of Guangzhou in recent years, the inverse S-shape urban IS density curves were constructed. The results were different from the findings of Bonafoni and Keeratikasikorn [24] and Jiao [16]. In this study, parameter c of the estimated urban IS density curves was observed to decrease with time. This indicates that there was no significant increase in IS density in the surrounding rural area of Guangzhou during the period of rapid urban development. This result may be reasonable, which may reflect the actual situation. The central districts of Guangzhou include Liwan, Yuexiu, Haizhu, Tianhe, Baiyun, and Huangpu; other districts are located in the outskirts of Guangzhou. The districts of Huadu, Conghua, Zengcheng, and Panyu were incorporated into Guangzhou after 2000. Furthermore, the Huadu, Conghua, and Zengcheng districts in northern Guangzhou were covered by large mountainous areas with large forests. In these districts, agricultural land accounts for at least 70% of the total area. However, benefiting from the rapid growth of employment of central districts of Guangzhou, these districts has also experienced expansive development after 2000 (Figure 2), and have been competing for the best talent that can augment the productivity of their economy.
Furthermore, we explored the influence of rapid urban expansion on LST and ecological quality from urban centers to suburbs from 1987 to 2019. Figure 9 and Figure 10 show scatterplots of IS density-LST and IS density-CEEI, with the corresponding fitted model and its R2. An R2 value greater than 0.8 indicates that the fitted models can effectively express the interrelationship of IS density-LST and IS density-CEEI, which can be used to analyze the impact of urban expansion on LST and ecological quality from urban centers to suburbs. Besides, Figure 9 and Figure 10 also show that urban IS density has been found to positively and negatively affect LST and CEEI, respectively.
During the initial stage of rapid urbanization, less than 20% of the urban pervious surface was changed into an impervious surface, but the urban IS density may have a dramatic nonlinear effect on LST (Figure 9). After that, the urban IS density may be linearly positively correlated with LST with the increase of IS areas. This result indicates that small changes in IS areas effect larger LST if the IS density is less than 0.2. This is because the changes in materials and albedo of land cover may affect the thermal patterns [52]. While the IS density is larger than 0.2, LST may be largely determined by the combined effects of impervious surface and pervious surfaces, including forest, grass land, bare soil, and wetlands.
During the rapid urbanization, large areas of forests, agricultural land, and wetlands were destroyed, and the ecological system was vulnerable to destruction from reckless development. This may have led to large areas with poor ecological quality, similar to those of Yang et al. [33]. Unrestricted urban expansion with an increasing IS may lead to uneven development and exacerbate ecological deterioration. Thus, green cities with increasing urban green spaces have become the main development trend, which can improve the ecological quality in the urban areas of Guangzhou [33,53].
Presently, with rapid industrialization and urbanization, ecological quality is poor because of the increasing demand for IS areas for urban construction. An increase of IS areas may increase the risk of urban heat island and degradation of ecological quality. Thus, it has been proposed that increasing urban green space may be the most important and efficient method for improving urban heat and ecological quality, because urban green spaces have considerable potential for mitigating urban LST [54]. Extensive plant cover could increase urban green space and the corresponding NDVI by covering ISs, which can reduce the urban LST. Re-adjustment and optimization of landscape patterns may be an alternative method for mitigating the thermal effect [55] and thereby improve urban ecological quality. Strengthening and optimizing the construction of urban wetlands and parks could also be a practical means for cooling LST to improve ecological quality [56].
The urban IS density, LST, and CEEI were functions of the distance from the city center, which were calculated in concentric rings. The results are working on the assumption that the direction of urban expansion is isotropous. However, this may be unreasonable. The IS expansion had different change characteristics in various directions at different scales in Guangzhou. For example, the ISs exhibited an expansion trend in the southwest and northeast direction over the period from 1988 to 2015 for Liwan and Yuexiu, respectively [35]. Figure 2 also shows that the principle expansion direction of ISs was northeast and southeast from 1987 to 2019. Thus, we may construct a new inverse S-shaped urban IS density function by integrating inverse the S-shaped function and the standard deviational ellipse (SDE) method, to depict the spatio-temporal dynamics of urban expansion in various directions from the urban center to the suburbs. Furthermore, the study limited the study area to administrative region of Guangzhou, and did not consider the surrounding area, i.e., Foshan and Dongguan. This may introduce some errors in the construction of urban IS density function. This may be because the urban center is close to the borderline of Guangzhou, and is also closely related to Foshan. In future, the spatio-temporal expansion characteristics of urban agglomeration as a whole may be explored in various directions under a multi-center urban spatial structure.

6. Conclusions

In this study, by integrating four Landsat images of Landsat-5 TM and Landsat-8 OLI/TIRS from 1987 to 2019, we calculated the time-series urban IS density, normalized LST, and CEEI in concentric rings from the urban center to the suburbs in Guangzhou. For each year, the urban IS density curve as a function of the distance from the urban center was modeled using an inverse S-shaped function. The urban IS density curves and their corresponding parameters illustrate the general trend of urban IS density variation from the urban center to the suburbs. The findings highlight that Guangzhou experienced expansive growth of a non-monocentric nature during a 32-year period of rapid development, especially in the transformation (2000–2010) and upgrading (2010–now) stages. Using the time-series normalized LST and CEEI in concentric rings, the LST and CEEI curves were modeled using linear and second-order polynomial functions, respectively. These curves depict the variation of LST and CEEI from the urban center to the suburbs. The LST gradually decreased, and the CEEI increased significantly. This indicates that the ecological quality in suburban areas was better than that in urban areas, and that the urban center area had a higher LST than the suburban area did.
To further analyze the effect of the changing spatiotemporal characteristics of urban growth on the urban heat environment and urban ecological quality, the urban IS density–LST, and urban IS density–CEEI relationships were modeled using different functions, including logarithmic, linear regression, and quadratic polynomial functions. The curves of these relationships were accurately fitted, and all the coefficients of determination were greater than 0.8. Generally, urban IS density had a substantial positive effect on LST and a negative effect on CEEI. This result suggests that an increase in urban IS density may enhance LST and reduce CEEI. In other words, a substantial increase in the IS area may increase the risk of an urban heat island effect and degradation of ecological quality.
This study can deepen the understanding of urban expansion and clarify the effect of urbanization on the urban heat environment and ecological quality evolution in Guangzhou from 1987 to 2019. However, this analysis was only based on the assumption of directional isotropy. This may introduce some errors. In the future, we can combine the standard deviational ellipse method into the inverse S-shaped function to depict the spatio-temporal change characteristics of urban expansion in various directions from the urban center to the suburbs.

Author Contributions

Conceptualization, Methodology, Investigation, Writing—Original draft, J.X.; Formal analysis, J.X., C.S., and J.Y.; Data preparation, Software, Validation, Y.Z. and H.L.; Visualization, J.X. and C.S.; Writing—Editing, C.S.; Result analysis, Supervision, data curation, J.Y.; Writing—Review and Editing, K.Z., Y.L., and X.L. All authors have read and agreed to the published version of the manuscript.

Funding

This research was jointly funded by the National Natural Science Foundation of China, grant number 41901371 and 41976189; the Key Special Project for Introduced Talents Team of Southern Marine Science and Engineering Guangdong Laboratory (Guangzhou), grant number GML2019ZD0301; the Guangdong Basic and Applied Basic Research Foundation, grant number 2020A1515010562; the Science and Technology Planning Project of Guangdong Province, grant number 2018B020207012 and 2018B020207002; the Guangdong Innovative and Entrepreneurial Research Team Program, grant number 2016ZT06D336; the GDAS’ Project of Science and Technology Development, grant number 2019GDASYL-0301001.

Institutional Review Board Statement

Not applicable.

Informed Consent Statement

Not applicable.

Data Availability Statement

The data presented in this study are available on request from the corresponding website.

Acknowledgments

The authors would like to thank the anonymous reviewers for their constructive comments. The authors acknowledge the USGS-NASA, due to freely accessible Landsat-5 TM and Landsat-8 data from 1987 to 2019.

Conflicts of Interest

The authors declare no conflict of interest.

Abbreviations

CEEIcomprehensive ecological evaluation index
GBAGuangdong–Hong Kong–Macau Greater Bay Area
ISimpervious surface
LSMland surface moisture
LSTland surface temperature
MLSMAmodified linear spectral mixture analysis
MNDWImodified normalized difference water index
NDBSInormalized difference built-up and soil index
NDSVInormalized difference senescent vegetative index
NDVInormalized difference vegetation index
NRInitrogen reflectance index
RSEIremote sensing-based ecological index
VCvegetative cover
VHIvegetative health index

References

  1. Fang, C. The urbanization and urban development in China after the reform and opening-up. Econ. Geogr. 2009, 29, 19–25. [Google Scholar]
  2. Xu, X.; Min, X. Quantifying spatiotemporal patterns of urban expansion in China using remote sensing data. Cities 2013, 35, 104–113. [Google Scholar] [CrossRef]
  3. Gong, J.; Hu, Z.; Chen, W.; Liu, Y.; Wang, J. Urban expansion dynamics and modes in metropolitan Guangzhou, China. Land Use Policy 2018, 72, 100–109. [Google Scholar] [CrossRef]
  4. Wu, J. Urban sustainability: An inevitable goal of landscape research. Landsc. Ecol. 2010, 25, 1–4. [Google Scholar] [CrossRef] [Green Version]
  5. Dorning, M.A.; Koch, J.; Shoemaker, D.A.; Meentemeyer, R.K. Simulating urbanization scenarios reveals tradeoffs between conservation planning strategies. Landsc. Urban Plan. 2015, 136, 28–39. [Google Scholar] [CrossRef] [Green Version]
  6. Xu, X.; Du, Z.; Zhang, H. Integrating the system dynamic and cellular automata models to predict land use and land cover change. Int. J. Appl. Earth Obs. Geoinf. 2016, 52, 568–579. [Google Scholar] [CrossRef]
  7. Brabec, E.; Schulte, S.; Richards, P.L. Impervious surfaces and water quality: A review of current literature and its implications for watershed planning. J. Plan. Literature 2002, 16, 499–514. [Google Scholar] [CrossRef]
  8. Yao, R.; Wang, L.; Huang, X.; Niu, Z.; Liu, F.; Wang, Q. Temporal trends of surface urban heat islands and associated determinants in major Chinese cities. Sci. Total Environ. 2017, 609, 742–754. [Google Scholar] [CrossRef] [PubMed]
  9. Guo, G.; Zhou, X.; Wu, Z.; Xiao, R.; Chen, Y. Characterizing the impact of urban morphology heterogeneity on land surface temperature in Guangzhou, China. Environ. Model. Softw. 2016, 84, 427–439. [Google Scholar] [CrossRef]
  10. Xu, G.; Jiao, L.; Zhao, S.; Yuan, M.; Li, X.; Han, Y.; Zhang, B.; Dong, T. Examining the impacts of land use on air quality from a spatio-temporal perspective in Wuhan, China. Atmosphere 2016, 7, 62. [Google Scholar] [CrossRef] [Green Version]
  11. Liu, F.; Zhang, Z.; Zhao, X.; Wang, X.; Zuo, L.; Wen, Q.; Yi, L.; Xu, J.; Hu, S.; Liu, B. Chinese cropland losses due to urban expansion in the past four decades. Sci. Total Environ. 2019, 650, 847–857. [Google Scholar] [CrossRef]
  12. Hang, J.; Sandberg, M.; Li, Y. Effect of urban morphology on wind condition in idealized city models. Atmos. Environ. 2009, 43, 869–878. [Google Scholar] [CrossRef]
  13. Meng, L.; Sun, Y.; Zhao, S. Comparing the spatial and temporal dynamics of urban expansion in Guangzhou and Shenzhen from 1975 to 2015: A case study of pioneer cities in China’s rapid urbanization. Land Use Policy 2020, 97, 104753. [Google Scholar] [CrossRef]
  14. Sun, Y.; Zhao, S. Spatiotemporal dynamics of urban expansion in 13 cities across the Jing-Jin-Ji Urban Agglomeration from 1978 to 2015. Ecol. Indic. 2018, 87, 302–313. [Google Scholar] [CrossRef]
  15. Li, J.; Deng, J.; Wang, K.; Li, J.; Huang, T.; Lin, Y.; Yu, H. Spatiotemporal patterns of urbanization in a developed region of eastern coastal China. Sustainability 2014, 6, 4042–4058. [Google Scholar] [CrossRef] [Green Version]
  16. Jiao, L. Urban land density function: A new method to characterize urban expansion. Landsc. Urban Plan. 2015, 139, 26–39. [Google Scholar] [CrossRef]
  17. Chen, Y.; Yu, S. Impacts of urban landscape patterns on urban thermal variations in Guangzhou, China. Int. J. Appl. Earth Obs. Geoinf. 2017, 54, 65–71. [Google Scholar] [CrossRef]
  18. Fei, W.; Zhao, S. Urban land expansion in China’s six megacities from 1978 to 2015. Sci. Total Environ. 2019, 664, 60–71. [Google Scholar] [CrossRef] [PubMed]
  19. Dewan, A.M.; Yamaguchi, Y. Using remote sensing and GIS to detect and monitor land use and land cover change in Dhaka Metropolitan of Bangladesh during 1960–2005. Environ. Monit. Assess. 2009, 150, 237–249. [Google Scholar] [CrossRef] [PubMed]
  20. Ma, Y.; Xu, R. Remote sensing monitoring and driving force analysis of urban expansion in Guangzhou City, China. Habitat Int. 2010, 34, 228–235. [Google Scholar] [CrossRef]
  21. Zhang, Z.; Wen, Q.; Liu, F.; Zhao, X.; Liu, B.; Xu, J.; Yi, L.; Hu, S.; Wang, X.; Zuo, L.; et al. Urban expansion in China and its effect on cultivated land before and after initiating “Reform and Open Policy”. Sci. China Earth Sci. 2016, 59, 1930–1945. [Google Scholar] [CrossRef]
  22. Wu, W.; Zhao, S.; Zhu, C.; Jiang, J. A comparative study of urban expansion in Beijing, Tianjin and Shijiazhuang over the past three decades. Landsc. Urban Plan. 2015, 134, 93–106. [Google Scholar] [CrossRef]
  23. Xu, G.; Jiao, L.; Liu, J.; Shi, Z.; Zeng, C.; Liu, Y. Understanding urban expansion combining macro patterns and micro dynamics in three Southeast Asian megacities. Sci. Total Environ. 2019, 660, 375–383. [Google Scholar] [CrossRef]
  24. Bonafoni, S.; Keeratikasikorn, C. Land surface temperature and urban density: Multiyear modeling and relationship analysis using MODIS and landsat data. Remote Sens. 2018, 10, 1471. [Google Scholar] [CrossRef] [Green Version]
  25. Hao, P.; Niu, Z.; Zhan, Y.; Wu, Y.; Wang, L.; Liu, Y. Spatiotemporal changes of urban impervious surface area and land surface temperature in Beijing from 1990 to 2014. GIScience Remote Sens. 2015, 53, 63–84. [Google Scholar] [CrossRef]
  26. Weng, Q.; Lu, D. A sub-pixel analysis of urbanization effect on land surface temperature and its interplay with impervious surface and vegetation coverage in Indianapolis, United States. Int. J. Appl. Earth Obs. Geoinf. 2008, 10, 68–83. [Google Scholar] [CrossRef]
  27. Zhang, L.; Weng, Q. Annual dynamics of impervious surface in the Pearl River Delta, China, from 1988 to 2013, using time series Landsat imagery. ISPRS J. Photogramm. Remote Sens. 2016, 113, 86–96. [Google Scholar] [CrossRef]
  28. Guo, J.; Han, G.; Xie, Y.; Cai, Z.; Zhao, Y. Exploring the relationships between urban spatial form factors and land surface temperature in mountainous area: A case study in Chongqing city, China. Sustain. Cities Soc. 2020, 61, 102286. [Google Scholar] [CrossRef]
  29. Wu, Z.; Yao, L.; Ren, Y. Characterizing the spatial heterogeneity and controlling factors of land surface temperature clusters: A case study in Beijing. Build. Environ. 2020, 169, 106598. [Google Scholar] [CrossRef]
  30. Xu, H.; Lin, D.; Tang, F. The impact of impervious surface development on land surface temperature in a subtropical city: Xiamen, China. Int. J. Climatol. 2013, 33, 1873–1883. [Google Scholar] [CrossRef]
  31. Xu, H. A remote sensing urban ecological index and its application. Acta Ecol. Sin. 2013, 33, 7853–7862. [Google Scholar]
  32. Xu, H.; Wang, M.; Shi, T.; Guan, H.; Fang, C.; Lin, Z. Prediction of ecological effects of potential population and impervious surface increases using a remote sensing based ecological index (RSEI). Ecol. Indic. 2018, 93, 730–740. [Google Scholar] [CrossRef]
  33. Yang, C.; Zhang, C.; Li, Q.; Liu, H.; Gao, W.; Shi, T.; Liu, X.; Wu, G. Rapid urbanization and policy variation greatly drive ecological quality evolution in Guangdong-Hong Kong-Macau Greater Bay Area of China: A remote sensing perspective. Ecol. Indic. 2020, 115, 106373. [Google Scholar] [CrossRef]
  34. Guan, X.; Wei, H.; Lu, S.; Dai, Q.; Su, H. Assessment on the urbanization strategy in China: Achievements, challenges and reflections. Habitat Int. 2018, 71, 97–109. [Google Scholar] [CrossRef]
  35. Xu, J.; Zhao, Y.; Zhong, K.; Zhang, F.; Liu, X.; Sun, C. Measuring spatio-temporal dynamics of impervious surface in Guangzhou, China, from 1988 to 2015, using time-series Landsat imagery. Sci. Total Environ. 2018, 627, 264–281. [Google Scholar] [CrossRef]
  36. Ma, Y.; Kuang, Y.; Huang, N. Coupling urbanization analyses for studying urban thermal environment and its interplay with biophysical parameters based on TM/ETM+ imagery. Int. J. Appl. Earth Obs. Geoinf. 2010, 12, 110–118. [Google Scholar] [CrossRef]
  37. Tu, L.; Qin, Z.; Li, W.; Geng, J.; Yang, L.; Zhao, S.; Zhan, W.; Wang, F. Surface urban heat island effect and its relationship with urban expansion in Nanjing, China. J. Appl. Remote Sens. 2016, 10, 26037. [Google Scholar] [CrossRef] [Green Version]
  38. Sun, Q.; Wu, Z.; Tan, J. The relationship between land surface temperature and land use/land cover in Guangzhou, China. Environ. Earth Sci. 2012, 65, 1687–1694. [Google Scholar] [CrossRef]
  39. USGS. Product Guide: Landsat 4–7 Surface Reflectancee (LEDAPS) Product, Version 4.0. Department of the Interior, U.S.; Geological Survey: Reston, VA, USA, 2017.
  40. USGS. Product Guide: Landsat 8 Surface Reflectance Code (LASRC) Product, Version 4.1. Department of the Interior, U.S.; Geological Survey: Reston, VA, USA, 2017.
  41. Zhang, Y.; Hu, Y.; Zhuang, D. A highly integrated, expansible, and comprehensive analytical framework for urban ecological land: A case study in Guangzhou, China. J. Clean. Product. 2020, 268, 122360. [Google Scholar] [CrossRef]
  42. Zhao, Y.; Xu, J.; Zhong, K.; Wang, Y.; Hu, H.; Wu, P. Impervious surface extraction by linear spectral mixture analysis with post-processing model. IEEE Access 2020, 8, 128476–128489. [Google Scholar] [CrossRef]
  43. Shen, H.; Huang, L.; Zhang, L.; Wu, P.; Zeng, C. Long-term and fine-scale satellite monitoring of the urban heat island effect by the fusion of multi-temporal and multi-sensor remote sensed data: A 26-year case study of the city of Wuhan in China. Remote Sens. Environ. 2016, 172, 109–125. [Google Scholar] [CrossRef]
  44. Valor, E.; Caselles, V. Mapping land surface emissivity from NDVI: Application to European, African, and South American areas. Remote Sens. Environ. 1996, 57, 167–184. [Google Scholar] [CrossRef]
  45. van de GRIEND, A.A.; OWE, M. On the relationship between thermal emissivity and the normalized difference vegetation index for natural surfaces. Int. J. Remote Sens. 1993, 14, 1119–1131. [Google Scholar] [CrossRef]
  46. Artis, D.A.; Carnahan, W.H. Survey of emissivity variability in thermography of urban areas. Remote Sens. Environ. 1982, 12, 313–329. [Google Scholar] [CrossRef]
  47. Bausch, W.C.; Duke, H.R. Remote sensing of plant nitrogen status in corn. Trans. ASAE 1996, 39, 1869–1875. [Google Scholar] [CrossRef]
  48. Qi, J.; Marsett, R.; Heilman, P.; Bieden-bender, S.; Moran, S.; Goodrich, D.; Weltz, M. RANGES improves satellite-based information and land cover assessments in southwest United States. Eos Trans. AGU 2002, 83, 601. [Google Scholar] [CrossRef]
  49. Xu, H. A new index for delineating built-up land features in satellite imagery. Int. J. Remote Sens. 2008, 29, 4269–4276. [Google Scholar] [CrossRef]
  50. Hu, X.; Xu, H. A new remote sensing index for assessing the spatial heterogeneity in urban ecological quality: A case from Fuzhou City, China. Ecol. Indic. 2018, 89, 11–21. [Google Scholar] [CrossRef]
  51. Cui, X.; Li, S.; Wang, X.; Xue, X. Driving factors of urban land growth in Guangzhou and its implications for sustainable development. Front. Earth Sci. 2019, 13, 464–477. [Google Scholar] [CrossRef]
  52. Bonafoni, S.; Baldinelli, G.; Verducci, P. Sustainable strategies for smart cities: Analysis of the town development effect on surface urban heat island through remote sensing methodologies. Sustain. Cities Soc. 2017, 29, 211–218. [Google Scholar] [CrossRef]
  53. He, H. Evaluation of Urban Ecosystem Niche-Fitness in the Pearl River Delta Region; Guangzhou Institute of Geochemistry; Chinese Academy of Science: Guangzhou, China, 2007. [Google Scholar]
  54. Shih, W.-Y.; Ahmad, S.; Chen, Y.-C.; Lin, T.-P.; Mabon, L. Spatial relationship between land development pattern and intra-urban thermal variations in Taipei. Sustain. Cities Soc. 2020, 62, 102415. [Google Scholar] [CrossRef] [PubMed]
  55. Li, B.; Wang, W.; Bai, L.; Chen, N. Effects of spatio-temporal landscape patterns on land surface temperature: A case study of Xi’an city, China. Environ. Monit. Assess. 2018, 190, 419. [Google Scholar] [CrossRef] [PubMed]
  56. Sun, R.; Chen, A.; Chen, L.; Lü, Y. Cooling effects of wetlands in an urban region: The case of Beijing. Ecol. Indica. 2012, 20, 57–64. [Google Scholar] [CrossRef]
Figure 1. Study area: (a) Guangdong–Hong Kong–Macao Greater Bay Area (GBA), (b) Guangzhou city, and (c) the city center and the rings in Guangzhou.
Remotesensing 13 01019 g001
Figure 2. The time-series impervious surface (IS) fraction in (a) 1987, (b) 1999, (c) 2009, and (d) 2019.
Remotesensing 13 01019 g002
Figure 3. The urban IS densities in concentric rings with the distance to the urban center in 1987, 1999, 2009, and 2019.
Remotesensing 13 01019 g003
Figure 4. Fitting of the urban ISF density data with the inverse S-shape function in (a) 1987, (b) 1999, (c) 2009, and (d) 2019.
Remotesensing 13 01019 g004
Figure 5. The normalized land surface temperature in concentric rings with the distance to the urban center in 1987, 1999, 2009, and 2019.
Remotesensing 13 01019 g005
Figure 6. The fitting curve of normalized land surface temperature as a function of the urban center distance in (a) 1987, (b) 1999, (c) 2009, and (d) 2019.
Remotesensing 13 01019 g006
Figure 7. The comprehensive ecological evaluation index (CEEI) in concentric rings with the distance to the urban center in 1987, 1999, 2009, and 2019.
Remotesensing 13 01019 g007
Figure 8. The fitting curve of CEEI as a function of the urban center distance in (a) 1987, (b) 1999, (c) 2009, and (d) 2019.
Remotesensing 13 01019 g008
Figure 9. The regression models between urban IS densities versus normalized LST in each concentric ring in (a) 1987, (b) 1999, (c) 2009, and (d) 2019.
Remotesensing 13 01019 g009
Figure 10. The regression models between urban IS densities versus CEEI in each concentric ring in (a) 1987, (b) 1999, (c) 2009, and (d) 2019.
Remotesensing 13 01019 g010
Table 1. The remote sensing data used in this study.
SensorDate
Landsat-5 TM1987-12-08
Landsat-5 TM1999-12-09
Landsat-5 TM2009-12-02
Landsat-8 OLI/TIRS2019-11-14
Table 2. The fitting functions of IS densities, land surface temperature (LST), and comprehensive ecological evaluation index (CEEI) in 1987, 1999, 2009, and 2019.
YearFitting FunctionAdj.R2
IS densities1987 f r = 0.951 / 1 + e 1.066 2 r / 4.629 1 + 0.049 0.901
1999 f r = 0.958 / 1 + e 1.145 2 r / 13.559 1 + 0.042 0.953
2009 f r = 0.982 / 1 + e 0.858 2 r / 21.778 1 + 0.018 0.965
2019 f r = 0.995 / 1 + e 1.096 2 r / 39.593 1 + 0.005 0.962
LST1987 f r = 0.002 r + 0.530 0.727
1999 f r = 0.9263 E 4 r + 0.317 0.875
2009 f r = 0.002 r + 0.648 0.909
2019 f r = 0.003 r + 0.449 0.934
CEEI1987 f r = 0.773 r / 1.554 + r 0.487
1999 f r = 0.918 r / 5.758 + r 0.949
2009 f r = 0.353 + 0.012 r 6.559 E 5 r 2 0.956
2019 f r = 0.235 + 0.012 r 6.204 E 5 r 2 0.963
Table 3. The values of ks and kp of Guangzhou city in 1987, 1999, 2009, and 2019.
1987199920092019
ks0.0960.0350.0170.012
kp1.2351.1501.5351.202
Publisher’s Note: MDPI stays neutral with regard to jurisdictional claims in published maps and institutional affiliations.

