Article

The Decrease in Lake Numbers and Areas in Central Asia Investigated Using a Landsat-Derived Water Dataset

1
Research Center of Government Geographic Information System, Chinese Academy of Surveying & Mapping, Beijing 100830, China
2
National Tibetan Plateau Data Center, Key Laboratory of Tibetan Environmental Changes and Land Surface Processes, Institute of Tibetan Plateau Research, Chinese Academy of Sciences, Beijing 100101, China
3
CAS Center for Excellence in Tibetan Plateau Earth Sciences, Chinese Academy of Sciences, Beijing 100101, China
4
University of Chinese Academy Sciences, Beijing 100049, China
5
TerraPulse, Inc., North Potomac, MD 20878, USA
6
State Key Laboratory of Severe weather (LASW), Chinese Academy of Meteorological Sciences, Beijing 100081, China
*
Author to whom correspondence should be addressed.
Submission received: 23 January 2021 / Revised: 3 March 2021 / Accepted: 3 March 2021 / Published: 9 March 2021

Abstract

:
Although Central Asia has a strong continental climate with a constant moisture deficit and low relative humidity, it is covered by thousands of lakes that are critical to the sustainability of ecosystems and human welfare in the region. Vulnerability to climate change and anthropogenic activities have contributed to dramatic inter-annual and seasonal changes of the lakes. In this study, we explored the high spatio–temporal dynamics of the lakes of Central Asia using the terraPulse™ monthly Landsat-derived surface water extent dataset from 2000 to 2015 and the HydroLAKES dataset. The results identified 9493 lakes and significant linear decreasing trends were identified for both the number (rate: −85 lakes/year, R2: 0.69) and area (rate: −1314.1 km2/year, R2: 0.84) of the lakes in Central Asia between 2000 and 2015. The decrease rate in lake area accounted for 1.41% of the total lake area. About 75% of the investigated lakes (7142 lakes), mainly located in the Kazakh steppe (especially in the north) and the Badghyz and Karabil semi-desert terrestrial ecological zones, experienced a decrease in the water area. Lakes with increasing water area were mainly distributed in the Northern Tibetan Plateau–Kunlun Mountains alpine desert and Qaidam Basin semi-desert zones in the east-south corner of Central Asia. The possible driving factors of lake decreases in Central Asia were explored for the Aral Sea and Tengiz Lake on yearly and monthly time scales. The Aral Sea showed the greatest decrease in the summer months because of increased evaporation and massive irrigation, while the largest decrease for Tengiz Lake was observed in early spring and was linked to decreasing snowmelt.

Graphical Abstract

1. Introduction

The distribution of water bodies and their quality are critical for the sustainability of life on Earth. Although inland surface water bodies such as lakes, reservoirs, and rivers only cover approximately 3% of the global land, they constitute essential terrestrial ecosystems, and play a crucial role in the global hydrological cycle, e.g., for water supply, agricultural production, and hydropower generation, especially in arid and semi-arid regions [1,2]. Many water bodies have experienced ecological, morphological, and areal changes in the past decades, which were driven by climate change and human activities [3,4,5]. Central Asia is located far inside the Eurasian continent, and 75% of the region is arid or semiarid with a continental climate. While Central Asia is one of the world’s eight semi-arid regions, it includes thousands of lakes, which are critical to the sustainability of the ecosystems and human welfare in the region. However, the water bodies in Central Asia can experience dramatic seasonal as well as permanent changes due to the vulnerability of the region to climate change and anthropogenic activities. Therefore, a consistent spatiotemporal record of water extents with fine-scale spatial and temporal resolutions is needed to investigate the changes of lacustrine surface waters in Central Asia. A fine spatial resolution is needed to accurately represent the large number of small water bodies in the region, and the fine temporal resolution is important for distinguishing seasonal changes from permanent inter-annual changes [6]. Anthropogenic activities, e.g., intensive agriculture, irrigation, and hydropower generation, can disrupt the fragile equilibrium between water supply and use and lead to changes in water bodies [7,8,9]. Numerous reservoirs have been built in Central Asia, especially in Kazakhstan, which has over 200 water reservoirs [10]. Water reservoirs show high seasonality in their areal extent, which is at its maximum before the start of the growing season and minimum after the growing season [11]. Considering this variability in water availability, a seasonal surface water dataset with high spatial resolution for Central Asia can support a detailed analysis of the changes in lakes, which is crucial for sustainable water resources management and land and water ecosystem balance in Central Asia.
Satellite-based remote sensing observes the Earth with short revisit times, providing an unprecedented ability to detect the distribution of water and monitor its changes in large areas. The images acquired by coarse-resolution satellite sensors, e.g., the Advanced Very-High-Resolution Radiometer (AVHRR), Moderate Resolution Moderate Resolution Imaging Spectroradiometer (MODIS), and Visible Infrared Imaging Radiometer Suite (VIIRS)), have been widely used to detect the changes of large water bodies because of their high-frequency observations (1–2 days) but coarse spatial resolutions (>100 m) [12,13,14,15]. In the past decade, with the advances in increasingly affordable computation [16], automated atmospheric correction [17] and cloud detection algorithms [18], moderate-resolution satellite data, e.g., Landsat and Sentinel-2, have been used to map the distribution as well as the dynamic extent of water for a larger range of water bodies, including those as small as 0.01 km2 [19,20]. These efforts allowed depiction of the inter-annual changes of water extents. However, to monitor their seasonal variation is challenging due to the poor temporal resolution of the moderate resolution satellite data and the strong influence of atmospheric conditions. The global surface water (GSW) explorer [21] estimated the occurrence, change, seasonality, and transition of inland surface water. The developers of this dataset assessed the accuracy of the water maps at the pixel scale (i.e., 30 m) using a total of 40,124 control points distributed both geographically (globally), temporally (across the 32 year). Overall, errors of commission were less than 1% and omission less than 5% [22]. François Soulard tested GSW for Canada and reported the analysis from GSW alone is limited in answering questions related to real change in freshwater ecosystems, and should be considered alongside other important datasets when analyzing the data [23]. Its accuracy in delineating seasonal water changes was limited because it utilized an insufficient number of valid Landsat observations and the gaps in the time window could lead to a bias in seasonal estimates [24]. Seasonal water occurrences for different years were likely estimated from different dates; thus, the seasonal water estimates are incomparable. Uncertainties in seasonal water variation estimates could also jeopardize estimating inter-annual water changes. Estimates of seasonal water occurrence provide comprehensive representations of water dynamics for both intra- and inter-annual scales [25]. Up to now, the attempts at fine temporal resolution (e.g., monthly) monitoring of water using moderate resolution satellite data have mainly focused on countries (e.g., France) [26] or specific lakes (e.g., Poyang Lake) [27,28,29].
The water dynamics in Central Asia have been previously investigated for two given time periods or uneven multi-temporal intervals using Landsat data, and mainly focused on individual large lakes (e.g., Aral Sea, Ulan Ula, Balkhash, and Issyk-Kul) to assess the impact of global warming on the water bodies in the region [7,30,31,32]. The long-term (1986–2012) monthly surface water dynamics in Central Asia were analyzed with MODIS data by Klein et al. [11] and showed diverse patterns of water bodies in Central Asia. Moreover, changes in the area of 14 lakes in Central Asia from 2001 to 2016 were analyzed using three months of data from the MODIS 500-m spatial resolution global water product and found that plains lakes showed a declining trend while alpine lakes showed an increasing trend [33]. However, the coarse spatial resolution of MODIS data does not allow resolution of the large number of small lakes that cover northern Central Asia. Che et al. [24] utilized 16 years of data from the United States Geological Survey Landsat archive to detect and map surface water over Central Asia from 2000 to 2015 at 90 m and monthly resolution upon which this study produced a first monthly water extent distribution of lakes for Central Asia. In this study, we analyzed the number, area, and spatio–temporal dynamics of the lakes of Central Asia from 2000 to 2015. Finally, two typical lakes (the rapidly changing Aral Sea and Tengiz Lake surrounded by many small water bodies) were investigated to explore the driving factors of the changes in the lakes of Central Asia.

2. Study Area and Data

2.1. Central Asia

Central Asia is located at the very heart of the Eurasian continent with an area of 4,862,082.62 km2, including Kazakhstan, Kyrgyzstan, Tajikistan, Turkmenistan, Uzbekistan (with the exclusion of the Caspian Basin), as well as Xinjiang Province in northwest China (Figure 1). Central Asia has a distinctive continental climate with cold winters and hot summers, with temperature, precipitation, and elevation showing a marked increasing trend from north to south [34]. Central Asia is flat in the northwest and has high mountain ranges such as Tian Shan in the south-east and Altay Mountains in the east. Major land cover types on the plains are temperate grassland, shrublands, deserts, and xeric shrublands. The mountainous regions are dominated by montane grasslands, shrublands, and temperate coniferous shrublands in the south [35]. There are numerous natural lakes and man-made reservoirs scattered in Central Asia. Kazakhstan has over 3000 natural lakes larger than 1 km2 and over 200 reservoirs [10].
We selected the Aral Sea, which is rapidly changing, and Tengiz Lake, which is surrounded by many small water bodies, to explore in detail the dynamics at yearly and monthly time scales (Figure 1). The Aral Sea lies between Kazakhstan and Uzbekistan. It was once the world’s fourth-largest lake but began shrinking in the 1960s. During 1987–1988, the Aral Sea split into two separate water bodies, the North Aral Sea and the South Aral Sea [36], fed by Syr Darya and the Amu Darya, respectively [28]. Tengiz Lake is the largest lake in northern Kazakhstan and is surrounded by many small water bodies in the east. Located in a sparsely inhabited dry steppe and semidesert, Tengiz Lake is fed by the Nura and Kulanutpes rivers with a maximum depth of more than 6 m; its level is subject to sharp fluctuations. The shore is mostly low lying and clayey, and along the jagged eastern shore are several islands. The Tengiz Lake is the northernmost habitat of the pink flamingo, and its brine is rich in the mineral mirabilite.

2.2. Data

2.2.1. Monthly Landsat -Derived Surface Water Dataset

We used the monthly (April to October) Landsat-derived surface water data with 90-m spatial resolution defined in the sinusoidal projection from 2000 to 2015 that were derived and validated in [24]. The surface water was identified in each Landsat image using the algorithm developed by [1]. The algorithm automatically identifies water cover pixels in each Landsat image by building a locally optimized decision tree model for each Landsat image using possible water pixel samples. These samples are examined with multispectral water and topographic indices (e.g., Normalized-Difference Water index (NDWI) and Modified Normalized-Difference Water index (MNDWI)) derived from the image as well as a reference water layer (e.g., the MODIS water mask dataset). The decision tree model is then applied to each Landsat image to identify water. A detailed description of the algorithm can be found in [1].
Due to the 16-day revisit cycle of the Landsat sensors and contaminations of clouds, cloud shadows, haze, and ice and snow, valid observations for a specific month can be sparse or non-existent. About 17% of observations in the region (estimated by a WRS-2 pathrow, i.e., p152r028 located at the center of study area) are likely to be invalid due to cloud, shadow, or other quality issues. Irregular annual time-series of directly-observed water records were linearly interpolated to daily frequency and then aggregated to monthly surface water estimates in Central Asia [24].

2.2.2. HydroLAKES Dataset

The HydroLAKES dataset was used as a reference for identifying lakes and reservoirs. The dataset distinguishes 11,164 natural lakes and man-made reservoirs with a surface area of at least 0.1 km2 in vector format with Universal horizontal Mercator projection [37]. The HydroLAKES dataset was created by compiling, correcting and unifying several near-global and regional data sets, foremost the Shuttle Radar Topographic Mission Water Body Data for regions from 56° S to 60° N [38] (Table 1). The main processing steps in the creation of the HydroLAKES dataset included vectorization of raster data, manual identification and removal of river and wetland polygons, removal of duplicates and overlapping polygons, dissolving of segmented polygons into individual lake entities, correction of corrupt or incorrect polygon geometry, removal of small islands within lakes, smoothing of water body shorelines to reduce inconsistencies between data sets of different initial resolutions, and establishing a 0.03-km2 cut-off based on lake surface area. Numerous studies had utilized this dataset to select lakes and reservoirs of analysis and to determine their geographical extent [39,40,41,42], but the evaluation of this dataset and its uncertainties is rare. However, the developer of this dataset compared this dataset with four global estimates of lakes and lake area from Verpoorter et al. [43], Downing et al. [44], Lehner and Döll [45] and Lerman [46]. Estimations of HydroLAKES generally exceed older estimates [43,45,46] indicating the comprehensiveness of HydroLAKES. At the same time, this dataset has stayed below some higher estimates of the past decade [44,47] due to its enhanced ability for differentiating natural lakes from reservoirs, manual corrections to detect and remove fluvial features, as well as variations in the statistical extrapolation of smaller lakes. A more detailed description of the production steps is provided in the technical documentation [48].

3. Method

3.1. Identifying Lakes

To analyze the changes of each lake, the isolated surface water bodies were assigned a unique label to identify the surface water extent of each individual lake entity using the HydroLAKES dataset. Any misclassified surface water bodies were removed by referring to the locations of the lakes in the HydroLAKES dataset. Furthermore, the labelling procedure of the lakes guaranteed that surface waters that were separated onto different Landsat tiles but that were part of the same water body were taken as one lake.
The HydroLAKES dataset was first re-projected to the sinusoidal projection and resampled to 90-m pixel size, thus guaranteeing that HydroLAKES was comparable to the Landsat surface water data pixel by pixel. All pixels within the extent of a lake from the rasterized HydroLAKES were taken as the initial lake pixels pool with the same label. Subsequently, one centered water pixel was extracted from the lake pixels pool and an iteration process started. If this pixel was non-water on the monthly Landsat-derived water bodies, the next water target pixel was taken out from the lake pixels pool. Conversely, if this pixel was detected as water and had no label in the Landsat surface water bodies, it was given the label of the lake pixels pool on the Landsat-derived water bodies. Following this, we identified water pixels without labels within the window size of 3×3 pixels centered on the labeled water pixel and stacked them into this lake pool. The iteration continued by extracting a pixel from the lake pool and stopped when the lake pool was emptied. Finally, all pixels within this lake had the same label on the Landsat-derived water bodies. Nevertheless, the small lakes were likely connected to the adjacent large lakes due to water dynamics. Lake labelling started with the large lake pool to guarantee that the connected small lakes had the same label as the corresponding connected large lake and were treated as one lake. The iterative processing is depicted in Figure 2.

3.2. Lakes Change Analysis

A power-law equation was used to model the size-abundance distribution of the lakes over Central Asia (Equation (1)) by categorizing lakes into eight size groups with breaking at 0.01, 0.05, 0.1, 0.5, 1, 10, 100, 1000:
N = α × A β
where N is the density of lakes > A. A is the lake surface area in km2, which can be 0.01, 0.05, 0.1, 0.5, 1.0, 10, 100, 1000. α is a constant, β is the exponent parameter indicating the logarithmic rate of decline of the number of lakes as a function of increasing lake area.
In the meanwhile, a terrestrial ecological zoning map [36] was overlayed on Central Asia to explore the number and area patterns of lakes in each zone. Central Asia was divided into seven terrestrial ecological zones by merging the adjacent zone with similar biological types (Figure 4). Since each zone had different land areas, the quantity and area density of the lakes were calculated by dividing the corresponding zone areas to make the distribution pattern comparable.
To analyze change trends, this study adopted a simple linear regression model to calculate the change of lake area and their number (Equations. (2) and (3)):
A r e a = S l o p e a T + b a
N u m = S l o p e n T + b n
where T represents the year (from 2000 to 2015); A r e a is the area of lakes at the time of T . S l o p e a represents the yearly or monthly variation of lakes’ area. N u m is the number of lakes at T i m e . S l o p e n represents the yearly or monthly variation of the number of lakes.
Ordinary least squares (OLS) linear regression was conducted to estimate   S l o p e and b . The goodness of fit of the OLS was defined by the coefficient of determination (R2) between the fitted and observed area or number. The significance of the OLS regressions was defined by examination of the regression overall t-statistic p-value [49]. A p-value of less than 0.05 indicates a significant linear trend in the lake change. The larger the lake area is, the higher the variation magnitude the lake has. To compare the changes of lakes with different sizes, the variation magnitude was normalized with the average lake area or number during the period of 16 years as change rate (Equation. (4)):
R a t e =   S l o p e / A v e r a g e 100 % )
where S l o p e is the variation magnitude of lake area or number from Equations (2) and (3). A v e r a g e is the average lake area and quantity during the 16-year time period. The fluctuation in area or number of lakes is defined as:
F l u c t u a t i o n x = S T D x / A v e r a g e x
where x is the time series of the area or number of lakes during a period. S T D is the standard deviation of x , and A v e r a g e is the average of x . F l u c t u a t i o n x indicates the fluctuation of the lakes during the period.
The frequency with which water was present on the surface of a lake from 2000 to 2015 was calculated and called water occurrence to display the temporal–spatial change distribution, which is the ratio between the water detections and the sum of water and non-water detections:
water   occurrence = w a t e r / w a t e r + l a n d

4. Results

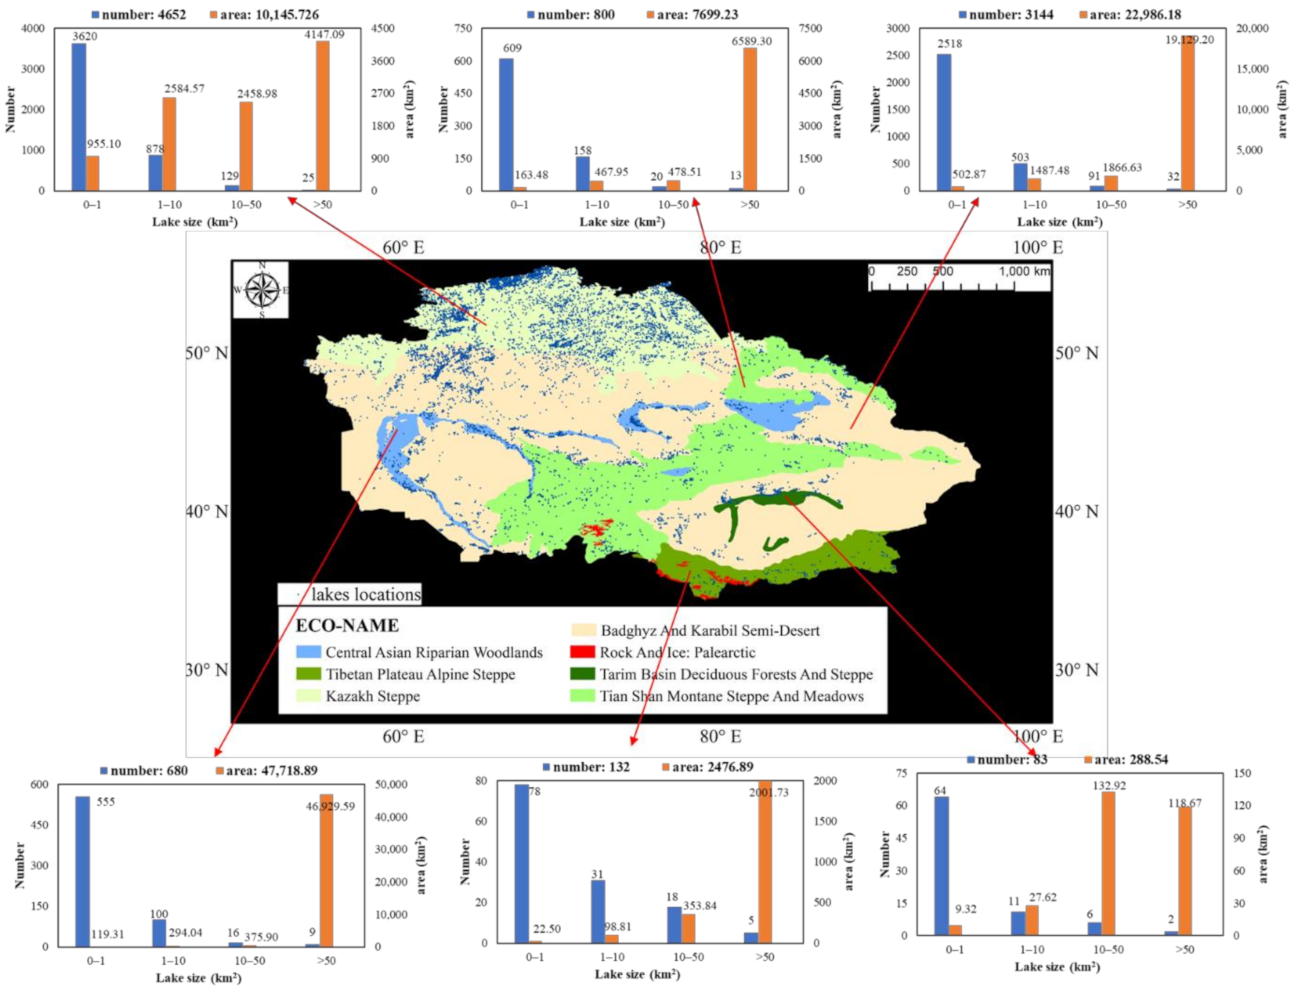
4.1. Number and Area of Lakes in Central Asia

A total of 9493 lakes were identified between 2000 and 2015, including permanent and intermittent lakes. The density of these lakes in Central Asia was 1.95 per 1000 km2 (Figure 4 and Table 2). The number of lakes decreased with the increase in lake size (Figure 3b). Out of these lakes, 7445 lakes, or 78.43% of the total, were smaller than 1 km2; only 16 lakes, 0.17% of the total, were larger than 500 km2. Lake size distribution for Central Asia followed a power law with the exponent parameter of −0.602 (Figure 3b).
Within seven terrestrial ecological zones [35] (Figure 4), nearly half of the total identified lakes (4652 lakes, 49% of the total) were located in the Kazakh steppe zone, and the lake density was also the highest (6.1/1000 km2). Although the Badghyz and Karabil semi-desert zone ranked second in the number of lakes, with 3144 lakes, its lake density was only 1.22/1000 km2. In contrast, the Central Asian riparian wetland zone had the second largest lake density of 3.16/1000 km2 with 680 lakes. Although the Tarim Basin Deciduous Forest and Steppe zone had the smallest number of lakes (83), its lake density was not the smallest with 1.52 /1000 km2. The rock and ice zone only included two lakes (Figure 4 and Table 2).
On average, the lakes covered an area of 91,317.94 km2 between 2000 and 2015 in Central Asia. Of this area, 47,718.84 km2, 52.25% of total surface water area, was distributed at the Central Asian riparian wetland zone with a lake area density of 221.96 km2/1000 km2, which was followed by Badghyz and Karabil semi-desert zone with a lake area of 22,986.17 km2 (25.17%). In contrast, its area density was only 8.95 km2/1000 km2. Although most lakes were located in the Kazakh steppe zone, the water covered area was 10,145.72 km2 with an area density of 13.31 km2/1000 km2. The rock and ice zone had the smallest area and density of lakes (Figure 4 and Table 2).

4.2. Number and Area Change of the Lakes in Central Asia

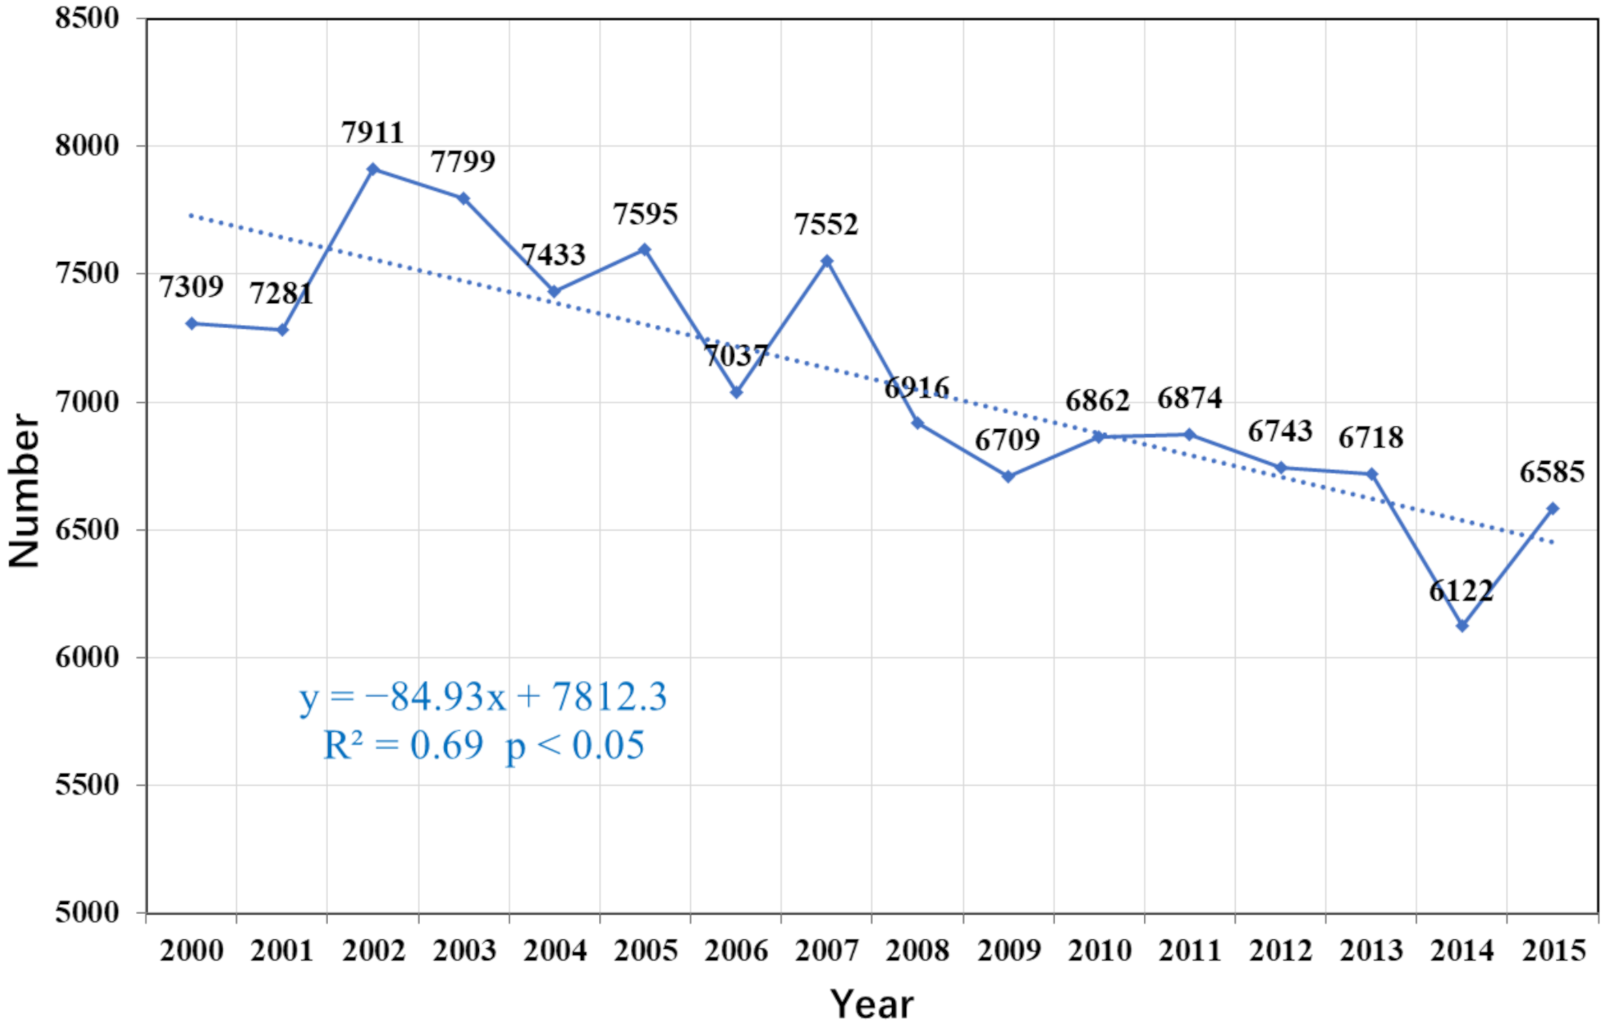
4.2.1. Change in Number of Lakes

The number of lakes in Central Asia had a strong linearly decreasing trend with an R2 of 0.69. There were 7309 lakes identified in Central Asia in 2000, which decreased to 6585 in 2015, with an average decline of 85 lakes per year (Figure 5). The decrease was found in every lake size category during the 16 years (Table 3), but the greatest decrease was in the 1–10 km2 category (decrease rate of 1.90%), followed by the 10–50 km2 category (1.32%). The 50–100 km2 category was the most stable with a decrease rate of only 0.02%.

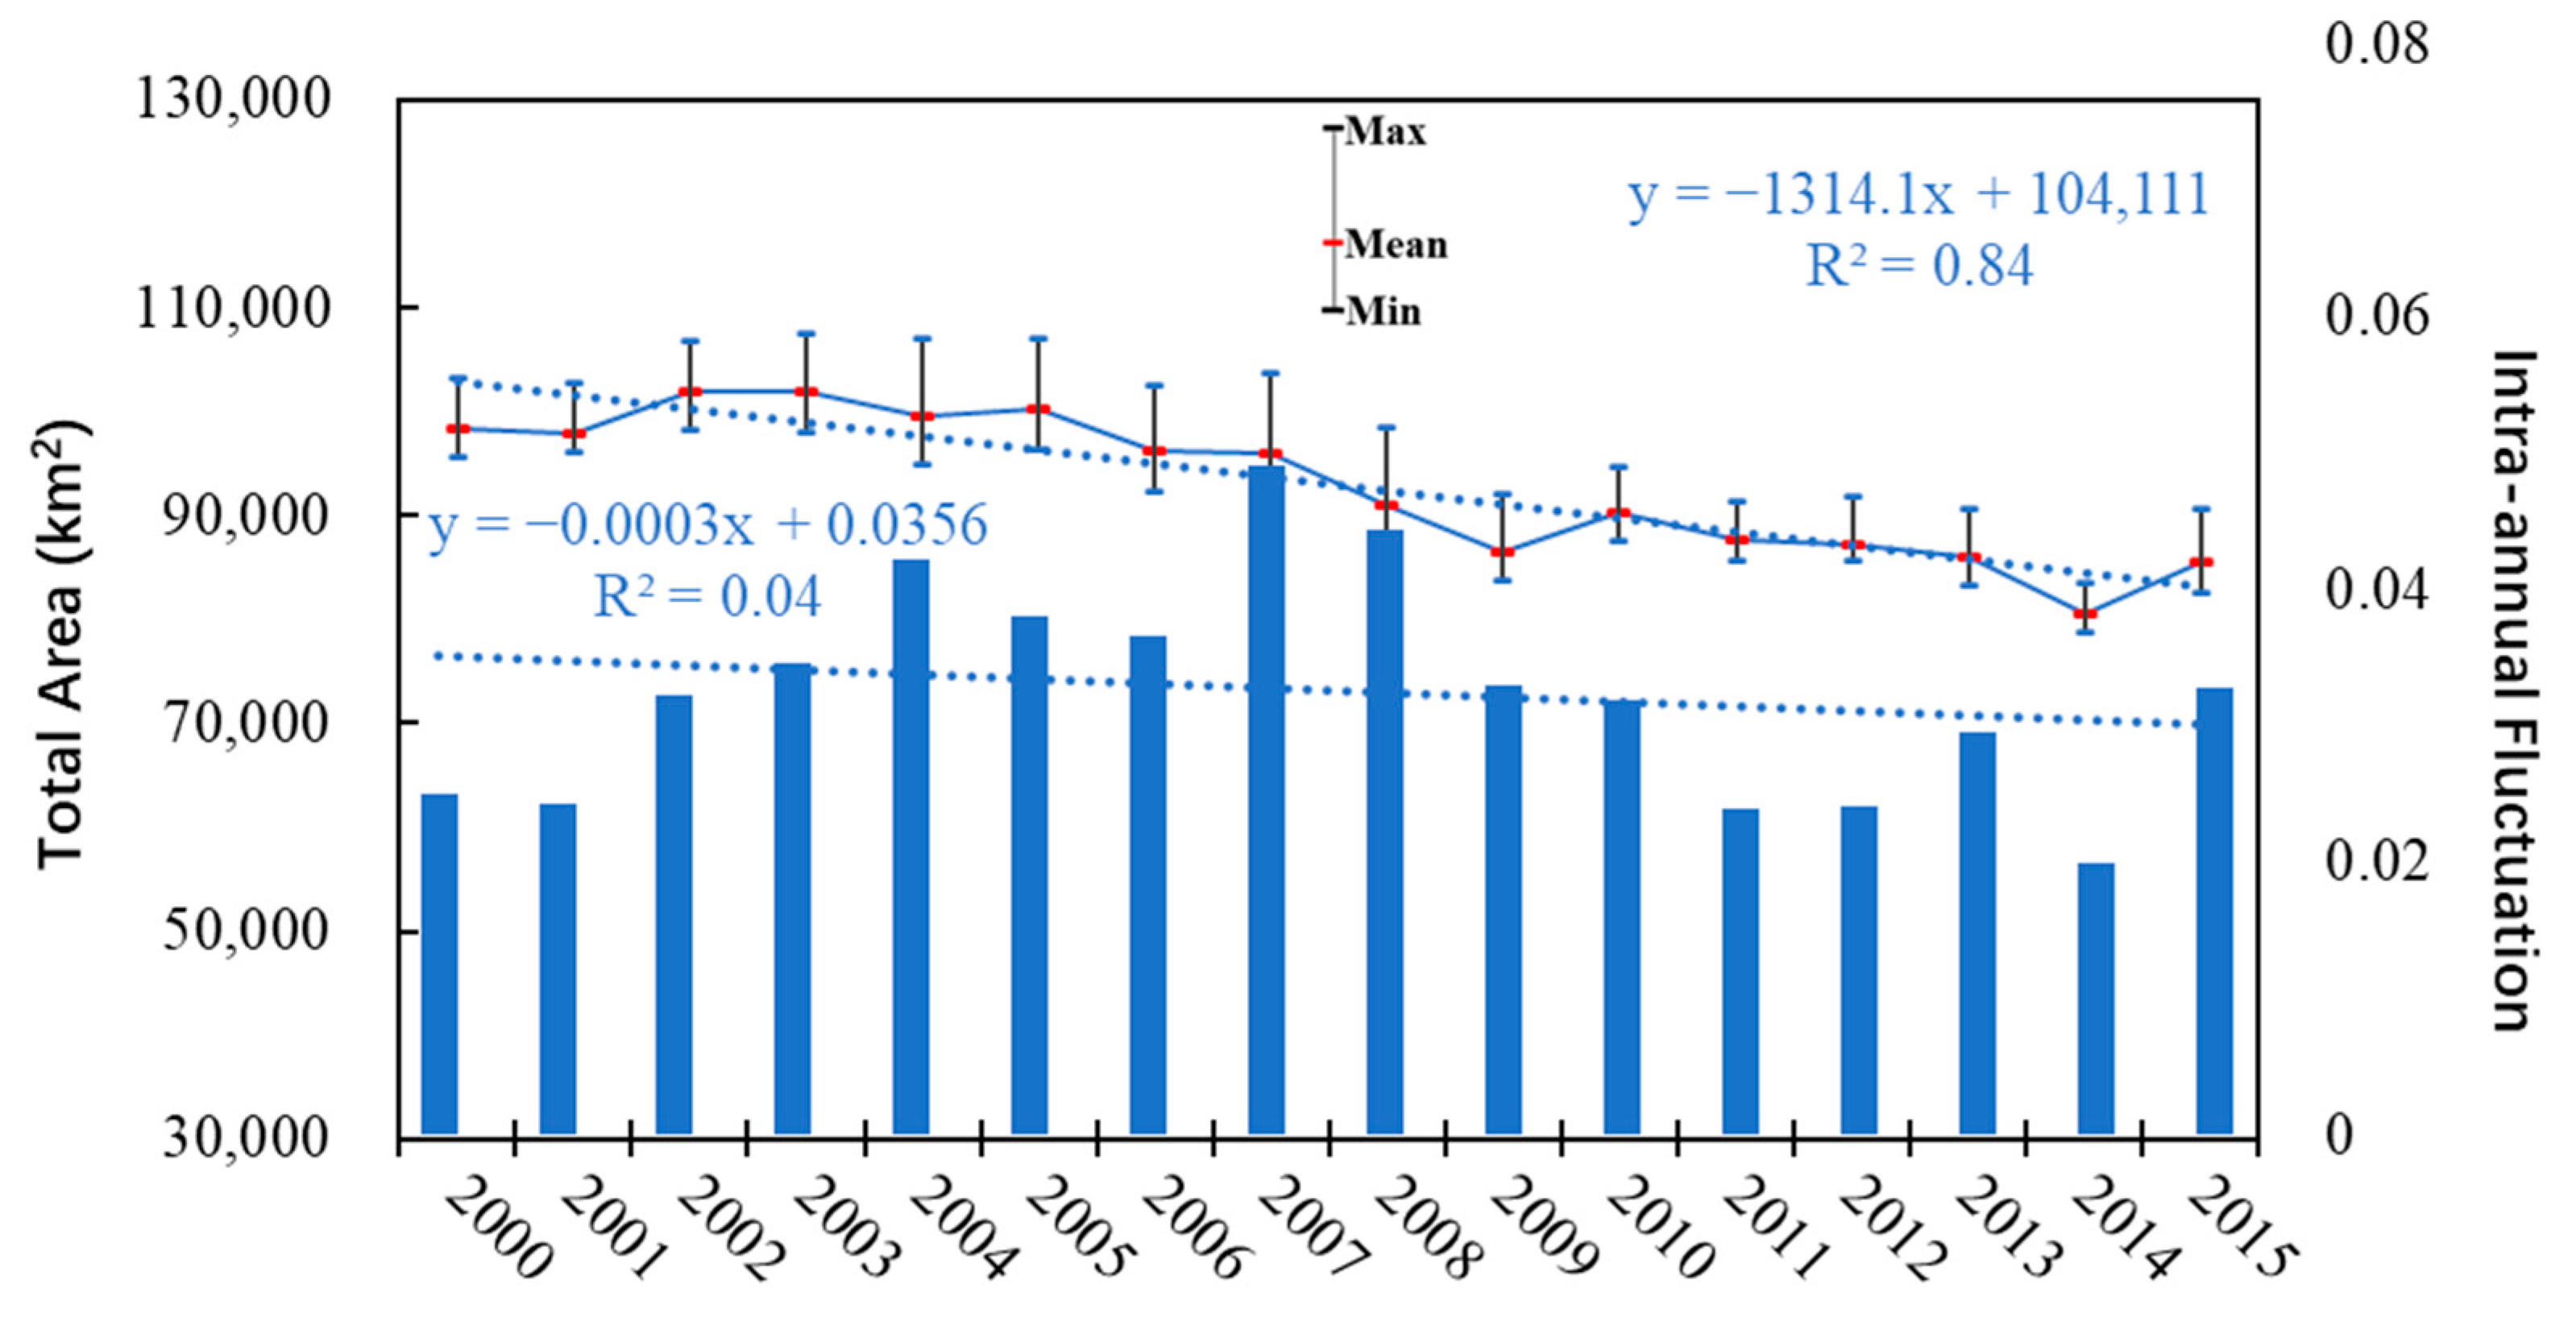
4.2.2. Area Change of Lakes

The yearly area change of lakes is linear during the 16-year period analyzed for Central Asia with R2 of 0.84 (Figure 6). There were 98,364.61 km2 covered by lakes in 2000, which decreased to 82,455.32 km2 in 2015, with an average decline of −1314.10 km2 per year. The intra-annual fluctuations were higher than 2% for every year, suggesting significant seasonal water extent variation in the region. However, there was no strong linear decreasing trend for intra-annual fluctuations with R2 of 0.04, and this demonstrated the yearly change of lakes was not closely related to the seasonal change in Central Asia.
The area change of lakes with different sizes is tabulated in Table 4, showing that all categories of lake areas had a strong decreasing trend, except for medium lakes between 50 and 500 km2, which had a relatively stable area. Large lakes (>500 km2) had the strongest linear decrease, with a slope of 1048.99 km2 per year and R2 of 0.91, which was followed by small lakes (<10 km2). Lakes between 1 and 10 km2 changed more with a rate of −1.66% than lakes >500 km2, which illustrated the large lakes do not necessarily change faster than small ones.

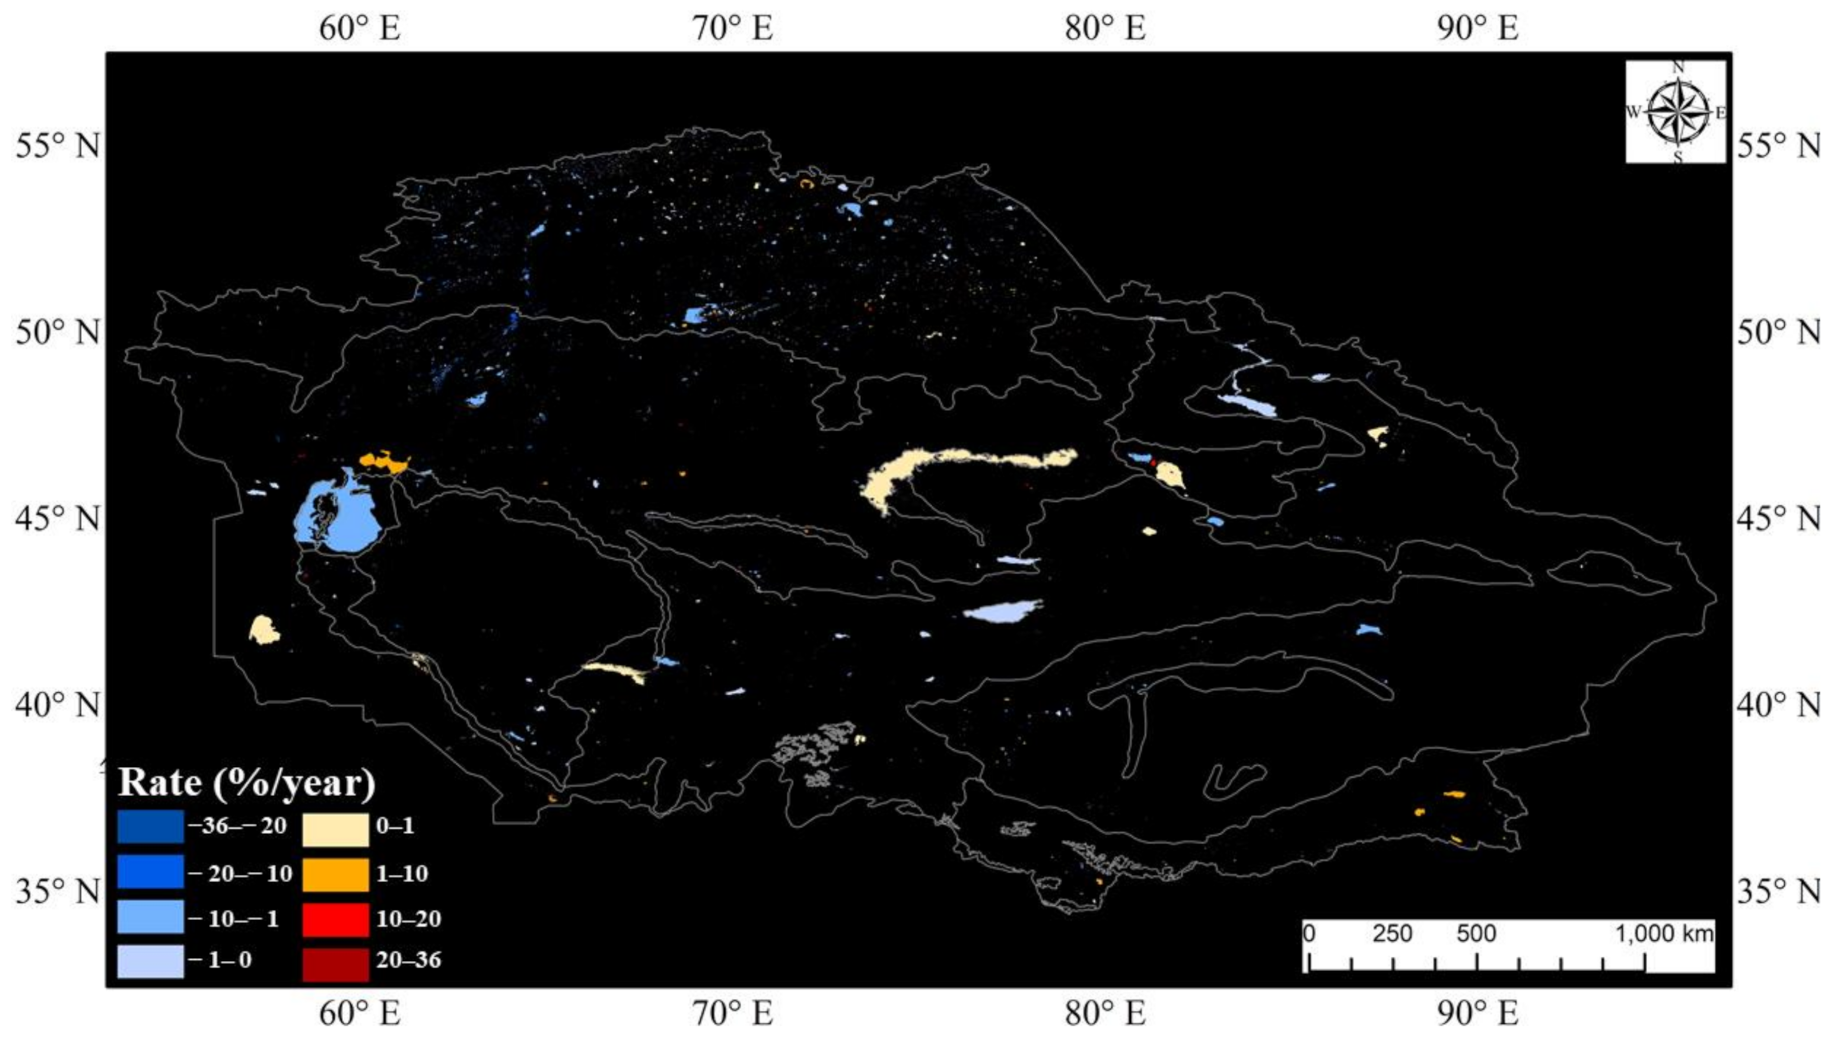
4.2.3. Spatio–Temporal Change of Lakes

Out of a total of 9494 lakes, 7142 lakes, i.e., 75.23%, were found to be shrinking between 2000 and 2015 (Table 5). Shrinking lakes were mainly distributed in the Kazakh steppe (especially in the north) zone and the Badghyz and Karabil semi-desert zones with 3730 and 2357, respectively (Figure 7 and Figure 4). Shrinking trends were found for most lakes (>50%) in each terrestrial ecological zone, except in the Central Tibetan Plateau alpine steppe zone, where 43 lakes (39.81%) shrunk during the 16-years study period. Among a total of 7142 shrinking lakes, 3872 lakes (54.21%) had a yearly change rate of −10–−1%, followed by 1540 lakes with a change rate of −20–−10%. A dramatic shrinking was found for 627 lakes, which experienced a yearly change rate of −36–−20% (Table 5).
At the same time, 2351 lakes were found to have expanded between 2000 and 2015. Although the expanding lakes were also primarily located in the Kazakh steppe (922) and Badghyz and Karabil semi-desert zones (787), similarly to the the shrinking lakes, they represented only a small proportion of the lakes in these two zones (25.04% and 19.82%, respectively). In contrast, expanding trends were found for 60.19% (65 lakes) and 57.14% (eight lakes) of the lakes in the North Tibetan Plateau-Kunlun Mountains alpine desert and Qaidam Basin semi-desert zones in the east-south corner of Central Asia (Figure 7). In terms of expansion rates, more than half of all the expanding lakes (51.38%, or 1208 lakes) had an increasing yearly rate of 1–10%, but lakes with 0–1% ranked second (538 lakes). Overall, this means that lake expansion in Central Asia was less significant compared to the lakes that shrunk at the rate of −20–−10%. Only 254 lakes (10.80%) had the largest increasing rate of 20–36%.

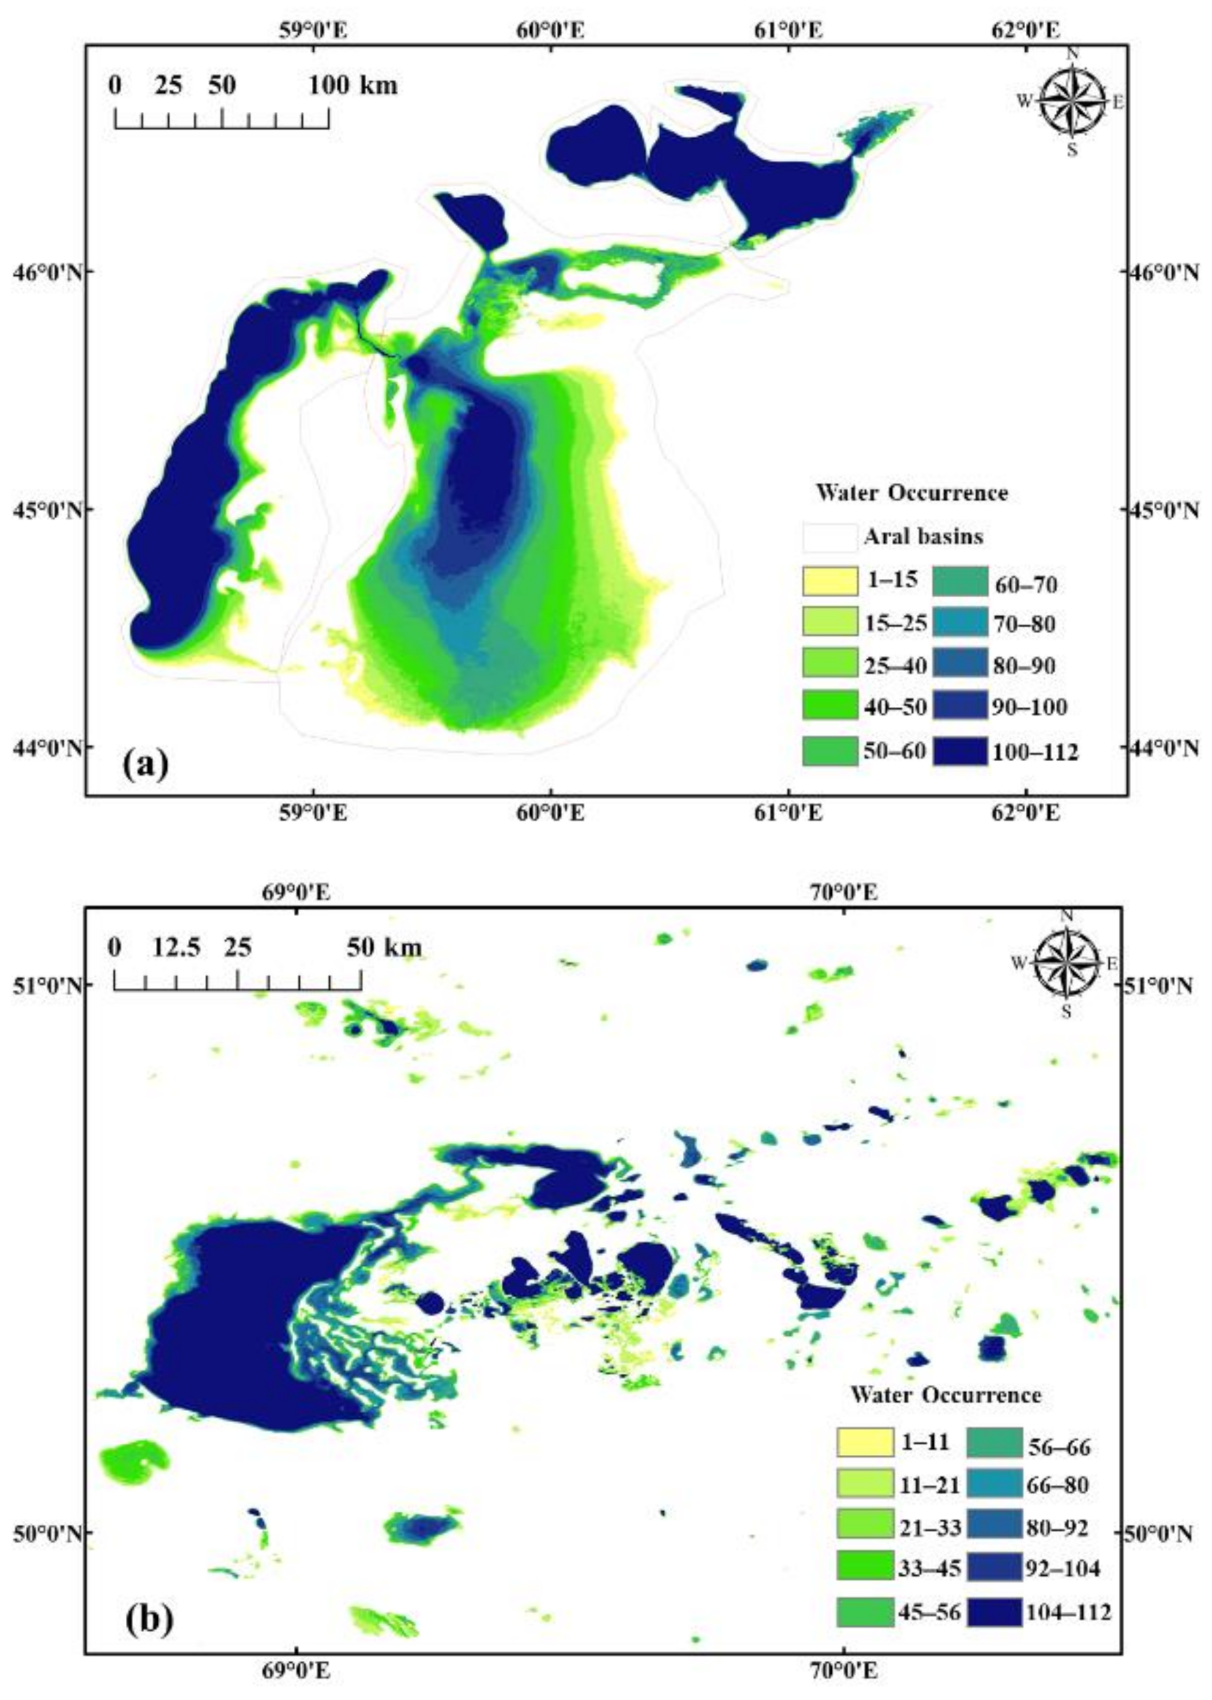
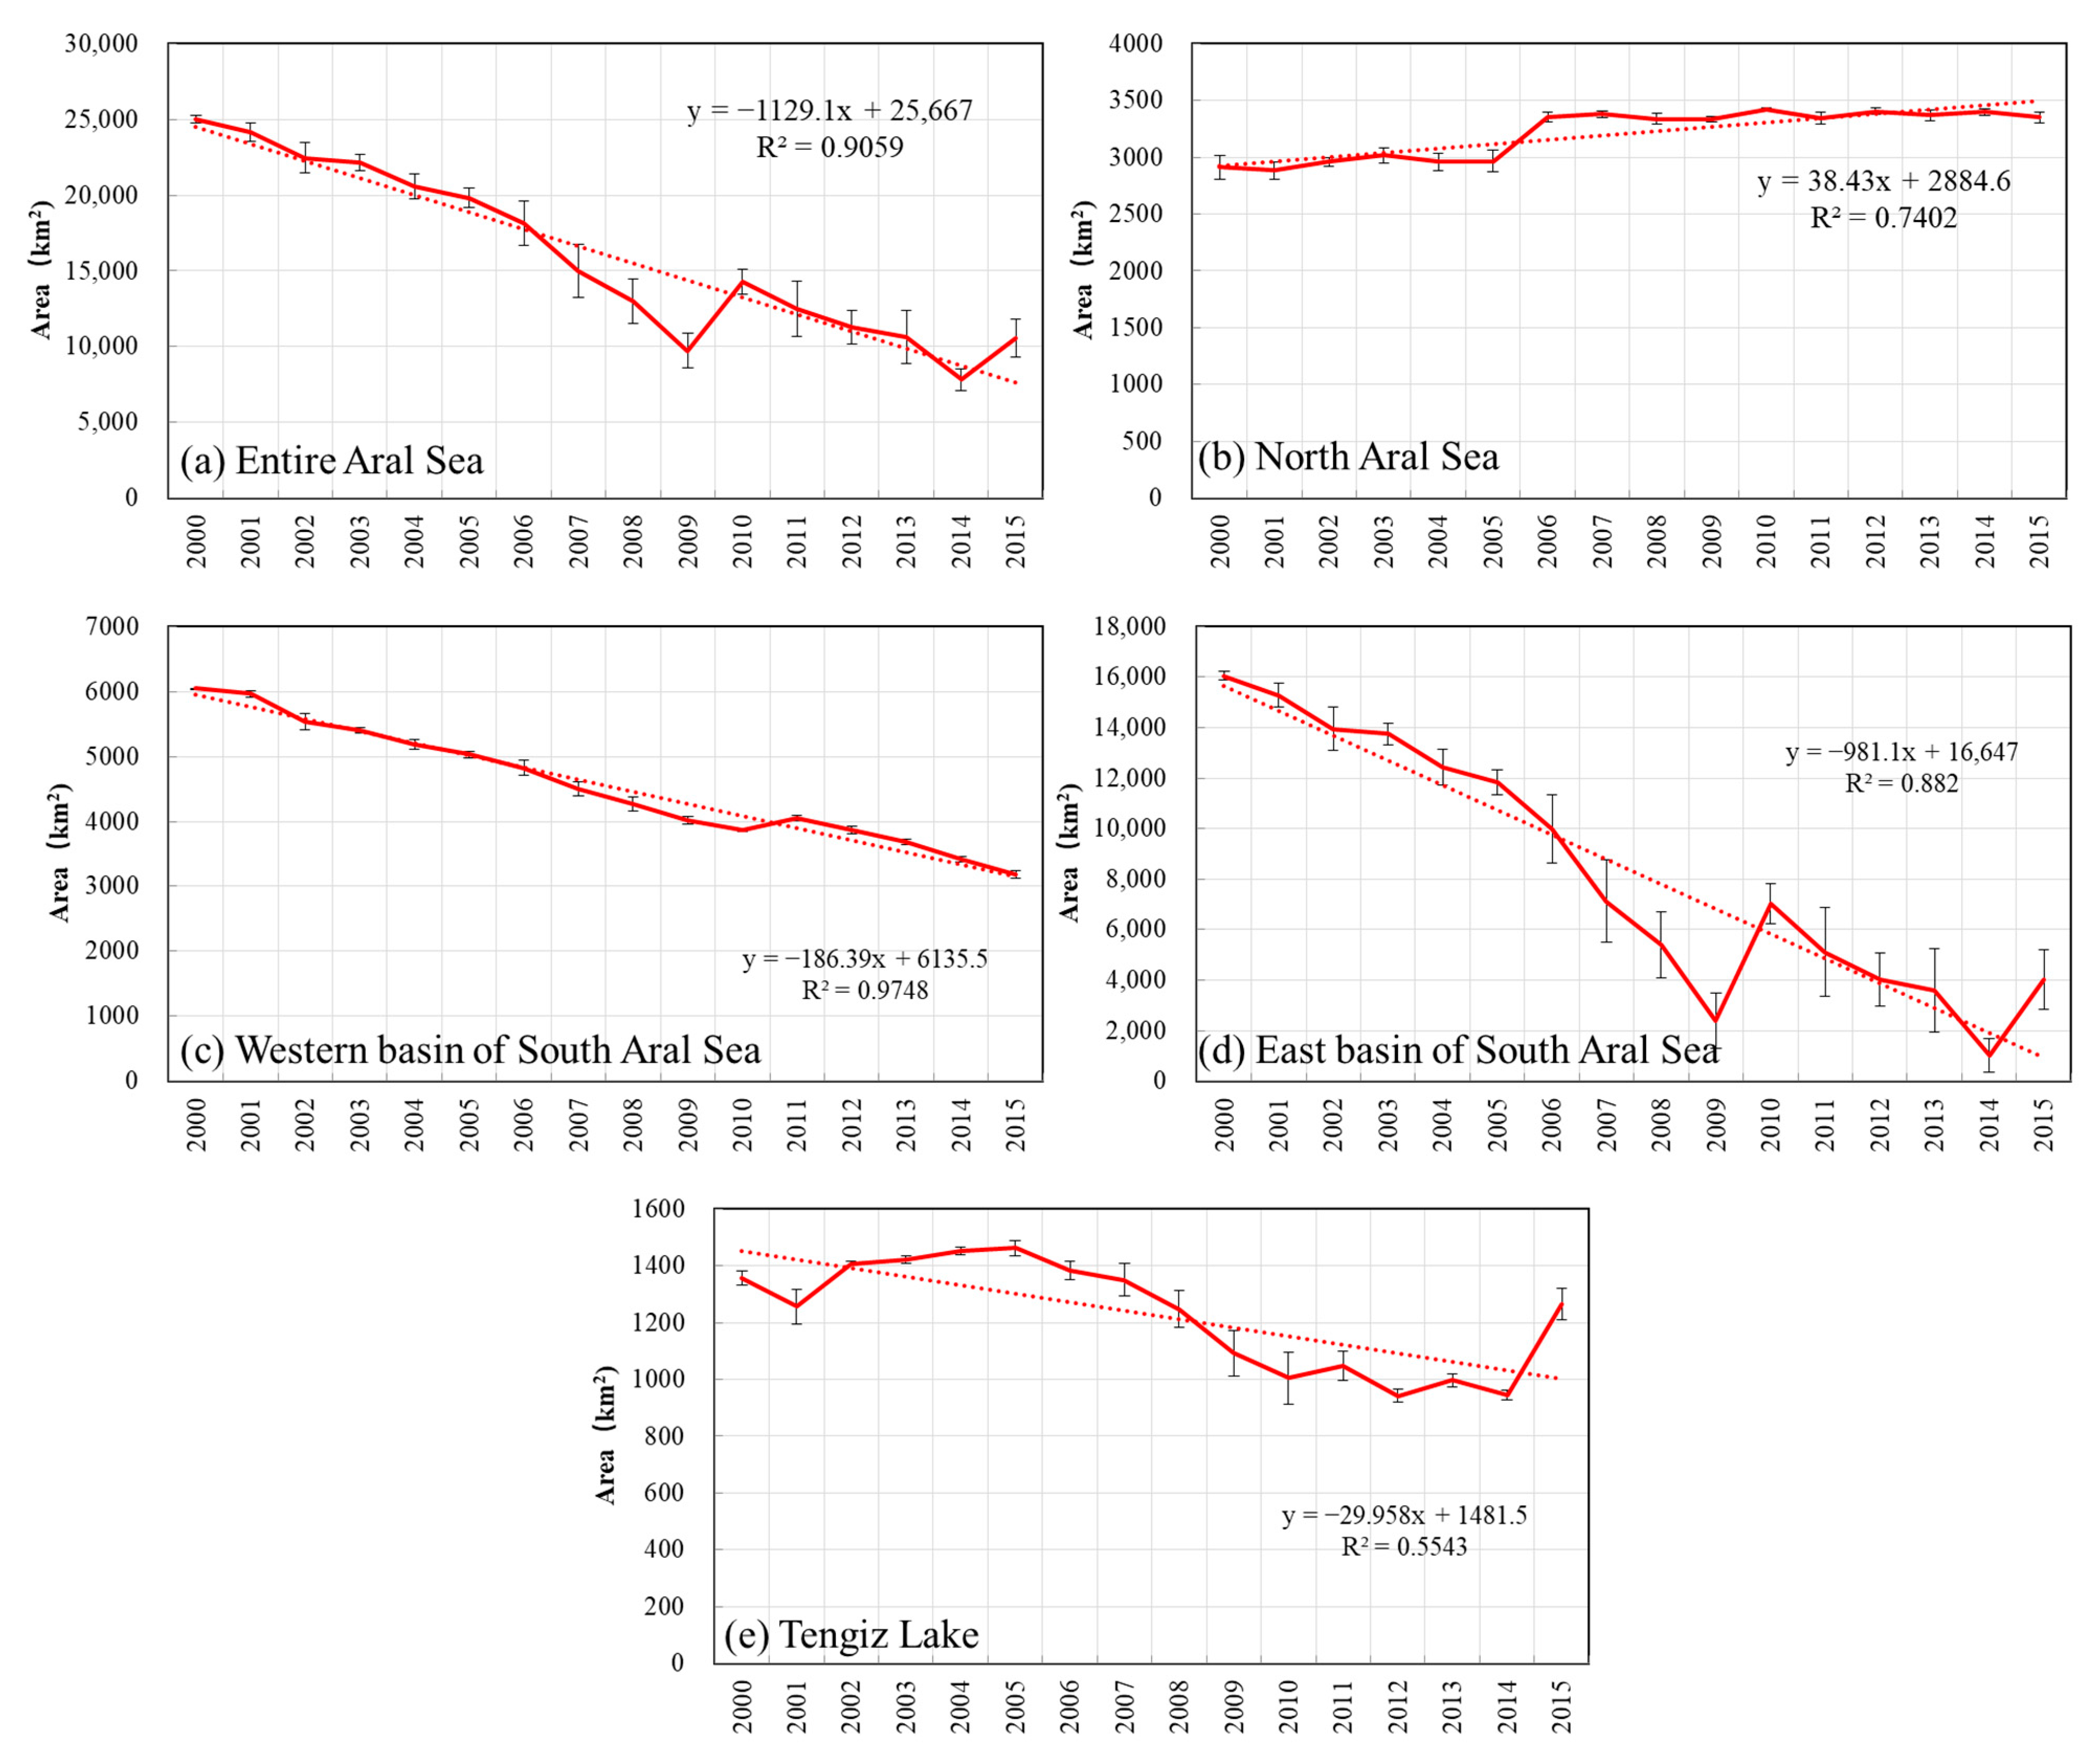
4.3. Aral Sea and Tengiz Lake

4.3.1. Yearly Changes

The North Aral Sea was relatively stable, and two basins of the South Aral Sea changed dramatically, especially in the eastern basin. Tengiz Lake is surrounded by an area that is irregularly inundated. Sharp fluctuations occurred in the eastern part of Tengiz Lake with lower water occurrence (Figure 8).
The entire Aral Sea presented a strong linear shrinkage over 16 years with an average of −1129.10 km2/year and R2 of 0.91 (Figure 9a). The largest area was 25,000.49 km2 in 2000 and continuously decreased over the study period, except for a sharp increase in 2010 when the area was 14,290.94 km2. The area decreased to nearly 3% (7837.15 km2) in 2014 when the eastern basin almost disappeared. Among the two basins of the South Aral Sea, the western basin had the most significant linear decrease with R2 of 0.97, but the intra-annual fluctuations were the smallest (Figure 9c). The area shrunk from 6048.13 km2 in 2000 to 3185.35 km2 in 2015, with a shrinking of 186.39 km2/year. In contrast, the east basin experienced dramatic inter- and intra-annual fluctuations. The largest area of 16,040.58 km2 was recorded in 2000; 2010 had a recovery with the area of 7012.81 km2. The water area of the east basin fell to 1022.56 km2 in 2014 and then had a recovery in 2015 with the area of 4016.48 km2. However, a strong linear decrease was also found with 981.1 km2/year and R2 of 0.88. In particular, the water area decreased sharply from 2006 to 2009 (Figure 9d). In contrast, the North Aral Sea presented a subtle increase, apart from the year 2006, with an increasing rate of 38.43 km2/year and R2 of 0.74. The smallest (2911.77 km2) and largest (3416.76 km2) areas were recorded in 2000 and 2010, respectively, and the intra-annual fluctuations were small (Figure 9b).
The area of Tengiz Lake experienced a linear fall with a decreasing rate of 29.96 km2 per year and R2 of 0.55 over 16 years. The area was 1356.91 km2 in 2000, and a subtle increase occurred from 2000 to 2005. Subsequently, the lake started to shrink to 943.62 km2 in 2014, but the year 2015 saw a sharp increase to 1265.66 km2. There was the largest intra-annual fluctuation in 2010 with ±92.48 km2 (Figure 9e).

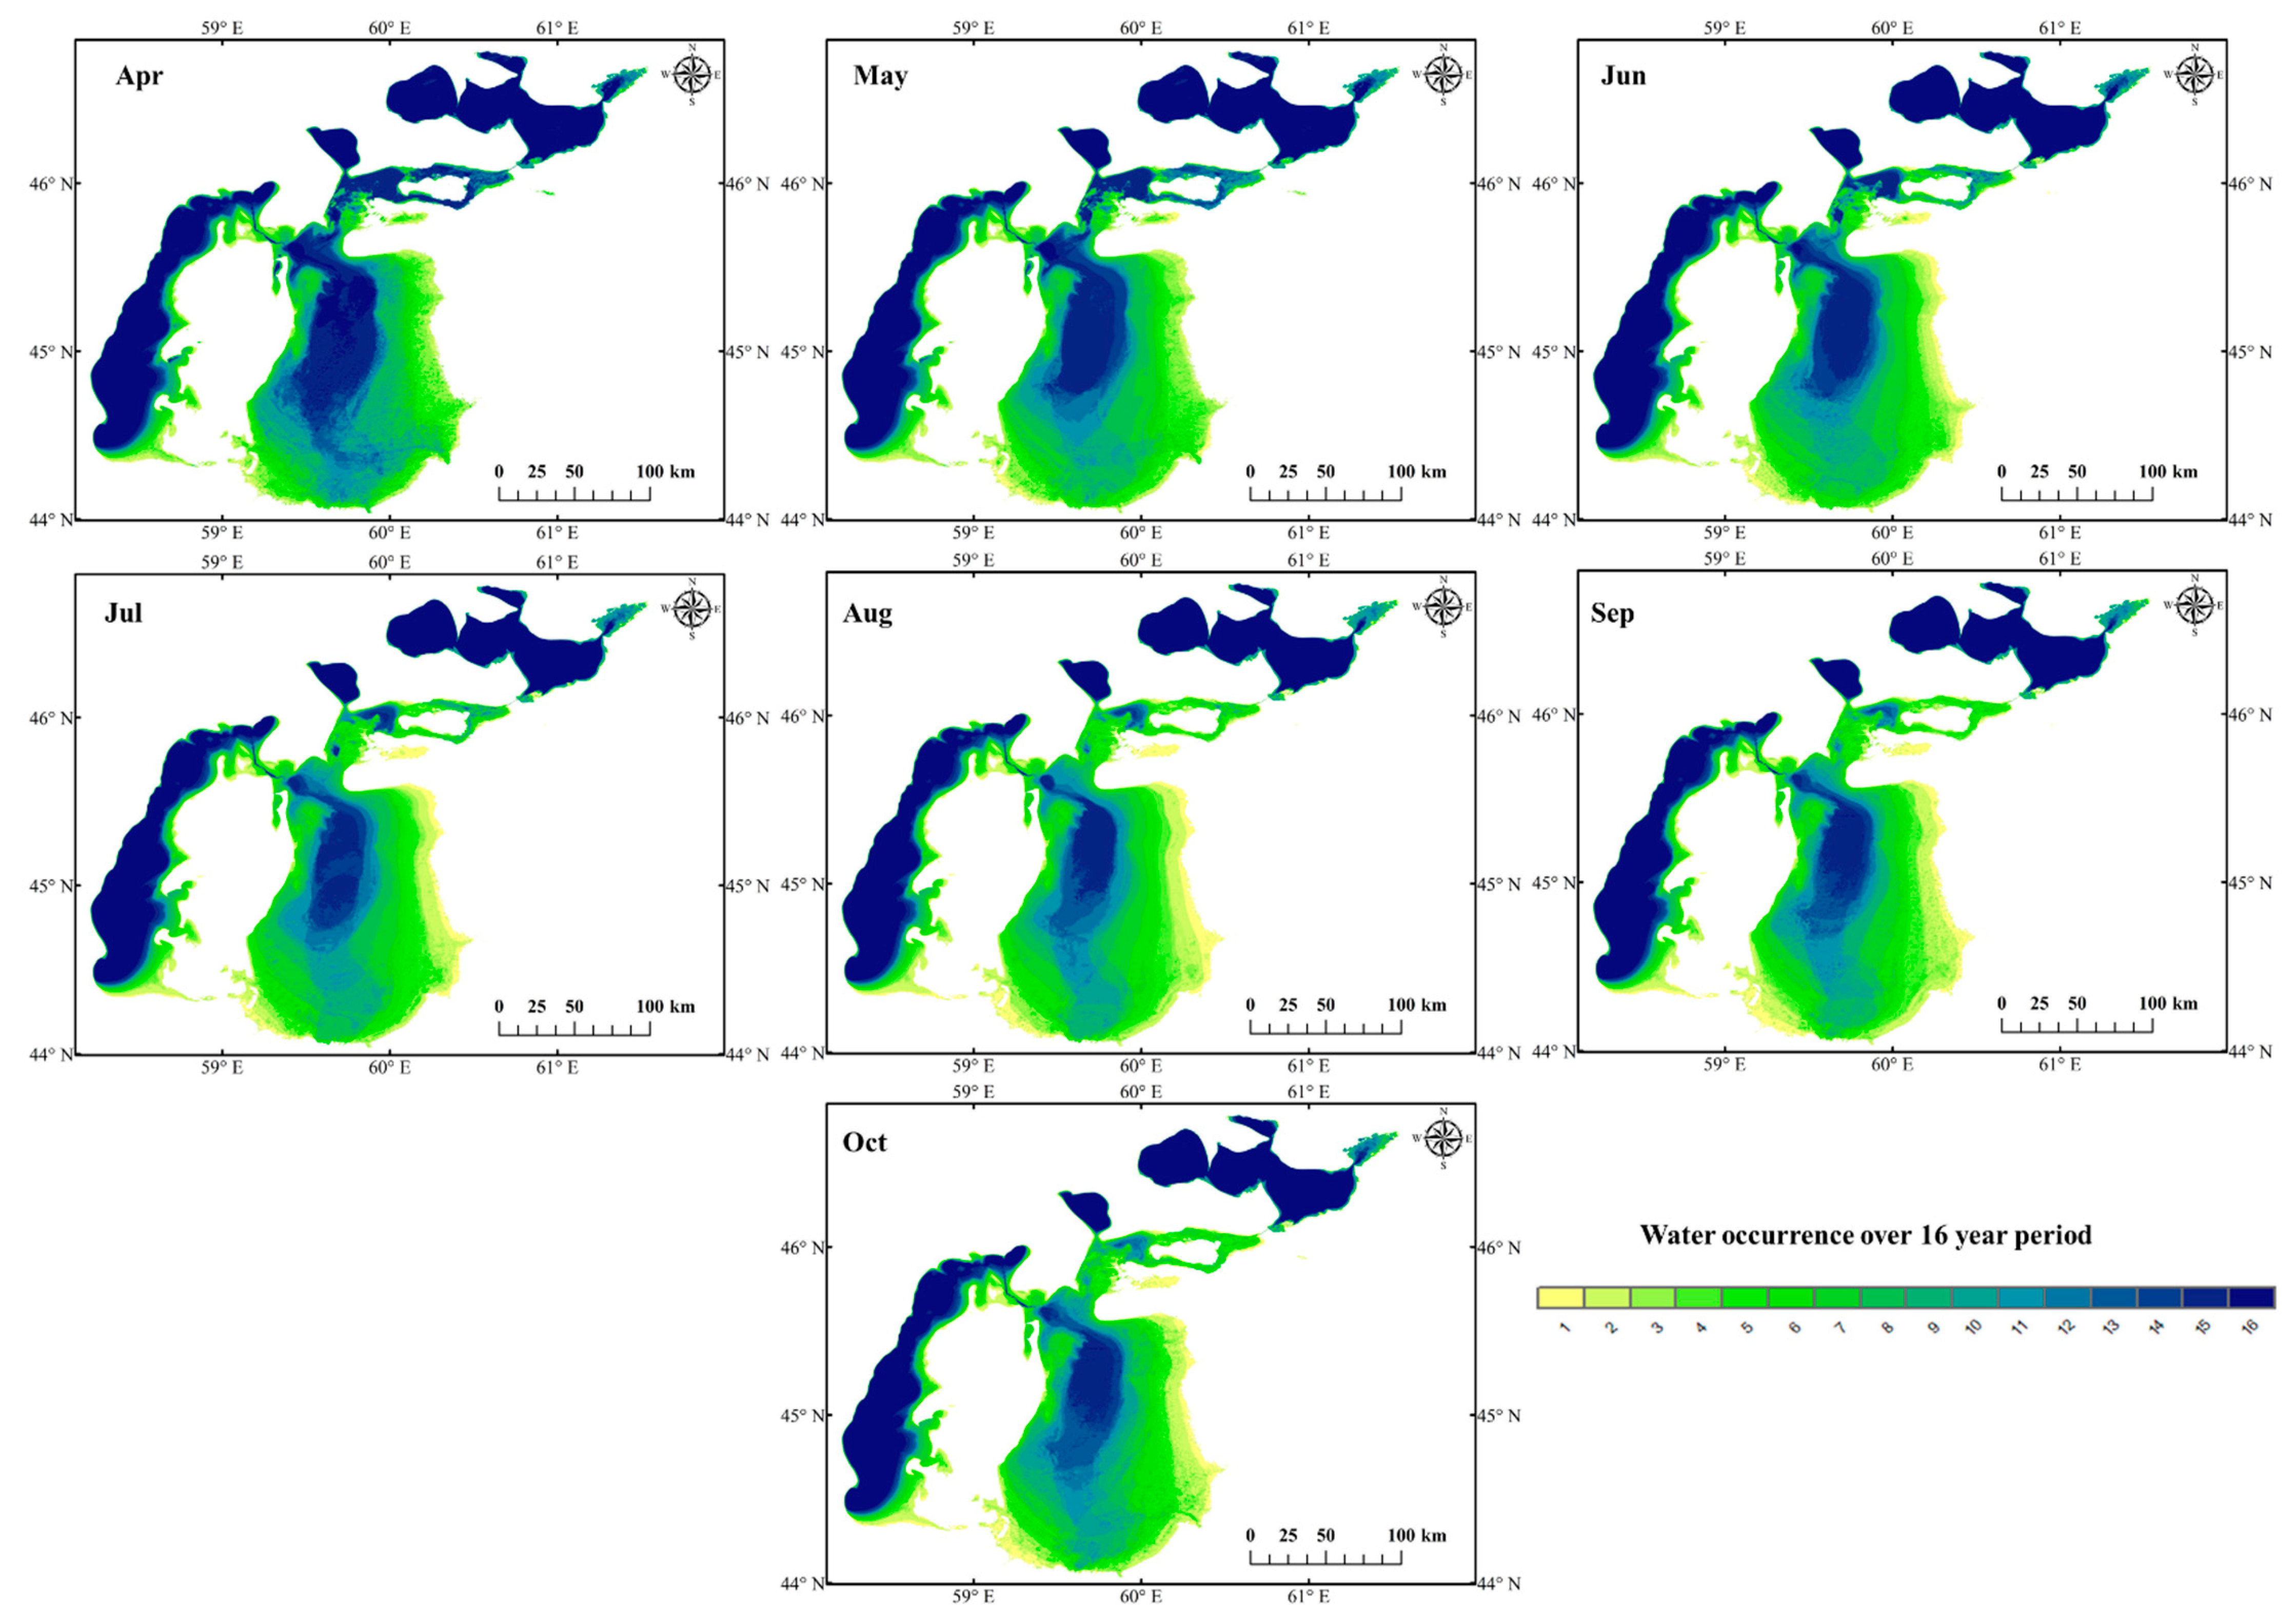
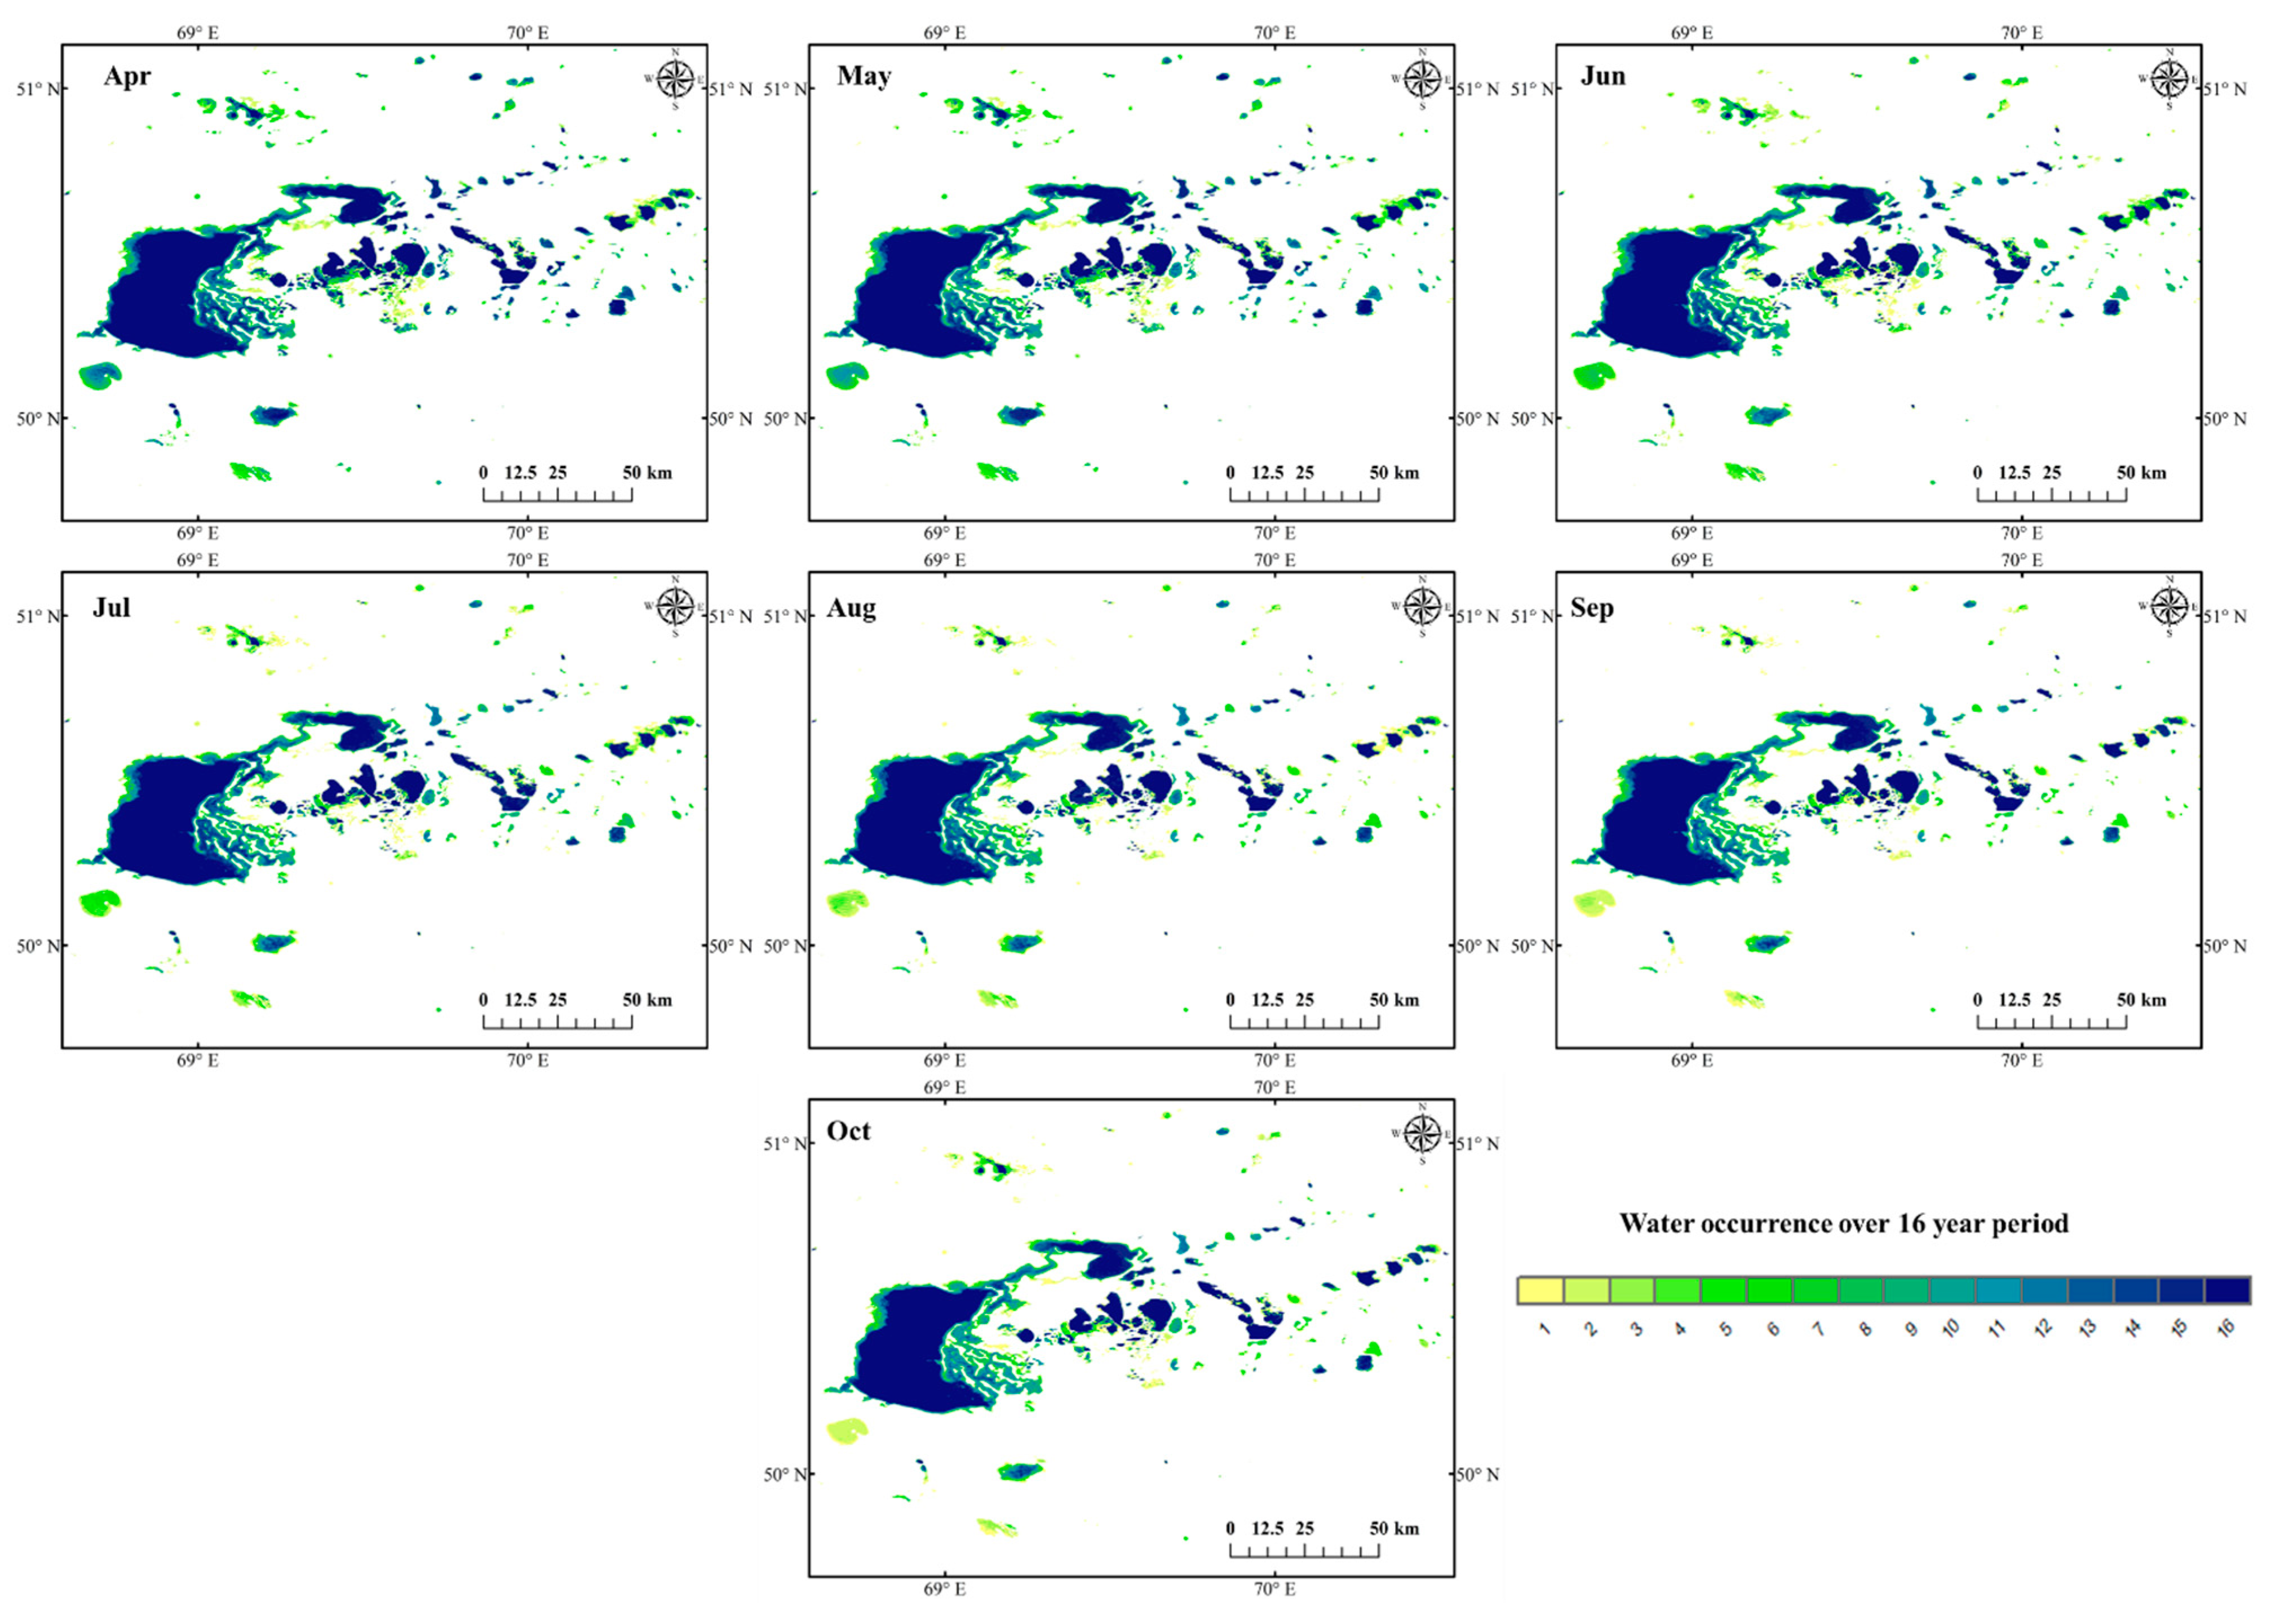
4.3.2. Monthly Changes

Water occurrence in early spring (i.e., April and May) was higher compared to other months for both Aral Sea and Tengiz Lake during the 16-year period, especially in the eastern basin of the Aral Sea and the east of Tengiz Lake (Figure 10 and Figure 11). There was a fall from June to October.
The linearly decreasing trends occurred in all seven months for the entire Aral Sea and in the two basins of the South Aral Sea as well as Tengiz Lake; the opposite trend was observed for the North Aral Sea (Table 6). Specifically, the largest decrease for the Aral Sea was in July with the slope of −1193.69 km2/year and R2 of 0.92, and April saw the smallest decrease with −1004.10 km2/year and R2 of 0.89, respectively. There was a similar pattern for the eastern basin. In contrast, the decreasing slope for the western basin in April was −187.08 km2/year and continuously fell to −184.81 km2/year. However, the North Aral Sea experienced an increase in each month. The increasing slope was 32.68 km2/year in April, and then increased to 42.02 km2/year in August and finally decreased to 39.83 km2/year in October. The decreasing change for Tengiz Lake decreased from −32.80 km2/year in April and then decreased to −28.06 km2/year in August. There was a recovery and it increased to −29.50 km2/year in October.

5. Discussion

Lake size distribution in Central Asia followed a power law (Figure 3b). This agrees with previous studies [22,45,50]. β = −1 reflects an average tenfold decrease in lakes’ density from one logarithmic size category to the next one. The β for Central Asia is −0.602 (Figure 3b) while the global β is −1.054 [37], which means there was a higher proportion of large lakes in Central Asia compared to the globe in spite of its semi-arid and arid climate.
Regional studies of lake dynamics and their interaction with climate change and human activities in Central Asia are rare. Only Bai et.al. [51] monitored changes in surface area of seven major lakes based on Landsat satellite images in 1975, 1990, 1999, and 2007 and showed that the area of inland lakes in Central Asia shrank during the period 1975–2007 owing to climate change and reported temperature and evaporation increase in Central Asia, which is even higher than the global average [52,53]. This study also certified that lakes in Central Asia showed both a number and area decline of lakes from 2000 to 2015, especially in 2009 and 2014 (Figure 5 and Figure 6). Considering a particularly large decrease in the number of stations with a long record [54] and biased estimates from remote sensing [55], we used atmospheric reanalysis product (ERA5-Land) to analyze five possible forcing factors, i.e., temperature, snowmelt, surface runoff, evaporation, and precipitation, to explore the overall decreasing trend of lakes in Central Asia. The ERA5-Land product combines a wide array of measured and remotely sensed information within a dynamical–physical coupled numerical model and is the fifth and newest generation reanalysis from European Centre for Medium-Range Weather Forecasts (ECMWF) with a regular latitude/longitude grid of 0.1° × 0.1° (9 km) and the hourly temporal frequency [56]. The five hourly factors were aggregated to yearly frequency to compare with the lake area from 2000 to 2015 (Figure 12). Rising evaporation (Figure 12d) had the highest linear correlation (R2: 0.44) with the change of the lake area, and decreasing precipitation ranked second with R2 of 0.2 (Figure 12e). Although snowmelt experienced a little increase (Figure 12b) owing to the increasing temperature (Figure 12a), the surface runoff had a decrease, which was consistent with the decline of lake area (Figure 12c). Figure 12 indicated there seems to be no direct relationship between lake area decline and temperature as well as snowmelt.
The shrinking lakes were mainly located in the Kazakh steppe and Badghyz and Karabil semi-desert zones where the changes of Tengiz lake and Aral Sea were explored based on possible driving factors.
The Aral Sea recorded a continuous decline throughout the years and all seven months (Figure 9 and Table 6). The smallest area occurred in 2014 when the eastern basin of the Aral Sea almost disappeared. This could have been the first time the Aral Sea dried up completely. The western portion of the west basin was stable because of its steep coastline [57], while the east basin experienced dramatic fluctuations regardless of inter- and intra-annual change owing to its shallow basin [58]. The sharpest decrease in water area took place from 2006 to 2009, while an abrupt increase was recorded in 2010 for the east basin, which also led to the quick decrease in the entire Aral Sea. Although the precipitation in this region witnessed a slight increase during the period 2006–2009 [59], temperature was relatively high and increased by 1 to 3 °C, thus increasing lake evaporation [60]. Meanwhile, there was little runoff from the Amu Darya River in the south from 2006 to 2009, which flowed into the Aral Sea [61]. However, an abnormal runoff increase was observed in 2010 [61,62]. These quick runoff changes were consistent with the water level (Figure 13) and greatly responded to lake area changes. Nevertheless, the North Aral Sea presented a subtle increase, apart from the year 2006. The abrupt rising water level was observed from 2005 to 2006 (Figure 12) since Dike Kokaral was built between the North and South Aral Seas in the autumn of 2005 [59,63], which made the runoff from Syr Darya only flow into the North Aral Sea.
The decreasing trends occurred for all seven months for the entire Aral Sea and two basins of the South Aral Sea, while there was an opposite trend for the North Aral Sea (Table 4). As a source of surface runoff in Central Asia, glacial meltwater feeds the Aral Sea through Amu Darya and Syr Darya in April and May [64,65]. Rising temperatures caused an increase in evaporation from June to August. Although precipitation also slightly increased, it was not sufficient to balance the water loss from river inflow and evaporation [66], thus leading to the decrease in surface water. At the same time, the massive irrigation of crops such as cotton, rice, and wheat during the summer primarily depended on the upper and middle Amu Darya and Syr Darya. In contrast, these crops were fed by meltwater from the mountains in early spring. The large increases for the North Aral Sea were in August and September, and this mainly resulted from the increasing river runoff from glaciers’ meltwater and precipitation [67]. Meanwhile, the largest decrease in the west basin of the South Aral Sea took place in April and May. This was more related to climate change than anthropogenic change because, as [68] pointed out, the retreat of glaciers reduces the amount of meltwater that normally is discharged into the lakes in early spring. In the east basin of the South Aral Sea, there were larger decreases in summer, mainly caused by the massive water usage for the irrigation of crops and exploration and exploitation of gas and oil reserves on the dry bed of the Aral Sea [69,70].
Tengiz Lake in northern Kazakhstan features a semi-natural water supply in comparison to the Aral Sea. Global rainfall and temperature reanalysis data from the University of Delaware was utilized to explore the changes in the Tengiz Lake. These data had a monthly temporal resolution from 1901 to 2014 and a global spatial resolution of 0.5° × 0.5°. Figure 14 shows the variations of the yearly-accumulated rainfall and summer temperature (from June to August) in the lake area region from 2000 to 2014. The annual precipitation had a downward trend, with an average annual decrease of 8.4 mm. There was a decreasing trend for precipitation from 2004 to 2010, especially in 2008, which probably reduced the inflow into Tengiz Lake. This agreed well with the decrease in lake area from 2005 to 2010 (Figure 9e). The summer temperatures showed an increasing trend, with an average annual increase of about 0.15 °C. The higher temperatures might have caused an increase in evaporation [53]. The shrinking of the lake indicates that Central Asia became dryer with less precipitation and less inflow as well as increased evaporation due to significant increases in air temperatures in the summer months. This trend is also true for northern Kazakhstan [71].
Apart from precipitation, snowmelt also serves as the main supply for Tengiz Lake and its surrounding small lakes [72]. To explore the most significant shrinking of Tengiz Lake in the early spring (April and May) (Table 4), Snow Water Equivalent (SWE) in the winter months (January to March) in the Tengiz Lake Basin from 2000 to 2014 was analyzed. SWE describes the amount of water equivalent to the melting of snow and ice, and SWE dataset from 1979 to 2014 with a spatial resolution of 25 km was utilized [73]. The daily SWE was average to the monthly data (Figure 15), which presents a weak decreasing trend for three winter months. This demonstrates the snowmelt was decreasing in early spring, thus leading to less inflow and a larger decreasing rate from April to May compared to other months. In addition, the smallest decrease occurred in the summer months (i.e., July and August), which was generally opposite to the monthly change rate for the Aral Sea. The inflow from precipitation and glacier melt in summer was compared to winter months. Reducing human activities in the region may slow the shrinking of Tengiz Lake in spite of increasing evaporation.
In contrast, expansions were found for the lakes in the southeast corner of Central Asia near the Tibetan Plateau (Figure 7), where the lakes are predominantly affected by multiple climate-related factors including the precipitation, temperature, glacier melting, and permafrost thawing [74,75]. The increase in the mean annual precipitation contributes to the increase in surface runoff, and the rising air temperature accelerates the melt of glacier and snow in high mountains [76], both of which likely result in the expansion of lakes on this mountainous region. Meanwhile, permafrost degradation with a rapidly warming climate is another important factor for lake expansion particularly for lakes in the Kunlun Mountains [76,77].
Finally, we elaborated on some of the limitations of this study. First, even though in this study we used 16 years (2000–2015) of lake data, the temporal coverage was not sufficient to accurately depict the long-term change of the lakes and explore their response to climate change in Central Asia. Climate represents the long-term manifestations of weather and other atmospheric conditions in a given area over a period long enough to ensure that representative values are obtained (generally 30 years) [78]. Therefore, the temporal coverage for such a study would need to be extended before 2000 and after 2015 to ensure a 30-year analysis. In the meantime, we found that there may have been an increasing trend since 2014 regardless of the number of lakes (Figure 5) and areas (Figure 6) in Central Asia, but this pattern can only be confirmed when the time coverage is expanded. Second, the spatial resolution needs to be increased in order to accurately capture the small lakes. Currently, a 90-m spatial resolution has detected the majority of the lakes of Central Asia (9494 out of a total of 11,164 lakes) but is still insufficient for detecting some small lakes (<1 km2). With increasingly affordable computation [16], studies of lake changes using Landsat 30-m resolution rather than 90-m time-series data in Central Asia could be achieved. Furthermore, the Sentinel-2A MultiSpectral Instrument (MSI) sensor data (launched in 2015) and Sentinel-2B (launched in 2017), providing continuity with the Landsat data record, can also be used to analyze small lakes changes with their 10- and 20-m spatial resolutions and 5-day revisit cycles [79]. Third, this study only qualitatively explored the possible driving factors of lake changes for the Aral Sea and Tengiz Lake. To establish the quantitative relationship between all lakes of Central Asia and regional climatic variables, such as temperature, precipitation, evaporation, will require further study. Lastly, we believe the analysis can be applied in other regions or even the globe to investigate the dynamics of lakes, which could provide insights for the changes of inland water as well as helpful information for addressing the suitability development goals.

6. Conclusions

Long-term fine resolution satellite observations have provided an unprecedented opportunity for monitoring the changes of the lakes of Central Asia, particularly of the numerous small size lakes that are extremely vulnerable to climate and human impacts. However, it is very challenging to provide a comprehensive representation of water dynamics in Central Asia regarding the interannual changes and strong seasonal variations. This study utilized a monthly Landsat-derived water data and HydroLAKES dataset to identify the distribution of lakes (>0.1 km2) over Central Asia for the months from April to October for 16 years (2000–2015). This study analyzed the changes in the number and area of lakes, their spatio–temporal distribution and explored possibly-related driving forces of lake changes using two typical lakes (Aral Sea and Tengiz Lake). The analysis showed that 78.43% of the lakes in Central Asia were small lakes with a surface area < 1 km2, and the number of lakes decreased with the increase in lake size with a higher proportion of large lakes compared to the global region. Both the yearly quantity and areal change of lakes showed a strong linear decrease. Among the seven terrestrial ecological zones in Central Asia, most lakes in each zone decreased, especially in the Kazakh steppe zone, while most lakes showed an opposite pattern in the Northern Tibetan Plateau–Kunlun Mountains alpine desert and Qaidam Basin semi-desert zones in the east-south corner of Central Asia. Meanwhile, the linearly decreasing trend for both the Aral Sea and Tengiz Lake on yearly and monthly scales demonstrated that the Aral Sea had the greatest decrease in summer because of evaporation and massive irrigation, while early spring saw the largest decrease for Tengiz Lake owing to decreasing snowmelt. This long and dense time-series dynamic of areal extents of lakes is a significant indicator for studies of climate change and regional environmental variability as well as human activities in Central Asia. However, this study only focused on the spatio–temporal changes in the number and area of lakes from 2000 to 2015. Lengthening the time-series and analyzing its quantitative response to climate change and human activities requires further investigation.

Author Contributions

Conceptualization, methodology and writing—review and editing, M.F.; formal analysis, investigation, and writing—original draft preparation, X.C.; software, Q.S.; resources, J.O.S.; supervision, J.L.; project administration, S.C. All authors have read and agreed to the published version of the manuscript.

Funding

This research was funded by the National Natural Science Foundation of China program (Grant No. 41901379); the Chinese Academy of Science (CAS) Pioneer Hundred Talents Program; National Aeronautics and Space Administration (NASA) programs: Making Earth Science Data Records for Use in Re-search Environment (NNH06ZDA001N-MEaSUREs), Land Cover and Land Use Change (NNH07ZDA001N-LCLUC) and the Basic Scientific Research Operating Expenses of the Chinese Academy of Surveying and Mapping (No. 20603020004096004 AR1904).

Data Availability Statement

No data.

Acknowledgments

We would like to thank TerraPulse, Inc for providing the monthly Landsat-derived water data.

Conflicts of Interest

The authors declare no conflict of interest.

References

  1. Feng, M.; Sexton, J.O.; Channan, S.; Townshend, J.R. A global, high-resolution (30-m) inland water body dataset for 2000: First results of a topographic–spectral classification algorithm. Int. J. Digit. Earth 2016, 9, 113–133. [Google Scholar] [CrossRef] [Green Version]
  2. Palmer, S.C.; Kutser, T.; Hunter, P.D. Remote sensing of inland waters: Challenges, progress and future directions. Remote. Sens. Environ. 2015, 157, 1–8. [Google Scholar] [CrossRef] [Green Version]
  3. George, G.; Hurley, M.; Hewitt, D. The impact of climate change on the physical characteristics of the larger lakes in the English Lake District. Freshw. Biol. 2007, 52, 1647–1666. [Google Scholar] [CrossRef]
  4. Hampton, S.E.; Izmest’Eva, L.R.; Moore, M.V.; Katz, S.L.; Dennis, B.; Silow, E.A. Sixty years of environmental change in the world’s largest freshwater lake—Lake Baikal, Siberia. Glob. Chang. Biol. 2008, 14, 1947–1958. [Google Scholar] [CrossRef] [Green Version]
  5. Lennox, B.; Spooner, I.; Jull, T.; Patterson, W.P. Post-glacial climate change and its effect on a shallow dimictic lake in Nova Scotia, Canada. J. Paleolimnol. 2009, 43, 15–27. [Google Scholar] [CrossRef]
  6. Lioubimtseva, E.; Henebry, G. Climate and environmental change in arid Central Asia: Impacts, vulnerability, and adaptations. J. Arid. Environ. 2009, 73, 963–977. [Google Scholar] [CrossRef]
  7. Bai, J.; Chen, X.; Li, J.; Yang, L.; Fang, H. Changes in the area of inland lakes in arid regions of central Asia during the past 30 years. Environ. Monit. Assess. 2011, 178, 247–256. [Google Scholar] [CrossRef]
  8. Zafarnejad, F. The contribution of dams to Iran’s desertification. Int. J. Environ. Stud. 2009, 66, 327–341. [Google Scholar] [CrossRef]
  9. Chen, X.; Jiang, F.; Wang, J.; Li, Y.; Hu, R. Characteristics of the Eco-geographical Pattern in Arid Land of Central Asia. Arid Zone Res. 2013, 30, 385–390. [Google Scholar]
  10. Kazakhstan, U. Water Resources of Kazakhstan in the New Millennium; UNDP: Almaty, Republic of Kazakhstan, 2004. [Google Scholar]
  11. Klein, I.; Dietz, A.J.; Gessner, U.; Galayeva, A.; Myrzakhmetov, A.; Kuenzer, C. Evaluation of seasonal water body extents in Central Asia over the past 27 years derived from medium-resolution remote sensing data. Int. J. Appl. Earth Obs. Geoinf. 2014, 26, 335–349. [Google Scholar] [CrossRef]
  12. Harris, A.R.; Mason, I.M. Lake area measurement using AVHRR A case study. Int. J. Remote Sens. 1989, 10, 885–895. [Google Scholar] [CrossRef]
  13. Carroll, M.; Townshend, J.; DiMiceli, C.; Noojipady, P.; Sohlberg, R. A new global raster water mask at 250 m resolution. Int. J. Digit. Earth 2009, 2, 291–308. [Google Scholar] [CrossRef]
  14. Huang, C.; Chen, Y.; Wu, J.; Li, L.; Liu, R. An evaluation of Suomi NPP-VIIRS data for surface water detection. Remote Sens. Lett. 2015, 6, 155–164. [Google Scholar] [CrossRef]
  15. Fluet-Chouinard, E.; Lehner, B.; Rebelo, L.-M.; Papa, F.; Hamilton, S.K. Development of a global inundation map at high spatial resolution from topographic downscaling of coarse-scale remote sensing data. Remote Sens. Environ. 2015, 158, 348–361. [Google Scholar] [CrossRef]
  16. Gorelick, N.; Hancher, M.; Dixon, M.; Ilyushchenko, S.; Thau, D.; Moore, R. Google Earth Engine: Planetary-scale geospatial analysis for everyone. Remote Sens. Environ. 2017, 202, 18–27. [Google Scholar] [CrossRef]
  17. Vermote, E.; Justice, C.; Claverie, M.; Franch, B. Preliminary analysis of the performance of the Landsat 8/OLI land surface reflectance product. Remote Sens. Environ. 2016, 185, 46–56. [Google Scholar] [CrossRef]
  18. Foga, S.; Scaramuzza, P.L.; Guo, S.; Zhu, Z.; Dilley, R.D.; Beckmann, T.; Schmidt, G.L.; Dwyer, J.L.; Hughes, M.J.; Laue, B. Cloud detection algorithm comparison and validation for operational Landsat data products. Remote Sens. Environ. 2017, 194, 379–390. [Google Scholar] [CrossRef] [Green Version]
  19. Nitze, I.; Grosse, G.; Jones, B.M.; Arp, C.D.; Ulrich, M.; Fedorov, A.; Veremeeva, A. Landsat-Based Trend Analysis of Lake Dynamics across Northern Permafrost Regions. Remote Sens. 2017, 9, 640. [Google Scholar] [CrossRef] [Green Version]
  20. Shao, Z.; Meng, X.; Zhu, D.; Zheng, D.; Qiao, Z.; Yang, C.; Han, J.; Yu, J.; Meng, Q.; Lü, R. Characteristics of the change of major lakes on the Qinghai-Tibet Plateau in the last 25 years. Front. Earth Sci. China 2008, 2, 364–377. [Google Scholar] [CrossRef]
  21. Pekel, J.-F.; Cottam, A.; Gorelick, N.; Belward, A.S. High-resolution mapping of global surface water and its long-term changes. Nature 2016, 540, 418–422. [Google Scholar] [CrossRef]
  22. Feng, S.; Liu, S.; Huang, Z.; Jing, L.; Zhao, M.; Peng, X.; Yan, W.; Wu, Y.; Lv, Y.; Smith, A.R.; et al. Inland water bodies in China: Features discovered in the long-term satellite data. Proc. Natl. Acad. Sci. USA 2019, 116, 25491–25496. [Google Scholar]
  23. François, S. Testing the Global Surface Water Dataset for Canada, Forum of Experts in SEEA Experimental Ecosystem Ac-Counting 2018; Statistics Canada: Glen Cove, NY, USA, June 2018.
  24. Che, X.; Feng, M.; Sexton, J.; Channan, S.; Sun, Q.; Ying, Q.; Liu, J.; Wang, Y. Landsat-Based Estimation of Seasonal Water Cover and Change in Arid and Semi-Arid Central Asia (2000–2015). Remote Sens. 2019, 11, 1323. [Google Scholar] [CrossRef] [Green Version]
  25. Feng, L.; Hu, C.; Chen, X.; Cai, X.; Tian, L.; Gan, W. Assessment of inundation changes of Poyang Lake using MODIS obser-vations between 2000 and 2010. Remote Sens. Environ. 2012, 121, 80–92. [Google Scholar]
  26. Yang, X.; Qin, Q.; Yésou, H.; Ledauphin, T.; Koehl, M.; Grussenmeyer, P.; Zhu, Z. Monthly estimation of the surface water extent in France at a 10-m resolution using Sentinel-2 data. Remote Sens. Environ. 2020, 244, 111803. [Google Scholar] [CrossRef]
  27. Hui, F.; Xu, B.; Huang, H.; Gong, P. Modeling spatial-temporal change of Poyang Lake using multi-temporal Landsat imagery. Geoinformatics 2007 2007, 6752, 675218. [Google Scholar] [CrossRef]
  28. Dronova, I.; Gong, P.; Wang, L. Object-based analysis and change detection of major wetland cover types and their classification uncertainty during the low water period at Poyang Lake, China. Remote Sens. Environ. 2011, 115, 3220–3236. [Google Scholar] [CrossRef]
  29. Campos, J.C.; Sillero, N.; Brito, J.C. Normalized difference water indexes have dissimilar performances in detecting seasonal and permanent water in the Sahara–Sahel transition zone. J. Hydrol. 2012, 464–465, 438–446. [Google Scholar] [CrossRef]
  30. Chen, C.; Fu, W.; Hu, Z.; Li, X. Changes of major lakes in Central Asia over the past 30 years revealed by remote sensing technology. Remote Sens. Land Resour. 2015, 27, 146–152. [Google Scholar]
  31. Wu, J.; Mang, L.; Ji, L. Lake surface change of the Aral Sea and its environmental effects in the arid region of the central asia. Arid Land Geogr. 2009, 32, 418–422. [Google Scholar]
  32. Yan, Q.; Liao, J.; Shen, G. Remote sensing analysis and simulation of change of Ulan Ul Lake in the past 40 years. Remote Sens. Land Resour. 2014, 26, 152–157. [Google Scholar]
  33. Liu, H.; Chen, Y.; Ye, Z.; Li, Y.; Zhang, Q. Recent Lake Area Changes in Central Asia. Sci. Rep. 2019, 9, 1–11. [Google Scholar] [CrossRef] [Green Version]
  34. De Pauw, E. ICARDA regional GIS datasets for Central Asia: Explanatory notes. In GIS Unit Technical Bulletin; International Center for Agricultural Research in the Dry Areas (ICARDA): Aleppo, Syria, 2008. [Google Scholar]
  35. Olson, D.M.; Dinerstein, E.; Wikramanayake, E.D.; Burgess, N.D.; Powell, G.V.; Underwood, E.C.; D’amico, J.A.; Itoua, I.; Strand, H.E.; Morrison, J.C. Terrestrial Ecoregions of the World: A New Map of Life on Earth: A new global map of terrestrial ecoregions provides an innovative tool for conserving biodiversity. BioScience 2001, 51, 933–938. [Google Scholar]
  36. Andreev, N.I.; Plotnikov, I.S.; Aladin, N.V. The fauna of the Aral Sea in the zooplankton. Int. J. Salt Lake Res. 1992, 1, 111–116. [Google Scholar] [CrossRef]
  37. Messager, M.L.; Lehner, B.; Grill, G.; Nedeva, I.; Schmitt, O. Estimating the volume and age of water stored in global lakes using a geo-statistical approach. Nat. Commun. 2016, 7, 13603. [Google Scholar] [CrossRef]
  38. Slater, J.A.; Garvey, G.; Johnston, C.; Haase, J.; Heady, B.; Kroenung, G.; Little, J. The SRTM Data “Finishing” Process and Products. Photogramm. Eng. Remote Sens. 2006, 72, 237–247. [Google Scholar] [CrossRef] [Green Version]
  39. Fang, Y.; Li, H.; Wan, W.; Zhu, S.; Wang, Z.; Hong, Y.; Wang, H. Assessment of Water Storage Change in China’s Lakes and Reservoirs over the Last Three Decades. Remote Sens. 2019, 11, 1467. [Google Scholar]
  40. Meyer, M.F.; Labou, S.G.; Cramer, A.N.; Brousil, M.R.; Luff, B.T. The global lake area, climate, and population dataset. Sci. Data 2020, 7, 174. [Google Scholar] [CrossRef]
  41. Zhu, S.; Liu, B.; Wan, W.; Xie, H.; Fang, Y.; Chen, X.; Li, H.; Fang, W.; Zhang, G.; Tao, M.; et al. A New Digital Lake Bathymetry Model Using the Step-Wise Water Recession Method to Generate 3D Lake Bathymetric Maps Based on DEMs. Water 2019, 11, 1151. [Google Scholar] [CrossRef] [Green Version]
  42. Wang, W.; Lee, X.; Xiao, W.; Liu, S.; Schultz, N.; Wang, Y.; Zhang, M.; Zhao, L. Global lake evaporation accelerated by changes in surface energy allocation in a warmer climate. Nat. Geosci. 2018, 11, 410–414. [Google Scholar] [CrossRef]
  43. Verpoorter, C.; Kutser, T.; Seekell, D.A.; Tranvik, L.J. A global inventory of lakes based on high-resolution satellite imagery. Geophys. Res. Lett. 2014, 41, 6396–6402. [Google Scholar] [CrossRef]
  44. Downing, J.A.; Prairie, Y.T.; Cole, J.J.; Duarte, C.M.; Tranvik, L.J.; Striegl, R.G.; McDowell, W.H.; Kortelainen, P.; Caraco, N.F.; Melack, J.M.; et al. The global abundance and size distribution of lakes, ponds, and impoundments. Limnol. Oceanogr. 2006, 51, 2388–2397. [Google Scholar] [CrossRef] [Green Version]
  45. Lehner, B.; Döll, P. Development and validation of a global database of lakes, reservoirs and wetlands. J. Hydrol. 2004, 296, 1–22. [Google Scholar] [CrossRef]
  46. Lerman, A.; Imboden, D.M.; Gat, J.; Chou, L. Physics and Chemistry of Lakes; Springer: Berlin/Heidelberg, Germany, 1995. [Google Scholar]
  47. McDonald, C.P.; Rover, J.A.; Stets, E.G.; Striegl, R.G. The regional abundance and size distribution of lakes and reservoirs in the United States and implications for estimates of global lake extent. Limnol. Oceanogr. 2012, 57, 597–606. [Google Scholar] [CrossRef]
  48. Bernhard, L.; Mathis, M. HydroLAKES, Technical Documentation Version 1.0. Available online: http://www.hydrosheds.org/images/inpages/HydroLAKES_TechDoc_v10.pdf (accessed on 31 December 2016).
  49. Ghalhari, G.F.; Dastjerdi, J.K.; Nokhandan, M.H. Using Mann Kendal and t-test methods in identifying trends of climatic elements: A case study of northern parts of Iran. Manag. Sci. Lett. 2012, 2, 911–920. [Google Scholar] [CrossRef]
  50. Birkett, C.M.; Mason, I.M. A New Global Lakes Database for a Remote Sensing Program Studying Climatically Sensitive Large Lakes. J. Great Lakes Res. 1995, 21, 307–318. [Google Scholar] [CrossRef]
  51. Bai, J.; Chen, X.; Yang, L.; Fang, H. Monitoring variations of inland lakes in the arid region of Central Asia. Front. Earth Sci. 2012, 6, 147–156. [Google Scholar] [CrossRef]
  52. Eisfelder, C.; Klein, I.; Niklaus, M.; Kuenzer, C. Net primary productivity in Kazakhstan, its spatio-temporal patterns and relation to meteorological variables. J. Arid. Environ. 2014, 103, 17–30. [Google Scholar] [CrossRef] [Green Version]
  53. Gupta, R.; Kienzler, K.; Martius, C.; Mirzabaev, A.; Oweis, T.; De Pauw, E.; Qadir, M.; Shideed, K.; Sommer, R.; Thomas, R. Research Prospectus: A vision for Sustainable Land Management Research in Central Asia; ICARDA Central Asia and Caucasus Program. Sustainable Agriculture in Central Asia and the Caucasus Series; CGIAR-PFU: Tashkent, Uzbekistan, 2009; Volume 1, p. 84. [Google Scholar]
  54. Lins, H.F. Challenges to Hydrological Observations. In WMO Bulletin; WMO: Geneva, Switzerland, 2008; Volume 57, pp. 55–58. [Google Scholar]
  55. Fortin, V.; Roy, G.; Donaldson, N.; Mahidjiba, A. Assimilation of radar quantitative precipitation estimations in the Canadian Precipitation Analysis (CaPA). J. Hydrol. 2015, 531, 296–307. [Google Scholar] [CrossRef]
  56. Muñoz-Sabater, J. ERA5-Land: A New State-Of-The-Art Global Land Surface Reanalysis Dataset. In Proceedings of the 31st Conference on Hydrology—2017 AMS Annual Meeting, Seattle, WA, USA, 21–23 June 2017. [Google Scholar]
  57. Zavialov, P.O. Physical Oceanography of the Dying Aral Sea; Springer: Berlin/Heidelberg, Germany, 2007. [Google Scholar]
  58. Roget, E.; Zavialov, P.; Khan, V.; Muñiz, M.A. Geodynamical processes in the channel connecting the two lobes of the Large Aral Sea. Hydrol. Earth Syst. Sci. 2009, 13, 2265–2271. [Google Scholar] [CrossRef]
  59. Massakbayeva, A.; Abuduwaili, J.; Bissenbayeva, S.; Issina, B.; Smanov, Z. Water balance of the Small Aral Sea. Environ. Earth Sci. 2020, 79, 75. [Google Scholar] [CrossRef]
  60. Engel, K. State and local climate change initiatives: What is motivating state and local governments to address a global problem and what does this say about federalism and environmental law. Urb. Law. 2006, 38, 1015. [Google Scholar]
  61. Singh, A.; Seitz, F.; Schwatke, C. Inter-annual water storage changes in the Aral Sea from multi-mission satellite altimetry, optical remote sensing, and GRACE satellite gravimetry. Remote. Sens. Environ. 2012, 123, 187–195. [Google Scholar] [CrossRef]
  62. ICWC, S. Scientific-Information Center, Interstate Commission for Water Coordination in Central Asia (SIC ICWC), United Nations Economic Commission for Europe (UNECE), Central Asian Regional Environmental Center (CAREC), Water quality in the amudarya and syrdarya river basins. Anal. Rep. Tashkent 2011, 77. Available online: http://www.cawater-info.net/water_quality_in_ca/files/analytic_report_en.pdf (accessed on 16 December 2012).
  63. Micklin, P.P. The Aral Sea Crisis. In Dying and Dead Seas Climatic Versus Anthropic Causes; Springer: Dordrecht, The Netherlands, 2004; pp. 99–123. [Google Scholar]
  64. Dietz, A.J.; Kuenzer, C.; Conrad, C. Snow-cover variability in central Asia between 2000 and 2011 derived from improved MODIS daily snow-cover products. Int. J. Remote Sens. 2013, 34, 3879–3902. [Google Scholar] [CrossRef]
  65. Zhou, H.; Aizen, E.; Aizen, V. Deriving long term snow cover extent dataset from AVHRR and MODIS data: Central Asia case study. Remote Sens. Environ. 2013, 136, 146–162. [Google Scholar] [CrossRef]
  66. Aizen, V.B.; Aizen, E.M.; Kuzmichenok, V.A. Geo-informational simulation of possible changes in Central Asian water re-sources. Glob. Planet. Chang. 2007, 56, 341–358. [Google Scholar]
  67. Long, A.; Deng, M.; Xie, L.; Li, X.-Q.; Wang, J.-Y.; Su, H.-C.; Wu, S.-F. Exploring analysis on the adaptive countermeasures to water resources evolvement under the climate change in Xinjiang and Aral Sea Basin. Arid Land Geogr. 2012, 35, 377–387. [Google Scholar]
  68. Hagg, W.; Hoelzle, M.; Wagner, S.; Mayr, E.; Klose, Z. Glacier and runoff changes in the Rukhk catchment, upper Amu-Darya basin until. Glob. Planet. Chang. 2013, 110, 62–73. [Google Scholar] [CrossRef] [Green Version]
  69. Karnieli, A.; Gilad, U.; Ponzet, M.; Svoray, T.; Mirzadinov, R.; Fedorina, O. Assessing land-cover change and degradation in the Central Asian deserts using satellite image processing and geostatistical methods. J. Arid. Environ. 2008, 72, 2093–2105. [Google Scholar] [CrossRef]
  70. Mannig, B.; Müller, M.; Starke, E.; Merkenschlager, C.; Mao, W.; Zhi, X.; Podzun, R.; Jacob, D.; Paeth, H. Dynamical downscaling of climate change in Central Asia. Glob. Planet. Chang. 2013, 110, 26–39. [Google Scholar] [CrossRef]
  71. Fensholt, R.; Langanke, T.; Rasmussen, K.; Reenberg, A.; Prince, S.D.; Tucker, C.; Scholes, R.J.; Le, Q.B.; Bondeau, A.; Eastman, R.; et al. Greenness in semi-arid areas across the globe 1981–2007—An Earth observing satellite based analysis of trends and drivers. Remote Sens. Environ. 2012, 121, 144–158. [Google Scholar] [CrossRef]
  72. Aladin, N.V.; Plotnikov, I.S. Large saline lakes of former USSR: A summary review. Hidrobiológica 1993, 267, 1–12. [Google Scholar] [CrossRef]
  73. Luojus, K.; Pulliainen, J.; Takala, M.; Lemmetyinen, J.; Derksen, C.; Wang, L. Snow water equivalent (SWE) product guide. European Space Agency Study Contract Report, ESRIN Contract 21703/08/I-EC. Glob. Snow Monit. Clim. Res. 2010, 1. [Google Scholar]
  74. Zhang, G.; Yao, T.; Piao, S.; Bolch, T.; Xie, H.; Chen, D.; Gao, Y.; O’Reilly, C.M.; Shum, C.K.; Yang, K.; et al. Extensive and drastically different alpine lake changes on Asia’s high plateaus during the past four decades. Geophys. Res. Lett. 2017, 44, 252–260. [Google Scholar] [CrossRef] [Green Version]
  75. Zhang, G.; Yao, T.; Xie, H.; Zhang, K.; Zhu, F. Lakes’ state and abundance across the Tibetan Plateau. Chin. Sci. Bull. 2014, 59, 3010–3021. [Google Scholar] [CrossRef]
  76. Mao, D.; Wang, Z.; Yang, H.; Li, H.; Thompson, J.R.; Li, L.; Song, K.; Chen, B.; Gao, H.; Wu, J. Impacts of Climate Change on Tibetan Lakes: Patterns and Processes. Remote Sens. 2018, 10, 358. [Google Scholar] [CrossRef] [Green Version]
  77. Ke, L.; Ding, X.; Song, C. Heterogeneous changes of glaciers over the western Kunlun Mountains based on ICESat and Landsat-8 derived glacier inventory. Remote Sens. Environ. 2015, 168, 13–23. [Google Scholar] [CrossRef]
  78. Bartee, L.; Shriner, W.; Creech, C. Climate and the Effects of Global Climate Change. Princ. Biol. 2017, 211–213. Available online: https://openoregon.pressbooks.pub/mhccmajorsbio/chapter/climate-and-the-effects-of-global-climate-change (accessed on 10 November 2017).
  79. Drusch, M.; Del Bello, U.; Carlier, S.; Colin, O.; Fernandez, V.; Gascon, F.; Bargellini, P. Sentinel-2: ESA’s Optical High-Resolution Mission for GMES Operational Services. Remote Sens. Environ. 2012, 120, 25–36. [Google Scholar]
Figure 1. The extent of Central Asia overlayed with a digital elevation model (DEM), glaciers, main rivers, and vectorized lakes from the HydroLAKES dataset [37].
Remotesensing 13 01032 g001
Figure 2. The graphical iteration processing for lake identification.
Remotesensing 13 01032 g002
Figure 3. Power-law frequency distribution of lake size in Central Asia.
Remotesensing 13 01032 g003
Figure 4. Number and area of lakes within seven terrestrial ecological zones in Central Asia [35].
Remotesensing 13 01032 g004
Figure 5. The change trend of the number of lakes in Central Asia.
Remotesensing 13 01032 g005
Figure 6. The yearly change (line) and intra-year fluctuation (blue bar) of the total lake area (the variables Max, Mean, and Min were calculated as the maximum, average, and minimum water area over the seven months within one year; the intra-annual fluctuation is the standard deviation of water areas over the seven months within one year).
Remotesensing 13 01032 g006
Figure 7. Spatial distribution of yearly change rate of each lake over seven terrestrial ecological zones in Central Asia as Figure 4.
Remotesensing 13 01032 g007
Figure 8. Water occurrence distribution of water bodies for the Aral Sea (a) and Tengiz Lake (b) during the 16-year study period.
Remotesensing 13 01032 g008
Figure 9. Yearly and intra-annual area changes for Aral Sea and Tengiz Lake from 2000 to 2015.
Remotesensing 13 01032 g009
Figure 10. Monthly dynamics of water bodies for the Aral Sea over 16-year study period.
Remotesensing 13 01032 g010
Figure 11. Monthly dynamics of water bodies for Tengiz Lake over the 16-year study period.
Remotesensing 13 01032 g011
Figure 12. Correlations between lake area and temperature (a), snowmelt (b), surface runoff (c), evaporation (d) and precipitation (e).
Remotesensing 13 01032 g012
Figure 13. Water level change of the North and South Aral Seas [61].
Remotesensing 13 01032 g013
Figure 14. Comparison between yearly lake area and yearly temperature and summer precipitation from 2000 to 2014 for Tengiz Lake Basin.
Remotesensing 13 01032 g014
Figure 15. Yearly variations in Snow Water Equivalent (SWE) for the months of January, February, and March and their linear trends for Tengiz Lake Basin.
Remotesensing 13 01032 g015
Table 1. Lake datasets references for HydroLAKES production.
Original DatasetRegionOriginal Format and Resolution
Shuttle Radar Topographic Mission (SRTM) Water Body Data (SWBD)56°S to 60°NRaster; 1 arc-second (~30 m at the equator)
MODerate resolution Imaging Spectro-radiometer (MODIS) MOD44W water maskRussia above 60°NRaster; 250 m
European Catchments and Rivers Network System (ECRINS)Europe above 60°N and the entirety of NorwayVector; varying resolutions (~1:250,000)
Global Lakes and Wetlands Database (GLWD)WorldVector; 1:1 million
Global Reservoir and Dam database (GRanD)WorldVector; varying resolutions (1:1 million)
OtherWorldVector; varying resolutions (1:1 million or better)
Table 2. The number and area density of lakes on seven terrestrial ecological zones in Central Asia.
Ecological ZoneDensity (/1000 km2)
NumberArea
Badghyz and Karabil semi-desert1.228.95
Tarim Basin deciduous forests and steppe1.525.30
Kazakh steppe6.1013.31
Tibetan Plateau alpine steppe0.529.94
Tian Shan montane steppe and meadow0.817.79
Central Asian riparian wetland3.16221.96
Rock and Ice0.090.11
All zones1.9518.78
Table 3. The yearly change statistics of the number of lakes with different sizes.
Categories (km2)0–11–1010–5050–100100–500>500
200053821567274373217
200152211702274333516
200255171968332433318
200355121880310443617
200453611687294393517
200553681819312403917
200651311543271403517
200753931761305383817
200850391510280353517
200948901471260373516
201051411366261403816
201150611464267333217
201249251470261363615
201248791493259403215
201444831325233382716
201548321404260432917
Slope(/year)–50.67–30.23–3.66–0.01–0.28–0.09
Rate (%)−0.99−1.90−1.32−0.02−0.81−0.52
Table 4. The yearly area changes of lakes with different sizes.
Lake TypeSlope (km2/year)Rate (%)R2
0–1−21.07−1.420.54 *
1–10−78.41−1.660.53 *
10–50−85.09−1.510.47 *
50–100−11.29−0.430.04
100–500−34.14−0.420.07
>500−1048.99−1.530.91 *
Note: * represents p > 0.05.
Table 5. The number of lakes by yearly change rate over seven terrestrial ecological zones in Central Asia as Figure 4.
Terrestrial Ecological ZonesRate (%/year)
−36–−20−20–−10−10–
−1
−1–
0
0–
1
1–
10
10–
20
20–
36
Badghyz and Karabil semi-desert2626321212251142402131112
Tarim Basin deciduous forests and steppe71925431960
Kazakh steppe283747207662425250010862
Tibetan Plateau alpine steppe4122218214942
Tian Shan montane steppe and meadow3048308153811282923
Central Asian riparian wetland418222852491106355
Rock and Ice00110000
All zones6271540387211035481208341254
Table 6. The monthly dynamics statistics of the Aral Sea and Tengiz Lake.
MonthAral SeaNorth Aral SeaWest Basin East BasinTengiz Lake
SlopeR2SlopeR2SlopeR2SlopeR2SlopeR2
April−1004.100.89 *32.680.77 *−187.080.98 *−849.700.87 *−32.800.67 *
May−1145.830.91 *33.910.73 *−187.250.98 *−992.490.89 *−32.030.66 *
June−1184.490.92 *39.100.75 *−186.780.98 *−1036.810.90 *−29.670.55 *
July−1193.690.92 *39.740.69 *−186.620.97 *−1046.810.90 *−28.180.51 *
August−1156.810.89 *42.020.73 *−186.550.97 *−1012.280.87 *−28.060.48 *
September−1112.190.86 *41.730.72 *−185.630.97 *−968.290.83 *−29.460.46
October−1106.290.85 *39.830.73 *−184.810.97 *−961.310.82 *−29.50 0.45 *
Note: slope: monthly change (km2/year); * significant at p > 0.05.
Publisher’s Note: MDPI stays neutral with regard to jurisdictional claims in published maps and institutional affiliations.

