Article

Dynamics of Vibrio cholerae in a Typical Tropical Lake and Estuarine System: Potential of Remote Sensing for Risk Mapping

by
Abdulaziz Anas
1,2,
Kiran Krishna
1,2,
Syamkumar Vijayakumar
1,
Grinson George
3,
Nandini Menon
4,
Gemma Kulk
5,
Jasmin Chekidhenkuzhiyil
1,
Angelo Ciambelli
5,
Hridya Kuttiyilmemuriyil Vikraman
1,
Balu Tharakan
1,
Abdul Jaleel Koovapurath Useph
1,
Elizabeth Goult
5,
Jithin Vengalil
1,
Trevor Platt
5 and
Shubha Sathyendranath
5,6,*
1
CSIR-National Institute of Oceanography, Regional Centre, Cochin 682018, Kerala, India
2
Academy of Scientific and Innovative Research (AcSIR), Ghaziabad 201002, Uttar Pradesh, India
3
ICAR-Central Marine Fisheries Research Institute, Cochin 682018, Kerala, India
4
Nansen Environmental Research Centre India, KUFOS Amenity Centre, Cochin 682506, Kerala, India
5
Earth Observation Science and Applications Plymouth Marine Laboratory, Plymouth PL1 3DH, UK
6
National Centre for Earth Observation, Plymouth Marine Laboratory, Plymouth Devon PL1 3DH, UK
*
Author to whom correspondence should be addressed.
Submission received: 29 January 2021 / Revised: 1 March 2021 / Accepted: 4 March 2021 / Published: 9 March 2021

Abstract

:
Vibrio cholerae, the bacterium responsible for the disease cholera, is a naturally-occurring bacterium, commonly found in many natural tropical water bodies. In the context of the U.N. Sustainable Development Goals (SDG) targets on health (Goal 3), water quality (Goal 6), life under water (Goal 14), and clean water and sanitation (Goal 6), which aim to “ensure availability and sustainable management of water and sanitation for all”, we investigated the environmental reservoirs of V. cholerae in Vembanad Lake, the largest lake in Kerala (India), where cholera is endemic. The response of environmental reservoirs of V. cholerae to variability in essential climate variables may play a pivotal role in determining the quality of natural water resources, and whether they might be safe for human consumption or not. The hydrodynamics of Vembanad Lake, and the man-made barrier that divides the lake, resulted in spatial and temporal variability in salinity (1–32 psu) and temperature (23 to 36 °C). The higher ends of this salinity and temperature ranges fall outside the preferred growth conditions for V. cholerae reported in the literature. The bacteria were associated with filtered water as well as with phyto- and zooplankton in the lake. Their association with benthic organisms and sediments was poor to nil. The prevalence of high laminarinase and chitinase enzyme expression (more than 50 µgmL−1 min−1) among V. cholerae could underlie their high association with phyto- and zooplankton. Furthermore, the diversity in the phytoplankton community in the lake, with dominance of genera such as Skeletonema sp., Microcystis sp., Aulacoseira sp., and Anabaena sp., which changed with location and season, and associated changes in the zooplankton community, could also have affected the dynamics of the bacteria in the lake. The probability of presence or absence of V. cholerae could be expressed as a function of chlorophyll concentration in the water, which suggests that risk maps for the entire lake can be generated using satellite-derived chlorophyll data. In situ observations and satellite-based extrapolations suggest that the risks from environmental V. cholerae in the lake can be quite high (with probability in the range of 0.5 to 1) everywhere in the lake, but higher values are encountered more frequently in the southern part of the lake. Remote sensing has an important role to play in meeting SDG goals related to health, water quality and life under water, as demonstrated in this example related to cholera.

Graphical Abstract

1. Introduction

The U.N. Sustainable Development Goal (SDG) targets on Health (Goal 3), Water quality (Goal 6), and Life under water (Goal 14) are all relevant to the study of Vibrio cholerae, the causative bacterium responsible for cholera, and which is endemic to many natural bodies of water, especially in tropical regions. Understanding the factors that determine the distribution and growth of V. cholerae in the natural environment is particularly important for SDG 6 (clean water and sanitation), which has the aim to “ensure availability and sustainable management of water and sanitation for all”. Cholera is a water-associated disease with up to four million cases and 143,000 deaths reported worldwide every year [1]. Ecosystem-based strategies, which involve identifying reservoirs and elucidating movements of disease-causing organisms, have been found to be successful for managing public health issues related to cholera [2,3]. More than 200 sero-groups of Vibrio cholerae are known, of which O1 and O139 are associated with seven cholera pandemics [4]. Other strains of V. cholerae can cause gastroenteritis and can enter hosts through oral or wound routes when exposed to contaminated seafood, seawater or freshwater [4]. In fact, there are at least nine Vibrio sp. that are present in coastal waters that can cause gastroenteritis in humans [4]. Pathogenic cholera bacteria are oral-faecal pathogens transported through drinking water and food. Therefore, the infections could be controlled to a large extent by providing safe drinking water and promoting hygiene habits such as washing hands. Although these strategies have helped in reducing the disease incidence considerably in developed countries, the situation is still grave in developing and underdeveloped countries, where safe drinking water is not often available. The diminishing availability of safe drinking water, and the emergence of antibiotic resistance among Vibrio spp. are two of the major hurdles that WHO faces in its efforts to reduce death due to cholera by 90% and eliminate disease transmission by 2030 [5].
V. cholerae belongs to the genus Vibrio that includes many bacterial species found in coastal waters, of which many are pathogenic. The distribution of V. cholerae strains are influenced by unusual weather conditions associated with climate-variability and climate-change; for example, abnormally warm temperatures, torrential rains, and flooding promotes the growth of V. cholerae in coastal waters of tropical countries [2,6,7,8]. The majority of cholera outbreaks start in coastal regions from where they spread inland [4]. Therefore, the efforts focusing on the elimination of Vibrio spp. infection should start with an understanding of the reservoirs of this species in the estuarine and coastal waters, proceeding to formulation of procedures that would reduce the associated risk, leading to plans for mitigation in the event of an outbreak.
However, the ecology of V. cholerae is complex. It is important to understand the factors that affect the survival, growth and dispersion of the bacteria [9]. V. cholerae are a natural part of aquatic ecosystems, and their growth and distribution are known to be affected by temperature, salinity and pH. The bacteria are known to grow in the water, or in association with phyto- or zooplankton, or in sediments. Of the known 206 serotypes of the species, only two (O1 and O139) are known to be responsible for cholera pandemics. Management of cholera pandemics would be more efficient if a forecast system for the presence of V. cholerae in natural aquatic bodies could be developed, based on environmental monitoring of risks. One approach could be to implement in situ observations as the central strategy, but, in the case of cholera, the bacteria reside in multiple coastal reservoirs and enjoy wide distribution. Therefore, in situ observations alone will not suffice and have to be complemented with satellite remote-sensing tools that give synoptic views of the entire water bodies known to harbor the bacteria. However, no direct methods exist to detect V. cholerae using satellite remote sensing, necessitating the use of indirect methods and indices that are in the nascent stages of development [3,8,10].
Vembanad Lake, situated along the southwest coast of India, is an ideal site for studying the reservoirs of this pathogen for the following reasons: (1) Water-associated diseases such as cholera and diarrhoea are endemic to the region, and constitute one of the reasons for significant loss in the number of effective working days per person, annually [11,12]; (2) The lake is partitioned into a northern and a southern region by a man-made barrier, with the waters of the northern region being brackish, and those of the southern region being fresh for most of the year, except during the south west monsoon season when the entire estuary becomes a fresh-water basin; and (3) The lake receives a large quantity of sewage containing pathogenic V. cholerae from nonpoint sources, especially during the monsoon season. These unique features of the lake provide a natural laboratory in which we can study the responses of the bacteria to changing environmental conditions and anthropogenic degradation of the ecosystem. In this study, we investigated the association of V. cholerae with phyto- and zooplankton, benthic organisms and sediments in the lake, with regular sampling at ~20-days interval, over a year. We also conducted in vitro laboratory experiments to examine their growth at various salinities and their interactions with plankton and benthic organisms. Based on these observations, we explored the possibility of monitoring V. cholerae in the Vembanad Lake remotely, using proxies applied to satellite ocean-colour data.

2. Methodology

2.1. Sample Collection and Preservation

Water, plankton and sediment samples were collected from thirteen locations (first six (stations 1–6) in the brackish-water region, and the remaining seven (stations 7–13) in the fresh-water regions of the lake, at an interval of ~20 days from April 2018 to May 2019 (Figure 1). The wet seasons of the year, viz., south-west monsoon (June–September) and north-east monsoon (October–November) were combined and addressed as the wet season in the present study. Likewise, winter (December–February) and spring inter-monsoon (March–May) were jointly treated as the dry season.
The salinity and temperature of the water column were measured using sensors attached to a Conductivity, Temperature and Depth (CTD) rosette. The water samples were taken using a 5 L capacity Niskin water sampler (General Oceanics, Miami, FL, USA). Sub-samples for microbiological analyses (250 mL) were transferred aseptically to a sterile polypropylene bottle and transported to the laboratory in an ice-chest for further analysis. Samples for micro-phytoplankton analyses were collected separately by filtering 50 L of surface water through 10 µm pore size bolting silk mesh. The phytoplankton collected on the net were washed with lake-water, transferred to a bottle, fixed with 3% neutralized formaldehyde or Lugol’s iodine solution, and transported to the laboratory for further analyses. Zooplankton samples were collected by horizontal (in shallow waters) or oblique (in deep waters) hauls of 10-min duration using a bongo net (200 µm pore size nylon mesh), fitted with a flow meter. Collected samples were fixed with 4–5% buffered formaldehyde. Sediment samples were collected using a VanVeen Grab (Hydro-Bios, Altenholz, Germany) with a bite area of 0.04 m2. Sub-samples (~100 g) for microbiological analyses were removed aseptically into a sterile polypropylene bottle and the remaining sub-samples were used for analyzing the macrobenthos.

2.2. Enumeration of Phytoplankton, Zooplankton and Macrobenthos

Micro-phytoplankton composition and abundance were analysed using a CX21i model trinocular compound microscope (Olympus, Tokyo, Japan). The samples were sorted into major taxonomic groups and enumerated using a S52 Sedgewick-Rafter chamber (Sree Analytical Inc., Hyderabad, India) with a volume of 1 mL in triplicates [13]. Micro-phytoplankton genera were enumerated using standard identification keys [14,15,16]. Abundance of micro-phytoplankton was expressed as number m−3. A known volume of water sample collected from each station was filtered through pre-weighed GF/F filter paper (0.45 µm pore size) of 47 mm size, and the chlorophyll extracted with 90% acetone for 24 h was measured spectrophotometrically, following standard protocols [17].
Micro-zooplankton biomass was estimated by volumetric method, and their groups were enumerated using standard identification keys [18,19]. Abundance of micro-zooplankton was expressed as number m−3. Sediment samples placed over a 300 µm mesh sieve were washed onboard with gently flowing water, and the retained sediments, along with organisms, were preserved in 5% formalin for studying the macrofauna. Samples for analysis of macrofauna were sorted into major taxonomic groups (e.g., polychaetes, crustaceans, mollusks) and enumerated using stereo-zoom microscopes. Abundance of macrobenthic fauna was expressed as number m−2. The dominant groups of phyto- and zooplankton and macro-benthic fauna contributing up to 90% of the total population were calculated using the dominance plot in Primer 6 software (Plymouth Marine Laboratory, Plymouth, UK)

2.3. Remote Sensing Observations

Lake Surface Water Temperature (LSWT) data for the Vembanad Lake between April 2018 and May 2019 were downloaded from the Copernicus Global Land Service (https://land.copernicus.eu/global/products/lswt; accessed on 3 July 2019). The service provides a Near Real Time level-3 dataset of 1 km, 10-day averaged LSWT from the SLSTR instrument on Sentinel-3A from April 2018-present [20,21]. The data were converted from degree Fahrenheit to degree Celsius, and the mean temperature for the Vembanad Lake for each 10-day period was calculated using all available data.
Sentinel-2A and -2B Multispectral Imager (MSI) images during April 2018 to May 2019 for the lake were downloaded from the Copernicus Open Access Hub (https://scihub.copernicus.eu; accessed on 3 June 2019). Level-1C products were processed at 10–20 m spatial resolution using ACOLITE, a processor developed for analysis of coastal and inland-water data from Landsat and Sentinel-2 imagery (version 20190326; https://odnature.naturalsciences.be/remsem/software-and-data/acolite; accessed on 4 April 2019). ACOLITE was applied with the dark spectrum fitting approach to perform the atmospheric correction [22,23], and chlorophyll-a concentrations (mg m−3) were calculated using the Ocean Chlorophyll 2-band algorithm (OC2v2; [24] based on the blue (443 nm) and green (561 nm) spectral reflectance and algorithm parameters specific to Landsat-8 and Sentinel-2 sensors (a0 = 0.1977, a1 = −1.8117, a2 = 1.9743, a3 = −2.5635, a4 = −0.7218) [22,25].

2.4. Enumeration of Vibrio cholerae

Filtered water samples (10 mL passed through a 3 µm pore size filter), phytoplankton (collected on filter paper), zooplankton (10 g), macrobenthic fauna (10 g) and sediment (10 g) were enriched separately in alkaline peptone water (90 mL) and kept overnight at 28 ºC in an incubator shaker maintained at 100 rpm. The cell lysate was then prepared from the enrichment broth by boiling [26], and then directly used as the source of DNA template for the screening for the V. cholerae outer membrane protein (Omp) gene using the primer sets of OmpF: 5′CACCAAGAAGGTGACTTTATTGTG3′ and OmpR: 5′GAACTTATAACCACCCGCG’ [27]. The Omp-positive samples were further tested for the presence of the 300 bp size fraction of the genetic element of cholera toxin (ctx) using the forward (ctxAF: 5′AACTCAGACGGGATTTGTTAGGC3′) and reverse (ctxAR: 5′TCTCTGTAGCCCCTATTACGATGT3′) primers specific for the gene of pathogenic V. cholerae [28]. The PCR reaction mixture consisted of EmeraldAmp GT PCR master mix (2X) (Takara, Otsu, Japan), forward and reverse primers (10 pmol µL−1 each) and 1 µL of the crude DNA template. The reaction was performed in a Takara thermal cycler with the following temperature and cycling conditions: initial denaturation (95 °C for 2 min), followed by cycle denaturation (at 94 °C for 30 s), annealing (for 30 s at 60 °C and 58 °C for Omp and ctx gene, respectively), extension (at 72 °C for 45 s) for a total of 30 cycles and a final extension for 5 min at 72 °C. The PCR products were loaded onto agarose gel (1%) impregnated with ethidium bromide; electrophoresis was carried out with 1 × TAE buffer and the result was visualized using a gel documentation system (BioRad, Hercules, CA, USA).

2.5. Salinity Tolerance of V. cholerae

The growth of pathogenic V. cholerae isolated from clinical samples during the 2016 cholera outbreak in Kerala in different salinities (0, 10, 20 and 30 psu) was monitored at four-hour intervals for 24 h. Samples of V. cholerae (1 mL each) grown overnight were inoculated in separate tubes containing an alkaline peptone broth (14 mL). Separate tubes were maintained in triplicate for different salinities and incubation times (0, 4, 8, 12, 16, 20 and 24 h). DNA was extracted from each tube designated for different salinities and time intervals, following the chloroform-isoamyl alcohol method. The concentration of DNA was adjusted to 10 ng µL−1 and was subjected for quantification of 16S rRNA gene (specific to Vibrio sp.) using absolute quantitative real-time PCR technique in a Roche Lightcycler 96- well real-time PCR system (Roche, Rotkreuz, Switzerland) following SyBr green technique. The 10 µL real-time PCR reaction mixture contained 1 µL template DNA and 5 µL of ready-to-use SyBr mix supplemented with 3 µL milliQ water and 0.5 µL each of forward (GGCGTAAAGCGCATGCAGGT3′) and reverse (GAAATTCTACCCCCCTCTACAG3′) primers. The qRT-PCR was initiated by maintaining the tube at 95 °C for 10 min, followed by 40 cycles at 95 °C for 10 s, 60 °C for 10 s, and 72 °C for 10 s. The dissociation (melt curve) analysis of amplified products was performed at the end of each cycle to confirm the amplification and detection of confirmed PCR product. Plasmid DNA standard curve equations were used to calculate the absolute copy number of the gene in the samples. Technical and experimental triplicates were maintained for each experiment. The absolute quantification data obtained was analysed with the Roche Lightcycler 96 software (Roche Life Science, Penzberg, Germany) and expressed as copy number per nanogram of DNA.

2.6. In Vitro Testing of Chitinase and Laminarinase Activities of V. cholerae

The chitinase and laminarinase activities of 96 isolates of environmental V. cholerae from the coastal waters of India, isolated previously as part of the Seawater Quality Monitoring Programme (SWQM) of the Ministry of Earth Sciences (MoES), and maintained at Marine Microbial Reference Facility (CSIR-National Institute of Oceanography, Regional Centre Kochi, India), were studied using standard spectrophotometric assays. One hundred microlitres of overnight-grown isolates were inoculated into conical flasks of 50 mL capacity, containing 25 mL of Zobell marine broth. Separate flasks supplemented with 1% substrate of colloidal chitin or laminarin were maintained. The flasks were incubated at 28 ± 2 °C at 120 rpm for 48 h. The supernatants separated by centrifugation at 5000 rpm for 10 min at 4 °C were stored at 4°C for further use as the crude enzyme. Enzyme assays were done in triplicate in 96-well microplates. Chitinase and laminarinase were assayed following the DNS assay [29]. Briefly, 50 µL of the substrate (0.25% w/v) was mixed with 50 µL crude enzymes in a microwell plate and incubated at 28 ± 2 °C for 2 h. Subsequently, 100 µL of 3,5-dinitrosalicylic acid (DNS) reagent (1% DNS prepared in a solution containing 0.5 N NaOH and 30% sodium potassium tartrate) was added and incubated at 95 °C for 5 min followed by cooling for 2 min in ice. DNS reacts with reduced sugar to give a yellow-coloured complex, whose absorbance was measured at 540 nm. Chitinase and laminarinase activities were expressed as µg ml−1 min−1 of glucose released. Standard calibration graphs were prepared from absorbance of different concentrations of glucose (50, 100, 150, 200, 250, 300, 350, 400, 450 and 500 µg mL−1) which had reacted with 100 µL DNS reagent.

3. Results

3.1. Salinity

Vembanad Lake shows a dynamic range in salinity from 0 to 32 psu (Figure 2A). The lowest salinity occurred during the southwest monsoon (June-September), with salinity equal to or close to zero being maintained for a longer duration in the fresh-water region of the lake than in the brackish-water region. The highest salinity of 32 psu occurred in the dry summer (March–May) at some stations in the brackish-water region, but the salinity remained below 13 psu in the fresh-water region even during this time.
Growth experiments in the laboratory (Figure 2B) showed a reduction in the growth of V. cholerae with increasing salinities. The growth was comparable for all salinities during the initial 20 h and preference to different salinities became evident in the last four hours (Figure 2B).

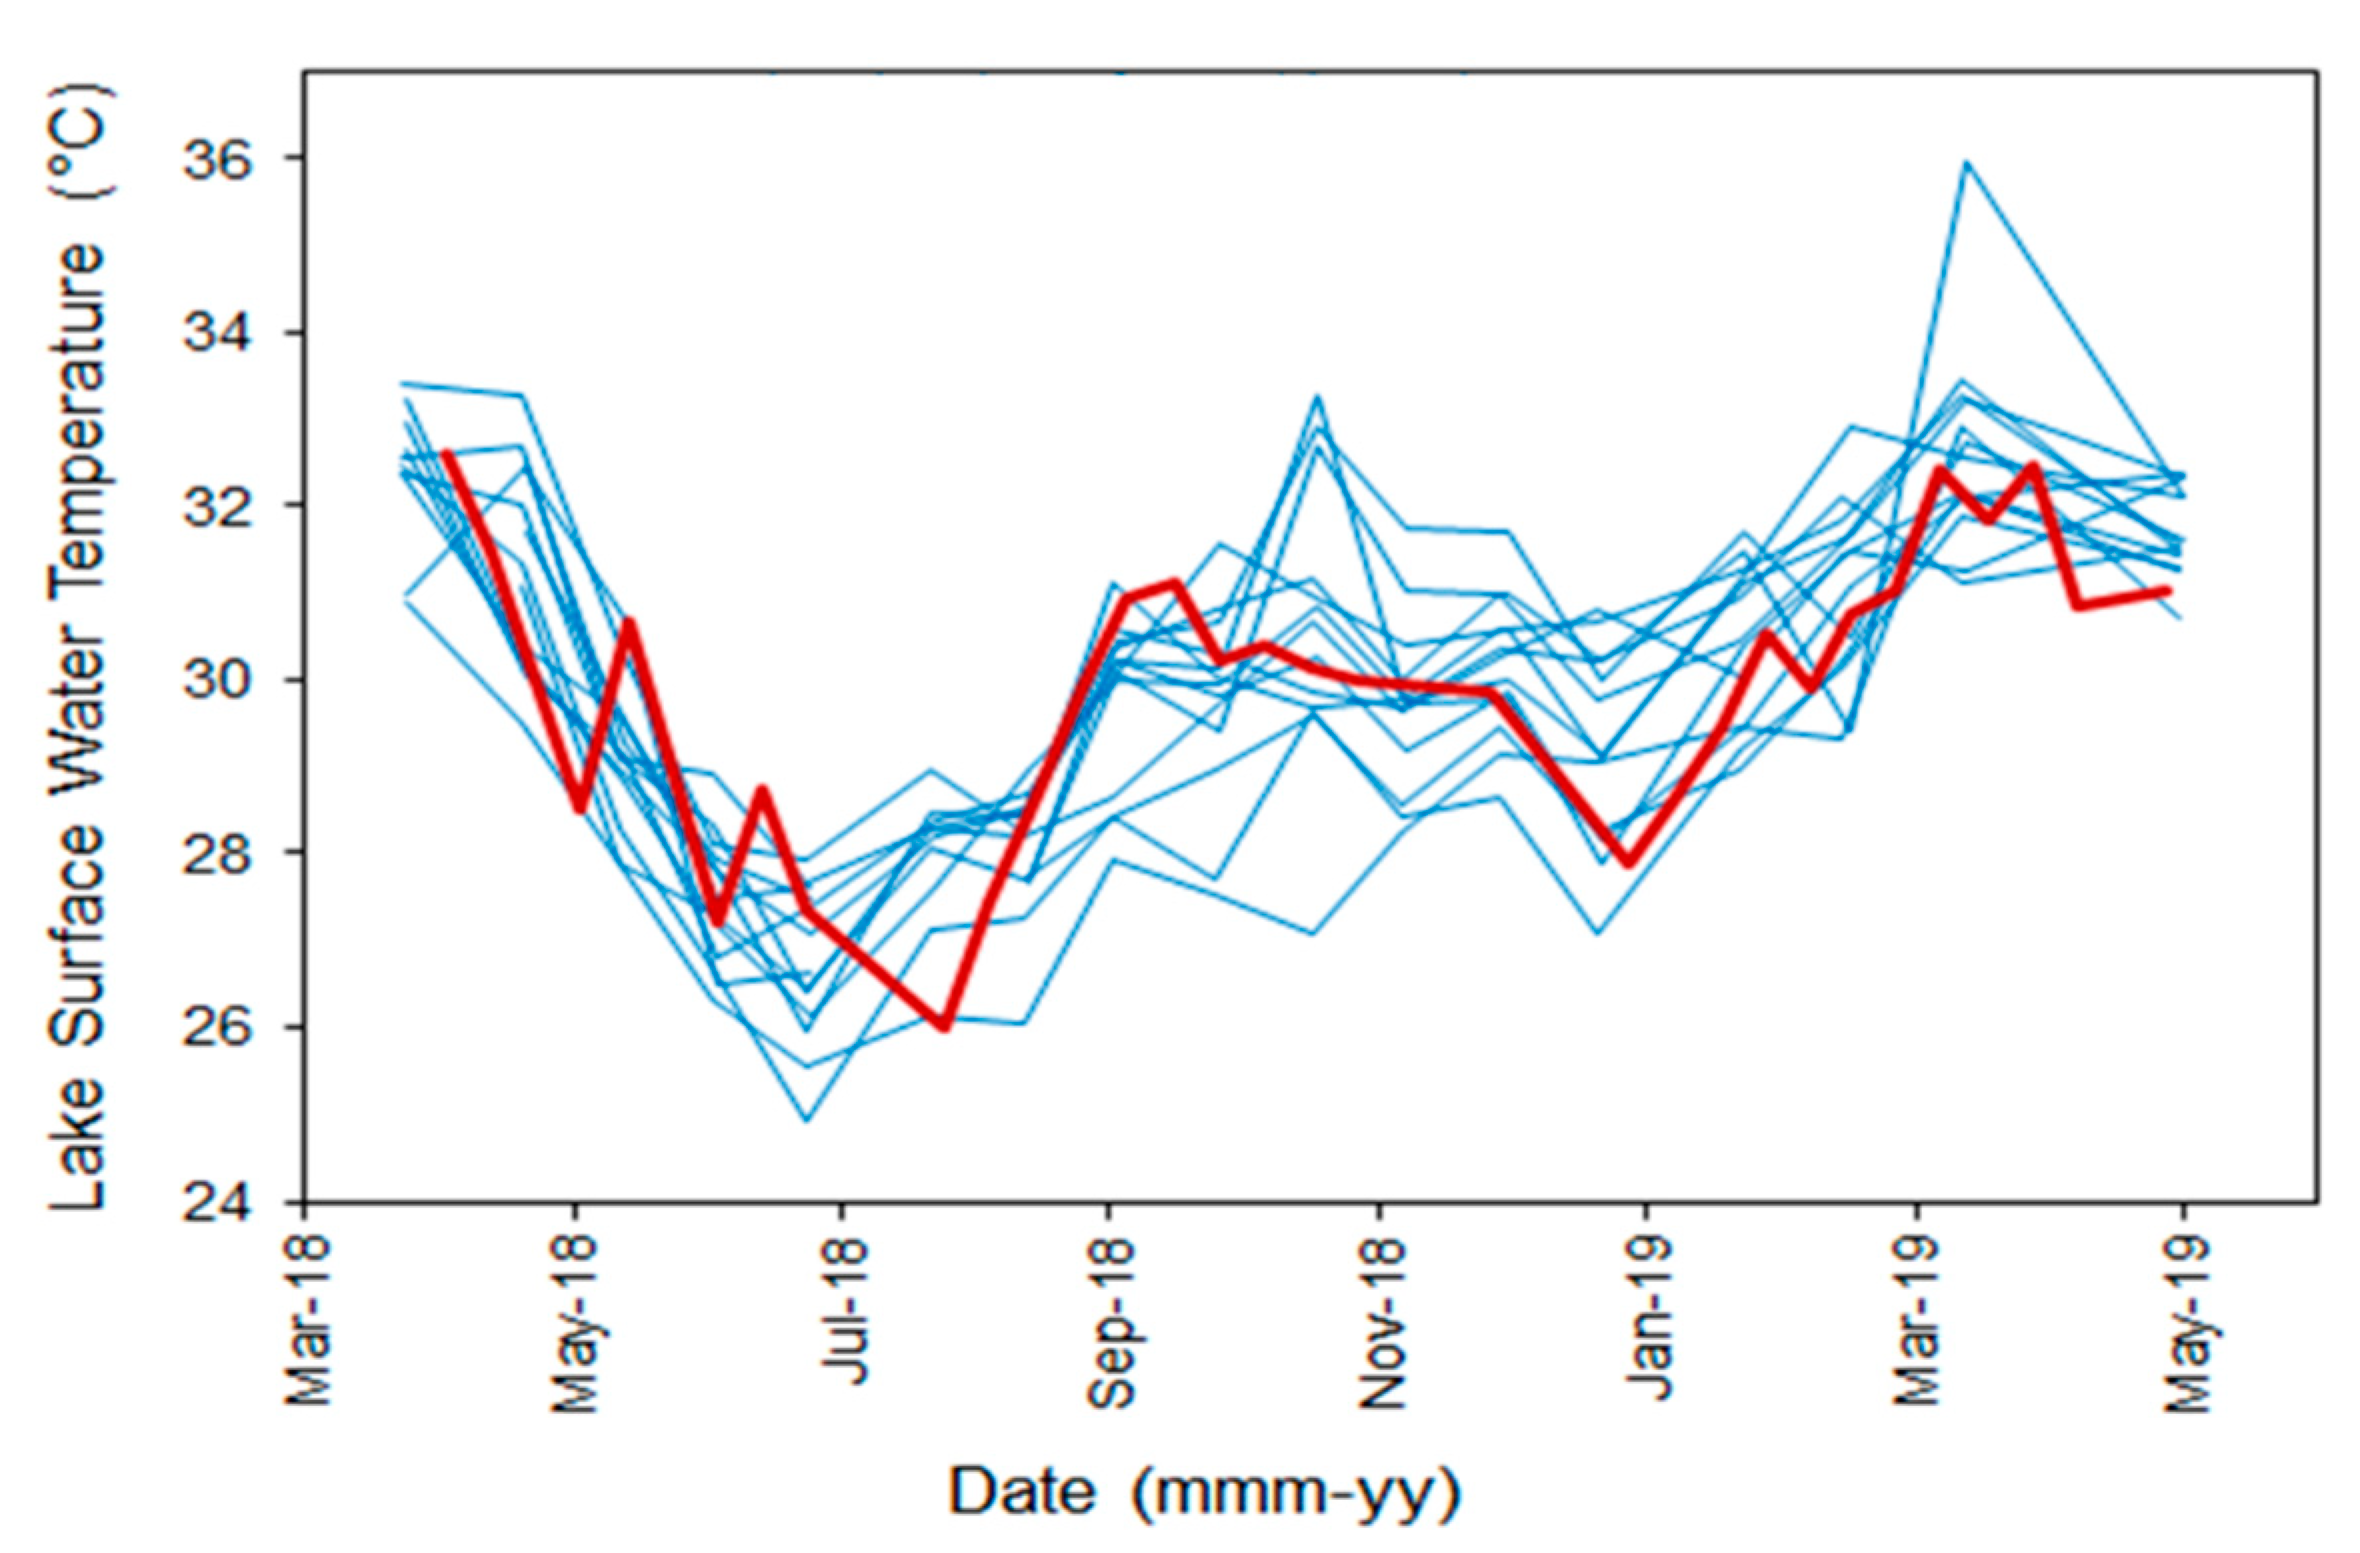
3.2. Surface Water Temperature

Temperature of the surface water in the entire lake varied between 23 °C in the wet season and 36 °C in the dry season during the study (Figure 3). The temperature drops rapidly from maximum in May to minimum in July, and progressively climbs back to the maximum. The difference in surface temperature between the brackish and freshwater regions was low (less than 0.6 °C). The mean surface temperature of the lake estimated from satellite remote sensing showed a pattern similar to in situ observations.

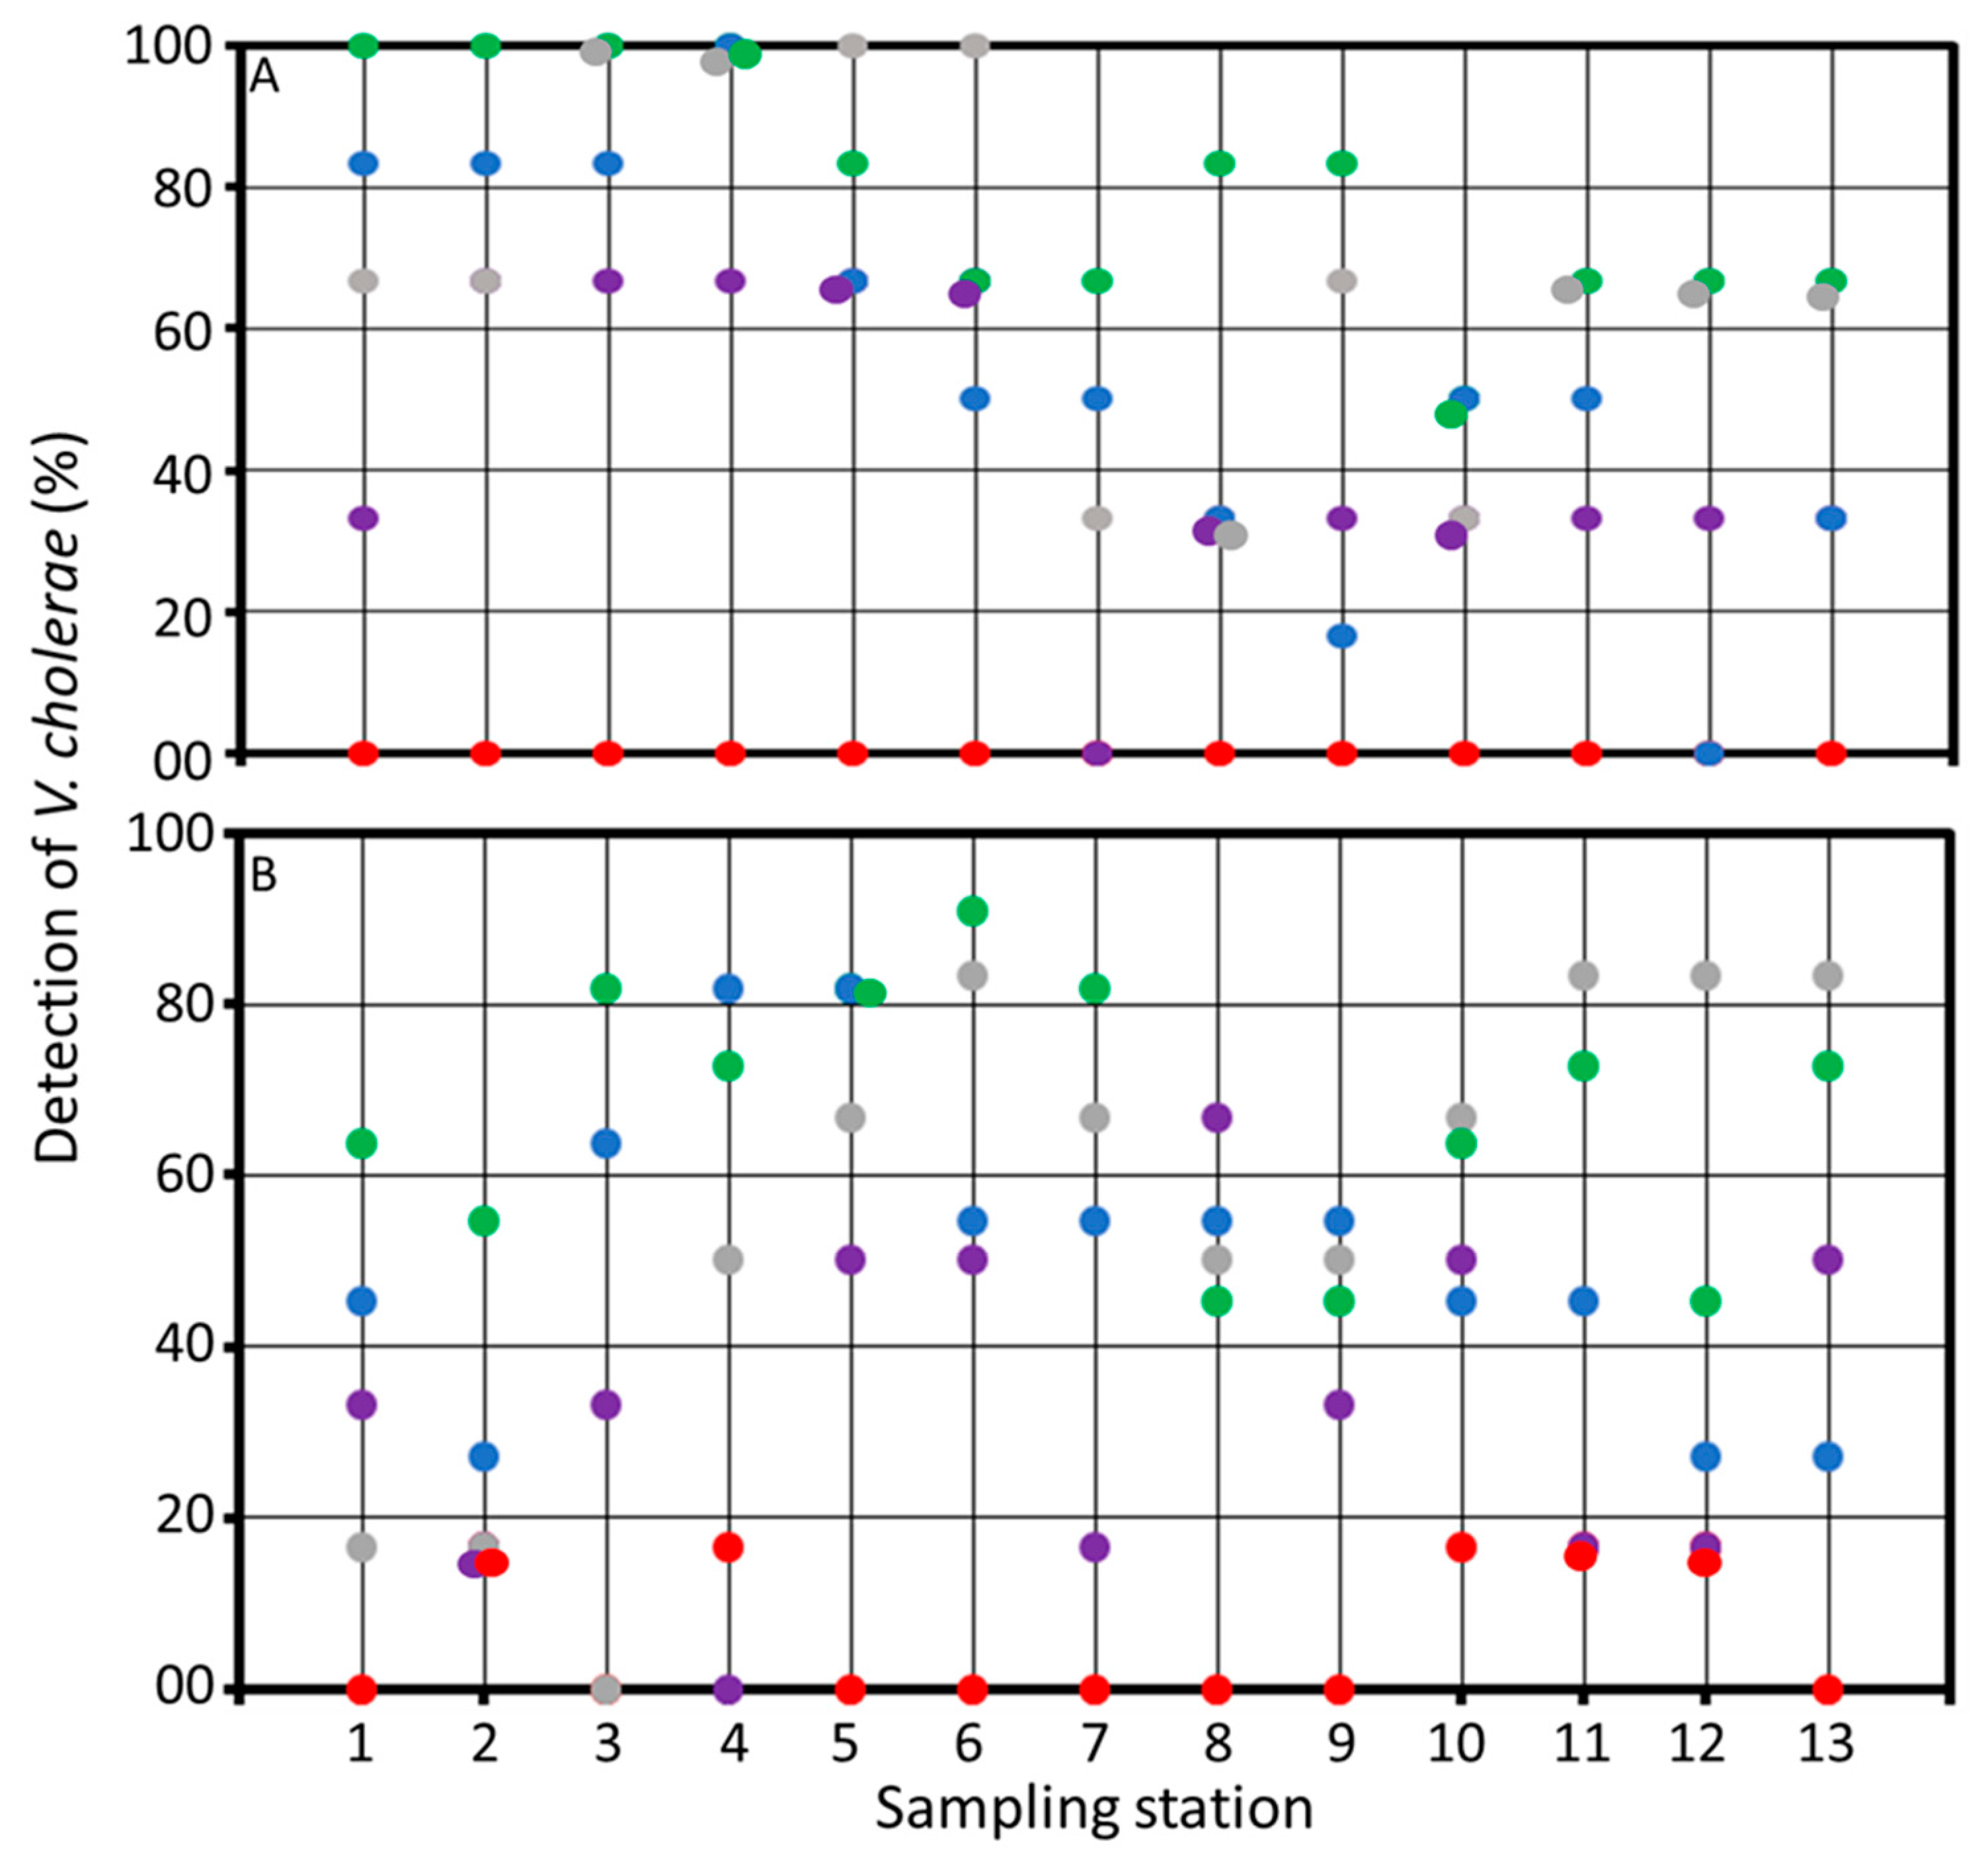
3.3. Environmental Reservoirs of Vibrio cholerae

The PCR screening of samples for the 588 bp size fraction of Omp gene amplified using the forward (OmpF) and reverse (OmpR) primers showed widespread presence of environmental V. cholerae in association with water, micro-phytoplankton, micro-zooplankton and macrobenthos, but their association with the sediment samples was poor to nil (Figure 4). V. cholerae was found more frequently in the water column of the brackish-water region when compared with the freshwater region, during both wet and dry seasons (Figure 4). During the wet season, more than 80% of filtered water from the stations near the bar-mouth (stations 1, 2 and 3) showed the presence of V. cholerae, whose presence decreased towards station 13. V. cholerae was found to be more scattered over the whole lake during summer, with no clear spatial pattern. Interestingly, the filtered water samples of stations 1, 2, 4 and 5 collected during the monsoon, which were Omp gene positive, also showed positive reactions to ctx gene in the PCR.
Phytoplankton emerged as the preferred hosts of environmental V. cholerae throughout the lake (Figure 4). During the wet season, V. cholerae was present in more than 60% of the phytoplankton collected from both brackish and freshwater regions, with those collected near the bar-mouth (i.e., in the vicinity of the industrial city of Cochin, stations 1–4) showing V. cholerae presence in 100% of the samples. Note that these observations were consistent with the laboratory results (Figure 2B) which showed enhanced growth of V. cholerae in low salinity. Furthermore, the phytoplankton collected from stations 4, 5 and 8 during the wet season, which had V. cholerae positive to the Omp gene, also showed the presence of ctx gene. V. cholerae was detected in >80% of phytoplankton samples collected from stations 3, 5–7, 60–80% of samples from stations 1, 4, 10, 11, and 13 and 40–60% of samples from the remaining stations. Association of V. cholerae with phytoplankton remained high during the dry season (always higher than 40%) but was less than in the wet season.
During the wet season, the zooplankton-associated V. cholerae was observed in all samples collected from stations 3–6, 60–80% of samples from stations 1, 2, 9 and 11–13 and <40% of samples from stations 7 and 10 (Figure 4). This pattern changed during the dry season, where >80% of zooplankton from stations 6 and 11–13, 60–80% from stations 5, 7 and 10, and 40–60% from stations 4,8 and 9 showed association with V. cholerae. Zooplankton associated with V. cholerae reduced markedly to 20% of samples at stations 1, 2 and 3 during the dry summer season.
Association of V. cholerae with sediment was low in the entire Vembanad Lake and was detected in only less than 20% of samples collected from stations 4 and 10 (Figure 4). On the other hand, V. cholerae was present in association with macrobenthos in more stations, especially during summer. The association of V. cholerae with macrobenthos from stations 2–6 was high during the wet season and low during the dry season (Figure 4). The association between macrobenthos and V. cholerae was less prevalent (<40% of samples) in the fresh-water region during both wet and dry seasons, with the exception of stations 10 and 13 during the dry season.
In vitro laboratory studies on isolates of environmental V. cholerae from the study area showed laminarinase and chitinase activities of more than 50 µgmL−1min−1 among 75% of isolates (Supplementary Figure S1). Nearly 50 % of the isolates had activities above 100 µgmL−1min−1.

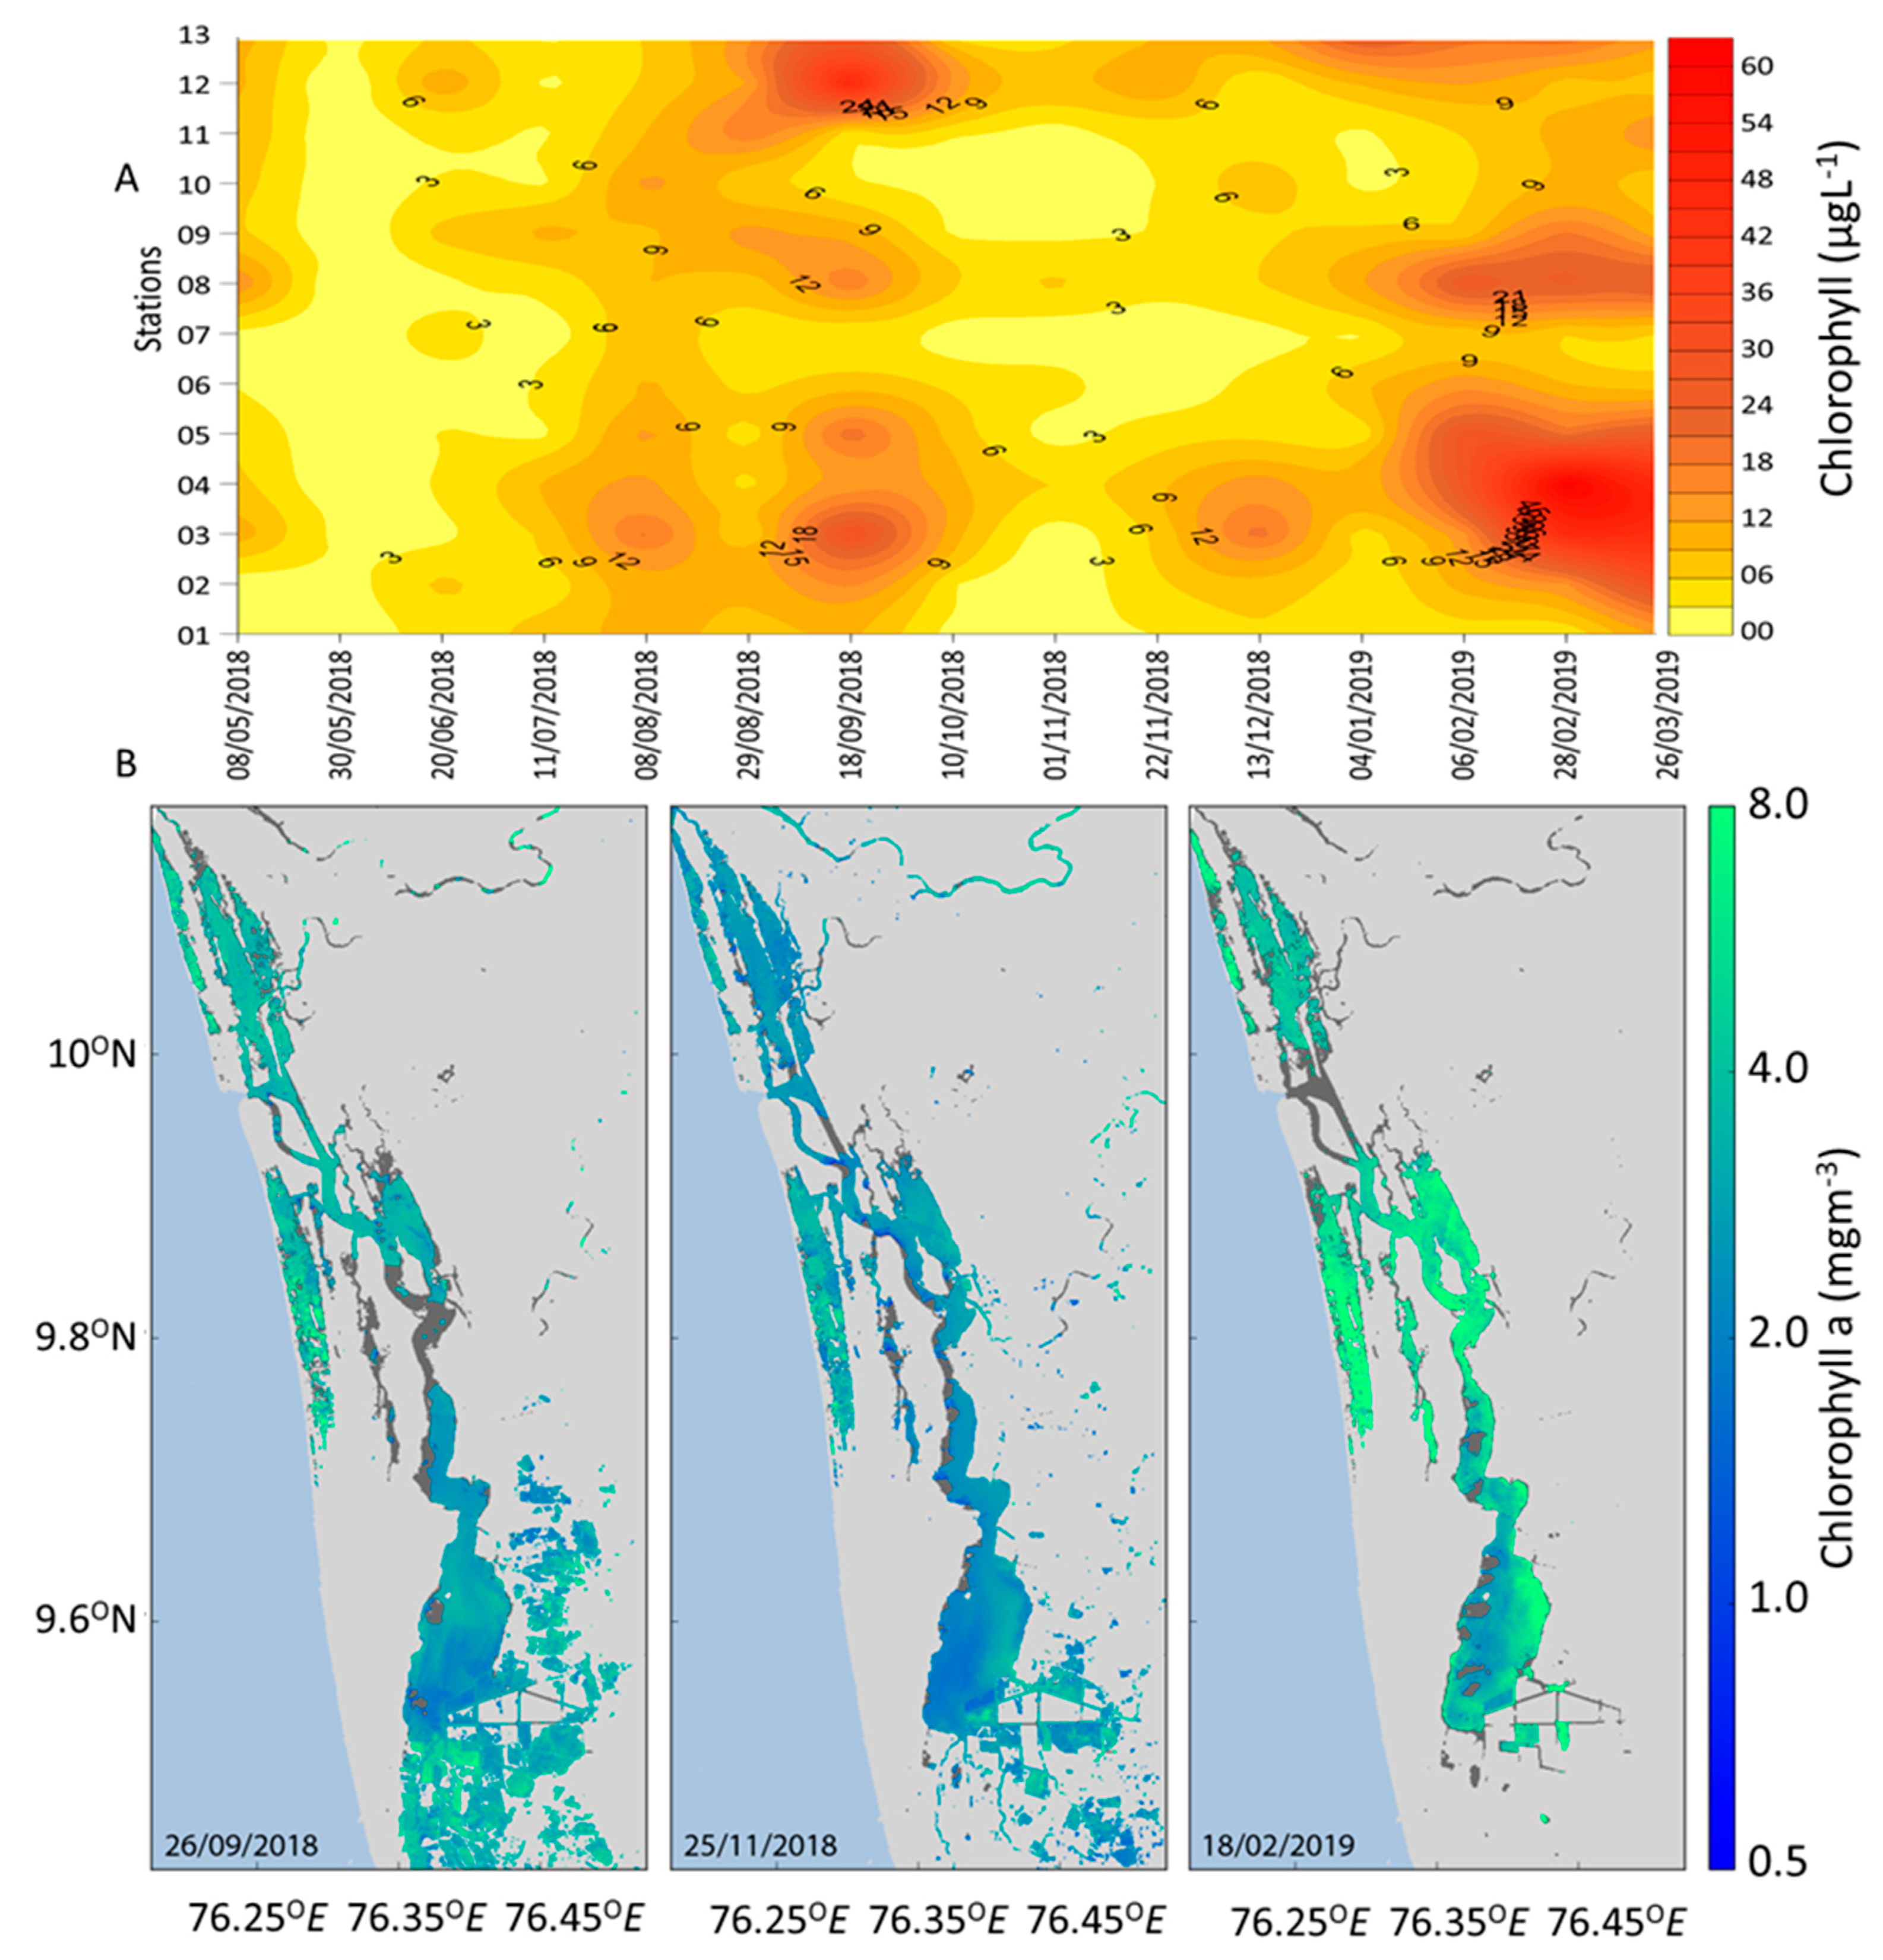
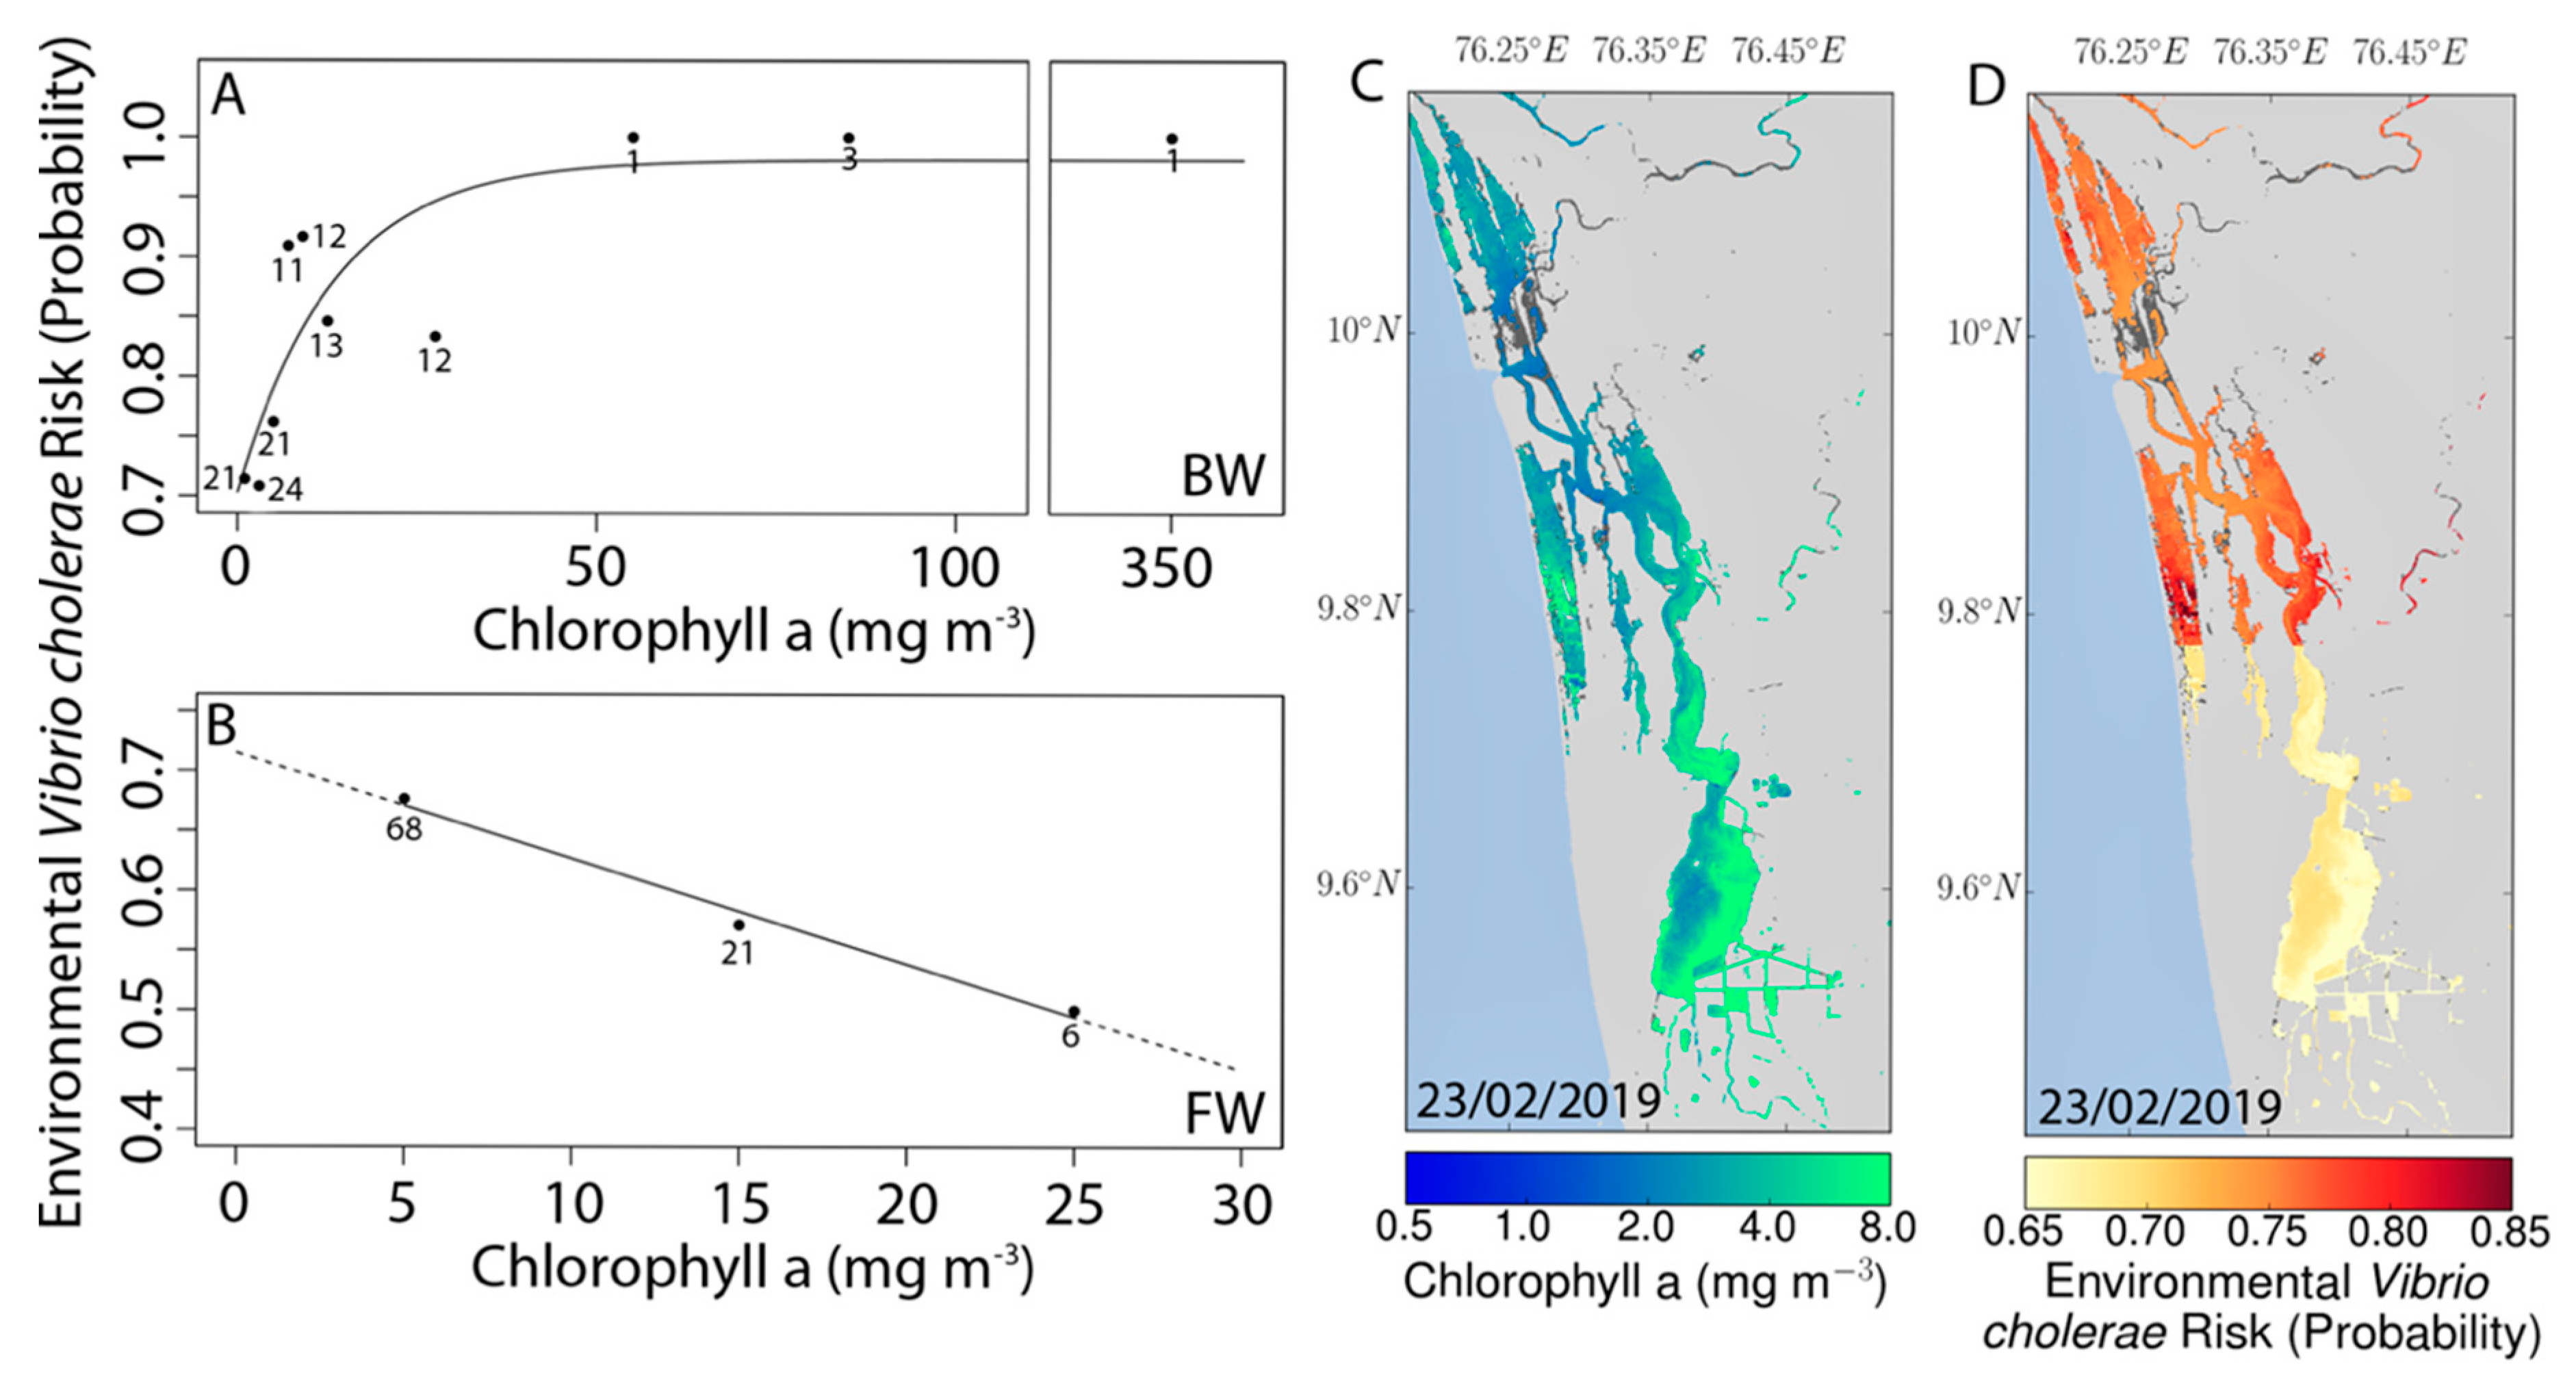
3.4. Remote Sensing and Risk Mapping

Because of the high association of V. cholerae with phytoplankton, we examined more closely the quantitative relationship between phytoplankton in the lake, using chlorophyll concentration as the measure of phytoplankton biomass, and the risk of environmental cholera bacteria in the water. Field measurements of chlorophyll concentration in the brackish-water region were high, with occasional incidences of algal blooms (Figure 5A). The chlorophyll concentration in the lake was between 3 and 12 µg L−1 in most of the samples but exceeded 20 µg L−1 during bloom situations. The chlorophyll concentration was at its lowest in May and November, and highest in February in the northern, brackish region of the lake. Representative satellite images (Figure 5B) also showed these patterns.
To convert the association between chlorophyll concentration and environmental cholera bacteria into a quantitative relationship, the total range of in situ chlorophyll data from each of the two regions of the lake were partitioned into a number of subsets (statistical class intervals) of varying widths (smaller class intervals were used when more observations were available in that sub-range). Then for each class interval in chlorophyll concentration, we counted the number of positive CPR (Omp) associated with phytoplankton and divided it by the total number of samples in that class interval, to obtain a probability that phytoplankton were positively associated with V. cholerae in that class interval of chlorophyll. The probability in each class interval was then plotted against the chlorophyll at the mid-point of that class interval for the brackish water (Figure 6A) and fresh-water (Figure 6B) regions. Note that the relationship is a positive, saturating one for the brackish-water region (Figure 6A), but linear and negative for the fresh-water (Figure 6B). The numbers against each point in the graph represent the number of observations that were used to calculate the probability.
Clear patterns emerged only when broad class intervals were used. The limitation was that some class intervals had only a few observations, and were as low as a single value for two points in Figure 6A, with chlorophyll-a concentrations greater than 70 mg m−3. However, those two points are consistent with their nearest neighbouring point on the chlorophyll axis, which is representative of 3 points. All five of these high-chlorophyll points were associated with environmental V. cholerae. Smooth functions were then fitted to the two sets of data. Because the number of samples is low in some of the class intervals, the results are quite vulnerable to outliers. The fitted relationships for the northern part of the lake shown in the figure:
P ( b ) = 0.28   ( ± 0.07 ) × ( 1 e ( 0.076   ( ± 0.047 × B ) ) + 0.70 ( ± 0.065 )
where P represents the probability that environmental cholera is present in the water, b represents brackish-water region of the lake, and B is the in situ phytoplankton biomass expressed as chlorophyll concentration (mgm−3). The uncertainties are provided as ± standard error. The relationship for the southern fresh-water (f) region is given by:
P ( f ) =   0.0088   ( ± 0.00097 ) × B + 0.7150 ( ± 0.017 )    
We note that Equation (1) (Figure 6A) is influenced strongly by five observations with chlorophyll concentrations greater than 50 mgm−3. However, we could not find any reason to suspect these concentrations. Replicates were consistent with each other for those samples, corresponding phytoplankton absorption measurements (not shown) were also unusually high, and the three class intervals are consistent with each other. In dealing with the southern part of the lake (Equation (2)), one outlier—a single observation with a very high chlorophyll-a value, with double the value of the closest observation—was omitted. The fit to the northern part of the lake is based on 129 paired observations of chlorophyll-a and V. cholerae presence/absence, binned into 10 class intervals in chlorophyll-a. The fit to the southern part is based on 107 paired observations in four class intervals, after omitting the one outlier. Because chlorophyll concentration is amenable to remote sensing, these relationships can be used to convert chlorophyll data from satellites (Figure 6C) to risk maps (probability that environmental V. cholerae bacteria are present in the water) for environmental cholera bacteria (Figure 6D). The contrast in the results between brackish and freshwater regions is interesting and could not be explained on the basis of temperature or salinity: The north-south differences were also apparent when the risk from environmental cholera was plotted against temperature or salinity (figure not shown). On the other hand, these differences may be related to differences in phytoplankton community composition, which is examined next.
Skeletonema (26.3%) and Microcystis (28.3%) were the dominant genera of micro-phytoplankton in the brackish and freshwater regions of the lake respectively during the dry summer season (Figure 7). During this season, three genera (Skeletonema (26.3%), Aulacoseira (18.3%), and Anabaena (15.8%)) and two genera (Microcystis (28.3%) and Aulacoseira (22.1%)) constituted more than 50% of the community cell abundance in the brackish-water and fresh-water regions respectively. Such dominance by a couple of genera was not evident during the wet season (Figure 7). Differences in community structure were also observed for macro-zooplankton and macro-benthos (Supplementary Figure S2) between the northern and southern parts of the lake and between the wet and dry seasons.

4. Discussion

The incidence of cholera and the presence of its causative organism, V. cholerae, have been reported historically from coastal regions of the Indian Ocean [3,30,31,32]. In the Vembanad Lake, the environmental V. cholerae was most abundant in the water column of the brackish water region during the monsoon (wet season), when the entire lake, including the brackish water region, turns limnetic. The huge volume of freshwater from six major rivers discharging into the lake, coupled with the 2018 floods that were labelled as the worst deluge of the century, increased the freshwater impact on the lake during the wet season. An area of almost 15,000 km2 drains into the lake [33], and the biggest city of Kerala, Kochi, on the northern banks of Vembanad Lake, is home to almost 700,000 people, with a population density of 7100 km−2. Bacterial pollution from land drainage was evident from the presence of clinically pathogenic, i.e., ctx positive, V. cholerae in the water samples collected from stations 1 to 4 during the study. Laboratory experiments reported here (Figure 2B) and previous studies indicate that salinities less than 20 psu are favourable for the growth of V. cholerae [34]. So, both the enhanced drainage of infected water into the lake, combined with low salinities, would have favoured the proliferation of V. cholerae during the wet season. On the other hand, the enhanced inflow of river water and land drainage would also have increased the flushing rate of the lake during this season, allowing the polluted waters to be flushed out to the coastal waters sooner than during the dry summer months.
Several previous studies have reported that temperatures within the range from 10 to 30 °C are suitable for V. cholerae [35,36]. The water temperatures observed in the lake, both from in situ and satellite measurements, stayed consistently high, in the range 26–36 °C, though the average surface temperatures for the lake rarely go above 32 °C (Figure 3), suggesting that warmer temperatures are probably short-lived and highly localised. While it appears reasonable to suppose that the lake temperatures, when less than 30 °C, would favour survival and growth of V. cholerae, we do not know whether heat waves of higher temperatures, even if sporadic, might serve to control the bacterial population. Materna et al. [37], studying the fundamental niche (without interference from other organisms, Hutchinson [38]) of a V. cholera strain isolated from a patient in Bangladesh, reported a “maximum permissible temperature” of 41 °C and an optimal temperature of 28.3 °C from laboratory experiments in which the bacteria were subjected to a range of temperatures and salinities. However, as noted by Takemura et al. [39], the fundamental niche of an organism might have a broader range than its realized niche in the field. Their compilation of field observations (Figure 5 in Takemura et al. [39]) suggests that temperatures higher than 30 °C might have an inhibitory effect on V. cholerae. It has been suggested that higher water temperatures under climate change would favour the growth of V. cholerae and their migration into new geographic areas in temperate waters, leading in turn to higher reported cases of associated diseases (e.g., [40,41]). But what would happen when the water temperatures rise above the optimal temperatures for the bacteria, as seems to be happening in the Vembanad Lake? Because of the reported differences between realised niches and fundamental niches, temperature-controlled laboratory experiments on strains of V. cholerae isolated from the lake may not be sufficient to answer this question. Continued monitoring of the lake, especially in extreme temperatures, has to be considered as well. The results would have broader applications than just for Vembanad Lake.
Climate change and associated variations in precipitation, temperature and other drivers might also increase the incidence of cholera across the globe in the future [41,42]. In fact, extreme weather, such as heavy freshwater influx due to the once-in-a-century floods in Kerala, and water temperature >32 °C in the dry season, occurred during our study period. The existence of warm temperature and moderate to low salinity in the lake for a significant portion of the year, combined with a supply of polluted water, both through river discharge or through land drainage, is conducive to the proliferation of the pathogen. An important question, for lakes such as the Vembanad Lake, is whether such incidences of extreme weather might become more frequent in the future under various climate-change scenarios, and whether they would materially change the threat from V. cholerae in the lake.
Pandemics of cholera are associated with clinically pathogenic strains of V. cholerae (i.e., ctx positive), and this strain was detected at stations 1 to 4 during the wet season. This could be due to leakage from ill-equipped sewage treatment plants in the city of Kochi on the banks of the lake, or due to mixing of septic sewage and lake water during the floods [43]. Such a possibility, if proven, points to a possible human-to-water pathway for the pathogenic bacteria, and to the possibility that the local population are carriers of the pathogen, even when there are no reported cases of cholera in the region. In fact, Kanungo et al. [44] pointed out that “notification of cholera cases in India is extremely deficient”. Finkeletein [45] also noted that the bacteria might survive during the intervening periods between epidemics through undiagnosed, transiently-infected, asymptomatic people. Another route of survival is through association with aquatic organisms such as phyto- and zooplankton. Further clinical studies are required to identify the sources of pathogenic V. cholerae in the waters of Vembanad Lake. Eradication of cholera associated with the lake would then follow a four-step procedure: First, increase testing and treatment to eliminate the infections in the local population; second, improve sewage treatment to eliminate the supply of pathogenic bacteria in the waters of the lake and rivers; and third, improve our understanding of the association of the bacteria with the life forms in the water to generate reliable risk maps, and engage with the policy makers, stakeholders and local population to facilitate evidence-based decision making processes.
Phytoplankton in the Vembanad Lake were found to be the preferred hosts of environmental V. cholerae, with zooplankton also showing high association with the bacteria. The in vitro experiments conducted on nearly 100 isolates of environmental V. cholerae from the lake showed that majority of the isolates had high (i.e., > 50 µgmL−1min−1) laminarinase and chitinase activities. These enzyme activities suggest that laminarin, which is a storage glucan, or chitin in the cell wall of certain types of plankton could explain why V. cholerae are attracted to them [46,47,48]. The attachment of V. cholerae to phyto- or zoo-plankton or benthic organisms in the aquatic environment also affects their ability to participate in nutrient cycling, particularly the utilization of laminarin and chitin biopolymers [3]. V. cholerae is now recognized as an important player in the aquatic carbon cycle [49]. Interestingly, the relationship between chlorophyll and environmental V. cholerae in the water changed in a marked fashion between the brackish and freshwater regions of the lake (Figure 6A,B), which could be related to the changes in the dominant phytoplankton types. The influence of seasonal shift in taxonomic composition of phytoplankton on the distribution of clinical V. cholerae in coastal systems has been reported previously [50].
We explored the possibilities of using the relationship between the chlorophyll concentration and environmental V. cholerae as a potential tool for developing remote-sensing-based risk maps of environmental V. cholerae for the entire lake (Figure 6). The potential of satellite remote sensing for forecasting cholera outbreaks has been noted in a number of previous studies, with chlorophyll concentration and other environmental variables such as sea surface temperature and precipitation emerging as suitable predictive variables, from different studies at different localities [7,8,51,52]. The risk map presented in this paper for the Vembanad Lake can only be considered as preliminary, partly because of the influence of poorly-sampled high chlorophyll values on the emerging patterns. Furthermore, operational implementation of such risk maps should be preceded by a thorough investigation of candidate algorithms for atmospheric correction of the satellite data, and for retrieval of chlorophyll concentrations, to identify algorithms that perform best in the study area. Retrieval of chlorophyll-a concentrations from satellite data is particularly difficult in optically-complex coastal and inland waters [53], such as Vembanad Lake. The algorithm selection has to take such complexities into account, along with the bio-optical environment of the lake. Such an in-depth study falls outside the scope of the present study, but would form the logical next step in a future study. The north-south difference in the relationships between V. cholerae and chlorophyll-a necessitates an artificial break in the risk map, where the algorithms are switched. Overcoming this weakness would require that we investigate further the underlying cause.
The contrast in the relationship between satellite chlorophyll and probability of finding environmental V. cholerae in the brackish and fresh-water regions of the Vembanad Lake could be potentially related to the differences in phytoplankton community composition between these regions. The difference in phytoplankton composition could be attributed to the changes in the hydrodynamics between these regions induced by the manmade salt water barrier, Thanneermukkom bund, located between stations 9 and 10 (Figure 1) [54], in addition to the natural differences in the hydrodynamics of the lake: The northern part is open to the sea, and is subject to salt-water incursion, whereas the southern part is largely fed by land drainage and river inflow. The dominant group of micro-phytoplankton in the Vembanad Lake was diatoms, whose contribution (by cell number) varied from 30 to 37% in the wet season and 39–72% during the dry season in brackish and fresh water regions respectively. The association of environmental V. cholerae with diatoms could be similar to the interaction between zooplankton and V. cholerae, in which the bacteria attach themselves to the chitinous layer. Durkin et al. [55] have characterised chitin synthase genes from different diatom species and identified nanofibrils of chitin that help in girdle formation in centric diatoms and also in other diatoms which do not secrete chitin fibrils, suggesting their possible role in cell wall formation along with silica. However, direct and specific interactions between diatoms and environmental V. cholerae has not been reported previously. An indirect indication of this effect was found in the studies of Neogi et al. [56], who found a positive correlation between the abundance of toxigenic V. cholerae with chitin fraction in the <20 µm fraction of phytoplankton. On the other hand, the secondary metabolites produced by diatoms such as Skeletonema have been found to inhibit the growth of V. cholerae [46], and Turner et al. [57] have reported a negative correlation between diatom and V. cholerae abundances. In fact, Olofsson et al. [58], studying Vibrio parahaemolyticus isolated from the south-west coast of India, reported that the dinoflagellate Prorocentrum micans facilitated the persistence of the bacteria, whereas the diatom Skeletonema tropicum inhibited it. Taken together, the results of Olofsson et al. [58] and Wang et al. [59] suggest that some diatoms have the capability to inhibit more than one species of Vibrio bacteria.
Cyanobacteria are the second major group of phytoplankton in the Vembanad Lake, which contribute 10–20 % of dominant phytoplankton in brackish water dominated regions during wet and dry seasons, while their contribution shifted from 12% in the wet season to nearly 45% in the dry season in the freshwater dominated region. Many of the cyanobacteria such as Anabaena, Microcystis and Oscillatoria are well known reservoirs of V. cholerae [60,61,62]. The association of environmental V. cholerae with cyanobacteria is known to be of a mutualistic type, in which the Vibrio spp. are accommodated within their polysaccharide sheaths by providing nutrients and oxygen, and in return, the respiratory CO2 produced by the bacteria is utilized by the phytoplankton for photosynthesis [63]. Islam et al. [6,63] have demonstrated the association of V. cholerae with phytoplankton samples collected from Bangladesh and were able to detect V. cholerae in the mucilaginous sheath of Anabaena variabilis using fluorescence microscopy. This association was correlated with the presence of the mucilage binding hap gene in V. cholerae [64]. The association with phytoplankton in the fresh-water part of the lake was over 60% during the wet season, when Anabaena was the dominant species, consistent with the positive association reported by Islam and colleagues from Bangladesh [6,63]. However, the changes in the community structure are not sufficient in themselves to explain the dynamics of environmental V. cholerae in the study area. A complex interplay of seasonal and regional changes in the abiotic environmental conditions such as salinity and temperature, the varying influx of the bacteria from rivers and land drainage, and the flushing rate of the lake, all probably combine with ecosystem properties of the lake, to determine the observed patterns in the distribution of the bacteria.
The contrast in the results between the brackish water and fresh water dominated regions of the lake remains intriguing, and merits further study. A fruitful avenue of future research would be to explore the functional relationships that underpin the association between different groups of phytoplankton and environmental V. cholerae. The role of diatoms certainly merits further study to establish whether their relationship with V. cholerae is positive or negative, and to establish the causative agents and processes. If the nature of such relationships between V. cholerae and phytoplankton genera is better understood, it would open up the possibility of developing satellite algorithms for detecting phytoplankton types such as diatoms and blue-green algae in Vembanad Lake, for refining the initial risk map presented here.
Cholera outbreak is the outcome of a combination of different processes such as the supply and growth of V. cholerae in the environment and the interaction of humans with the infected water. The risk of infection is high in areas where people depend on natural water for drinking, washing and recreation. Mapping the risk of exposure to infection based on the presence of V. cholerae in association with plankton and the application of remote-sensing techniques for continuous monitoring of changes in risk over the entire water body would serve to reduce the spread of infection. As shown in Figure 1, the number of phytoplankton samples that were associated with V. cholerae, relative to total number of samples analysed remained high throughout the lake (>40%), with risk increasing towards 100% closer to the areas of high population density (vicinity of Kochi city). Note that the risk increases when the association of the bacteria with water and zooplankton are also considered. Mapping risk solely based on in situ sampling is a time-consuming and expensive process. It will always suffer from sparse sampling and cannot provide the real-time information needed for policy makers. Combining the in situ information with satellite observations provides a cost-effective and fast method for extrapolating the results to the whole lake (Figure 6), with the possibility of updating the risk map with every new satellite overpass under cloud-free conditions. Operational advisories based on a decision support system thus developed can be provided to the stakeholders and policy makers. The ranking of a lake or areas of a lake based on the prevalence of pathogenic Vibrio will help reduce human contact with the water in such areas, to avoid disease outbreaks and thus support the idea of eradicating cholera by 2030, and thus contribute to SDG 3 on health, and in particular to target 3.3 that includes bringing an end to epidemics of water-borne and other communicable diseases by 2030. But more importantly, our goal must embrace the elimination of the illness in the infected, and often unreported cases in the local population and the improvement to sanitation facilities to eradicate the contamination of natural water bodies by pathogenic bacteria and viruses through untreated sewage.

5. Conclusions

We have reported here the first findings of an intensive study of V. cholerae dynamics in Vembanad Lake, a tropical lake-estuarine system on the coast of Kerala state in south-western India. The lake exhibits many of the traits, and experiences many of the threats, encountered in a large number of tropical estuaries: It is subject to monsoon dynamics, with consequent high seasonality in rainfall, salinity, river inflow, currents and temperature; There is a gradient in population density along the banks of the lake, changing from high density at the mouth of the estuary surrounded by a big city, gradually decreasing to relatively low density in the rural, agricultural areas at the other end of the lake; and it harbours a high diversity of aquatic communities, which also change with location and season. Vembanad Lake thus provides a natural laboratory for investigating the dynamics of V. cholerae under a diverse set of environmental conditions, such that sustained observations in this lake should lead to identification of agents and conditions that favour the survival of this bacteria in endemic regions.
The study has revealed that the environmental bacteria are present in unattached state in the water, or in association with phytoplankton, zooplankton, macrobenthos and sediments, with the association being highest with phytoplankton and poorest with sediments. The dynamics of the distribution are complex, with spatially and seasonally distinct patterns in their distribution. It appears that a variety of abiotic environmental factors, such as temperature, salinity, precipitation, and river inflow and biotic factors such as phytoplankton concentration and community structure, appear to have a role in dictating the observed patterns. The results have pointed to new avenues of research to elucidate these links further. Notable among them is the response of the bacteria to very high temperatures (>30 °C), and the mechanisms that dictate the favourable and unfavourable associations between various types of phytoplankton and V. cholerae. Such additional information would help further refine the preliminary, satellite-based risk maps that have emerged from the study.
The case study presented here highlights the interconnections between SDG 3 (health) and SDG 6 (availability and sustainable management of water and sanitation for all). SDG 14 and 15, that deal with marine and freshwater ecosystems, also come into play, as we strive to understand the dynamics of environmental cholera bacteria in natural aquatic systems, and the biotic and abiotic factors that control them.

Supplementary Materials

The following are available online at https://0-www-mdpi-com.brum.beds.ac.uk/2072-4292/13/5/1034/s1, Figure S1: In vitro testing of laminarinase (red) and chitinase (blue) activities of environmental Vibrio cholerae (96 isolates) isolated from the coastal waters, Figure S2: Dominant groups of (A) zooplankton and (B) benthic organisms in the brackish water (BW) and freshwater (FW) regions of the Vembanad Lake during dry and wet seasons.

Author Contributions

Conceptualization: A.A., S.S. and T.P.; methodology: K.K. and J.C.; software: G.K. and A.C.; validation: G.K., A.C. and E.G.; formal analysis: S.V., H.K.V., B.T. and J.V.; investigation: A.A., G.G., N.M. and A.J.K.U.; resources: A.A., K.K., G.G. and S.S.; data curation: A.A., G.G. and N.M.; writing—original draft preparation: A.A.; writing—review and editing: G.G., N.M., G.K. and S.S.; visualization: A.A.; supervision: S.S. and T.P.; project administration: A.A., G.G., N.M. and S.S.; funding acquisition: A.A., G.G., S.S. and T.P. All authors have read and agreed to the published version of the manuscript.

Funding

This research was funded by Department of Science and Technology, India (DST/TM/INDO-UK/2K17/64 (C) and Natural Environmental Research Council (UK) under India-UK water quality research program for the project RE-VIVAL.

Data Availability Statement

Data available with the first author. Would be shared on request.

Acknowledgments

This is a contribution to the activities of the National Centre for Earth Observations of the Natural Environment Research Council (UK). We acknowledge the Directors of CSIR-NIO, ICAR-CMFRI, NERCI, PML and Scientist-in-Charge of CSIR-NIO RCK for their support and encouragement.

Conflicts of Interest

The authors declare no conflict of interest.

References

  1. WHO. WHO Updates Fact Sheet on Cholera (17 January 2019). Available online: https://www.who.int/news-room/fact-sheets/detail/cholera (accessed on 7 March 2021).
  2. Jutla, A.S.; Akanda, A.S.; Islam, S. Tracking Cholera in Coastal Regions Using Satellite Observations: Tracking Cholera in coastal regions using satellite observations. JAWRA J. Am. Water Resour. Assoc. 2010, 46, 651–662. [Google Scholar] [CrossRef] [Green Version]
  3. Racault, M.-F.; Abdulaziz, A.; Vijayan, V.; George, G.; Menon, N.; Jasmin, C.; Punathil, M.; McConville, K.; Loveday, B.; Platt, T.; et al. Environmental Reservoirs of Vibrio cholerae: Challenges and Opportunities for Ocean-Color Remote Sensing. Remote Sens. 2019, 11, 2763. [Google Scholar] [CrossRef] [Green Version]
  4. Baker-Austin, C.; Oliver, J.D.; Alam, M.; Ali, A.; Waldor, M.K.; Qadri, F.; Martinez-Urtaza, J. Vibrio spp. infections. Nat. Rev. Dis. Prim. 2018, 4, 1–19. [Google Scholar] [CrossRef]
  5. GTFCC/WHO. Ending Cholera: A Global Road Map to 2030; WHO: Geneva, Switzerland, 2017; 32p. [Google Scholar]
  6. Islam, M.S.; Alam, M.J.; Khan, S.I. Occurence and distribution of culturable Vibrio cholerae O1 in aquatic environments of Bangladesh. Int. J. Environ. Stud. 1995, 47, 217–223. [Google Scholar] [CrossRef]
  7. Jutla, A.; Khan, R.; Colwell, R. Natural Disasters and Cholera Outbreaks: Current Understanding and Future Outlook. Curr. Environ. Health Rep. 2017, 4, 99–107. [Google Scholar] [CrossRef] [PubMed]
  8. Lobitz, B.; Beck, L.; Huq, A.; Wood, B.; Fuchs, G.; Faruque, A.S.G.; Colwell, R. Climate and infectious disease: Use of remote sensing for detection of Vibrio cholerae by indirect measurement. Proc. Natl. Acad. Sci. USA 2000, 97, 1438–1443. [Google Scholar] [CrossRef] [Green Version]
  9. Vezzulli, L.; Colwell, R.R.; Pruzzo, C. Ocean Warming and Spread of Pathogenic Vibrios in the Aquatic Environment. Microb. Ecol. 2013, 65, 817–825. [Google Scholar] [CrossRef] [PubMed]
  10. Sathyendranath, S.; Abdulaziz, A.; Menon, N.; George, G.; Evers-King, H.; Kulk, G.; Colwell, R.; Jutla, A.; Platt, T. Building Capacity and Resilience Against Diseases Transmitted via Water Under Climate Perturbations and Extreme Weather Stress. In Space Capacity Building in the XXI Century; Ferretti, S., Ed.; Springer International Publishing: Cham, Switzerland, 2020; pp. 281–298. [Google Scholar] [CrossRef]
  11. Ramamurthy, T.; Sharma, N.C. Cholerae Outbreaks in India; Balakrish Nair, G., Takeda, Y., Eds.; Springer: New York, NY, USA, 2014; Volume 379, 259p. [Google Scholar]
  12. Reed, R.H.; Singh, I.S.B.; Mani, S.K. Solar Disinfection of Drinking Water: Lessons from Field Studies in India. In Progress on Drinking Water Research; Lefebvre, M.H., Roux, M.M., Eds.; Nova Science Publishers, Inc.: New York, NY, USA, 2008; Volume 1, 290p. [Google Scholar]
  13. Gireesh, R.; Varghese, M.; Thomas, V.J. Phytoplankton—Collection, Estimation, Classification and Diversity. In Proceedings of the Summer School on Recent Advances in Marine Biodiversity Conservation and Management, Kochi, India, 16 February–8 March 2015; Central Marine Fisheries Research Institute: Kochi, India, 2015; pp. 24–28. [Google Scholar]
  14. Gopinathan, C.P. A systematic account of the littoral diatoms of the southwest coast of India. J. Mar. Biol. Assoc. India 1984, 26, 1–31. [Google Scholar]
  15. Thomas, R. Identifying Marine Phytoplankton; Academic Press: California, CA, USA, 1997. [Google Scholar]
  16. Throndsen, J.; Hasle, G.R.; Tangen, K. Phytoplankton of Norwegian Coastal Waters; Almater Forlag AS: Oslo, Norway, 2007. [Google Scholar]
  17. Parson, T.R.; Maita, Y.; Lalli, C.M. A Manual of Biological and Chemical Methods for Seawater Analysis; Pergamon Press: Oxford, UK, 1984; 173p. [Google Scholar]
  18. George, G.; Sreeraj, C.R.; Dam Roy, S. Brachionid rotifer diversity in Andaman waters. Indian J. Geo. Mar. Sci. 2011, 40, 454–459. [Google Scholar]
  19. Varghese, M.; Thomas, V.J.; Susan, V. Collection and Estimation of Zooplankton. In Proceedings of the Summer School on Recent Advances in Marine Biodiversity Conservation and Management, Cochin, India, 16 February–8 March 2015; Central Marine Fisheries Research Institute: Kochi, India, 2015; pp. 29–32. [Google Scholar]
  20. Carrea, L.; Embury, O.; Merchant, C.J. Datasets related to in-land water for limnology and remote sensing applications: Distance-to-land, distance-to-water, water-body identifier and lake-centre co-ordinates. Geosci. Data J. 2015, 2, 83–97. [Google Scholar] [CrossRef] [Green Version]
  21. Maccallum, S.N.; Merchant, C.J. Surface water temperature observations of large lakes by optimal estimation. Can. J. Remote Sens. 2012, 38, 25–45. [Google Scholar] [CrossRef]
  22. Vanhellemont, Q.; Ruddick, K. ACOLITE for Sentinel-2: Aquatic applications of MSI imagery. In Proceedings of the 2016-ESA Living Planet Symposium, Prague, Czech Republic, 9–13 May 2016; p. SP740. [Google Scholar]
  23. Vanhellemont, Q.; Ruddick, K. Atmospheric correction of metre-scale optical satellite data for inland and coastal water applications. Remote Sens. Environ. 2018, 216, 586–597. [Google Scholar] [CrossRef]
  24. O’Reilly, J.E.; Maritorena, S.; Siegel, D.A.; O’Brien, M.C.; Toole, D.; Greg Mitchell, B.; Kahru, M.; Chavez, F.P.; Strutton, P.; Cota, G.F.; et al. (Eds.) SeaWiFS Postlaunch Calibration and Validation Analyses; NASA Goddard Space Flight Center: Greenbelt, MD, USA, 2000; Volume 11, 49p.
  25. Franz, B.A.; Bailey, S.W.; Kuring, N.; Werdell, P.J. Ocean colour measurements with the operational land imager on Landsat-8: Implementation and evaluation in SeaDAS. J. Appl. Remote Sens. 2015, 9, 096070. [Google Scholar] [CrossRef]
  26. Peng, X.; Yu, K.-Q.; Deng, G.-H.; Jiang, Y.-X.; Wang, Y.; Zhang, G.-X.; Zhou, H.-W. Comparison of direct boiling method with commercial kits for extracting fecal microbiome DNA by Illumina sequencing of 16S rRNA tags. J. Microbiol. Methods 2013, 95, 455–462. [Google Scholar] [CrossRef] [PubMed]
  27. Mehrabadi, J.F.; Morsali, P.; Nejad, H.R.; Fooladi, A.A.I.; Najafy, S. Evaluation of new primers for detecting toxigenic vibrio cholerae by multiplex PCR. Microbiol. Res. 2011, 2, 1. [Google Scholar] [CrossRef] [Green Version]
  28. Ang, G.Y.; Yu, C.Y.; Balqis, K.; Elina, H.T.; Azura, H.; Hani, M.H.; Yean, C.Y. Molecular Evidence of Cholera Outbreak Caused by a Toxigenic Vibrio cholerae O1 El Tor Variant Strain in Kelantan, Malaysia. J. Clin. Microbiol. 2010, 48, 3963–3969. [Google Scholar] [CrossRef] [PubMed] [Green Version]
  29. Reynolds, D.M. Exocellular Chitinase from a Streptomyces sp. J. Gen. Microbiol. 1954, 11, 150–159. [Google Scholar] [CrossRef] [Green Version]
  30. Ramamurthy, T.; Mutreja, A.; Weill, F.-X.; Das, B.; Ghosh, A.; Nair, G.B. Revisiting the Global Epidemiology of Cholera in Conjuction With the Genomics of Vibrio cholerae. Front. Public Health 2019, 7, 203. [Google Scholar] [CrossRef] [PubMed]
  31. Escobar, L.E.; Ryan, S.J.; Stewart-Ibarra, A.M.; Finkelstein, J.L.; King, C.A.; Qiao, H.; Polhemus, M.E. A global map of suitability for coastal Vibrio cholerae under current and future climate conditions. Acta Trop. 2015, 149, 202–211. [Google Scholar] [CrossRef] [PubMed]
  32. Seetharaman, P.; Sarma, K.; George, G.; Krishnan, P.; Roy, S.D.; Sankar, K. Impact of Coastal Pollution on Microbial and Mineral Profile of Edible Oyster (Crassostrea rivularis) in the Coastal Waters of Andaman. Bull. Environ. Contam. Toxicol. 2015, 95, 599–605. [Google Scholar] [CrossRef] [PubMed] [Green Version]
  33. WISA. Vembanad-Kol Wetlands—An Integrated Management Planning Framework for Conservation and Wise Use; Wetland International-South AISA: New Delhi, India, 2013; 113p. [Google Scholar]
  34. Louis, V.R.; Russek-Cohen, E.; Choopun, N.; Rivera, I.N.G.; Gangle, B.; Jiang, S.C.; Rubin, A.; Patz, J.A.; Huq, A.; Colwell, R.R. Predictability of Vibrio cholerae in Chesapeake Bay. Appl. Environ. Microbiol. 2003, 69, 2773–2785. [Google Scholar] [CrossRef] [PubMed] [Green Version]
  35. Singleton, F.L.; Attwell, R.; Jangi, S.; Colwell, R.R. Effects of temperature and salinity on Vibrio cholerae growth. Appl. Environ. Microbiol. 1982, 44, 1047–1058. [Google Scholar] [CrossRef] [PubMed] [Green Version]
  36. Huq, A.; West, P.A.; Small, E.B.; Huq, M.I.; Colwell, R.R. Influence of water temperature, salinity, and pH on survival and growth of toxigenic Vibrio cholerae serovar 01 associated with live copepods in laboratory microcosms. Appl. Environ. Microbiol. 1984, 48, 420–424. [Google Scholar] [CrossRef] [PubMed] [Green Version]
  37. Materna, A.C.; Friedman, J.; Bauer, C.; David, C.; Chen, S.; Huang, I.B.; Gillens, A.; Clarke, S.A.; Polz, M.F.; Alm, E.J. Shape and evolution of the fundamental niche in marine Vibrio. ISME J. 2012, 6, 2168–2177. [Google Scholar] [CrossRef] [Green Version]
  38. Hutchinson, G.E. Concluding Remarks in Cold Spring Harbour Syposium on Quantitative Biology. Cold Spring Harb. Symp. Quant. Biol. 1957, 22, 415–427. [Google Scholar] [CrossRef]
  39. Takemura, A.F.; Chien, D.M.; Polz, M.F. Associations and dynamics of Vibrionaceae in the environment, from the genus to the population level. Front. Microbiol. 2014, 5, 38. [Google Scholar] [CrossRef] [Green Version]
  40. Vezzulli, L.; Brettar, I.; Pezzati, E.; Reid, P.C.; Colwell, R.R.; Höfle, M.G.; Pruzzo, C. Long-term effects of ocean warming on the prokaryotic community: Evidence from the vibrios. ISME J. 2011, 6, 21–30. [Google Scholar] [CrossRef] [Green Version]
  41. Baker-Austin, C.; Trinanes, J.; Gonzalez-Escalona, N.; Martinez-Urtaza, J. Non-Cholera Vibrios: The Microbial Barometer of Climate Change. Trends Microbiol. 2017, 25, 76–84. [Google Scholar] [CrossRef] [Green Version]
  42. Levy, S. Warming Trend: How Climate ShapesVibrioEcology. Environ. Health Perspect. 2015, 123, A82–A89. [Google Scholar] [CrossRef] [Green Version]
  43. Correspondent, S. Proximity of Wells to Septic Tanks in Flood-Hit Areas Raises Concern. The Hindu, 7 September 2018. [Google Scholar]
  44. Kanungo, S.; Sah, B.K.; Lopez, A.L.; Sung, J.S.; Paisley, A.M.; Sur, D.; Clemens, J.D.; Nair, G.B. Cholera in India: An analysis of reports, 1997–2006. Bull. World Health Organ. 2010, 88, 185–191. [Google Scholar] [CrossRef]
  45. Finkeletein, R.A. Cholera, Vibrio Cholera O1 and O139, and Other Pathogenic Vibrios. In Medical Microbiology, 4th ed.; Baron, S., Ed.; University of Texas Medical Branch at Galveston: Huston, TX, USA, 1996. [Google Scholar]
  46. Pruzzo, C.; Vezzulli, L.; Colwell, R.R. Global impact of Vibrio cholerae interactions with chitin. Environ. Microbiol. 2008, 10, 1400–1410. [Google Scholar] [CrossRef]
  47. Vezzulli, L.; Pruzzo, C.; Huq, A.; Colwell, R.R. Environmental reservoirs of Vibrio cholerae and their role in cholera. Environ. Microbiol. Rep. 2010, 2, 27–33. [Google Scholar] [CrossRef]
  48. Alderkamp, A.-C.; Van Rijssel, M.; Bolhuis, H. Characterization of marine bacteria and the activity of their enzyme systems involved in degradation of the algal storage glucan laminarin. FEMS Microbiol. Ecol. 2007, 59, 108–117. [Google Scholar] [CrossRef] [PubMed] [Green Version]
  49. Zhang, X.; Lin, H.; Wang, X.; Austin, B. Significance of Vibrio species in the marine organic carbon cycle—A review. Sci. China Earth Sci. 2018, 61, 1357–1368. [Google Scholar] [CrossRef]
  50. Turner, J.W.; Malayil, L.; Guadagnoli, D.; Cole, D.; Lipp, E.K. Detection of Vibrio parahaemolyticus, Vibrio vulnificus and Vibrio cholerae with respect to seasonal fluctuations in temperature and plankton abundance. Environ. Microbiol. 2014, 16, 1019–1028. [Google Scholar] [CrossRef] [PubMed]
  51. Finger, F.; Knox, A.; Bertuzzo, E.; Mari, L.; Bompangue, D.; Gatto, M.; Rodriguez-Iturbe, I.; Rinaldo, A. Cholera in the Lake Kivu region (DRC): Integrating remote sensing and spatially explicit epidemiological modeling. Water Resour. Res. 2014, 50, 5624–5637. [Google Scholar] [CrossRef] [Green Version]
  52. Xu, M.; Cao, C.X.; Wang, D.C.; Kan, B.; Xu, Y.F.; Ni, X.L.; Zhu, Z.C. Environmental factor analysis of cholera in China using remote sensing and geographical information systems. Epidemiol. Infect. 2016, 144, 940–951. [Google Scholar] [CrossRef] [PubMed] [Green Version]
  53. Sathyendranath, S. Remote Sensing of Ocean Colour in Coastal, and Other Optically Complex, Waters; IOCCCG: Dartmouth, NS, Canada, 2000; Volume 3. [Google Scholar]
  54. Haldar, R.; Khosa, R.; Gosain, A.K. Impact of Anthropogenic Interventions on the Vembanad Lake System. In Water Resources and Environmental Engineering I: Surface and Groundwater; Rathinasamy, M., Chandramouli, S., Phanindra, K., Mahesh, U., Eds.; Springer: Singapore, 2019; Volume I, pp. 9–99. [Google Scholar]
  55. Durkin, C.A.; Mock, T.; Armbrust, E.V. Chitin in Diatoms and Its Association with the Cell Wall. Eukaryot. Cell 2009, 8, 1038–1050. [Google Scholar] [CrossRef] [Green Version]
  56. Neogi, S.B.; Islam, M.S.; Nair, G.B.; Yamasaki, S.; Lara, R.J. Occurrence and distribution of plankton-associated and free-living toxigenic Vibrio cholerae in a tropical estuary of a cholera endemic zone. Wetl. Ecol. Manag. 2012, 20, 271–285. [Google Scholar] [CrossRef]
  57. Turner, J.W.; Good, B.; Cole, D.; Lipp, E.K. Plankton composition and environmental factors contribute to Vibrio seasonality. ISME J. 2009, 3, 1082–1092. [Google Scholar] [CrossRef] [Green Version]
  58. Olofsson, M.; Asplund, M.E.; Karunasagar, I.; Rehnstam-Holm, A.-S.; Godhe, A. Prorocentrum micans promote and Skeletonema tropicum disfavours persistence of the pathogenic bacteria Vibrio parahaemolyticus. Indian J. Geo. Mar. Sci. 2013, 42, 729–733. [Google Scholar]
  59. Wang, S.; Said, I.H.; Thorstenson, C.; Thomsen, C.; Ullrich, M.S.; Kuhnert, N.; Thomsen, L. Pilot-scale production of antibacterial substances by the marine diatom Phaeodactylum tricornutum Bohlin. Algal Res. 2018, 32, 113–120. [Google Scholar] [CrossRef]
  60. Chaturvedi, P.; Agrawal, M.K.; Bagchi, S.N. Microcystin-producing and non-producing cyanobacterial blooms collected from the Central India harbor potentially pathogenic Vibrio cholerae. Ecotoxicol. Environ. Saf. 2015, 115, 67–74. [Google Scholar] [CrossRef] [PubMed]
  61. Islam, M.S.; Goldar, M.M.; Morshed, M.G.; Bakht, H.B.M.; Sack, D.A. Chemotaxis between Vibrio cholerae O1 and a blue-green alga, Anabaena sp. Epidemiol. Infect. 2006, 134, 645–648. [Google Scholar] [CrossRef]
  62. Islam, M.S.; Zaman, M.; Ahmed, N.; Clemens, J. Environmental reservoirs of Vibrio cholerae. Vaccine 2019, 38, A52–A62. [Google Scholar] [CrossRef] [PubMed]
  63. Islam, M.S.; Drasar, B.S.; Bradley, D.J. Long-term persistence of toxigenic Vibrio cholerae O1 in the mucilagenous sheeth of a blue-green alga, Anabaena variabilis. J. Trop. Med. Hyg. 1990, 93, 133–139. [Google Scholar] [PubMed]
  64. Islam, M.S.; Goldar, M.M.; Morshed, M.G.; Khan, M.N.; Islam, M.S.; Sack, R. Involvement of the hap gene (mucinase) in the survival of Vibrio cholerae O1 in association with the blue-green alga, Anabaena sp. Can. J. Microbiol. 2002, 48, 793–800. [Google Scholar] [CrossRef]
Figure 1. Study area showing the sampling locations in the Vembanad lake. Stations are ranked based on the number of phytoplankton samples in which environmental Vibrio cholerae was detected, relative to the total number of samples examined, with extreme risk (black) corresponding to 80 to 100% of samples being positive, high risk (red) with 60–80% of samples being positive and seasonally risky (blue) in which 40–60% of samples showed the presence of V. cholerae. Locations of Kochi city, industrial areas and tourism spots mentioned in the main text are also labelled.
Remotesensing 13 01034 g001
Figure 2. (A) Spatio-temporal variation of salinity in the brackish-water (stations 1–6) and fresh-water (stations 7–13) regions of the Vembanad Lake; and (B) the growth of pathogenic isolate of V. cholerae at different salinities.
Remotesensing 13 01034 g002
Figure 3. In situ observations in the 13 stations (blue) and the lake-averaged satellite (red) estimate of the temporal variation of temperature in the Vembanad Lake during the study.
Remotesensing 13 01034 g003
Figure 4. Distribution of Vibrio cholerae in sediment (red), macrobenthos (purple), micro-zooplankton (ash), micro-phytoplankton (green) and filtered water (blue) samples during wet (A) and dry (B) seasons in the Vembanad Lake.
Remotesensing 13 01034 g004
Figure 5. Spatio-temporal variation of chlorophyll in the Vembanad Lake measured using (A) in situ and (B) satellite remote sensing. In (A), the lower half of the figure (stations 1–6) constitute the brackish-water region of the lake, and the upper half (stations 7–13) constitute the fresh-water region of the lake. In (B), dark grey represents missing data. Land is delineated as light grey and ocean as light blue.
Remotesensing 13 01034 g005
Figure 6. The relationship between satellite chlorophyll and probability of finding environmental Vibrio cholerae in the (A) brackish water (BW) and (B) fresh water (FW) regions in the Vembanad Lake. Note that a number of observations are used to generate each of the points in the graph, and the number of observations used are indicated against each point. (C) Representative satellite image (for 23 February 2019) of chlorophyll and (D) the corresponding risk map of environmental V. cholerae incidence in the lake, generated from the relationships shown in (A,B) for the two parts of the lake.
Remotesensing 13 01034 g006
Figure 7. Dominant groups of micro-phytoplankton in the brackish water (BW) and freshwater (FW) regions of the Vembanad Lake during dry and wet seasons.
Remotesensing 13 01034 g007
Publisher’s Note: MDPI stays neutral with regard to jurisdictional claims in published maps and institutional affiliations.

