1. Introduction
The extent, timing, and magnitude of inundation in terrestrial wetlands, also called the hydropattern, is a primary physical control on biogeochemical processes in surface environments ranging from coastal plains to desert playas [
1]. A wetland’s hydropattern is influenced by the net difference between inflows and outflows of water—whether through runoff, groundwater flow, or evaporation [
1,
2]. The spatial extent, temporal duration, and concentration of soil moisture are three key components of dryland playa hydropatterns that directly control microbial and floral biodiversity and community functioning in these environments [
3,
4]. Insight into soil moisture control of biological community functioning is essential information used to inform wilderness management decisions concerning these fragile desert ecosystems [
5,
6].
However, determining playa hydropattern directly is challenged by the remoteness of desert basin sites and by the difficulty in determining soil moisture content from remotely sensed data at spatial and temporal scales suitable for evaluating rapidly changing processes in small basins. Playa hydropatterns change over meter length scales, within regions hundreds of meters to a few kilometers wide, over daily to sub-daily timescales.
Remote sensing of surface soil moisture typically uses microwave, radar [
7], or thermal measurements to infer the water content of the soil, for example, using the changing heat capacity of wetted ground [
8], however, the complex interplay between soil moisture, albedo of barren ground, and changing density, compaction, and heat capacity can reduce correlations between thermal remote sensing measurements and soil water content [
9]. Synthetic aperture radar can be used to determine soil moisture [
10], as can reflectance imaging in the shortwave near-infrared (SWIR) [
11,
12,
13,
14], although in some studies, SWIR reflectance indices are found to correlate more closely with matrix-bound-water under tension, rather than with total pore water content [
6].
In barren soils free of vascular vegetation, optical reflectance measurements in the near-infrared can be used to directly observe the 1.4 µm absorption from water that fills surface pore space [
13,
15], or broadband multispectral indices can be used to infer soil moisture content, for example, through detections of minimum NDVI [
14]. Others have combined plant stress measurements (NDVI) with soil surface temperature measurements (a function of soil heat capacity), to derive soil moisture in agricultural, grassland, and forested settings [
16,
17,
18]. Multi-sensor fusion modeling has been successful at retrieving soil moisture at high temporal (~daily) and spatial (~30 m/pixel) scales with low uncertainty (RMSE errors ranging from ~3 to 11 volume percent) [
19], but even these spatial and temporal scales exceed the size of ephemeral desert wetland features, e.g., [
20,
21] that may be meters wide and that may change soil moisture on hourly timescales. NDVI-derived soil moisture retrievals are most sensitive in regions with abundant plant cover, however, they can also be employed in low-NDVI barren soil regions (e.g., Taklimakan desert), but these data fusion products are most effective when combined with microwave measurements that have spatial resolution on the order of kilometers to tens of kilometers [
22].
Direct observations of the 1.4 µm water absorption are possible for small soil moisture anomalies in desert landscapes, provided the spatial resolution of the sensor is finer than the scale of the groundwater plume and provided the spectral resolution is fine enough to resolve the feature [
13,
15]. Orbital reflectance sensors, however, are typically designed to filter around the 1.4 µm water absorption, minimizing atmospheric loss of incident radiation. Non-optical orbital remote sensing platforms typically do not have the repeat cadence or ground resolution needed to image soil moisture at the small spatial scales of playas and other ephemeral wetlands. Together, these challenges raise the possibility that in dryland playa systems, airborne remote sensing may be able to capture the shoulders of the 1.4 µm water absorption during rapid follow-on repeat sorties, allowing for the direct measurement of surface soil moisture in playa environments across fine spatial scales and at high temporal resolution.
Therefore, this project seeks to determine if SWIR reflectance spectral indices developed for remotely determining surface soil moisture content in temperate soils and in sandy, cold desert soils [
11,
13,
15] can be applied to barren ground cover types, including clay and silt dominated soils in continental playa settings. Past studies on playa soil moisture and runoff processes have focused on large lake and sheetwash-dominated systems in which standing water and lake formation is common [
23,
24]. In contrast, our goal is to determine if is it possible to use drone-borne hyperspectral imaging to determine the size, extent, and soil moisture distribution within a groundwater plumes in a playa environment.
2. Materials and Methods
2.1. Field Site: Alvord Desert, Eastern Oregon, USA
Remote sensing and ground-truth fieldwork in support of this objective occurred in the Alvord Desert of southeastern Oregon (
Figure 1), a ~13 km wide by 18 km long playa located in the vicinity of the Steens Wilderness Study Area (42.539°N, −118.513°E). The Alvord Desert is representative of playa and basin fill sites within the Basin and Range province, and hosts an assemblage of Pleistocene-aged paleo-lake deposits from Pluvial Lake Alvord that are comparable to larger and more widespread basin fills from other ice-age lakes, such as Lahontan [
25], making the Alvord Desert playa a type locality for clay and silt-dominated playa environments.
The Alvord Desert has nearly barren soils and is largely free of vegetation outside of halotolerant grasses and fungi that fringe perennial pools and wetlands [
3]. Scattered hydrothermal springs fringing the valley walls emerge from faults and produce ephemeral wetland conditions on the playa, supporting a robust bacterial ecosystem [
4,
26]. The soils of the central playa are fine grained (silt and clay sized particles) and are composed largely of smectite-dominated clays [
27]. Strong, convective winds, coupled with low precipitation, result in extremely desiccating conditions in the Alvord Playa outside of the hydrothermal spring plumes [
28], and repeated wetting and drying results in the widespread occurrence of desiccation cracks along the playa floor.
The specific field sampling location for this project is the discharge plume of the Alvord Hot Spring (AHS,
Figure 1), a digitate hydrothermal plume that flows out onto the flat playa floor. The spring water infiltrates into the soil at the site, forming a lobe of wetted sediment that is several hundred meters long and tens of meters wide. The balance of spring discharge, runoff from the neighboring slopes, and evaporation determine the extent and degree of saturation of the wetland plume along a gradient from saturated soils with standing water to fully dried playa sediment.
Field mapping via drone-borne reflectance spectroscopy and ground sampling of the Alvord Hot Spring site occurred in August 2019. Field measurements were complemented by laboratory analysis of sediment properties, soil moisture, and plume salinity in order to calibrate a predictive reflectance model for soil moisture at the site. Measurements were collected during the local dry season to minimize atmospheric water vapor concentrations and improve the probability of surveying under cloud-free or scattered cloud conditions.
2.2. Field Methods
The SWIR reflectance properties of the AHS plume were determined via drone-borne point hyperspectral measurements. An Ocean Optics FLAME NIR spectrometer was deployed over the site to collect three sorties of reflectance measurements. The FLAME NIR is an InGaAs-detector-based reflectance spectrometer that has a spectral range of 940–1646 nm, ~12 nm FWHM optical resolution, and was configured to sample across 128 spectral channels via the OceanView software tool. A Spectralon
TM white reference was used to determine incoming solar radiance prior to each of the three sorties, and all spectra are dark current corrected. Measurements were integrated for 100 ms per measurement, and ten spectra were averaged per sampling point to improve signal to noise. Spectra were averaged into one-second reduced reflectance measurements in Matlab. An example is shown in
Figure 2, and data are provided in full in the
Supplementary Data. A total of 1627 averaged measurement points were collected over three sorties (AHS4, AHS5, and AHS7), covering an area of ~15,000 m
2 at the distal end of the hot spring plume.
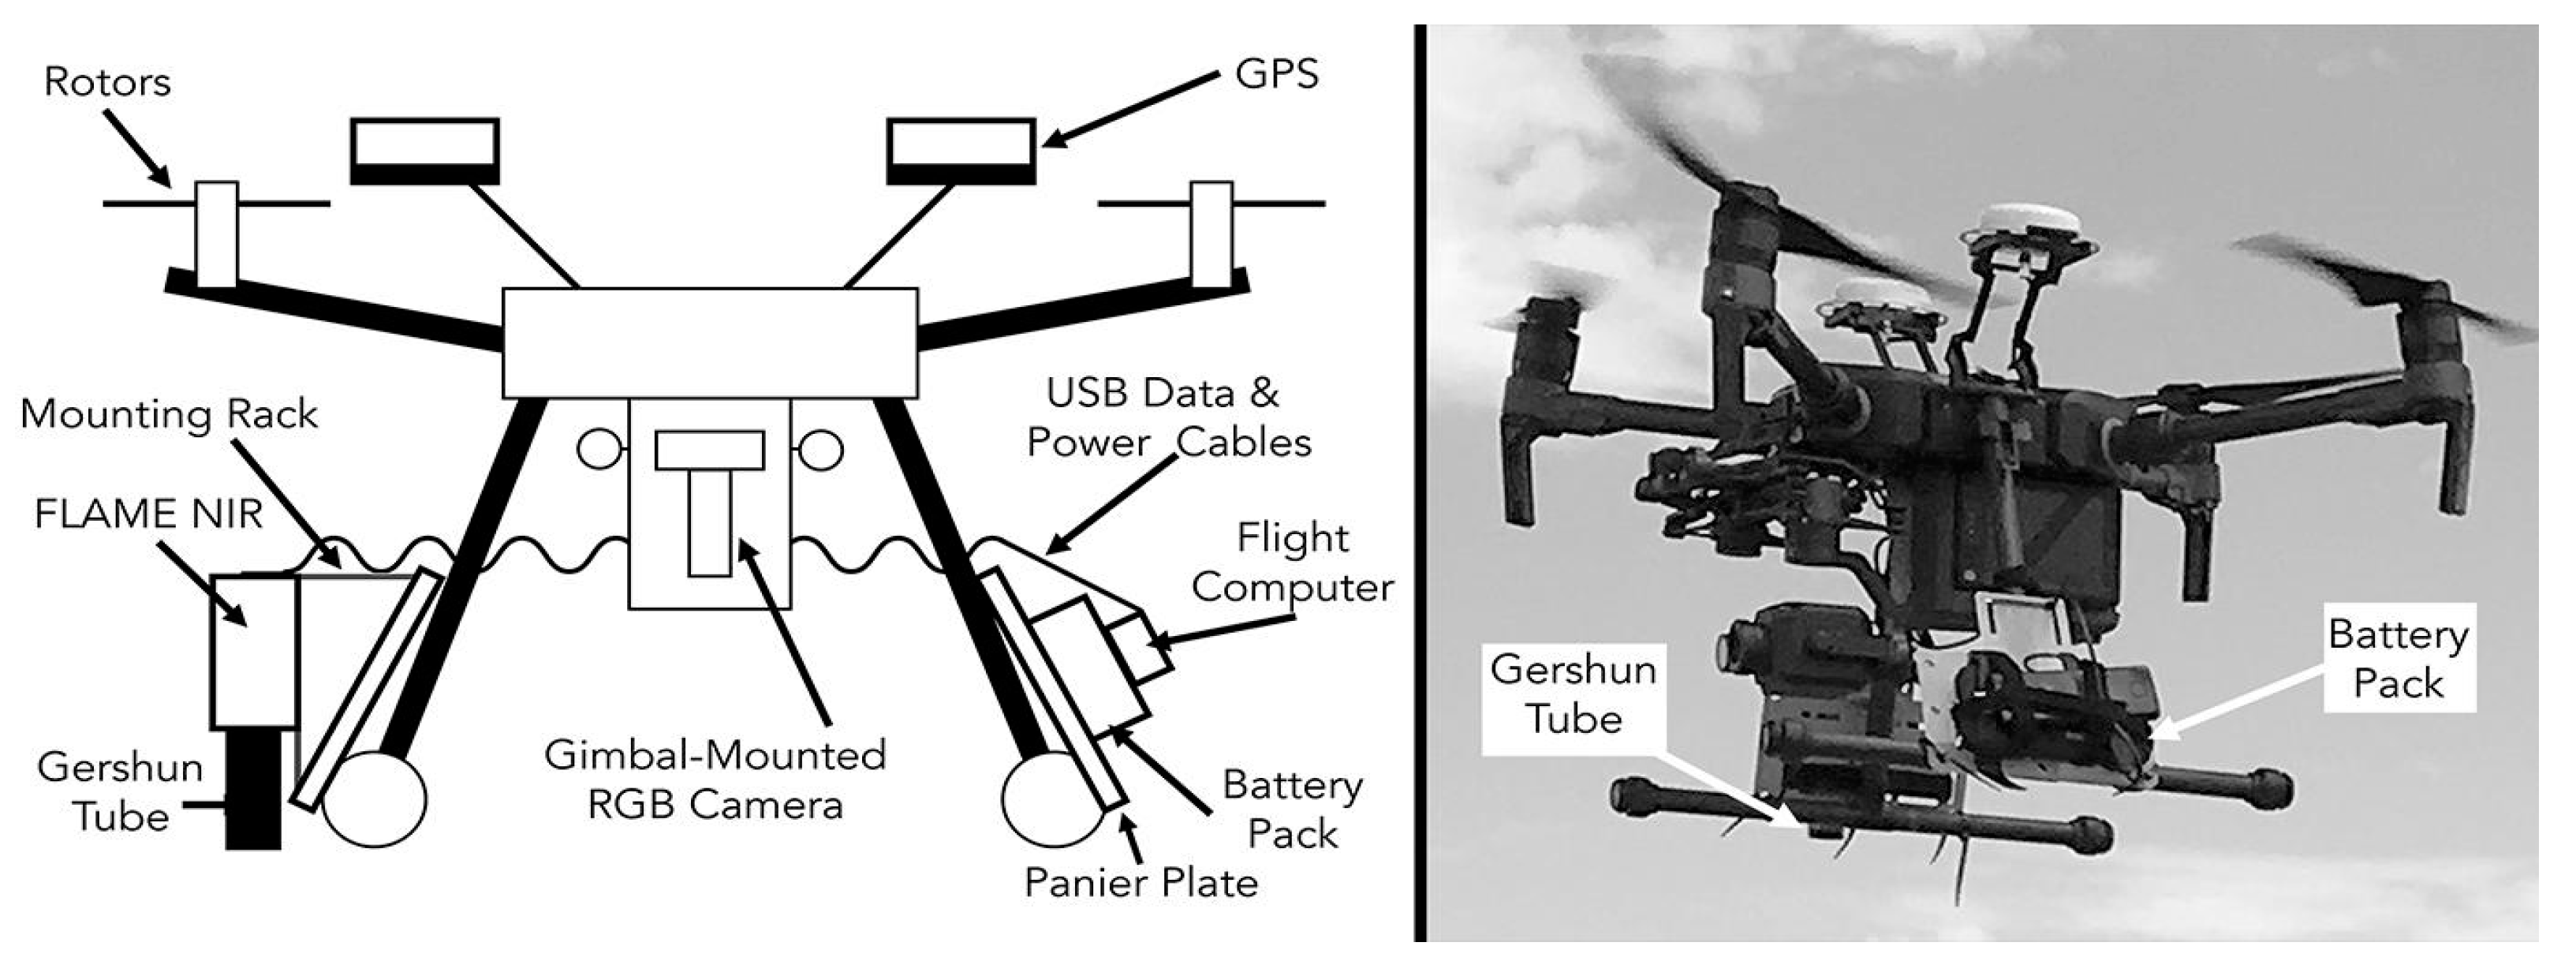
The SWIR spectrometer was flown aboard a DJI Matrice 210 RTK aircraft (
Figure 3). The spectrometer was mounted in a nadir-pointing fixed mount with vibration-damping Velcro strapping. A collimating Gershun tube with 14° field of view fore-optics was flush-mounted with the bottom of the drone landing skid. This flush mounting facilitated the synchronization of the aircraft position measurements with reflectance measurements by aligning launch of the aircraft with the first reflectance measurements exceeding the dark background. The UAV was flown 17 m above the ground surface, producing a ground footprint ~2 m in radius. The aircraft was flown in concert with a GNSS ground station allowing for real-time kinematic GPS correction, resulting in cm-scale horizontal positioning uncertainty for the aircraft. Across all three sorties, median roll and pitch were 2.46° and 2.03°, respectively, producing median ground position uncertainty for reflectance measurements of ±1 m.
Ground sampling and measurement was conducted in order to provide calibration for remotely sensed measurements. Measurements were collected at 26 ground control points in two transects that crossed the AHS plume (
Figure 1 and
Figure 4). At each point, a reflectance spectrum was collected of the ground surface from ~10 cm standoff distance using the same FLAME-NIR spectrometer that flew on the drone. Sediment samples were collected for laboratory analysis from fifteen of the ground control points, and soil moisture volumetric water content, temperature, and electrical conductivity were measured with a Decagon Devices 5-TE soil probe at all sites. Volumetric water content (VWC) for each sample was calculated using the raw 5TE voltage data and the Topp equation [
29]:
where ε
a = raw dielectric permittivity measured at the sensor.
A similar process was used for calculating the electrical conductivity (converted from raw mV to dS/cm). For conductivities up to 700 dS/cm, conductivity is measured mV divided by 100. For higher conductivity samples:
Ground truth samples and spectra were collected prior to drone activities between 9:30 and 10:00 a.m. local time.
Three drone sorties (AHS4, AHS5, and AHS7) were conducted to collect SWIR reflectance spectra over the plume and the ground sampling sites. Sorties were launched from outside the plume area and reflectance measurements were taken continuously from launch to landing. Sorties were launched sequentially, starting at 11:28 a.m. (AHS4), 11:51 a.m. (AHS5), 12:41 p.m. (AHS7) and were timed to avoid scattered cloud shadows in the study site.
2.3. Spectral Index Methods
Reflectance data from 940–1646 nm were processed to calculate the continuum-removed water index (CRWI) modified from the ground-based methods described in [
15] and the WISOIL moisture index of [
13]. The CRWI index targets the 1.4 µm water absorption driven by the O-H stretching fundamentals [
30]. Many hydrated minerals (e.g., clays) have absorption features associated with O-H absorptions, such as smectite, which is the dominant clay in the Alvord Desert. These clays typically have sharp absorption features close to 1.4 µm [
31]. For that reason, and to avoid incident photon loss from atmospheric water vapor, CRWI is calculated to measure the broad shoulder of the 1.4 µm water absorption by comparing reflectance at 1.5 µm to a continuum slope between two spectral regions that are unaffected by the 1.4 µm absorption.
CRWI is calculated as shown in Equation (3):
where ρ
1.5 is the mean measured reflectance at 1.5 µm (reflectance in spectrometer channels with centers at 1495.69 µm, 1500.85 µm, and 1506.01 µm) and ρ
1.5,continuum is the expected reflectance value calculated by fitting a continuum slope across the 1.4 µm water absorption. ρ
1.5,continuum is calculated as shown in Equation (4):
ρ1.335 is mean measured reflectance at 1.335 µm (spectral channels with centers at 1329.04 µm, 1334.35 µm, and 1339.65 µm), while ρ1.63 is mean measured reflectance at 1.63 µm (the average of spectral channels with centers at 1625.58 µm, 1630.86 µm, and 1636.14 µm). CRWI, then, is the difference between the continuum slope value at 1.5 µm and the measured reflectance at 1.5 µm. In all cases, averaging is conducted to increase signal to noise.
This CRWI index is a modification of that defined by [
15], which subtracted average reflectance at the deepest measurable part of the absorption feature from the continuum reflectance. Under the lab conditions described in [
15], reflectance values were reported at the minimum absorption feature value, typically 1.425 μm. Instead, CRWI, as formulated here, avoids directly targeting the center of the 1.4 µm water absorption feature, and instead measures on the shoulder of the absorption at 1.5 µm, outside the free and/or mineral-bound water absorption.
The WISOIL index is calculated using methods described in [
13]:
where ρ
1.45 and ρ
1.3 are measured reflectance at 1.45 and 1.3 µm, respectively (as measured at spectral channels centered on 1.449 µm and 1.302 µm).
2.4. Lab Methods
Soil samples were dried to determine gravimetric water content (GWC) via weighing of wet and dry soil splits. Samples were oven-dried at 105 °C for 24 h. High-temperature oven drying resulted in both removal of pore waters and also mineralogically bound water in clays. Net GWC is reported as the measured GWC minus the minimum value of GWC measured from the air-dried samples collected from the field, recognizing that smectite-dominated soils may contain up to 30% mineral-bound water by mass which would be removed by drying at 105 °C, but would not have been removed via lower-temperature air-drying) [
32]. The potential residual water content (pore-bound or grain-bound water) for each sample was determined by saturating the oven-dried soils and then air drying them at room temperature, under a fume hood, for three weeks.
Approximately 50 g of each (dry) sample was prepared for grain size analysis. Samples were rid of organic matter using hydrogen peroxide, were mixed with 100 mL of dispersing agent (75 g of powdered Calgon cleaning solution and 1500 mL of distilled water), and were dispersed in a Vitamix immersion blending system. The samples were centrifuged at 7200 rpm for 15 min to settle all particles. The solution was decanted and sediment was introduced to the METER Pario automated settling column system for grain size analysis [
33].
The soil salt extract electrical conductivity of each sample was determined using a Mettler Toledo FiveEasy Plus Conductivity meter. Sediment pastes were made using an ~100:1 water to soil extract by mass. Mixtures were blended, settled, and the filtered using 0.45 µm syringe filters. Salinity is reported as electrical conductivity-derived total dissolved solids in ppm (e.g.,
Table 1). Soil salt extract composition was measured using a Metrohm 930 Compact IC Flex ion chromatograph to determine sodium concentration (the primary cation in Alvord desert region hot springs.
A calibration curve for Alvord Desert soils was created via linear regression of ground-measured reflectance-derived CRWI values to lab-measured water content (net GWC). The linear relationship between CRWI and net GWC was inverted to provide a predictive relationship from which drone-measured CRWI values could be used to predict surface soil water contents. These predicted net GWC values were then compared to lab-measured net GWC values from ground control points to evaluate the predictive model.
2.5. Geospatial Analysis and Orbital Data Intercomparison Methods
Orthomosaics and a stereo digital elevation model of the study area were generated from geotagged drone color photographs and positional data using Agisoft Photoscan Pro. Approximately 30 ground-control targets were included in the UAS photograph dataset to provide spatial registration. Ground control target locations were determined using an Archer Field PC with an external GPS antenna. Orthomosaics were generated with <1 cm spatial resolution and were orthorectified using the concurrently produced digital elevation model.
Two multispectral soil moisture parameters were also examined at the site: normalized difference vegetation index: NDVI, which has been shown to inversely correlate with bare land soil moisture by [
14], and normalized difference water index (NDWI—here, the open water index described by [
34] is used to target standing water in the AHS plume—not the NDWI plant moisture index of [
35]. NDWI in the [
34] formulation is the ratio between green and SWIR channels:
where ρ
green and ρ
SWIR are reflectance in Landsat 8 bands 3 and 6, as processed and delivered as surface reflectance by [
36] via USGS Earth Explorer. NDVI was calculated as
where ρ
NIR and ρ
Red are surface reflectance in NIR and red channels, respectively, as processed and delivered via Planet Explorer.
NDWI was calculated using 30 m/pixel Landsat 8 image LC08_L1TP_043030_20190816_20190902, collected 16 August 2019 (five days after ground sampling and airborne measurements). NDVI was calculated using 3 m/pixel PlanetScope image 20190812_181021 collected during field operations on 12 August 2019. Both Landsat 8 and Planet images were processed to surface reflectance using standard methods (e.g., [
36]). NDWI and NDVI values were extracted from the gridded data at the ground control sampling points in ESRI ArcMap, as well as at all airborne spot spectra points for which CRWI was calculated.
3. Results
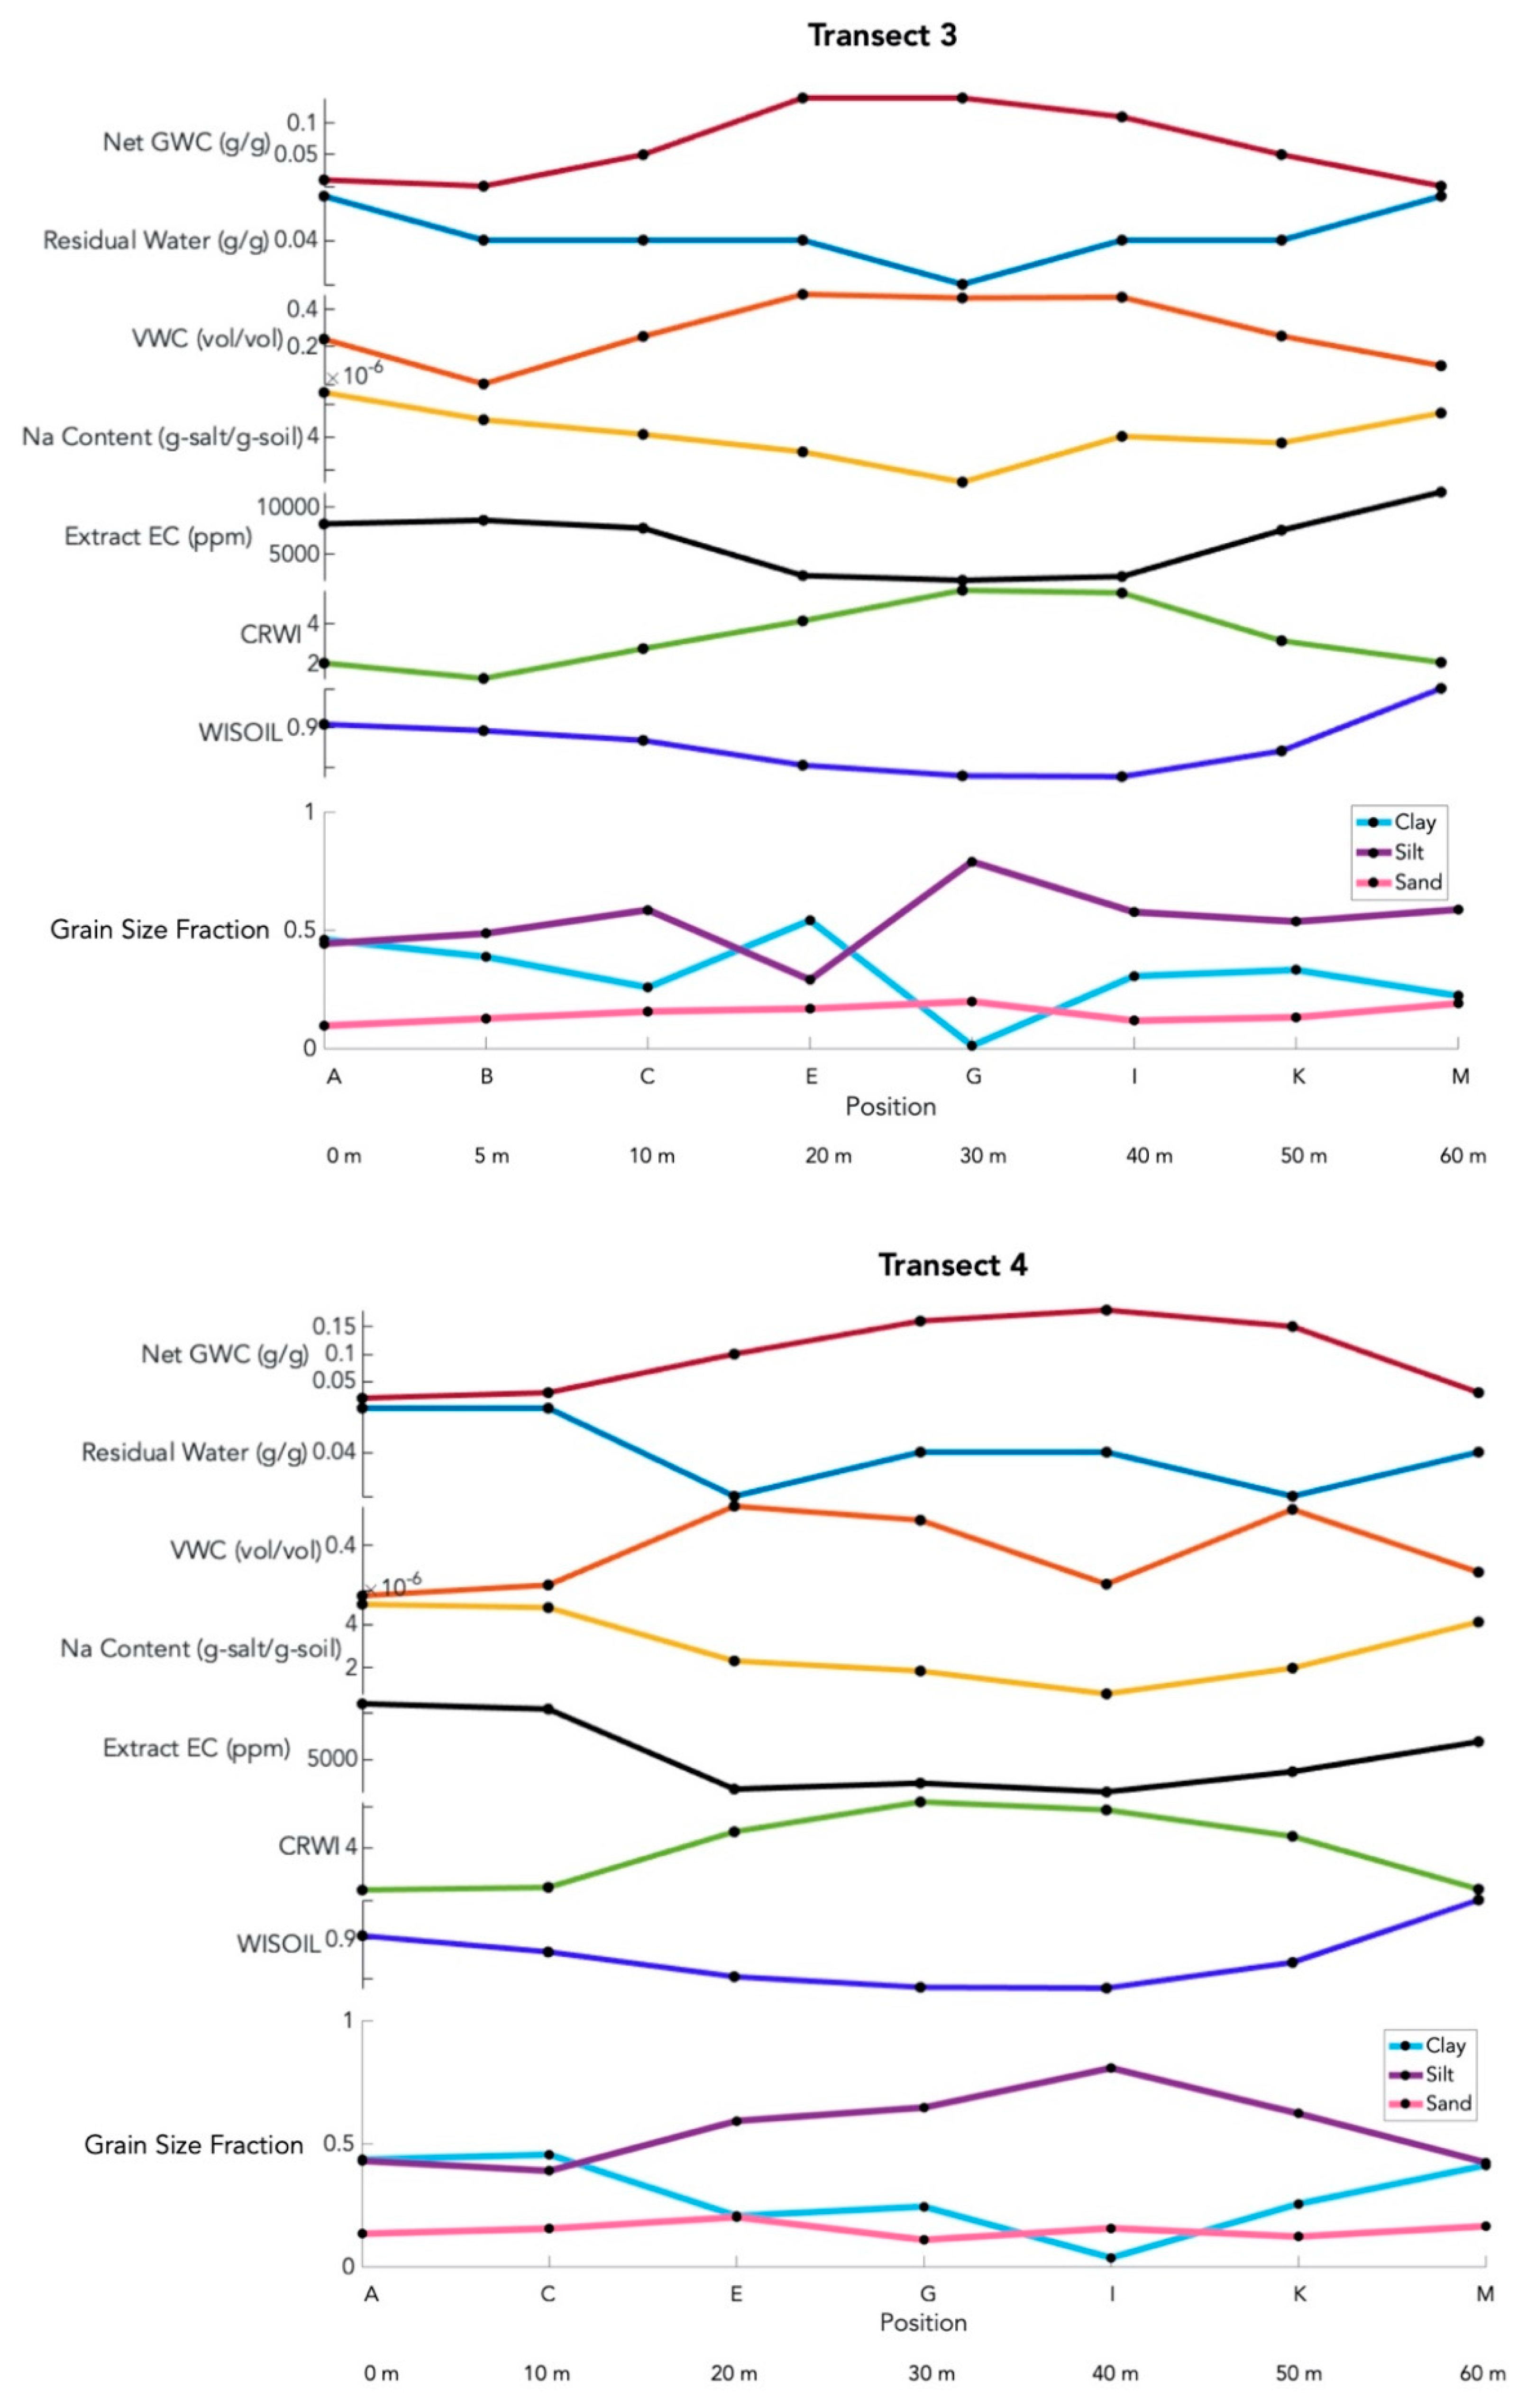
Ground and airborne observations show that the Alvord hot spring discharge plume is a digitate zone of soil with spatially heterogenous moisture, grain size, and salinity conditions that vary over meter length scales (
Figure 4). All graphical spectroscopic results are shown with standard error (dataset standard deviation divided by square root of sample size) unless otherwise indicated.
The Alvord hot spring plume varies in net soil moisture content from dry (0% by mass) to water saturated (18% by mass). The plume is dry on the margins and becomes increasingly wet towards the center (
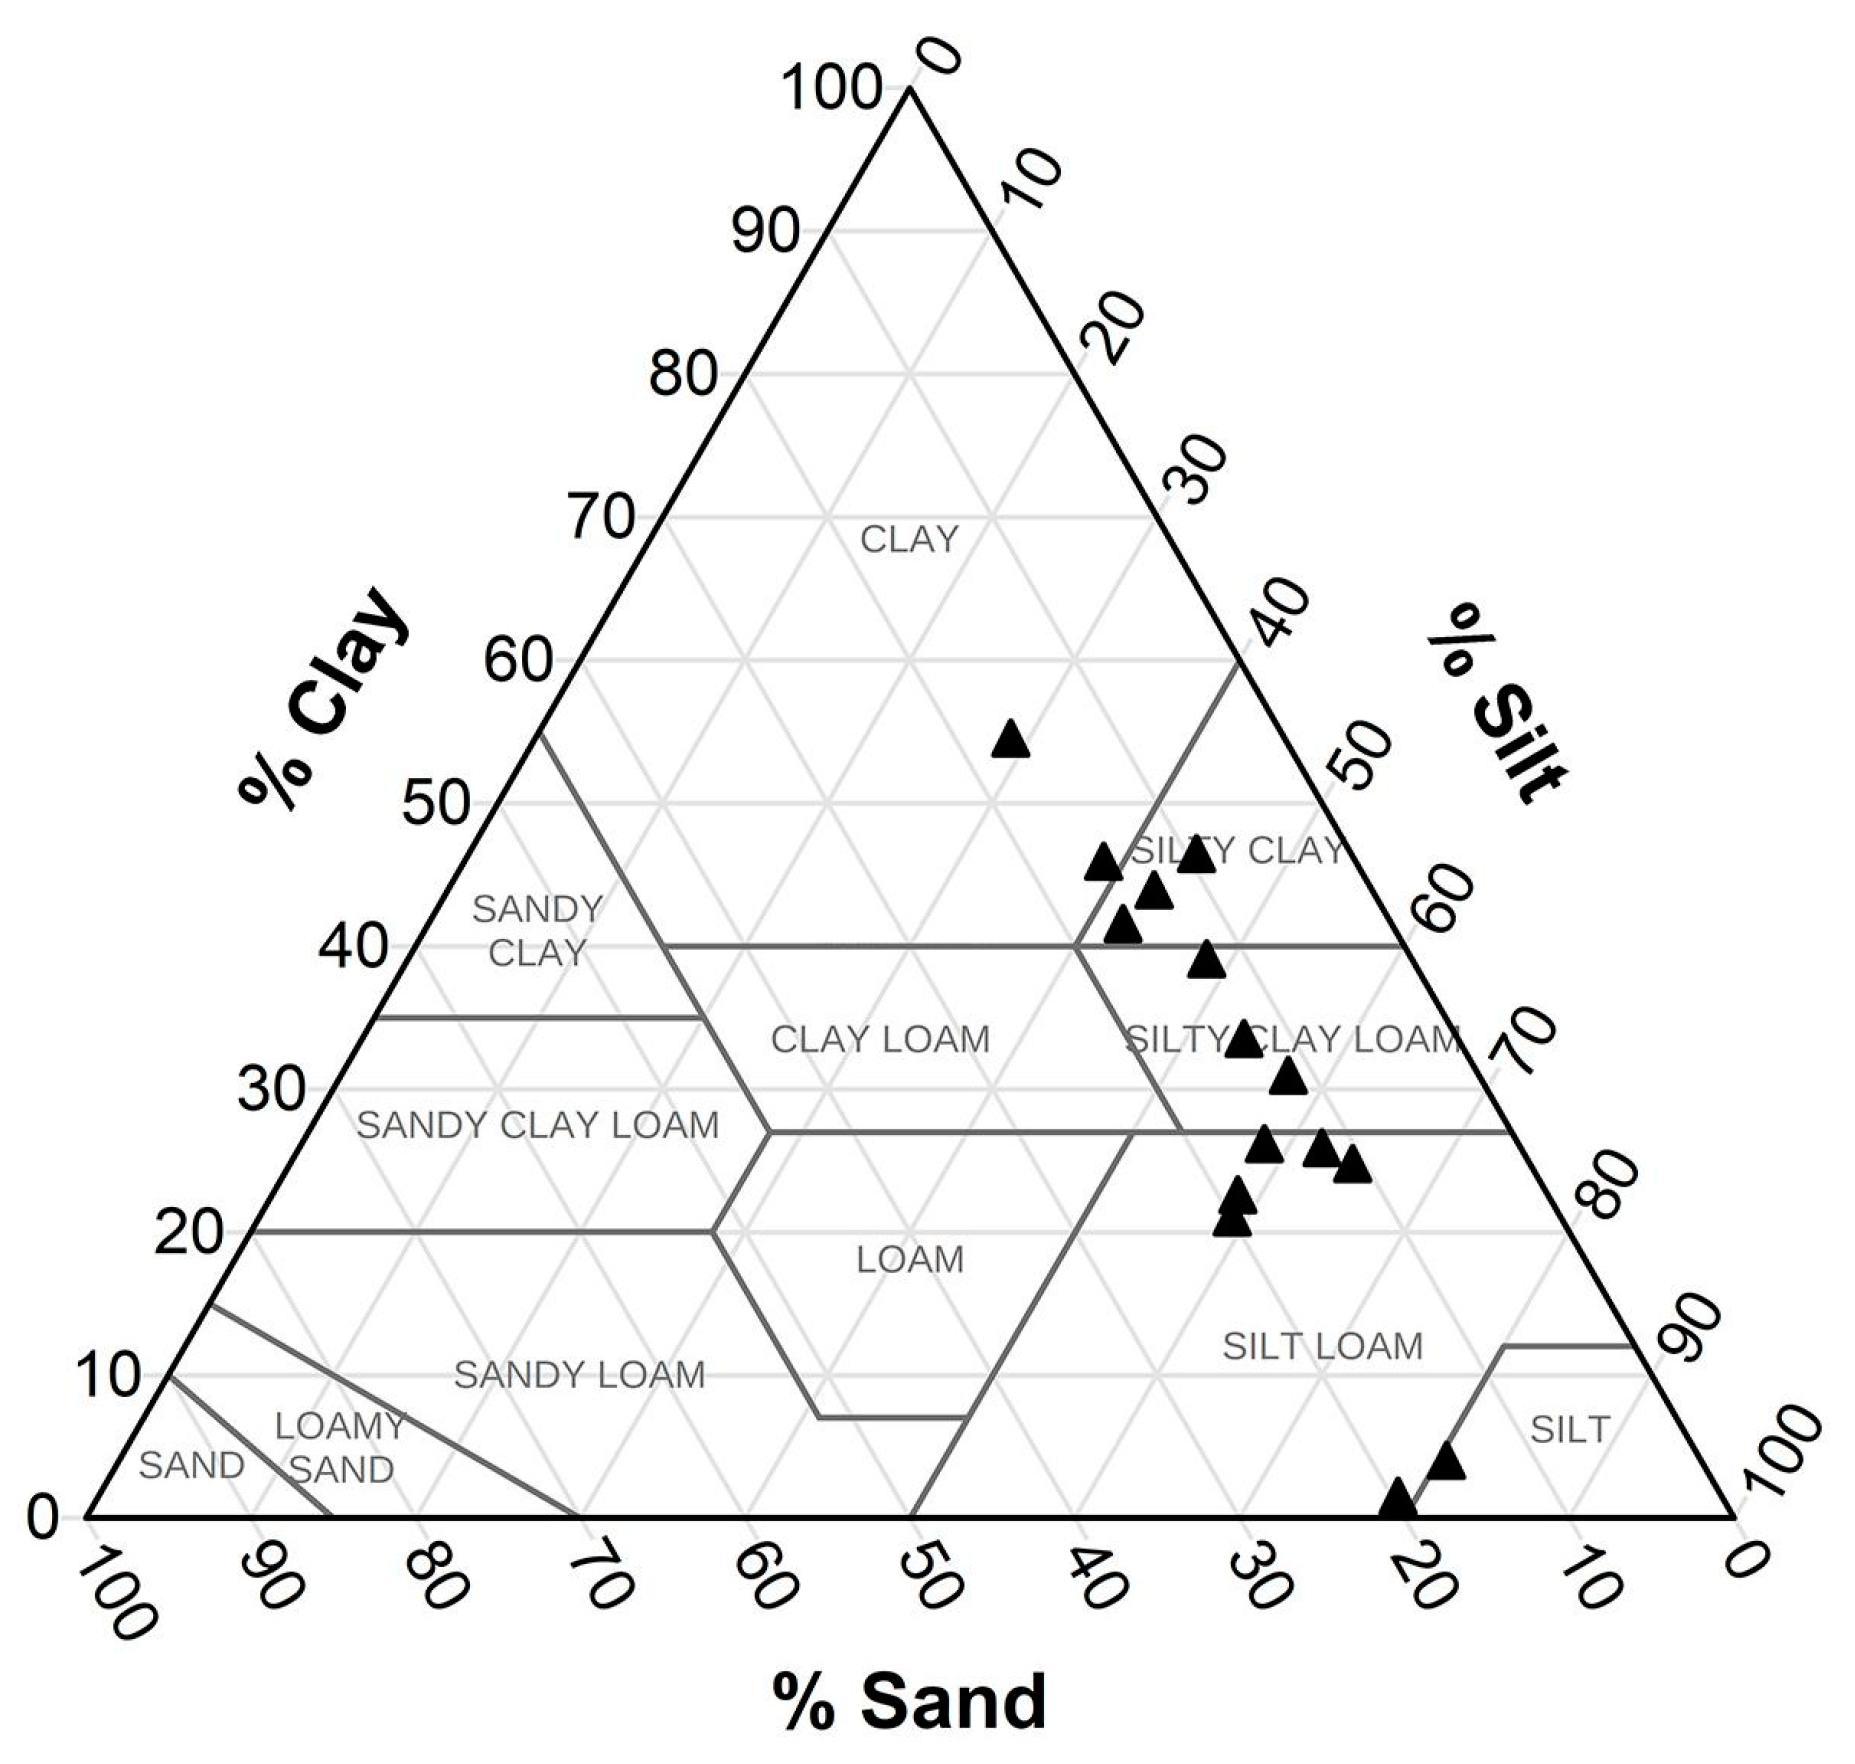
Figure 4), measured both via gravimetric and dielectric permittivity methods. The plume soils are saltier at the margins, having elevated total dissolved solids and higher concentrations of sodium ions at edge sites than in the plume interior. The plume soils are silt and clay dominated; collected samples are 30–80% silt, up to 55% clay, and <20% sand (
Figure 5). Soils are enriched in clay at the margins of the plume and are dominated by silt-sized grains in the interior, while sand is dispersed throughout the plume and does not vary systematically with location (
Figure 4).
Ground-based and drone-borne reflectance measurements show slight increases in reflectivity near ~1.4 µm, with the shoulders of the 1.4 µm absorption feature appearing most strongly and consistently near 1.5 µm (
Figure 2). Reflectivity at 1.5 µm is used as the basis for calculating CRWI, the continuum-removed water index.
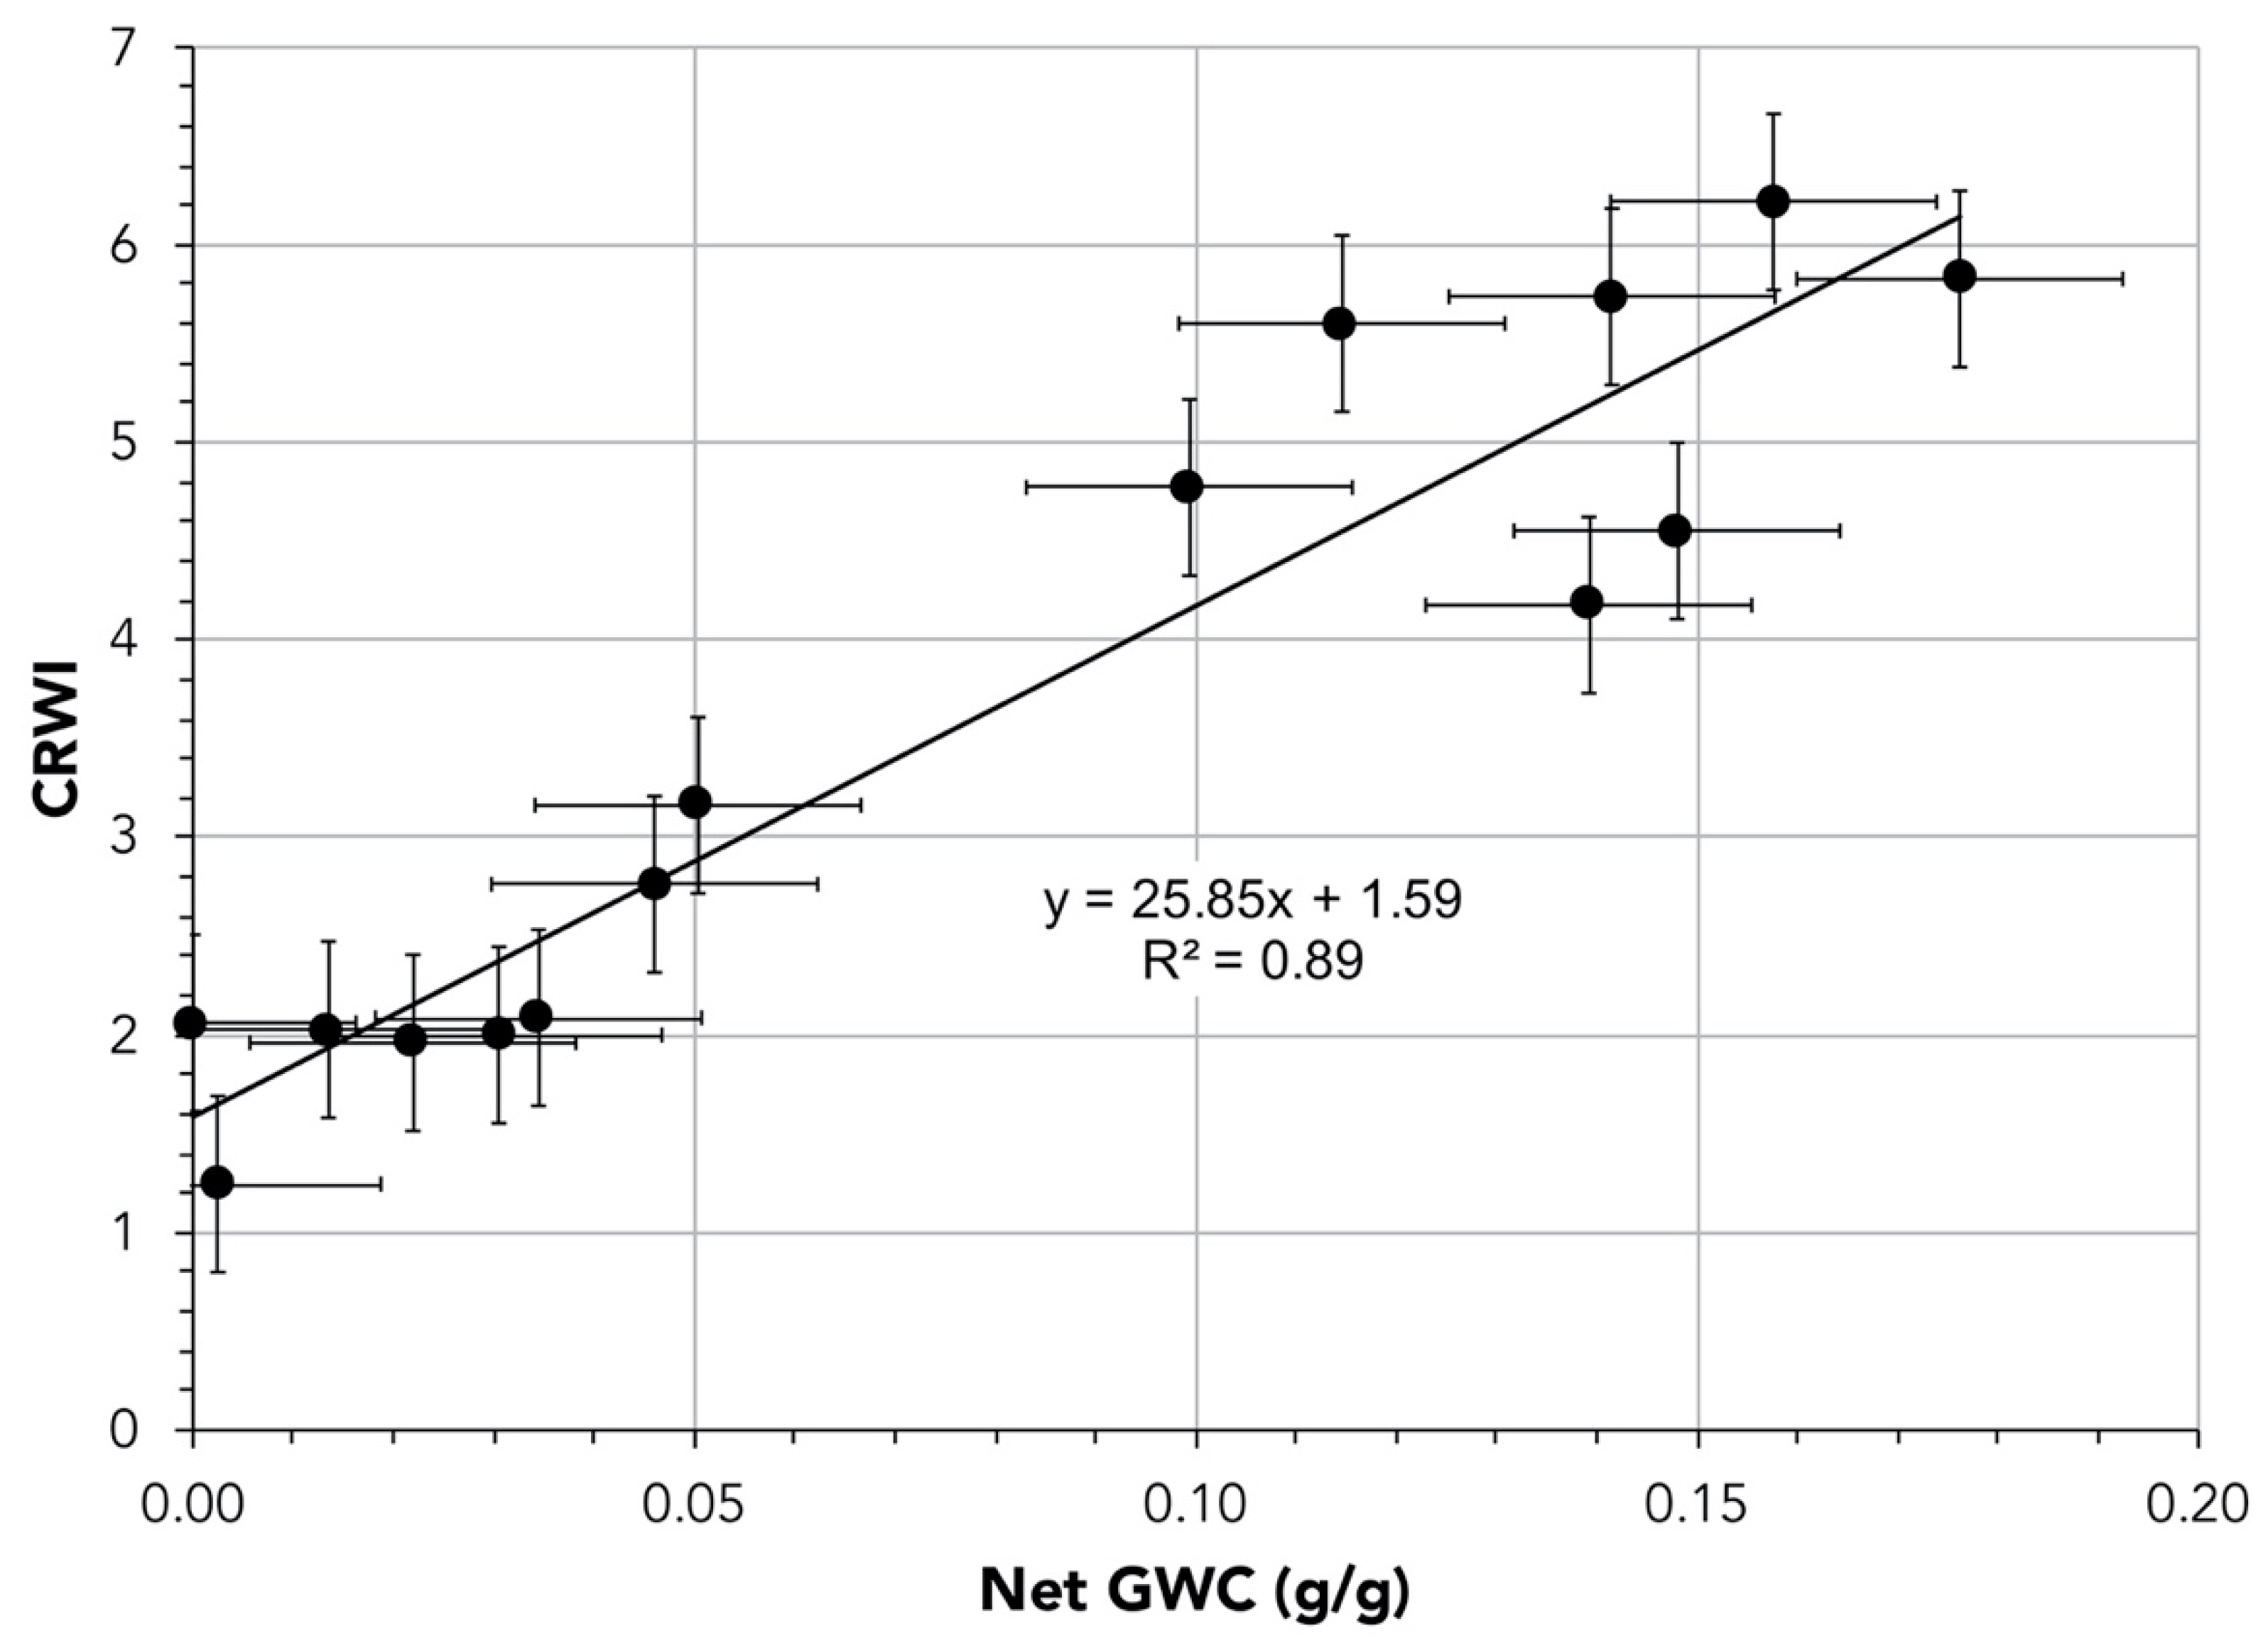
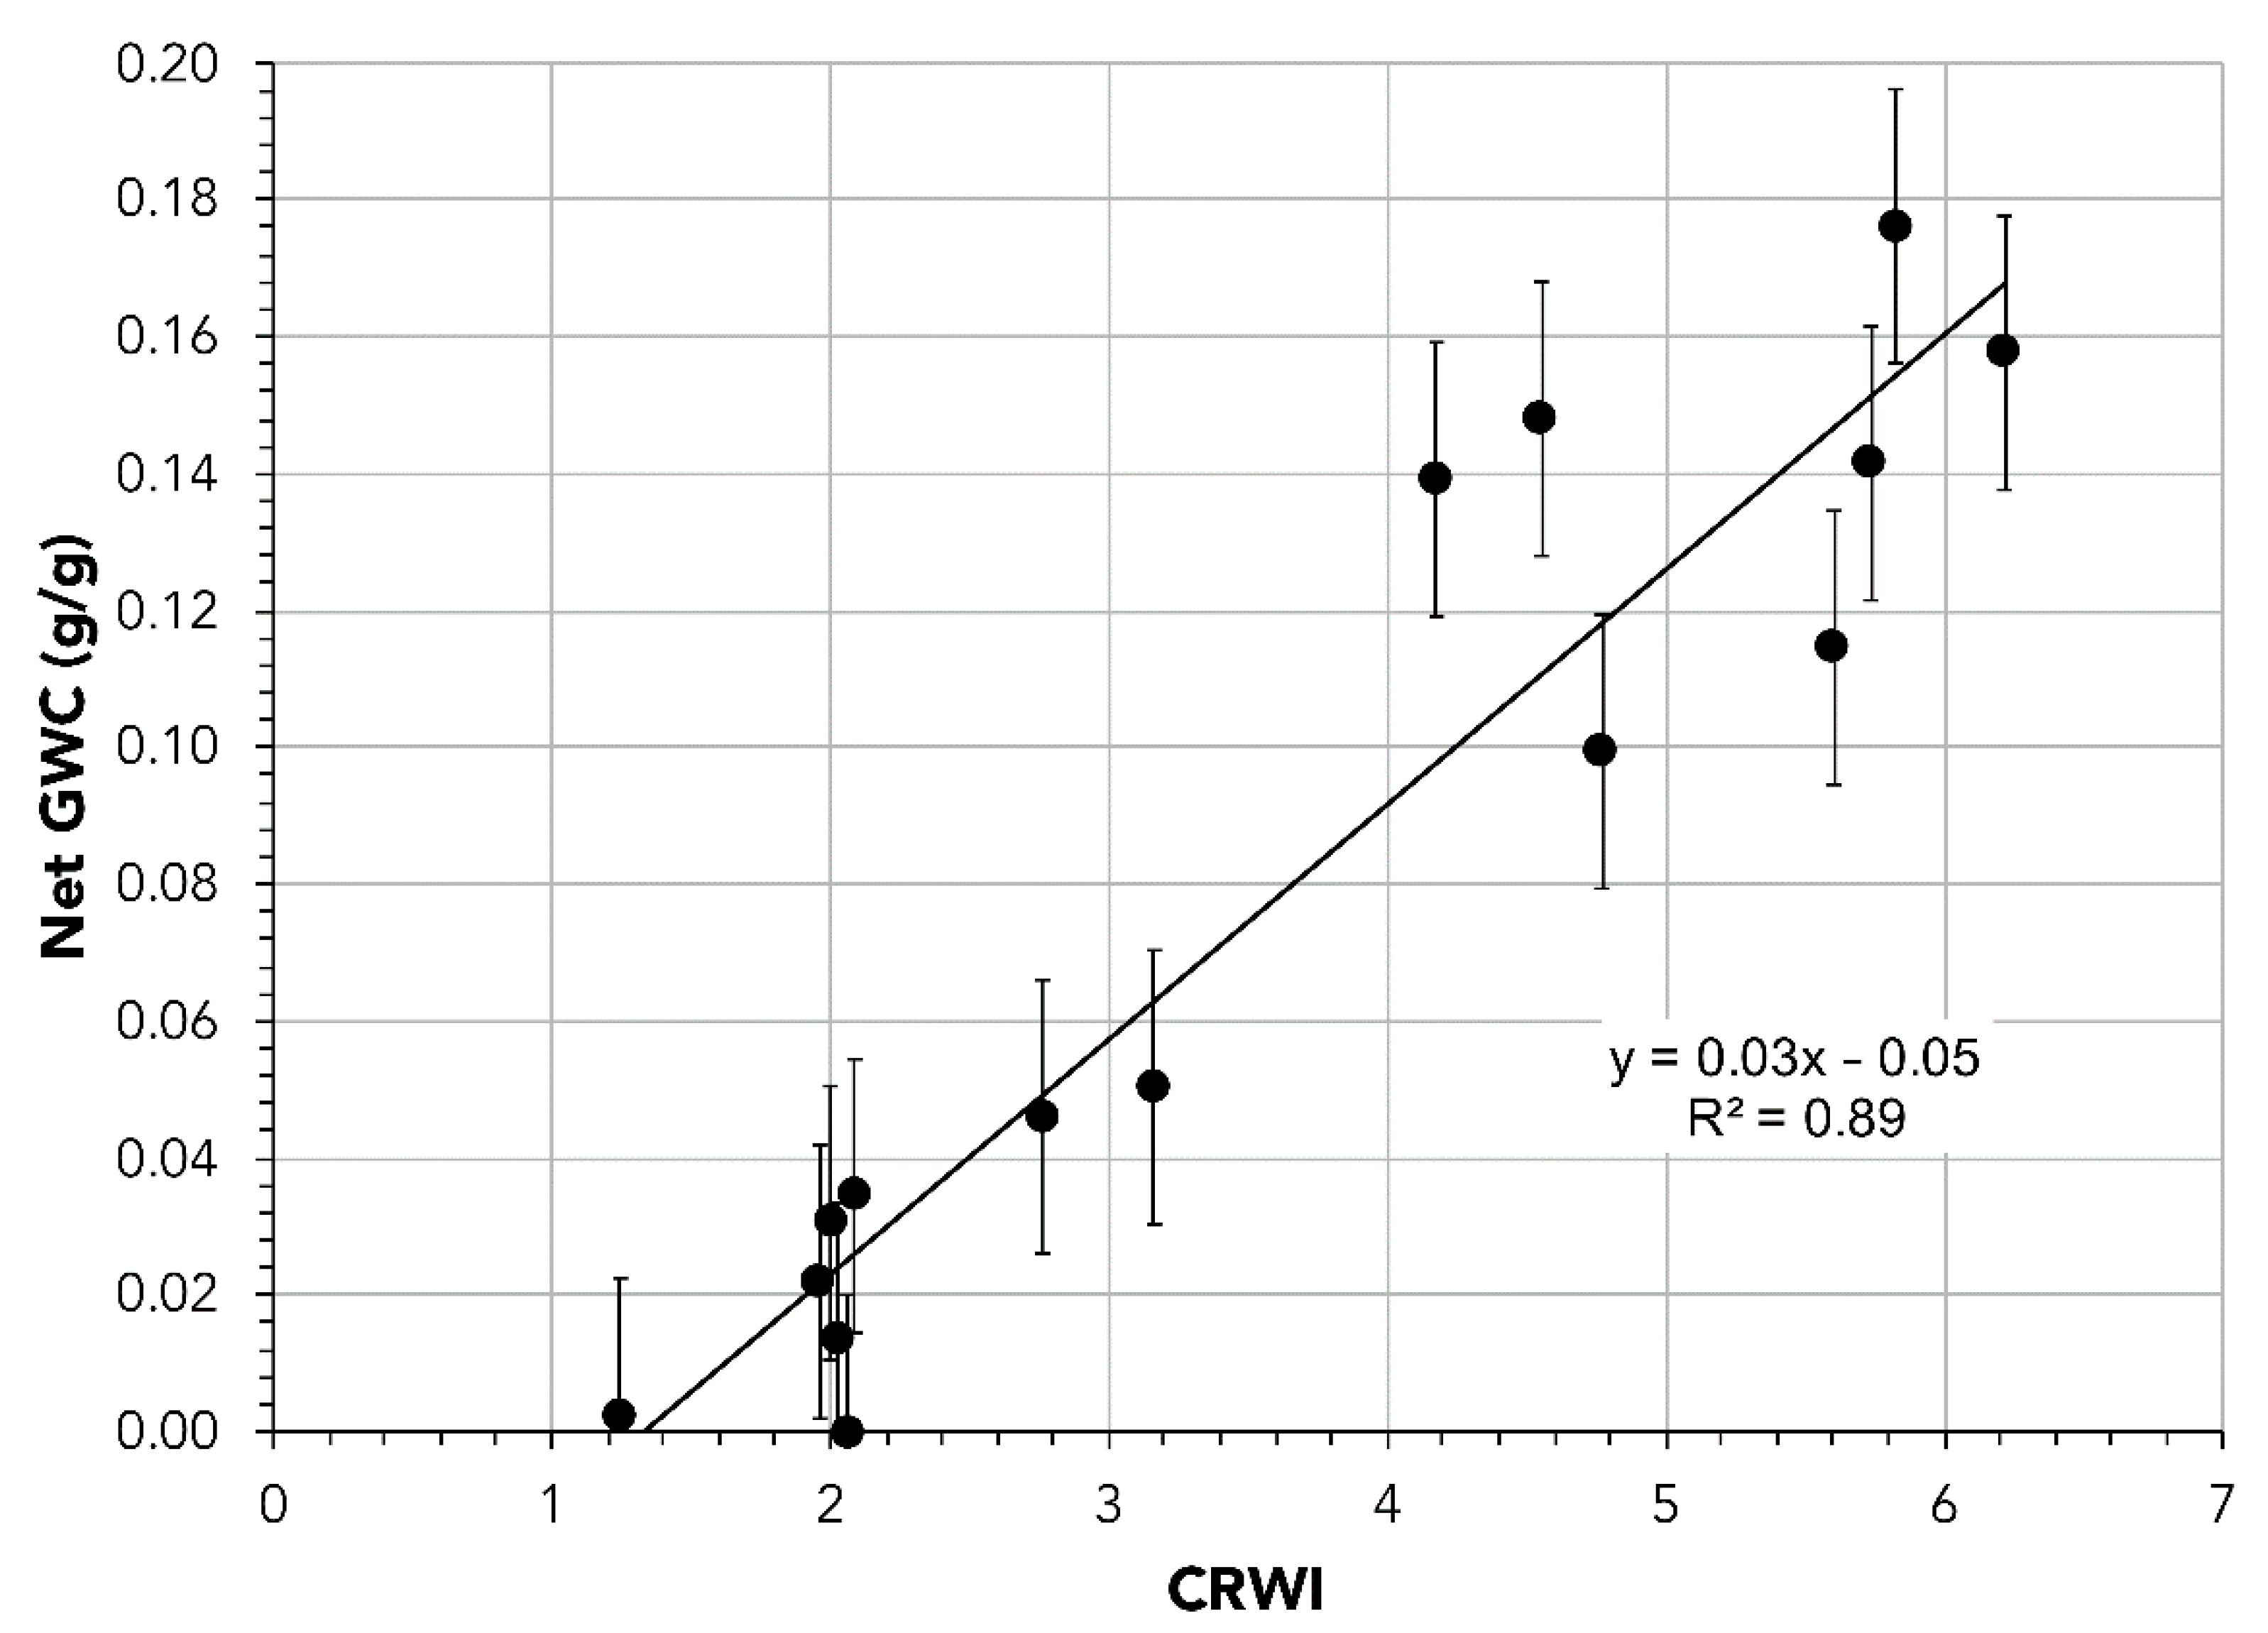
Continuum-removed water index correlates strongly with net soil moisture (
Figure 6). CRWI increases linearly with increasing soil moisture content (R
2 = 0.89,
p < 0.001) (Here and throughout linear regression correlation coefficients, R
2, are reported along with
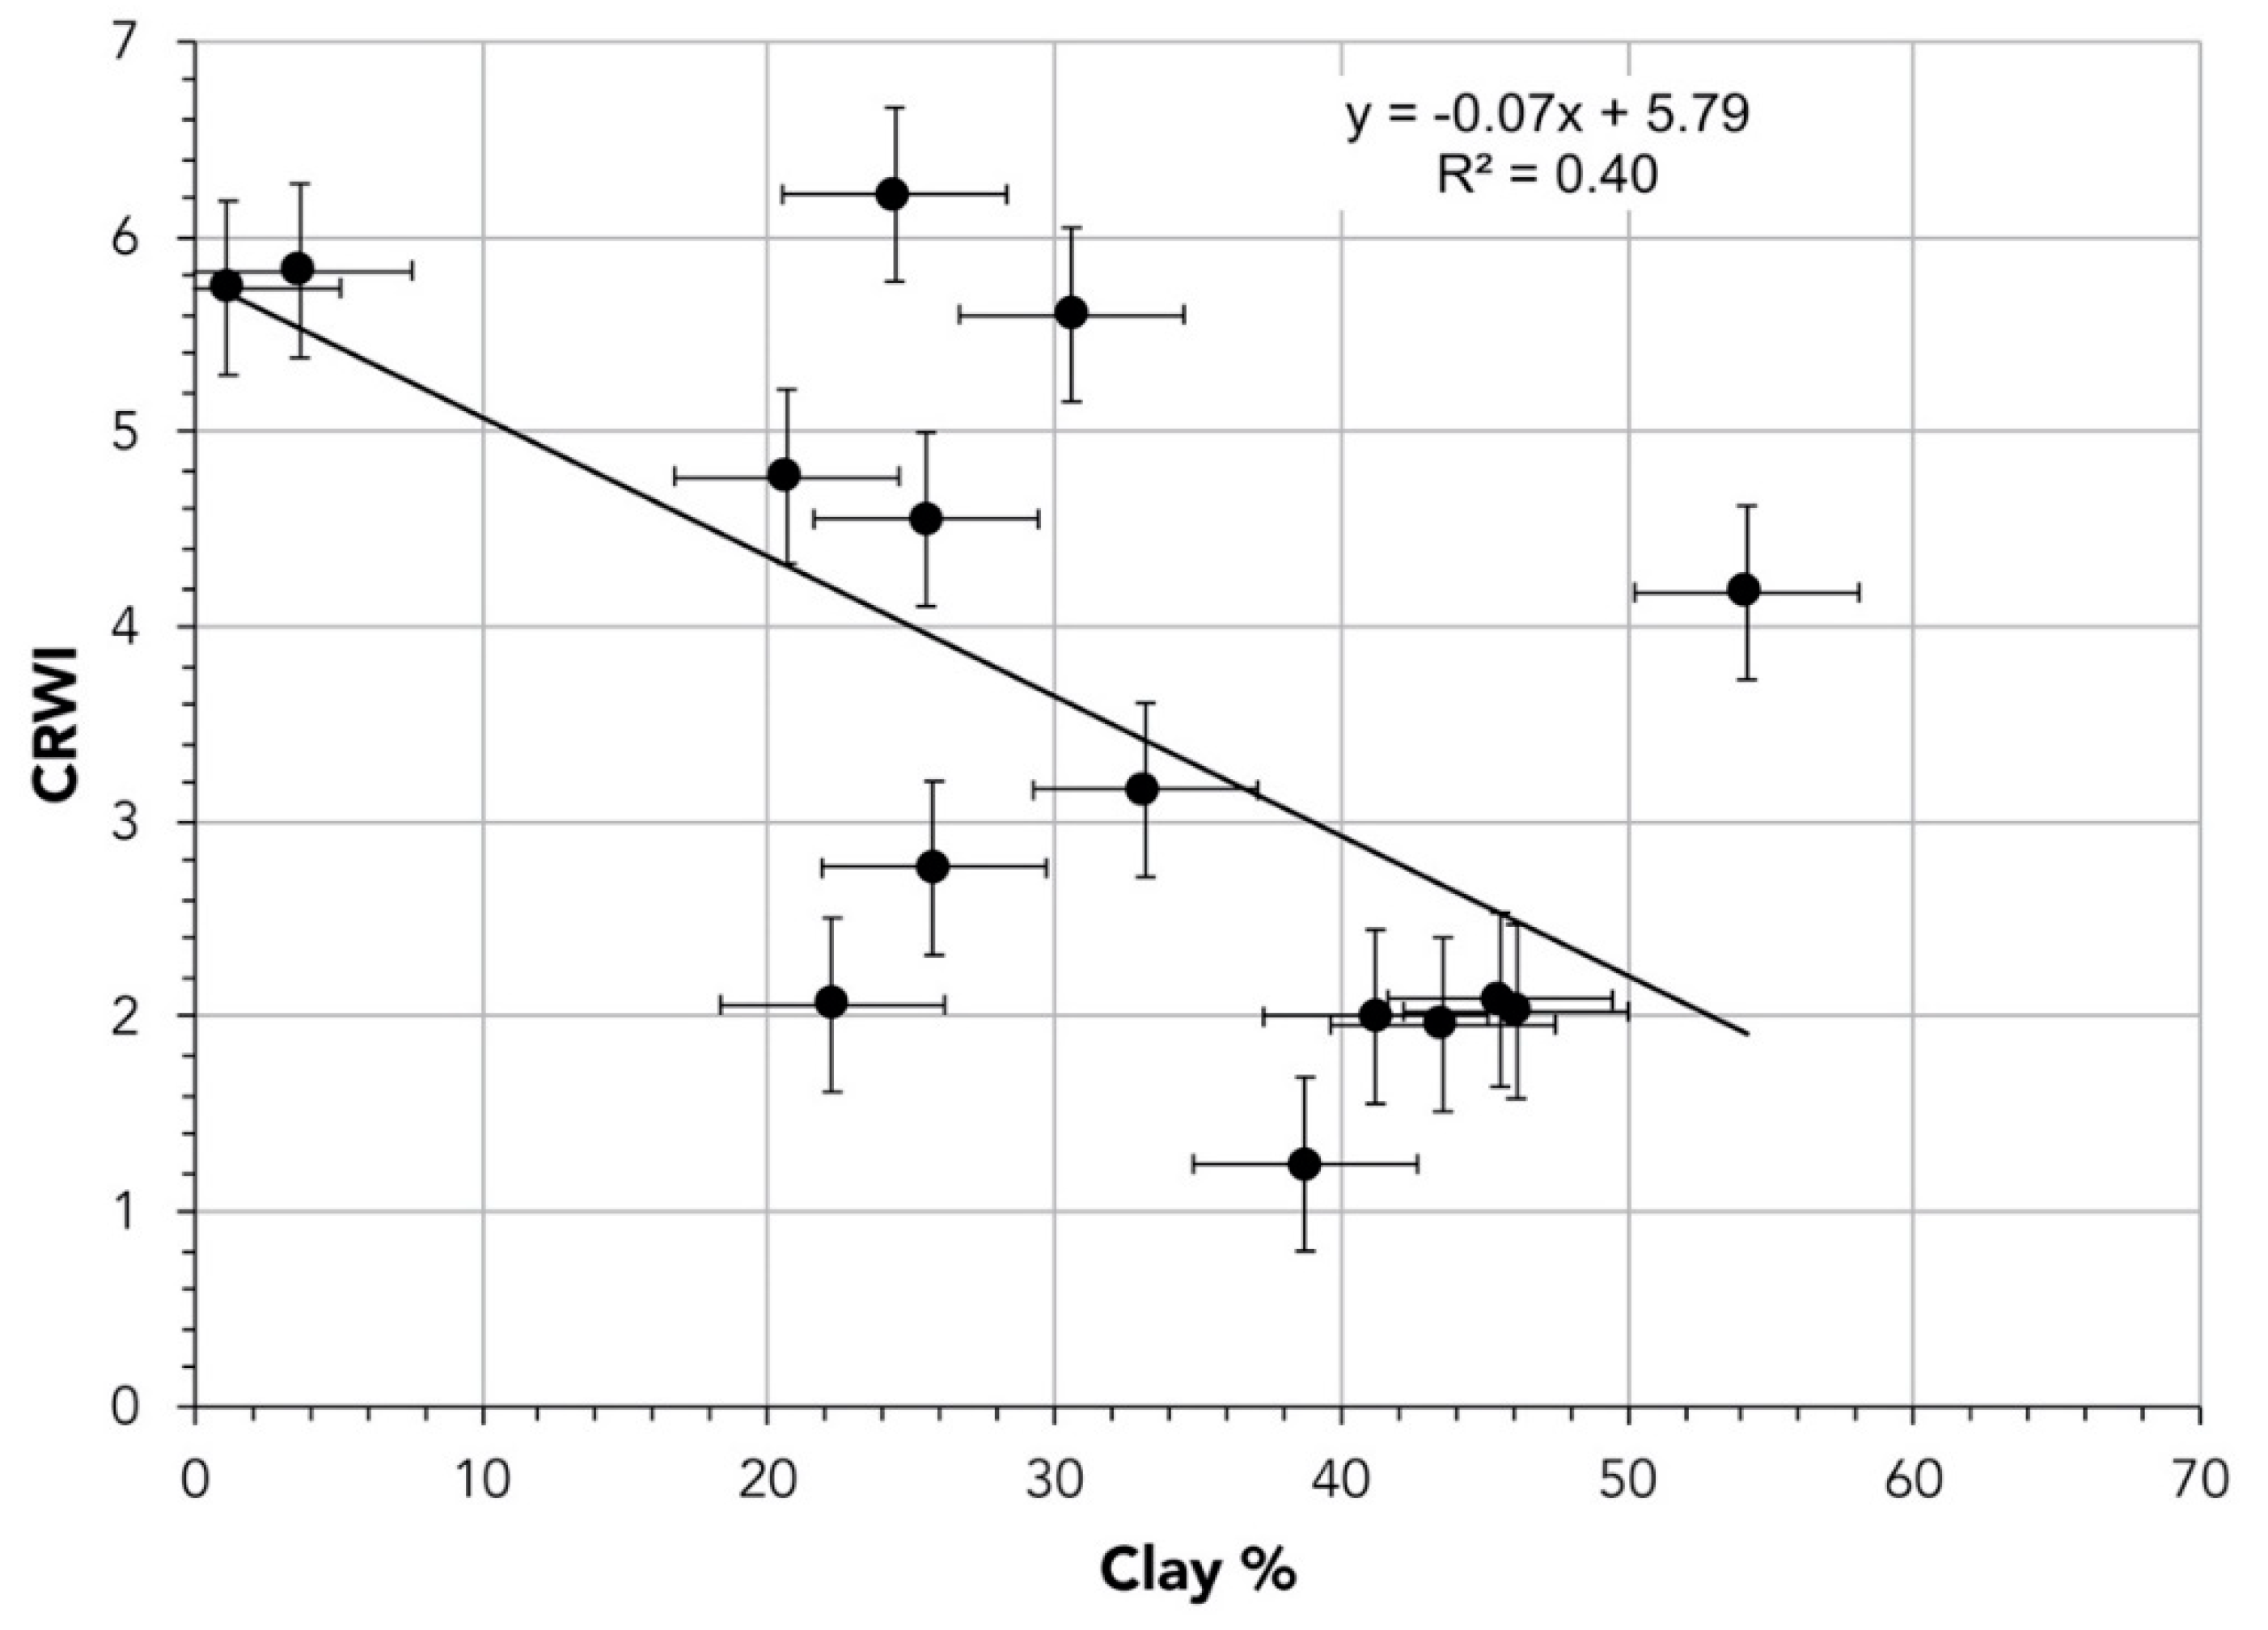
p values for model slope). Although wet field samples were enriched in clay and silt-sized particles, CRWI does not positively correlate with clay content in the soil. Instead, CRWI is inversely correlated with clay content (
Figure 7).
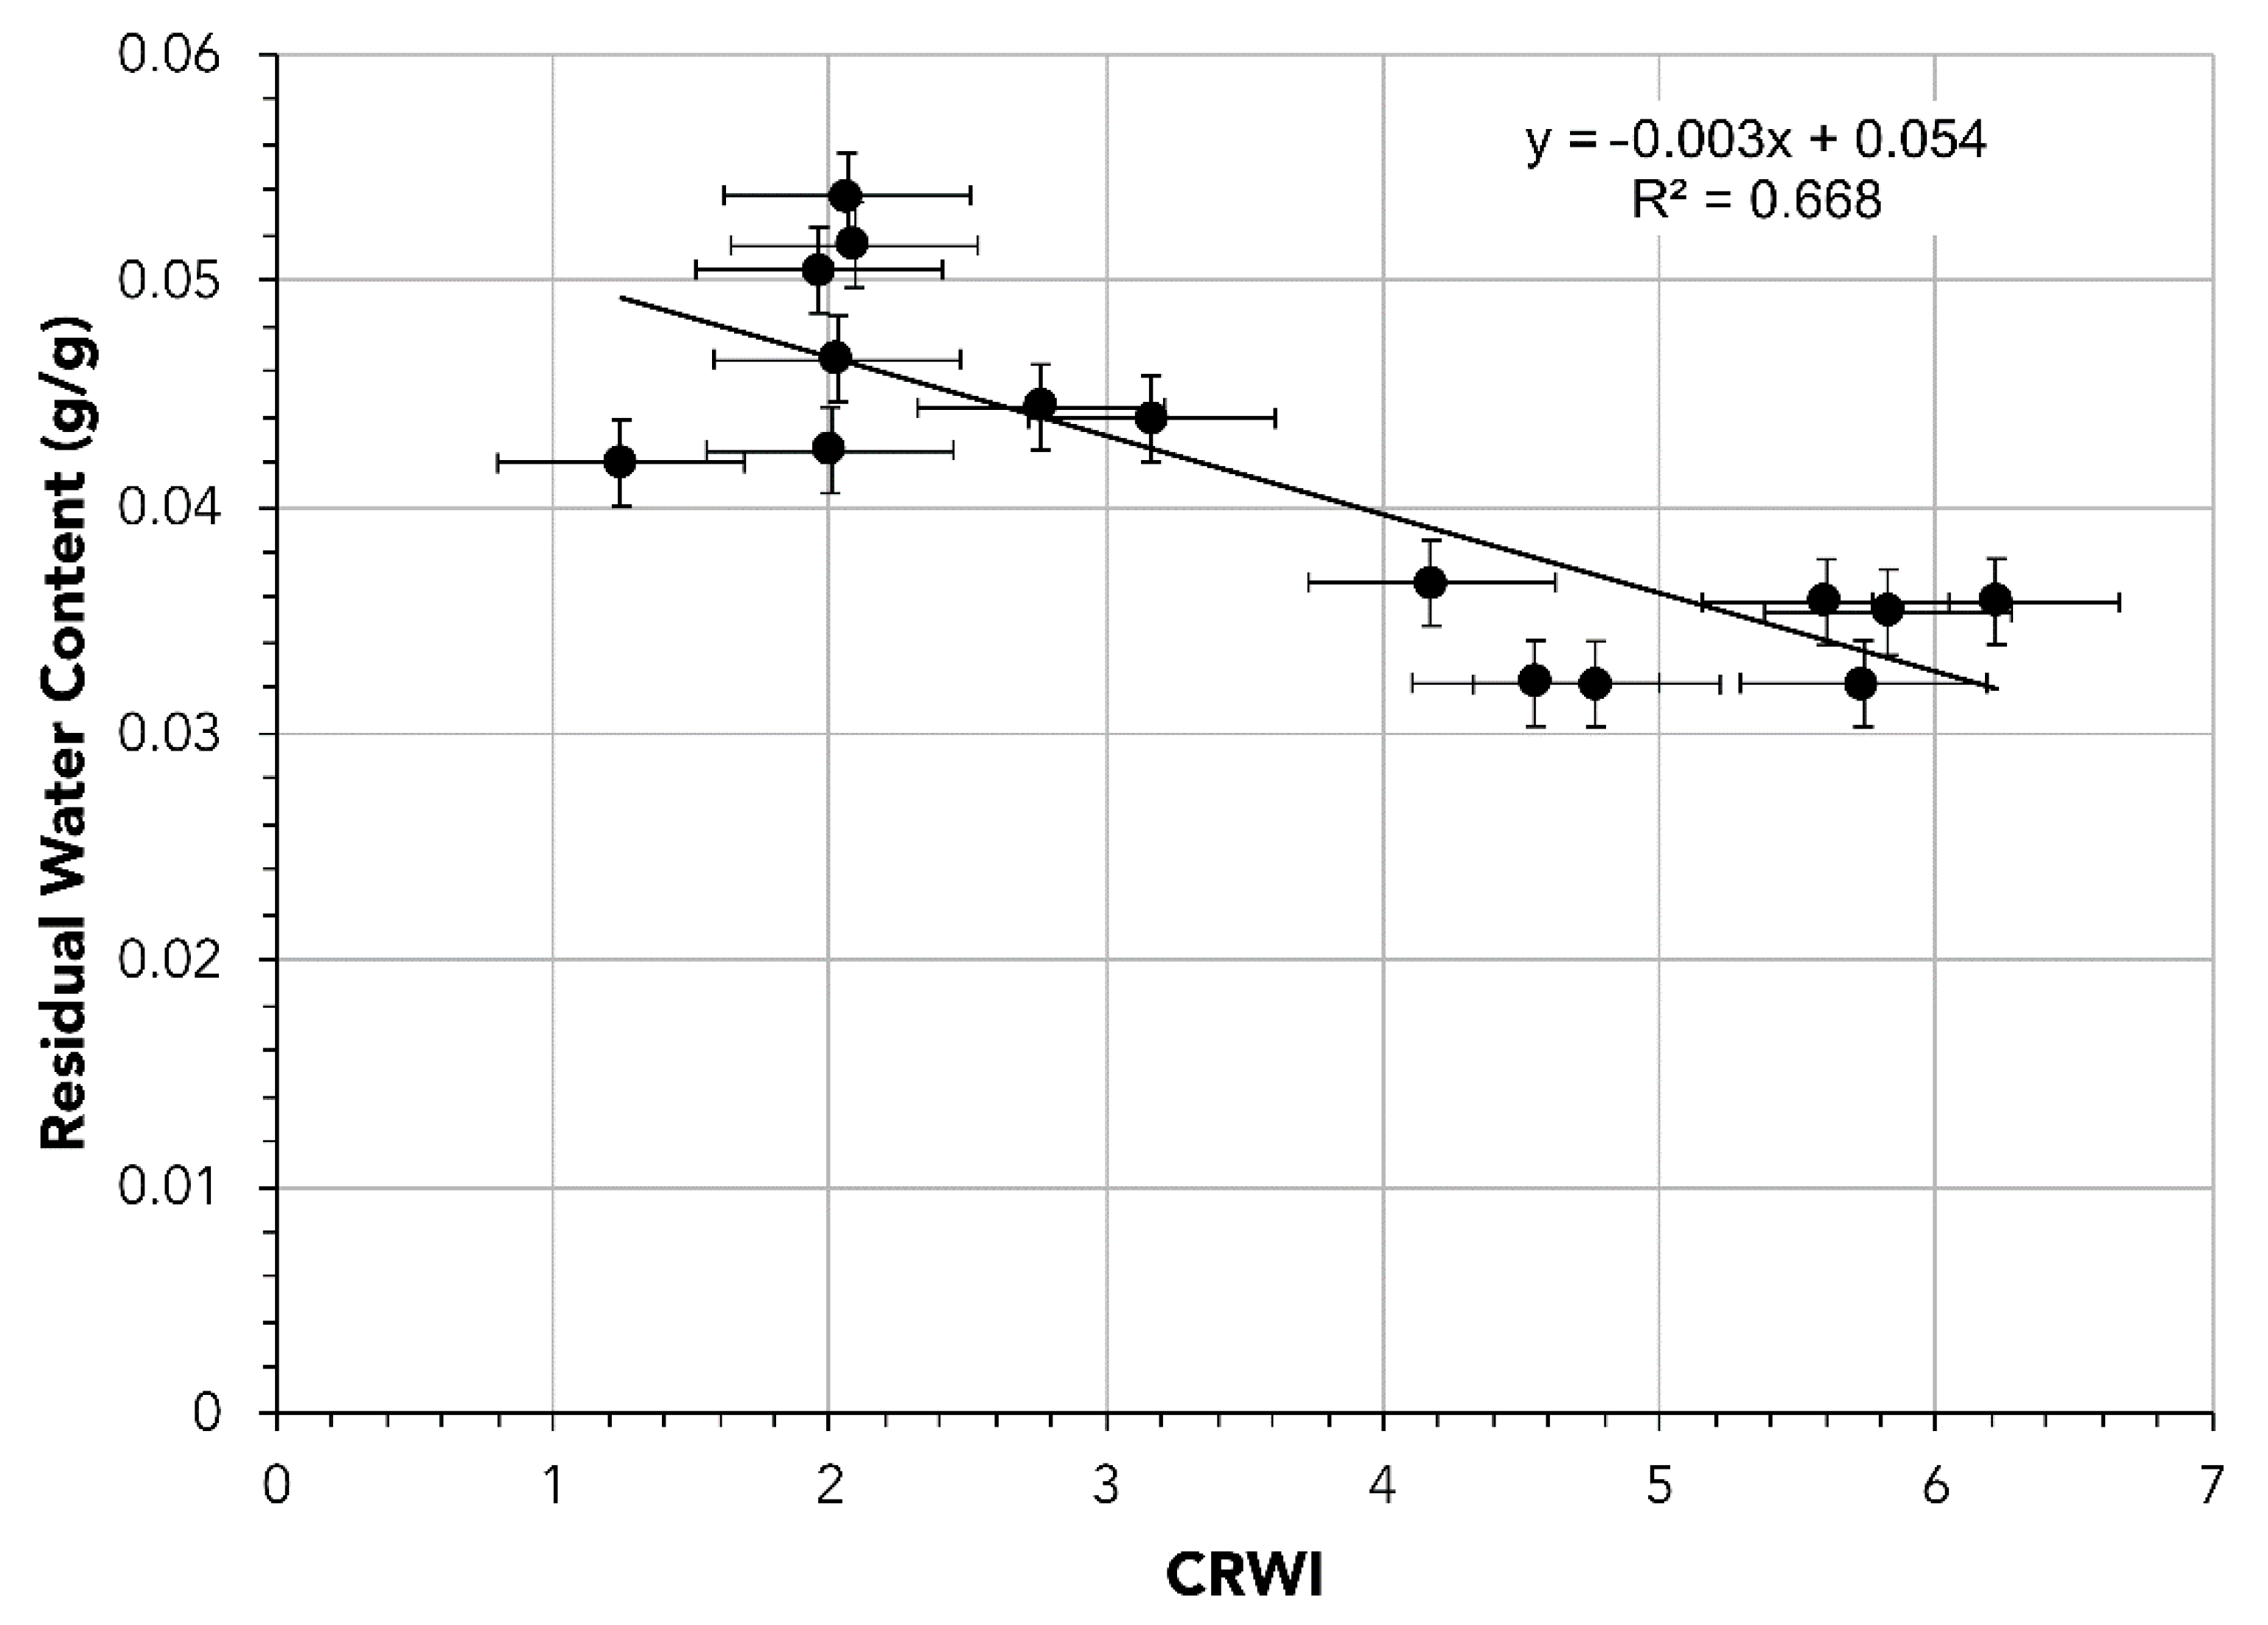
CRWI is also inversely related to potential residual water content measured in the soils (
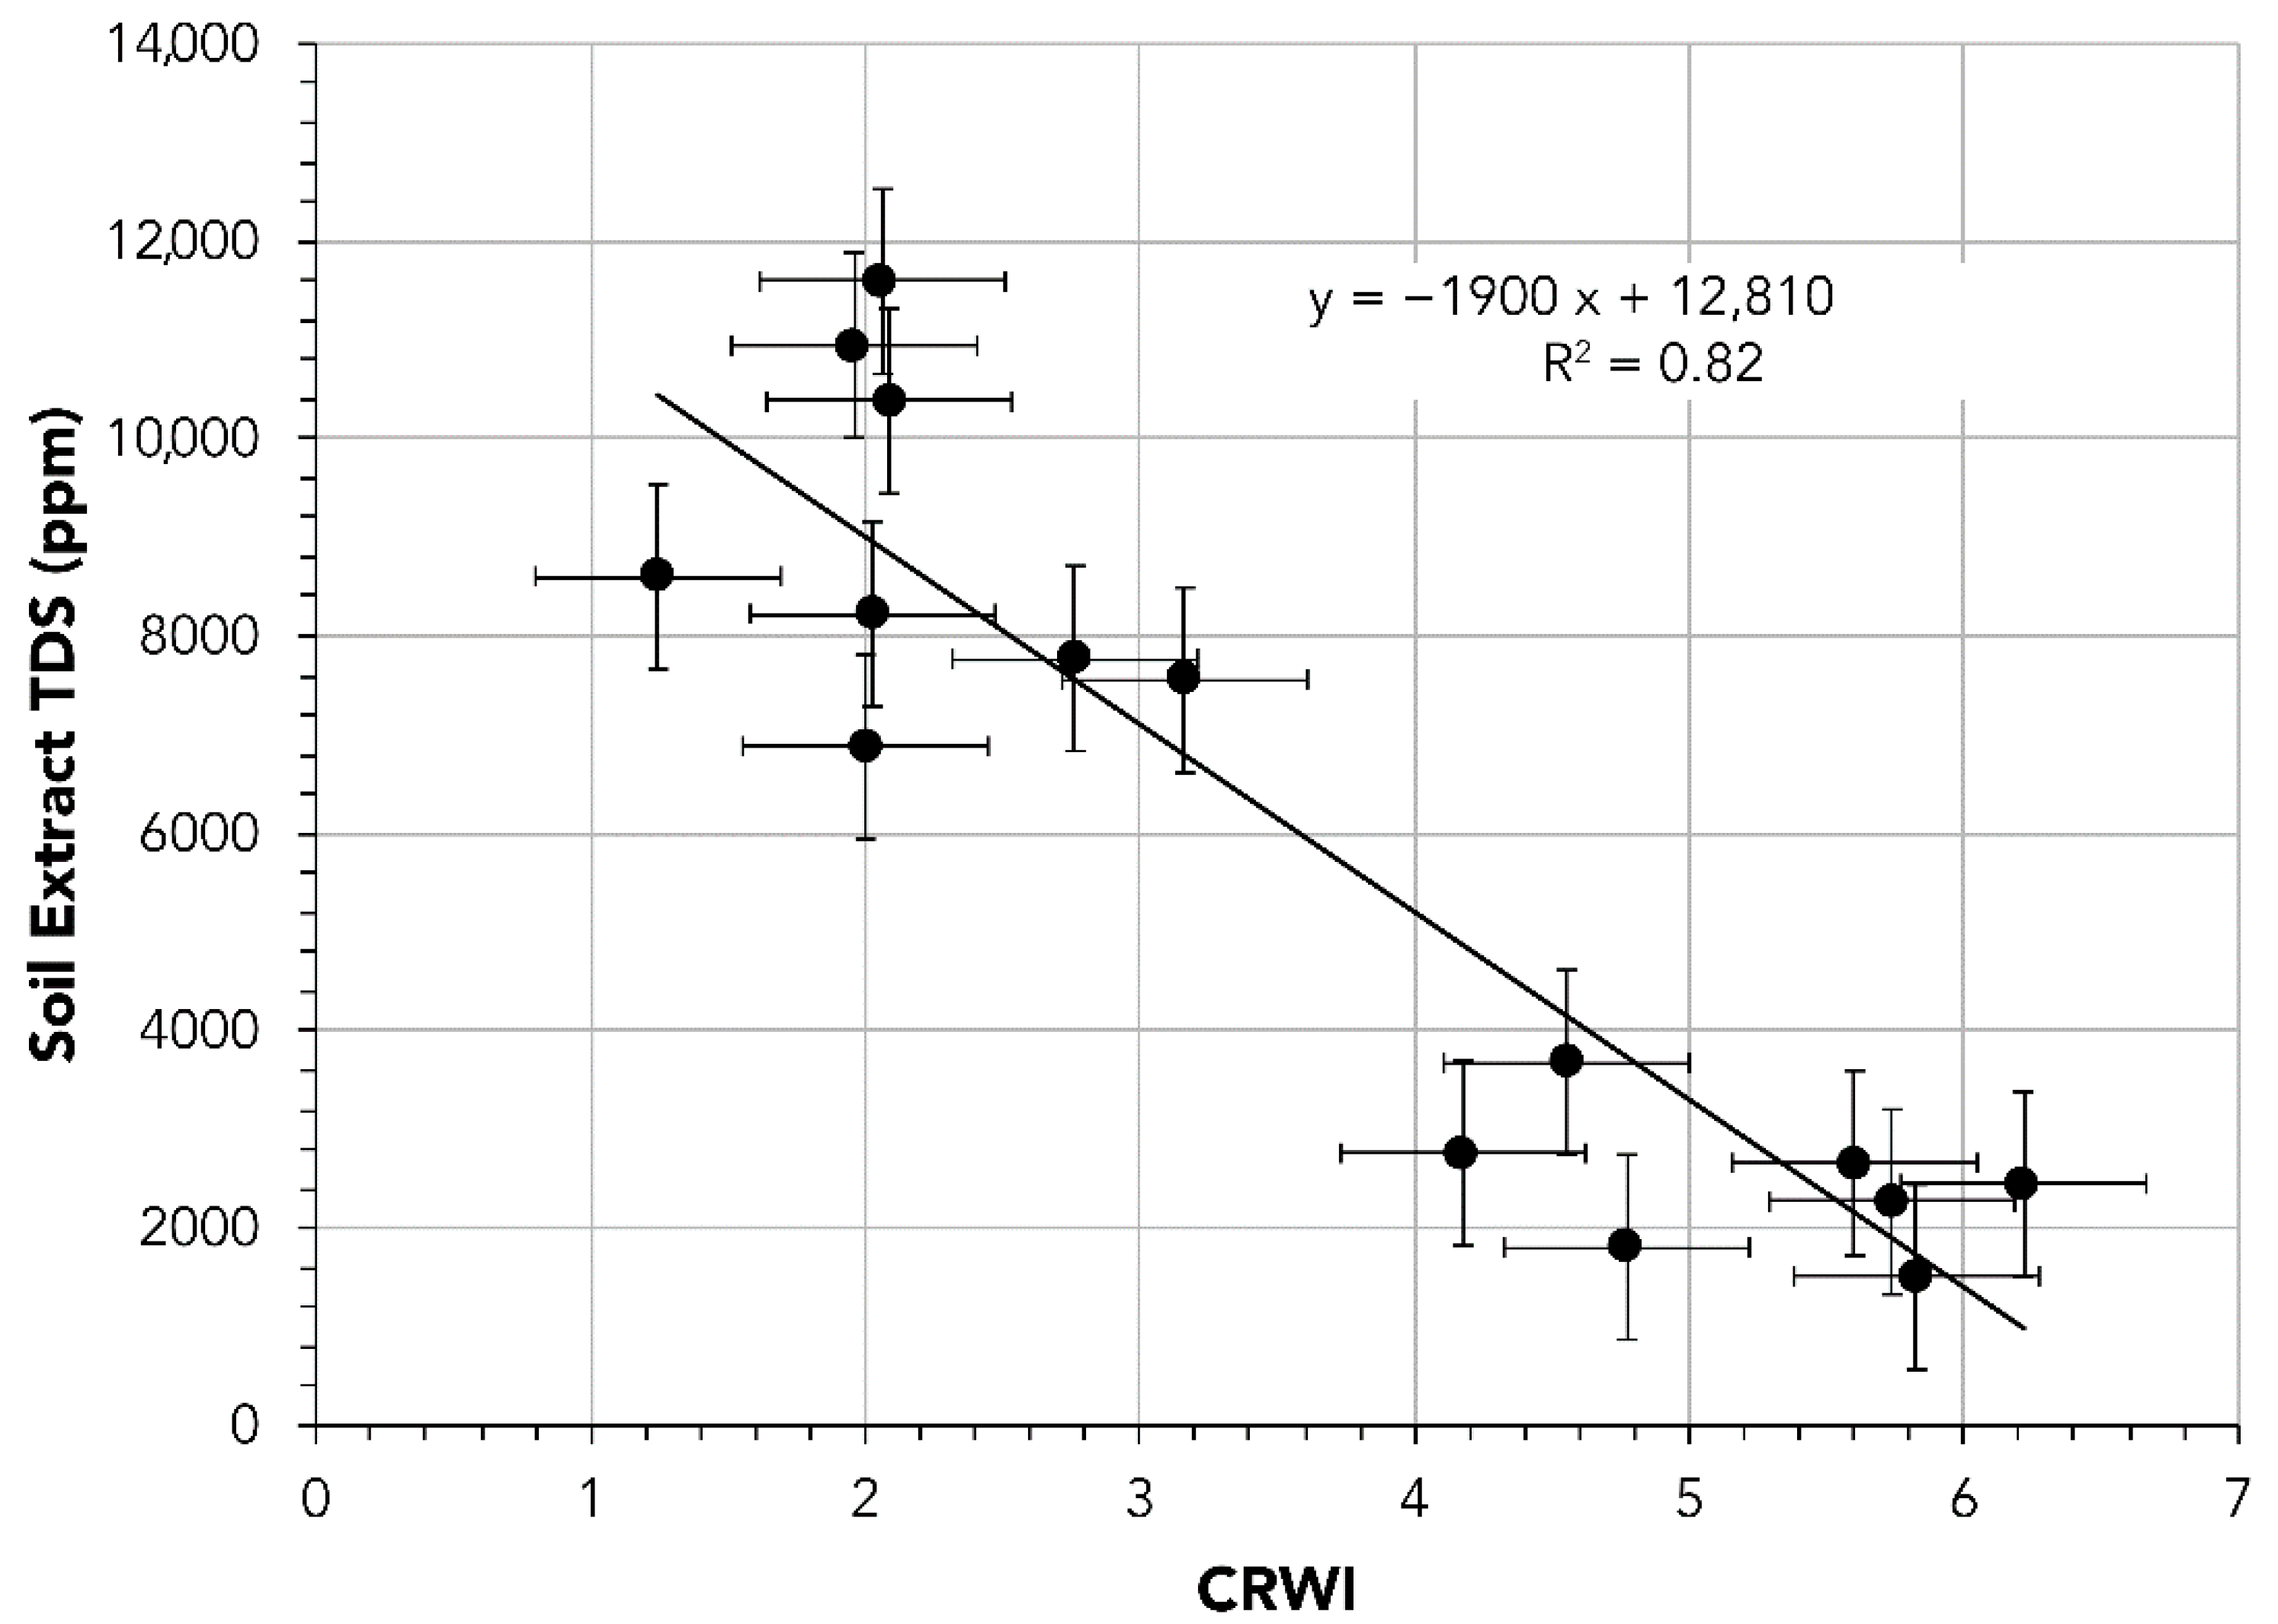
Figure 8). Soils that would retain intergranular water during air drying have lower CRWI values measured in the field than soils that air dry to nearly zero net soil moisture. CRWI is anti-correlated with soil extract total dissolved solids—saltier soils have lower CRWI values (
Figure 9). Likewise, soil moisture content in the plume is inversely correlated with total salinity. Drier, plume-margin soils show higher soluble salt concentrations than plume-interior sampling points that were wetter at the time of sampling.
Inverting the linear relationship between net gravimetric water content and CRWI results in a predictive linear function relating CRWI to net GWC, allowing soil moisture to be predicted based on drone-borne reflectance measurements (
Figure 10). The 95% confidence interval for the linear regression of CRWI versus net GWC results in a net GWC maximum uncertainty of ±1.5 wt.% water over the calibrated range of CRWI values (
Figure 10). This uncertainty is less than typical general dielectric soil moisture sensor uncertainty, but higher than the best possible soil-specific calibrations for in situ sensors [
37,
38]. It is also less uncertainty than the range of soil moisture uncertainty associated with orbital, NDVI-thermal fusion data products [
18,
19].
The functional relationship between ground-based CRWI index value, and measured net soil moisture content provides a forward model for predicting soil moisture based on airborne CRWI index values:
CRWI index values from airborne spectra range from ~−1.5 to 9.1, with a median value across the site and across all sorites of 2.1. Maximum CRWI values decrease over the three sorties, from ~9.1, to ~6.0, to ~5.3. Employing Equation (6), predicted GWC values based on drone-measured CRWI values across the plume site span 0–27% (
Figure 11).
The WISOIL index calculated using ground-based observations is also linearly correlated with ground sampling point water content (
Figure 12), although the correlation is weaker than the CRWI-GWC relationship (
Figure 10). WISOIL decreases with increasing soil moisture.
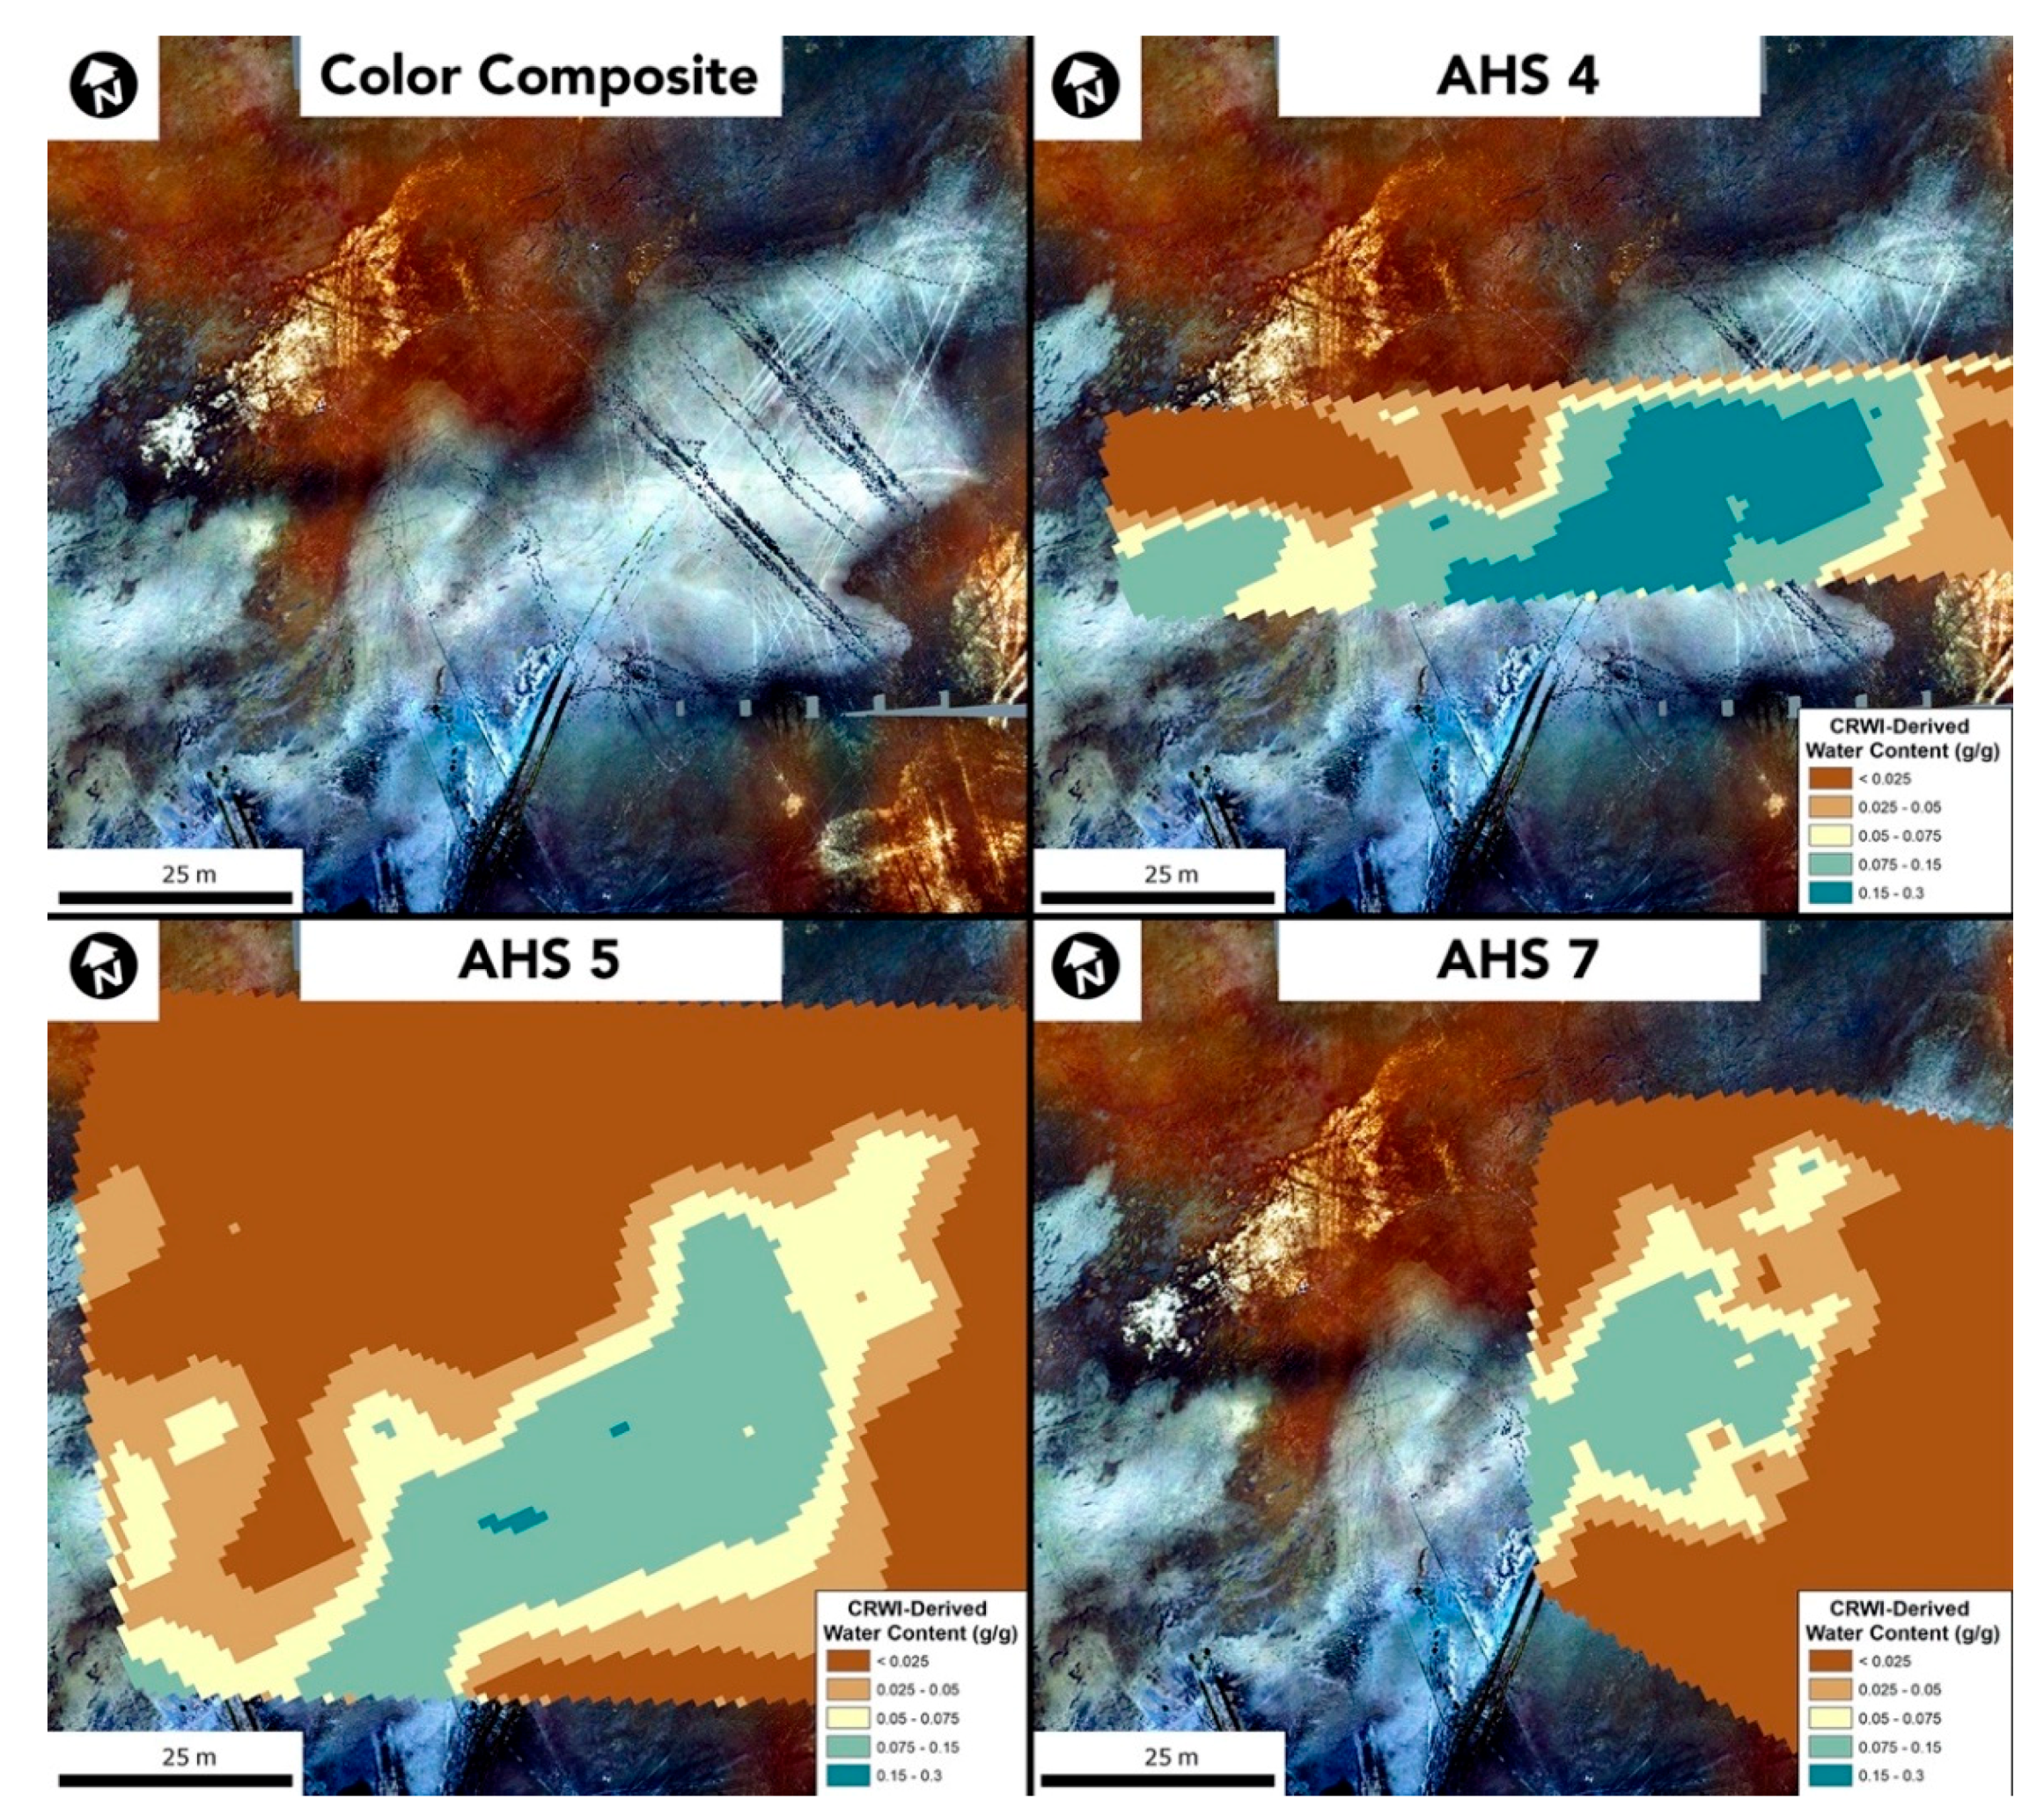
In all airborne CRWI measurements, the soil moisture plume is wettest along the plume centerline, with soils becoming drier towards the plume margin. The highest soil moisture values measured in the plume using the relationship shown in
Figure 10 were recorded during the first sortie of the morning (flight AHS4), with progressively lower soil moisture values measured during flights occurring into the early afternoon (
Figure 13).
Point reflectance measurements for each flight (AHS 4, 5, and 7) were interpolated in ArcMap using a natural-neighbor algorithm and were gridded at 1 m/pixel (approximate spacing between measurement centroids). Gridded, soil moisture values above the dry background largely correlate with the observed locations of bright, white plume-deposited sediments in the concurrent drone ortho-image (
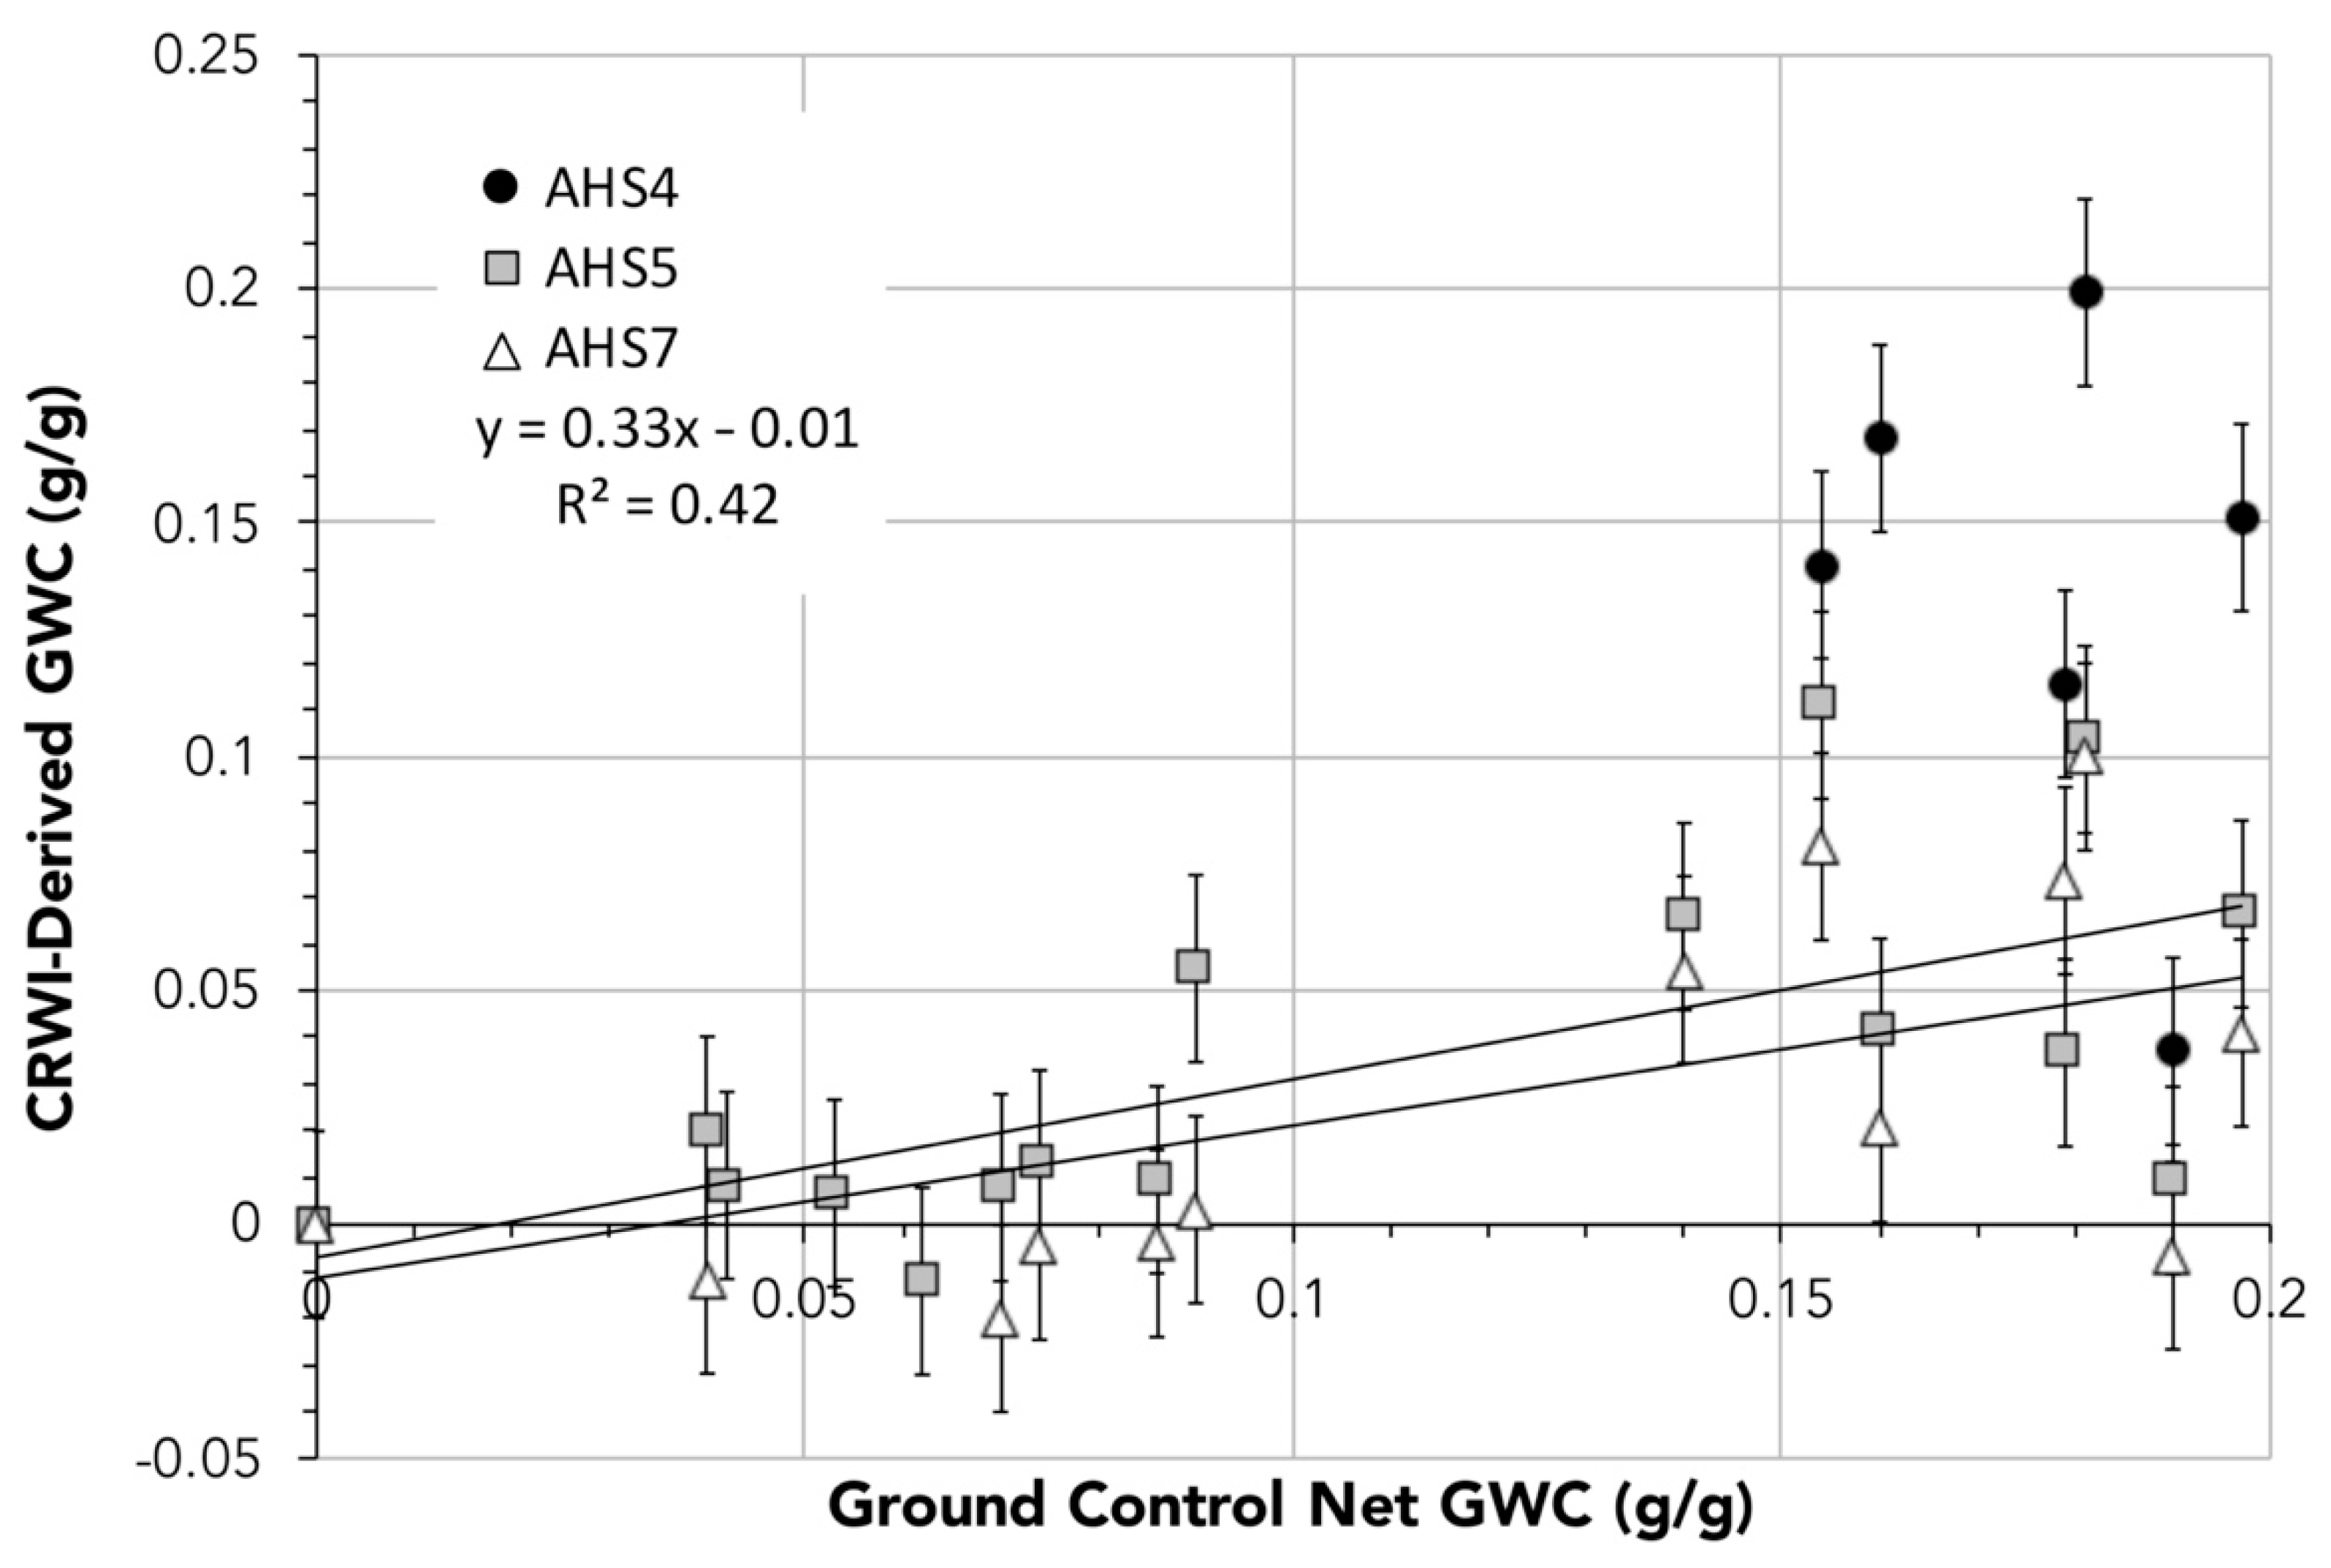
Figure 11). However, the spectral index maps provide information not available in the ortho-image alone, i.e., soil moisture conditions. Measured net GWC values at the ground sampling points vary linearly with CRWI-derived net GWC values predicted from the drone-borne reflectance measurements (
Figure 13). Soil moisture measured via drone-borne CRWI varies over the course of the day: it is highest during the earliest sortie (AHS 4: 8/11/19: 11:28), lower during the middle sortie (AHS 5: 8/11/19: 11:51), and lowest during the last sortie (AHS 7: 8/11/19 12:41) (
Figure 13).
Airborne CRWI index values systematically under-predict ground sampling point soil moisture, except for the wettest measurement points imaged early in the day during sortie AHS4. This under-prediction of soil moisture at ground control points may result from desiccation of the sample sites during the course of the day, or may result from CRWI calculations made on comparatively large spectrometer imaging spots: soils in the 2 m radius footprint of the spectrometer may vary in soil moisture content, reducing the overall intensity of the water absorption feature shoulder measured by the CRWI index.
It is not possible to interpolate WISOIL-derived soil moisture measurements between airborne measurement points because WISOIL indices calculated using the airborne reflectance measurements exceed 1 and therefore produce negative apparent soil moisture values. See discussion for analysis of possible reasons.
Soil moisture measurements derived from airborne CRWI values and from ground sampling show small, but significant correlations with satellite-derived wetness indices such as NDWI and minimum-NDVI. CRWI measurements and NDWI have a small, but significant, positive linear correlation (R2 = 0.009, p = 0.0001), while CRWI measurements and NDVI have a small, but negative correlation (R2 = 0.006, p = 0.002).
4. Discussion
Together, these results suggest that drone-borne reflectance spectroscopy can be used to calculate the continuum-removed water index (CRWI), which in turn, can be used to measure the time-transgressive distribution of soil moisture in barren ground soils, even those with high concentrations of hydrated clay minerals. The strong, linear correlation between soil surface net water content and CRWI suggests that with site-specific calibration, e.g., [
15], CRWI can be used to determine soil moisture distribution at the surface of barren, ephemeral wetlands. However, it should be noted that the natural calibration targets used to determine these relationships do not fully populate the range of measured soil moisture values. Prior studies relating reflectance index values to soil moisture content report linear variation across experimentally fixed soil moisture ranges, e.g., [
13,
15], suggesting that linear variation of CRWI with net GWC is not an artifact of regression against a high and a low soil moisture cluster.
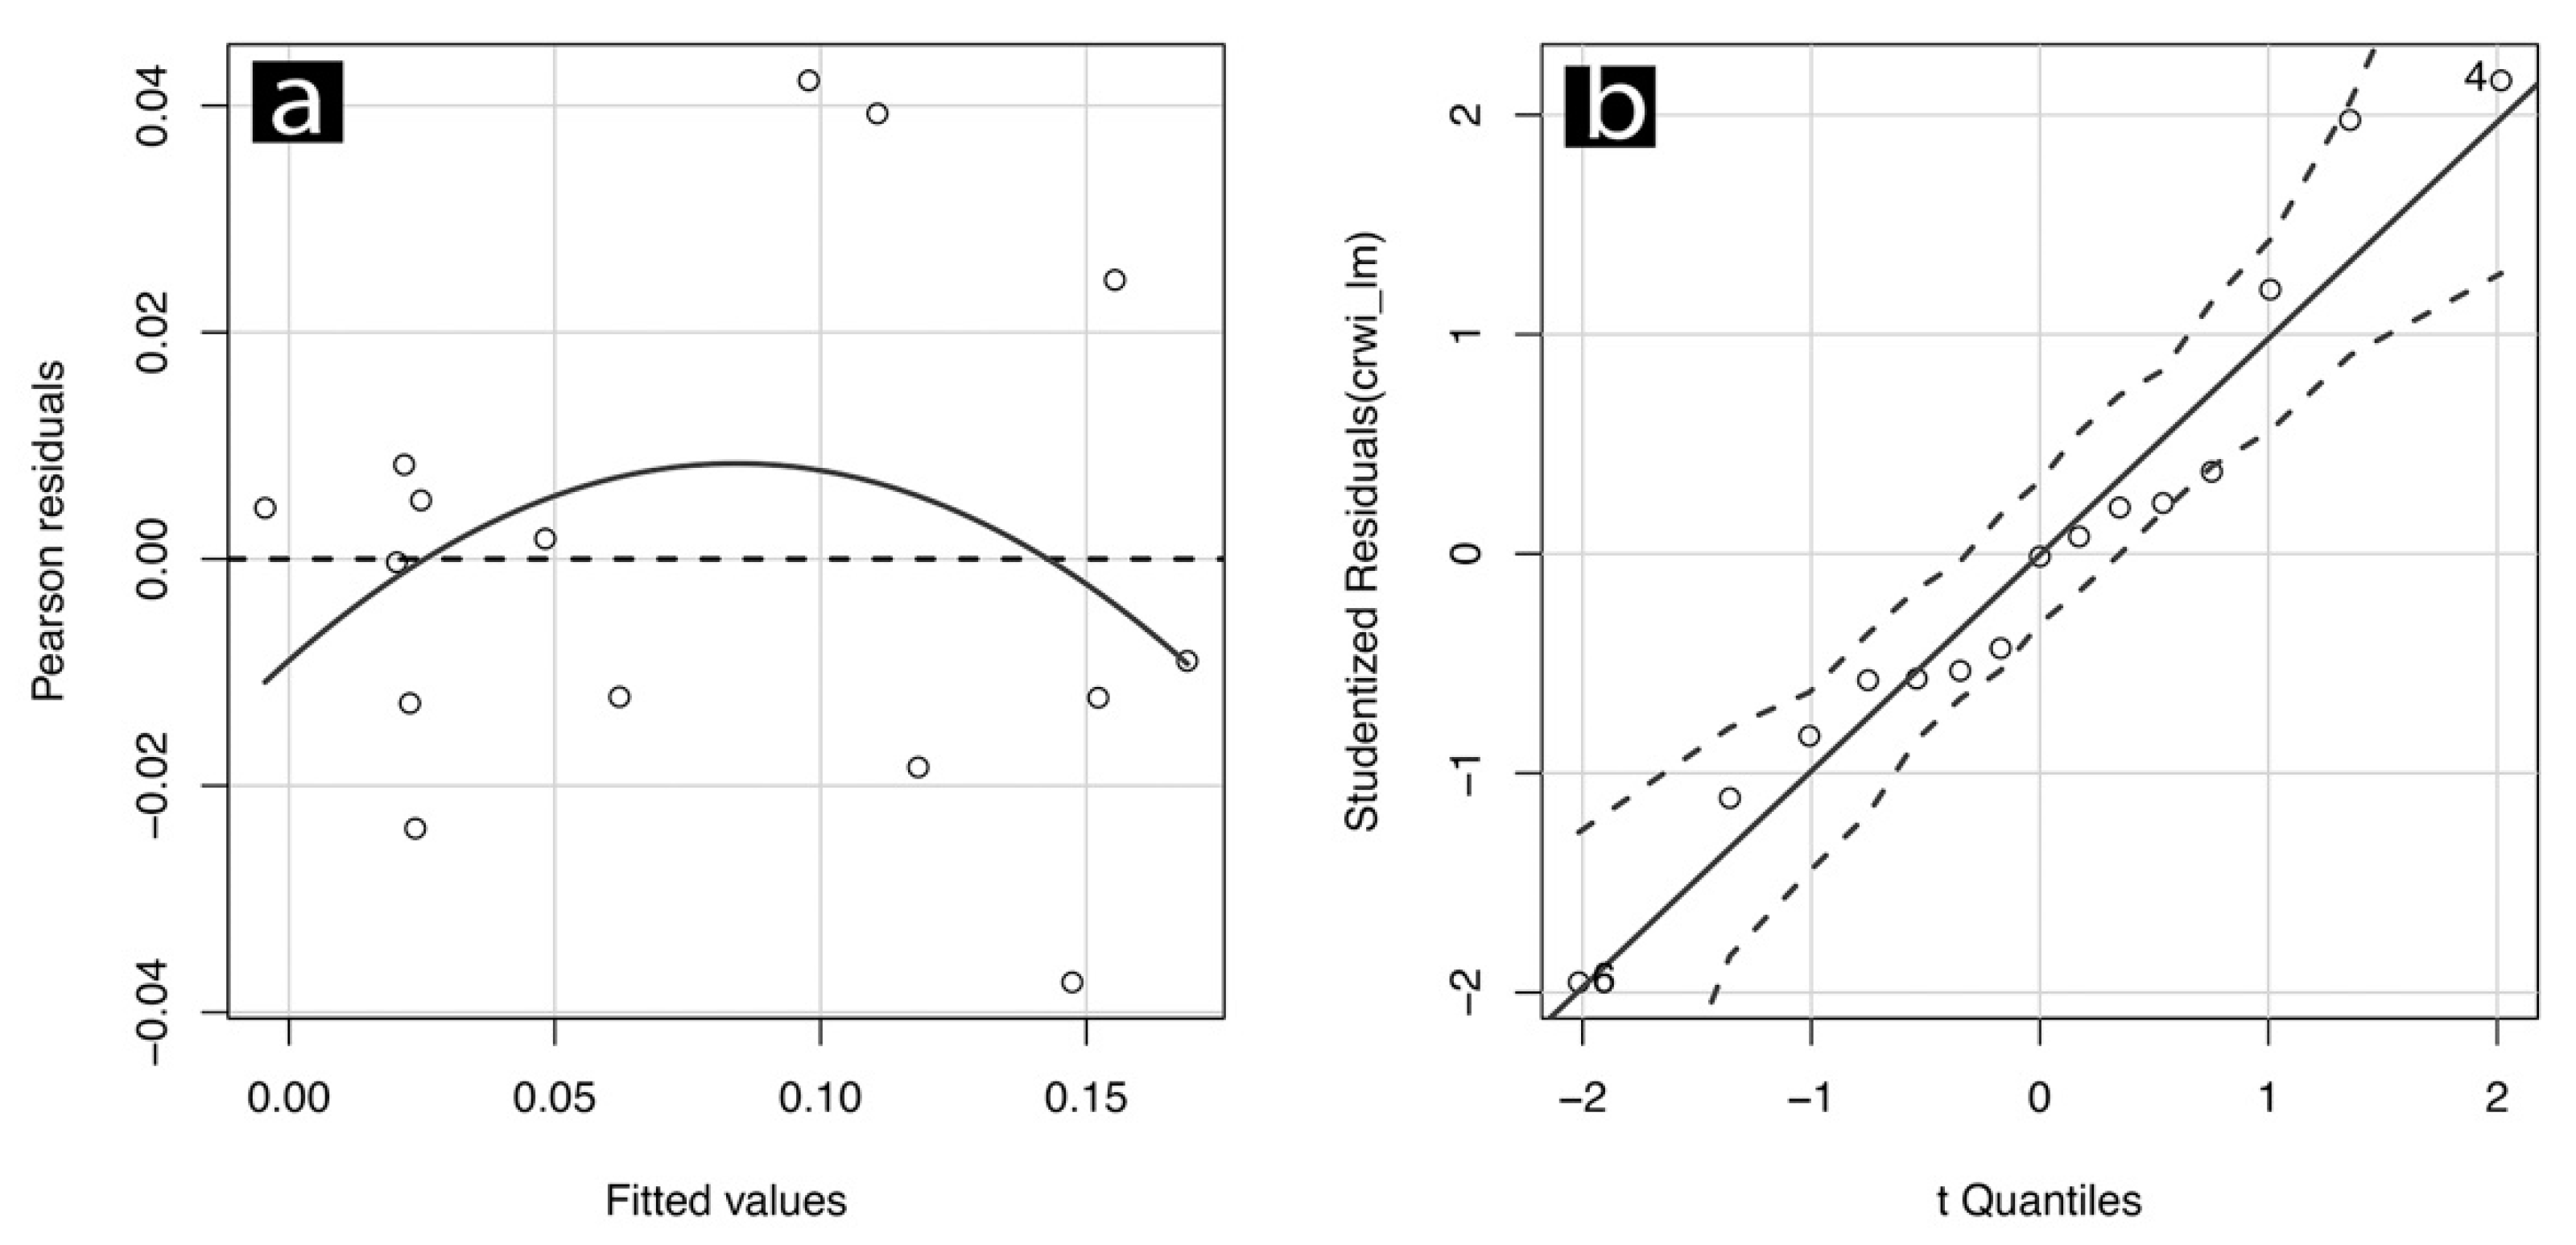
To verify that the CRWI-net GWC prediction function has limited bias based introduced by the clustering of ground truth GWC samples, e.g., [
39], we analyzed the linear model shown in
Figure 10 using the carData package in R [
40] (
Figure 14) to determine if systematic variation exists in the residuals of the linear model relating CRWI to net GWC. Pearson residuals are small (typically < ±0.04) and are not structured: the model does not appear to be under- or over-fitting the data, and there is no evidence of non-constant variance (i.e., systematic changes across the measurement domain). Quantile-quantile (QQ-plot) analysis (
Figure 14) shows no major departures from normality: the standardized residuals of the CRWI-net GWC linear model lie on a straight line.
This ground-sample/air-borne measurement range mis-match is similar to the well-known challenges of validating large-footprint satellite soil moisture sensors (e.g., microwave-based) using point-based measurements of soil moisture (e.g., [
41]). As shown above, ground-truth sampling at length scales approximating the spatial resolution of the airborne reflectance sensor (5 m distance between samples with ~2 m sensor footprint and ~1 m gridding) produce a CRWI-net GWC function that shows little systematic bias, but does suffer from the shortcoming that it does not reflect the full range of CRWI index values measured by the airborne sensor. See future work recommendations below for proposed approaches to provide synchronous measurements of soil moisture and reflectance as a model for further enhancing site-specific calibrations.
While CRWI could be applied to Alvord desert soils to predict soil moisture content, WISOIL could not owing to widespread WISOIL index values exceeding 1 (and thus, negative apparent soil moisture). One possible reason that WISOIL-derived soil moisture estimates may include unrealistic values (i.e., negative soil moisture content) is enhanced reflectivity observed in airborne measurements near 1.45 µm (
Figure 2). This enhanced reflectivity may be a consequence of changing atmospheric water vapor conditions during white reference measurements versus airborne spectral measurements, coupled with enhanced reflectivity resulting from zenith effects closer to solar noon (i.e., 10:00 versus 11:37 am local time).
WISOIL parameter measurements require complete removal of atmospheric contributions to reflectance measurements [
13]. While all reflectance measurements were made relative to a white reference, and drone-borne spectrometer measurements resulted in minimal path length between the ground and the sensor, it is possible that a lower level of atmospheric water vapor during the measurement interval vs. during the white-reference collection could result in a higher apparent illumination at that point, and a larger apparent reflectance than the irradiance that was measured during the white reference collection when water vapor content may have been higher. It is also possible that the high clay concentrations at the site provide enhanced absorptions near 1.45 µm, reducing the value of the WISOIL parameter. This would be consistent with the large step-changes in WISOIL parameter values and the reduction in linear correlation coefficient between soil moisture and WISOIL seen at moderate to high soil moisture contents in clay-rich arid soils [
13].
In contrast, by measuring along the shoulders of the atmospheric and ground water absorption at 1.5 and 1.63 µm, CRWI avoids atmospheric noise expected closer to 1.4 µm. For that reason, coupled with the higher correlation coefficient between CWRI and soil moisture content than between WISOIL and soil moisture content (0.89 vs. 0.69), we suggest that CRWI may be a more suitable soil moisture index for measurement of near-surface water content in sandy and/or clay-rich soils similar to those of the Alvord playa.
Hydrogeological Summary and Future Work
To briefly characterize the hydrological activity of the investigated wetland hot spring site based on this investigation, the Alvord hot springs discharge plume is a down-slope digitate (elongate and branching) wetlands feature with a planform morphology consistent with unconfined flow (e.g., [
42] within and above the clay- and silt-rich playa aquitard. The AHS plume is salty and fines-rich, especially at the edges, but despite these two hygroscopic soil components, most soil moisture was confined to the central axis of the plume during the observed discharge period. This may not be the case during low discharge events, when the soils begin to desiccate. Plume-marginal sediments have both higher lab-measured residual water contents (more pore-bound water after saturation and lab air-drying) and are also saltier, which may preserve pore-bound brines that are more resistant to evaporation than comparatively low-solute sediments at the plume interior.
The accumulation of both fines and soil salts at the plume margin suggest that the Alvord Hot Springs plume is a wetland system with unidirectional flow, in which fines and solutes are removed from the water-rich, high-CRWI main flow path to the plume edges, resulting in evapoconcentration of groundwater solutions, e.g., [
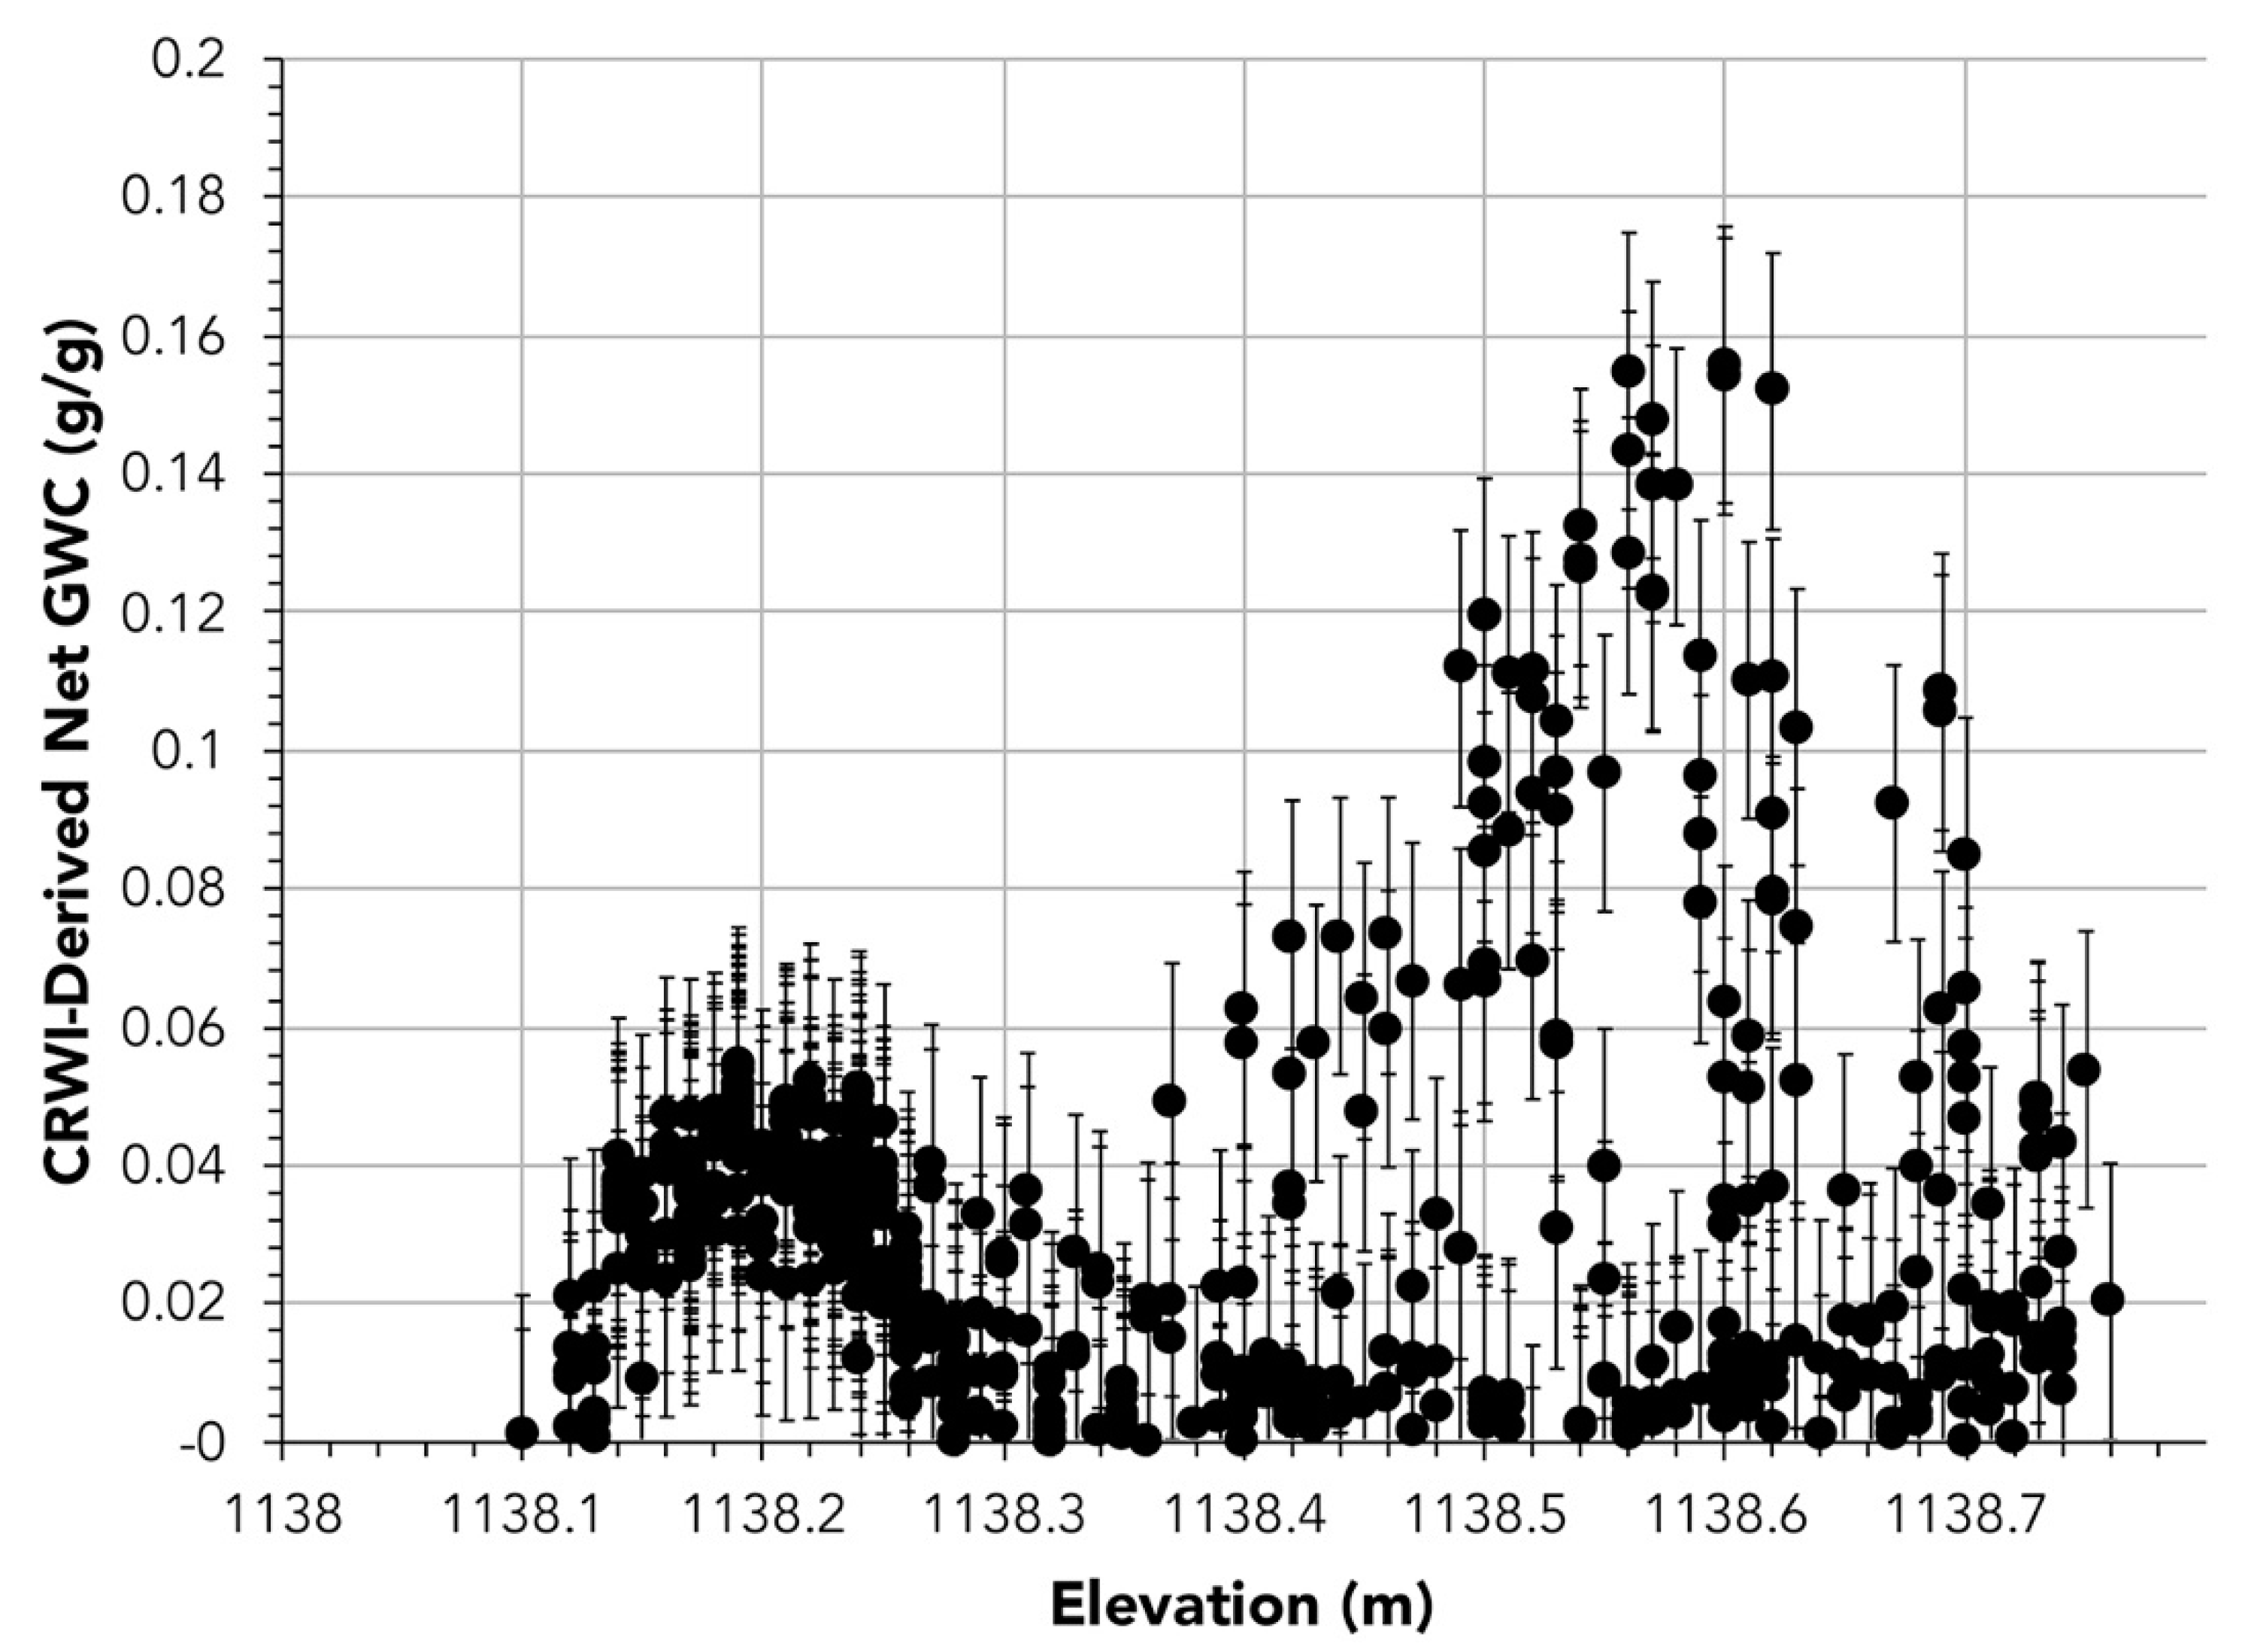
43], and advection of clay- and silt-sized particles to the margins of the plume through the sandy matrix, producing high-clay, high-salt, low-CRWI edge soils. Unidirectional flow of water in this flat-lying distributary system is further indicated by generally decreasing soil moisture at lower elevations over the 60–70 cm of relief at the site (
Figure 15). This stands in contrast to more typical groundwater systems in which soil moisture increases at lower elevations that have greater upslope accumulation area to can capture and route precipitation and which are typically less steep than soils high in drainage basins [
44].
As might be expected for small playa features such as the Alvord hot springs plume, CRWI values derived from drone-based measurements are a much stronger predictor (higher correlation coefficient) of surface soil moisture conditions than either Landsat-derived NDWI or Planet-derived NDVI, suggesting that multispectral satellite observations outside of water-active SWIR wavelengths may be less useful than hyperspectral indices like CRWI for determining changing soil moisture content at local sites in desert soils.
In terms of using drone-borne measurements to monitor playa wetland soil moisture and hydropattern, CRWI was shown to correlate linearly with net GWC, providing instantaneous surface soil moisture measurements to within ~±1.5% net GWC. This suggests that drone-borne surveys could provide a rapidly deployable method for measuring barren wetland inundation conditions over time. Such a high-cadence soil moisture monitoring system could be used to monitor the propagation of soil moisture through precipitation-fed groundwater systems in similar playa environments were hydrothermal systems are absent.
Decreasing CRWI values at ground control sampling sites over the course of the measurement campaign are consistent with drying out of surface layer under low humidity conditions, suggesting that CRWI could be used to determine wetland soil moisture conditions over timescales as short as minutes to hours, depending on aircraft repeat interval. However, the efficacy of CRWI-based soil moisture predictions under conditions of varying atmospheric water vapor conditions remain unknown. If atmospheric water vapor reduces incident photon flux significantly in the vicinity of the 1.4 µm feature, humidity conditions may place seasonal operational constraints on data collection at some sites.
Future efforts at applying SWIR reflectance to surface soil moisture determination in wetland systems would benefit from ground control calibration measurements taken across the full duration of aircraft operations, not just at the beginning. This would permit calibration of net GWC to CRWI curves based on ground conditions at the site at the instantaneous time of aircraft measurement. Continuous soil moisture monitoring through time-domain reflectometry soil moisture probes could provide a point-scale soil moisture record at a cadence approaching that of the airborne observations, resulting in even lower levels of uncertainty in the CRWI to net GWC calibration. Likewise, point-measurement and imaging spectrometers with smaller ground footprints may reduce measurement noise in soil moisture measurements by reducing the range of soil moisture conditions present in the measurement area.
In addition, future drone-borne reflectance surveys could be designed to provide a spatial and temporal resolution bridge between multi-dataset orbital measurements, e.g., [
16,
17,
18,
19] and ground-based observations. For example, future drone-borne surveys could expand the aircraft sensor suite from SWIR (used in this study) to include visible/near-infrared, e.g., [
45] reflectance imagers alongside thermal infrared sensors [
46], which could provide simultaneous NDVI and ground temperature measurements similar to those collected from orbit, e.g., [
18,
19].
5. Conclusions
Reflectance measurements of the Alvord Hot Springs discharge plume in the Alvord desert playa provide a reference case for measuring soil surface moisture content in barren soils through direct observation of SWIR absorptions resulting from soil pore water. The CRWI parameter varies linearly with soil water content (R2 = 0.89, p < 0.001), even in clay rich soils, allowing for meter-scale aircraft-based measurements to be made of playa hydropattern and groundwater distribution at a cadence of minutes to hours. The CRWI index is comparatively insensitive to soil clay content (R2 = 0.4, p = 0.01), soil salinity (R = 0.82, p < 0.001), and soil grain size distribution (R2 = 0.67, p < 0.001). CRWI is negatively correlated with clay content, indicating it is not sensitive to hydrated mineral absorption features, even then those clays are hydrated and contain mineral-bound water which could generate at 1.4 µm absorption feature. CRWI has stronger correlation with surface soil moisture than other hyperspectral and multispectral indices (R2 = 0.69, p < 0.001 for WISOIL at this site), suggesting it can more effectively map soil moisture in these clay-rich playa soils.
Reflectance-derived soil moisture measurements can be used to delineate groundwater plumes and transitional environments in playas, where changing groundwater conditions may shape ecosystem functioning and biogeochemical cycling. By incorporating distributed soil moisture sensors as part of CRWI-net-GWC calibration in future studies, it may be possible to evaluate whether changing soil moisture conditions (i.e., drying) or changing atmospheric water vapor conditions are responsible for mis-matches between drone-derived spectroscopic soil moisture predictions and ground-truth observations. This enhanced ground data collection strategy can provide a template for concurrent measurements of soil moisture during future airborne soil moisture mapping and monitoring campaigns.


