
Offshore Hydrocarbon Exploitation Observations from VIIRS NTL Images: Analyzing the Intensity Changes and Development Trends in the South China Sea from 2012 to 2019


Abstract
:
1. Introduction
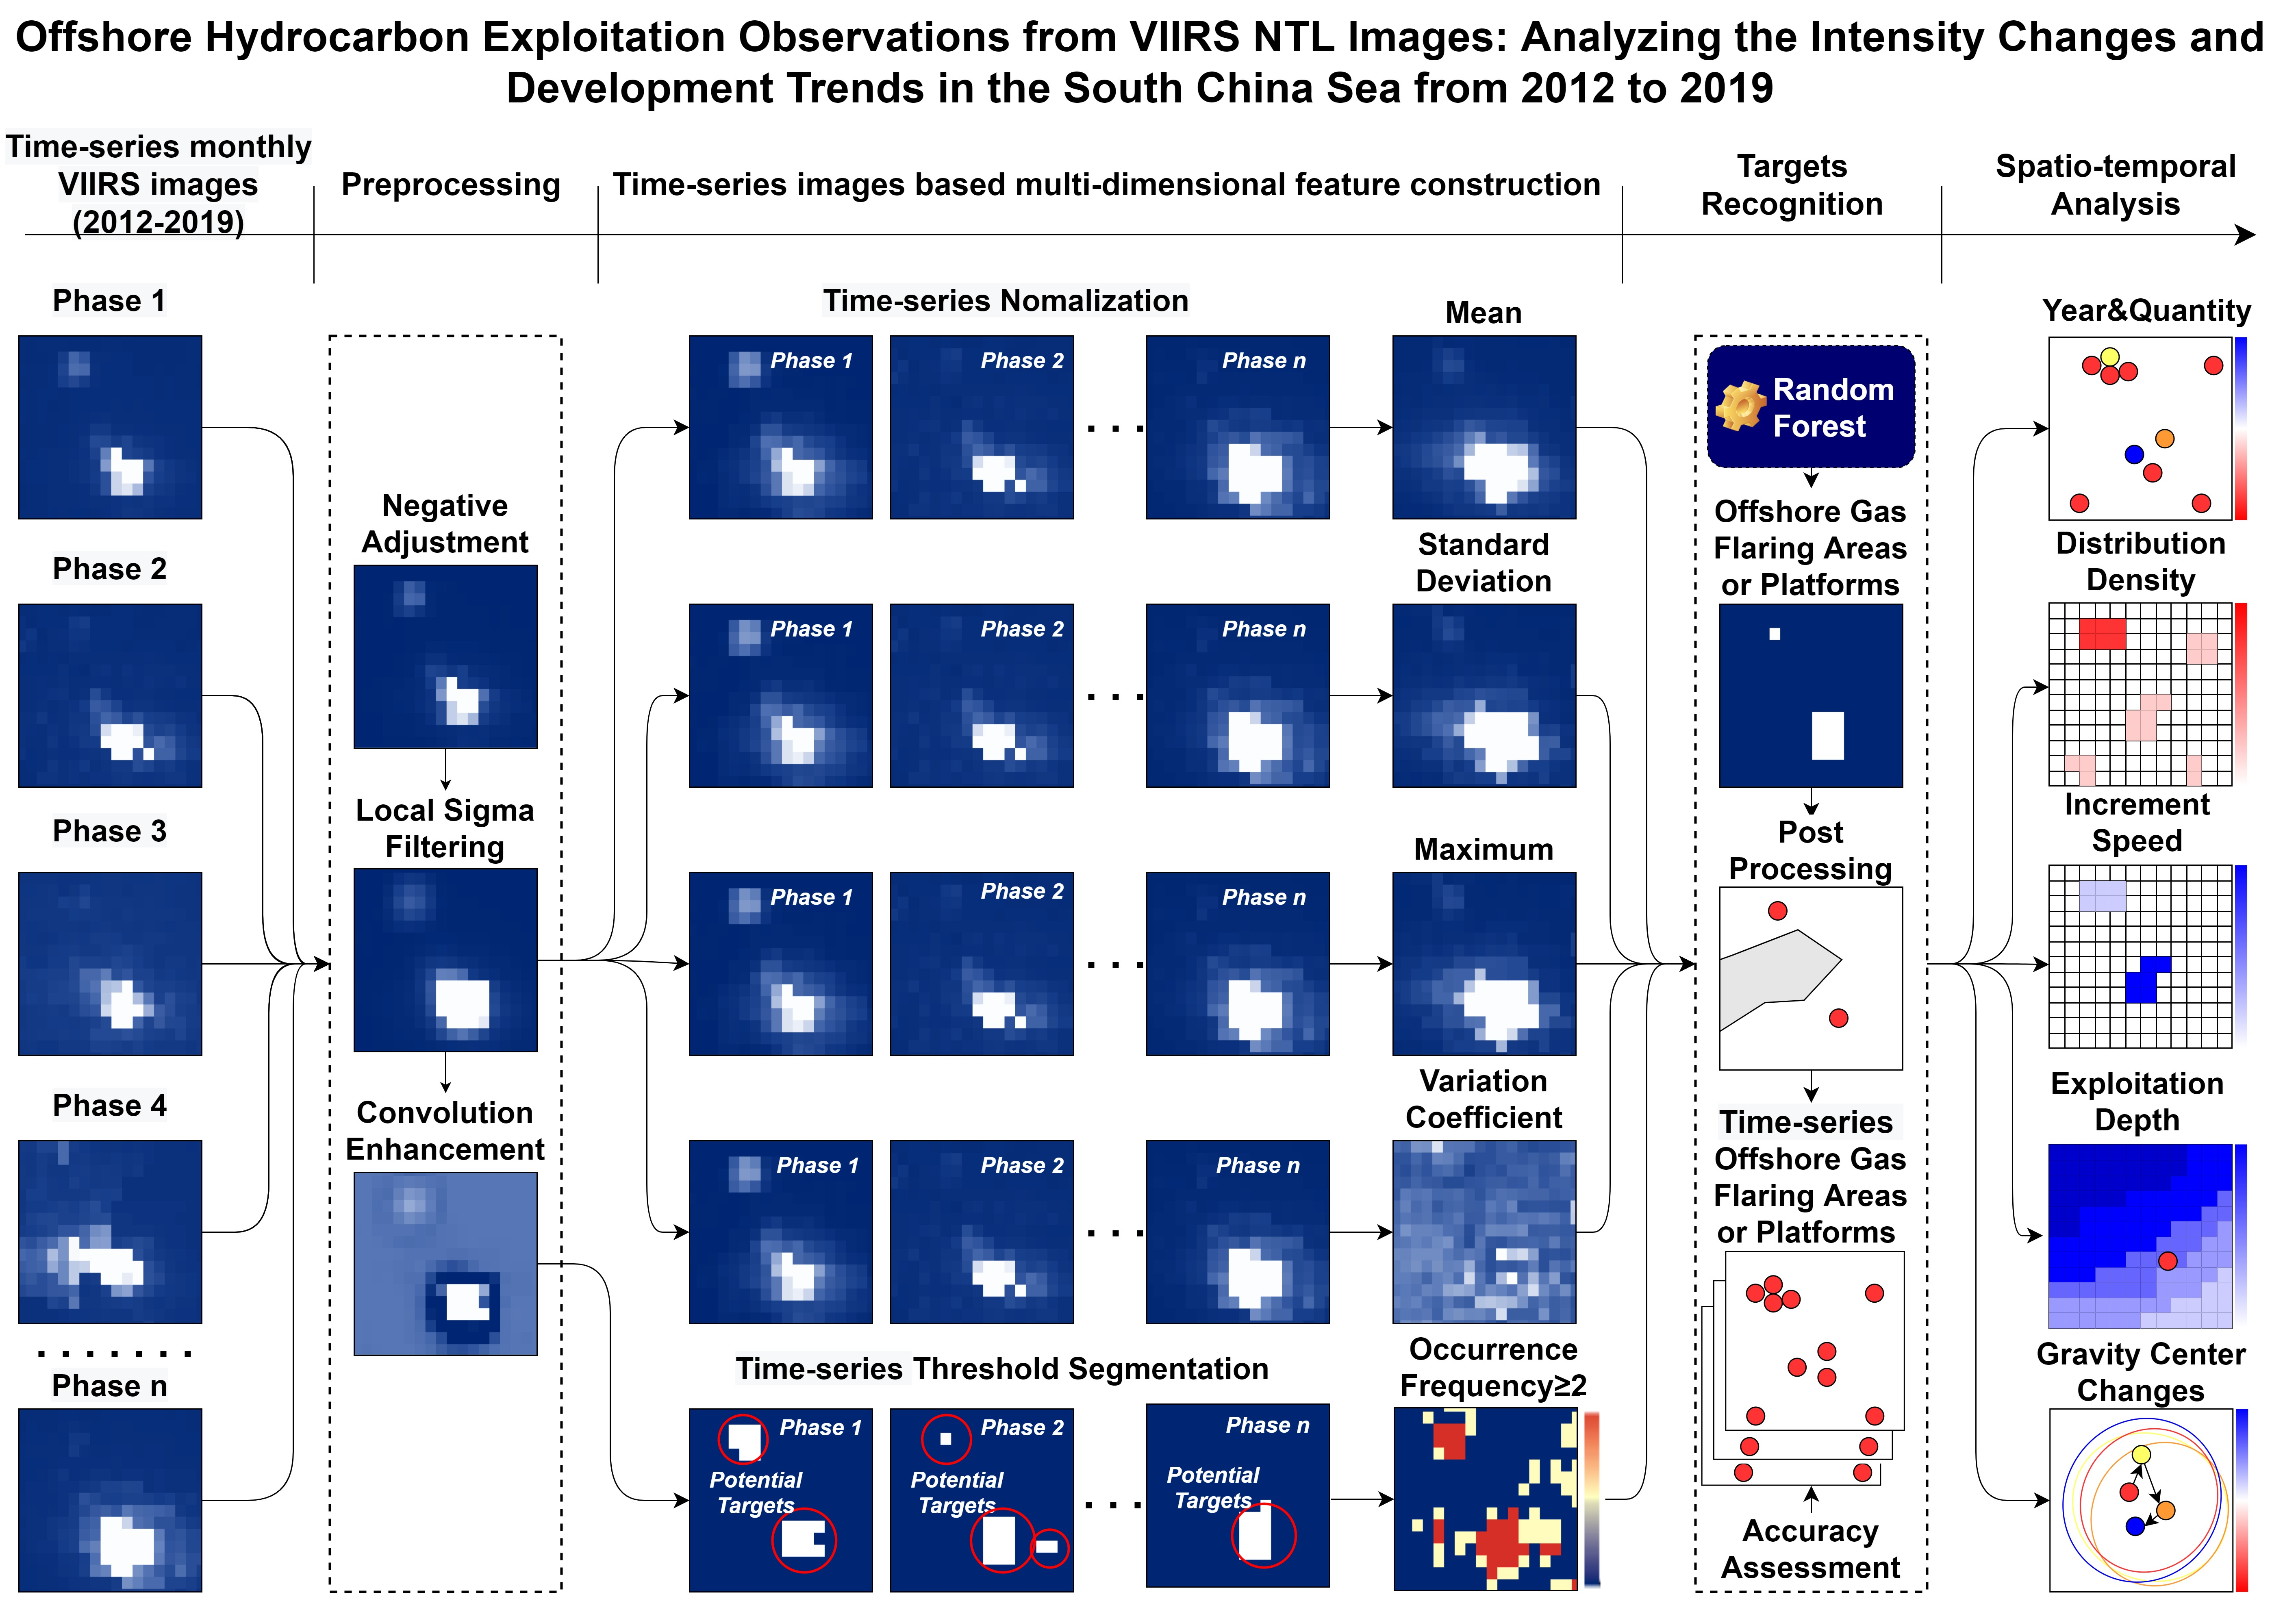
2. Study Area
3. Materials and Methods
3.1. Datasets
3.1.1. VIIRS Day/Night Band (DNB) Monthly Composite Images
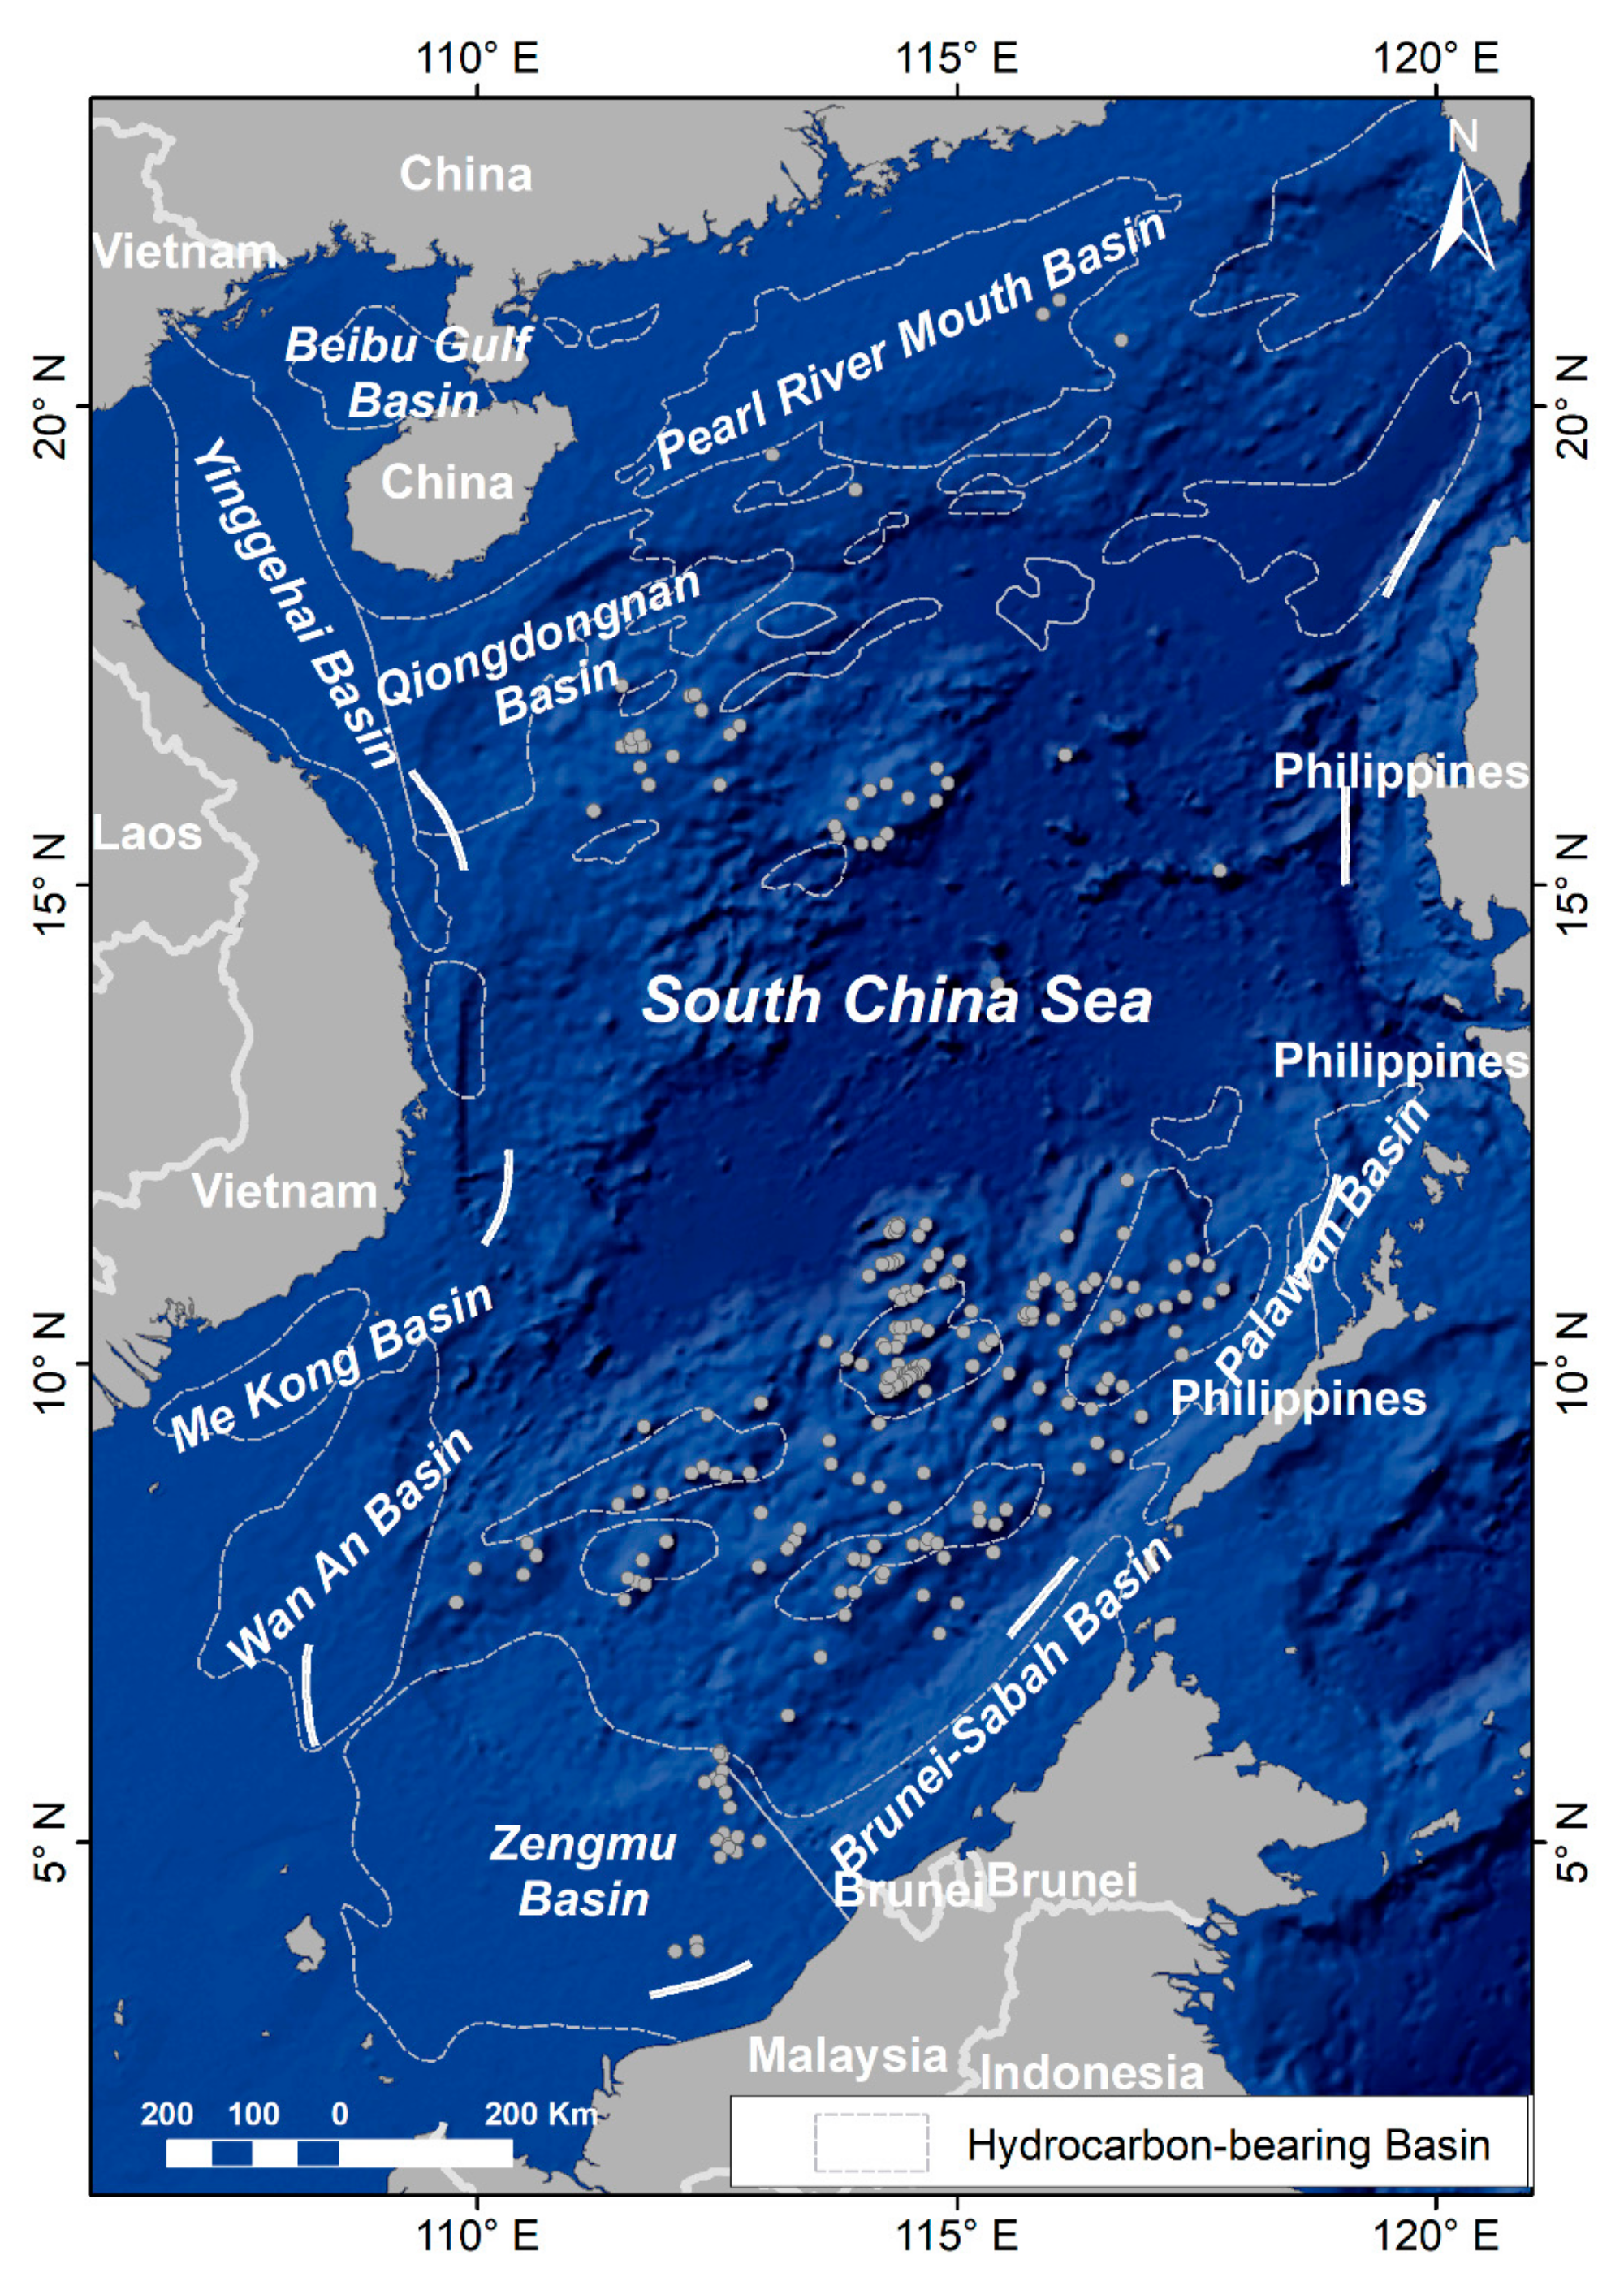
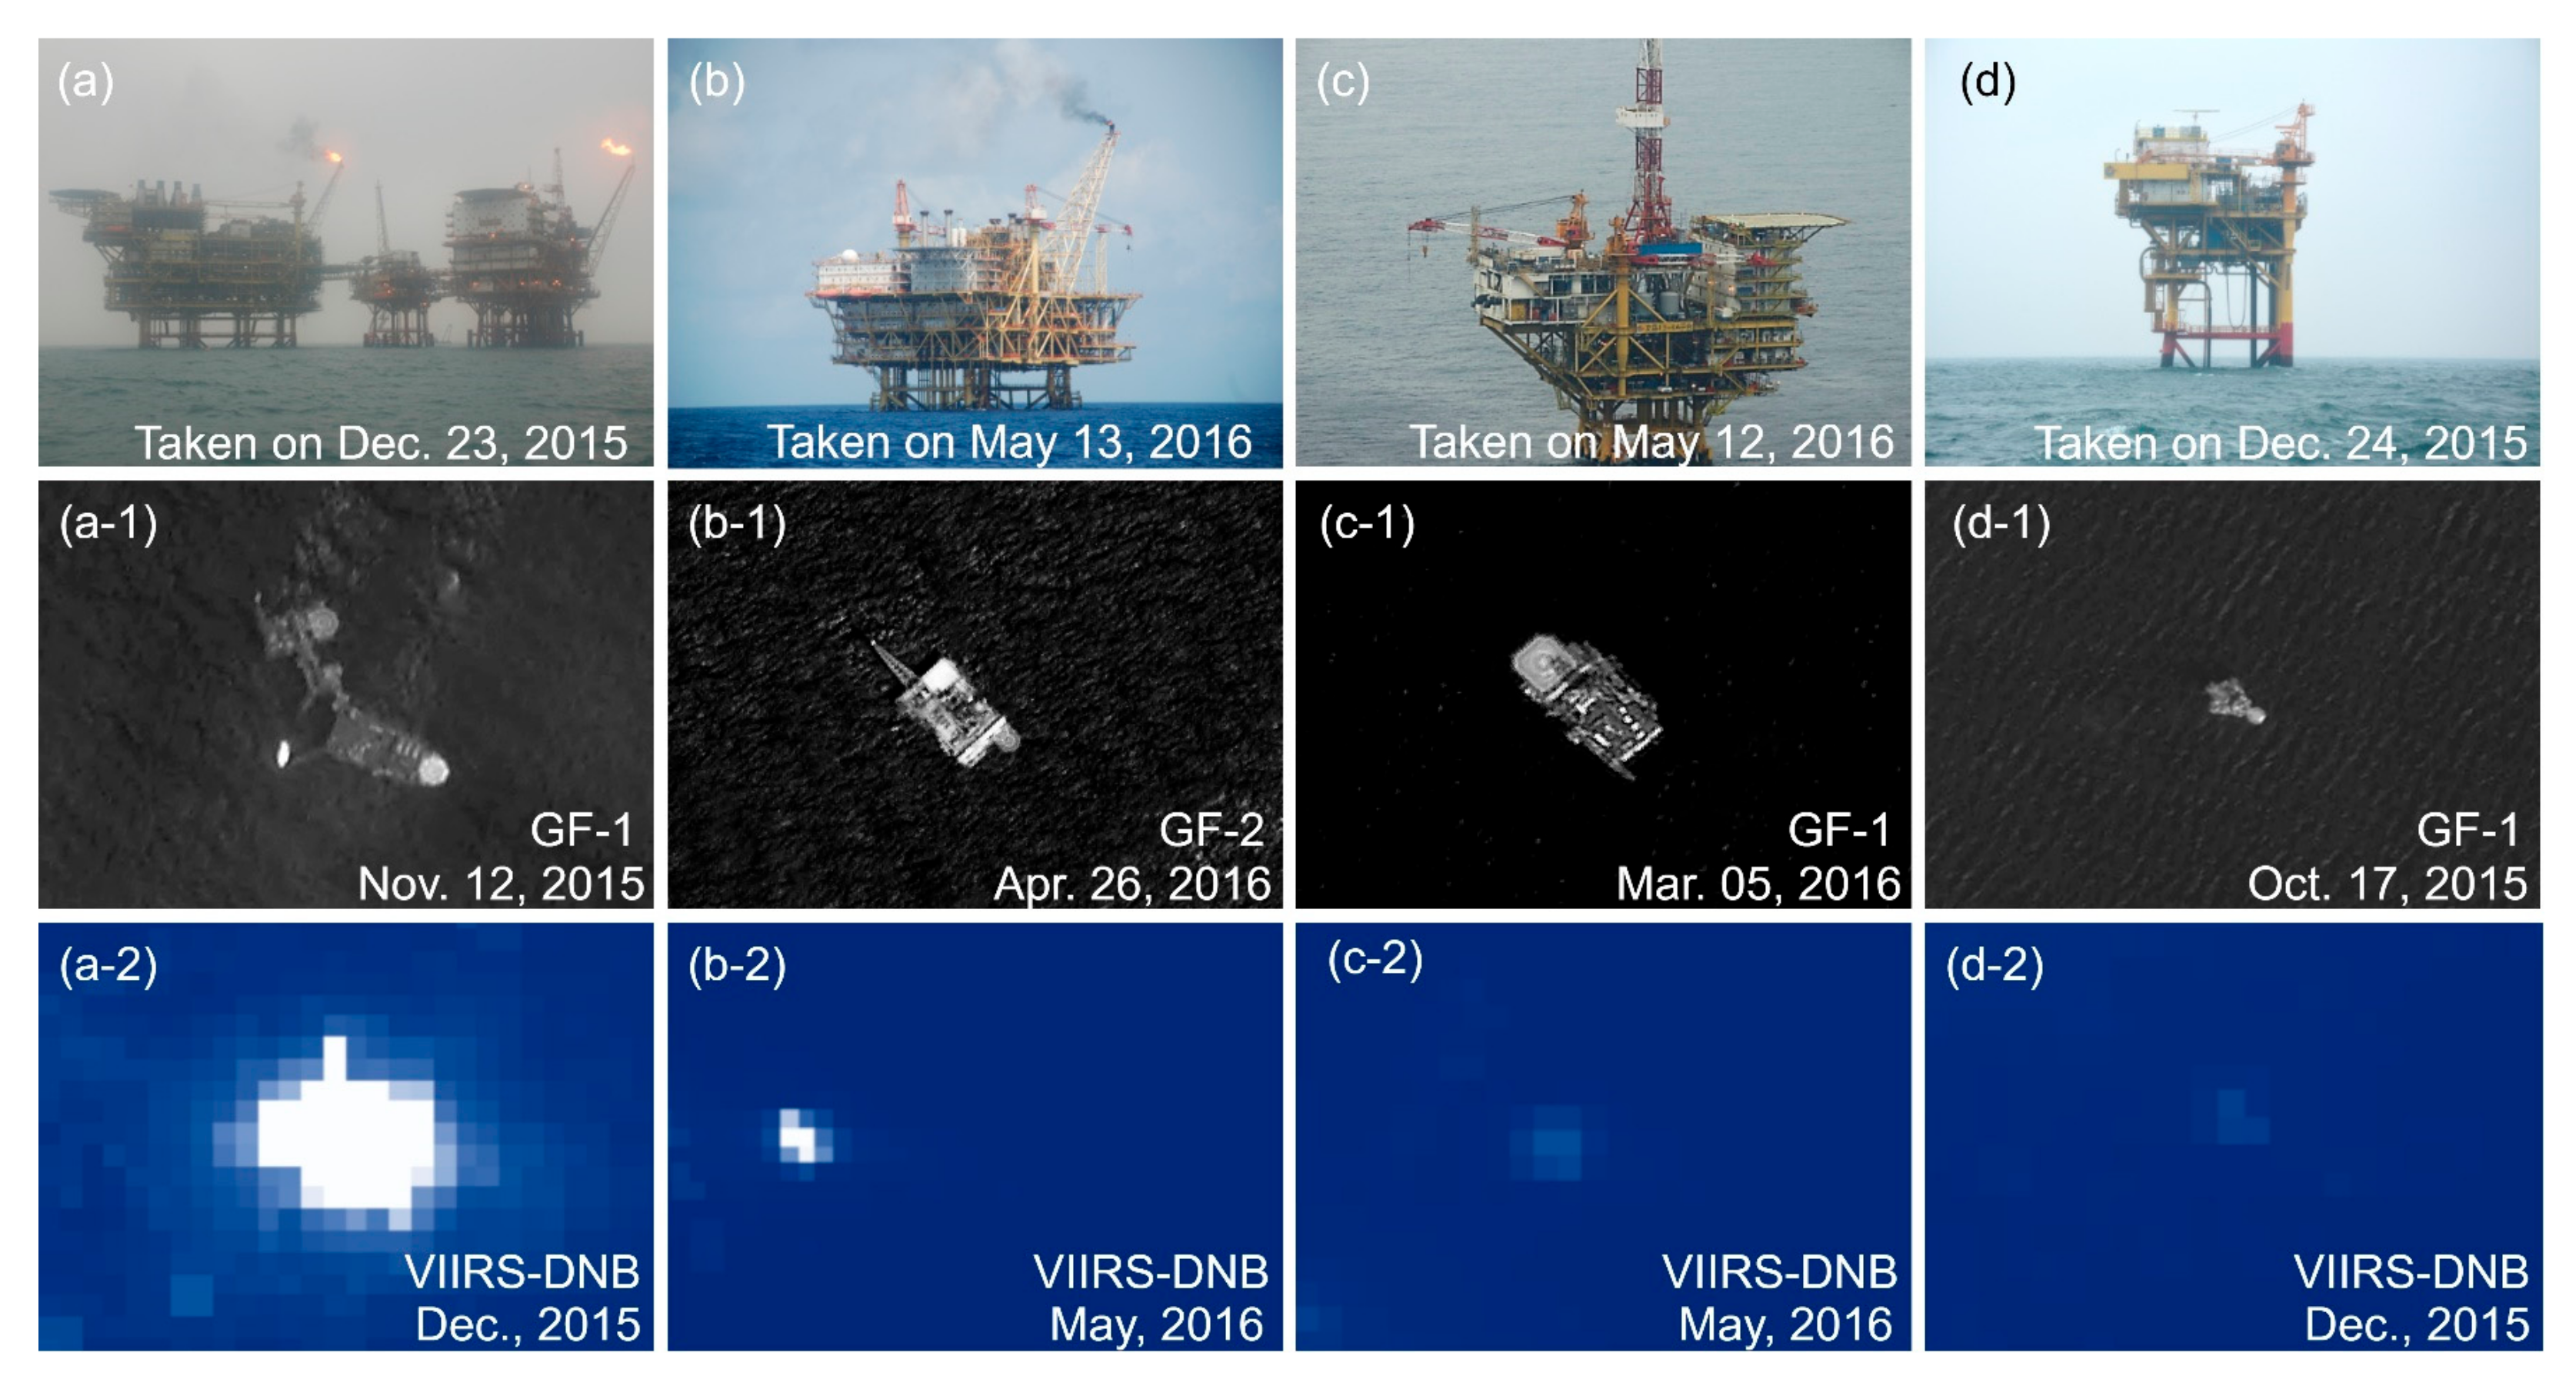
3.1.2. Chinese High-Resolution Images and Offshore Platform Records
3.1.3. Bathymetric Data
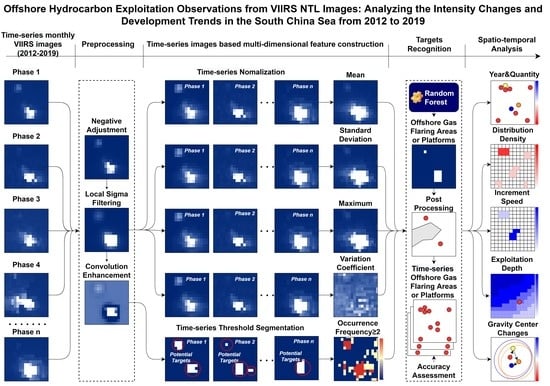
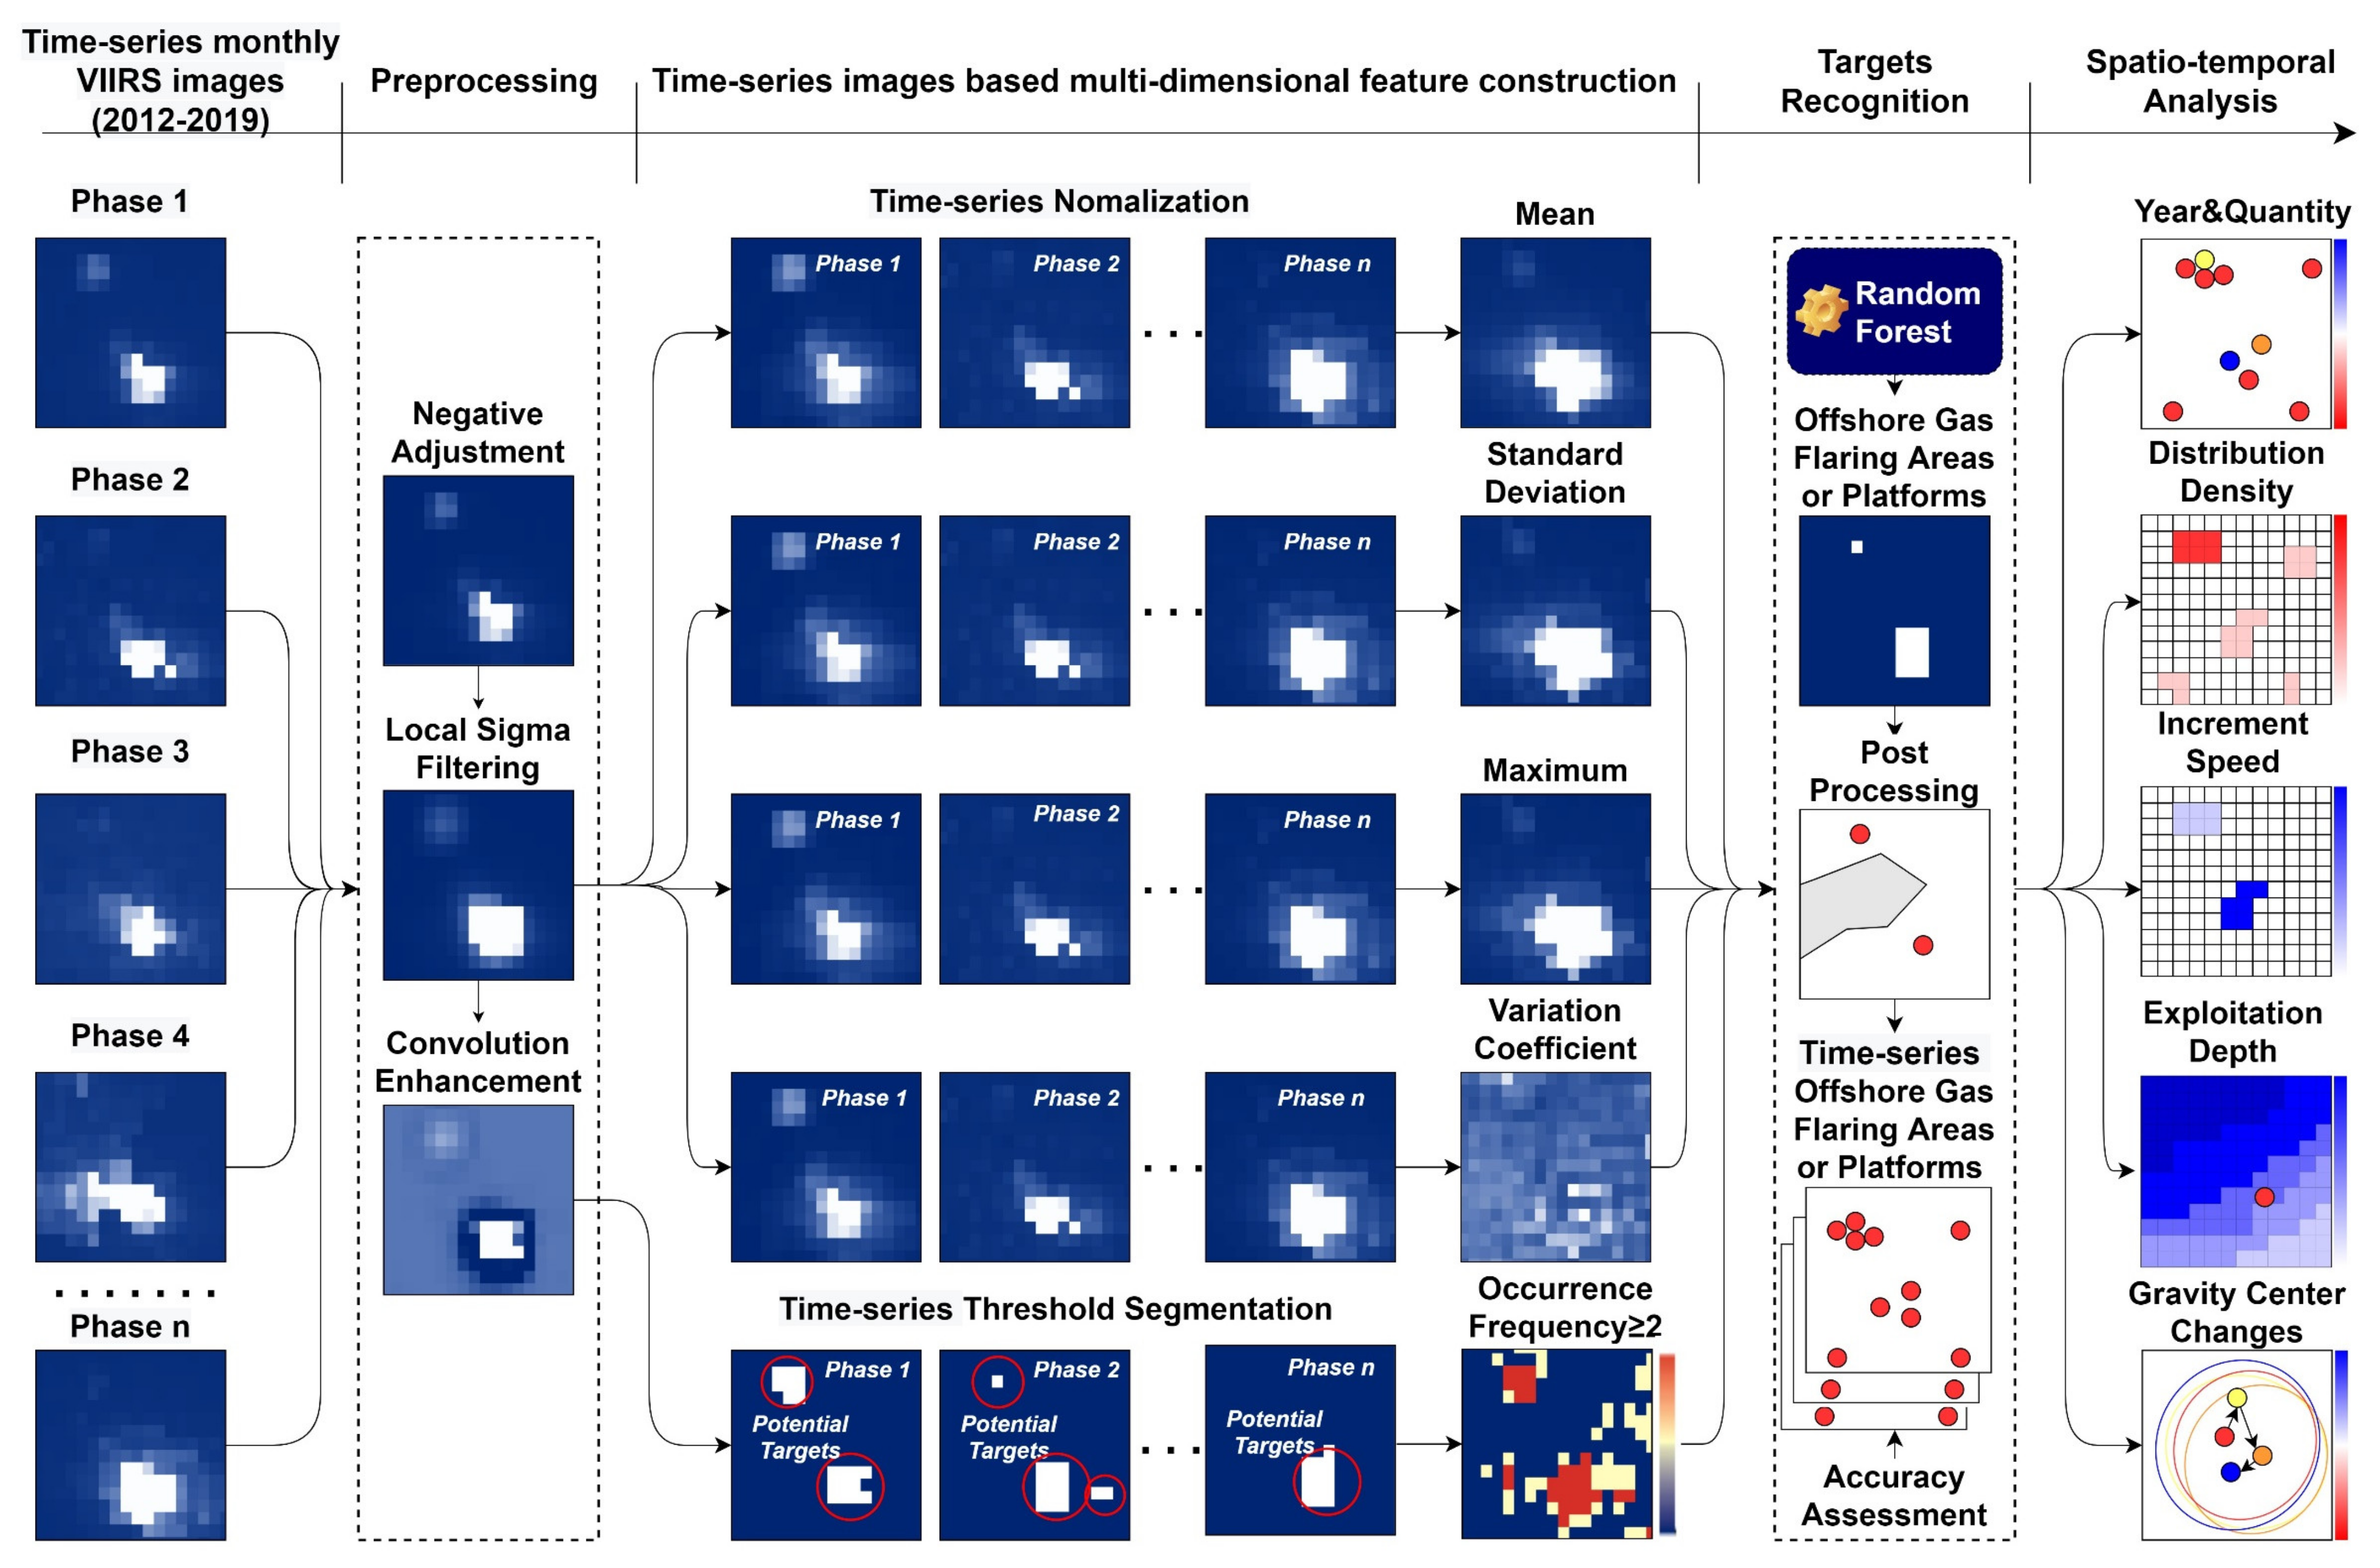
3.2. Methods
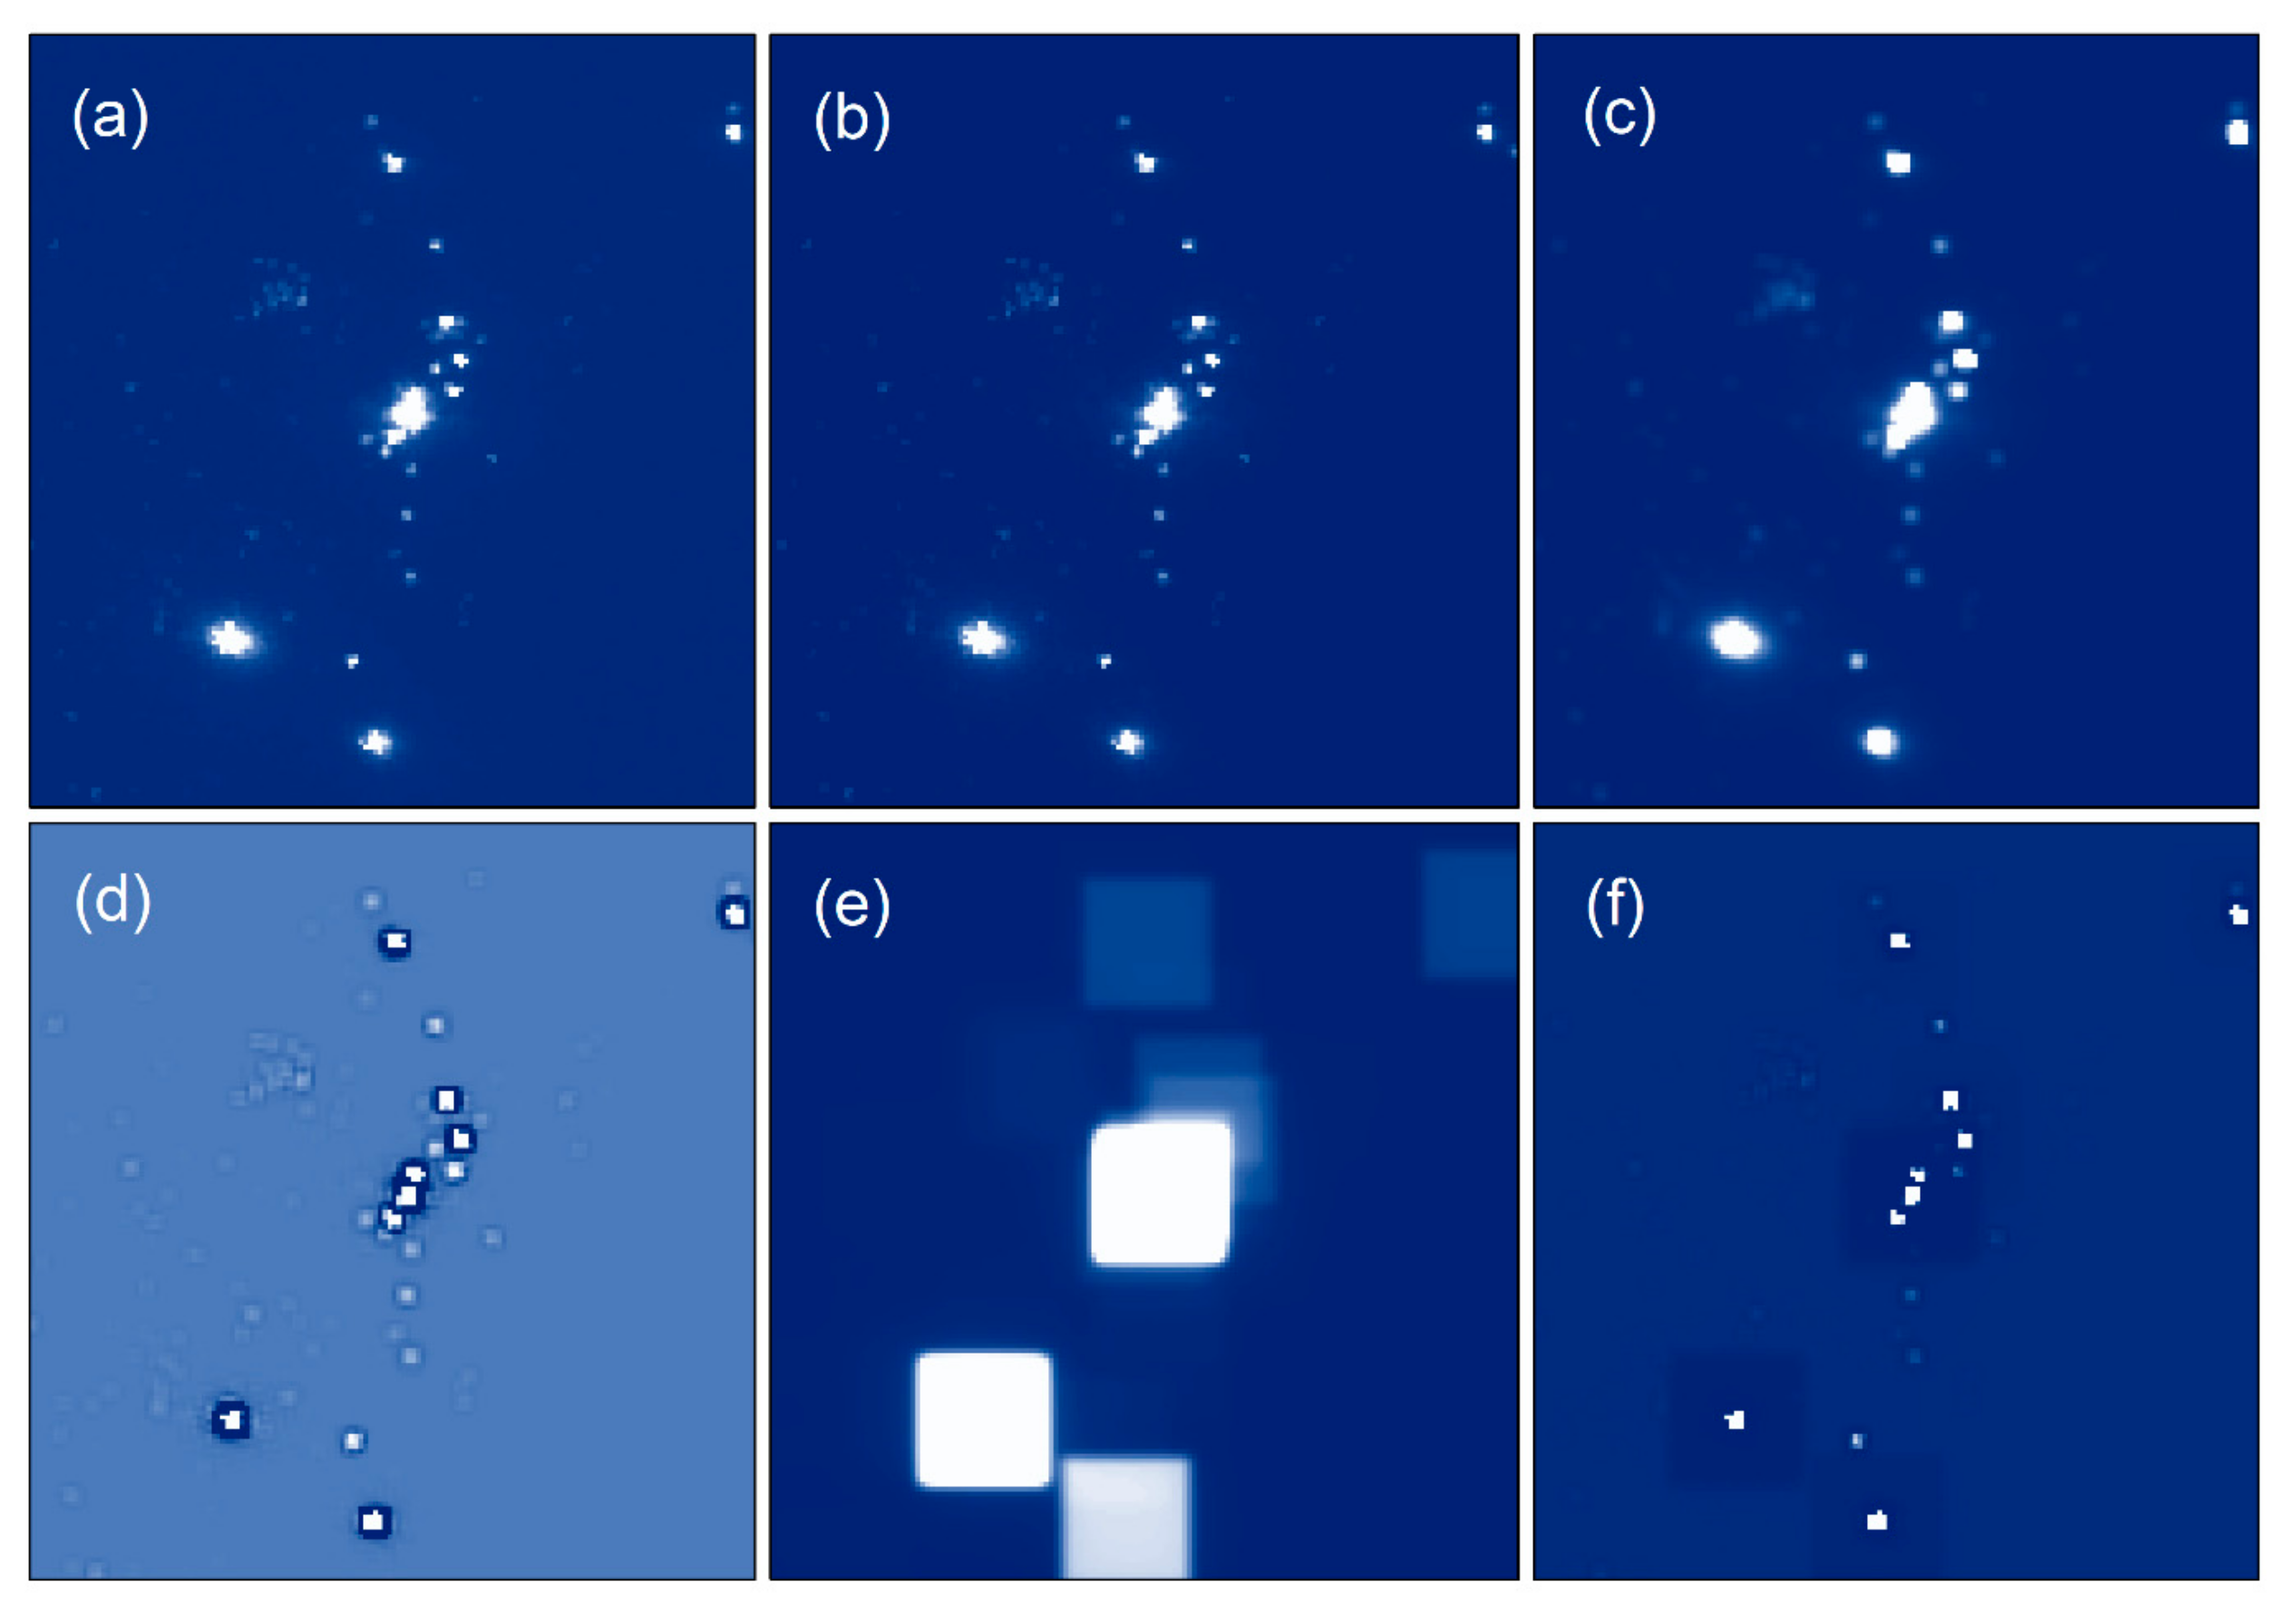
3.2.1. Data Preprocessing
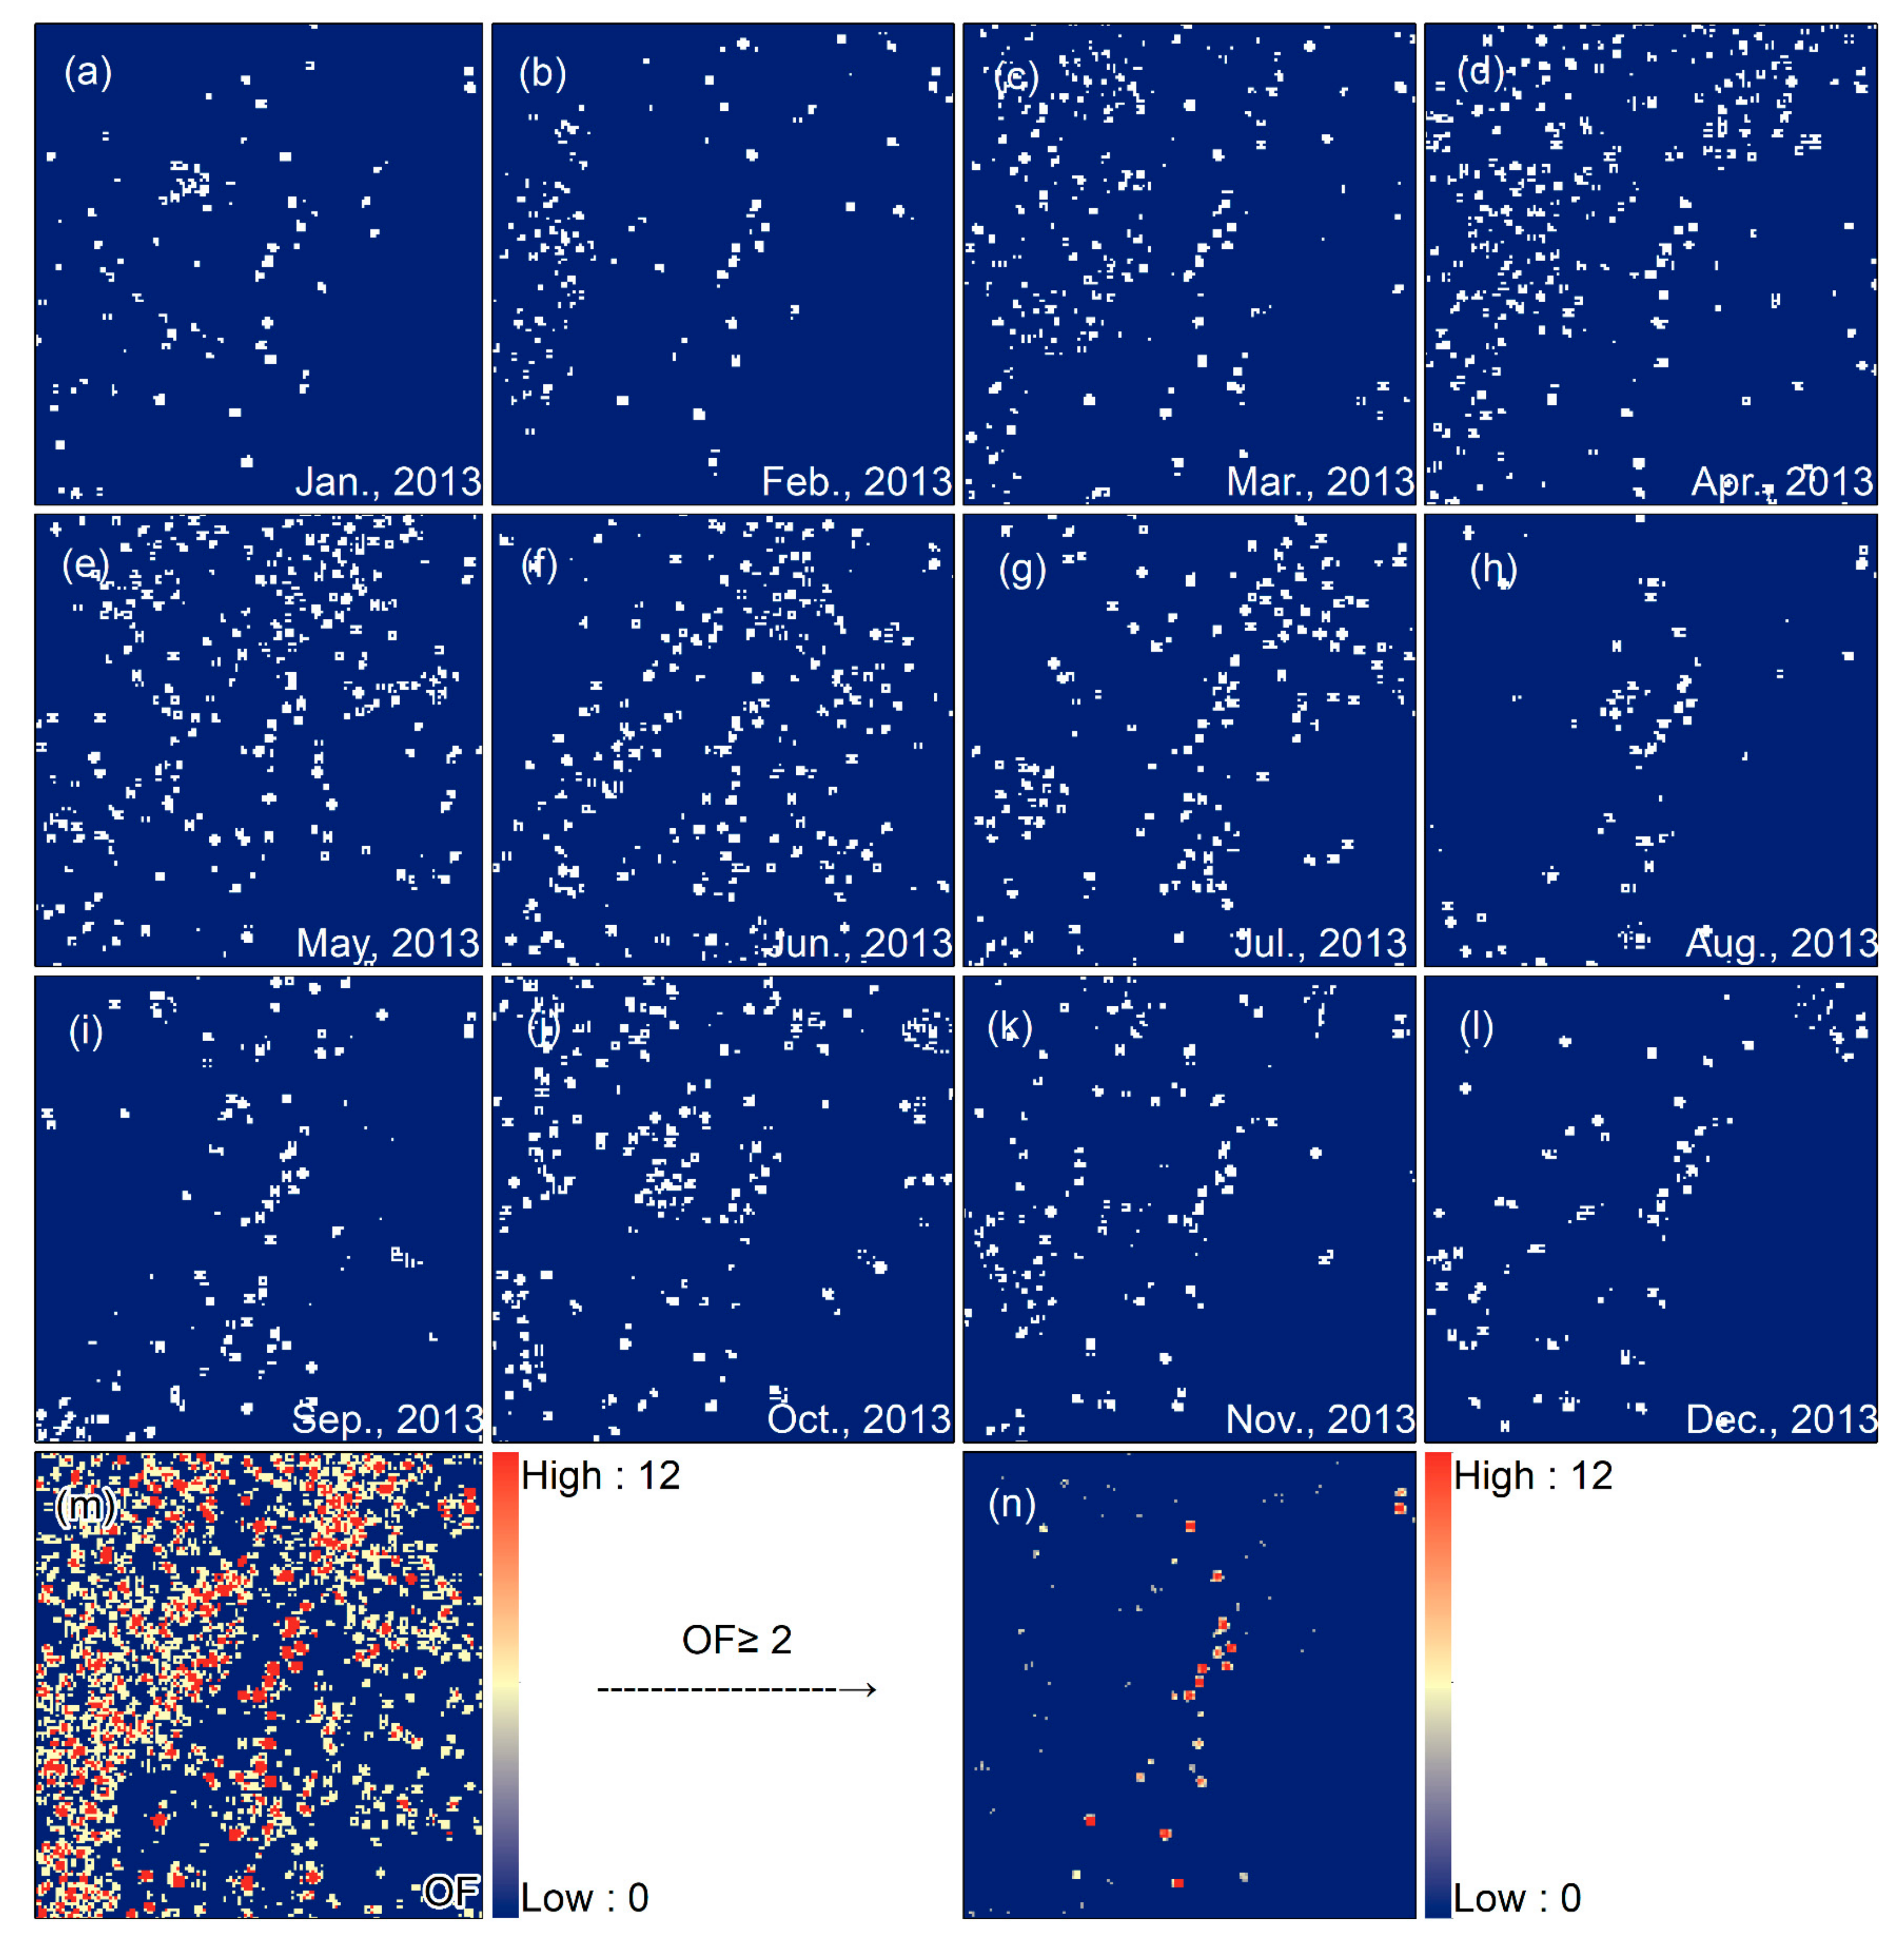
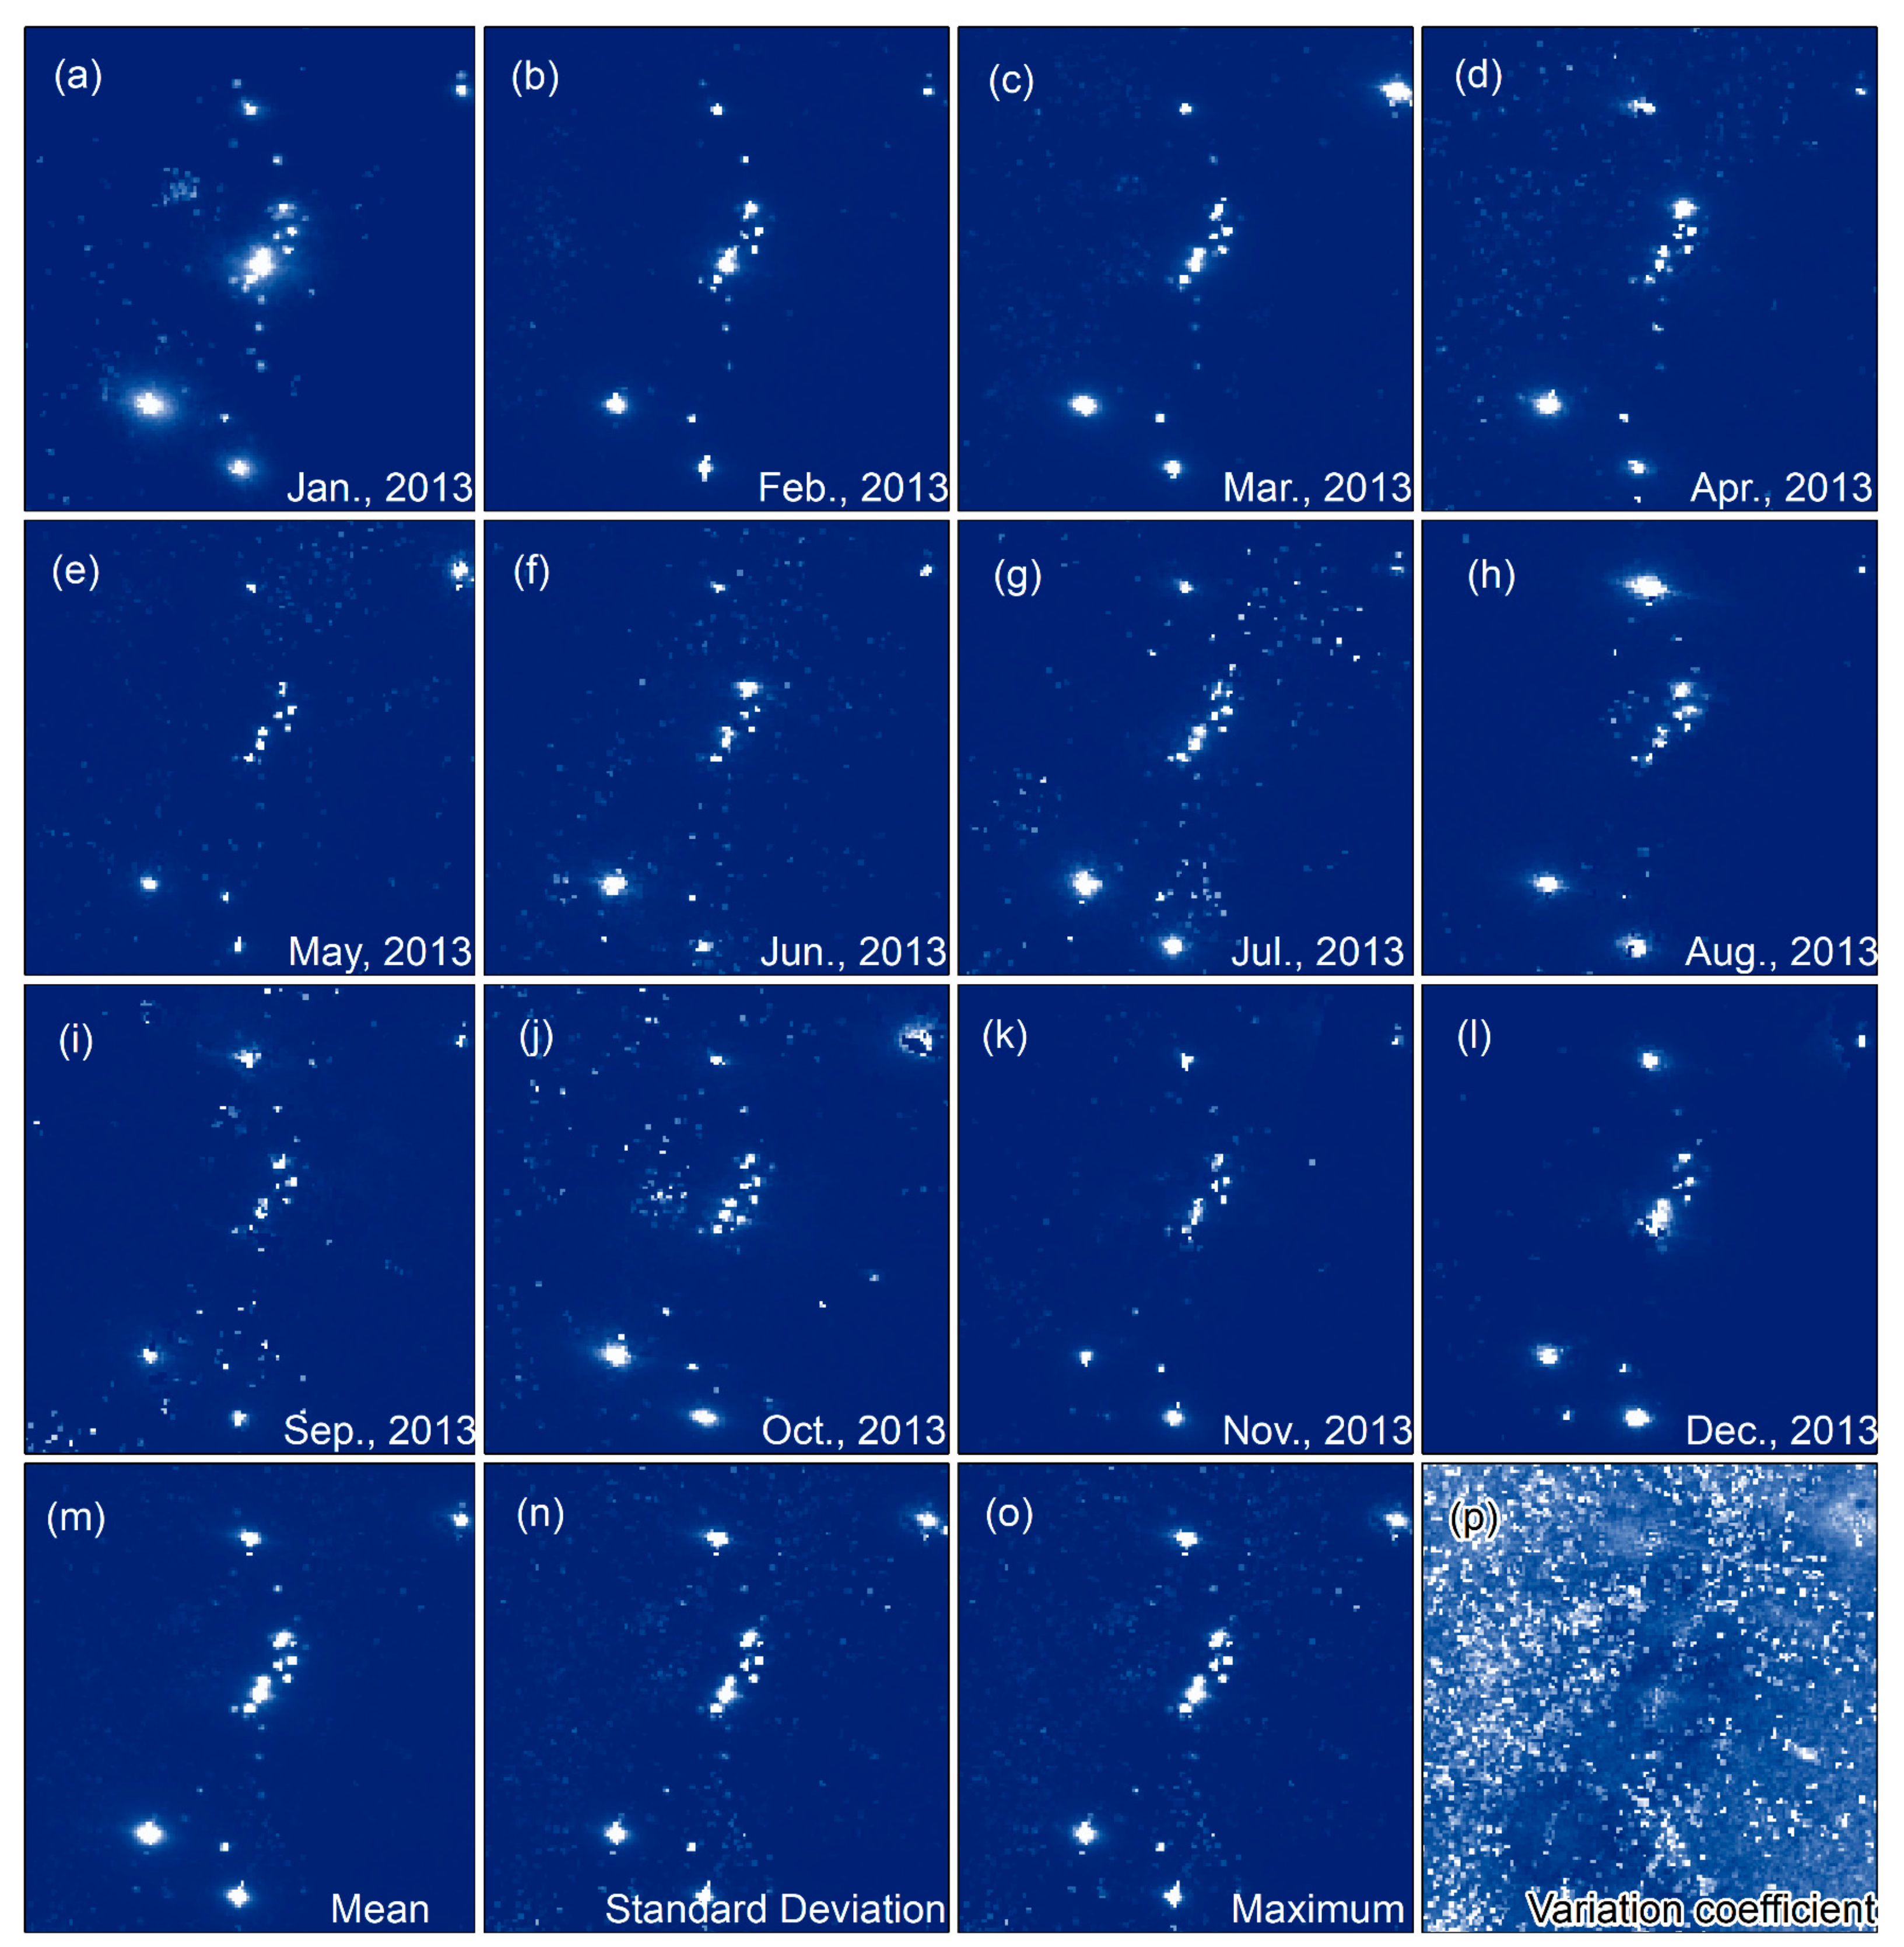
3.2.2. Multi-Features Construction of Offshore HE Targets
3.2.3. Offshore HE Targets Recognition Based on Random Forest Model
3.2.4. Spatio-Temporal Analysis of Offshore HE Activities
4. Results
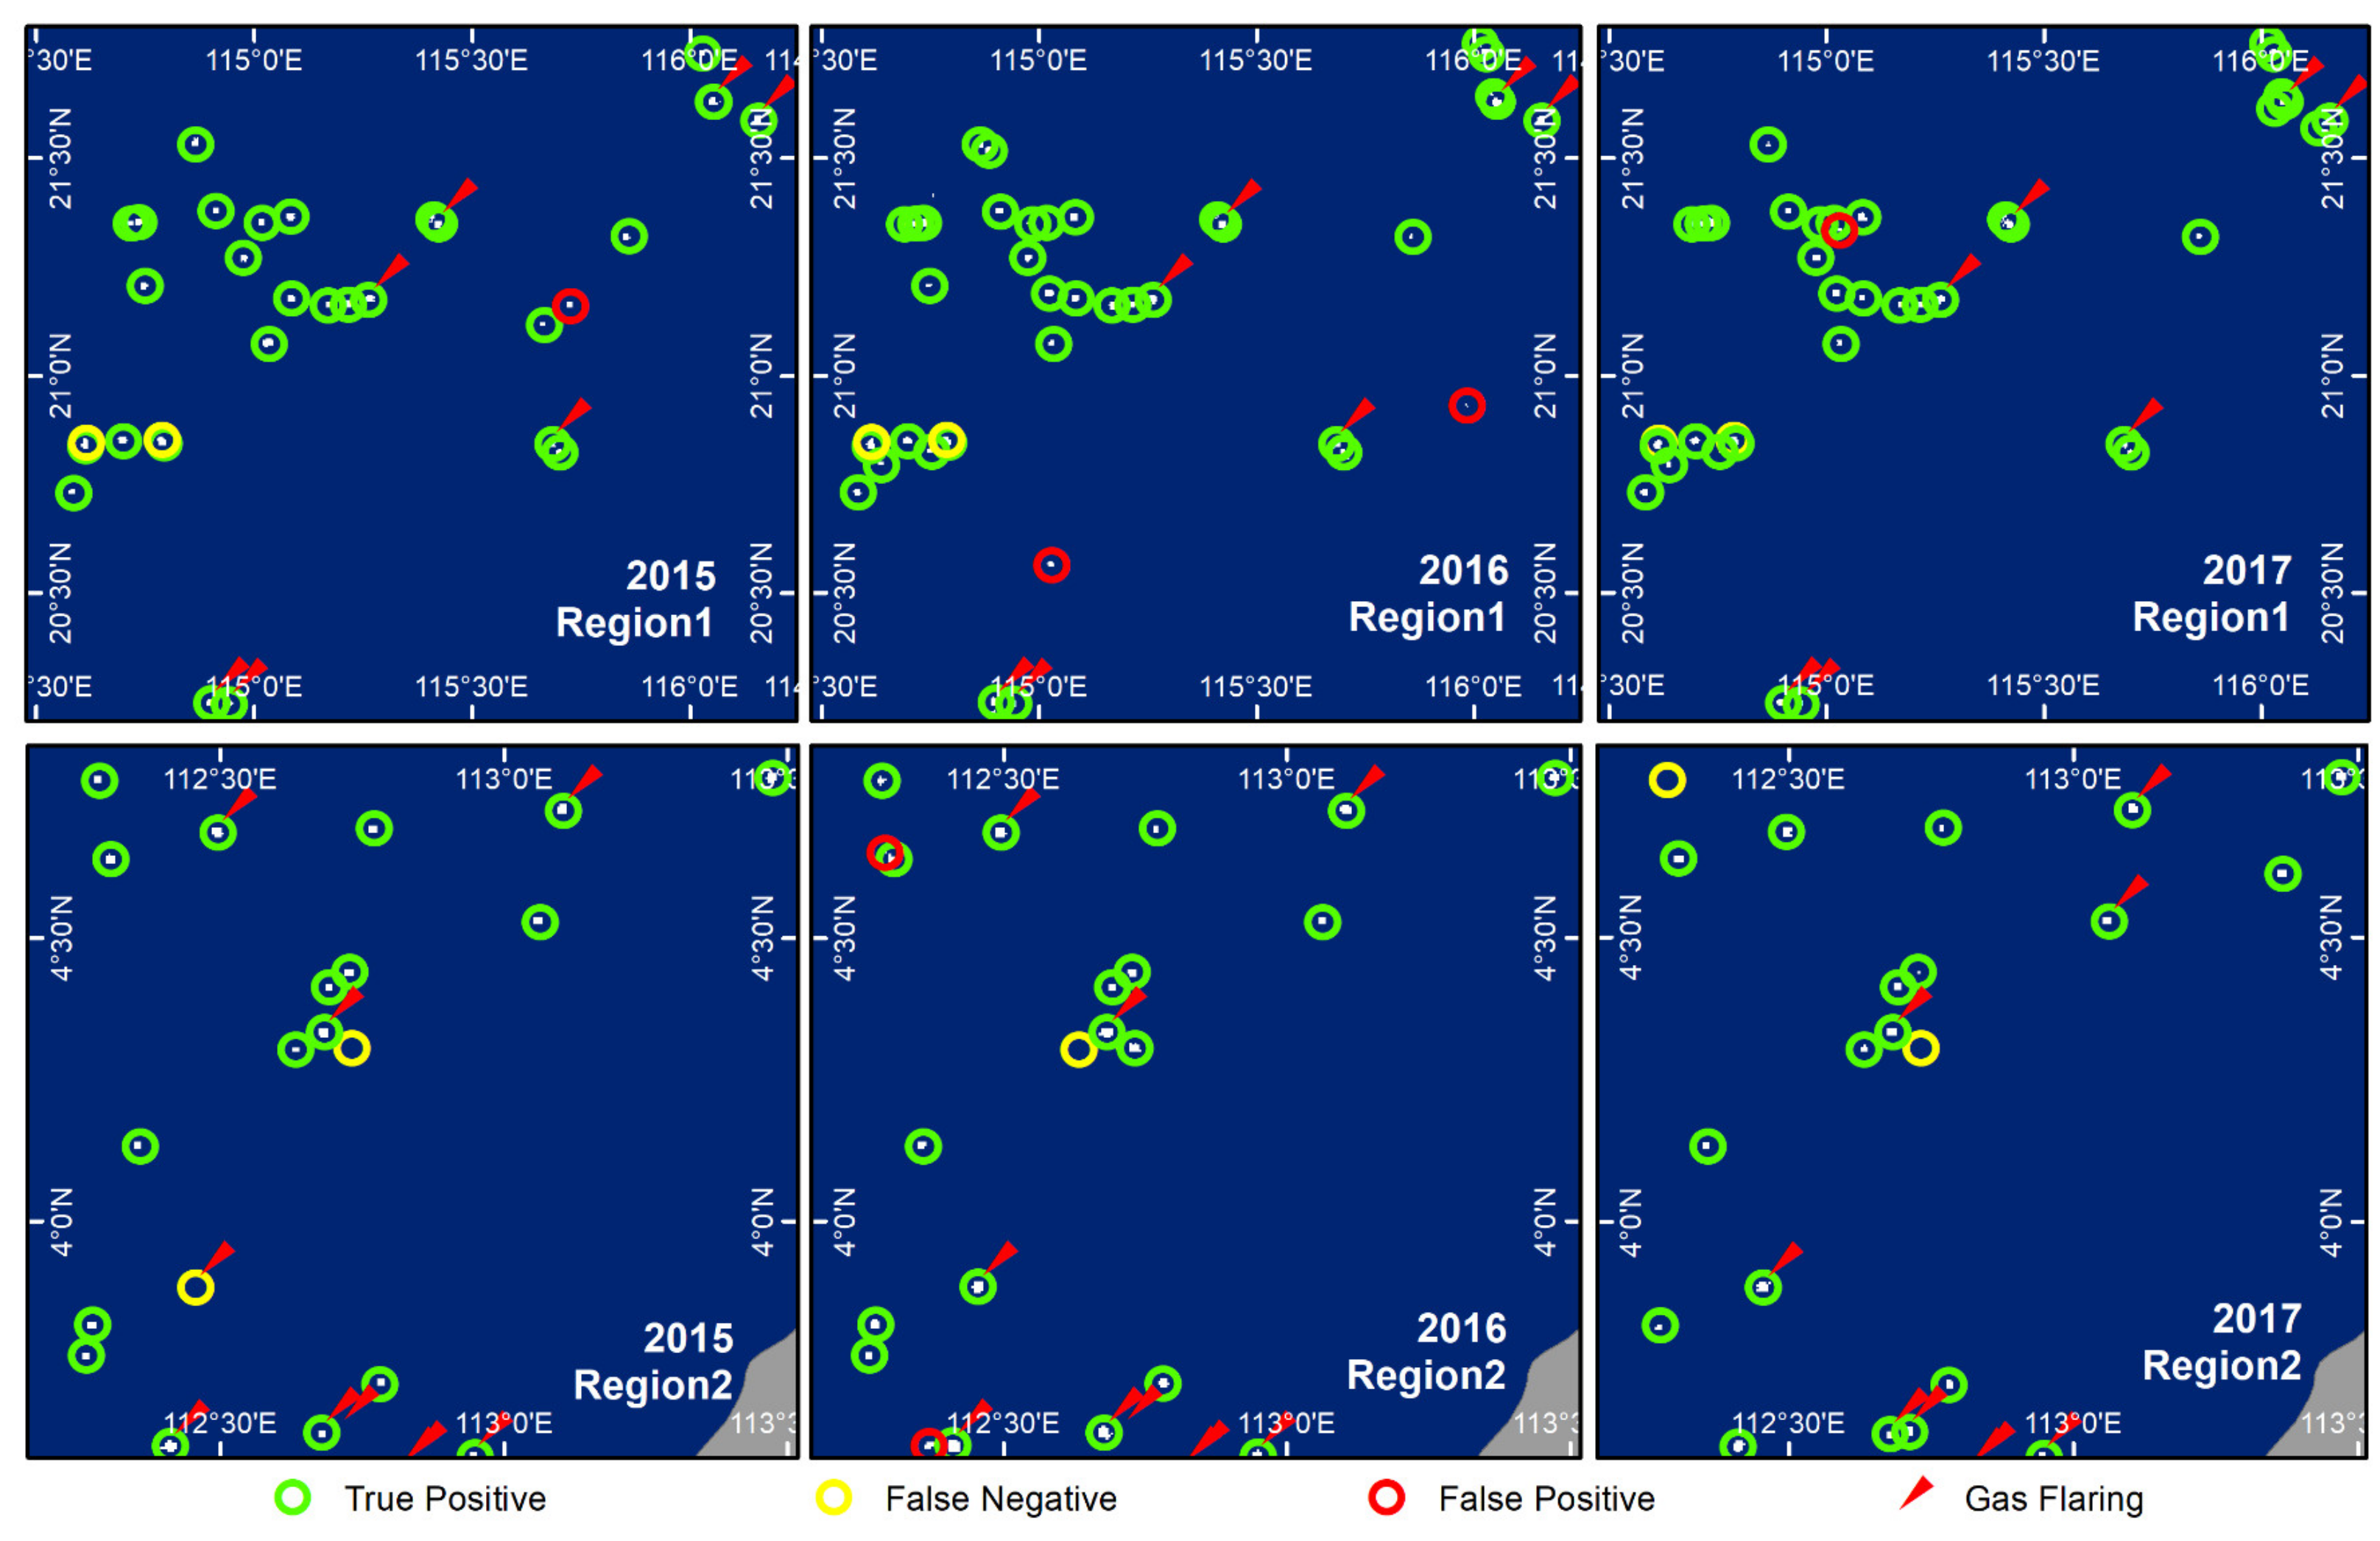
4.1. Precision Evaluation of Target Recognition for Offshore HE
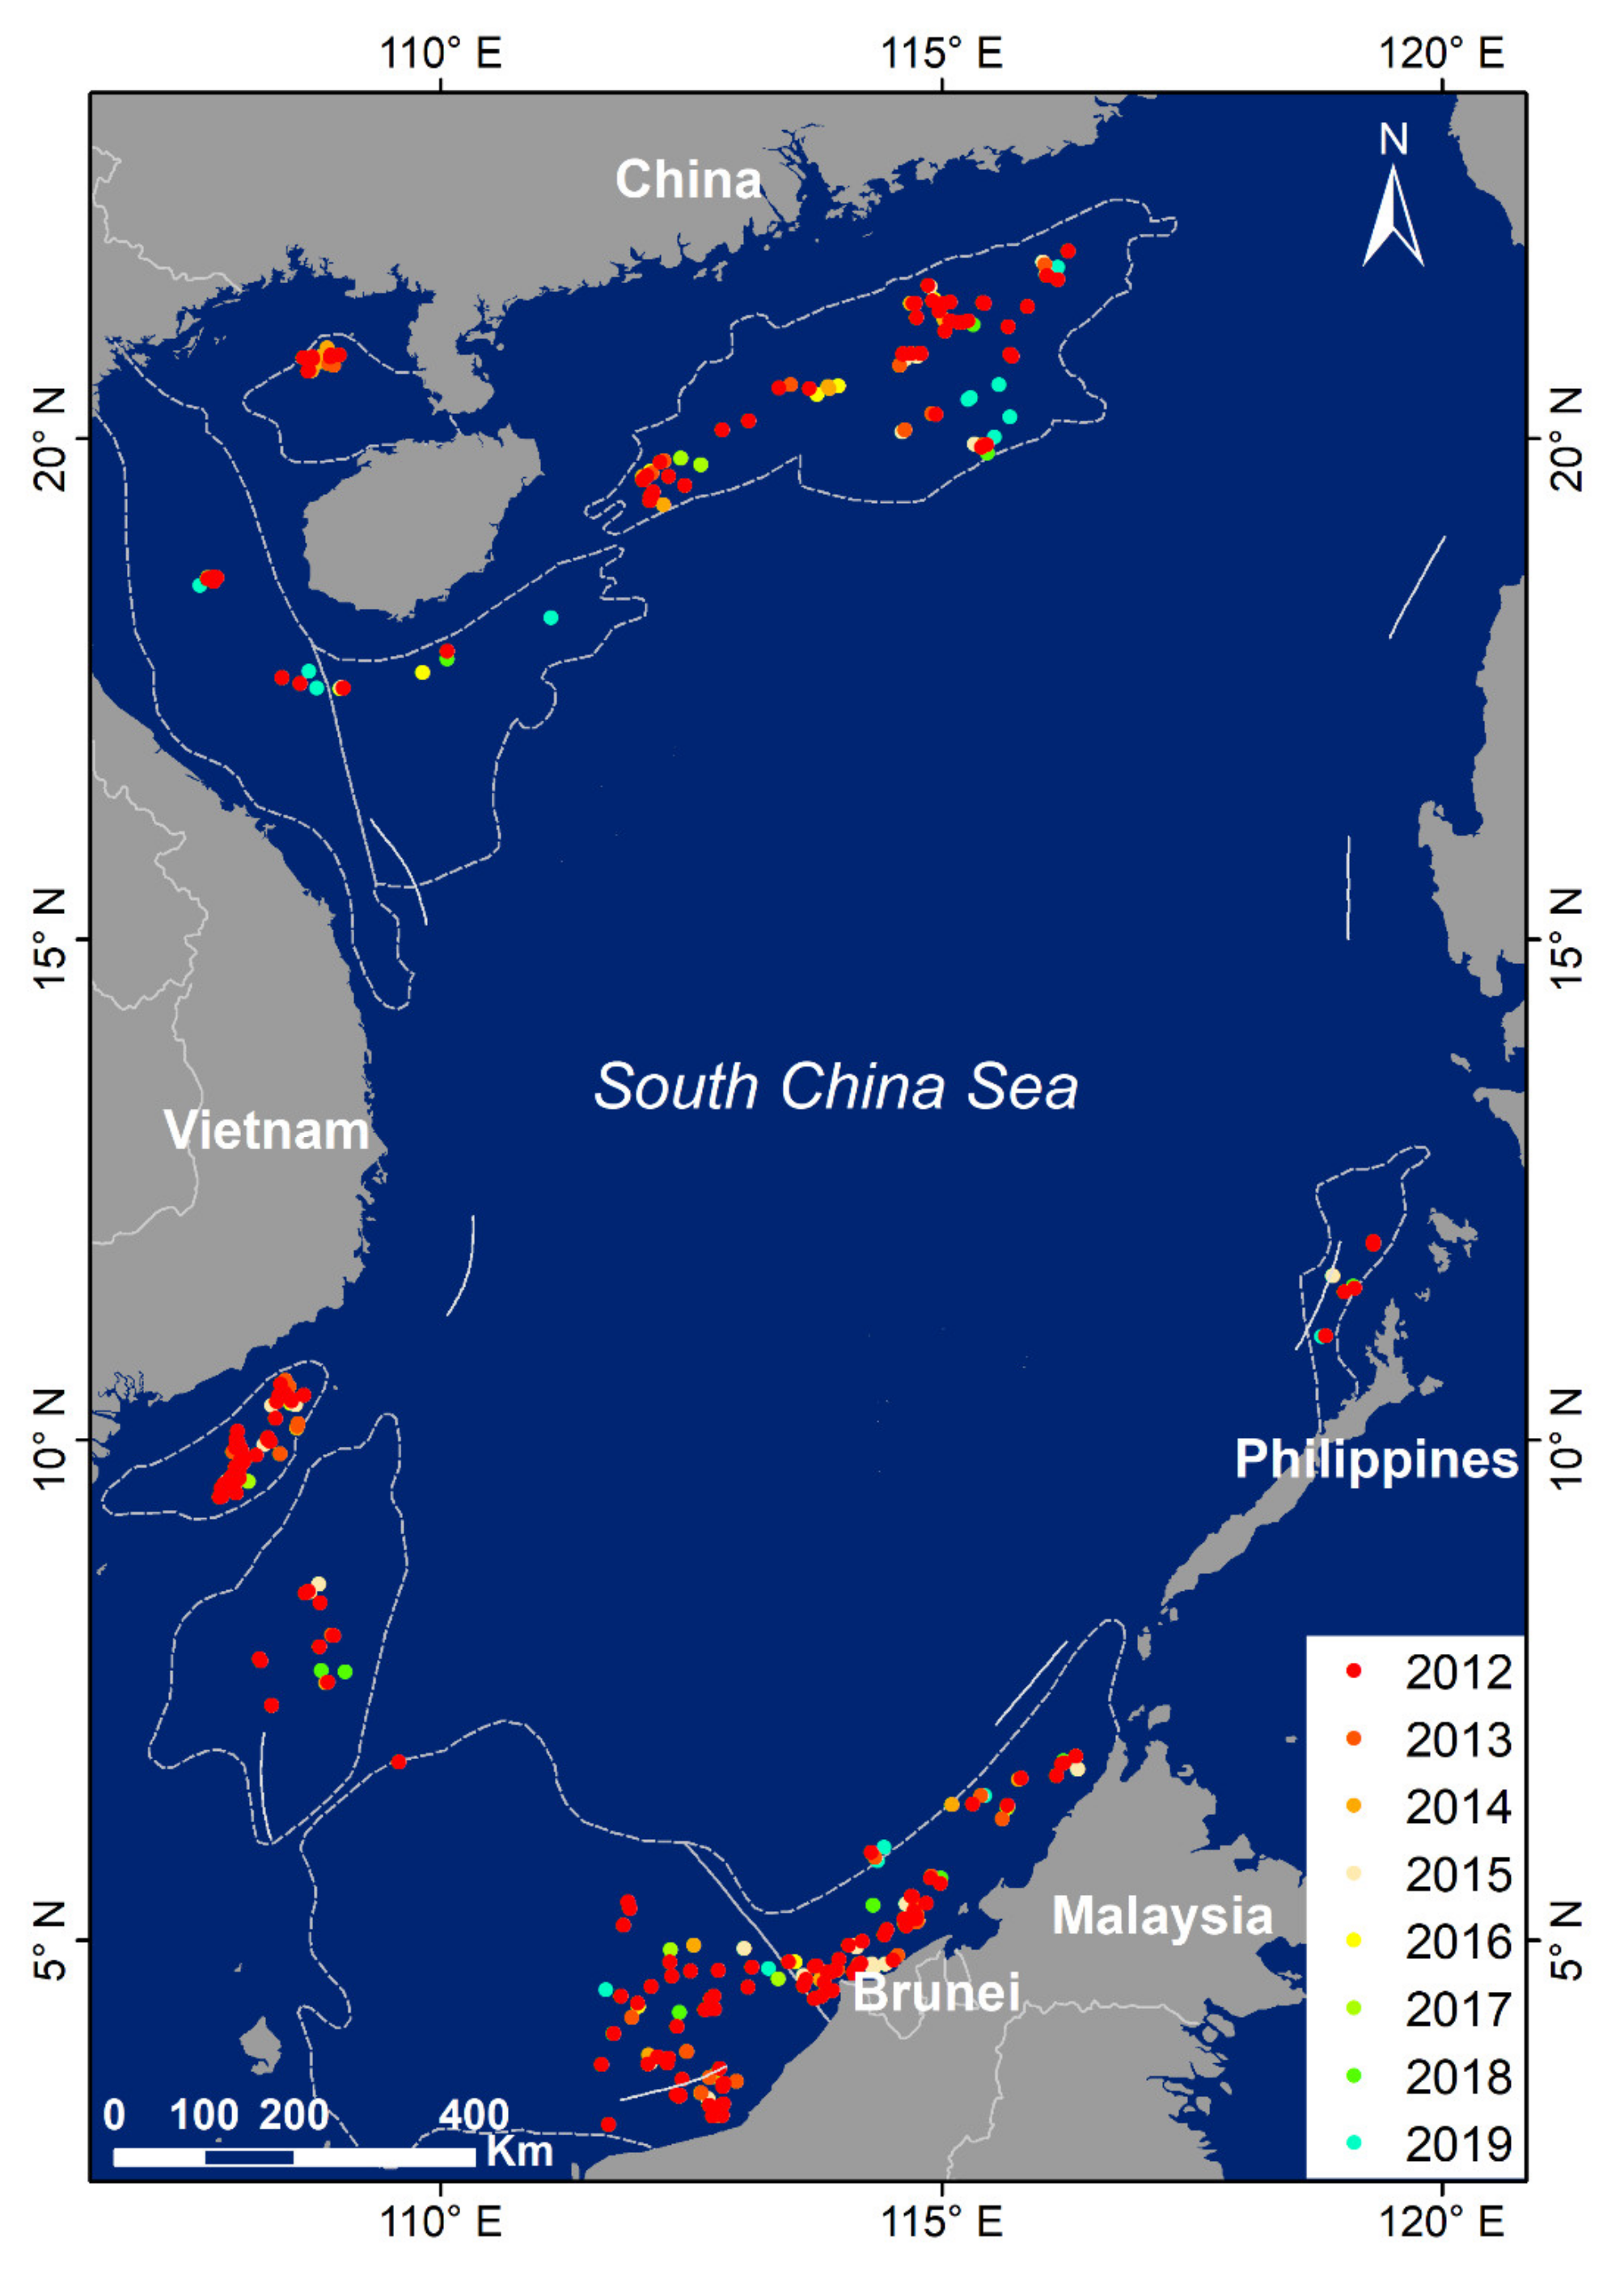
4.2. Recognition Results of Offshore HE Targets from 2012 to 2019
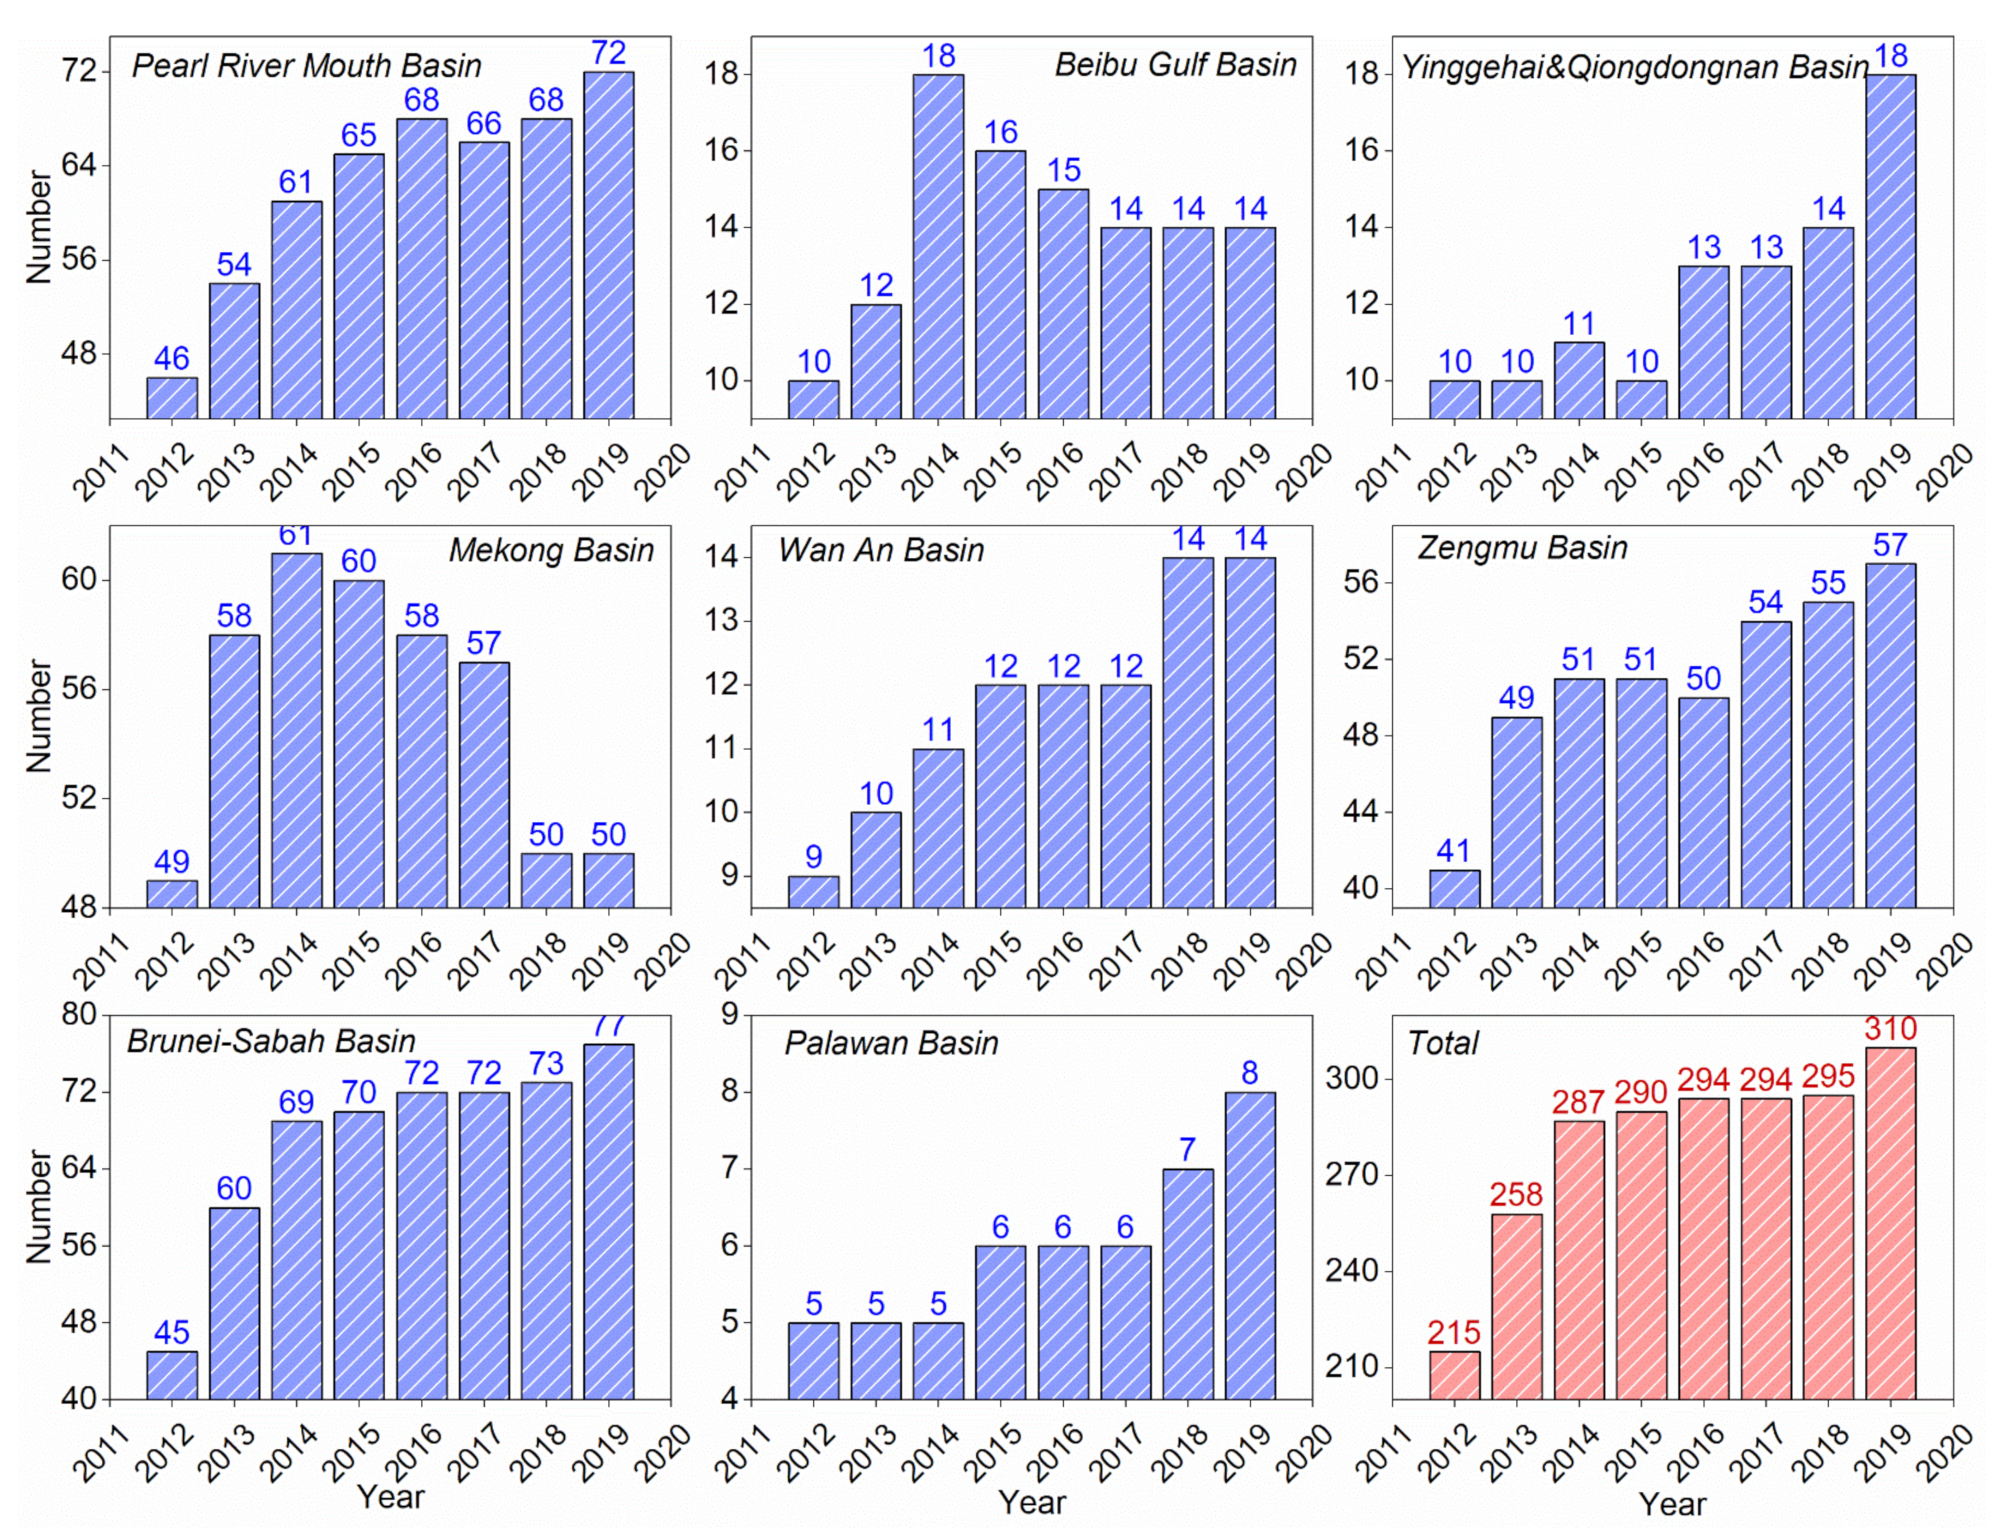
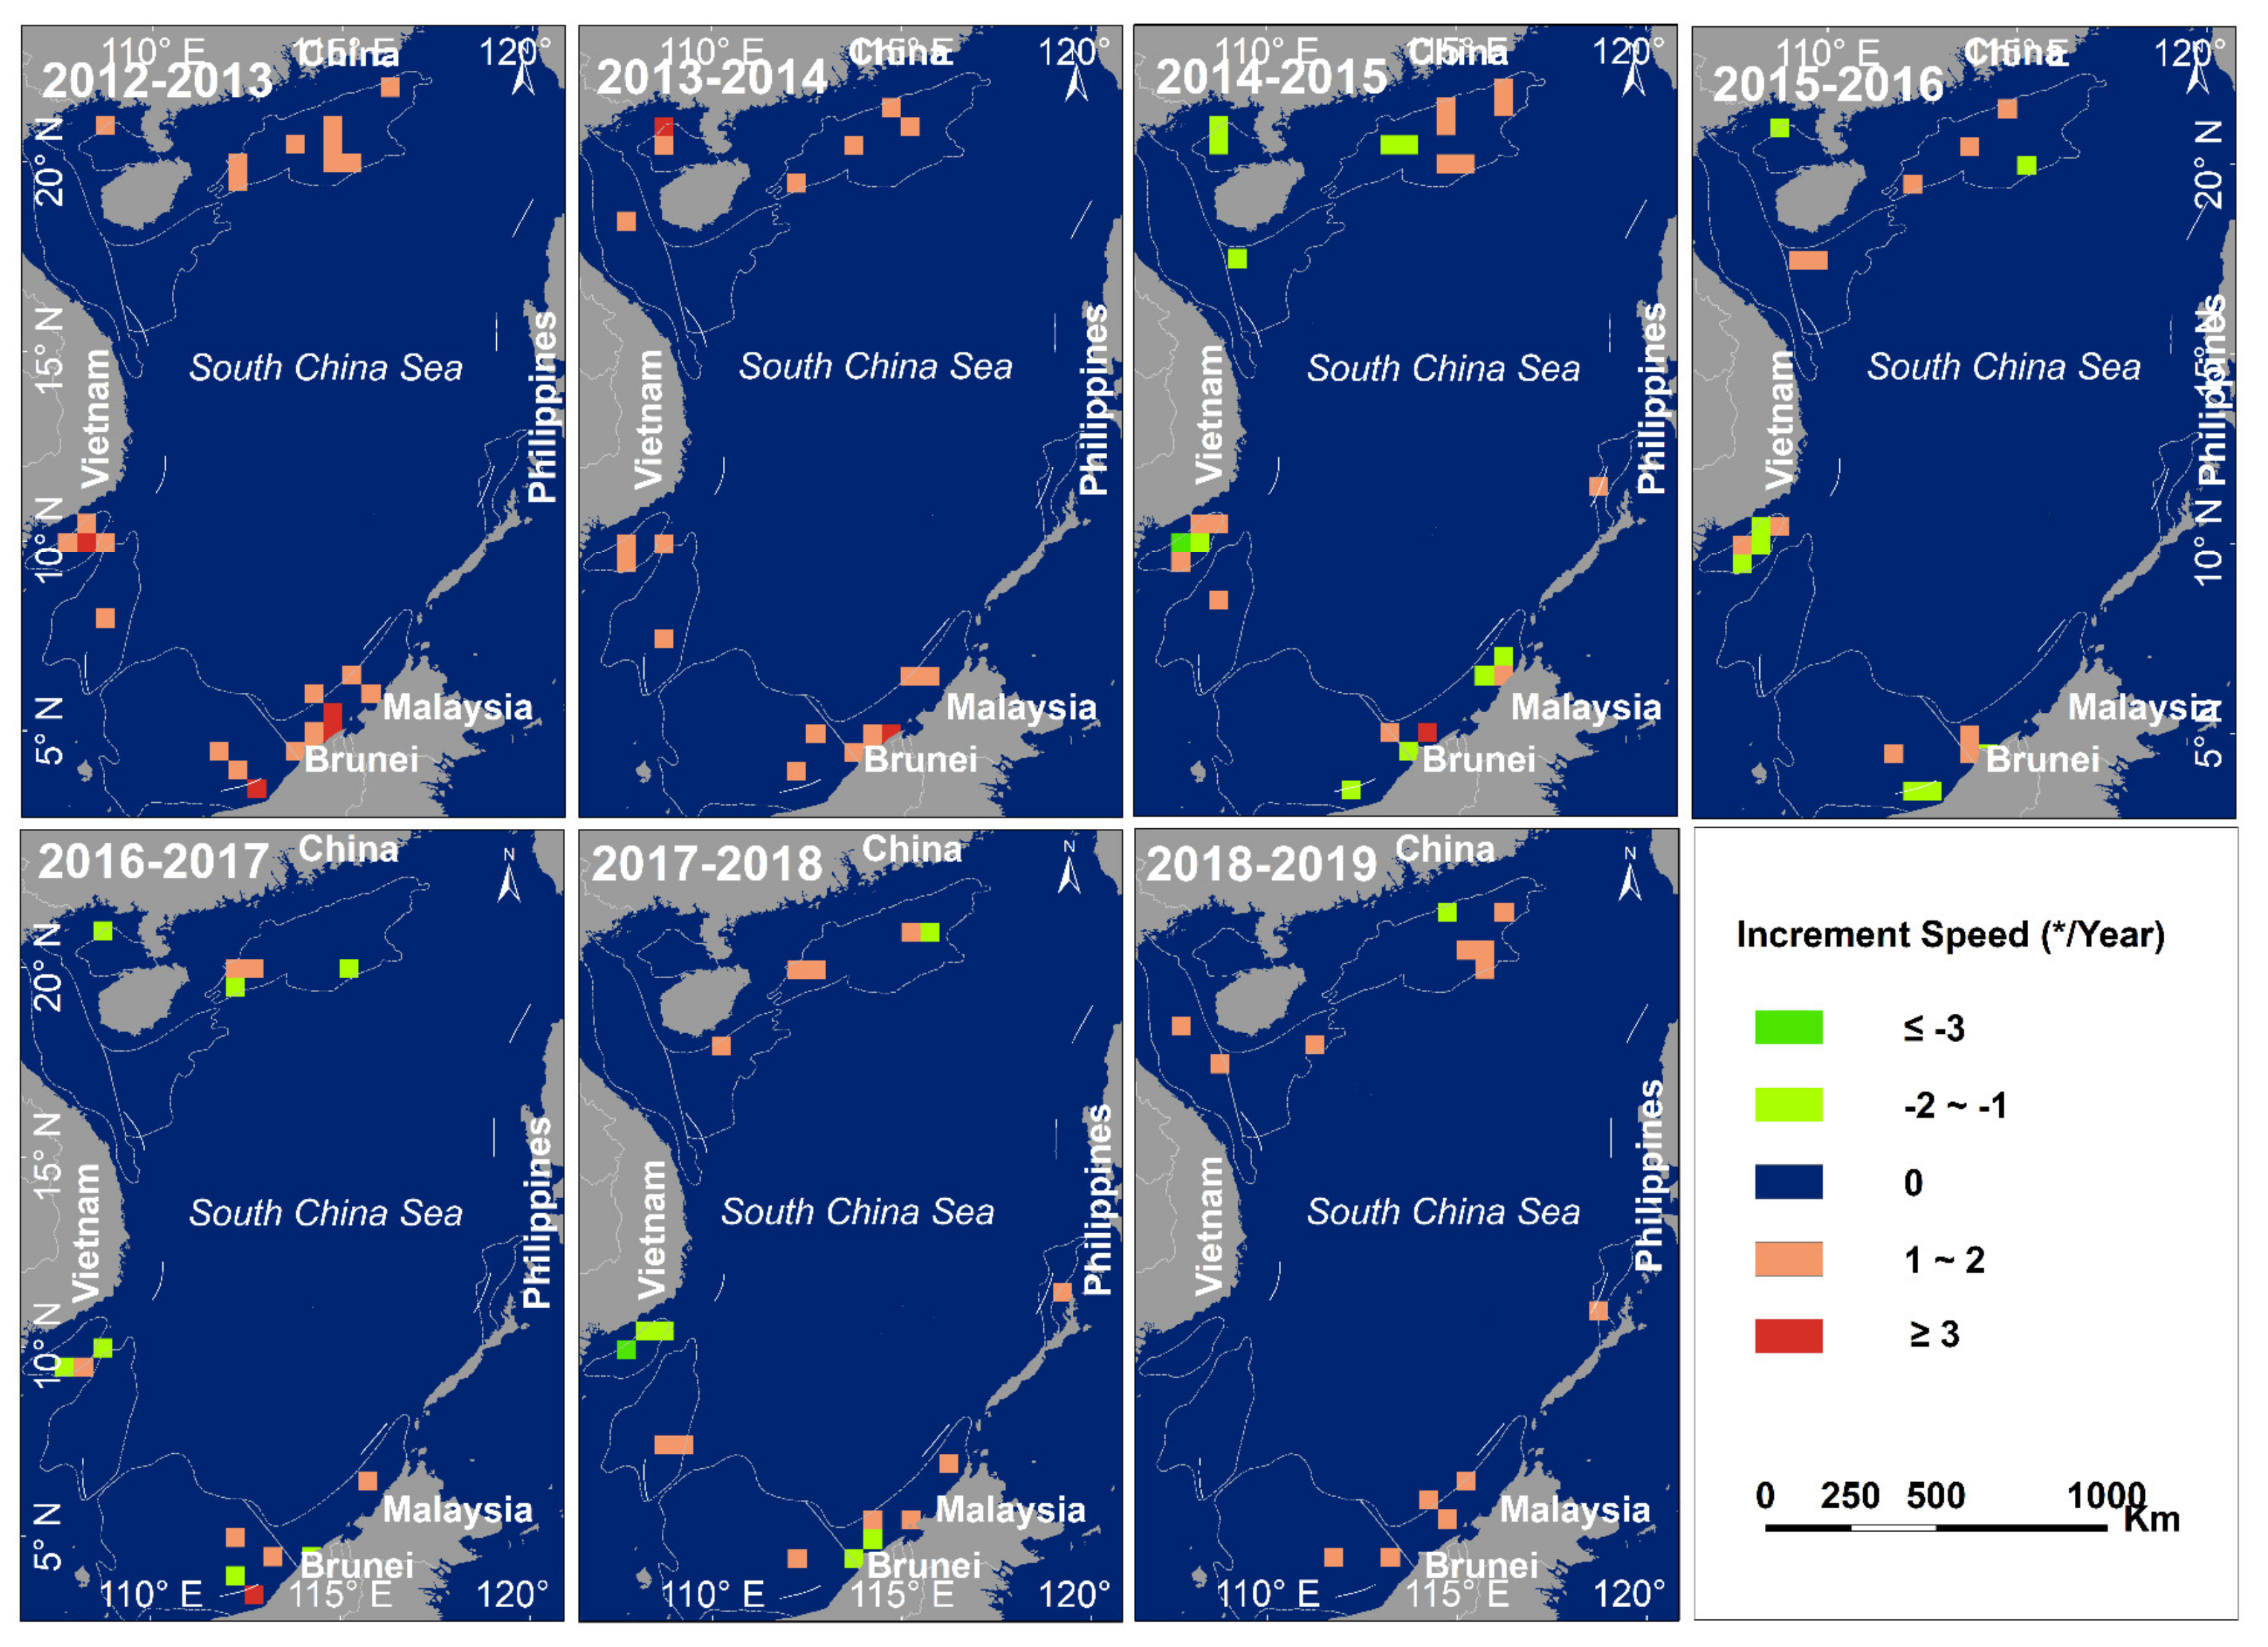
4.3. Increment Speed Changes of Offshore HE Targets from 2012 to 2019
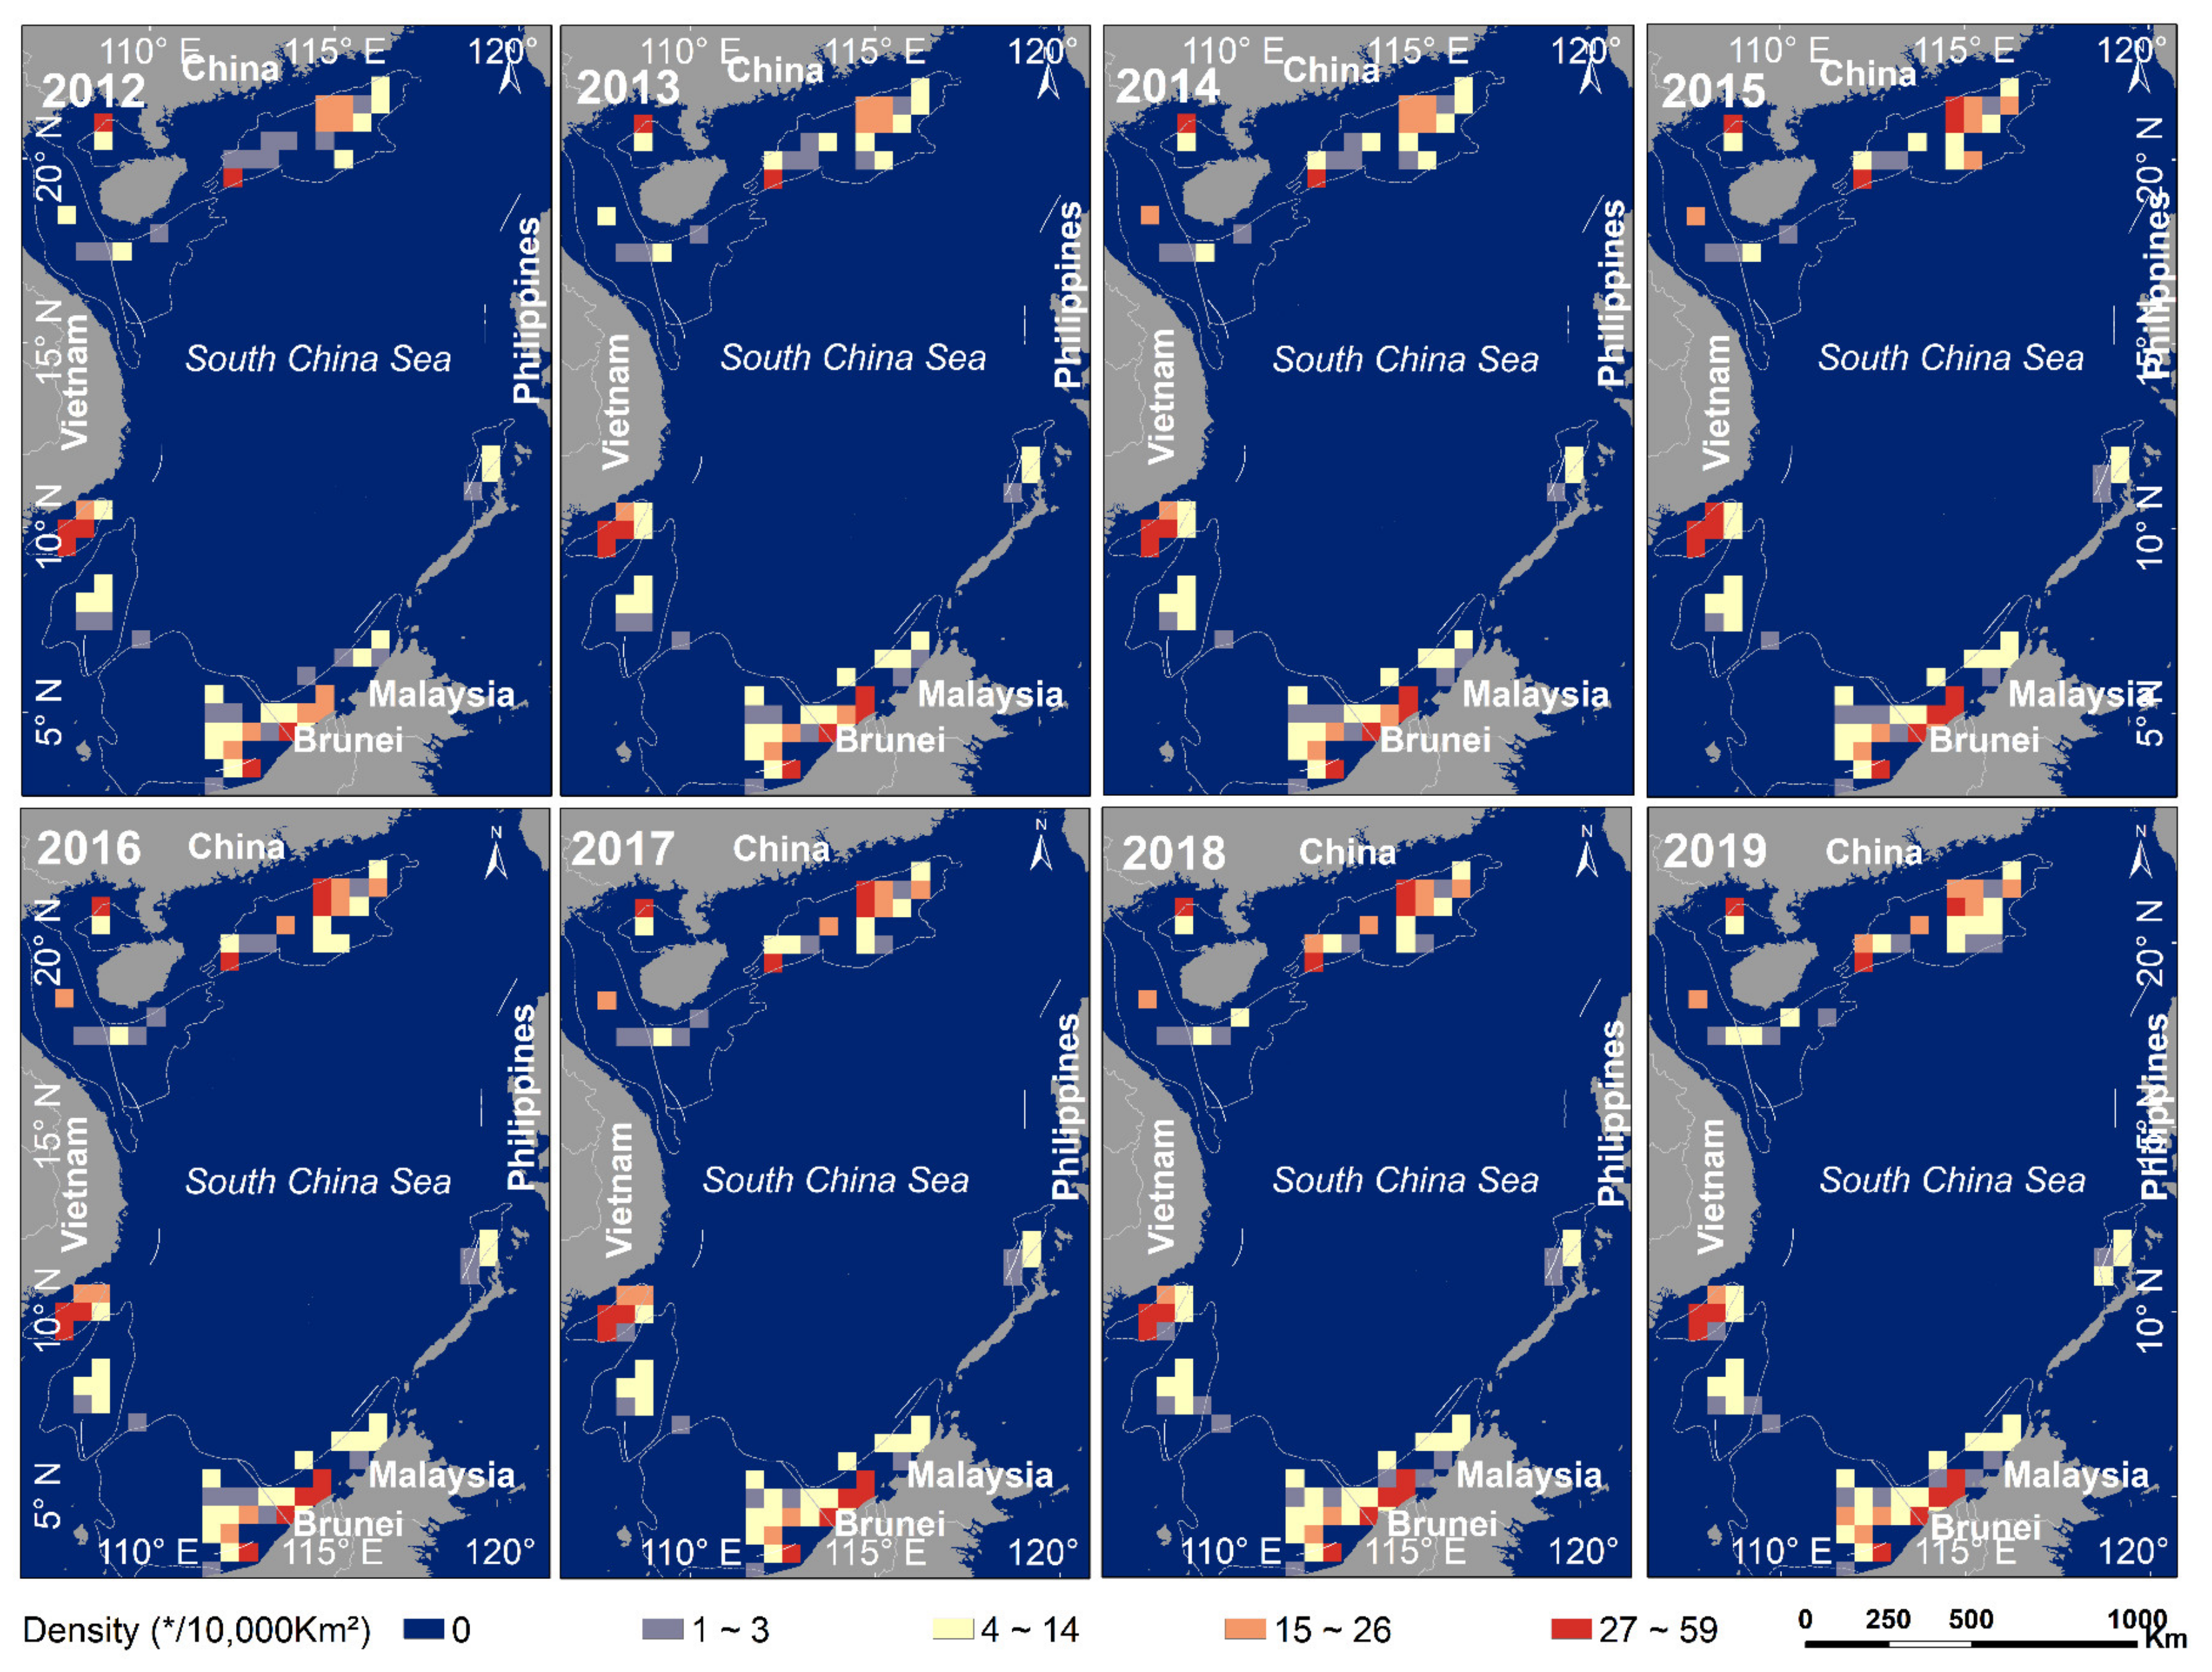
4.4. Distribution Density Changes of Offshore HE Targets from 2012 to 2019
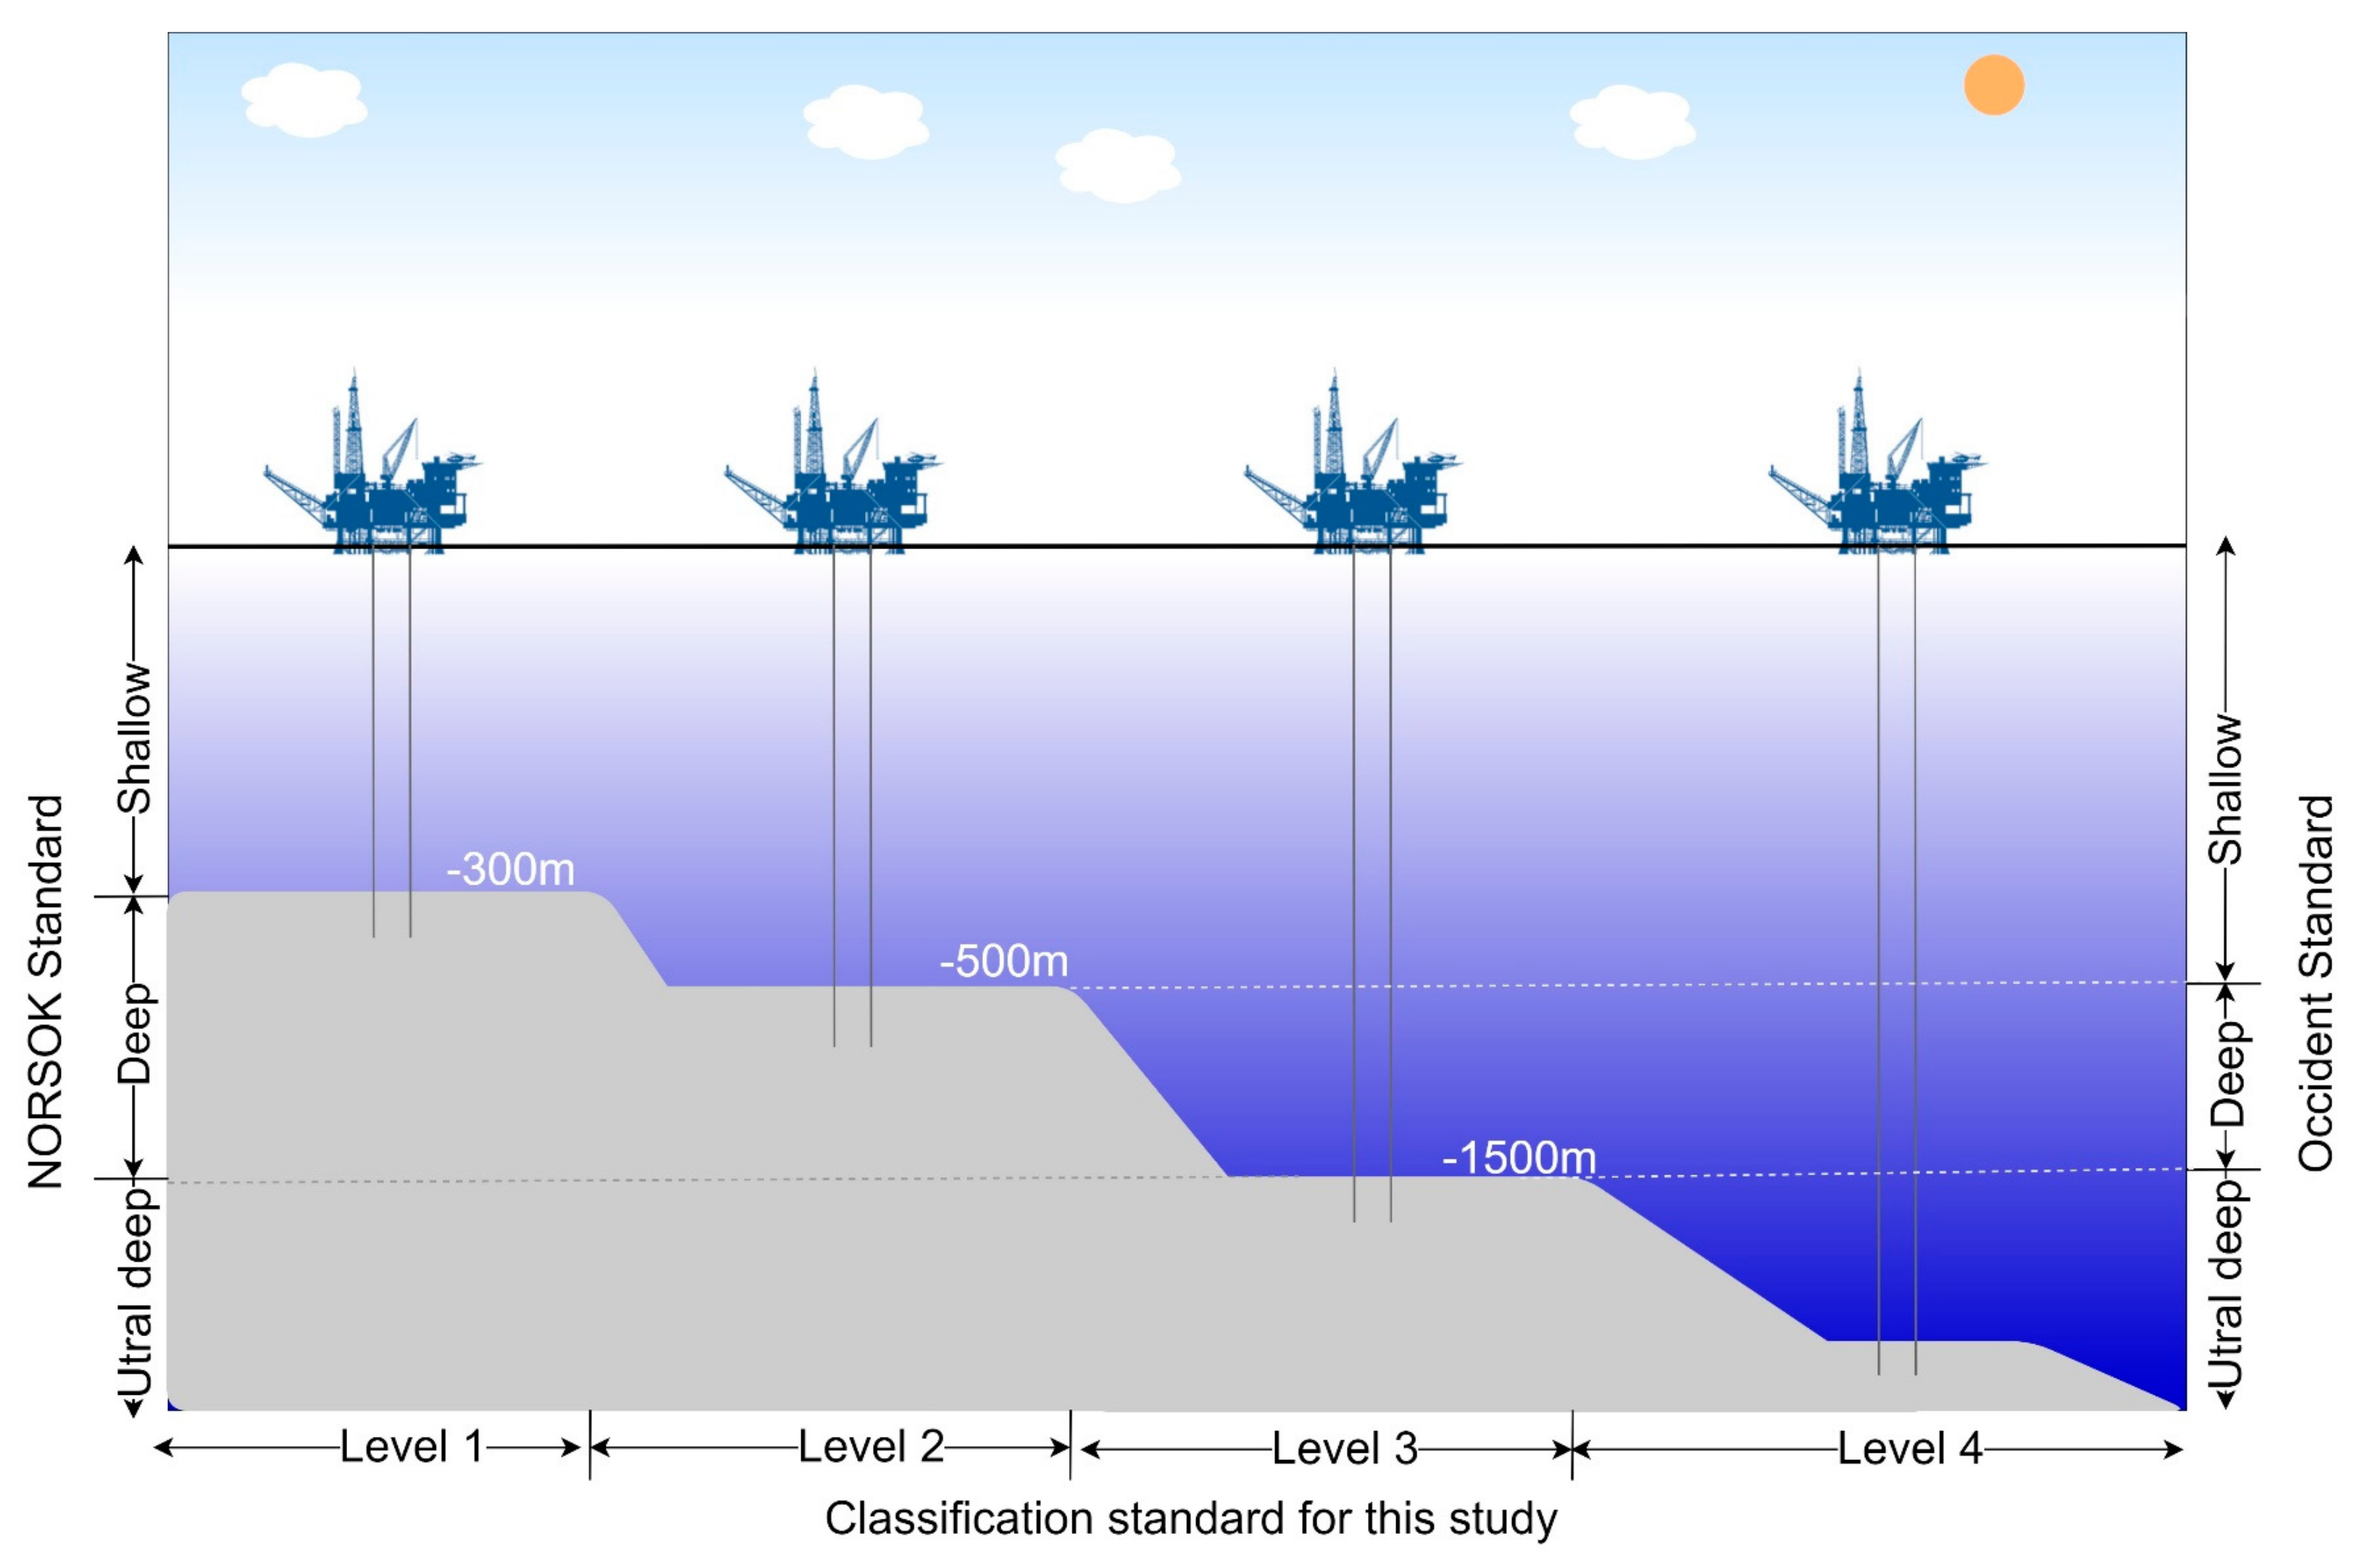
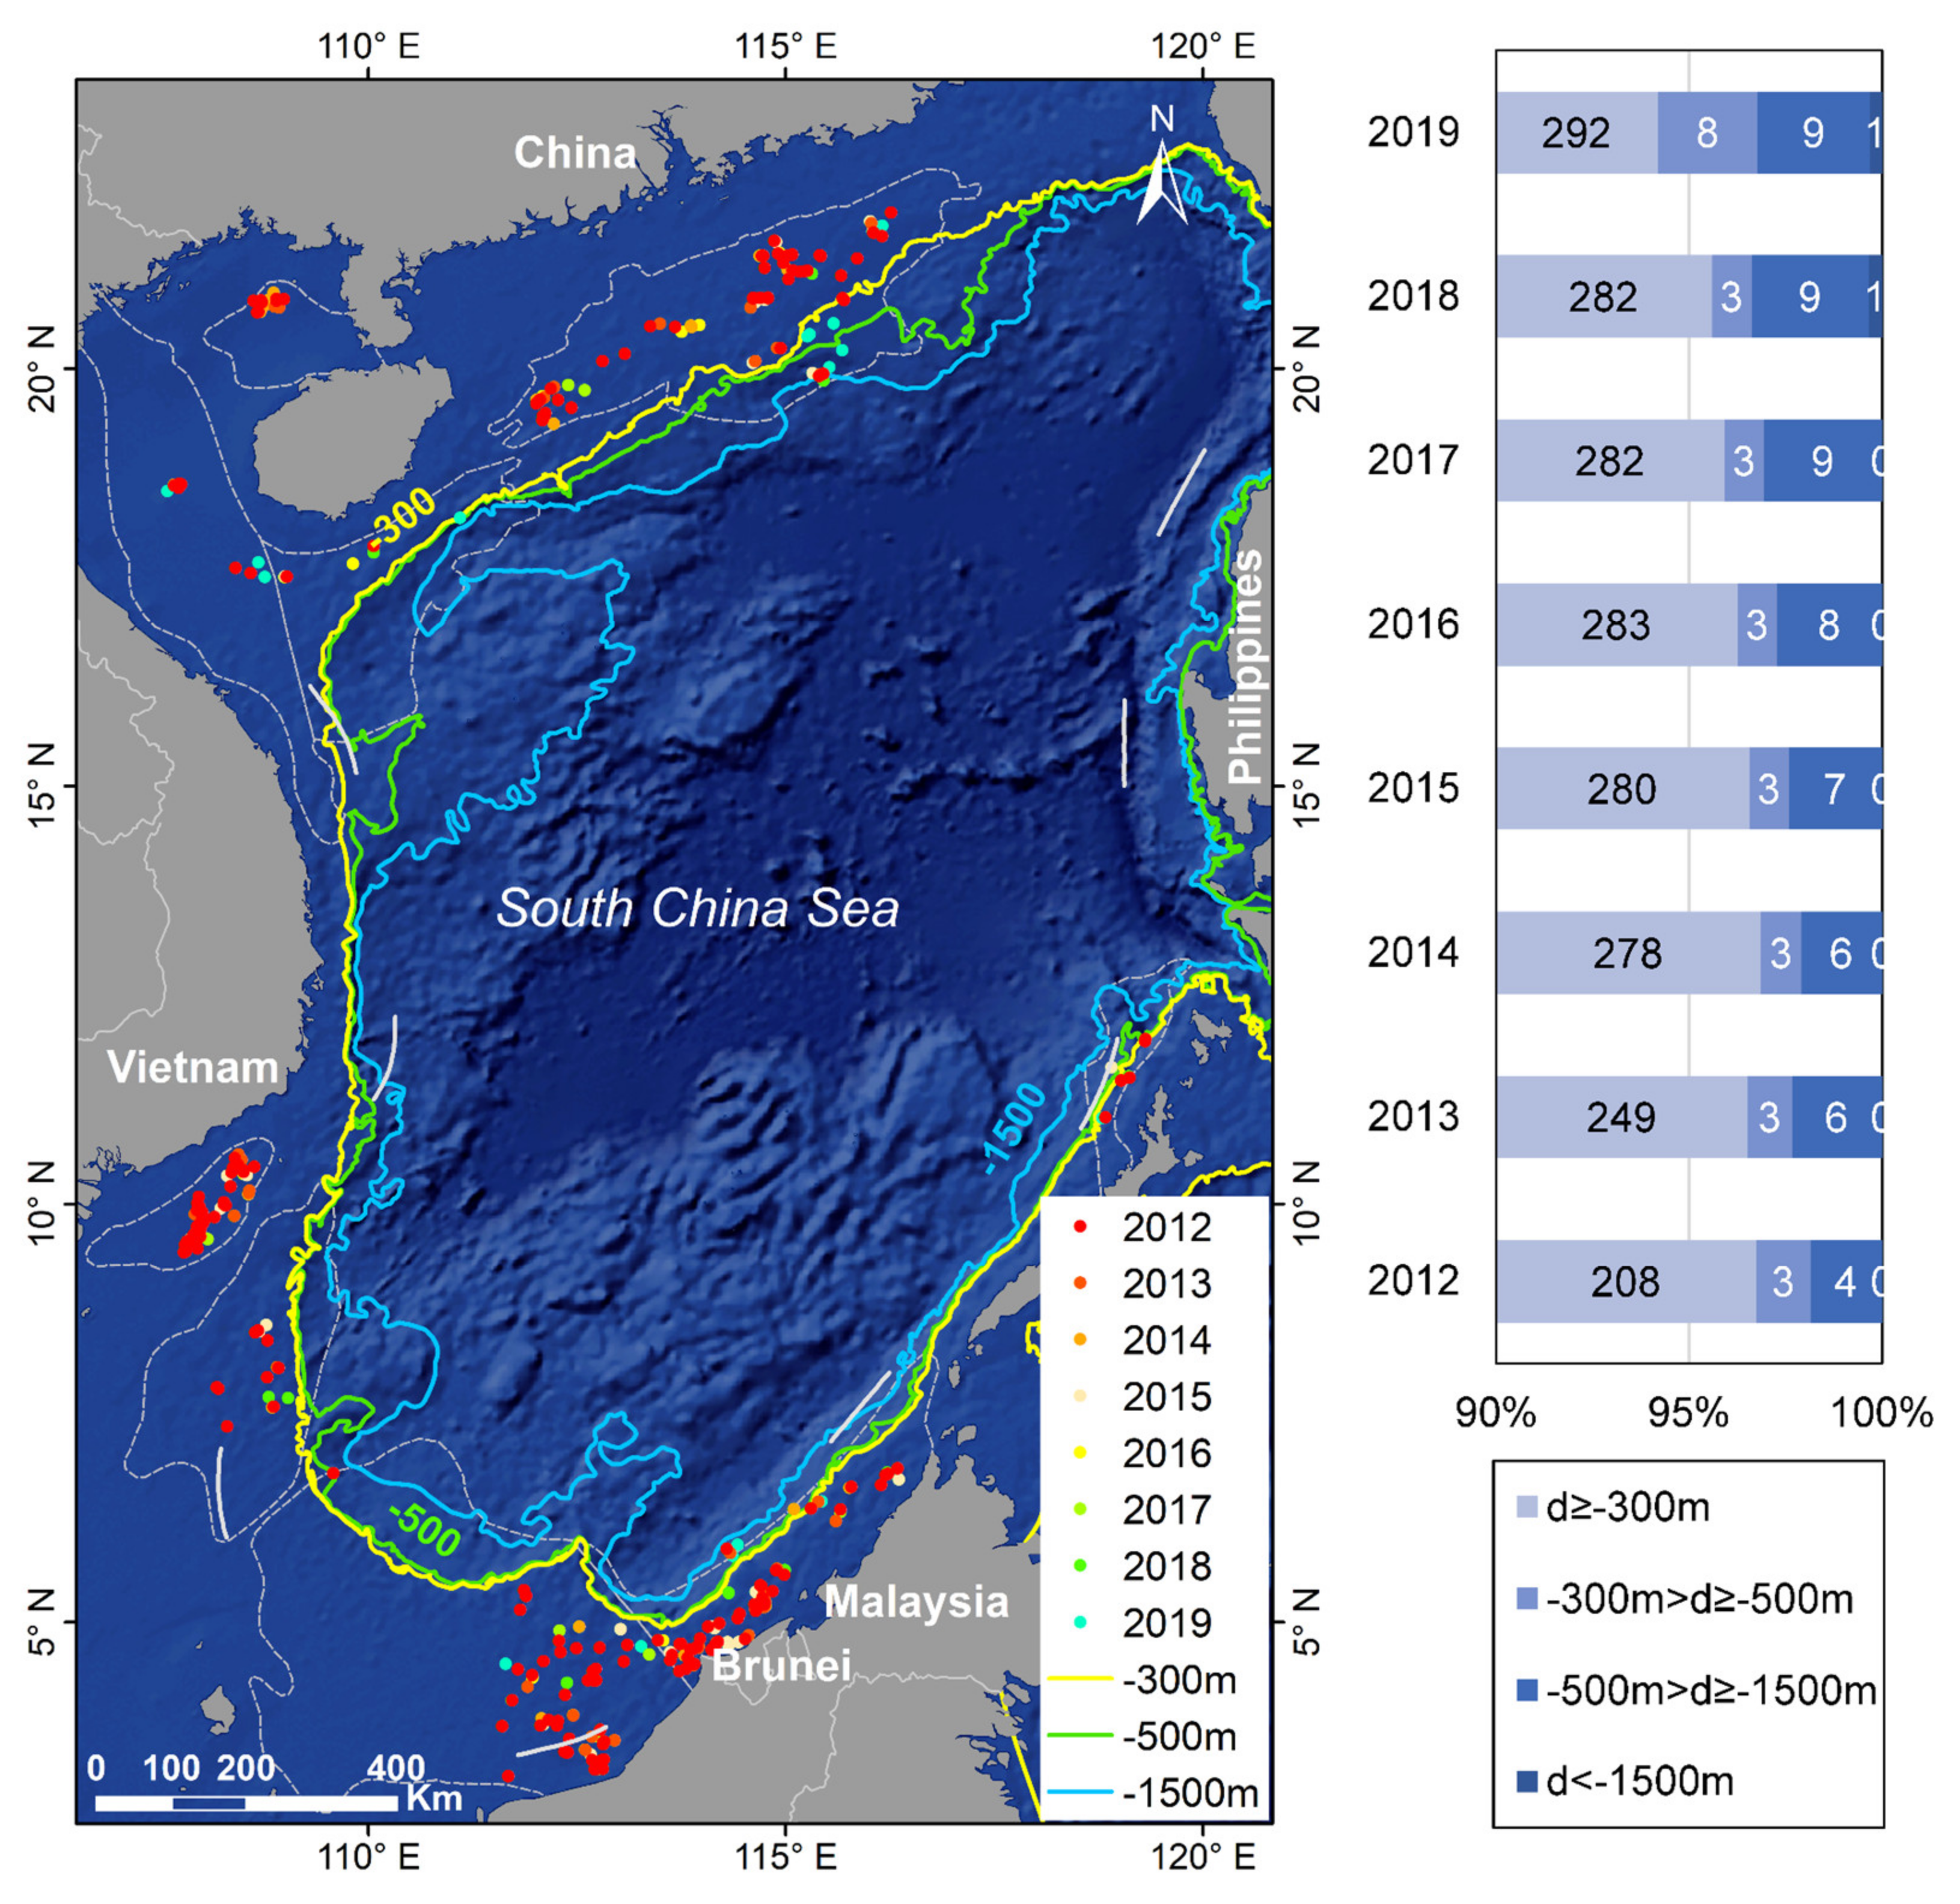
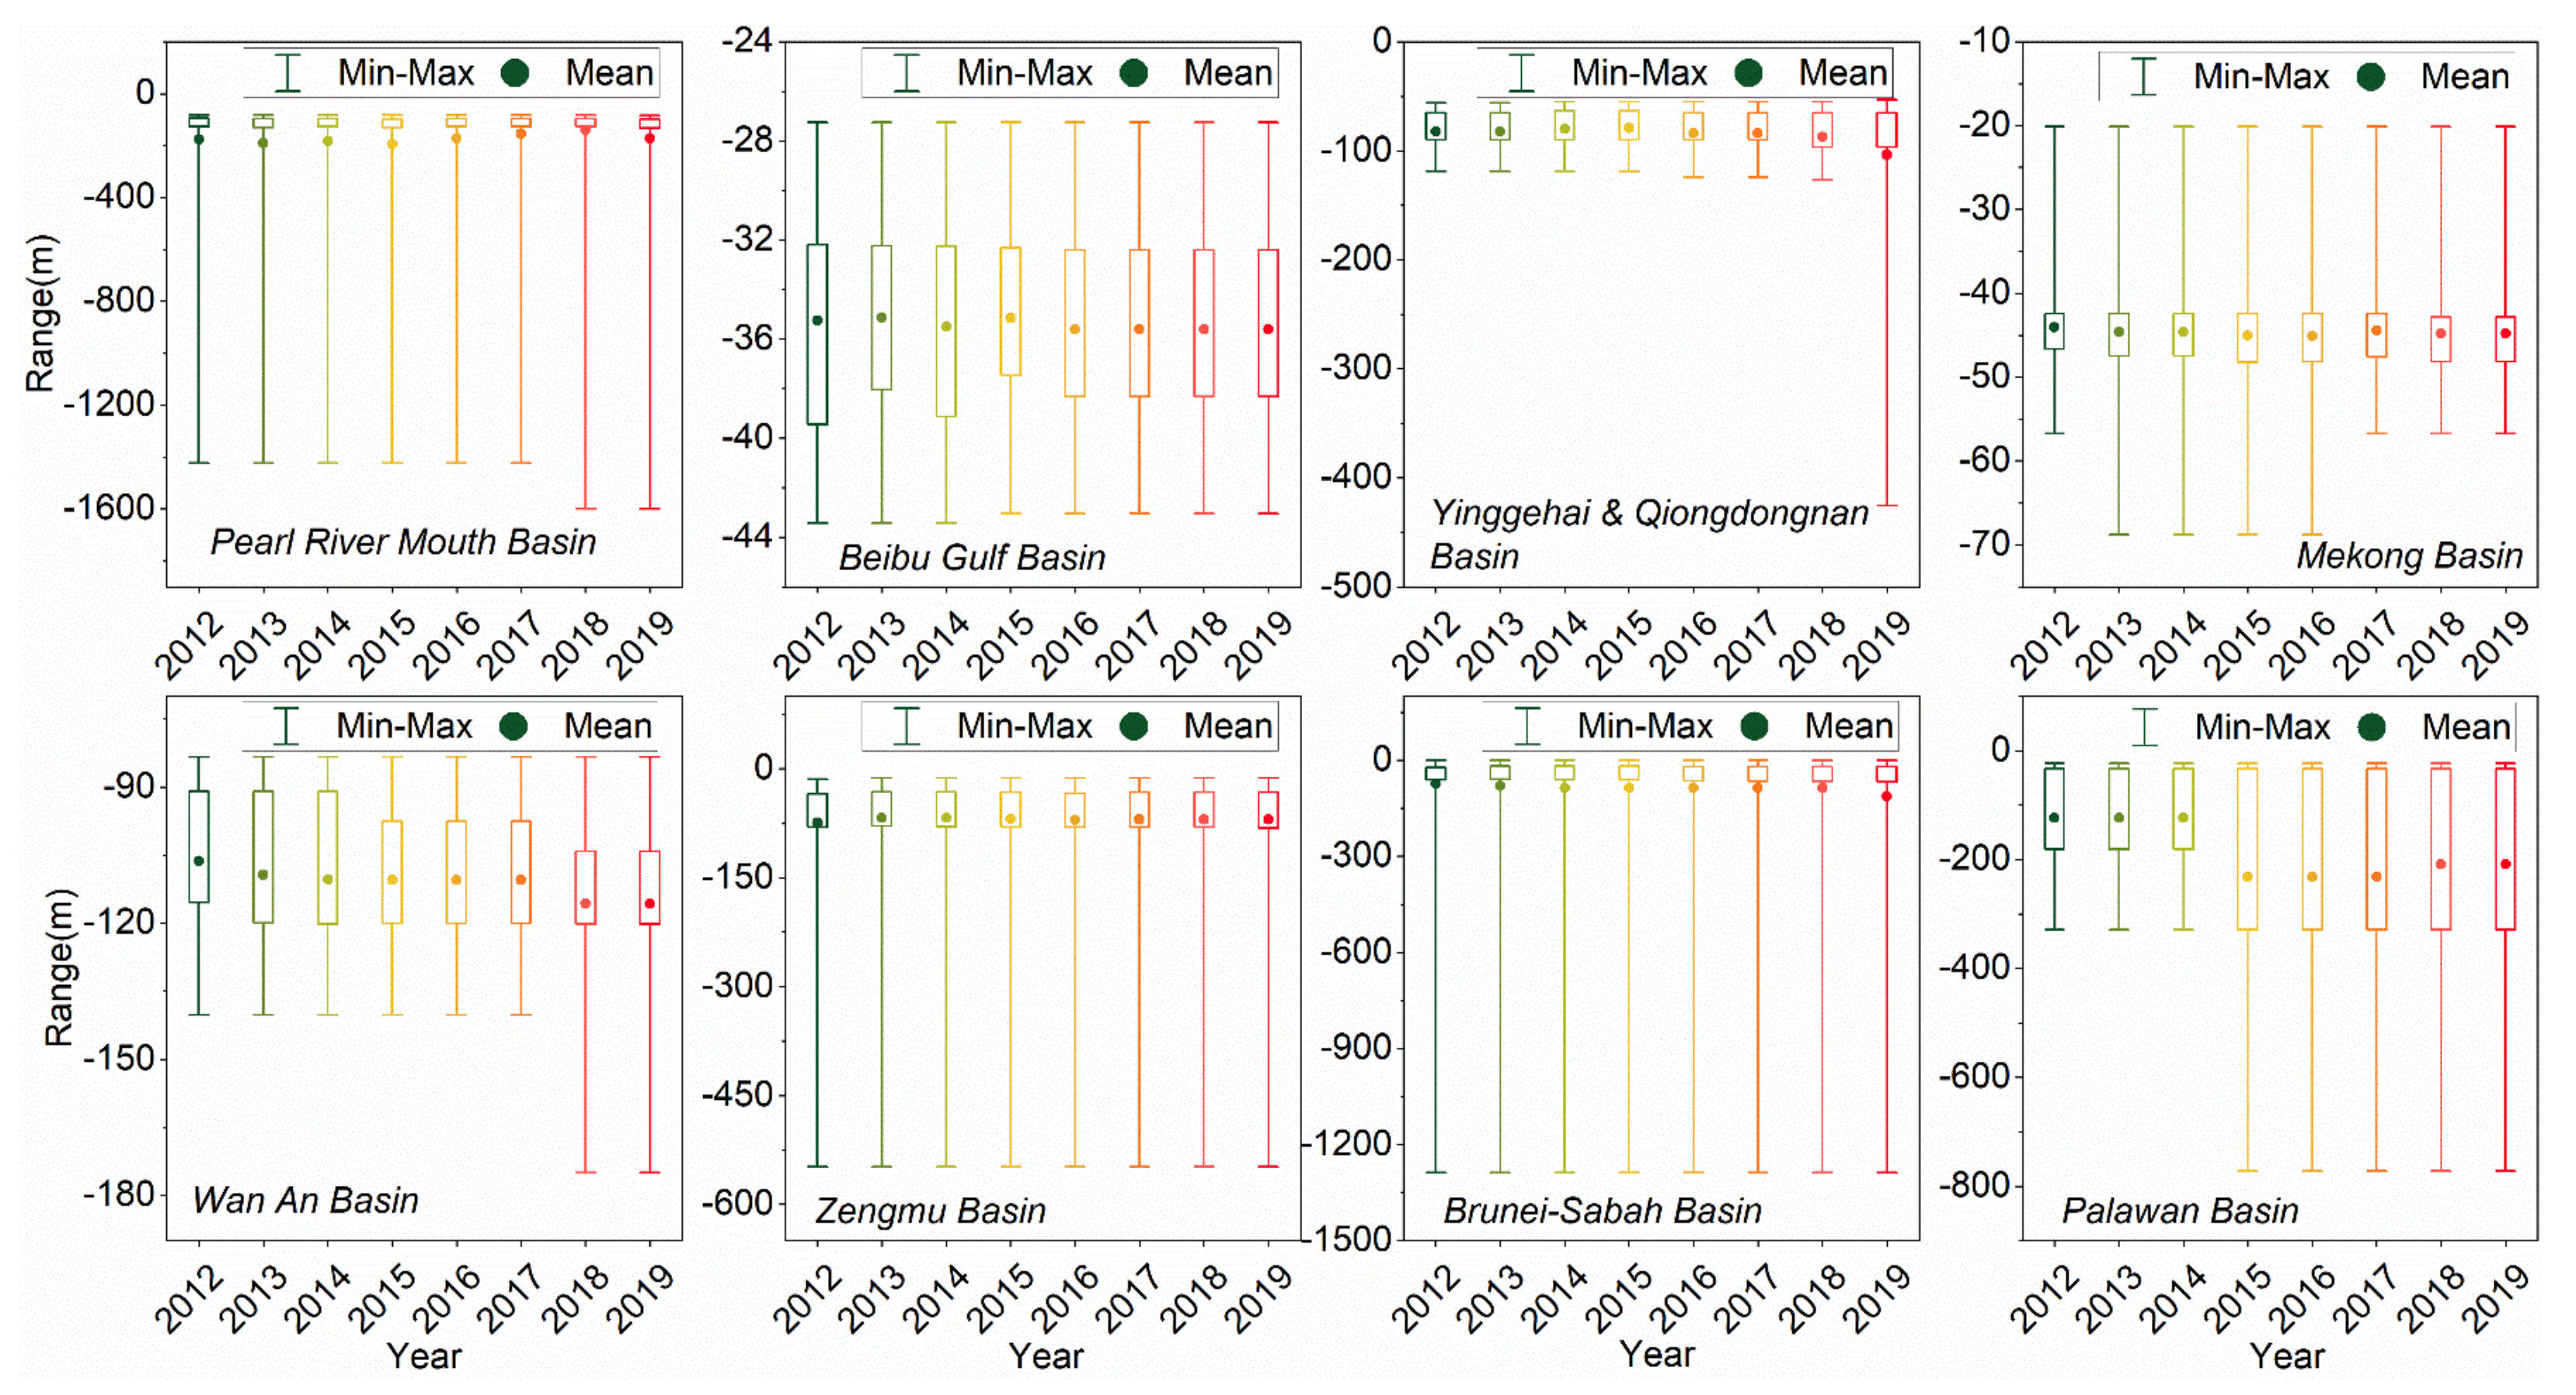
4.5. Development Trends in the Depth of Offshore HE from 2012 to 2019
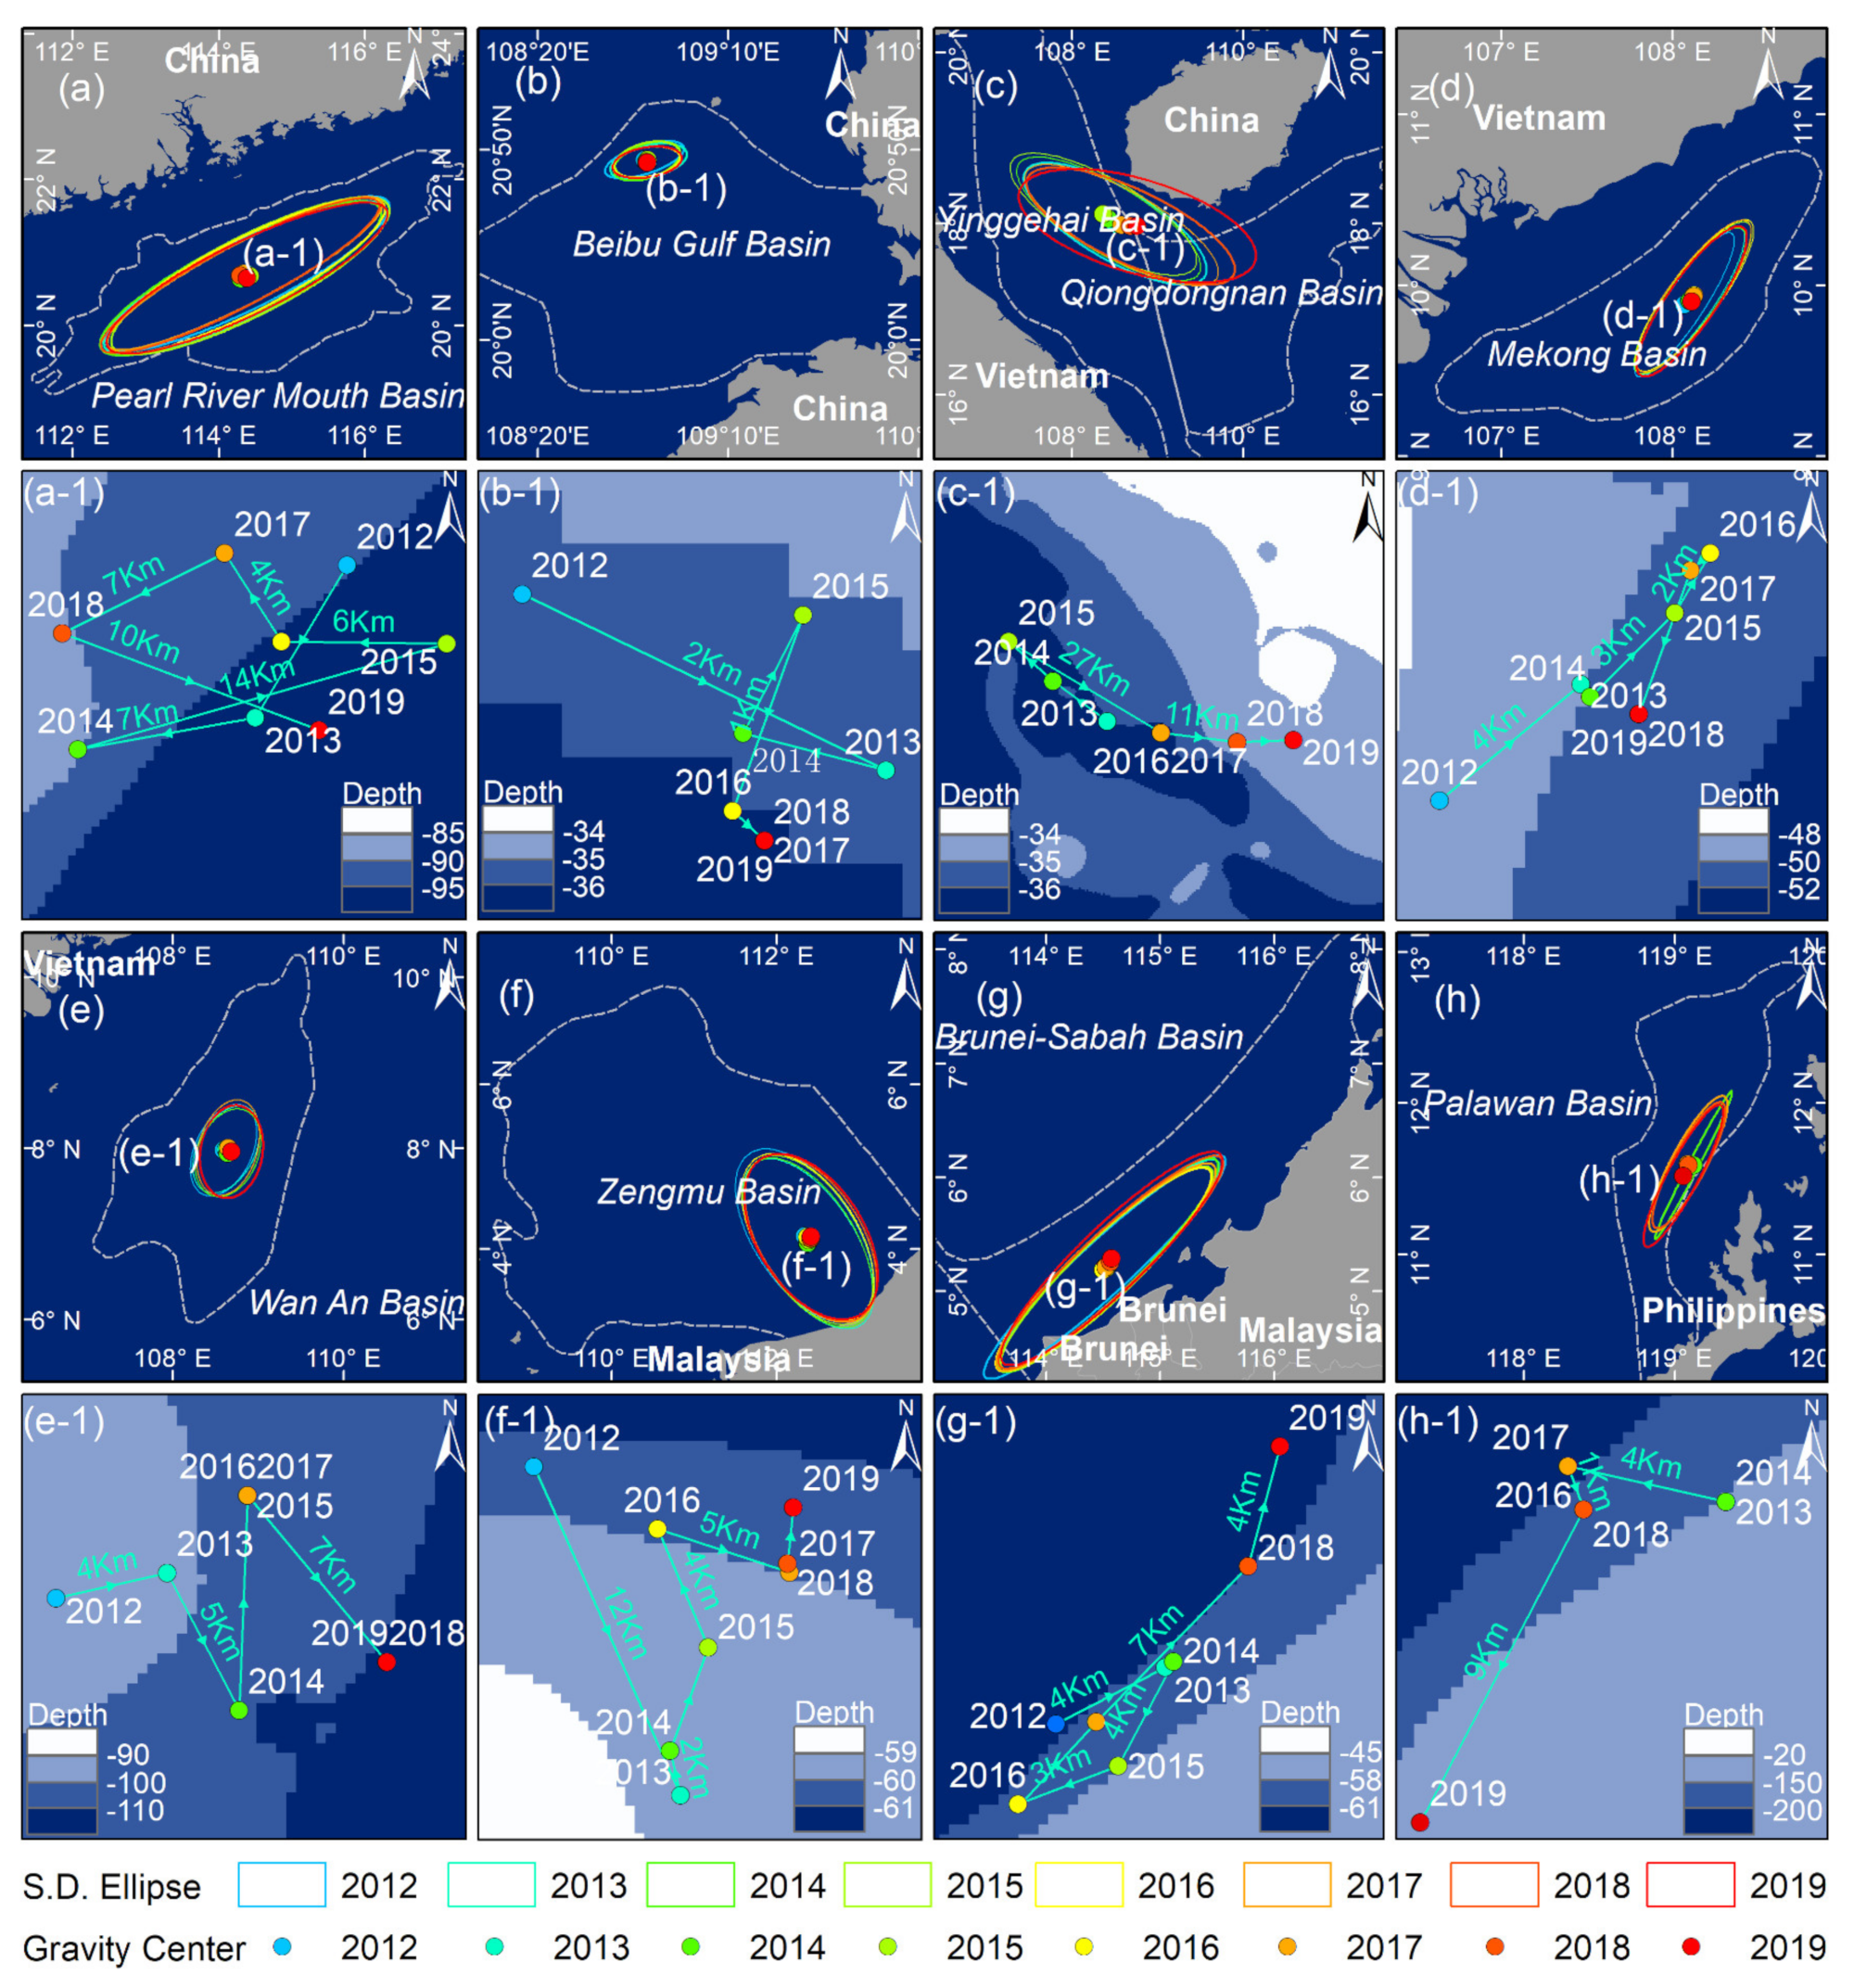
4.6. Gravity Center Shift of Offshore HE Targets Distrbution from 2012 to 2019
5. Discussion
6. Conclusions
Author Contributions
Funding
Data Availability Statement
Acknowledgments
Conflicts of Interest
References
- Sandrea, I.; Sandrea, R. Growth expected in global offshore crude oil supply. Oil Gas J. 2007, 105, 34–36, 38. [Google Scholar] [CrossRef]
- Pinder, D. Offshore oil and gas: Global resource knowledge and technological change. Ocean Coast. Manag. 2001, 44, 579–600. [Google Scholar] [CrossRef]
- EIA. Offshore Production Nearly 30% of Global Crude Oil Output in 2015. Available online: https://www.eia.gov/todayinenergy/detail.php?id=28492 (accessed on 25 October 2016).
- Sun, C.; Liu, Y.X.; Zhao, S.S.; Jin, S. Estimating offshore oil production using DMSP-OLS annual composites. Isprs J. Photogramm. Remote Sens. 2020, 165, 152–171. [Google Scholar] [CrossRef]
- Liu, Y.; Hu, C.; Sun, C.; Zhan, W.; Sun, S.; Xu, B.; Dong, Y. Assessment of offshore oil/gas platform status in the northern Gulf of Mexico using multi-source satellite time-series images. Remote Sens. Environ. 2018, 208, 63–81. [Google Scholar] [CrossRef]
- Liu, Y.; Sun, C.; Yang, Y.; Zhou, M.; Zhan, W.; Cheng, W. Automatic extraction of offshore platforms using time-series Landsat-8 Operational Land Imager data. Remote Sens. Environ. 2016, 175, 73–91. [Google Scholar] [CrossRef]
- Claisse, J.T.; Pondella, D.J., II; Love, M.; Zahn, L.A.; Williams, C.M.; Williams, J.P.; Bull, A.S. Oil platforms off California are among the most productive marine fish habitats globally. Proc. Natl. Acad. Sci. USA 2014, 111, 15462–15467. [Google Scholar] [CrossRef] [Green Version]
- Robinson, D.P.; Jaidah, M.Y.; Jabado, R.W.; Lee-Brooks, K.; El-Din, N.M.N.; Malki, A.A.A.; Elmeer, K.; McCormick, P.A.; Henderson, A.C.; Pierce, S.J.; et al. Whale Sharks, Rhincodon typus, Aggregate around Offshore Platforms in Qatari Waters of the Arabian Gulf to Feed on Fish Spawn. PLoS ONE 2013, 8, e58255. [Google Scholar] [CrossRef] [PubMed] [Green Version]
- Burke, C.M.; Montevecchi, W.A.; Wiese, F.K. Inadequate environmental monitoring around offshore oil and gas platforms on the Grand Bank of Eastern Canada: Are risks to marine birds known? J. Environ. Manag. 2012, 104, 121–126. [Google Scholar] [CrossRef]
- Terlizzi, A.; Bevilacqua, S.; Scuderi, D.; Fiorentino, D.; Guarnieri, G.; Giangrande, A.; Licciano, M.; Felline, S.; Fraschetti, S. Effects of offshore platforms on soft-bottom macro-benthic assemblages: A case study in a Mediterranean gas field. Mar. Pollut. Bull. 2008, 56, 1303–1309. [Google Scholar] [CrossRef] [PubMed]
- Lu, W.Y.; Liu, Y.X.; Wang, J.Z.; Xu, W.X.; Wu, W.; Liu, Y.C.; Zhao, B.X.; Li, H.T.; Li, P. Global proliferation of offshore gas flaring areas. J. Maps 2020, 16, 396–404. [Google Scholar] [CrossRef]
- Nara, H.; Tanimoto, H.; Tohjima, Y.; Mukai, H.; Nojiri, Y.; Machida, T. Emissions of methane from offshore oil and gas platforms in Southeast Asia. Sci. Rep. 2014, 4, 6503. [Google Scholar] [CrossRef] [PubMed] [Green Version]
- Fingas, M.; Brown, C. Review of oil spill remote sensing. Mar. Pollut. Bull. 2014, 83, 9–23. [Google Scholar] [CrossRef] [Green Version]
- Leifer, I.; Lehr, W.J.; Simecek-Beatty, D.; Bradley, E.; Clark, R.; Dennison, P.; Hu, Y.; Matheson, S.; Jones, C.E.; Holt, B.; et al. State of the art satellite and airborne marine oil spill remote sensing: Application to the BP Deepwater Horizon oil spill. Remote Sens. Environ. 2012, 124, 185–209. [Google Scholar] [CrossRef] [Green Version]
- Elvidge, C.D.; Ziskin, D.; Baugh, K.E.; Tuttle, B.T.; Ghosh, T.; Pack, D.W.; Erwin, E.H.; Zhizhin, M. A Fifteen Year Record of Global Natural Gas Flaring Derived from Satellite Data. Energies 2009, 2, 595–622. [Google Scholar] [CrossRef]
- Smyth, K.; Christie, N.; Burdon, D.; Atkins, J.P.; Barnes, R.; Elliott, M. Renewables-to-reefs?—Decommissioning options for the offshore wind power industry. Mar. Pollut. Bull. 2015, 90, 247–258. [Google Scholar] [CrossRef] [PubMed]
- Wang, J.; Li, M.; Liu, Y.; Zhang, H.; Zou, W.; Cheng, L. Safety assessment of shipping routes in the South China Sea based on the fuzzy analytic hierarchy process. Saf. Sci. 2014, 62, 46–57. [Google Scholar] [CrossRef]
- Do, Q.-T.; Shapiro, J.N.; Elvidge, C.D.; Abdel-Jelil, M.; Ahn, D.P.; Baugh, K.; Hansen-Lewis, J.; Zhizhin, M.; Bazilian, M.D. Terrorism, geopolitics, and oil security: Using remote sensing to estimate oil production of the Islamic State. Energy Res. Soc. Sci. 2018, 44, 411–418. [Google Scholar] [CrossRef] [PubMed] [Green Version]
- Liu, Y.; Sun, C.; Sun, J.; Li, H.; Zhan, W.; Yang, Y.; Zhang, S. Satellite data lift the veil on offshore platforms in the South China Sea. Sci. Rep. 2016, 6, 33623. [Google Scholar] [CrossRef] [PubMed] [Green Version]
- Nyman, E. Offshore oil development and maritime conflict in the 20th century: A statistical analysis of international trends. Energy Res. Soc. Sci. 2015, 6, 1–7. [Google Scholar] [CrossRef]
- EIA. South China Sea Analysis Brief. Available online: https://www.eia.gov/international/analysis/regions-of-interest/South_China_Sea (accessed on 7 February 2013).
- Jie, C.; Ning, W.; Xuejie, L.I. The status of the resource potential and petroleum exploration of The South China Sea. Prog. Geophys. 2007, 22, 1285–1294. [Google Scholar] [CrossRef]
- Elvidge, C.D.; Zhizhin, M.; Baugh, K.; Hsu, F.-C.; Ghosh, T. Methods for Global Survey of Natural Gas Flaring from Visible Infrared Imaging Radiometer Suite Data. Energies 2015, 9, 14. [Google Scholar] [CrossRef]
- Zhang, J.; Wang, Q.; Su, F. Automatic Extraction of Offshore Platforms in Single SAR Images Based on a Dual-Step-Modified Model. Sensors 2019, 19, 231. [Google Scholar] [CrossRef] [PubMed] [Green Version]
- Wong, B.A.; Thomas, C.; Halpin, P. Automating offshore infrastructure extractions using synthetic aperture radar & Google Earth Engine. Remote Sens. Environ. 2019, 233, 111412. [Google Scholar] [CrossRef]
- Wang, Q.; Zhang, J.; Su, F. Offshore Platform Extraction Using RadarSat-2 SAR Imagery: A Two-Parameter CFAR Method Based on Maximum Entropy. Entropy 2019, 21, 556. [Google Scholar] [CrossRef] [PubMed] [Green Version]
- Xu, W.; Liu, Y.; Wu, W.; Dong, Y.; Lu, W.; Liu, Y.; Zhao, B.; Li, H.; Yang, R. Proliferation of offshore wind farms in the North Sea and surrounding waters revealed by satellite image time series. Renew. Sustain. Energy Rev. 2020, 133, 110167. [Google Scholar] [CrossRef]
- Cheng, L.; Yang, K.; Tong, L.; Liu, Y.; Li, M. Invariant triangle-based stationary oil platform detection from multitemporal synthetic aperture radar data. J. Appl. Remote Sens. 2013, 7, 302–309. [Google Scholar] [CrossRef]
- Casadio, S.; Arino, O.; Minchella, A. Use of ATSR and SAR measurements for the monitoring and characterisation of night-time gas flaring from off-shore platforms: The North Sea test case. Remote Sens. Environ. 2012, 123, 175–186. [Google Scholar] [CrossRef]
- Liu, Y.; Hu, C.; Dong, Y.; Xu, B.; Zhan, W.; Sun, C. Geometric accuracy of remote sensing images over oceans: The use of global offshore platforms. Remote Sens. Environ. 2019, 222, 244–266. [Google Scholar] [CrossRef]
- Xing, Q.; Meng, R.; Lou, M.; Bing, L.; Liu, X. Remote Sensing of Ships and Offshore Oil Platforms and Mapping the Marine Oil Spill Risk Source in the Bohai Sea. Aquat. Procedia 2015, 3, 127–132. [Google Scholar] [CrossRef]
- Anejionu, O.C.D.; Blackburn, G.A.; Whyatt, J.D. Detecting gas flares and estimating flaring volumes at individual flow stations using MODIS data. Remote Sens. Environ. 2015, 158, 81–94. [Google Scholar] [CrossRef] [Green Version]
- Oliva, P.; Schroeder, W. Assessment of VIIRS 375 m active fire detection product for direct burned area mapping. Remote Sens. Environ. 2015, 160, 144–155. [Google Scholar] [CrossRef]
- Elvidge, D.C.; Zhizhin, M.; Hsu, F.-C.; Baugh, E.K. Rapid Fire Detection, Characterization and Reporting from VIIRS Data. In Time-Sensitive Remote Sensing; Lippitt, D.C., Stow, A.D., Coulter, L.L., Eds.; Springer: New York, NY, USA, 2015; pp. 45–53. [Google Scholar] [CrossRef]
- Csiszar, I.; Schroeder, W.; Giglio, L.; Ellicott, E.; Vadrevu, K.P.; Justice, C.O.; Wind, B. Active fires from the Suomi NPP Visible Infrared Imaging Radiometer Suite: Product status and first evaluation results. J. Geophys. Res. Atmos. 2014, 119, 803–816. [Google Scholar] [CrossRef]
- Casadio, S.; Arino, O.; Serpe, D. Gas flaring monitoring from space using the ATSR instrument series. Remote Sens. Environ. 2012, 116, 239–249. [Google Scholar] [CrossRef]
- Elvidge, C.D.; Zhizhin, M.; Hsu, F.-C.; Baugh, K.E. VIIRS nightfire: Satellite pyrometry at night. Remote Sens. 2013, 5, 4423–4449. [Google Scholar] [CrossRef] [Green Version]
- Zhao, H.; Qiu, W.T.; Qu, W.L. Countermeasure Study on Deep-sea Oil Exploitation in the South China Sea-A Comparison between Deep-sea Oil Exploitation in the South China Sea and the Gulf of Mexico. In Proceedings of the 3rd International Conference on Advances in Energy Resources and Environment Engineering; IOP Publishing: Bristol, UK, 2018; Volume 113. [Google Scholar]
- Team, C.P. How Much Trade Transits the South China Sea? Available online: https://chinapower.csis.org/much-trade-transits-south-china-sea/ (accessed on 13 December 2020).
- Elvidge, C.D.; Zhizhin, M.; Baugh, K.; Hsu, F.-C. Automatic boat identification system for VIIRS low light imaging data. Remote Sens. 2015, 7, 3020–3036. [Google Scholar] [CrossRef] [Green Version]
- Lee, J.S.; Lee, J.S.; Wen, J.H.; Ainsworth, T.L.; Chen, K.S.; Chen, A.J. Improved Sigma Filter for Speckle Filtering of SAR Imagery. Ieee Trans. Geosci. Remote Sens. 2009, 47, 202–213. [Google Scholar] [CrossRef]
- Yu, X.; Hyyppä, J.; Vastaranta, M.; Holopainen, M.; Viitala, R. Predicting individual tree attributes from airborne laser point clouds based on the random forests technique. Isprs J. Photogramm. Remote Sens. 2011, 66, 28–37. [Google Scholar] [CrossRef]
- Gislason, P.O.; Benediktsson, J.A.; Sveinsson, J.R. Random Forests for land cover classification. Pattern Recognit. Lett. 2006, 27, 294–300. [Google Scholar] [CrossRef]
- Yue, D.; Weiguo, J.; Zhenghong, T.; Jiahong, L.; Jinxia, L.; Zheng, C.; Kai, J. Spatio-Temporal Change of Lake Water Extent in Wuhan Urban Agglomeration Based on Landsat Images from 1987 to 2015. Remote Sens. 2017, 9, 270. [Google Scholar] [CrossRef] [Green Version]
- Tulbure, M.G.; Broich, M.; Stehman, S.V.; Kommareddy, A. Surface water extent dynamics from three decades of seasonally continuous Landsat time series at subcontinental scale in a semi-arid region. Remote Sens. Environ. 2016, 178, 142–157. [Google Scholar] [CrossRef]
- Gabrielsen, C.G.; Murphy, M.A.; Evans, J.S. Using a multiscale, probabilistic approach to identify spatial-temporal wetland gradients. Remote Sens. Environ. 2016, 184, 522–538. [Google Scholar] [CrossRef]
- Li, X.; Gong, P.; Liang, L. A 30-year (1984–2013) record of annual urban dynamics of Beijing City derived from Landsat data. Remote Sens. Environ. 2015, 166, 78–90. [Google Scholar] [CrossRef]
- Wang, B.; Li, C.; Pavlu, V.; Aslam, J. A Pipeline for Optimizing F1-Measure in Multi-label Text Classification. In Proceedings of the 2018 17th IEEE International Conference on Machine Learning and Applications (ICMLA), Orlando, FL, USA, 17–20 December 2018; pp. 913–918. [Google Scholar] [CrossRef]
- Sammut, C.; Webb, G.I. F1-Measure. In Encyclopedia of Machine Learning and Data Mining; Sammut, C., Webb, G.I., Eds.; Springer: Boston, MA, USA, 2017; p. 497. [Google Scholar] [CrossRef]
- Leon, D. Complementarity, F-score, and NLP Evaluation. In Proceedings of the Tenth International Conference on Language Resources and Evaluation (LREC’16), Portorož, Slovenia, 23–28 May 2016; pp. 261–266. [Google Scholar]
- EIA. VIETNAM. Available online: https://www.eia.gov/international/analysis/country/VNM (accessed on 7 February 2020).
- Elvidge, C.D.; Baugh, K.; Zhizhin, M.; Hsu, F.C.; Ghosh, T. VIIRS night-time lights. Int. J. Remote Sens. 2017, 38, 5860–5879. [Google Scholar] [CrossRef]
- Franklin, M.; Chau, K.; Cushing, L.J.; Johnston, J.E. Characterizing Flaring from Unconventional Oil and Gas Operations in South Texas Using Satellite Observations. Environ. Sci. Technol. 2019, 53, 2220–2228. [Google Scholar] [CrossRef] [PubMed]


| Verification Region | Year | TAsr 1 | TP | FN | FP | P | R | F1 |
|---|---|---|---|---|---|---|---|---|
| Region 1 | 2013 | 32 | 30 | 2 | 1 | 96.77% | 93.75% | 95.24% |
| 2015 | 39 | 37 | 2 | 2 | 94.87% | 94.87% | 94.87% | |
| 2017 | 39 | 37 | 2 | 1 | 97.37% | 94.87% | 94.11% | |
| Region 2 | 2013 | 20 | 18 | 2 | 0 | 100.00% | 90.00% | 94.73% |
| 2015 | 20 | 19 | 1 | 2 | 90.48% | 95.00% | 92.69% | |
| 2017 | 21 | 19 | 2 | 0 | 100.00% | 90.48% | 95.00% | |
| Average | 96.58% | 93.16% | 94.44% |
| Basins | 2012 | 2013 | 2014 | 2015 | 2016 | 2017 | 2018 | 2019 |
|---|---|---|---|---|---|---|---|---|
| Pearl River Mouth Basin | 46 | 54 | 61 | 65 | 68 | 66 | 68 | 72 |
| Beibu Gulf Basin | 10 | 12 | 18 | 16 | 15 | 14 | 14 | 14 |
| Yinggehai & Qiongdongnan Basin | 10 | 10 | 11 | 10 | 13 | 13 | 14 | 18 |
| Me Kong Basin | 49 | 58 | 61 | 60 | 58 | 57 | 50 | 50 |
| Wan An Basin | 9 | 10 | 11 | 12 | 12 | 12 | 14 | 14 |
| Zengmu Basin | 41 | 49 | 51 | 51 | 50 | 54 | 55 | 57 |
| Brunei-Sabah Basin | 45 | 60 | 69 | 70 | 72 | 72 | 73 | 77 |
| Palawan Basin | 5 | 5 | 5 | 6 | 6 | 6 | 7 | 8 |
| Total | 215 | 258 | 287 | 290 | 294 | 294 | 295 | 310 |
Publisher’s Note: MDPI stays neutral with regard to jurisdictional claims in published maps and institutional affiliations. |
© 2021 by the authors. Licensee MDPI, Basel, Switzerland. This article is an open access article distributed under the terms and conditions of the Creative Commons Attribution (CC BY) license (http://creativecommons.org/licenses/by/4.0/).
Share and Cite
Wang, Q.; Wu, W.; Su, F.; Xiao, H.; Wu, Y.; Yao, G. Offshore Hydrocarbon Exploitation Observations from VIIRS NTL Images: Analyzing the Intensity Changes and Development Trends in the South China Sea from 2012 to 2019. Remote Sens. 2021, 13, 946. https://0-doi-org.brum.beds.ac.uk/10.3390/rs13050946
Wang Q, Wu W, Su F, Xiao H, Wu Y, Yao G. Offshore Hydrocarbon Exploitation Observations from VIIRS NTL Images: Analyzing the Intensity Changes and Development Trends in the South China Sea from 2012 to 2019. Remote Sensing. 2021; 13(5):946. https://0-doi-org.brum.beds.ac.uk/10.3390/rs13050946
Chicago/Turabian StyleWang, Qi, Wenzhou Wu, Fenzhen Su, Han Xiao, Yutong Wu, and Guobiao Yao. 2021. "Offshore Hydrocarbon Exploitation Observations from VIIRS NTL Images: Analyzing the Intensity Changes and Development Trends in the South China Sea from 2012 to 2019" Remote Sensing 13, no. 5: 946. https://0-doi-org.brum.beds.ac.uk/10.3390/rs13050946