Article

Yield Prediction in Soybean Crop Grown under Different Levels of Water Availability Using Reflectance Spectroscopy and Partial Least Squares Regression

by
Luís Guilherme Teixeira Crusiol
1,2,
Marcos Rafael Nanni
2,
Renato Herrig Furlanetto
2,
Rubson Natal Ribeiro Sibaldelli
3,
Everson Cezar
2,
Liang Sun
1,*,
José Salvador Simonetto Foloni
4,
Liliane Marcia Mertz-Henning
4,
Alexandre Lima Nepomuceno
4,
Norman Neumaier
4 and
José Renato Bouças Farias
4
1
Key Laboratory of Agricultural Remote Sensing, Ministry of Agriculture/CAAS-CIAT Joint Laboratory in Advanced Technologies for Sustainable Agriculture—Institute of Agricultural Resources and Regional Planning, Chinese Academy of Agricultural Sciences, Beijing 100081, China
2
Department of Agronomy, State University of Maringá, Maringá, PR 87020-900, Brazil
3
Mathematician, Statistical Specialist, Londrina, PR 86001-970, Brazil
4
Embrapa Soja (National Soybean Research Center—Brazilian Agricultural Research Corporation), Londrina, PR 86001-970, Brazil
*
Author to whom correspondence should be addressed.
Submission received: 3 February 2021 / Revised: 25 February 2021 / Accepted: 28 February 2021 / Published: 4 March 2021
(This article belongs to the Special Issue Spectroscopic Analysis of Plants and Vegetation)

Abstract

:
Soybean grain yield has regularly been impaired by drought periods, and the future climatic scenarios for soybean production might drastically impact yields worldwide. In this context, the knowledge of soybean yield is extremely important to subsidize government and corporative decisions over technical issues. This paper aimed to predict grain yield in soybean crop grown under different levels of water availability using reflectance spectroscopy and partial least square regression (PLSR). Field experiments were undertaken at Embrapa Soja (Brazilian Agricultural Research Corporation) in the 2016/2017, 2017/2018 and 2018/2019 cropping seasons. The data collected were analyzed following a split plot model in a randomized complete block design, with four blocks. The following water conditions were distributed in the field plots: irrigated (IRR), non-irrigated (NIRR) and water deficit induced at the vegetative (WDV) and reproductive stages (WDR) using rainout shelters. Soybean genotypes with different responses to water deficit were distributed in the subplots. Soil moisture and weather data were monitored daily. A total of 7216 leaf reflectance (from 400 to 2500 nm, measured by the FieldSpec 3 Jr spectroradiometer) was collected at 24 days in the three cropping seasons. The PLSR (p ≤ 0.05) was performed to predict soybean grain yield by its leaf-based reflectance spectroscopy. The results demonstrated the highest accuracy in soybean grain yield prediction at the R5 phenological stage, corresponding to the period when grains are being formed (R2 ranging from 0.731 to 0.924 and the RMSE from 334 to 403 kg ha−1—7.77 to 11.33%). Analyzing the three cropping seasons into a single PLSR model at R5 stage, R2 equal to 0.775, 0.730 and 0.688 were obtained at the calibration, cross-validation and external validation stages, with RMSE lower than 634 kg ha−1 (13.34%). The PLSR demonstrated higher accuracy in plants submitted to water deficit both at the vegetative and reproductive periods in comparison to plants under natural rainfall or irrigation.

Graphical Abstract

1. Introduction

Brazil is responsible for over one third (124 million tons) of soybean produced worldwide (341 million tons) and plays an important role in the world’s food production and financial market [1,2]. Although expressive yields are often obtained, Brazilian soybean crop production is regularly impaired by drought periods. Battisti et al. [3] demonstrated the influence of water availability on soybean yield in different fields in Brazil. According to Sentelhas et al. [4], drought periods have impaired around 30% of the Brazilian soybean production, which led to financial losses of over USD 79 billion in 38 years [5]. Furthermore, the future climatic scenarios for soybean production might drastically impact yields worldwide [6].
In this context, the understanding of soybean production areas and their development conditions is extremely important to subsidize government and corporative decisions over technical issues, which directly affect supply regulation, food security, financial market and strategical planning in relation to social, environmental and economic policies [7,8,9,10]. Hence, a rising need for precise methods capable of predicting soybean yield prior to the harvesting period has been observed, assisting better management of agronomic, logistic and economic practices.
Soybean grain yield prediction has been successfully addressed by several researches at orbital and aerial (UAV-based) levels of data acquisition [11,12,13,14,15,16]. However, according to Sakamoto [13], most of yield prediction models are based on the direct relation between biomass and vegetation indexes and the indirect relation between biomass and yield at specific phenological stage. According to Braga et al. [17], soybean plants submitted to different levels of water availability present different physiological responses, and those physiological responses are differently expressed across the spectrum. Thus, considering that yield is the result of multiple physiological iterations during the cropping season, field-based investigation addressing soybean grain yield prediction via hyperspectral response, studying a larger number of spectral bands at fine spectral resolution, can contribute to better understand, across multiple wavelengths, the relation between reflectance and yield, comprising a larger number of physiological iterations across the spectrum.
Recognized to be a useful method when the number of predictor variables (e.g., wavelengths) is larger than the number of response variables (e.g., grain yield—[18]), partial least squares regression (PLSR) has been successfully applied to yield prediction in several crop types: soybean [19], maize [20,21], winter wheat [22,23], barley [24], oilseeds [25] and grassland [26]. Moreover, Barmeier et al. [24] described the PLSR approach to have stronger predictive capacity of yield compared to vegetation indices in several crop systems. Developed by Wold et al. [27], the PLSR is a multivariate statistical analysis method that combines principal component regression (PCR) and multiple regression, overcoming the multicollinearity among independent variables [28,29].
In Brazil, due to the regular threat of unfavorable weather events, especially drought periods, soybean yield prediction models should comprise the evaluation of plants both under water shortage and under good conditions of water availability, allowing the yield monitoring across cropping seasons with variable weather characteristics.
Based on the current progress, this paper aimed to predict grain yield in soybean crop grown under different levels of water availability using reflectance spectroscopy and partial least squares regression. Our hypothesis is that soybean plants present different spectral responses according to their levels of water availability and that the spectral response might be related to grain yield. Our research question addresses: (1) the detection of the best time across soybean cropping season to predict grain yield; (2) the development of a multi-year prediction model, composed by hyperspectral reflectance collected in multiple cropping seasons; (3) the evaluation of the effect of crop water status on the accuracy of soybean grain yield prediction.

2. Materials and Methods

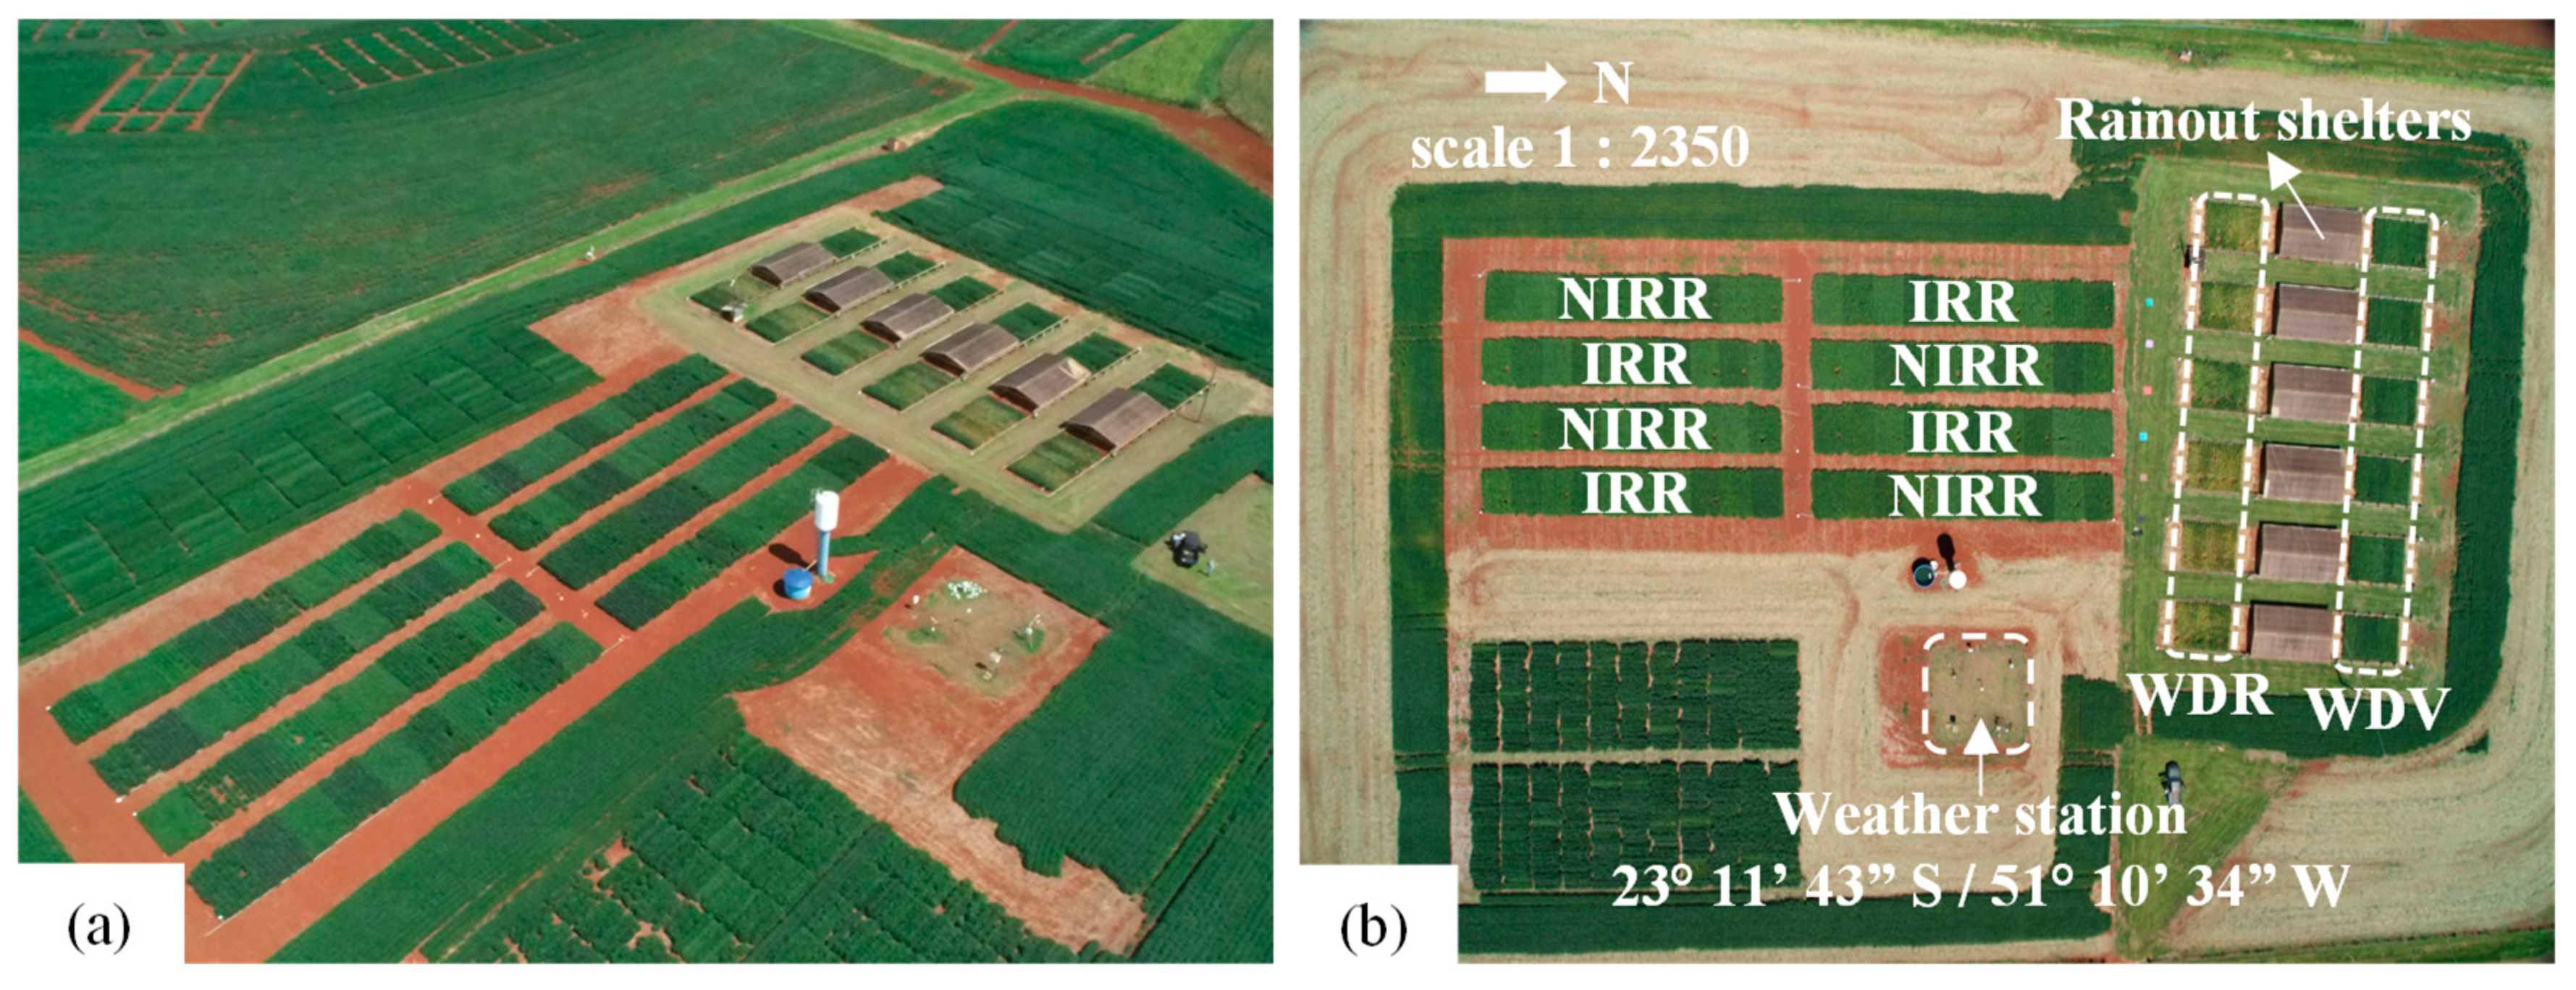
2.1. Experimental Site

The experiment (Figure 1) was undertaken in the experimental farm of the National Soybean Research Center (Embrapa Soja), a branch of the Brazilian Agricultural Research Corporation, located in Londrina Municipality, Paraná State, Southern Brazil (23°11′37″ S, 51°11′03″ W, 630 m above sea level), in the 2016/2017, 2017/2018 and 2018/2019 cropping seasons.
The climate of the experimental site is classified as Cfa climate according to the Köppen climate classification, i.e., subtropical climate, with a mean temperature in the hottest month higher than 22 °C, and rainfall concentrated in the summer months, corresponding to the periods of soybean production, albeit with no defined dry season [30,31]. Although dry season is not observed in the entire soybean crop season, periods of water deficit often cause large yield losses [4].
The soil of the experimental area is characterized as Udox Oxisol [32], with 75 mm of water holding capacity, and the results from soil analysis (March 2016) are presented in Table 1.
The data collected were analyzed following a split plot model in a randomized complete block design, with four blocks and the experimental practices followed soybean production technologies [33]. The following water condition treatments were distributed in the field plots: irrigated (IRR, receiving rainfall and irrigation when necessary, with a soil water matric potential between −0.03 and −0.05 MPa); non-irrigated (NIRR, receiving only rainfall); water deficit induced at the vegetative stages (WDV); water deficit induced at reproductive stages (WDR). Soybean genotypes (commercial cultivars and genotypes with drought tolerance genes), with different response to water deficit, were distributed in the subplots.
WDV and WDR plots were established under rainout shelters to simulate water deficit. Shelters automatically covered the subplots (at the vegetative or reproductive stage) when rainfalls above 0.1 mm were recorded and automatically uncovered plants once rainfalls had ceased. To prevent water lateral movement from outside into the soil, the plots had in their perimeter vertical concrete barriers (buried up to 90 cm depth).
During the period to which WDV plots were deprived of rainfall, WDR was kept under natural conditions of water availability. From the flowering period to the harvesting period, the WDR treatment was deprived of natural rainfall, and in turn, the WDV plots began to be rain watered, simulating, thus, water deficit periods both at the vegetative and reproductive stages of development. Specifically, in the 2018/2019 cropping season, due to the severe natural drought conditions, WDR was only deprived from natural rainfall until 14 January 2019, when plants begun to receive natural rainfall until the harvesting period.
Plots from IRR and NIRR treatments were composed by 10 subplots, and plots from WDV and WDR were composed by 5 subplots. Only genotypes sown in all the four experimental treatments were considered in the analysis. In the 2016/2017 and 2017/2018 cropping seasons, five genotypes (1Ea15, 2Ha11, 2Ia4, BR16 and BRS 184) were sown in all experimental treatments, while in the 2018/2019 cropping season, five different genotypes (1Ea2939, 3Ma2, BRS 283, BRT18-0089 and BRT18-0201) were sown in those plots.
In IRR and NIRR treatments, the subplot dimensions were 4 m width × 5.5 m length composed by eight rows spaced 0.5 m from each other. In WDV and WDR treatments, the subplot dimensions were 1.5 m width × 6 m length composed by three rows spaced 0.5 m from each other. To minimize potential external effects on soybean plants, both extremities from each row (0.5 m) were not considered for data acquisition.
Table 2 displays the sowing dates and periods of inducement of water deficit both at the vegetative and reproductive periods in the three evaluated cropping seasons.
Soil moisture (0–20 and 20–40 cm depths) in IRR plots were daily monitored by tensiometers, contributing to the determination of the amount of irrigation needed to keep the soil water matric potential between −0.03 and −0.05 MPa. Tensiometers are composed by a porous and permeable ceramic tip, placed in contact to the soil, and connected to a vacuum gauge by a tube filled with water. When the water flows from the tube to the soil (since it is not always saturated), a negative pressure is created and can be measured by the vacuum gauge. Tensiometers were installed in each one of the four blocks, and the irrigation schedule performed in the 2016/2017 and 2018/2019 cropping seasons is described in Table 3. In the 2017/2018 cropping season, there was no need for irrigation, and therefore, plants of IRR and NIRR treatments were under the same water availability.
Soil moisture was monitored in all plots by gravimetric analysis at two periods across each cropping season: transition between vegetative and reproductive stages (58 DAS, 57 DAS and 62 DAS in 2016/2017, 2017/2018 and 2018/2019 cropping seasons, respectively) and close to the maturity period (112 DAS, 112 DAS and 2017 DAS in 2016/2017, 2017/2018 and 2018/2019 cropping seasons, respectively).
The growth stages of the soybean plants were weekly monitored from emergence to maturation according to Fehr and Caviness [34].
Recorded by the weather station located within the experimental area, weather data (air temperature, relative air humidity and rainfall) were monitored according to Sibaldelli and Farias [35,36,37], and the climatic water balance for each experimental treatment of each cropping season was calculated according to Thornthwaite and Mather [38].
Grain yield was calculated and corrected for 13% grain moisture, according to Equation (1):
GY = 100 HGM 100 DGM   ×   HGW   × 10,000 HPA
in which GY is the grain yield (kg ha−1), HGM the harvested grain moisture (%), DGM the desired grain moisture (%), HGW the harvested grain weight (kg) and HPA the harvested plot area (m2). Harvest grain moisture was measured using the G810 grain moisture meter (Gehaka Inc., São Paulo, Brazil).

2.2. Spectral Data Acquisition and Processing

The FieldSpec 3 Jr spectroradiometer (Analytical Spectral Devices, Boulder, CO, USA), with spectral resolution of 3 nm between 350 and 1400 nm and 30 nm between 1400 and 2500 nm (Figure 2), was used to collect soybean leaf reflectance. Each spectral reading was averaged by 20 internal automatic spectral readings, and the output spectra are given in single bands of 1 nm width, 2151 contiguous spectral bands.
The leaf reflectance plant probe device, connected to the FieldSpec by a one-meter bare fiber (Figure 2c), was used to prevent illumination interferences of adjacent targets and atmospheric scattering and attenuation, not requiring, therefore, the application of spectral filters for noise removal and data smooth [39,40,41,42,43]. With an internal 99% reflectance board (Spectralon®), used as reflectance standard, and a 1% reflectance opaque and black board, this device was used during the spectral assessment to ensure pure leaf reflectance spectra collection.
Spectral data acquisition was performed at the central leaflet of the fullest expanded third trifoliate leaf from the top. Leaf reflectance spectra were collected from four plants within each subplot and then averaged, resulting in the values used on data processing, minimizing, thus, the spectral variability within the same subplot.
A total of 7216 leaf reflectance was collected at 24 days in the three cropping seasons (four sub-samples in each plot), resulting into 1804 spectral samples used in statistical analysis, as described in Table 4. During the 2016/2017 cropping season, reflectance data from cultivar BRS 184 were not collected. The days of spectral assessments are represented in “days after sowing” (DAS). Because of the frequent spectral noises observed on vegetation analysis, wavelengths between 350 and 399 nm were not considered [44,45].

2.3. Statistical Analysis

Once the assumptions of analysis of variance (ANOVA) had been met, soil moisture and grain yield in each cropping season were submitted to ANOVA and means compared by the Tukey’s test (p ≤ 0.05) via the software Sisvar [46].

Partial Least Squares Regression—PLSR

The partial least squares regression (p ≤ 0.05) was performed by The Unscrambler® (CAMO Software—Norway) to develop a soybean grain yield prediction model by its leaf-based hyperspectral reflectance.
The PLSR method correlates the spectral data (matrix “X”) to the grain yield (analytical data—matrix “Y”) and creates a new dataset of orthogonal base vectors (latent variables or PLSR factors), which account for most of the variation in a trait variable, generating a linear model consisting of waveband scaling coefficients to transform full-spectrum data [47]. The number of orthogonal base vectors is considered a key process in the PLSR and deeply affects its prediction capacity [42]. The ideal PLSR model should use the number of orthogonal base vectors that presents the lowest value of root mean square error (RMSE) through the “leave-one-out” cross-validation method, highest coefficient of determination of multivariate regression (R2) and value of systematic error (BIAS) close to zero [48].
At the first stage, PLSR was applied using the hyperspectral data from each day of spectral assessment and the corresponding cropping season’s grain yield.
At the second stage, the possibility of developing a multi-year soybean grain yield prediction model was evaluated. To do so, the spectral assessment at R5 phenological stage (corresponding to the period when grains are being formed) of each cropping seasons were pooled into the same dataset and analyzed together: 89 DAS (2016/2017 cropping season), 96 DAS (2017/2018 cropping season) and 94 DAS (2018/2019 cropping season), in a total of 224 leaf reflectance samples.
The hyperspectral reflectance of soybean plants at R5 stage (224 samples) were randomly split in two subsets: calibration/cross-validation (containing 75% of data—168 spectral samples), used to develop the PLSR model, and external validation (containing the remaining 25% of the data—56 spectral samples), used to test the developed PLSR model.
At the third stage, aiming at investigating the individual effect of the experimental treatments on the accuracy of grain yield prediction, the spectral samples from each treatment (IRR, NIRR, WDV and WDR) at R5 phenological stage, comprising the three cropping seasons, were fitted into separated models.
The fit quality of each developed PLSR model was assessed by the coefficient of determination (R2), the root mean squared error (RMSE), the root mean squared error expressed in percentage in relation to the amplitude of observed values (RMSE%) and the systematic error (BIAS) at the calibration and cross-validation (using the leave-one-out cross-validation method) steps. Specifically, at the second stage, the predictive accuracy of the obtained PLSR model (generated using 75% of the soybean spectral data at R5 stage) and tested using external samples (25% of the soybean spectral data at R5 stage) was also assessed by the R2, RMSE, RMSE% and BIAS obtained in the external validation (predicted Vs measured yield) step.
Before adjusting the PLSR models, reflectance spectra within each spectral dataset were normalized (subtraction of mean reflectance from the actual reflectance at each wavelength), allowing, thus, the comparison among the fitted coefficients in PLSR. Outliers and homogeneity of the spectral data were assessed by the Leverage and Hotelling’s T2 tests.

3. Results and Discussion

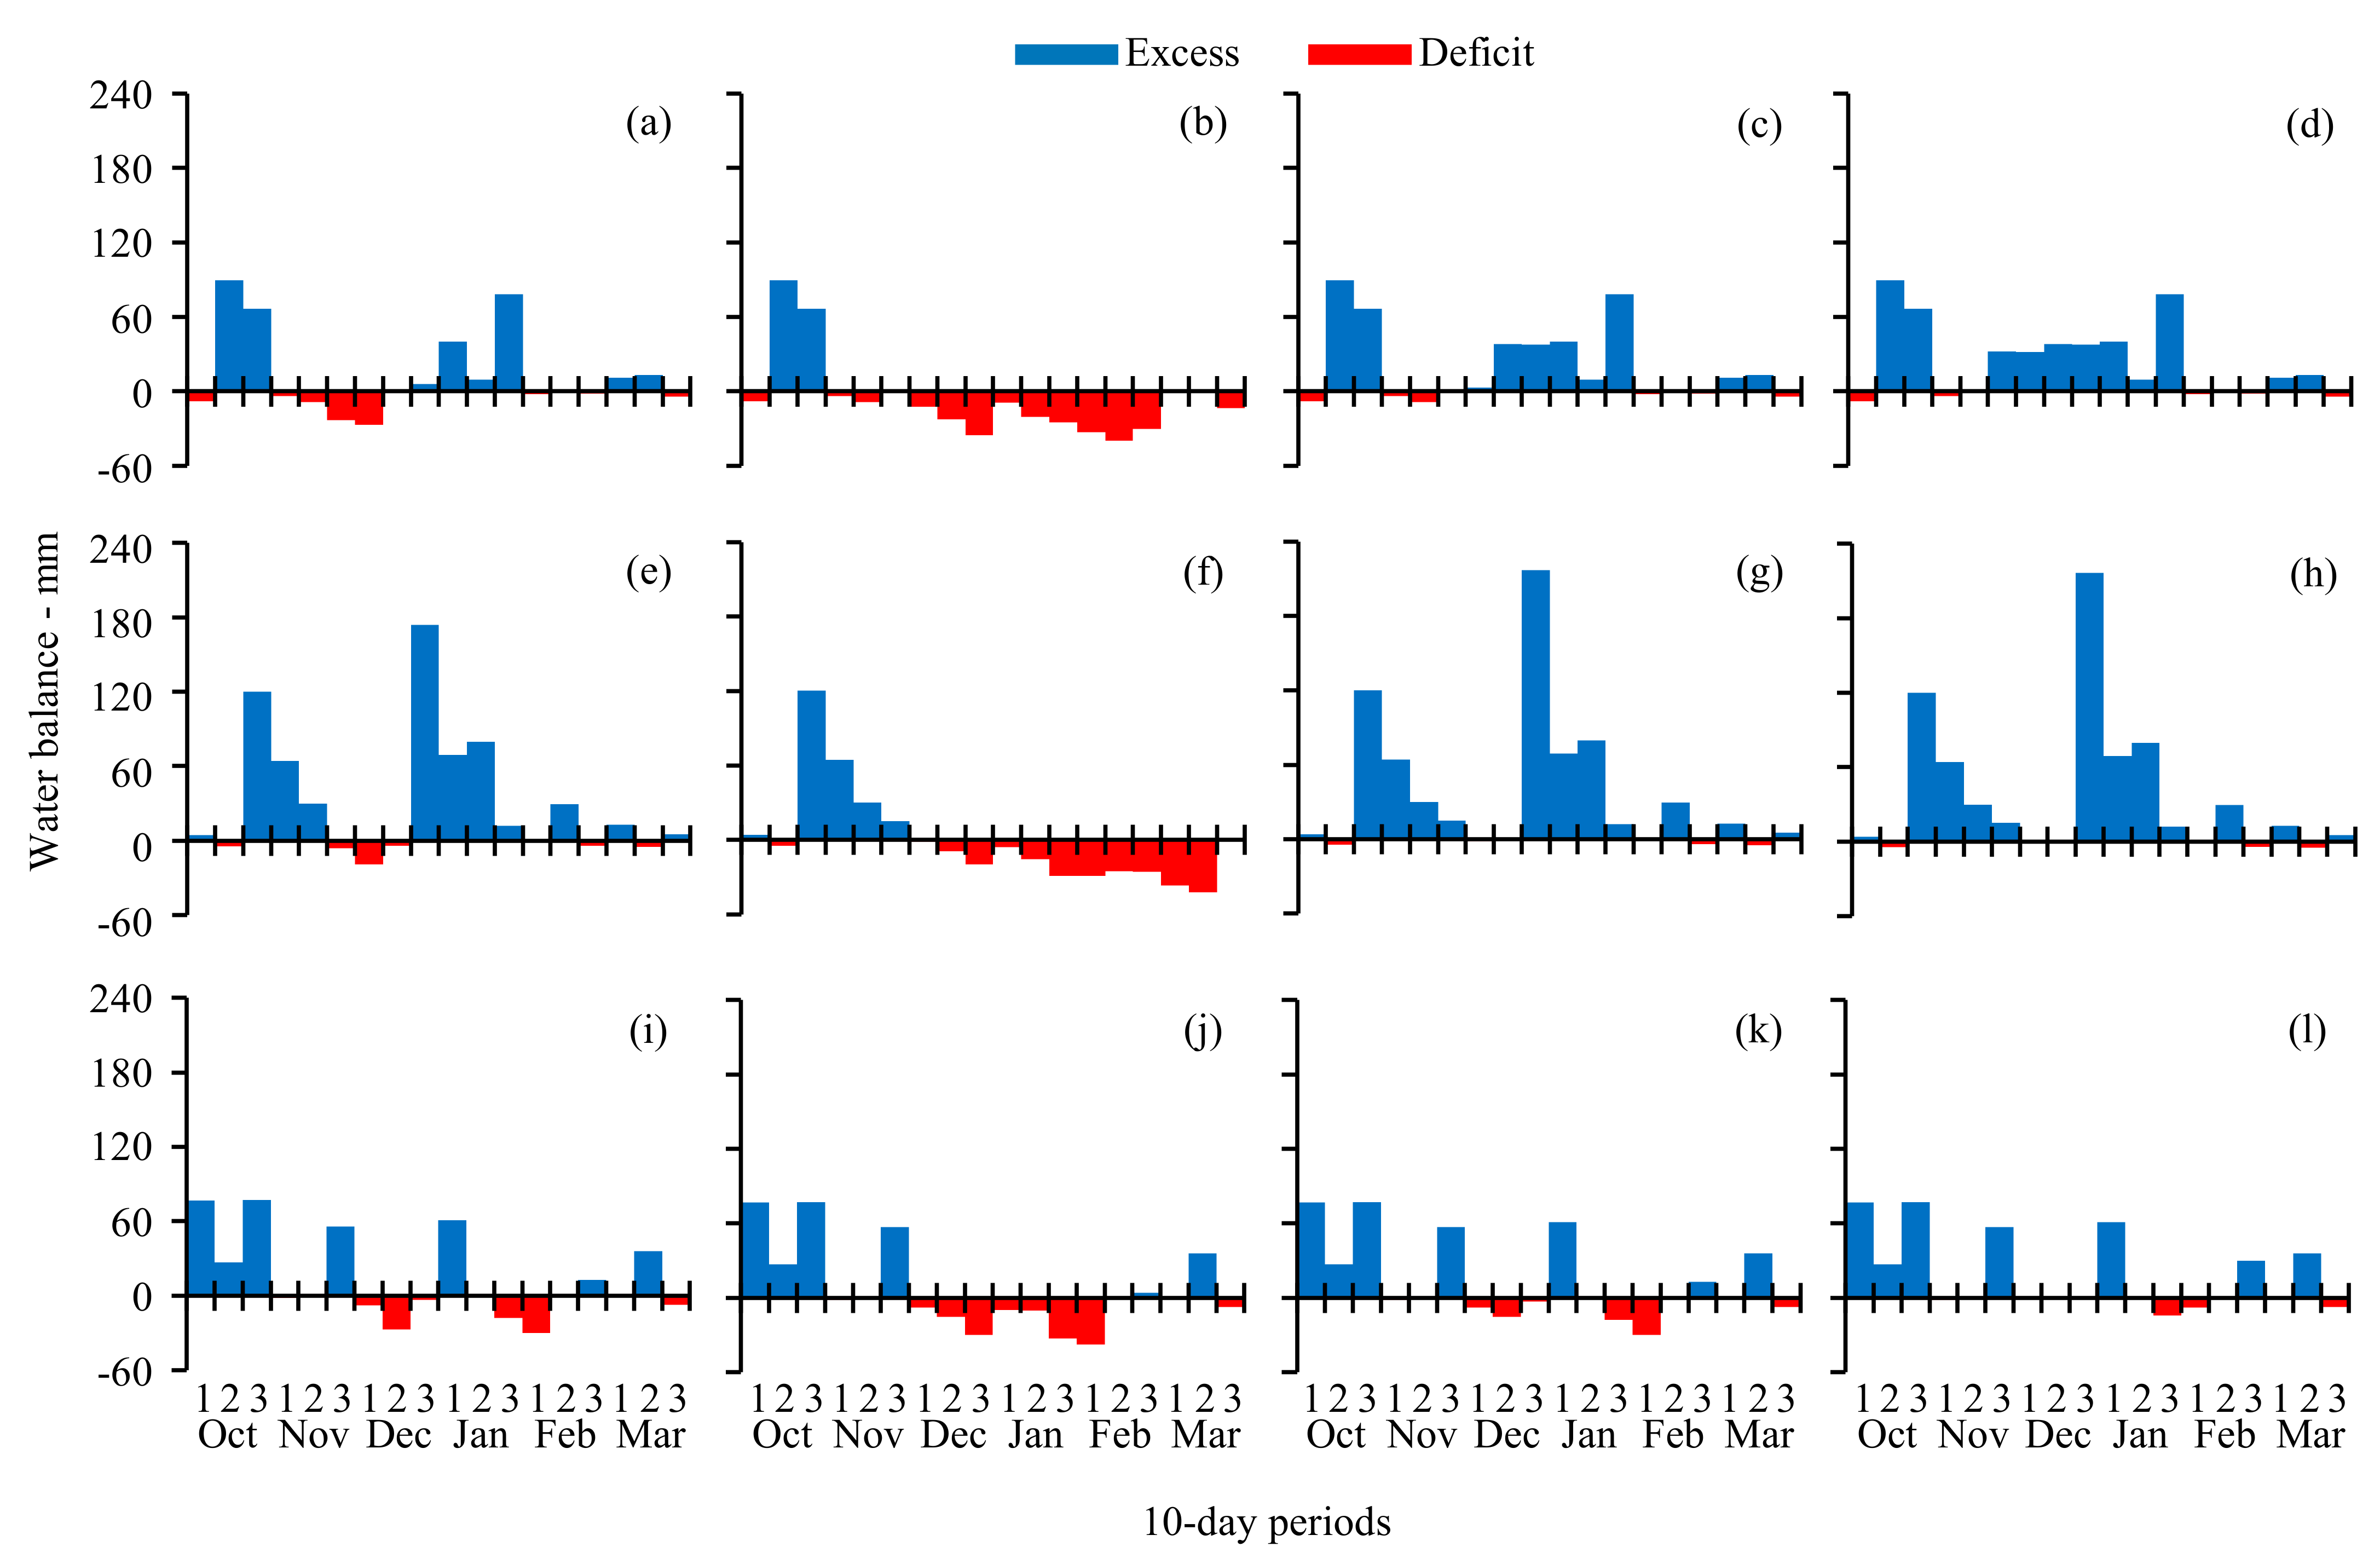
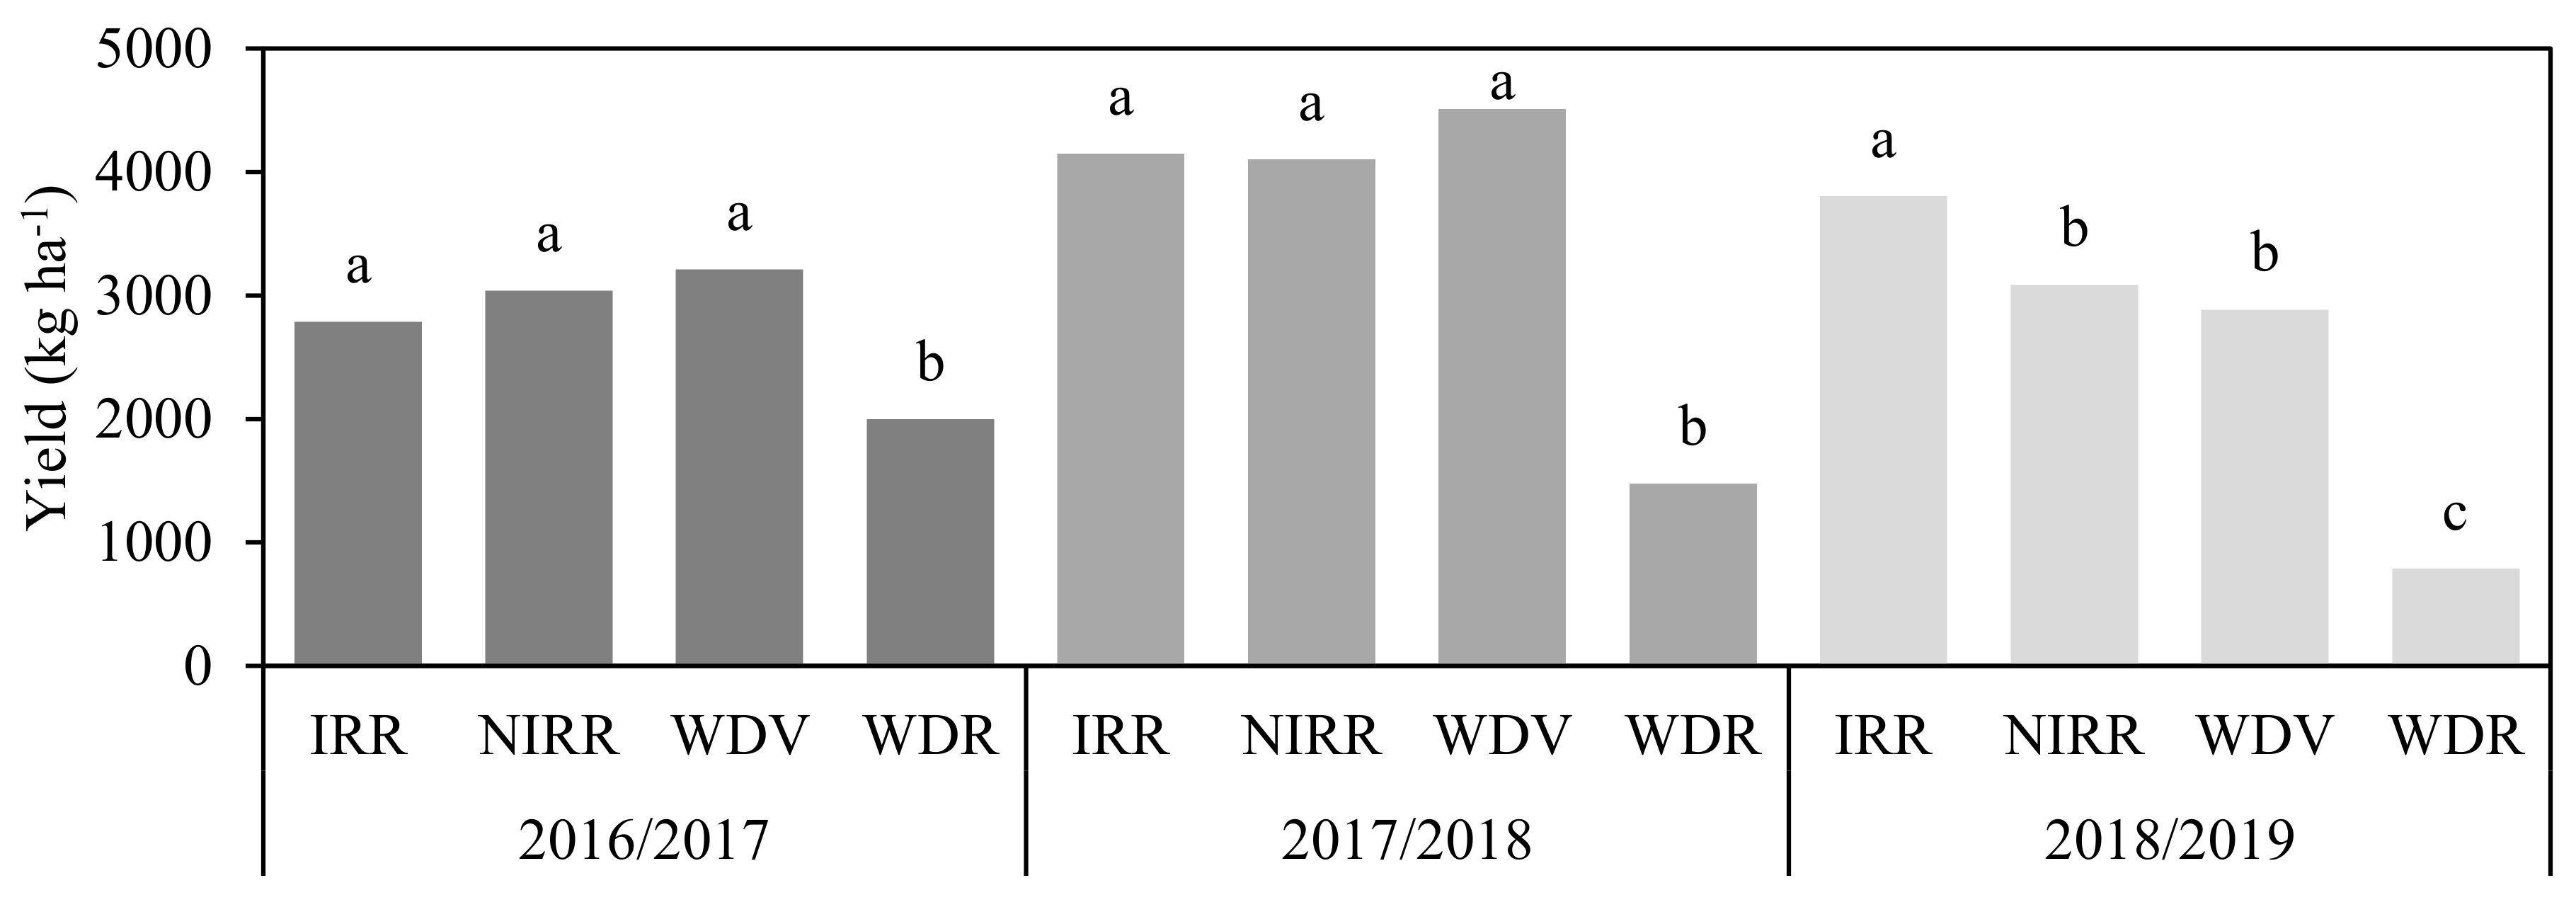
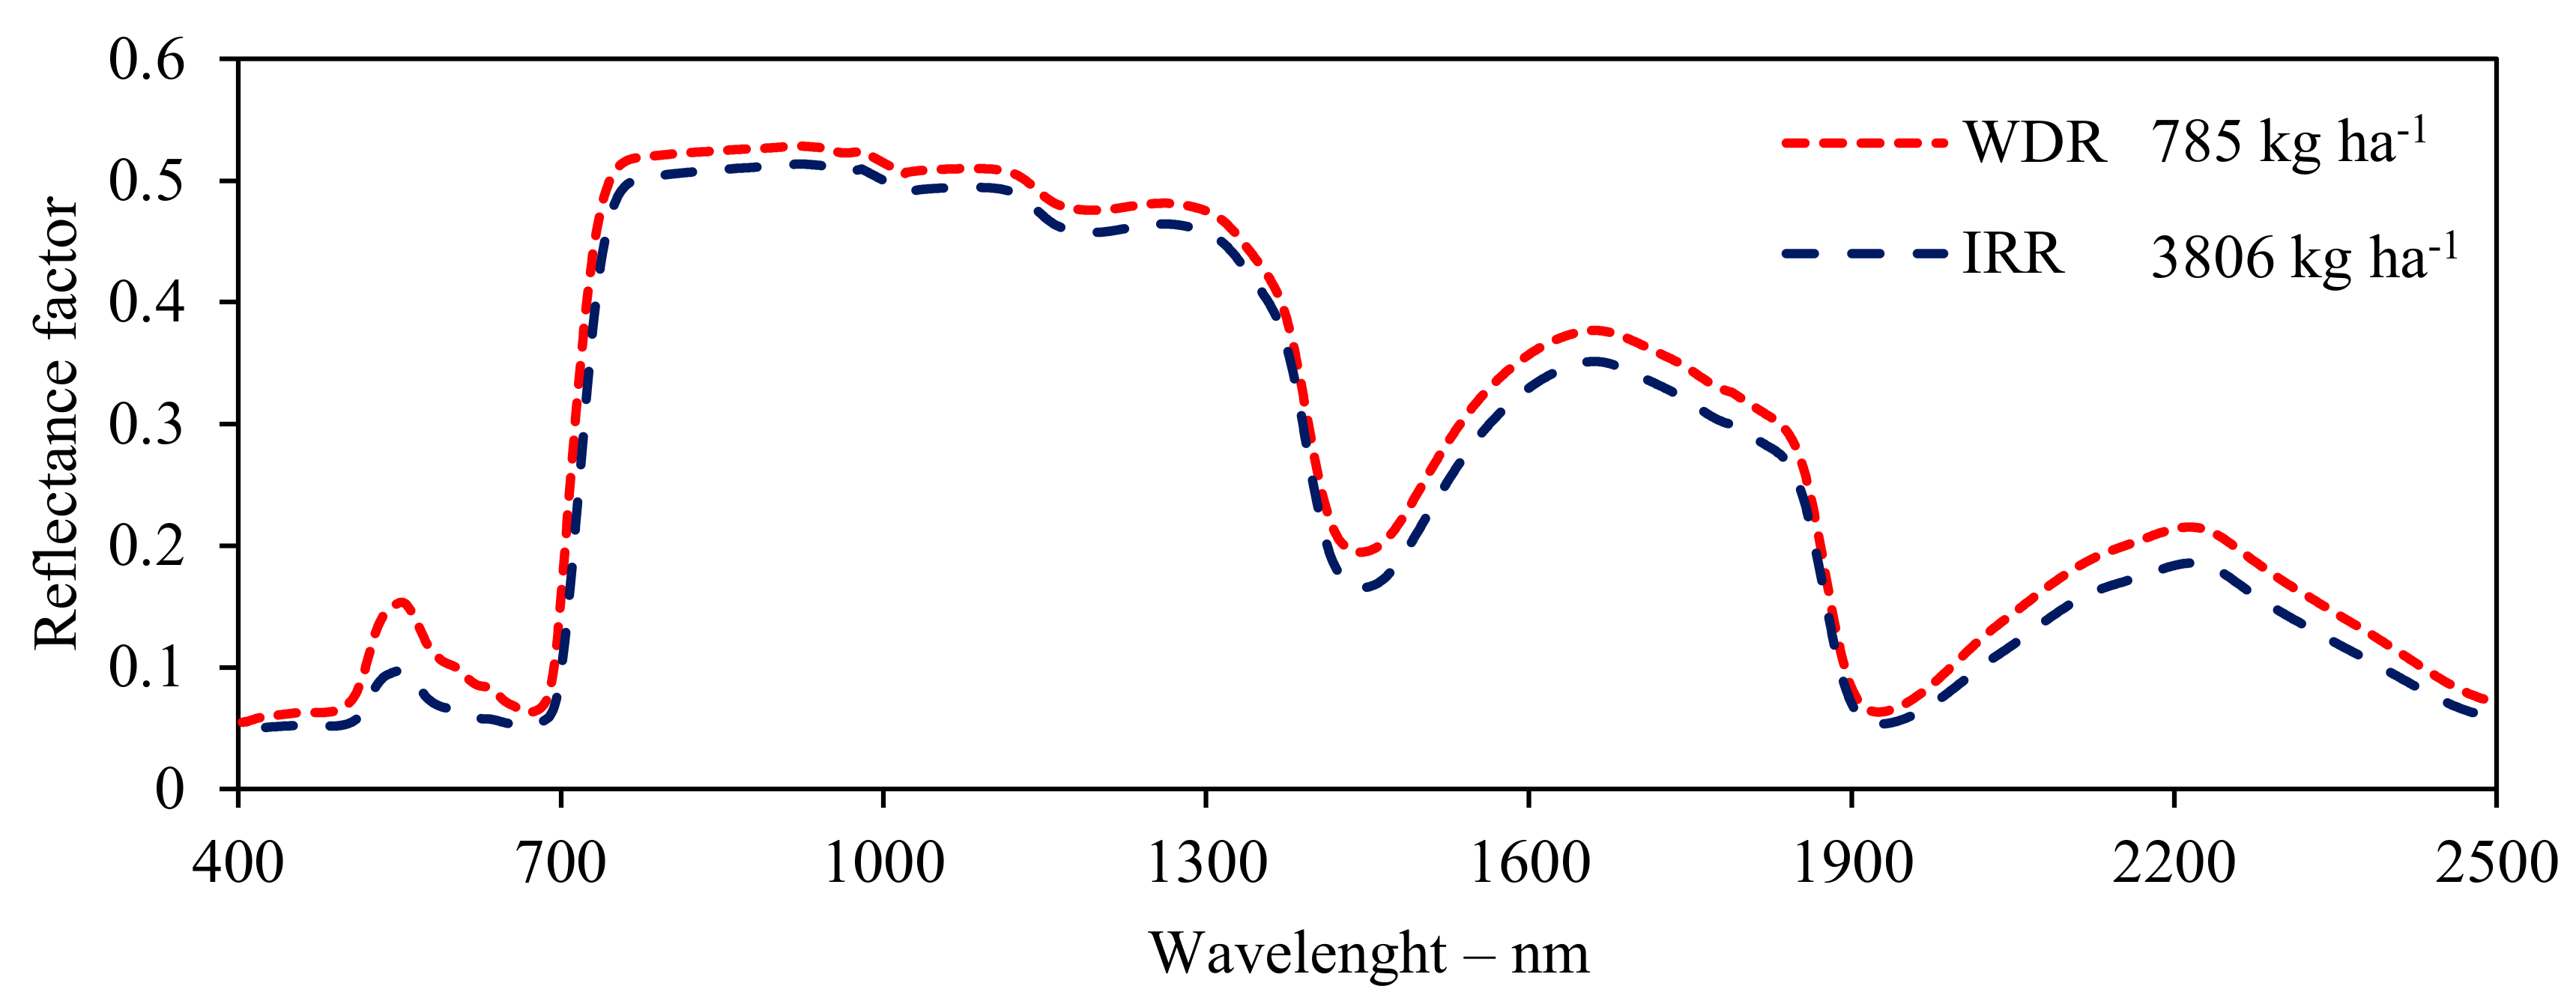
3.1. Effect of Experimental Treatments on Climatic Water Balance, Soil Moisture, Grain Yield and Leaf Reflectance

The climatic water balance, calculated according to Thornthwaite and Mather [38] for each experimental treatment of each cropping season, is presented in Figure 3.
The experimental treatments demonstrated to be efficient in promoting water deficit at the vegetative (at December 1 and 2 10-day periods—Figure 3a,e,i) and at the reproductive (3 December and 1, 2 and 3 January 10-day periods—Figure 3b,f,j) stages in the three cropping seasons. However, the water deficit induced at reproductive stages revealed to be more severe, most likely because of the longer period to which plants were submitted to water withholding.
In the 2016/2017 cropping season, the 69.6 mm of irrigation between 24 and 38 DAS were enough to maintain plants of IRR treatments under good conditions of water availability at 3 November and 1 December 10-day periods (Figure 3d) even under the absence of severe water deficit across this cropping seasons (Figure 3c). Natural water deficit periods could be observed in the 2018/2019 cropping season, both at the vegetative and reproductive periods (Figure 3k), and the irrigation across crop development (106.1 mm) sustained IRR plants under good water status at 1, 2 and 3 December, 2 January and 2 February 10-day periods (Figure 3l).
The soil moisture assessed on the transition between vegetative and reproductive stages and close to the maturity period at the three evaluated cropping seasons is presented in Figure 4.
At the three cropping seasons, the soil moisture on WDV plots on the transition between vegetative and reproductive stages (Figure 4a) demonstrated to be the lowest among all treatments. Even though in the 2017/2018 cropping season, statistical differences could not be detected, most likely because of the large amount of rainfall before the onset of the rainout shelters (late October) and the atmospheric conditions at 3 November and 1 and 2 December 10-day periods, the average values at both depths indicate such a trend.
The soil moisture on the last day of spectral assessment in each cropping season, close to maturation period (Figure 4b), revealed to be lower in WDR plots, due to the long period to which plants were submitted to water deficit. In turn, in WDV plots, the soil moisture demonstrated an increase, since plants began to be rain-watered.
Soybean grain yield in the 2016/2017, 2017/2018 and 2018/2019 cropping seasons is presented in Figure 5. It is possible to observe that soybean plants under water deficit during the reproductive stages had their grain yield drastically decreased. In the 2017/2018 and 2018/2019 cropping seasons, grain yield was reduced to less than a half of other levels of water availability.
In turn, soybean plants subjected to water deficit during the vegetative stages presented grain yield similar to plants under natural rainfall (NIRR treatment), demonstrating that the water deprivation during reproductive stages is more harmful to soybean crop. Several authors have reported similar values of soybean yield on plants under water deficit during the vegetative stages (and rain watered during reproductive stages) compared to plants under good conditions of water availability [49,50,51,52].
Although yield on irrigated plots were similar to non-irrigated plants in the 2016/2017 cropping season, due to the absence of severe natural water deficit (Figure 3c), in the 2018/2019 cropping season, when severe natural water deficit was observed, the IRR treatment demonstrated higher grain yield compared to plants receiving only natural rainfall.
Figure 6 demonstrates the average spectral response of soybean genotypes on irrigated (IRR) and water deficit induced at reproductive stages (WDR) treatments at 107 DAS in the 2018/2019 cropping season (when severe natural water deficit was observed) and their correspondent grain yield. It is possible to observe that plants with higher levels of grain yield (irrigated treatment—blue dashed line) presented lower reflectance across the spectrum compared to plants submitted to water deficit at reproductive stages (WDR treatment—red dashed line), which presented lower values of grain yield.
Damm et al. [53] developed a complete review highlighting that plants under water deficit present higher values of reflectance in comparison to those under good conditions of water availability. According to Maimaitiyiming et al. [54], because of the leaf biochemical properties and structure, the differences in spectral responses of soybean plants under different levels of water availability are not the same across the spectrum.
Although differences in reflectance from IRR and WDR plants can be observed across the spectrum, differences in visible wavelengths (around 550 nm) and shortwave infrared wavelengths (around 1400 and 2200 nm) demonstrated to be better expressed.
Leaf reflectance across the visible spectrum (between 400 and 720 nm) has been proven to have a direct relation with photosynthetic active radiation (PAR), influenced by the interaction between electromagnetic energy and plant tissue compounds, e.g., chlorophyll a, b [55,56], carotenoids (β-carotene, lutein, violaxanthin and neoxanthin) [57], flavonoids (flavones, flavonols, isoflavones and anthocyanins) [58,59,60]. Hence, high rates of absorbed PAR deliver low reflectance, and low rates of absorbed PAR deliver high reflectance at those wavelengths [61,62,63,64,65]. Soybean plants under water deficit present lower photosynthetic and stomatal conductance rates [66,67], resulting in lower absorption of PAR and delivering higher values of reflectance. Regarding the largest difference observed across the visible spectrum, in the green wavelengths (around 550 nm), Moriwaki et al. [68] observed larger absorption in this spectral interval with increasing chlorophyll contents, albeit, no significant increases in blue or red absorptions.
Despite the absence of large difference in leaf reflectance across near-infrared wavelengths (between 720 and 1300 nm), it is possible to observe higher reflectance from WDR plants. The near-infrared spectrum is associated to leaf physical structure and spatial distribution of cells and also by water content [56,69,70]. Thus, the interaction of electromagnetic energy inside the mesophyll leads to internal scattering [71,72,73] and promotes differences in leaf reflectance.
The shortwave-infrared spectrum (between 1300 and 2500 nm) has been well characterized as negative related to vegetation water status and leaf water content. Braga et al. [17], characterizing the relative water content in soybean plants submitted to irrigated and water deficit conditions, demonstrated higher reflectance values for plants under water shortage. Hence, plants under good conditions of water availability (IRR treatment) presented higher levels of leaf water content and, consequently, lower values of reflectance [74,75,76,77].
The differences in reflectance across the spectrum play an important role in the monitoring and differentiation of soybean crop water status and can contribute to the water management and decision making across cropping season. Besides that, the spectral behavior from visible to shortwave infrared can provide important information for yield prediction, and the understanding of the most correlated wavelengths to yield (also influenced by the phenological iteration across cropping season).

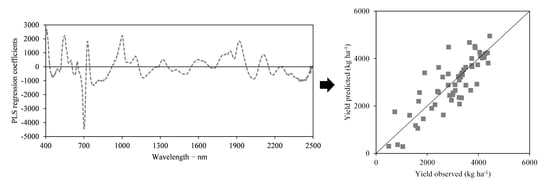
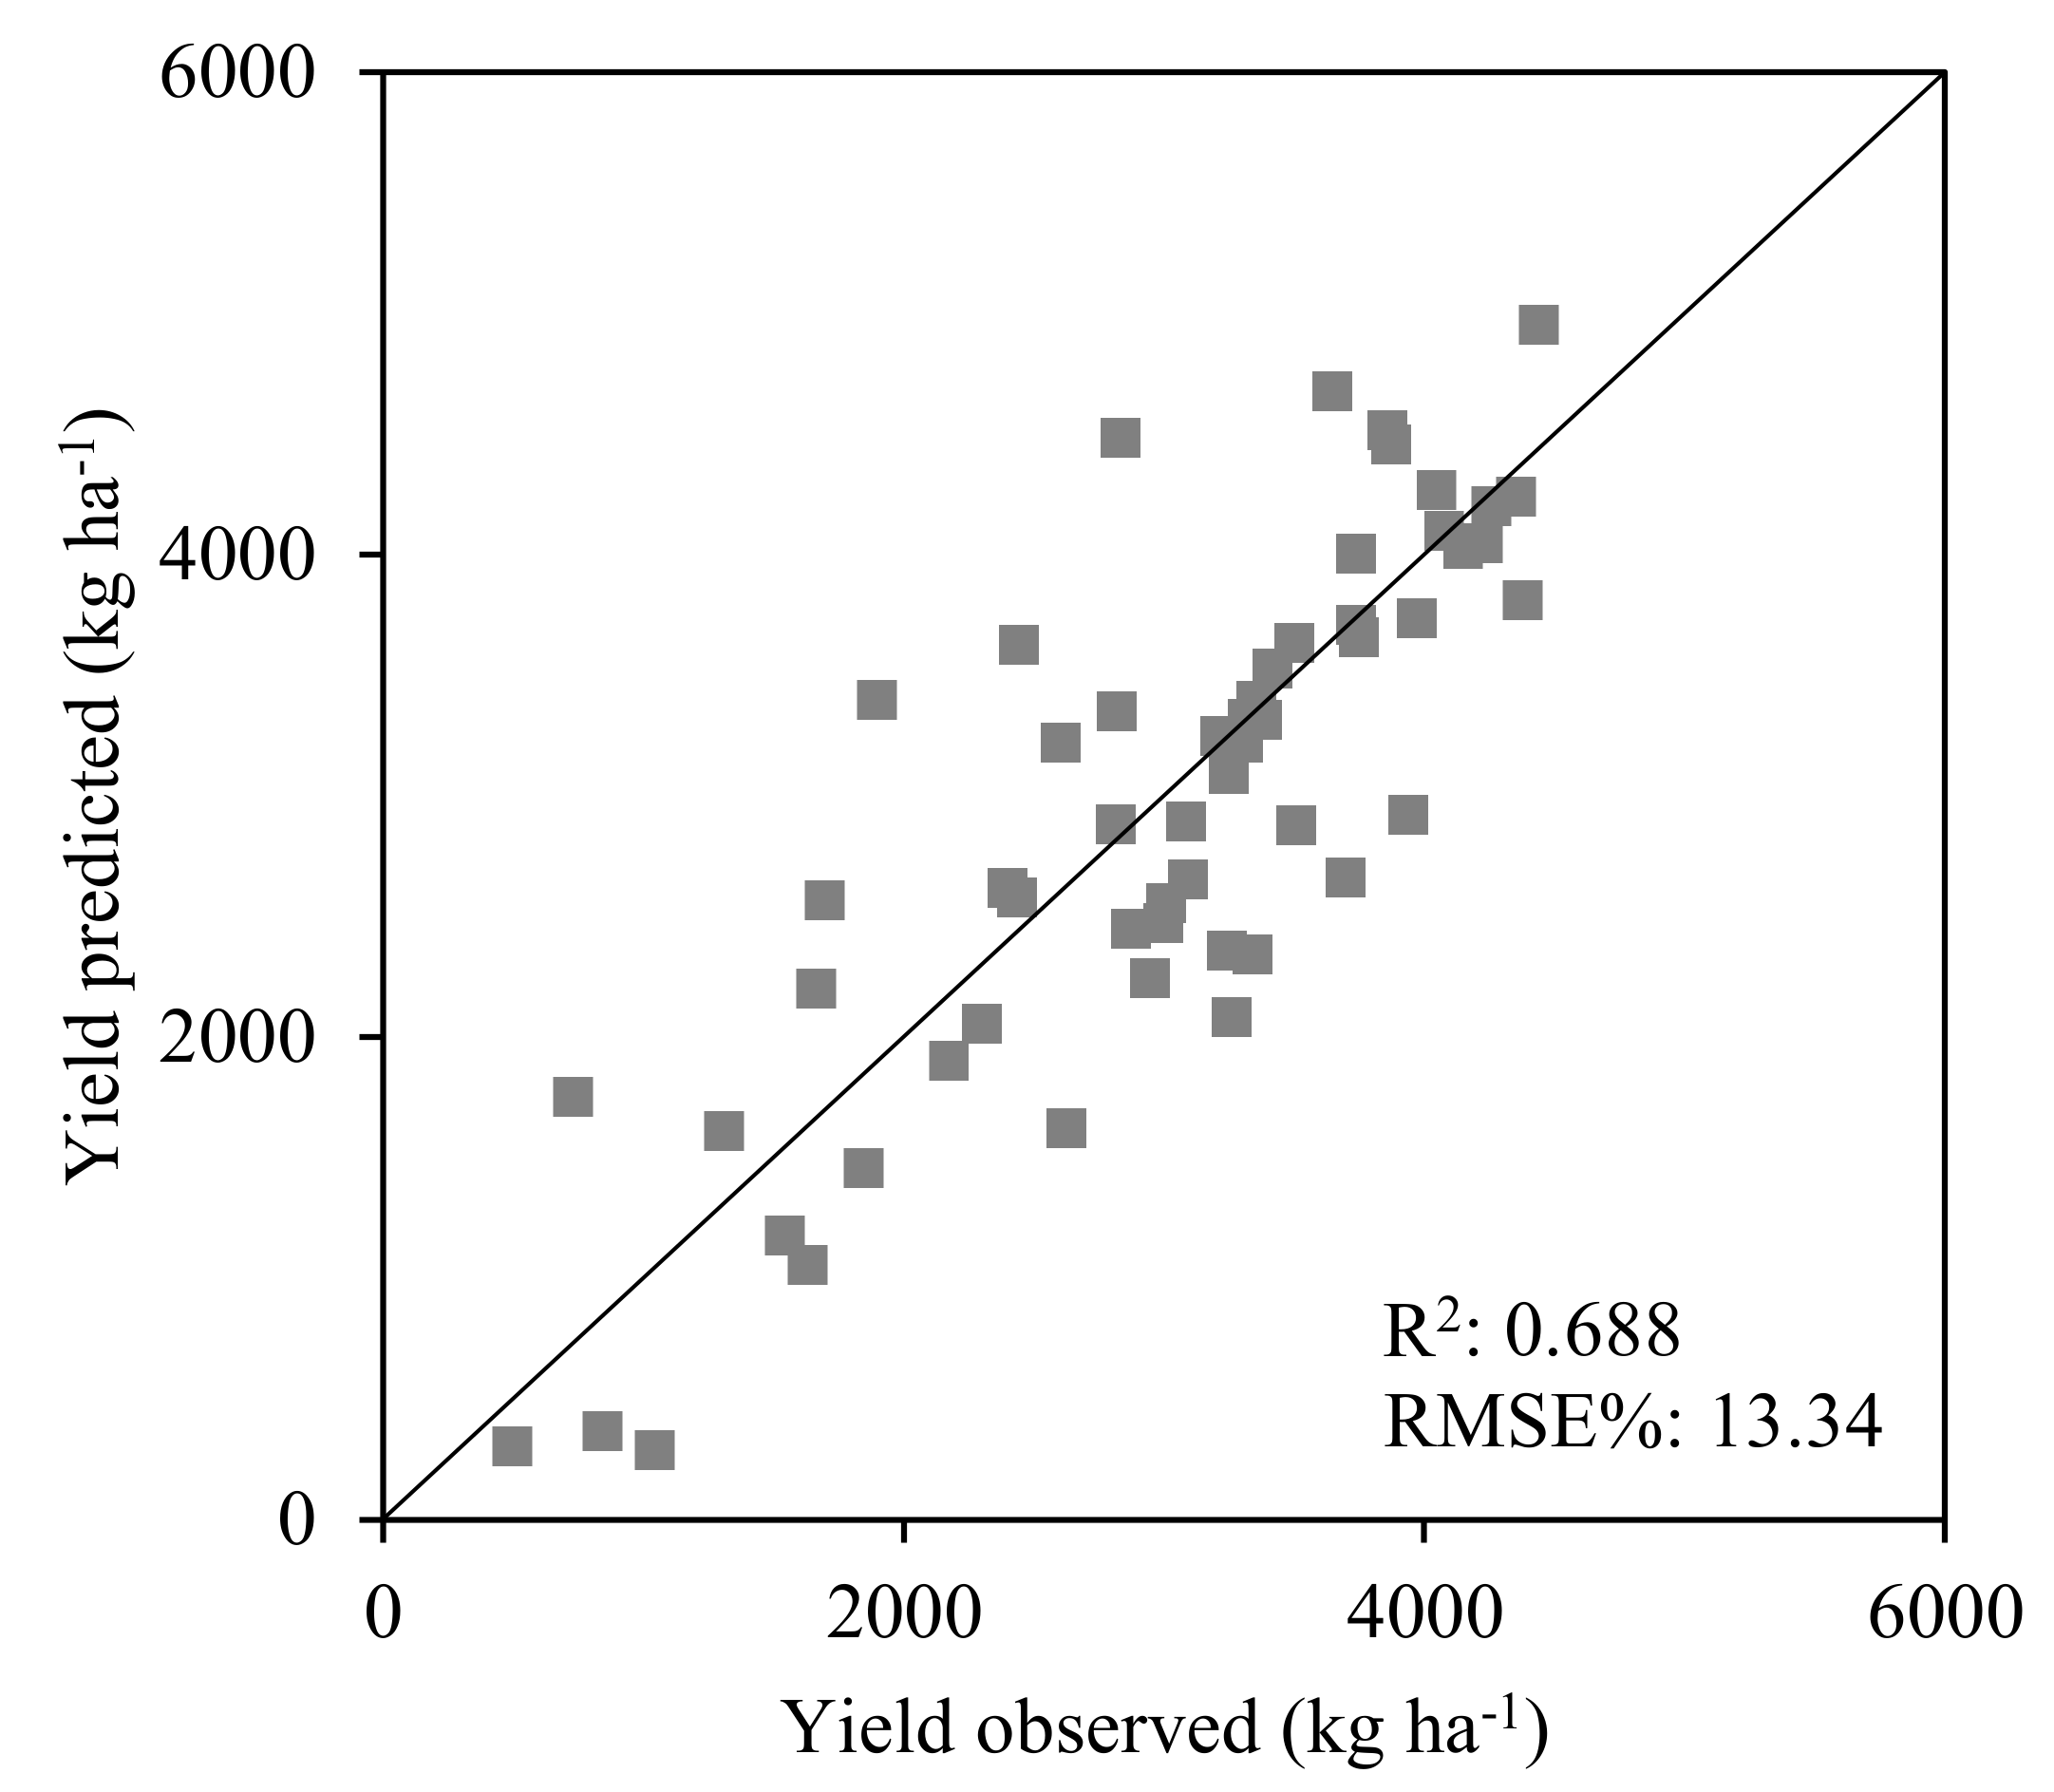
3.2. Predicting Soybean Grain Yield through Partial Least Squares Regression—PLSR

The results of PLSR in the prediction of soybean grain yield for the 2016/2017, 2017/2018 and 2018/2019 cropping seasons are presented in Table 5.
In all days of spectral assessment, the correlation coefficient (R2) of the calibration step was superior than the R2 found on cross-validation step. Consequently, the RMSE from the cross-validation was larger than the values obtained in the calibration step.
In the 2016/2017 cropping season, the lowest values of R2 and highest values of RMSE were observed at the early stages of crop development (28 and 33 DAS) both in the calibration and cross-validation steps. On those dates, the R2 was lower than 0.168, and the RMSE was over 588 kg ha−1 (19.96%). However, an increment in grain yield prediction accuracy, with higher R2 and lower RMSE, was observed as the soybean crop becomes developed.
Therefore, at 89 DAS, the highest R2 was obtained both at calibration and cross-validation (0.731 and 0.595, respectively). On this date, the RMSE at the calibration step was 334 kg ha−1 (11.33%) and 416 kg ha−1 (14.14%) at the cross-validation. This date corresponds to the R5 phenological stage, when soybean grains are being formed.
Although the accuracy in grain yield prediction increased as soybean crop developed, at the last assessment day in this cropping season (112 DAS), the values of R2 demonstrated to be lower and the RMSE higher compared to the previous assessment day. On this last evaluation, soybean crop had reached the R6 phenological stage, indicating that grains have been completely filled, and the maturation is initiating.
Based on the obtained results, the PLSR model demonstrated to be able to predict soybean grain yield (ranging from 1221 to 4169 kg ha−1, as demonstrated by Figure 7) under different levels of water availability with R2 between 0.731 and 0.595 and RMSE between 334 kg ha−1 (11.33%) and 416 kg ha−1 (14.14%) at the calibration and cross-validation steps, respectively.
On the 2017/2018 cropping season, as it has been observed in the previous cropping season, the lowest values of R2 and highest RMSE were obtained in the early stages of crop development.
Following the results observed in the 2016/2017 cropping season, in the 2017/2018 cropping season, the highest accuracy in grain yield prediction was found at the R5 stage (96 DAS), when the R2 at calibration and cross-validation were 0.924 and 0.885, respectively, and the RMSE at both steps was 351.49 kg ha−1 (7.77%—calibration) and 437.22 kg ha−1 (9.67%—cross-validation). As previously discussed, decrease in R2 and increase in RMSE values were observed as the crop reached the maturation stages of crop development (113 DAS).
In this cropping season (2017/2018), the PLSR demonstrated to be able to predict soybean grain yield under contrasting levels of water status across crop development, resulting in yields ranging from 875 to 5398 kg ha−1, as shown in Figure 7.
The results of the PLSR in the prediction of soybean grain yield in the 2018/2019 cropping season corroborate the results observed in the 2016/2017 and 2017/2018 cropping seasons, with lower values of R2 at the calibration and cross-validation observed on the earliest days of spectral assessment.
In the 2018/2019 cropping season, the highest values of R2, both at the calibration (0.891) and cross-validation (0.810), were obtained at the R5 stage (94 DAS), presenting the lowest values of RMSE (403.59 kg ha−1—8.90%—and 538.47 kg ha−1—11.87%—respectively). A decrease in prediction accuracy was observed as the crop reaches the maturation stages of development. In this cropping season, the observed yields ranged from 287 to 4823 kg ha−1 (Figure 7).
In the three cropping seasons, the accuracy in soybean grain yield prediction demonstrated to increase as the crop develops and to decrease as the crop reaches the maturation stages of development. Similar results were reported by Herrmann et al. [21] who performed the corn yield prediction using crop reflectance and PLSR. Christenson et al. [19] collected hyperspectral data from soybean canopy between R1 and R6 reproductive stages and applied PLSR to predict grain yield but did not conclude about the best stage for yield prediction. The R5 phenological stage has been suggested to be more suitable for soybean grain yield monitoring and prediction using satellite-based [11,13,78], UAV-based [15] and field-based [52,79] remote-sensed data.
The highest accuracy for soybean yield prediction at R5 phenological stage is associated to the crop phenology, physiological responses according to the water availability and time of inducement of water deficit. The R5 phenological stage corresponds to the period when the grains are being formed, which represents the crop yield, being a result of several physiological iterations during the cropping season. At this stage, most of physiological iterations will be expressed on yield. Hence, the R5 phenological stage is the closest one to yield itself, and spectral assessments during this stage are suitable to investigate the relation between leaf reflectance and yield (also comprising its driving factors). In the forthcoming development stages, the grains had already been formed and plants reached their maturity. At this time, most biotic and abiotic factors that can provoke physiological responses and, therefore, interfere in grain yield, as water availability, soil nutritional status, plant diseases and insect attack, can no longer impair the crop production.
Regarding the physiological responses under different levels of water availability, the lowest accuracy in yield prediction at the early phenological stages is associated to the fact that soybean plants submitted to water shortage at vegetative stages demonstrated to recover their physiological responses and to reach a similar yield compared to those plants grown under good conditions of water availability (Figure 5). Hence, there is a trade-off between early yield prediction and accuracy: plants from WDV treatment assessed at the vegetative stages of development can be submitted to different water status (e.g., rainfall) on forthcoming stages; likewise, plants from WDR treatment evaluated at vegetative stages might be submitted to different conditions of water availability (e.g., water deficit) in the forthcoming development stages, which imposes limitation to the early prediction of yield with high accuracy.
Considering the results found in the three evaluated cropping seasons (2016/2017, 2017/2018 and 2018/2019), the highest accuracy in soybean grain yield prediction was obtained at 89 DAS, 96 DAS and 94 DAS, respectively, which correspond to the R5 stage. Based on that, aiming at constructing a multi-year soybean grain yield prediction model, the spectral data collected at 89 DAS (2016/2017 cropping season), 96 DAS (2017/2018 cropping season) and 94 DAS (2018/2019 cropping season), and their correspondent yields were analyzed into a single PLSR model.
The results of the PLSR in the prediction of soybean grain yield at R5 stage, comprising spectral data collected in the three evaluated cropping seasons (2016/2017, 2017/2018 and 2018/2019), are presented in Table 6. As it was expected, the highest accuracy in grain yield prediction was found in the calibration step, followed by the cross-validation and external validation. At the calibration, the highest R2 and lowest RMSE were observed (0.775 and 574.52 kg ha−1—11.38%—respectively), while at the cross-validation, using the leave-one-out method, the R2 demonstrated a slightly decrease (0.730), and the RMSE was increased (634 kg ha−1—12.57%).
When applying the generated yield prediction model to external samples (external validation), a positive correlation was achieved between the observed and predicted soybean grain yield, as demonstrated by Figure 8.
The regression analysis with an intersection passing through the origin (y = bx) revealed an adjusted model (y = 0.9814 x) with coefficients of determination (R2) equal to 0.688. The RMSE of the external validation (622 kg ha−1—13.34%) demonstrated an increase of only 48 kg ha−1 in comparison to the calibration step.
Hence, soybean grain yield ranging from 287 to 5398 kg ha−1 (Figure 7), due to the different levels of water availability in the three evaluated cropping seasons, could be predicted at the R5 stage, which denotes the possibility of applying the generated PLSR model on forthcoming cropping seasons.
Similar results were obtained in research using crop reflectance and PLSR to predict yield in major crops. Ancin-Murguzur et al. [26], predicting grassland yield, obtained R2 between 0.37 and 0.82 in the calibration step and between 0.56 and 0.71 in the validation step. Estimating spring barley yield, Barmeier et al. [24] obtained R2 equal to 0.78 and 0.80 at calibration and validation steps, respectively. In the same context, Ferrio et al. [80] predicted durum wheat yield with R2 equal to 0.81 and 0.76 at calibration and validation steps, respectively, and R2 lower than 0.6 when using external validation. In winter wheat, Sharabian et al. [23] demonstrated R2 equal to 0.66 and 0.73 at the cross and external validation, respectively. Predicting corn yield, Herrmann et al. [21] obtained R2 equal to 0.77, 0.70 and 0.73 at calibration, cross and external validation steps, respectively.
Christenson et al. [19] used hyperspectral canopy reflectance and PLSR to predict soybean grain yield. The authors obtained R2 between 0.18 and 0.67 depending on the maturity group of the evaluated cultivars and R2 equal to 0.44 and RMSE equal to 841 Kg ha−1 when considering all cultivars into the same model.
Figure 9 presents the regression coefficients of the PLSR model for soybean grain yield prediction at R5 stage. Although the PLSR coefficients demonstrated to be well distributed across the spectrum, peaks were observed at 408, 550 and 702 nm (deeply influenced by the absorption photosynthetic active radiation); 729 nm (correspondent to the slope in leaf reflectance between the red and near-infrared wavelengths); 1000 and 1917 nm (associated to the light scattering inside the mesophyll and leaf water content, respectively).
The strong negative correlation at 702 nm is in accordance to previous research works addressing the yield prediction through PLSR and canopy reflectance in major crops. Ferrio et al. [80] observed negative correlation at 700 and 750 nm in the yield prediction of durum wheat. Herrmann et al. [21] detected negative correlation at 740 nm aiming at predicting corn yield. Estimating spring wheat yield, Øvergaard et al. [81] demonstrated a negative correlation at 700 nm; Christenson et al. [19] observed a strong negative correlation between the reflectance at 715 nm in the prediction of soybean grain yield.
To assess the individual effect of the experimental treatments on the prediction ability of the PLSR, comprising the three cropping seasons at R5 stage, the spectral samples from each treatment (IRR, NIRR, WDV and WDR) were fitted into separated PLSR models. The performance of PLSR in the prediction of soybean grain yield at R5 stage in each experimental treatment (water availability) is presented in Table 7.
The highest accuracy in grain yield prediction, both at the calibration and cross-validation, was found on soybean plants that have been submitted to water shortage during the vegetative stages of crop development and then rain watered from the flowering period (WDV treatment). In accordance to these results, the WDR treatment demonstrated the second highest accuracy in grain yield prediction, both at the calibration and cross-validation steps.
In contrast, the lowest R2 and highest RMSE, both at the calibration and cross-validation, were found on soybean plants from the irrigated (IRR) treatment. It is important to emphasize that the IRR spectral samples from 2017/2018 cropping seasons were analyzed into the NIRR treatment due to the absence of irrigation in this cropping season. Although the prediction accuracy on NIRR demonstrated to be higher compared to the IRR treatment, it was still inferior than the values obtained both in WDR and WDV treatments.
Much research suggests that the expression of drought tolerance genes in soybean genotypes is higher in plants submitted to water deficit, as it might have occurred in the WDV and WDR treatments, leading to physiological differences among soybean genotypes [50,66,67,82,83] and resulting in spectral responses better correlated to grain yield.
Assessing the accuracy of PLSR to predict corn yield using canopy and leaves reflectance, Weber et al. [20] obtained better results on plants subjected to water deficit in comparison to well-watered plants. Accordingly, Christenson et al. [19] reported limitations when predicting soybean grain yield on irrigated plots.
The obtained results demonstrated that the use of leaf reflectance and PLSR is able to predict soybean grain yield under different levels of crop water status. The highest accuracy in the prediction of soybean grain yield under water shortage during vegetative and reproductive stages plays an important role, providing information for better characterization and mitigation of the negative impacts of drought occurrence, leading to adjustments in management practices and decision making regarding food security, logistic, economic and social issues, minimizing potential losses.
The use of leaf-based hyperspectral data demonstrated to be feasible for soybean yield prediction. Although the used sensor is a non-imaging sensor, providing only point-based spectral acquisition, it provides a large number of bands at high spectral resolution, which allows the characterization of multiple iterations between yield (as a result of crop physiology) and reflectance across the spectrum. The methods used on the present manuscript and the obtained results might contribute to future research aiming at yield monitoring using hyperspectral sensors at different levels of data acquisition, including satellite and UAV-based hyperspectral images. Considering that spectroradiometers are usually expensive, its intensive use on large areas might be undermined. However, considering the most explanatory spectral bands for yield prediction, future research can focus on the evaluation of narrow-band vegetation indices, centered on specific wavelengths, which can be generated and acquired by digital cameras equipped with narrow-band-pass optical filters, allowing the monitoring of large crop areas by unmanned aerial vehicles (UAVs).

4. Conclusions

This present paper addressed the prediction of grain yield in soybean crop grown under different levels of water availability using reflectance spectroscopy and partial least squares regression.
Plants with higher levels of yield presented lower leaf reflectance across the spectrum. Although differences in reflectance from IRR and WDR plants could be observed across the spectrum, differences in visible wavelengths (around 550 nm), influenced by the interaction between electromagnetic energy and plant tissue compounds, and shortwave infrared wavelengths (around 1400 and 2200 nm), influenced by crop water status and leaf water content, demonstrated to be better expressed.
The PLSR in the three evaluated cropping seasons (2016/2017, 2017/2018 and 2018/2019) demonstrated the highest accuracy in soybean grain yield prediction at 89 DAS, 96 DAS and 94 DAS, respectively, which correspond to the R5 phenological stage. On these dates, the R2 on the calibration step ranged from 0.731 to 0.924 and the RMSE from 334 to 403 kg ha−1 (7.77 to 11.33%), respectively.
Analyzing the three cropping seasons into a single PLSR model, soybean yield ranging from 287 to 5398 kg ha−1 could be predicted at the R5 stage with R2 equal to 0.775, 0.730 and 0.688 at the calibration, cross-validation and external validation step, respectively. A strong positive correlation was achieved between the observed and predicted soybean yield, with RMSE equal to 622 kg ha−1 (13.34%), which denotes the possibility of applying the generated PLSR model in forthcoming cropping seasons.
The obtained results demonstrated that the use of leaf reflectance and PLSR is able to predict soybean grain yield under different levels of crop water status. The PLSR of each experimental treatment at the R5 stage demonstrated higher accuracy for plants submitted to water deficit both at the vegetative and reproductive periods in comparison to plants under natural rainfall or irrigation. The accuracy in grain yield prediction under different levels of crop water status provides valuable information for better characterization and mitigation of the negative impacts of drought occurrence, leading to adjustments in management practices and decision making regarding food security, logistic, economic and social issues, minimizing potential losses.

Author Contributions

Conceptualization: L.G.T.C., M.R.N., R.H.F. and R.N.R.S. Methodology: L.G.T.C., M.R.N., R.H.F., R.N.R.S., J.S.S.F., L.M.M.-H., A.L.N., N.N. and J.R.B.F. Software, L.G.T.C., R.H.F. and E.C. Formal analysis: L.G.T.C., M.R.N., R.N.R.S. and J.R.B.F. Data curation: L.G.T.C., M.R.N. and J.R.B.F. Writing—original draft preparation: L.G.T.C. Visualization: L.G.T.C., M.R.N. and J.R.B.F. Project administration: M.R.N., J.R.B.F. and L.S. Funding acquisition: M.R.N., J.R.B.F. and L.S. All authors have read and agreed to the published version of the manuscript.

Funding

This work has been funded by the National Council for Scientific and Technological Development—CNPq; Central Public-Interest Scientific Institution Basal Research Fund [Y2020GH14] and the Talented Young Scientist Program—China Science and Technology Exchange Center [Brazil–19-004].

Informed Consent Statement

Not applicable.

Data Availability Statement

The data that support the findings of this study are available from the author L.G.T.C.

Conflicts of Interest

The authors declare no conflict of interest.

References

  1. CONAB (National Company of Food Supply). Brazilian Crop Assessment–Grain, 2019/2020 Crops, Sixth Inventory Survey, March/2020. 2020. Available online: https://www.conab.gov.br/info-agro/safras/graos/boletim-da-safra-de-graos (accessed on 25 March 2020).
  2. USDA (United States Department of Agriculture). World Agricultural Production. Circular Series WAP 3–20 March 2020. 2020. Available online: https://apps.fas.usda.gov/psdonline/circulars/production.pdf (accessed on 25 March 2020).
  3. Battisti, R.; Sentelhas, P.C.; Pascoalino, J.A.L.; Sako, H.; Dantas, J.P.D.S.; Moraes, M.F. Soybean Yield Gap in the Areas of Yield Contest in Brazil. Int. J. Plant Prod. 2018, 12, 159–168. [Google Scholar] [CrossRef]
  4. Sentelhas, P.C.; Battisti, R.; Câmara, G.M.S.; Farias, J.R.B.; Hampf, A.C.; Nendel, C. The soybean yield gap in Brazil—magnitude, causes and possible solutions for sustainable production. J. Agric. Sci. 2015, 153, 1394–1411. [Google Scholar] [CrossRef] [Green Version]
  5. Ferreira, R.C. Quantificação das Perdas por Seca na Cultura da Soja o Brasil. Ph.D. Thesis, Universidade Estadual de Londrina, Londrina, Brazil, 2016. [Google Scholar]
  6. Rio, A.D.; Sentelhas, P.C.; Farias, J.R.B.; Sibaldelli, R.N.R.; Ferreira, R.C. Alternative sowing dates as a mitigation measure to reduce climate change impacts on soybean yields in southern Brazil. Int. J. Clim. 2015, 36, 3664–3672. [Google Scholar] [CrossRef]
  7. Gusso, A.; Ducati, J.R. Algorithm for Soybean Classification Using Medium Resolution Satellite Images. Remote Sens. 2012, 4, 3127–3142. [Google Scholar] [CrossRef] [Green Version]
  8. De Souza, C.H.W.; Mercante, E.; Johann, J.A.; Lamparelli, R.A.C.; Uribe-Opazo, M.A. Mapping and discrimination of soya bean and corn crops using spectro-temporal profiles of vegetation indices. Int. J. Remote Sens. 2015, 36, 1809–1824. [Google Scholar] [CrossRef]
  9. Song, X.-P.; Potapov, P.V.; Krylov, A.; King, L.; Di Bella, C.M.; Hudson, A.; Khan, A.; Adusei, B.; Stehman, S.V.; Hansen, M.C. National-scale soybean mapping and area estimation in the United States using medium resolution satellite imagery and field survey. Remote Sens. Environ. 2017, 190, 383–395. [Google Scholar] [CrossRef]
  10. Da Silva, C.A.; Nanni, M.R.; Teodoro, P.E.; Silva, G.F.C. Vegetation Indices for Discrimination of Soybean Areas: A New Approach. Agron. J. 2017, 109, 1331–1343. [Google Scholar] [CrossRef]
  11. Bolton, D.K.; Friedl, M.A. Forecasting crop yield using remotely sensed vegetation indices and crop phenology metrics. Agric. For. Meteorol. 2013, 173, 74–84. [Google Scholar] [CrossRef]
  12. Johnson, D.M. An assessment of pre- and within-season remotely sensed variables for forecasting corn and soybean yields in the United States. Remote Sens. Environ. 2014, 141, 116–128. [Google Scholar] [CrossRef]
  13. Sakamoto, T. Incorporating environmental variables into a MODIS-based crop yield estimation method for United States corn and soybeans through the use of a random forest regression algorithm. ISPRS J. Photogramm. Remote Sens. 2020, 160, 208–228. [Google Scholar] [CrossRef]
  14. Yu, N.; Li, L.; Schmitz, N.; Tian, L.F.; Greenberg, J.A.; Diers, B.W. Development of methods to improve soybean yield estimation and predict plant maturity with an unmanned aerial vehicle based platform. Remote Sens. Environ. 2016, 187, 91–101. [Google Scholar] [CrossRef]
  15. Zhang, X.; Zhao, J.; Yang, G.; Liu, J.; Cao, J.; Li, C.; Zhao, X.; Gai, J. Establishment of Plot-Yield Prediction Models in Soybean Breeding Programs Using UAV-Based Hyperspectral Remote Sensing. Remote Sens. 2019, 11, 2752. [Google Scholar] [CrossRef] [Green Version]
  16. Maimaitijiang, M.; Sagan, V.; Sidike, P.; Hartling, S.; Esposito, F.; Fritschi, F.B. Soybean yield prediction from UAV using multimodal data fusion and deep learning. Remote Sens. Environ. 2020, 237, 111599. [Google Scholar] [CrossRef]
  17. Braga, P.; Crusiol, L.G.T.; Nanni, M.R.; Caranhato, A.L.H.; Fuhrmann, M.B.; Nepomuceno, A.L.; Neumaier, N.; Farias, J.R.B.; Koltun, A.; Gonçalves, L.S.A.; et al. Vegetation indices and NIR-SWIR spectral bands as a phenotyping tool for water status determination in soybean. Precis. Agric. 2021, 22, 249–266. [Google Scholar] [CrossRef]
  18. Zhou, Z.; Morel, J.; Parsons, D.; Kucheryavskiy, S.V.; Gustavsson, A.-M. Estimation of yield and quality of legume and grass mixtures using partial least squares and support vector machine analysis of spectral data. Comput. Electron. Agric. 2019, 162, 246–253. [Google Scholar] [CrossRef]
  19. Christenson, B.S.; Schapaugh, W.T.; An, N.; Price, K.P.; Prasad, V.; Fritz, A.K. Predicting Soybean Relative Maturity and Seed Yield Using Canopy Reflectance. Crop Sci. 2016, 56, 625–643. [Google Scholar] [CrossRef] [Green Version]
  20. Weber, V.S.; Araus, J.L.; Cairns, J.E.; Sanchez, C.; Melchinger, A.E.; Orsini, E. Prediction of grain yield using reflectance spectra of canopy and leaves in maize plants grown under different water regimes. Field Crops Res. 2012, 128, 82–90. [Google Scholar] [CrossRef]
  21. Herrmann, I.; Bdolach, E.; Montekyo, Y.; Rachmilevitch, S.; Townsend, P.A.; Karnieli, A. Assessment of maize yield and phenology by drone-mounted superspectral camera. Precis. Agric. 2020, 21, 51–76. [Google Scholar] [CrossRef]
  22. Hansen, P.M.; Jørgensen, J.R.; Thomsen, A. Predicting grain yield and protein content in winter wheat and spring barley using repeated canopy reflectance measurements and partial least squares regression. J. Agric. Sci. 2002, 139, 307–318. [Google Scholar] [CrossRef]
  23. Sharabian, V.R.; Noguchi, N.; Ishi, K. Significant wavelengths for prediction of winter wheat growth status and grain yield using multivariate analysis. Eng. Agric. Environ. Food 2014, 7, 14–21. [Google Scholar] [CrossRef]
  24. Barmeier, G.; Hofer, K.; Schmidhalter, U. Mid-season prediction of grain yield and protein content of spring barley cultivars using high-throughput spectral sensing. Eur. J. Agron. 2017, 90, 108–116. [Google Scholar] [CrossRef]
  25. Zhang, X.; He, Y. Rapid estimation of seed yield using hyperspectral images of oilseed rape leaves. Ind. Crops Prod. 2013, 42, 416–420. [Google Scholar] [CrossRef]
  26. Ancin-Murguzur, F.J.; Taff, G.; Davids, C.; Tømmervik, H.; Mølmann, J.; Jørgensen, M. Yield Estimates by a Two-Step Approach Using Hyperspectral Methods in Grasslands at High Latitudes. Remote Sens. 2019, 11, 400. [Google Scholar] [CrossRef] [Green Version]
  27. Wold, S.; Sjöström, M.; Eriksson, L. PLS-regression: A basic tool of chemometrics. Chemom. Intell. Lab. Syst. 2001, 58, 109–130. [Google Scholar] [CrossRef]
  28. Inoue, Y.; Sakaiya, E.; Zhu, Y.; Takahashi, W. Diagnostic mapping of canopy nitrogen content in rice based on hyperspectral measurements. Remote Sens. Environ. 2012, 126, 210–221. [Google Scholar] [CrossRef]
  29. Li, F.; Mistele, B.; Hu, Y.; Chen, X.; Schmidhalter, U. Reflectance estimation of canopy nitrogen content in winter wheat using optimised hyperspectral spectral indices and partial least squares regression. Eur. J. Agron. 2014, 52, 198–209. [Google Scholar] [CrossRef]
  30. Wrege, M.S.; Steinmetz, S.; Reiser, C., Jr.; de Almeida, I.R. Atlas Climático da Região Sul do Brasil: Estados do Paraná, Santa Catarina e Rio Grande do Sul; Embrapa Clima Temperado: Pelotas, Brazil; Embrapa Florestas: Colombo, Brazil, 2011. [Google Scholar]
  31. Alvares, C.A.; Stape, J.L.; Sentelhas, P.C.; Gonçalves, J.L.D.M.; Sparovek, G. Köppen’s climate classification map for Brazil. Meteorol. Z. 2013, 22, 711–728. [Google Scholar] [CrossRef]
  32. USDA (United States Department of Agriculture)—Natural Resources Conservation Service. Soil Taxonomy: A Basic System of Soil Classification for Making and Interpreting Soil Surveys; USDA: Washington, DC, USA, 1999.
  33. Embrapa Soja. Tecnologias de Produção de Soja–Região Central do Brasil 2014; Embrapa Soja: Londrina, Brazil, 2013. [Google Scholar]
  34. Fehr, W.R.; Caviness, C.E. Stages of Soybean Development; Special Report 80; Iowa State University of Science and Technology: Ames, IA, USA, 1977. [Google Scholar]
  35. Sibaldelli, R.N.R.; Farias, J.R.B. Boletim Agrometeorológico da Embrapa Soja, Londrina, PR–2016; Embrapa Soja: Londrina, Brazil, 2017; Available online: http://www.infoteca.cnptia.embrapa.br/infoteca/handle/doc/1067152 (accessed on 15 June 2020).
  36. Sibaldelli, R.N.R.; Farias, J.R.B. Boletim Agrometeorológico da Embrapa Soja, Londrina, PR–2017; Embrapa Soja: Londrina, Brazil, 2018; Available online: https://www.infoteca.cnptia.embrapa.br/infoteca/handle/doc/1087963 (accessed on 15 June 2020).
  37. Sibaldelli, R.N.R.; Farias, J.R.B. Boletim Agrometeorológico da Embrapa Soja, Londrina, PR–2018; Embrapa Soja: Londrina, Brazil, 2019; Available online: https://www.infoteca.cnptia.embrapa.br/infoteca/bitstream/doc/1109091/1/DOC4111.pdf (accessed on 15 June 2020).
  38. Thornthwaite, C.W.; Mather, J.R. The Water Balance; Laboratory of Climatology: Centerton, AR, USA, 1955. [Google Scholar]
  39. Rumpf, T.; Mahlein, A.-K.; Steiner, U.; Oerke, E.-C.; Dehne, H.-W.; Plümer, L. Early detection and classification of plant diseases with Support Vector Machines based on hyperspectral reflectance. Comput. Electron. Agric. 2010, 74, 91–99. [Google Scholar] [CrossRef]
  40. Mahlein, A.-K.; Steiner, U.; Dehne, H.-W.; Oerke, E.-C. Spectral signatures of sugar beet leaves for the detection and differentiation of diseases. Precis. Agric. 2010, 11, 413–431. [Google Scholar] [CrossRef]
  41. Da Silva, C.A., Jr.; Nanni, M.R.; Shakir, M.; Teodoro, P.E.; De Oliveira, J.F., Jr.; Cézar, E.; De Gois, G.; Lima, M.; Wojciechowski, J.C.; Shiratsuchi, L.S. Soybean varieties discrimination using non-imaging hyperspectral sensor. Infrared Phys. Technol. 2018, 89, 338–350. [Google Scholar] [CrossRef]
  42. Streher, A.S.; da Silva Torres, R.; Morellato, L.P.C.; Silva, T.S.F. Accuracy and limitations for spectroscopic prediction of leaf traits in seasonally dry tropical environments. Remote Sens. Environ. 2020, 244, 111828. [Google Scholar] [CrossRef]
  43. Crusiol, L.G.T.; Nanni, M.R.; Furlanetto, R.H.; Sibaldelli, R.N.R.; Cezar, E.; Sun, L.; Foloni, J.S.S.; Mertz-Henning, L.M.; Nepomuceno, A.L.; Neumaier, N.; et al. Classification of Soybean Genotypes Assessed Under Different Water Availability and at Different Phenological Stages Using Leaf-Based Hyperspectral Reflectance. Remote Sens. 2021, 13, 172. [Google Scholar] [CrossRef]
  44. Schmidt, K.; Skidmore, A. Spectral discrimination of vegetation types in a coastal wetland. Remote Sens. Environ. 2003, 85, 92–108. [Google Scholar] [CrossRef]
  45. Peng, Y.; Fan, M.; Song, J.; Cui, T.; Li, R. Assessment of plant species diversity based on hyperspectral indices at a fine scale. Sci. Rep. 2018, 8, 1–11. [Google Scholar] [CrossRef] [PubMed] [Green Version]
  46. Ferreira, D.F. Sisvar: A computer statistical analysis system. Ciência e Agrotecnologia 2011, 35, 1039–1042. [Google Scholar] [CrossRef] [Green Version]
  47. Yendrek, C.R.; Tomaz, T.; Montes, C.M.; Cao, Y.; Morse, A.M.; Brown, P.J.; McIntyre, L.M.; Leakey, A.D.; Ainsworth, E.A. High-Throughput Phenotyping of Maize Leaf Physiological and Biochemical Traits Using Hyperspectral Reflectance. Plant Physiol. 2017, 173, 614–626. [Google Scholar] [CrossRef]
  48. De Souza, A.M.; Breitkreitz, M.C.; Filgueiras, P.R.; Rohwedder, J.J.R.; Poppi, R.J. Experimento didático de quimiometria para calibração multivariada na determinação de paracetamol em comprimidos comerciais utilizando espectroscopia no infravermelho próximo: Um tutorial, parte II. Química Nova 2013, 36, 1057–1065. [Google Scholar] [CrossRef] [Green Version]
  49. Nogueira, S.D.S.S.; Nagai, V. Deficiência hídrica simulada nos diferentes estádios de desenvolvimento de um cultivar precoce de soja. Bragantia 1988, 47, 9–14. [Google Scholar] [CrossRef]
  50. Rolla, A.A.D.P.; Carvalho, J.D.F.C.; Fuganti-Pagliarini, R.; Engels, C.; Rio, A.D.; Marin, S.R.R.; De Oliveira, M.C.N.; Beneventi, M.A.; Marcelino-Guimarães, F.C.; Farias, J.R.B.; et al. Phenotyping soybean plants transformed with rd29A:AtDREB1A for drought tolerance in the greenhouse and field. Transgenic Res. 2013, 23, 75–87. [Google Scholar] [CrossRef]
  51. Carvalho, J.D.F.C.; Crusiol, L.G.T.; Perini, L.J.; Sibaldelli, R.N.R.; Ferreira, L.C.; Marcelino-Guimarães, F.C.; Nepomuceno, A.L.; Neumaier, N.; Farias, J.R.B. Phenotyping Soybeans for Drought Responses Using Remote Sensing Techniques and Non-Destructive Physiological Analysis. Glob. Sci. Technol. 2015, 8, 1–16. [Google Scholar] [CrossRef] [Green Version]
  52. Crusiol, L.G.T.; Carvalho, J.D.F.C.; Sibaldelli, R.N.R.; Neiverth, W.; Rio, A.D.; Ferreira, L.C.; Procópio, S.D.O.; Mertz-Henning, L.M.; Nepomuceno, A.L.; Neumaier, N.; et al. NDVI variation according to the time of measurement, sampling size, positioning of sensor and water regime in different soybean cultivars. Precis. Agric. 2016, 18, 470–490. [Google Scholar] [CrossRef] [Green Version]
  53. Damm, A.; Paul-Limoges, E.; Haghighi, E.; Simmer, C.; Morsdorf, F.; Schneider, F.; Van Der Tol, C.; Migliavacca, M.; Rascher, U. Remote sensing of plant-water relations: An overview and future perspectives. J. Plant Physiol. 2018, 227, 3–19. [Google Scholar] [CrossRef] [PubMed]
  54. Maimaitiyiming, M.; Miller, A.J.; Ghulam, A. Discriminating Spectral Signatures among and within Two Closely Related Grapevine Species. Photogramm. Eng. Remote Sens. 2016, 82, 51–62. [Google Scholar] [CrossRef] [Green Version]
  55. Simlat, M.; Ślęzak, P.; Moś, M.; Warchoł, M.; Skrzypek, E.; Ptak, A. The effect of light quality on seed germination, seedling growth and selected biochemical properties of Stevia rebaudiana Bertoni. Sci. Hortic. 2016, 211, 295–304. [Google Scholar] [CrossRef]
  56. Falcioni, R.; Moriwaki, T.; Pattaro, M.; Furlanetto, R.H.; Nanni, M.R.; Antunes, W.C. High resolution leaf spectral signature as a tool for foliar pigment estimation displaying potential for species differentiation. J. Plant Physiol. 2020, 249, 153161. [Google Scholar] [CrossRef]
  57. Merzlyak, M.N.; Melø, T.B.; Naqvi, K.R. Effect of anthocyanins, carotenoids, and flavonols on chlorophyll fluorescence excitation spectra in apple fruit: Signature analysis, assessment, modelling, and relevance to photoprotection. J. Exp. Bot. 2008, 59, 349–359. [Google Scholar] [CrossRef] [PubMed]
  58. Gitelson, A.; Solovchenko, A. Non-invasive quantification of foliar pigments: Possibilities and limitations of reflectance- and absorbance-based approaches. J. Photochem. Photobiol. B Biol. 2018, 178, 537–544. [Google Scholar] [CrossRef]
  59. Gitelson, A.; Chivkunova, O.; Zhigalova, T.; Solovchenko, A. In situ optical properties of foliar flavonoids: Implication for non-destructive estimation of flavonoid content. J. Plant Physiol. 2017, 218, 258–264. [Google Scholar] [CrossRef] [PubMed]
  60. Gould, K.S.; Jay-Allemand, C.; Logan, B.A.; Baissac, Y.; Bidel, L.P. When are foliar anthocyanins useful to plants? Re-evaluation of the photoprotection hypothesis using Arabidopsis thaliana mutants that differ in anthocyanin accumulation. Environ. Exp. Bot. 2018, 154, 11–22. [Google Scholar] [CrossRef]
  61. Marinho, J.P.; Kanamori, N.; Ferreira, L.C.; Fuganti-Pagliarini, R.; Carvalho, J.D.F.C.; Freitas, R.A.; Marin, S.R.R.; Rodrigues, F.A.; Mertz-Henning, L.M.; Farias, J.R.B.; et al. Characterization of Molecular and Physiological Responses under Water Deficit of Genetically Modified Soybean Plants Overexpressing the AtAREB1 Transcription Factor. Plant Mol. Biol. Rep. 2015, 34, 410–426. [Google Scholar] [CrossRef]
  62. Honna, P.T.; Fuganti-Pagliarini, R.; Ferreira, L.C.; Molinari, M.D.C.; Marin, S.R.R.; De Oliveira, M.C.N.; Farias, J.R.B.; Neumaier, N.; Mertz-Henning, L.M.; Kanamori, N.; et al. Molecular, physiological, and agronomical characterization, in greenhouse and in field conditions, of soybean plants genetically modified with AtGolS2 gene for drought tolerance. Mol. Breed. 2016, 36, 157. [Google Scholar] [CrossRef] [Green Version]
  63. Daughtry, C.S.T.; Gallo, K.P.; Goward, S.N.; Prince, S.D.; Kustas, W.P. Spectral estimates of absorbed radiation and phytomass production in corn and soybean canopies. Remote Sens. Environ. 1992, 39, 141–152. [Google Scholar] [CrossRef]
  64. Roujean, J.-L.; Breon, F.-M. Estimating PAR absorbed by vegetation from bidirectional reflectance measurements. Remote Sens. Environ. 1995, 51, 375–384. [Google Scholar] [CrossRef]
  65. Singer, J.W.; Meek, D.W.; Sauer, T.J.; Prueger, J.H.; Hatfield, J.L. Variability of light interception and radiation use efficiency in maize and soybean. Field Crop. Res. 2011, 121, 147–152. [Google Scholar] [CrossRef]
  66. Gitelson, A.A.; Peng, Y.; Arkebauer, T.J.; Suyker, A.E. Productivity, absorbed photosynthetically active radiation, and light use efficiency in crops: Implications for remote sensing of crop primary production. J. Plant Physiol. 2015, 177, 100–109. [Google Scholar] [CrossRef] [Green Version]
  67. Gitelson, A.A. Remote estimation of fraction of radiation absorbed by photosynthetically active vegetation: Generic algorithm for maize and soybean. Remote Sens. Lett. 2018, 10, 283–291. [Google Scholar] [CrossRef]
  68. Moriwaki, T.; Falcioni, R.; Tanaka, F.A.O.; Cardoso, K.A.K.; Souza, L.A.; Benedito, E.; Nanni, M.R.; Bonato, C.M.; Antunes, W.C. Nitrogen-improved photosynthesis quantum yield is driven by increased thylakoid density, enhancing green light absorption. Plant Sci. 2019, 278, 1–11. [Google Scholar] [CrossRef]
  69. Manjunath, K.R.; Ray, S.S.; Panigrahy, S. Discrimination of Spectrally-Close Crops Using Ground-Based Hyperspectral Data. J. Indian Soc. Remote Sens. 2011, 39, 599–602. [Google Scholar] [CrossRef]
  70. Sahoo, R.N.; Ray, S.S.; Manjunath, K.R. Hyperspectral Remote Sensing of Agriculture. Curr. Sci. 2015, 108, 848–859. [Google Scholar]
  71. Gates, D.M.; Keegan, H.J.; Schleter, J.C.; Weidner, V.R. Spectral Properties of Plants. Appl. Opt. 1965, 4, 11–20. [Google Scholar] [CrossRef]
  72. Latimer, P. Apparent Shifts of Absorption Bands of Cell Suspensions and Selective Light Scattering. Science 1958, 127, 29–30. [Google Scholar] [CrossRef] [PubMed]
  73. Ustin, S.L.; Jacquemoud, S.; Govaerts, Y. Simulation of photon transport in a three-dimensional leaf: Implications for photosynthesis. Plant Cell Environ. 2001, 24, 1095–1103. [Google Scholar] [CrossRef] [Green Version]
  74. Gao, B.C. NDWI—A normalized difference water index for remote sensing of vegetation liquid water from space. Remote Sens. Environ. 1996, 58, 257–266. [Google Scholar] [CrossRef]
  75. Wang, L.; Qu, J.J. NMDI: A normalized multi-band drought index for monitoring soil and vegetation moisture with satellite remote sensing. Geophys. Res. Lett. 2007, 34, 20405. [Google Scholar] [CrossRef]
  76. Wang, J.; Xu, R.; Yang, S. Estimation of plant water content by spectral absorption features centered at 1450 nm and 1940 nm regions. Environ. Monit. Assess. 2008, 157, 459–469. [Google Scholar] [CrossRef]
  77. Zhang, Z.; Tang, B.-H.; Li, Z.-L. Retrieval of leaf water content from remotely sensed data using a vegetation index model constructed with shortwave infrared reflectances. Int. J. Remote Sens. 2018, 40, 2313–2323. [Google Scholar] [CrossRef]
  78. Kross, A.; Znoj, E.; Callegari, D.; Kaur, G.; Sunohara, M.; Lapen, D.R.; McNairn, H. Using Artificial Neural Networks and Remotely Sensed Data to Evaluate the Relative Importance of Variables for Prediction of Within-Field Corn and Soybean Yields. Remote Sens. 2020, 12, 2230. [Google Scholar] [CrossRef]
  79. Carneiro, F.M.; Furlani, C.E.A.; Zerbato, C.; De Menezes, P.C.; Gírio, L.A.D.S.; De Oliveira, M.F. Comparison between vegetation indices for detecting spatial and temporal variabilities in soybean crop using canopy sensors. Precis. Agric. 2019, 21, 979–1007. [Google Scholar] [CrossRef]
  80. Ferrio, J.; Villegas, D.; Zarco, J.; Aparicio, N.; Araus, J.; Royo, C. Assessment of durum wheat yield using visible and near-infrared reflectance spectra of canopies. Field Crop. Res. 2005, 94, 126–148. [Google Scholar] [CrossRef]
  81. Øvergaard, S.I.; Isaksson, T.; Kvaal, K.; Korsaeth, A. Comparisons of Two Hand-Held, Multispectral Field Radiometers and a Hyperspectral Airborne Imager in Terms of Predicting Spring Wheat Grain Yield and Quality by Means of Powered Partial Least Squares Regression. J. Near Infrared Spectrosc. 2010, 18, 247–261. [Google Scholar] [CrossRef]
  82. Fuganti-Pagliarini, R.; Ferreira, L.C.; Rodrigues, F.A.; Molinari, H.B.C.; Marin, S.R.R.; Molinari, M.D.C.; Marcolino-Gomes, J.; Mertz-Henning, L.M.; Farias, J.R.B.; De Oliveira, M.C.N.; et al. Characterization of Soybean Genetically Modified for Drought Tolerance in Field Conditions. Front. Plant Sci. 2017, 8, 448. [Google Scholar] [CrossRef] [Green Version]
  83. Stolf-Moreira, R.; Lemos, E.G.M.; Carareto-Alves, L.; Marcondes, J.; Pereira, S.S.; Rolla, A.A.P.; Pereira, R.M.; Neumaier, N.; Binneck, E.; Abdelnoor, R.V.; et al. Transcriptional Profiles of Roots of Different Soybean Genotypes Subjected to Drought Stress. Plant Mol. Biol. Rep. 2010, 29, 19–34. [Google Scholar] [CrossRef]
Figure 1. Experimental area overview (a) and description of weather station and treatment plots (b): irrigated (IRR), non-irrigated (NIRR) and water deficit induced at vegetative (WDV) and reproductive (WDR) stages. RGB image obtained by an UAV carrying a regular digital camera.
Remotesensing 13 00977 g001
Figure 2. Spectral assessment in field (a,b) and detail of the plant probe device (c). Photo by Décio de Assis—Embrapa Soja.
Remotesensing 13 00977 g002
Figure 3. Climatic water balance at 10-day periods in the WDV (a), WDR (b), NIRR (c) and IRR (d) treatments in 2016/2017 cropping season; WDV (e), WDR (f), NIRR (g) and IRR (h) treatments in the 2017/2018 cropping season; WDV (i), WDR (j), NIRR (k) and IRR (l) treatments in 2018/2019 cropping season.
Remotesensing 13 00977 g003
Figure 4. Soil moisture content (%) at 0–20 cm and 20–40 cm depths in the 2016/2017, 2017/2018 and 2018/2019 cropping seasons at the transition between vegetative and re-productive stages (a) and close to maturity period (b). Means followed by the same letter among treatments within each depth and on each date do not differ by Tukey’s test (p ≤ 0.05).
Remotesensing 13 00977 g004
Figure 5. Soybean yield in the 2016/2017, 2017/2018 and 2018/2019 cropping seasons (kg ha−1). Means followed by the same letter do not differ by Tukey test (p ≤ 0.05).
Remotesensing 13 00977 g005
Figure 6. Average spectral response of soybean genotypes on irrigated (IRR) and water deficit induced at reproductive stages (WDR) treatments at 107 DAS in the 2018/2019 cropping season.
Remotesensing 13 00977 g006
Figure 7. Boxplot of soybean grain yield in the 2016/2017, 2017/2018 and 2018/2019 cropping seasons and all data (all cropping seasons).
Remotesensing 13 00977 g007
Figure 8. Correlation between observed and predicted (external validation) values of soybean grain yield through PLSR.
Remotesensing 13 00977 g008
Figure 9. Regression coefficients of PLSR for soybean grain yield prediction at R5 stage.
Remotesensing 13 00977 g009
Table 1. Soil characteristics of the experimental area.
pHH++Al3+Al3+Ca2+Mg2+K+CTCPCSBV%Clay
H2Ocmolc dm−3mg dm−3g dm−3 g kg−1
4.93.50.033.91.80.710.024.215.66.564.8710
Table 2. Sowing dates and periods of inducement of water deficit at the vegetative and reproductive periods (expressed in days after sowing—DAS) during the 2016/2017, 2017/2018 and 2018/2019 cropping seasons.
Cropping SeasonSowingWater Deficit Induced at Vegetative StagesWater Deficit Induced at Reproductive StagesHarvesting Period
2016/201719 October 2016From 37 DAS to 54 DASFrom 54 DAS to the harvesting periodFrom 116 DAS
2017/201818 October 2017From 33 DAS to 62 DASFrom 62 DAS to the harvesting periodFrom 139 DAS
2018/201916 October 2018From 41 DAS to 64 DASFrom 41 DAS to 90 DASFrom 129 DAS
Table 3. Irrigation schedule in the 2016/2017 and 2018/2019 cropping seasons.
Cropping SeasonDays after SowingAmount (mm)Length (min)
2016/20172414.460
294.820
307.230
319.640
344.820
354.820
364.820
374.820
3814.460
2018/20195214.460
5314.460
5711.548
585.724
595.724
618.435
662.912
1067.230
1098.435
11411.548
1152.912
1168.435
1194.820
Table 4. Description of days of spectral assessment (expressed in days after sowing—DAS) and number of spectral samples in the 2016/2017, 2017/2018 and 2018/2019 cropping seasons.
2016/2017 Cropping Season2017/2018 Cropping Season2018/2019 Cropping Season
DASSpectral SamplesDASSpectral SamplesDASSpectral Samples
286429804180
336437805080
446442805780
576457806480
696478807980
896496808780
11260106809480
--1138010180
----10780
Table 5. Statistical parameters of partial least squares regression (PLSR) for soybean grain yield prediction in the 2016/2017, 2017/2018 and 2018/2019 cropping seasons, on each day of spectral assessment (expressed in days after sowing—DAS).
Cropping SeasonDays after SowingSpectral SamplesRc2 Rcv2 RMSEc (kg ha−1)RMSEcv (kg ha−1)RMSEc
%
RMSEcv
%
BIAScv
2016/201728640.1680.088588.43625.7219.9621.227.286
33640.1340.083600.12627.5520.3621.290.854
44640.4070.105496.77619.9116.8521.036.646
57640.5730.316421.44541.8314.2918.384.036
69640.6410.529386.42449.3613.1115.247.225
89640.7310.595334.11416.8111.3314.14−6.651
112600.6110.590403.51421.2913.6914.294.686
2017/201829800.5100.265893.461108.9619.7624.52−12.929
37800.4400.189955.691164.5221.1325.75−13.176
42800.6010.314806.251070.6717.8323.677.477
57800.1590.1671171.351180.3725.9026.1032.699
78800.9130.881374.97445.108.299.842.867
96800.9240.885351.49437.227.779.675.618
106800.9210.866358.21473.197.9210.463.037
113800.8470.842498.32513.2411.0211.353.300
2018/201941800.5420.329826.841014.0418.2322.36−0.107
50800.2510.0941057.831178.0123.3225.97−0.942
57800.7510.494609.89880.6013.4519.41−6.239
64800.8580.443460.64923.3210.1620.36−2.539
79800.8680.801443.18551.149.7712.152.740
87800.8710.775437.76586.239.6512.92−8.600
94800.8910.810403.59538.478.9011.87−7.726
101800.7390.681624.04698.4913.7615.403.671
107800.8390.733489.73638.7810.8014.081.618
c. Calibration step. cv. Cross-validation step.
Table 6. Statistical parameters of PLSR for soybean grain yield prediction at the R5 phenological stage.
PLSRR2RMSE (kg ha−1)RMSE%BIAS
Calibration0.775574.5211.38-
Cross-validation0.730634.4412.57−4.941
External validation0.688622.4613.34-
Table 7. Statistical parameters of PLSR for soybean grain yield prediction at R5 phenological stage under the four experimental treatments (water availability) evaluated.
TreatmentSpectral SamplesRc2Rcv2RMSEc (kg ha−1)RMSEcv (kg ha−1)RMSEc%RMSEcv % BIAScv
IRR360.6220.315453.72628.6116.6823.11−24.25
NIRR760.6910.625378.62422.7913.1114.644.79
WDV560.8120.738367.04441.8311.0613.324.07
WDR560.7950.624298.39412.2011.3315.65−16.60
c. Calibration step. cv. Cross-validation step.
Publisher’s Note: MDPI stays neutral with regard to jurisdictional claims in published maps and institutional affiliations.

