Article

Mission-Long Recalibrated Science Quality Suomi NPP VIIRS Radiometric Dataset Using Advanced Algorithms for Time Series Studies

1
NOAA/NESDIS/Center for Satellite Applications and Research, College Park, MD 20740, USA
2
Cooperative Institute for Satellite Earth System Studies (CISESS), University of Maryland/CISESS, College Park, MD 20740, USA
3
Global Science and Technology, College Park, MD 20740, USA
*
Author to whom correspondence should be addressed.
Submission received: 10 February 2021 / Revised: 9 March 2021 / Accepted: 9 March 2021 / Published: 12 March 2021

Abstract

:
Suomi NPP has been successfully operating since its launch on 28 October 2011. As one of the major payloads, along with microwave and infrared sounders (Advanced Technology Microwave Sounder (ATMS), Cross-track Infrared Sounder (CrIS)), and ozone mapping/profiling (OMPS) instruments, the Visible Infrared Imaging Radiometer Suite (VIIRS) has performed for well beyond its mission design life. Its data have been used for a variety of applications for nearly 30 environmental data products, including global imagery twice daily with 375 and 750 m resolutions, clouds, aerosol, cryosphere, ocean color and sea-surface temperature, a number of land products (vegetation, land-cover, fire and others), and geophysical and social economic studies with nightlights. During the early days of VIIRS operational calibration and data production, there were inconsistencies in both algorithms and calibration inputs, for several reasons. While these inconsistencies have less impact on nowcasting and near real-time applications, they introduce challenges for time series analysis due to calibration artifacts. To address this issue, we developed a comprehensive algorithm, and recalibrated and reprocessed the Suomi NPP VIIRS radiometric data that have been produced since the launch. In the recalibration, we resolved inconsistencies in the processing algorithms, terrain correction, straylight correction, and anomalies in the thermal bands. To improve the stability of the reflective solar bands, we developed a Kalman filtering model to incorporate onboard solar, lunar, desert site, inter-satellite calibration, and a deep convective cloud calibration methodology. We further developed and implemented the Solar Diffuser Surface Roughness Rayleigh Scattering model to account for the sensor responsivity degradation in the near infrared bands. The recalibrated dataset was validated using vicarious sites and alternative methods, and compared with independent processing from other organizations. The recalibrated radiometric dataset (namely, the level 1b or sensor data records) also incorporates a bias correction for the reflective solar bands, which not only addresses known calibration biases, but also allows alternative calibrations to be applied if so desired. The recalibrated data have been proven to be of high quality, with much improved stability (better than 0.3%) and accuracy (by up to 2%). The recalibrated radiance data are now available from 2012 to 2020 for users and will eventually be archived on the NOAA CLASS database.

Graphical Abstract

1. Introduction

Suomi NPP has been operating successfully since its launch on 28 October 2011. VIIRS is one of the major payloads, along with Advanced Technology Microwave Sounder (ATMS), Cross-track Infrared Sounder (CrIS), and Ozone Mapping/Profiling (OMPS) instruments. VIIRS data have been used for a variety of applications including nearly 30 environmental data products [1] such as global imagery twice daily with 375 and 750 m resolution, cloud properties, aerosol, cryosphere, ocean color, sea-surface temperature, a number of land products (vegetation, land-cover, fire and others), as well as nighttime products for geophysical (nighttime aerosols, air glow) and social economic studies (light outage, correlation with gross domestic product). However, in the early days of VIIRS operational calibration and data production, there were inconsistencies in both algorithms and calibration inputs, for several reasons. This is further entangled with the unexpected rapid telescope mirror throughput degradation due to prelaunch contamination with tungsten oxide [2], for which several measures were implemented to mitigate its impacts on calibration, including the implementation of the RSBAutocal in the operations [3]. In addition, the Suomi NPP VIIRS reflective solar band calibration in the operations uses an outdated solar irradiance model [4], which becomes inconsistent with the later NOAA-20 calibration, which uses the Thuillier 2003 solar irradiance model [5].
Among the VIIRS radiometric performance requirements, the absolute radiometric accuracy for the reflective solar bands is specified as +/−2% (1 sigma), which is in line with that of the MODIS [6,7]. Separately, there is also the stability requirement, which states:
“The VIIRS instrument response to input radiance shall not change by more than 0.1% for the emissive bands and 0.3% for the reflective bands during the time between successive acquisitions of on-orbit calibration data.” [8].
The above VIIRS calibration requirements are derived from the Key Performance Parameters (KPPs) requirements. KPPs are system attributes that represent those minimum capabilities or characteristics considered most essential to achieve an effective system. Failure to meet a KPP attribute threshold may result in a reevaluation of the program. The KPPs for VIIRS are:
For latitudes greater than 60°N in the Alaskan region, VIIRS Imagery EDRs at 0.64 µm (I1), 1.61 µm (I3), 3.74 µm (I4), 11.45 µm (I5), 8.55 µm (M14), 10.763 µm (M15), 12.03 µm (M16), and the 0.7 µm (DNB) Near-Constant Contrast (NCC) EDR [9].
However, these requirements were written from an operational product generation perspective, which relies heavily on operational forecasting and modeling for weather and ocean. In reality, the retrieval of several environmental products requires much more stringent calibration stability and absolute accuracy. For example, ocean color, aerosol, and vegetation require time series analysis with several months or years of extremely stable data in order to detect changes or anomalies. These types of studies use very sensitive algorithms with historical data and look for subtle changes in the time series or climatology. In addition, the stability and accuracy requirements for climate change studies are even more challenging [10], and this has led to the dedicated satellite missions of Climate Absolute Radiance and Refractivity Observatory (CLARREO) and TRUTH [11,12,13]. Therefore, calibration stability and accuracy are critical for these types of studies. From this perspective, the inconsistencies and artifacts in the operational Suomi NPP VIIRS data significantly impact their use. Thus, there is a fundamental need for recalibration.
To address these issues, we have studied all relevant algorithms and methodologies in satellite calibration, developed a comprehensive algorithm and recalibrated the VIIRS radiometric data that have been recorded since launch. In the recalibration, we took into account all aspects of calibration that may affect the data quality, including inconsistencies in the processing algorithms, terrain correction, straylight correction and anomalies in the thermal bands (discussed in detail in Section 2). To improve the stability of the reflective solar bands, we synthesized all calibration and validation methodologies and results, and developed a Kalman filtering model to incorporate onboard solar, lunar, desert site, inter-satellite calibration, and deep convective-cloud-based calibrations. We further developed and implemented the solar diffuser Surface Roughness Rayleigh Scattering (SRRS) model to account for the degradation in the near infrared bands, which the solar diffuser stability monitor does not cover. The recalibrated dataset was validated using vicarious sites and alternative methods, and compared with independent processing from other organizations. The recalibrated sensor data records or level 1b radiance data incorporate a bias correction, which addresses all known biases, and also allows alternative calibrations to be derived if so desired. The recalibrated data have been proven to be very stable, and the algorithm is novel and robust. The recalibrated radiance data, which were processed with a high-performance computing system (Appendix A), are now available from 2012 to 2020, on request, for users, and will eventually be archived in the NOAA Comprehensive Large Array-data Stewardship System (CLASS) database [14].

2. Past VIIRS Recalibration Efforts

Several studies have attempted to recalibrate the Suomi NPP VIIRS sensor data records [3,15,16,17,18]). During the first few years after the launch of the Suomi NPP satellite, radiometric and geolocation calibration of the VIIRS SDR operational products from NOAA Interface Data Processing Segment (IDPS) was improved multiple times [15,16,17]. The main goal of the early reprocessing efforts was to apply the improved operational calibration to the VIIRS data acquired since the Suomi NPP launch. For the reflective solar bands (RSB), as well as for the day/night band (DNB), the primary issue was the correction of the VIIRS telescope throughput degradation detected shortly after launch. That continuing degradation required the implementation of an automated solar calibration procedure, which was applied in the Sensor Data Record (SDR) production by the end of 2015 [3], and the initial reprocessing allowed for the validation of the automated approach. For the thermal emissive bands (TEB), the initial emphasis was on consistency between the radiance and brightness temperature products, followed by improvements in the calibration during the onboard blackbody warm-up/cool-down tests that were then conducted for 2–3 days every 3 months [19,20]. For the VIIRS Day/Night Band (DNB), calibration improvements included corrections of the spectral response changes due to the telescope degradation, consistent derivation and application of the dark offset and gain ratio parameters, as well as the stray light corrections that have been affecting DNB near the day/night terminator since the Suomi NPP launch. Geolocation improvements involved the initial removal of biases after launch and adjustments made after scan-controller-configuration changes, and a star tracker realignment in 2012 and 2013 [21]. These early reprocessing results formed a baseline, on which further enhancements of the VIIRS SDR radiometric and geolocation products were built.
Extensive studies were carried out on further improving the VIIRS reflective solar band calibration. In 2015 [22], it was recognized that the operationally produced VIIRS SDR solely relied on onboard solar diffuser calibration, and did not incorporate lunar calibration, which revealed residual degradation in the operational products. There had been user-oriented requests of the entire mission lifetime recalibration to improve initial calibration changes, mid-mission anomalies, and calibration updates. On top of these improvements, the on-orbit calibration coefficients in the Reflective Solar Bands (RSBs), called the F-factors, calculated from the Solar Diffuser (SD) observations, were gradually deviating from the lunar F-factors that were calculated from the monthly scheduled lunar observations [22,23,24,25]. These SD and lunar F-factor differences were observed by other teams and the differences in the SD and lunar calibrations were well documented [22,23,25]. Table 1 summarizes the calibration algorithms which are used in the production of VIIRS SDR. The NOAA Ocean Color (OC) team initially applied corrections from SD to lunar trends, recognizing that the lunar provided more accurate sensor degradation than SD [26]. For the short wavelength bands (M1–M4), the OC team’s operational calibration coefficients were fitted to the long-term trends of the lunar F-factors, and were named “hybrid calibration coefficients”; this was validated against the long-term water leaving radiance trends from the Marine Optical Buoy (MOBY) data [26].
Separately, the NASA VIIRS Calibration Support Team (VCST) developed an independent on-orbit VIIRS calibration using a different SD degradation at the Rotating Telescope Assembly (RTA) angle to the solar diffuser (SD) surface (H-RTA) [28,29]. The study assumed that the long-term SD and F-factor differences were caused by the solar diffuser stability monitor (SDSM) and the RTA SD view vector differences in the SD surface normal and the solar vectors. In addition, they developed a simple phenomenological model to correct the annual oscillations and the differences between the SD and lunar F-factors. The number of corrections was slightly different among all the teams of NASA VCST, NOAA VIIRS team, and NOAA OC team, and the differences were summarized in a study [18].
Since the OC team’s hybrid calibration coefficients were optimized for their use (low reflectance range for ocean-color applications), they may not produce the best results for other Environment Data Record (EDR) teams, where the reflectance is significantly higher. In this situation, the NOAA VIIRS team developed a baseline VIIRS calibration, which is described in the official VIIRS Algorithm Theoretical Basis Document (ATBD), and used version 1 products for reprocessing [30]. The official implementation of the ATBD-based VIIRS calibration was implemented to RSBAutoCal as a baseline RSB-reprocessing calibration version 1 [8,15]. For VIIRS on-orbit automatic radiometric calibration, the RSBAutoCal is currently included in the Algorithm Development Library (ADL) package, and it is also a part of the NOAA’s operational Interface Data Processing Segment (IDPS) [31]. The version 1 S-NPP recalibrated datasets were produced by an offline software package called ADL version 4.2 with Mx 8.11, which includes accumulative updates over five years, such as early mission calibration updates, H-factor changes in 2014, c-coefficient update [32], and solar vector reference change [33].

3. Current Recalibration Methodology, Algorithms, and Improvements

This section may be divided by subheadings. It should provide a concise and precise description of the experimental results, their interpretation, and the experimental conclusions that can be drawn.

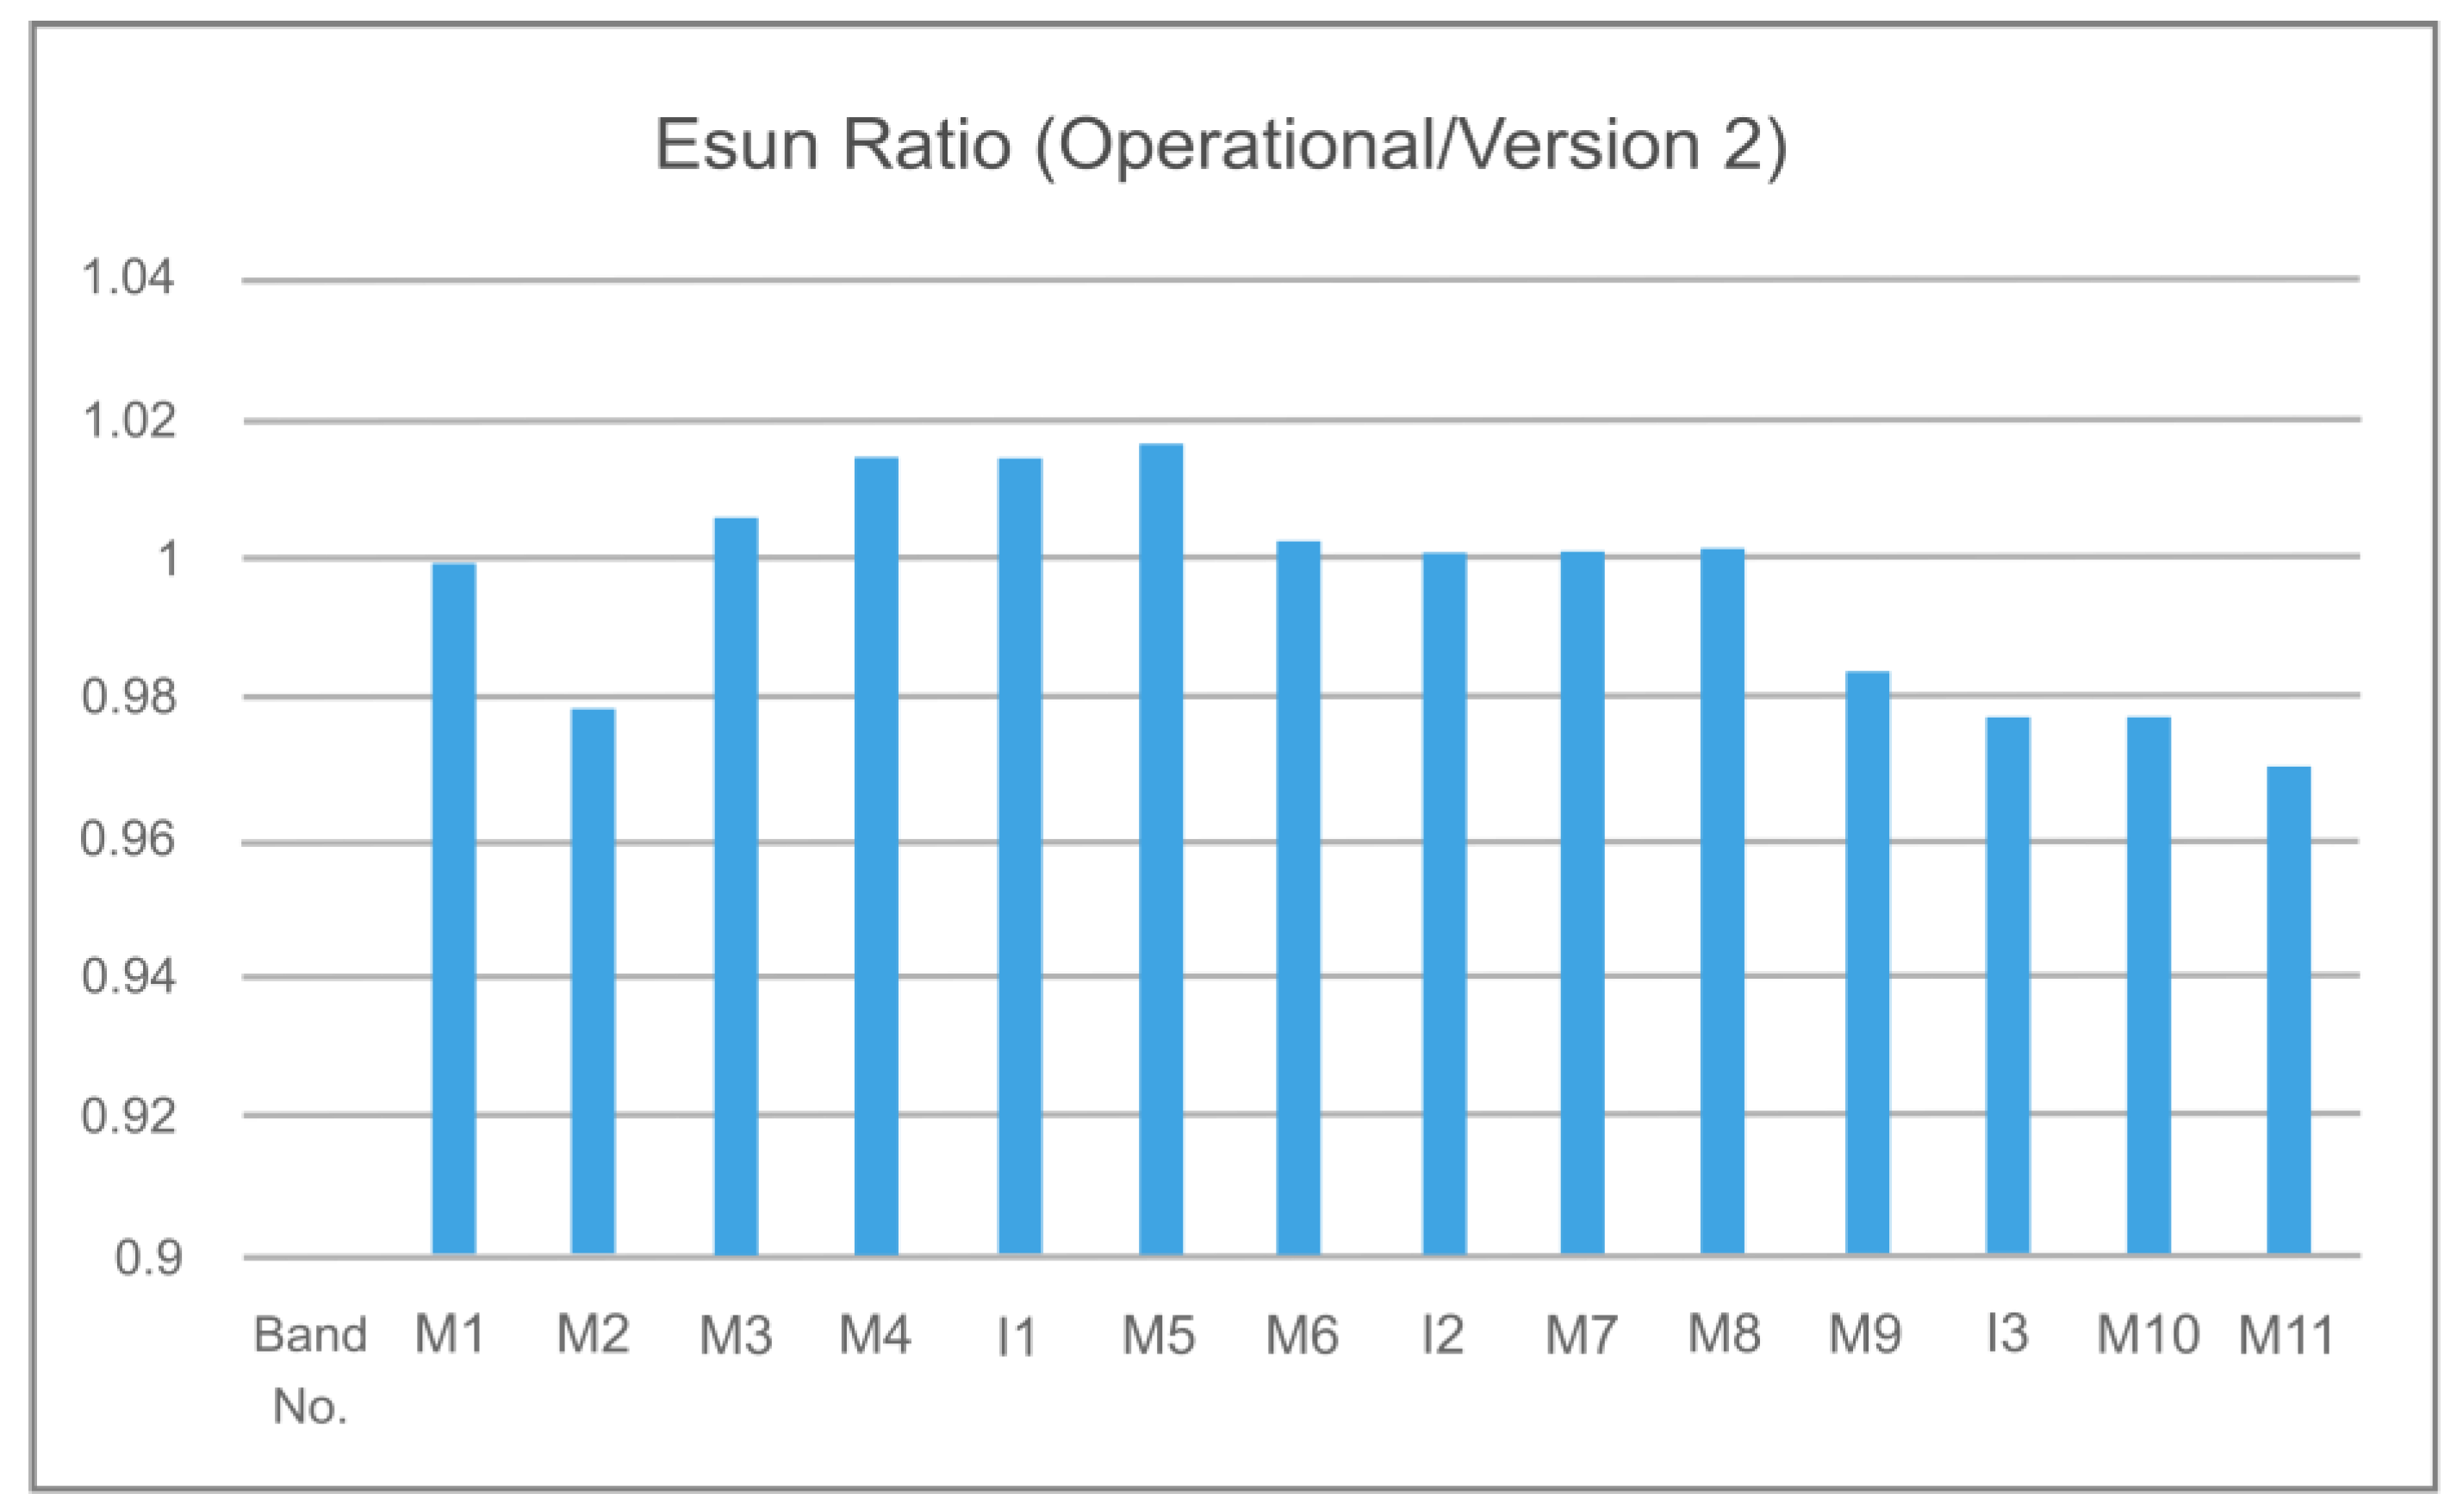
3.1. Improvements in Absolute Radiometric Accuracy

While there may be many different definitions of absolute radiometric accuracy, in this paper, we define it as the uncertainty of the VIIRS radiometric measurement relative to the International Systems of Unit (SI) traceable absolute radiometric source, which is typically characterized during prelaunch calibration against a national laboratory standard source and validated on-orbit. Traceability is the property of a measurement result, whereby the result can be related to a reference through a documented unbroken chain of calibrations, each contributing to the measurement uncertainty (BIPM, https://www.bipm.org/en/bipm-services/calibrations/traceability.html, accessed on 31 August 2020). Absolute radiometric accuracy is one of the key performance parameters for all satellite radiometers. Compared to the thermal emissive bands and DNB, the RSB is the most complex and challenging in terms of improving the radiometric accuracy and stability. In this section, we focus on the RSB improvements in the latest version of reprocessing, which involves a major change in the calibration algorithm and methodology. We then discuss the incremental improvements in the TEB and DNB.
Three major issues related to absolute accuracy were revealed in previous studies: (1) The solar irradiance model used in the operational processing and earlier reprocessing was outdated, as shown in Figure 1 [4]; (2) Based on validation and user feedback, there are radiometric biases in the M5 and M7 (I2 as well, but not I1) bands, which are about 2% higher than what they should be based on comparisons with MODIS and independent observations; (3) The latest comparison with NOAA-20 shows that Suomi NPP VIIRS measured reflectance are higher than those of NOAA-20 bands by 2% or more for all solar bands.
Although the bias resulting from the use of different solar irradiance models only affects the radiance measurements, not reflectance, if computed correctly, it causes problems in radiance-based inter-sensor comparisons. In the recalibration, this discrepancy was resolved by consistently using the Thuillier 2003 solar irradiance model. As a result, the radiometric consistency with other instruments, such as NOAA-20 VIIRS, has been improved by up to 3% for some channels in the recalibrated SDR data. The M5 and M7 radiometric biases were discovered by multiple users (both NOAA and NASA Cloud and Aerosol teams) and independently verified by the VIIRS SDR team at desert sites [4,34,35,36]. In the recalibration, this issue has been addressed, as discussed in Section 4.

3.2. Improvements in Long-Term Radiometric Stability

As is discussed in Section 1, the radiometric stability requirement of 0.3% is much more stringent than the absolute calibration accuracy (+/−2%). These two measures go hand in hand. Assuming that absolute calibration accuracy is established at a few checkpoints (such as prelaunch SI traceable calibration), a stable calibration is essential to ensure the calibration accuracy in the time series of the measurements on-orbit.
Historically, the stability of the RSB relied on the onboard solar diffuser, and was independently verified with vicarious calibration. However, in recent years, it was found that residual degradation, and imprecise characterization of the onboard calibration system, can lead to drifts in the calibrated radiances. As a result, a number of methods have been used to ensure the stability of the calibration. This includes the dedicated monthly lunar calibration for VIIRS, and vicarious calibration using deep convective clouds, and desert sites, as well as cross-calibration with other stable satellite measurements at the simultaneous nadir overpasses. Table 2 summarizes the various calibration methods, as well as their pros and cons for ensuring stable and accurate calibrated radiances.

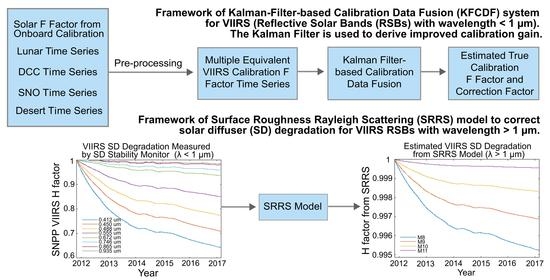
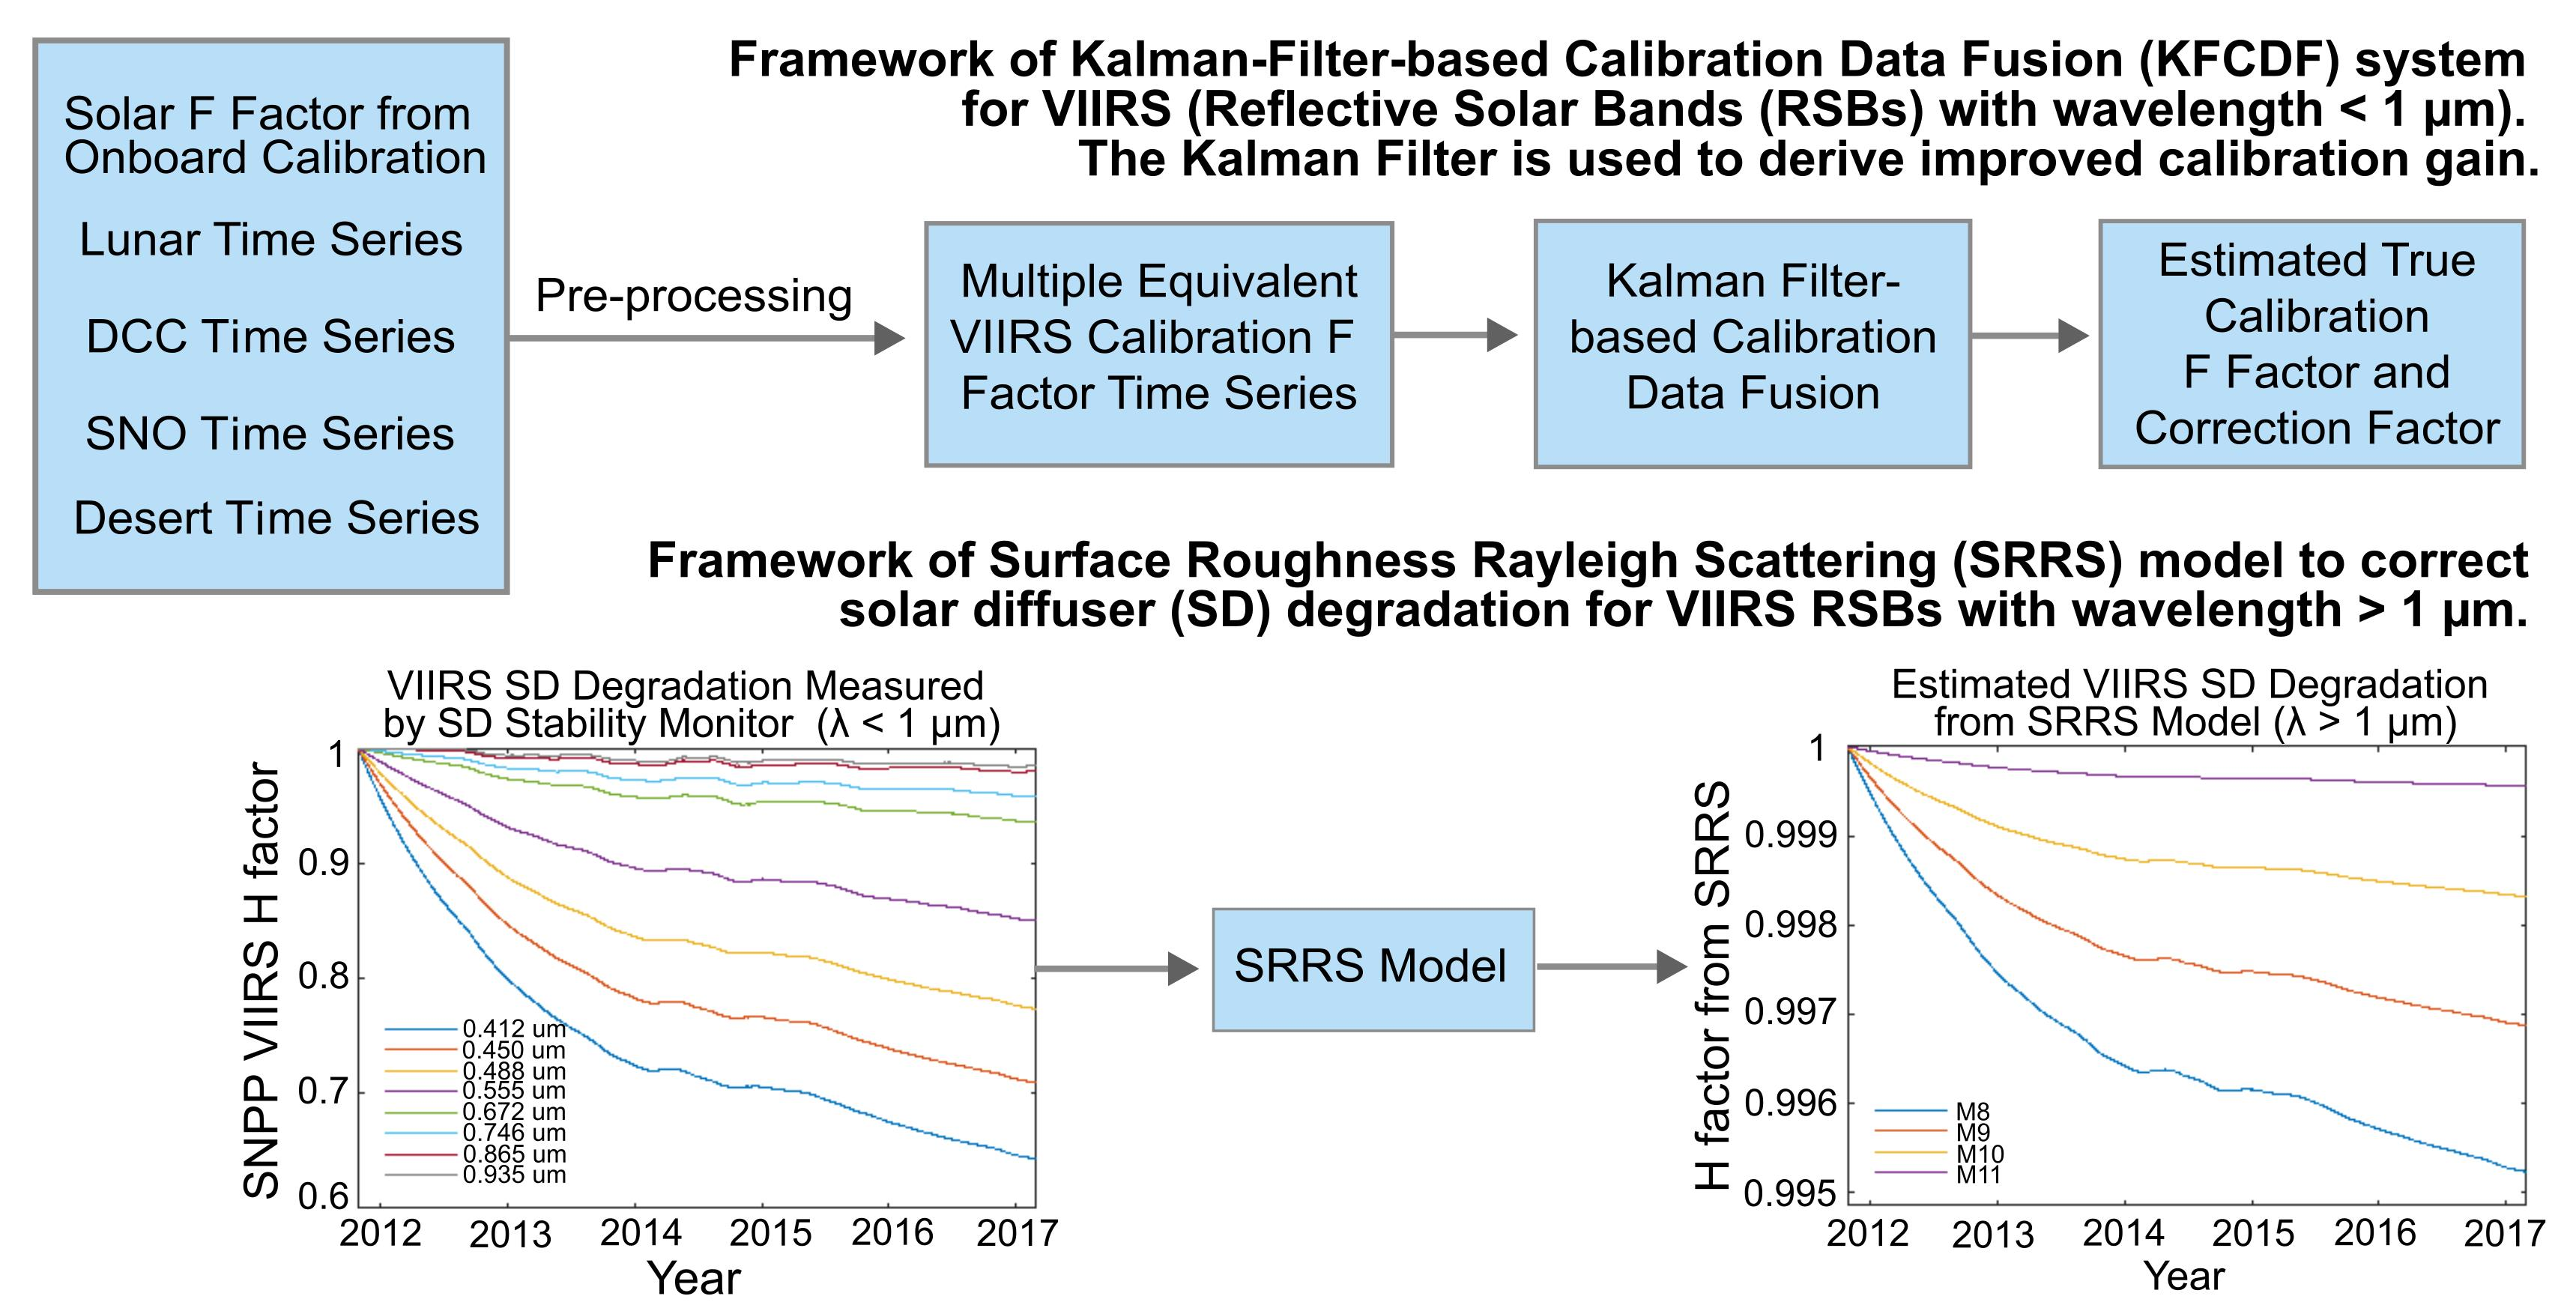
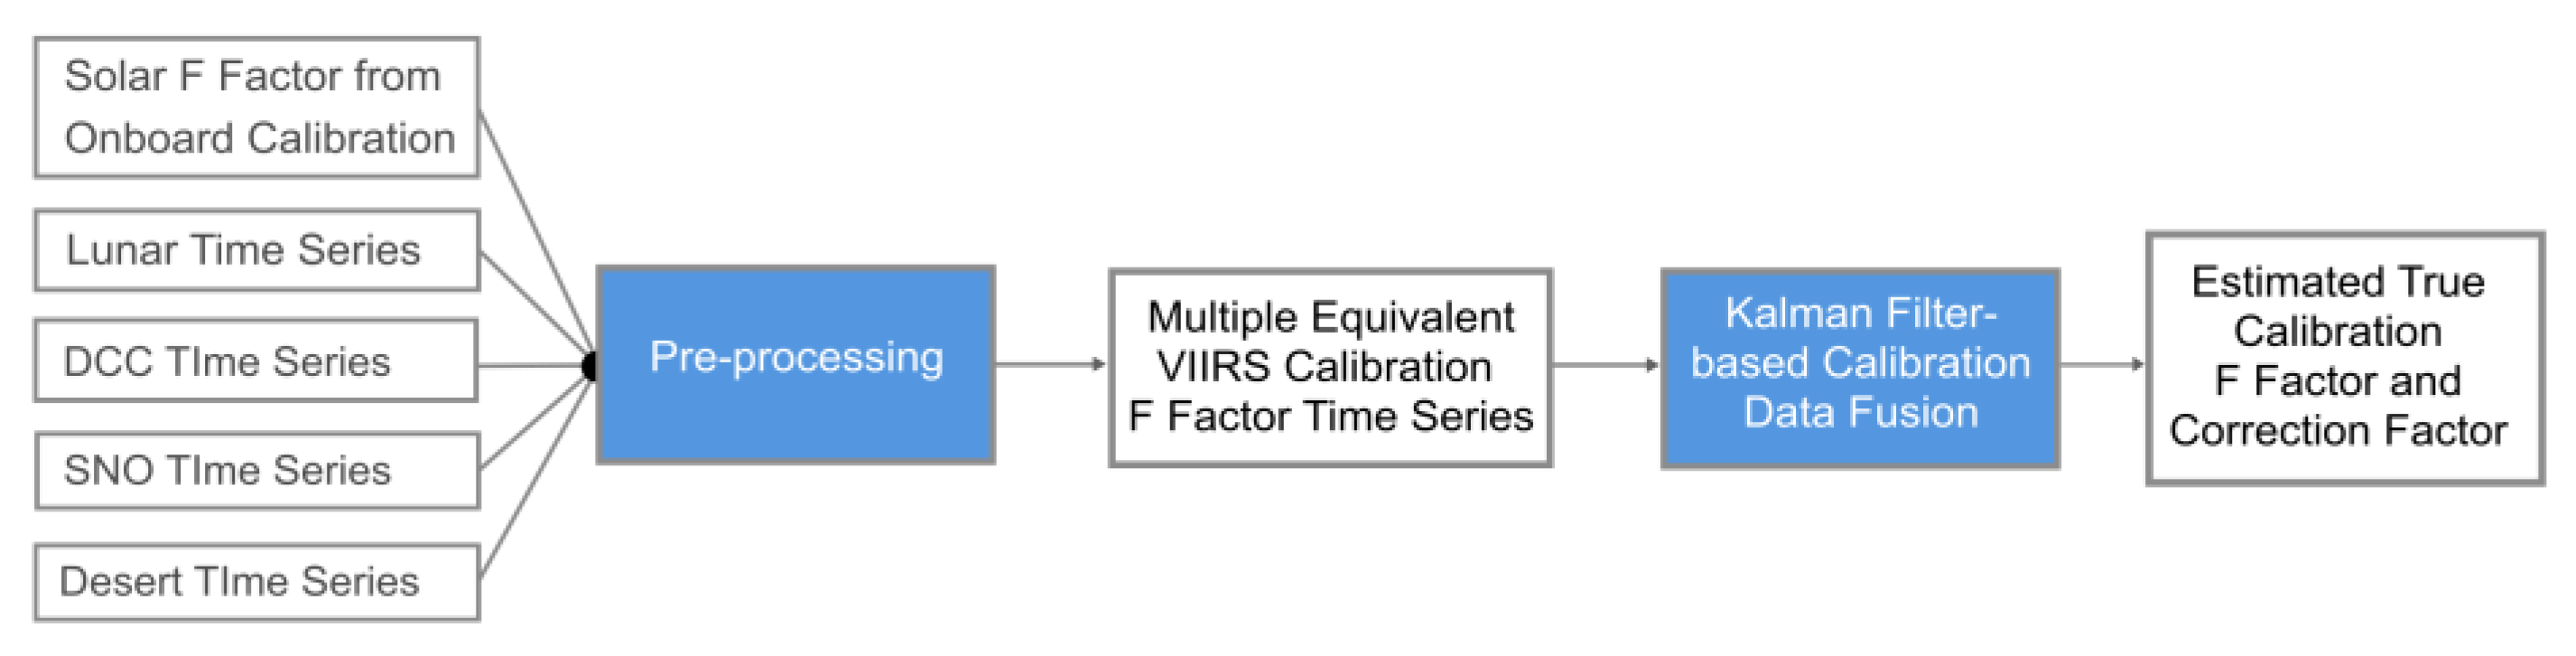
3.3. A Comprehensive Approach for Improved Accuracy and Long-Term Stability: The Kalman Filter Approach

It is recognized that the VIIRS onboard calibration system (solar diffuser and solar diffuser stability monitor) alone is not sufficient to ensure calibration stability, due to residual degradation effects. Therefore, lunar-based calibration has been used to correct the residual degradation of VIIRS RSBs which was not captured by the onboard calibration system due to the angular-dependent degradation of solar diffuser BRDF [22,26,28]. However, lunar calibration only has a few datapoints per year, and there is a gap in the summer months when no lunar calibration is available. As a result, in addition to lunar calibration, a number of other methods have been developed and matured over the years for satellite radiometer calibration/validation, including the Deep Convective Clouds (DCC), pseudo-invariant calibration targets (PICS) such as desert sites, and inter-satellite calibration at simultaneous nadir overpass (SNO) and extended SNO with other low-Earth-orbit (LEO) sensors. All of these provide an independent evaluation of the radiometric stability and accuracy of VIIRS RSBs, and each has its own advantages and limitations. The challenge is to reconcile these independent results and provide a comprehensive estimate for the VIIRS sensor in terms of stability, degradation, and absolute accuracy, which are essential for time series analysis.
The approach used in this study for synthesizing the various calibration approaches and results is the Kalman filter method [37], which has numerous applications, such as the navigation of vehicles, aircrafts and satellites, motion control, time series analysis in signal processing and econometrics, and data assimilation [38]. Multi-sensor data fusion based on Kalman filtering has been extensively studied and successfully applied in various areas [39,40,41] to reduce uncertainty through information fusion. In this paper, the Kalman filtering technique is applied to combine the sensor response variations monitored with independent approaches to form an optimal determination of the true degradation in the VIIRS instrument response. Figure 2 shows the framework of the Kalman Filter-based Calibration Data Fusion (KFCDF) system we developed for VIIRS RSBs, with wavelength < 1 µm, to support optimal calibration correction factor determination from multiple sources of calibration data input.

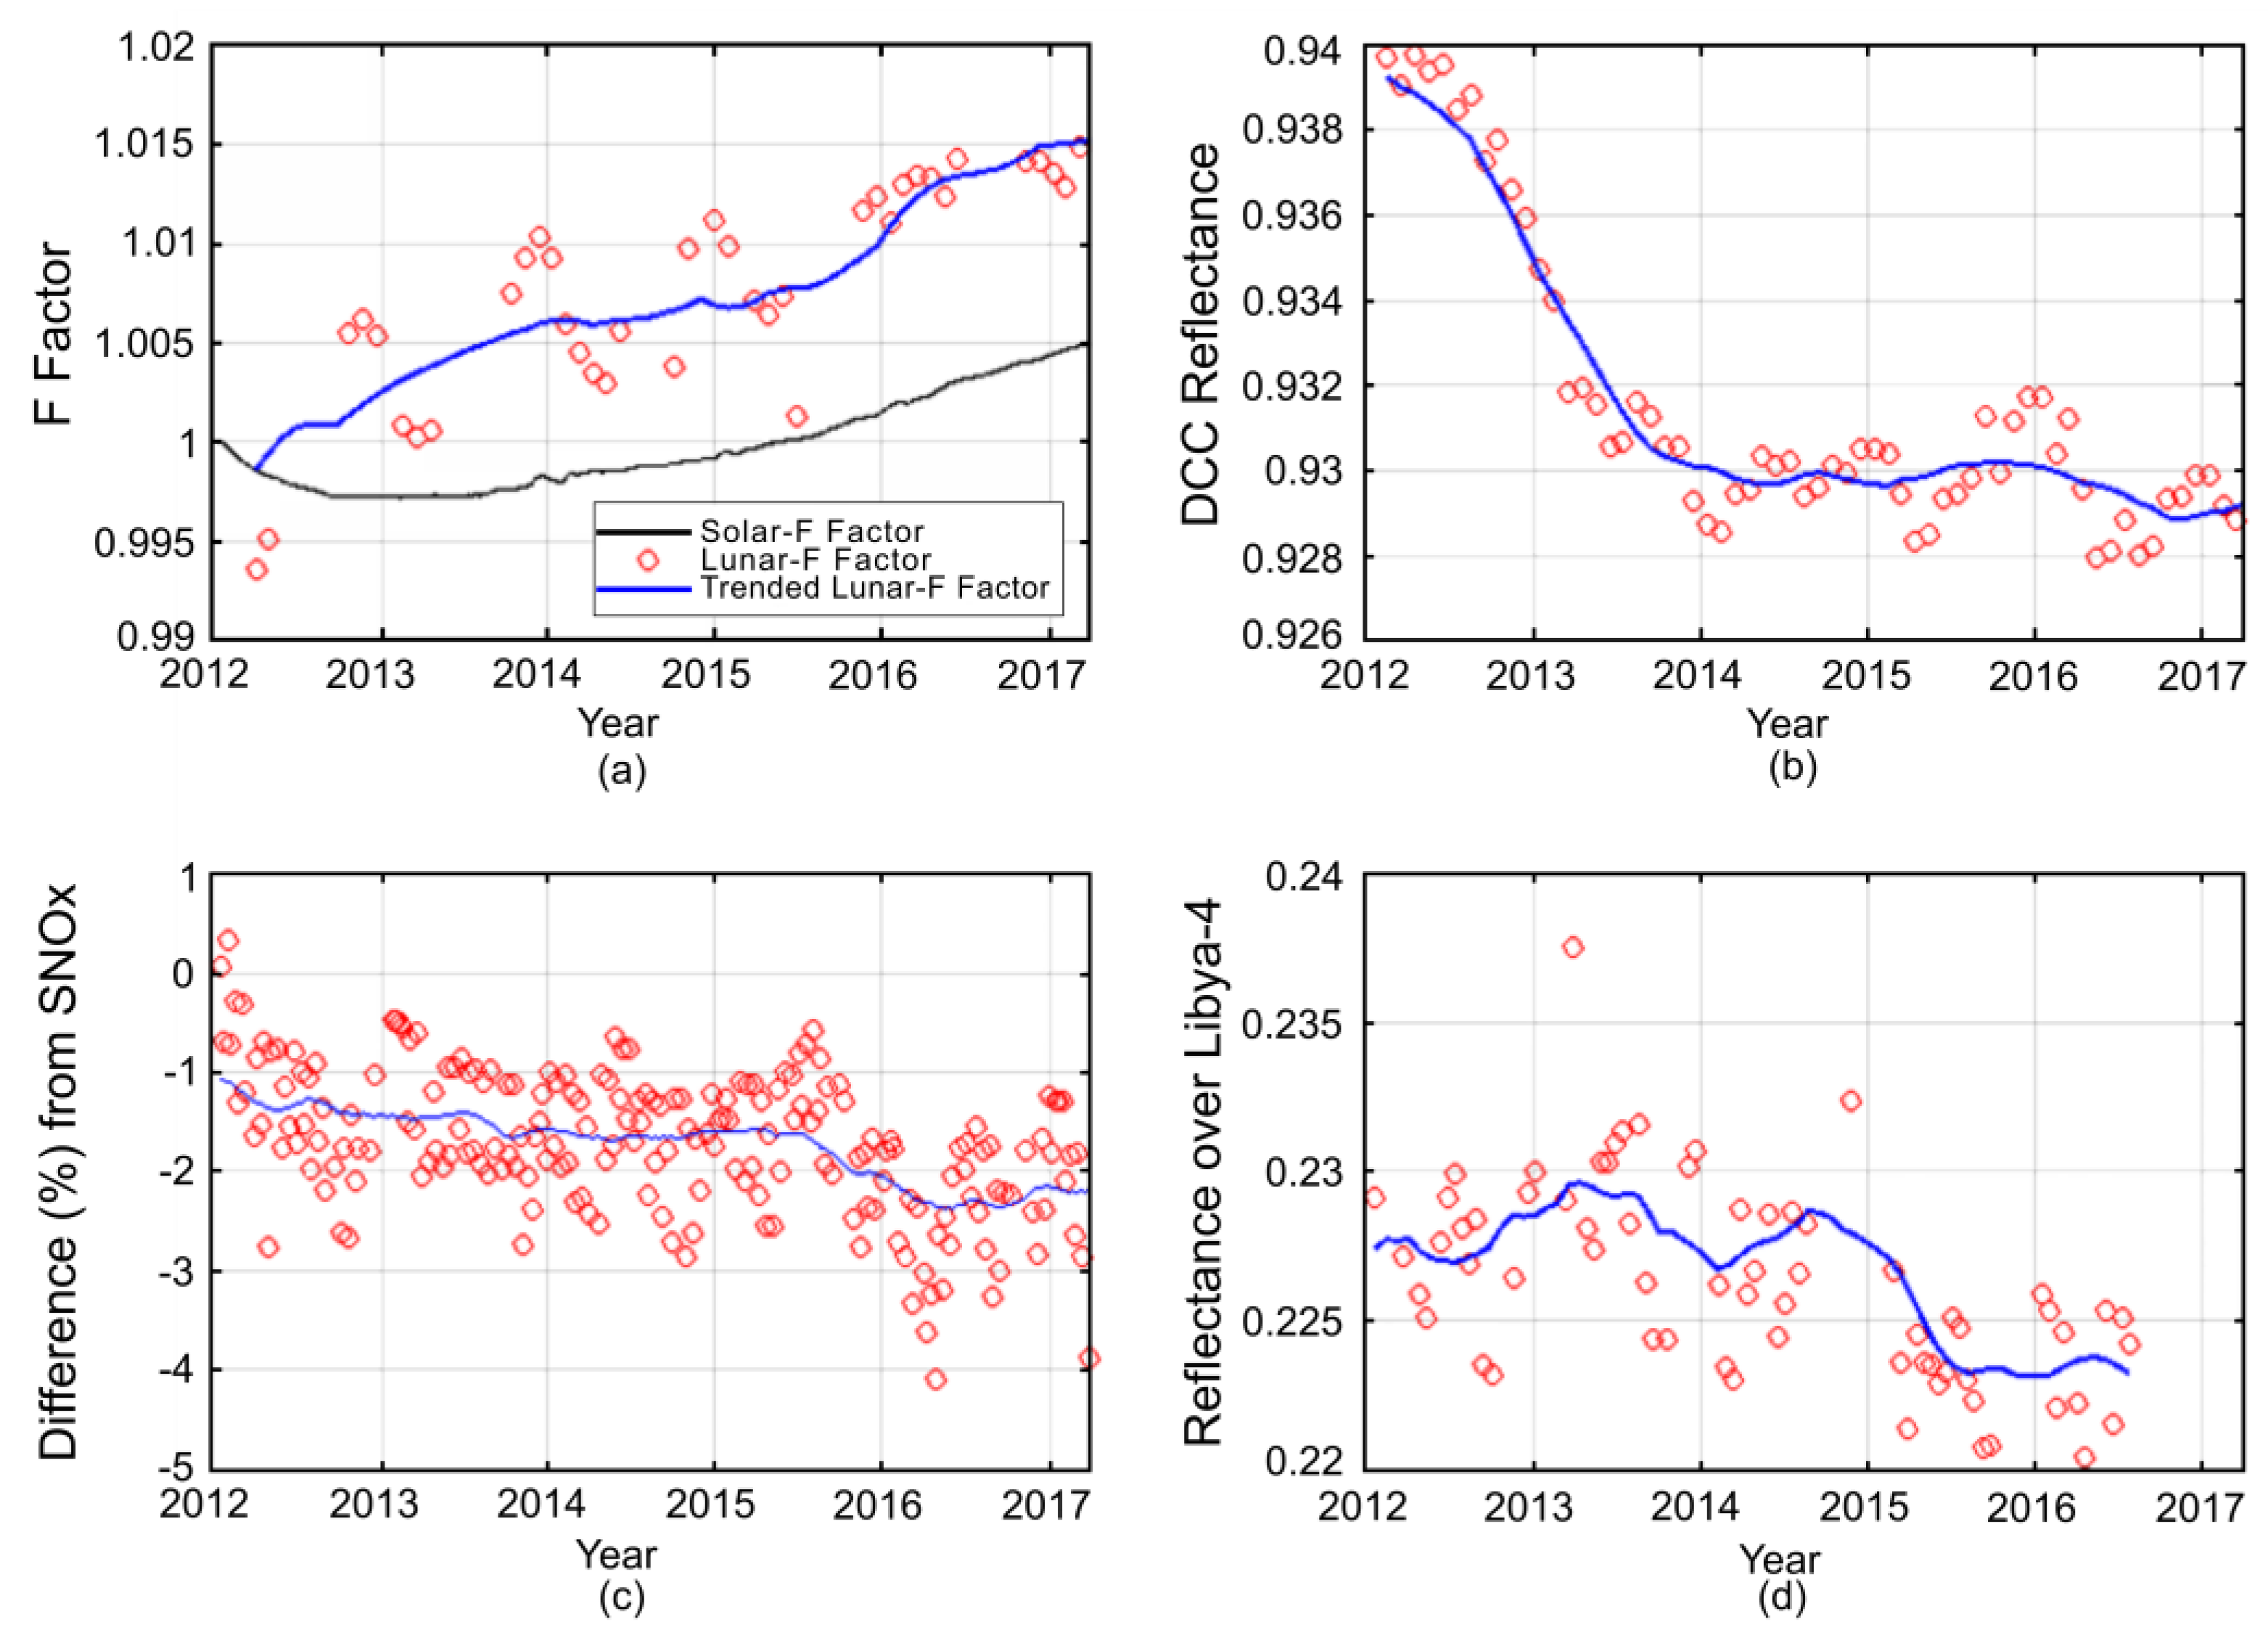
3.3.1. The Five Calibration Methods for Stability Monitoring and Calibration Preprocessing

As shown in Figure 2, multiple measurement data for VIIRS calibration stability monitoring have been processed and fed into the VIIRS KFCDF system to perform calibration data fusion and derive the best estimated radiometric trending of VIIRS RSB bands. Figure 3 shows an example of the measurement data used in the calibration data fusion for SNPP VIIRS M2 band. Among these, VIIRS calibration stability monitoring data, solar and lunar observations are directly used to derive solar-F and lunar-F factors as proxy of sensor gain change. The vicarious target measurements over DCC- or desert- and SNOx-based sensor stability monitoring rely on the radiance data of VIIRS RSB over the target region or coincident nadir view with another LEO sensor. Therefore, these vicarious and SNOx-based VIIRS stability monitoring data are derived by processing the radiance data generated with the time-varying solar-F factor that is applied. The processing of VIIRS calibration stability monitoring measurements used in this study, their applicability, and associated uncertainties, are briefly described as follows.
(a)
Solar diffuser-F factor
The operational radiometric calibration of SNPP VIIRS RSBs relies mainly on the onboard solar diffuser observations. During each orbit, when the satellite moves from the night-side toward the day-side of the Earth, near the South Pole, the sun illuminates the SD panel and sun-view port of the SD stability monitor (SDSM) through attenuation screens for a short period. With the data collected during the solar calibration, the on-orbit calibration coefficient, i.e., solar-F factor, as proxy of detector gain change, can be calculated for each valid SD observation. As shown in Table 3, solar calibration frequency is once per orbit, with the solar diffuser stability monitoring scheduled as frequently as each orbit during early post-launch checkup, and then reduced to three times a week or even once per week when VIIRS calibration (SD degradation rate) is stabilized. Since the azimuth and elevation location of the Sun vary for each solar calibration, both the transmission screen and the SD reflectance need to be characterized as a function of solar incidence angles, i.e., bidirectional reflectance distribution function (BRDF). The BRDF characterization of the SD system was performed during the pre-launch testing and updated with the on-orbit yaw maneuver measurements. There were remnant oscillations in long-term VIIRS solar-F factors due to imperfect characterization of SDSM screen transmittance and SD BRDF with yaw maneuver measurements alone. An earlier study developed a scheme to minimize the Solar-F factor oscillations by reanalyzing the yaw maneuver data to cover more comprehensive solar incidence angular geometry [27]. The current paper uses the time series of daily solar-F factor for VIIRS RSBs, derived in [27] as inputs to KFCDF. Figure 3a shows an example of solar-F factor time series for VIIRS M2.
The SD reflectance value decreases over time and its degradation is monitored by SDSM. However, the SDSM monitors the SD reflectance degradation at a different view geometry from the VIIRS Rotating Telescope Assembly (RTA) view of SD. It was suggested that the SD BRDF degradation has angular dependency [15,23,24,25,26,27,28], especially for M1-M4 of SNPP VIIRS, whose SD reflectance degraded faster [42,43,44]. The solar-F factor did not account for the post-launch angular-dependent degradation in solar diffuser BRDF for these bands. In addition, the solar-F factor carries the uncertainties of the solar irradiance model, SDSM and SD screen transmittance and SD BRDF determined from pre-launch and post-launch measurements. Therefore, solar-F factor itself cannot adequately monitor the radiometric performance of VIIRS RSBs, especially M1–M4.
  • (b) Lunar-F factor
The photometric stability of the lunar surface and its smooth reflectance spectrum make the moon an ideal target for calibrating spaceborne hyperspectral and multispectral RSB imagers. The observation of the moon by SNPP VIIRS is not subject to the atmospheric absorption and scattering effects. Therefore, moon-based radiometric calibration has been used as an independent means of monitoring and validating VIIRS RSB performance. During lunar calibration for VIIRS, spacecraft roll maneuvers are usually performed to acquire moon-view data in the Space View port. Moon data collections were performed monthly at nearly the same lunar phase angle of ~51 degree, with waxing lunar phase, except for 3–4 summer months each year [18,23].
The moon-based calibration coefficients (lunar F-factors) are calculated by taking the ratio between the observed and modeled lunar irradiance. In [18], the Global Space-based Inter-Calibration System (GSICS) Implementation of ROLO (GIRO) model is used to derive the lunar-F factors. The current paper ingests the time series of the lunar-F factor derived in [18] into the KFCDF processing system. Figure 3a shows an example of lunar-F factor time series for VIIRS M2 band. It can be seen that the lunar F-factor deviates from the solar F-factor by as much as ~1% for the VIIRS M2 band due to overestimation of the SD BRDF degradation in the solar F-factor. There are also apparent annual oscillations in the lunar-F factor time series, which may arise from the unaccounted lunar libration and other uncertainties in the lunar irradiance model. Other uncertainties in lunar F-factor calculations may come from the derivation of lunar irradiance from multiple scans of the moon by 16 (M band) or 32 (I band) detectors of VIIRS during each scan, such as oversampling factor determination and background offset subtraction. In addition, the 3–4-month gap in moon observations each year can also impact the long-term trending of lunar F-factors.
  • (c) Deep Convective Cloud (DCC) Data
DCCs are extremely cold, near Lambertian and radiometrically stable targets that have been widely used for the on-orbit calibration stability monitoring of satellite radiometers in the reflective solar spectrum. The DCC technique has been demonstrated in our previous studies [45,46] for VIIRS operational calibration monitoring and reprocessing improvements’ evaluation. In this study, monthly DCC time series were generated for the reprocessed S-NPP RSB SDRs using a similar method. DCC pixels are identified using M15 brightness temperatures. The anisotropic effects in the VNIR bands’ DCC data were corrected using the HU2004 angular distribution model [47]. Moreover, uniformity thresholds for RSB reflectance and M15 BT were also applied. Details of the DCC technique used in this study are available in [45,46]. In this section, the time series of monthly DCC mode data derived from visible and near infrared (VNIR) SDRs were used to characterize residual degradation after the solar calibration. Seasonal cycles in the DCC time series were removed using a method developed in [48]. Then, monthly DCC time series data were ingested as one type of calibration data input to the KFCDF model. Figure 3b shows an example of such DCC time series derived from VIIRS M2 radiance data.
  • (d) SNOx with MODIS over Sonoran Desert
When two or more satellites orbit the earth at different altitudes, simultaneous nadir overpasses (SNOs) periodically occur [49]. The SNO technique has been used to independently quantify the VIIRS radiometric performance w.r.t. MODIS instruments at their orbital intersection, with a small time-difference between the instruments’ observation [34,35]. The comparison of simultaneous measurements at their orbital intersection allows nearly identical viewing conditions, making this approach extremely suitable in inter-calibration, with reduced uncertainties associated with atmospheric absorption variability and BRDF.
While SNOs occur mostly in high-latitude polar regions with limited scene types, there are extended SNO events between SNPP VIIRS and Aqua MODIS at low latitudes, every 2–3 days, but with larger time differences, of more than 8 min. SNOx in low latitudes enables the inter-comparison of sensors over a wide dynamic range, such as over ocean surface, desert target, and green vegetation. A previous study has demonstrated the use of SNOx to study the on-orbit radiometric performance of VIIRS onboard SNPP [35]. VIIRS top-of-the-atmosphere (TOA) reflectance measurements are compared with matching MODIS bands. Aqua MODIS collection 6.1 data are used in this study. Figure 3c shows example time series of TOA reflectance-based SNPP VIIRS bias (%) relative to Aqua MODIS, derived using the SNOx method for the VIIRS M2 band. The main uncertainties of the SNOx method are due to cloud movement, residual cloud contamination and cloud shadow, BRDF due to view geometry differences, atmospheric absorption variability, and spectral differences between sensors. In addition, the SNOx method is subject to uncertainty in the radiometric accuracy and stability of MODIS measurements.
  • (e) Vicarious monitoring over Libyan desert
Pseudo-invariant calibration sites (PICS) have been widely used for characterizing the radiometric performance (temporal stability and accuracy) of satellite sensors for RSBs. PICS sites are homogenous and very stable in the long term. It is desirable to compare instruments over well-characterized homogenous calibration targets to reduce uncertainties resulting from registration errors. In the past, efforts have been focused on analyzing the radiometric performance of VIIRS using PICS such as Libya-4 and Dome-C [34]. This study analyzes the stability of SNPP VIIRS RSBs by using nadir observations of the Libya-4 desert. The Libya-4 desert is a Committee on Earth Observation Satellites (CEOS)-endorsed calibration site. Figure 3d shows an example time series of TOA reflectance over the Libya-4 desert for the VIIRS M2 band without BRDF and atmosphere correction. SNPP VIIRS has a repeating ground track cycle of 16 days. Therefore, the TOA reflectance dataset over Libya-4 is, at most, one datapoint every 16 days, and this can be sparser due to cloud contamination. The inherent impacts of sparse dataset, BRDF dependence and atmospheric absorption variability on the measurements over PICS make quantifying the radiometric stability of VIIRS more challenging than when using other methods. This can be seen from the larger fluctuations in the TOA reflectance series shown in Figure 3d in comparison with other calibration-stability-monitoring data.
Table 2 summarizes the key features of these five calibration-stability-monitoring methods in terms of their data sample frequency, advantages and uncertainties. The characteristic sampling intervals for these time series of stability monitoring data vary irregularly, from per orbit to monthly, depending on the particular monitoring scheme. To reconcile the large differences in data sampling frequency, the calibration stability monitoring data are smoothed to remove seasonal variations and reduce uncertainties, and then are interpolated to the same daily time resolution. The resulting trending data after preprocessing are recorded as F S o l a r , F L u n a r , T D C C , T S N O x , and T D e s e r t for the five stability monitoring schemes, respectively.
Figure 4 shows an example of stability trending derived for VIIRS M2 using these five schemes. While the solar-F factor is almost flat, the lunar-F factor shows an upward trend, which indicates that the M2 detector response degrades. DCC, SNOx and Libya desert monitoring all show downward trends. These trends are derived from the SDR data that accounted for the solar-F factor derived from the onboard solar diffuser calibration. Using stable vicarious sites, such as DCC and the Libya desert or MODIS sensor, as a reference, the downward trend in these three stability monitoring methods reveals the degradation of the M2 detector response that the solar calibration did not capture. Therefore, lunar calibration, DCC, SNOx and Libya desert monitoring all consistently show the degradation of VIIRS M2, which was unaccounted for in the solar calibration, possibly due to the angular-dependent degradation of SD BRDF. To quantitatively reconcile these stability monitoring time series and establish a true estimate of calibration F factors for VIIRS RSBs, data fusion of multiple stability monitoring data is performed with Kalman filtering, i.e., KFCDF. Since the desert stability monitoring time series have larger uncertainties and sparsity due to uncorrected desert BRDF effects and atmospheric absorption, as shown in Figure 3, the KFCDF modeling screened out T D e s e r t and focused on the data fusion of F S o l a r , F L u n a r , T D C C , and T S N O x time series data.

3.3.2. Normalization of the F Factor

While solar-F and lunar-F factors provide direct characterization of the sensor gain change, the DCC- and SNOx-based VIIRS stability monitoring data are derived by processing the SDRs generated when the time-varying solar-F factor is applied. Therefore, to characterize the stability of VIIRS RSB bands with T D C C , and T S N O x , equivalent calibration F factors need to be derived from these stability trending time series data. The trend observed by DCC measurement reveals the detector gain variation, in addition to those accounted for in the solar-F factor. Therefore, the DCC-F factor can be derived as
F D C C ( t ) = F S o l a r ( t ) T D C C ( t ) / ( T D C C ( t 0 , D C C ) ) ,   for   t t 0 , D C C ,
where t 0 , D C C is the starting time of DCC data. Similarly, the SNOx-based F factor, i.e., SNOx-F, can be derived from the time series of SNOx trending data as
F S N O x ( t ) = F S o l a r ( t ) ( 1 + T S N O x ( t ) / 100 ) / ( 1 + T S N O x ( t 0 , S N O x ) / 100 ) ,   for   t t 0 , S N O x ,
where t t 0 , S N O x is the starting time of SNOx data. Note that T S N O x (t) trending data are recorded as the bias in percent difference between MODIS and VIIRS.
Figure 4 shows the time series of solar-F, lunar-F, DCC-F and SNOx-F factors for M1-M4 of SNPP VIIRS. Lunar-F, DCC-F and SNOx-F all show deviations from the solar-F factor for these four bands. For VIIRS M2-M4, all three F factors are consistently trending to higher values than solar-F, which indicates that the additional detector degradation over time is unaccounted for by solar-F for these bands. These four F factors, derived from stability monitoring data, provide an independent evaluation of the sensor response variation over time, and are fed into the kernel of KFCDF for true calibration F factor estimation.

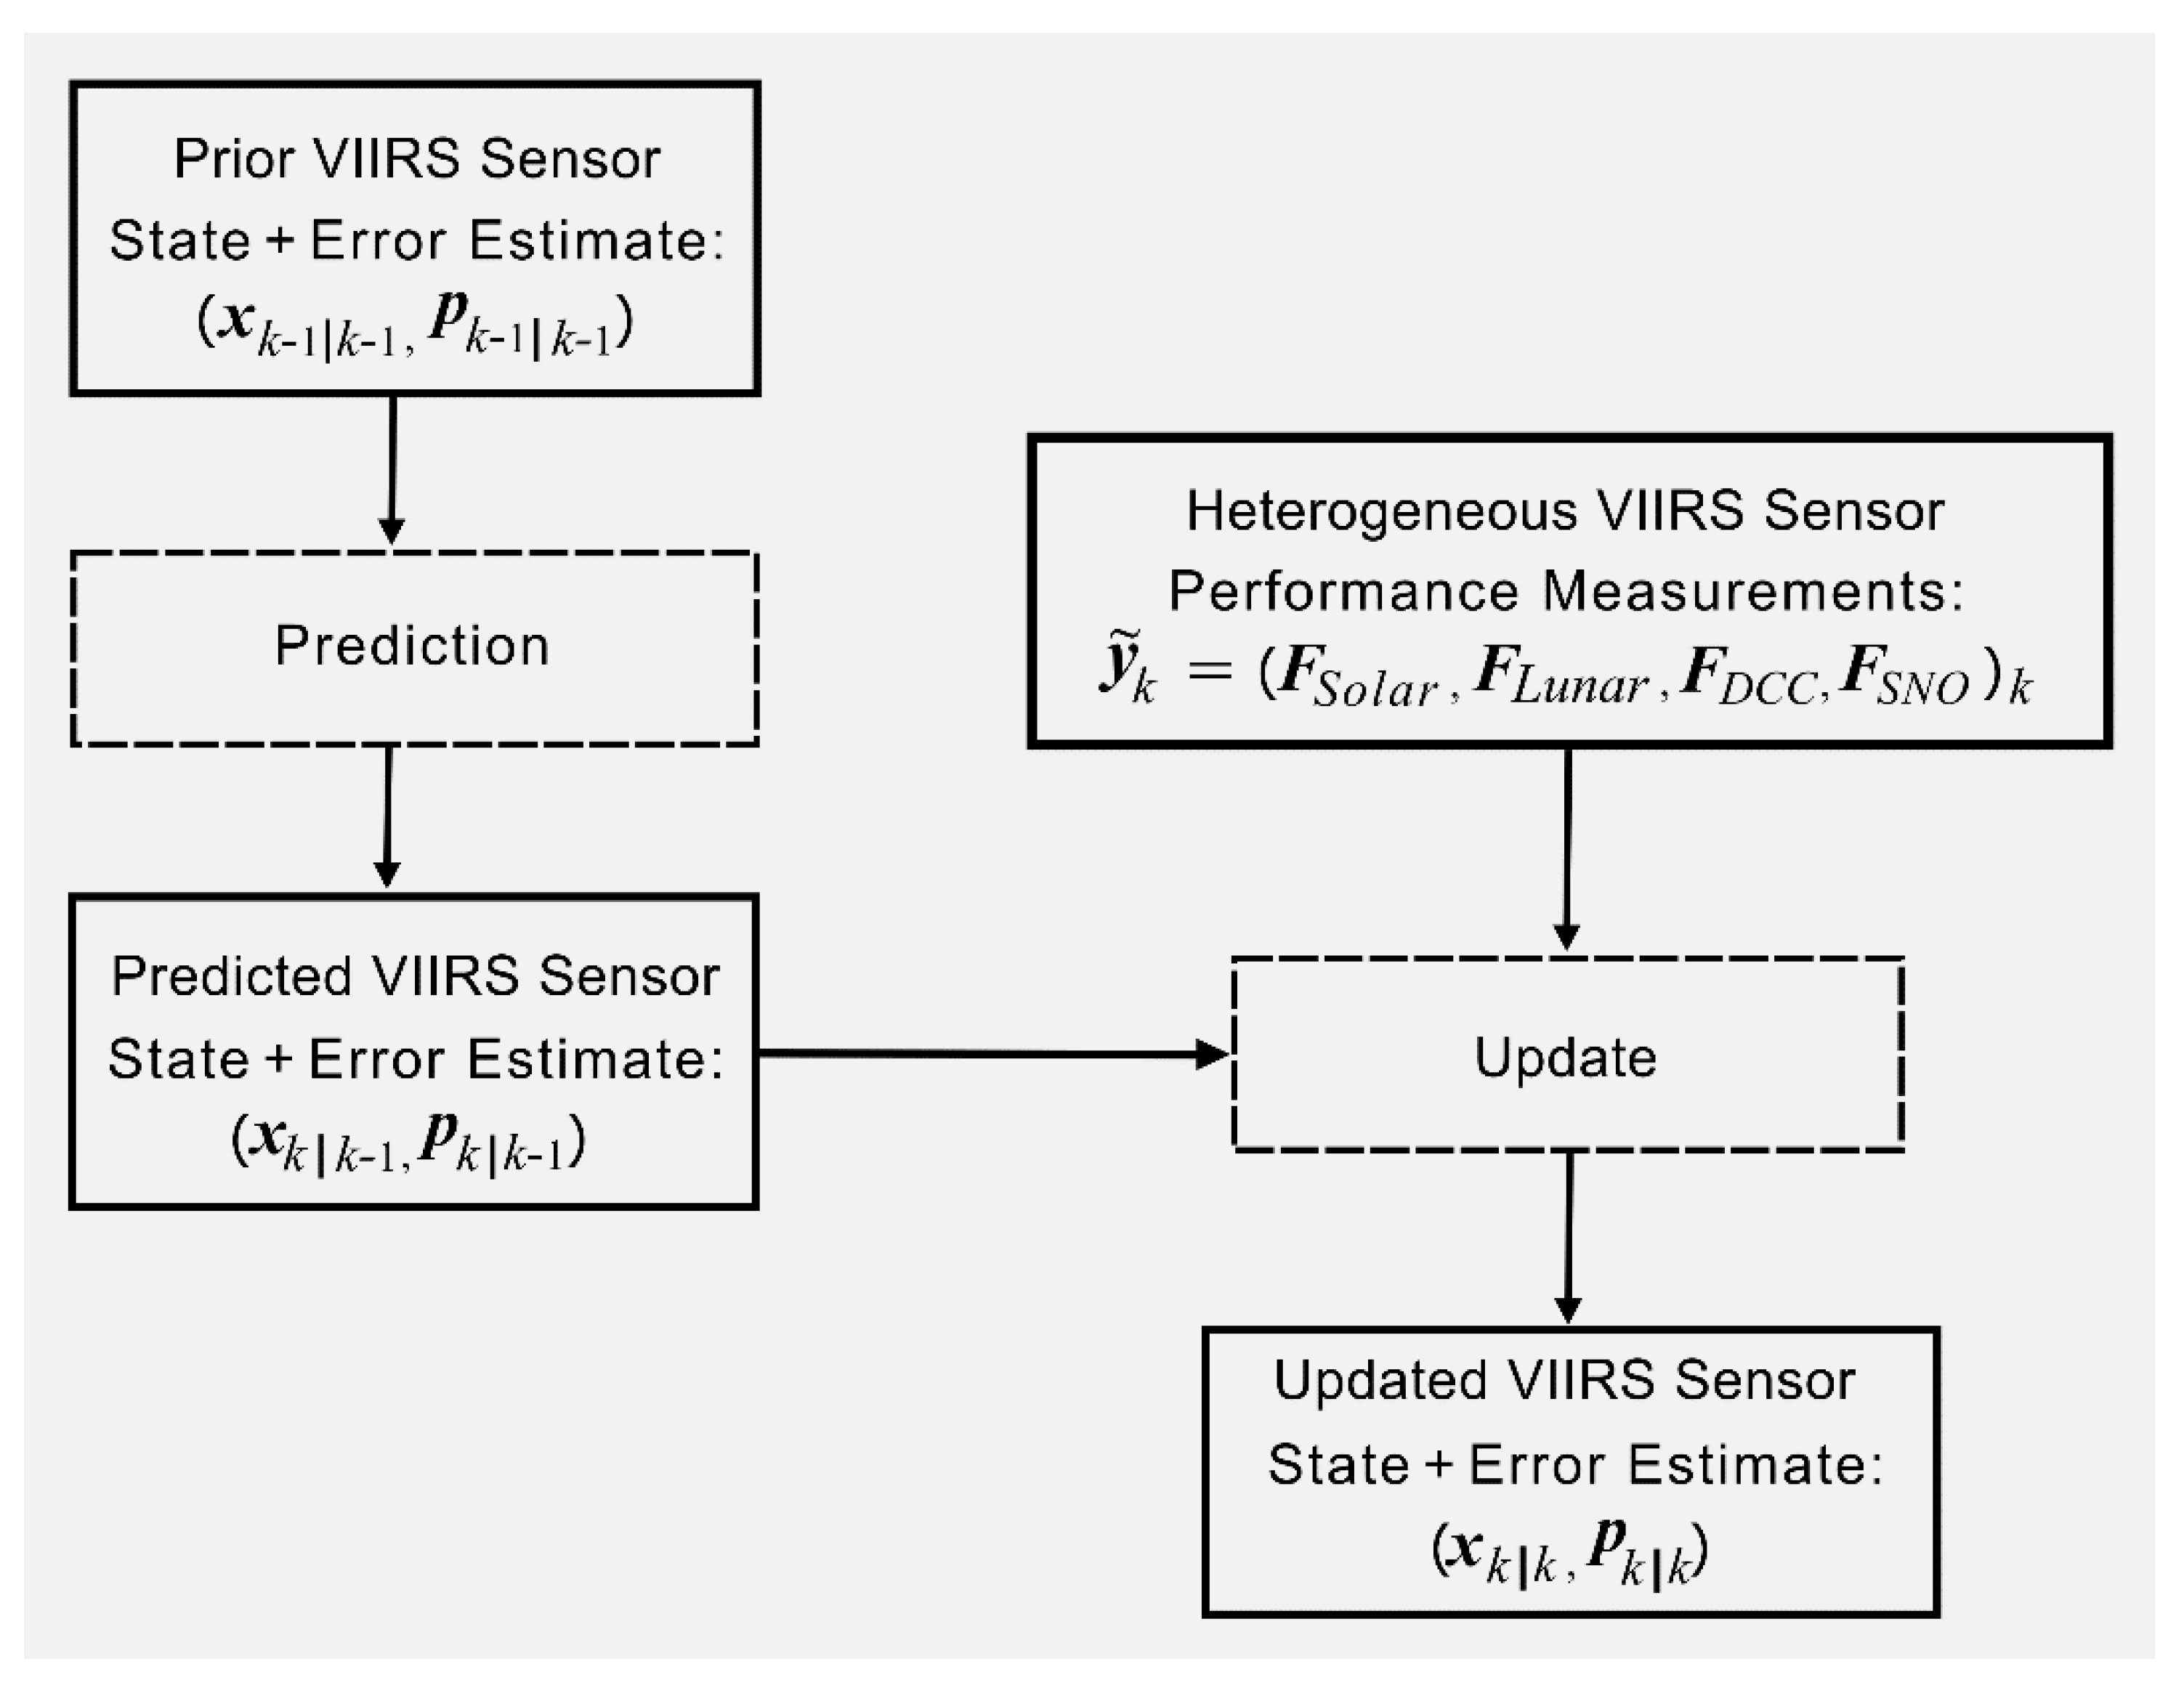
3.3.3. Kalman Filter-Based VIIRS Calibration Data Fusion

The kernel of the KFCDF processing system for VIIRS is the customized Kalman filter, used to estimate the time series of the optimal F factor for trending VIIRS sensor gains. It combines independent VIIRS calibration stability measurements such that the resulting F factor time series has less uncertainty than would be possible when these calibration data are used individually. This scheme focuses on calibration uncertainty reduction. Figure 5 shows the steps involved in the KFCDF scheme.
As illustrated in Figure 5, the Kalman-filtering-based calibration data fusion process for VIIRS can be divided into two phases, the prediction phase and update phase, as follows.
Predict
Predicted VIIRS sensor state estimate (a priori):
x k | k 1 = x k 1 | k 1
Predicted sensor covariance estimate (a priori):
P k | k 1 = P k 1 | k 1 + Q k
Update
Innovation covariance
S k = H k P k | k 1 H k T + R k
Optimal Kalman Gain
K k = P k H k T S k 1
Updated VIIRS sensor state estimate (a posteriori)
x k | k = x k | k 1 + K k ( y ˜ k   H k x k | k 1 )
Updated covariance estimate (a posteriori)
P k | k = ( I K k H k ) P k | k 1
In the above formulations for KFCDF, x k is the estimated true VIIRS sensor F factor state and   P k is the covariance matrix of the state or error estimate. y ˜ k = ( F S o l a r ,   F L u n a r , F D C C , F S N O ) k is a heterogeneous VIIRS sensor performance measurement vector in terms of equivalent F factors from four types of measurement. In Equation (7), y ˜ k   H k x k | k 1 is also called the innovation residual of measurements. H k is the observation model and is set as unity after the y ˜ k and populated with equivalent F factors from diverse measurements. Q k and R k are the covariances of the process noise and the observation noise, respectively, and are estimated with time-lagged auto-covariance. At each instant, in the predict phase, the priori estimated VIIRS F factor and covariance are used to predict VIIRS sensor state with Equations (3) and (4). Then, the VIIRS F factors derived from heterogeneous measurement are used to calculate the innovation residual with y ˜ k   H k x k | k 1 , innovation covariance and Kalman gain using Equations (5) and (6). The estimated true F factor x k | k and covariance P k | k are updated with Equations (7) and (8), which serve as the priori for the next KFCDF update.
The adaptive nature of Kalman filtering enables the fusion of multiple calibration data to estimate the true VIIRS sensor calibration F factor time series, which are shown as black curves in Figure 4 for VIIRS M1-M4. At each instant, the true F factor estimation provides an optimal determination of gain values in calibration. Most often, the F factor from KFCDF is aligned with lunar-F factor, as shown in Figure 4, which validates the importance and robustness of lunar calibration for VIIRS RSBs. For VIIRS M1 and M3, the F factors from KFCDF start to deviate from lunar-F after 2016, when the DCC-F and SNOx-F factors became more consistent. The KFCDF scheme has been applied to recalibrate the gain coefficients of VIIRS M1-M7 and I1-I2 RSBs with wavelengths less than 1 µm, and make corrections to these SDRs. For VIIRS M5-M7, the KFCDF F factors are within 0.3% of solar-F for 5 years. Since the optical throughput degradations of VIIRS M5 to M7 band varied from ~10% to ~40% due to the contamination of the mirror along the optical throughput path [4], the consistency between solar-F and KFCDF-F factors validates the reliability of solar calibration for M5-M7 bands. In Section 4, the effectiveness of F factors derived from KFCDF in removing long-term biases and improving VIIRS RSB data quality is evaluated through the long-term trending of DCC data.

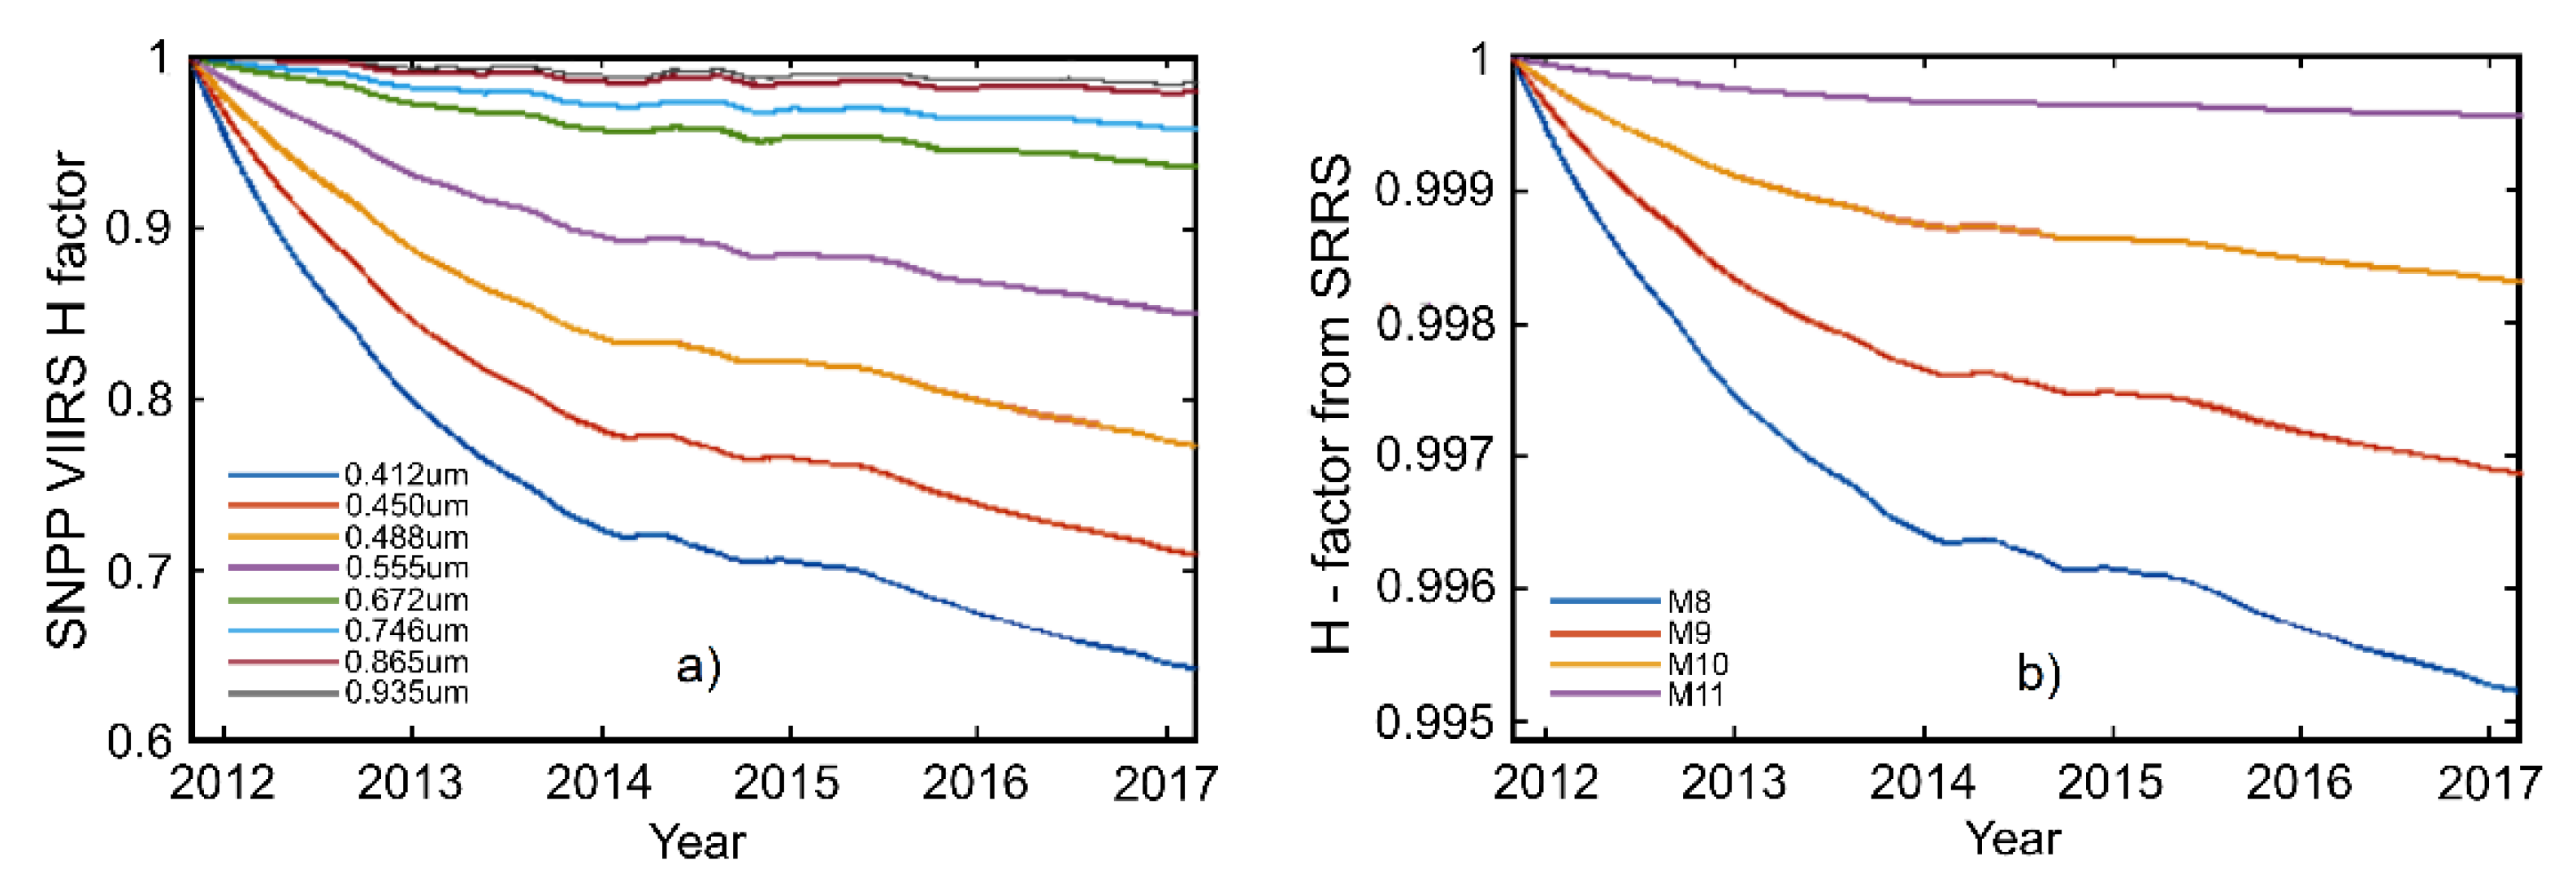
3.4. The Surface Roughness Rayleigh Scattering Model (SRRS) for Improving Calibration Stability (Bands with Wavelength > 1 µm)

The onboard calibration of SNPP VIIRS NIR bands (M8-M11) with wavelength >1 µm relies on onboard calibration system including a solar diffuser (SD) to maintain radiometric quality and stability. During the on-orbit solar calibration, the SD panel is illuminated by sunlight for a short period. The SD is made of Spectralon and is known to degrade in reflectance at the short wavelength (blue end of the spectrum) due to exposure to solar ultraviolet (UV) and energetic particle radiation in space. For VIIRS RSBs with wavelength < 1 µm, a SD Stability Monitor (SDSM), i.e., a ratioing radiometer, is used to measure the ratio between the offset-corrected SD and sun-view digital counts, and to track SD reflectance changes. However, there is no detector in VIIRS SDSM with a center wavelength longer than 1 µm. Therefore, the onboard solar calibrations of NIR bands (M8-M11, I3) of VIIRS rely on direct measurements of reflected solar radiation from the SD through Rotating Telescope Assembly (RTA). It is assumed that the reflectance of VIIRS SD does not degrade in the NIR bands. Therefore, the calibration factors of VIIRS NIR bands derived from onboard solar calibration do not account for the SD degradation in these NIR bands. On the other hand, the degradation of SNPP VIIRS NIR bands due to residual SD degradation is small and largely masked by noise, due to the weak signal and annual variations embedded in the sensor measurements of the moon and DCC targets. Therefore, a physics-based model that links the spectral-dependent degradation in SD material with surface roughness is used to derive correction factors for SNPP VIIRS NIR bands.
In a previous study, a physics-based Surface Roughness Rayleigh Scattering (SRRS) model was developed to characterize the spectral degradation of the SNPP VIIRS SD as monitored by the SDSM [43]. In this model, the long-term spectral degradation of the SD reflectance is attributed to the increased Rayleigh-scattering due to the growth in surface roughness with length scale << wavelength on the SD surface after being exposed to UV and particle radiation in space. The characteristic length parameter of the SD surface roughness is derived from the long-term reflectance data of the VIIRS SD and it changes at approximately the tens of nanometers level over the operational period of SNPP VIIRS. This estimated roughness length scale is consistent with the experimental result from the radiation exposure of a fluoropolymer sample [50], which validates the applicability of the SRRS model. Furthermore, the SRRS model was shown to effectively model the spectral-dependent degradation of the SDs on an Aqua/Terra Moderate Resolution Imaging Spectroradiometer (MODIS) and SNPP/NOAA-20 VIIRS, which indicates that the SRRS model captures the governing physical process of spectral degradation [44,51].
Since the spectral degradation of SD reflectance follows the spectral power law of Rayleigh scattering, it is expected that SD of SNPP VIIRS also degrades in NIR bands with smaller magnitude, but can manifest its effect over a longer period of time. The on-orbit change in VIIRS SD’s reflectance is tracked by eight detectors with wavelength < 1 µm in VIIRS SDSM in terms of H-factors (Figure 6a). Large SD reflectance degradation at shorter wavelengths can be observed from the reflectance data in Figure 6a.
To derive the spectral degradation of SNPP VIIRS SD in NIR bands, the SRRS model developed in [43] is used
R m ( λ , t ) = R 0 ( λ ) [ 1 S ( λ , t ) ] = R 0 ( λ ) ( 1 α ( t ) λ 4 )
where R 0 ( λ ) is the initial spectral reflectance of SNPP VIIRS SD and is set to be equal to 1. S ( λ , t ) = α ( t ) λ 4 contains the spectral dependence and time variation of the SD reflectance degradation due to SD surface-roughness-induced Rayleigh scattering. Here, the factor α ( t ) is the fitting parameter derived from the measurements by eight SDSM detectors at discrete time t. The factor α ( t ) contains information of the growth of SD surface roughness characterization parameters. Details on the derivation of SRRS model can be found in [43,44,51]. Once the time series of fitting parameter α ( t ) are determined, Equation (2) can be used to derive the time-dependent SD reflectance degradation for SNPP VIIRS NIR bands by plugging corresponding wavelengths into Equation (9). Figure 6b shows the degradation in SD reflectance for SNPP VIIRS NIR bands, derived with the SRRS model. The largest SD reflectance degradation among VIIRS VNIR bands occurred at the M8 band, with a magnitude of ~0.5% as of March 2017.
The SD degradation factors for SNPP VIIRS NIR bands shown in Figure 6b have been applied to make corrections to the M8-M11 (λ > 1 µm) radiance data. It is also noted that [52] used a phenomenology-based power-law-fitting and derived a wavelength-exponent = −4.03 to model the spectral degradation of SNPP VIIRS SD, as well as making corrections to the NASA version of VIIRS NIR data. The formulation in [52] is very close to the physics-based SRRS model. In an earlier study [28], the SRRS model presented in [43] was applied to estimate the spectral reflectance degradation of Aqua MODIS SD in NIR bands, and the gains of the Aqua MODIS NIR detectors were corrected.

3.5. Algorithm Improvements for the Thermal Emissive Bands

For the thermal emissive bands, the onboard calibration with blackbody/spaceview and related coefficients plays a dominant role in the absolute radiometric accuracy. Previous studies have shown that modern blackbodies typically have high emissivity, which ensures accurate calibration. The operational calibration of Suomi-NPP VIIRS TEB has generally been good for all nominal operations since launch. There are two major TEB calibration improvements in the Suomi-NPP VIIRS recalibration.
First, the TEB calibration algorithm was improved to mitigate TEB calibration anomaly during blackbody (BB) warm-up/cool-down (WUCD) events, which were performed to characterize on-orbit calibration offset and nonlinearity changes over time. Note that the same WUCD bias correction method has also been implemented in the VIIRS ground processing system, the Interface Data Processing Segment (IDPS), since July 2019. Previous studies indicate that small but persistent TEB calibration anomalies were observed during the WUCDs [19,20]. During such events, Suomi-NPP VIIRS TEBs show calibration anomalies up to 0.1 K during the cool-down phase. The VIIRS daytime sea-surface temperature (SST) product, which uses bands M15 and M16 as primary inputs, becomes anomalous, with warm spikes on the order of 0.25 K, in the SST time series [53]. For the reprocessing, the TEB calibration anomaly during WUCD was corrected using the Ltrace method and the Ltrace-2 methods [19,20] through a VIIRS SDR algorithm code change and Emissive LUT update. Both the Ltrace and the Ltrace-2 methods are designed to be localized corrections, which are only applied during the WUCD events. During the S-NPP version 2 reprocessing, the Ltrace method was applied to bands M12, M14-M16, I5, and the Ltrace-2 method was applied to bands M13 and I4, at the beginning of the S-NPP mission. Details of the Ltrace and Ltrace-2 methods are given in [19,20]. Improvements to TEB SDRs will be evaluated in Section 4.2.
The second major improvement in the reprocessed TEB SDRs is the upgraded TEB radiance/BT limits since the beginning of the Suomi-NPP mission. Discrepancies between TEB radiance and BT limits (as well as reflectance for RSBs) were reported in the operational SDRs during the early Suomi-NPP mission. The issue was resolved by an Emissive Band Brightness Temperature conversion (EBBT) LUT update in the operational processing on June 22, 2015. Besides resolving the radiance/BT mismatch issue, the radiance/BT limits were also expanded in the updated EBBT LUT. For example, the M13 (a dual-gain band designed for fire detection) limits were expanded from 199–634 to 180–700 K. As a result, the M13 saturation during the early mission was reduced after reprocessing. During the version 2 reprocessing, the updated EBBT LUT was used from the beginning of the Suomi NPP mission.

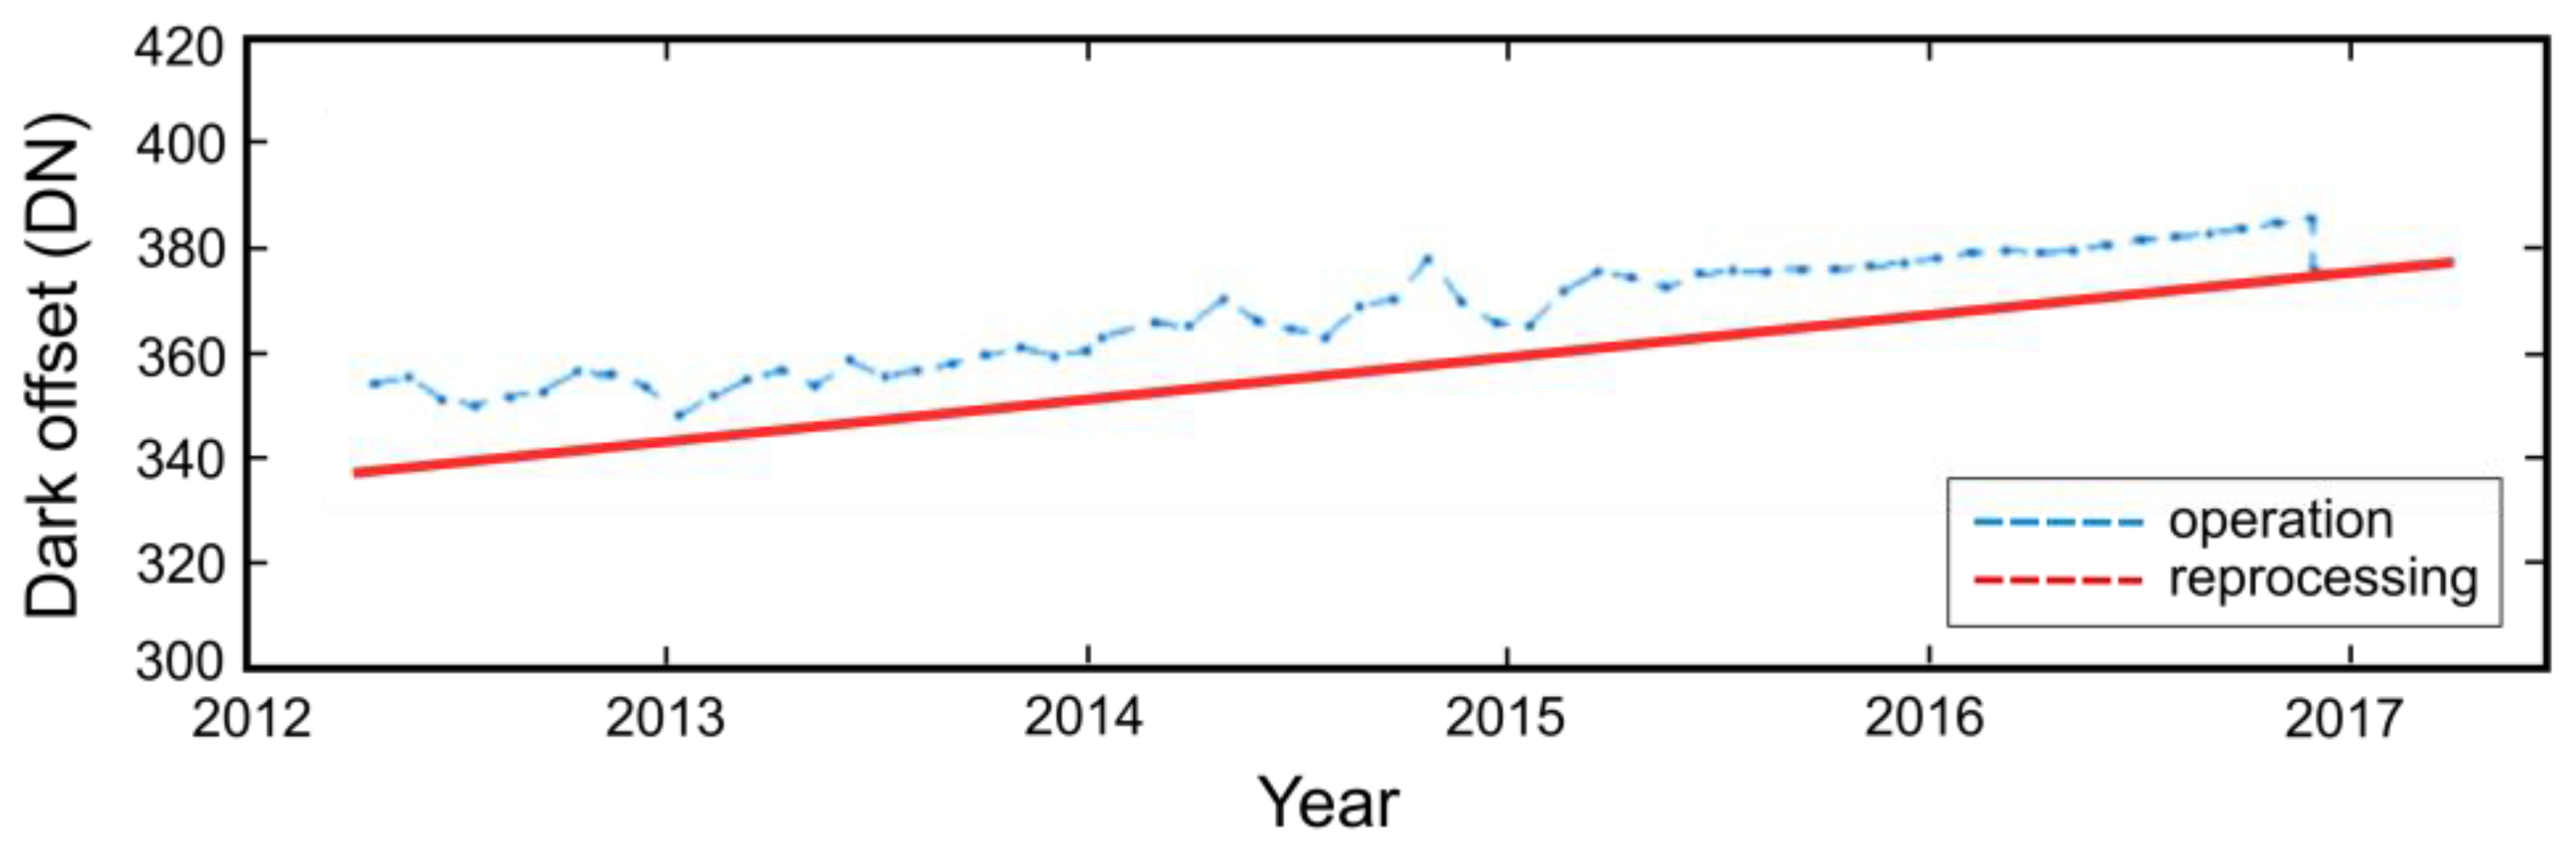
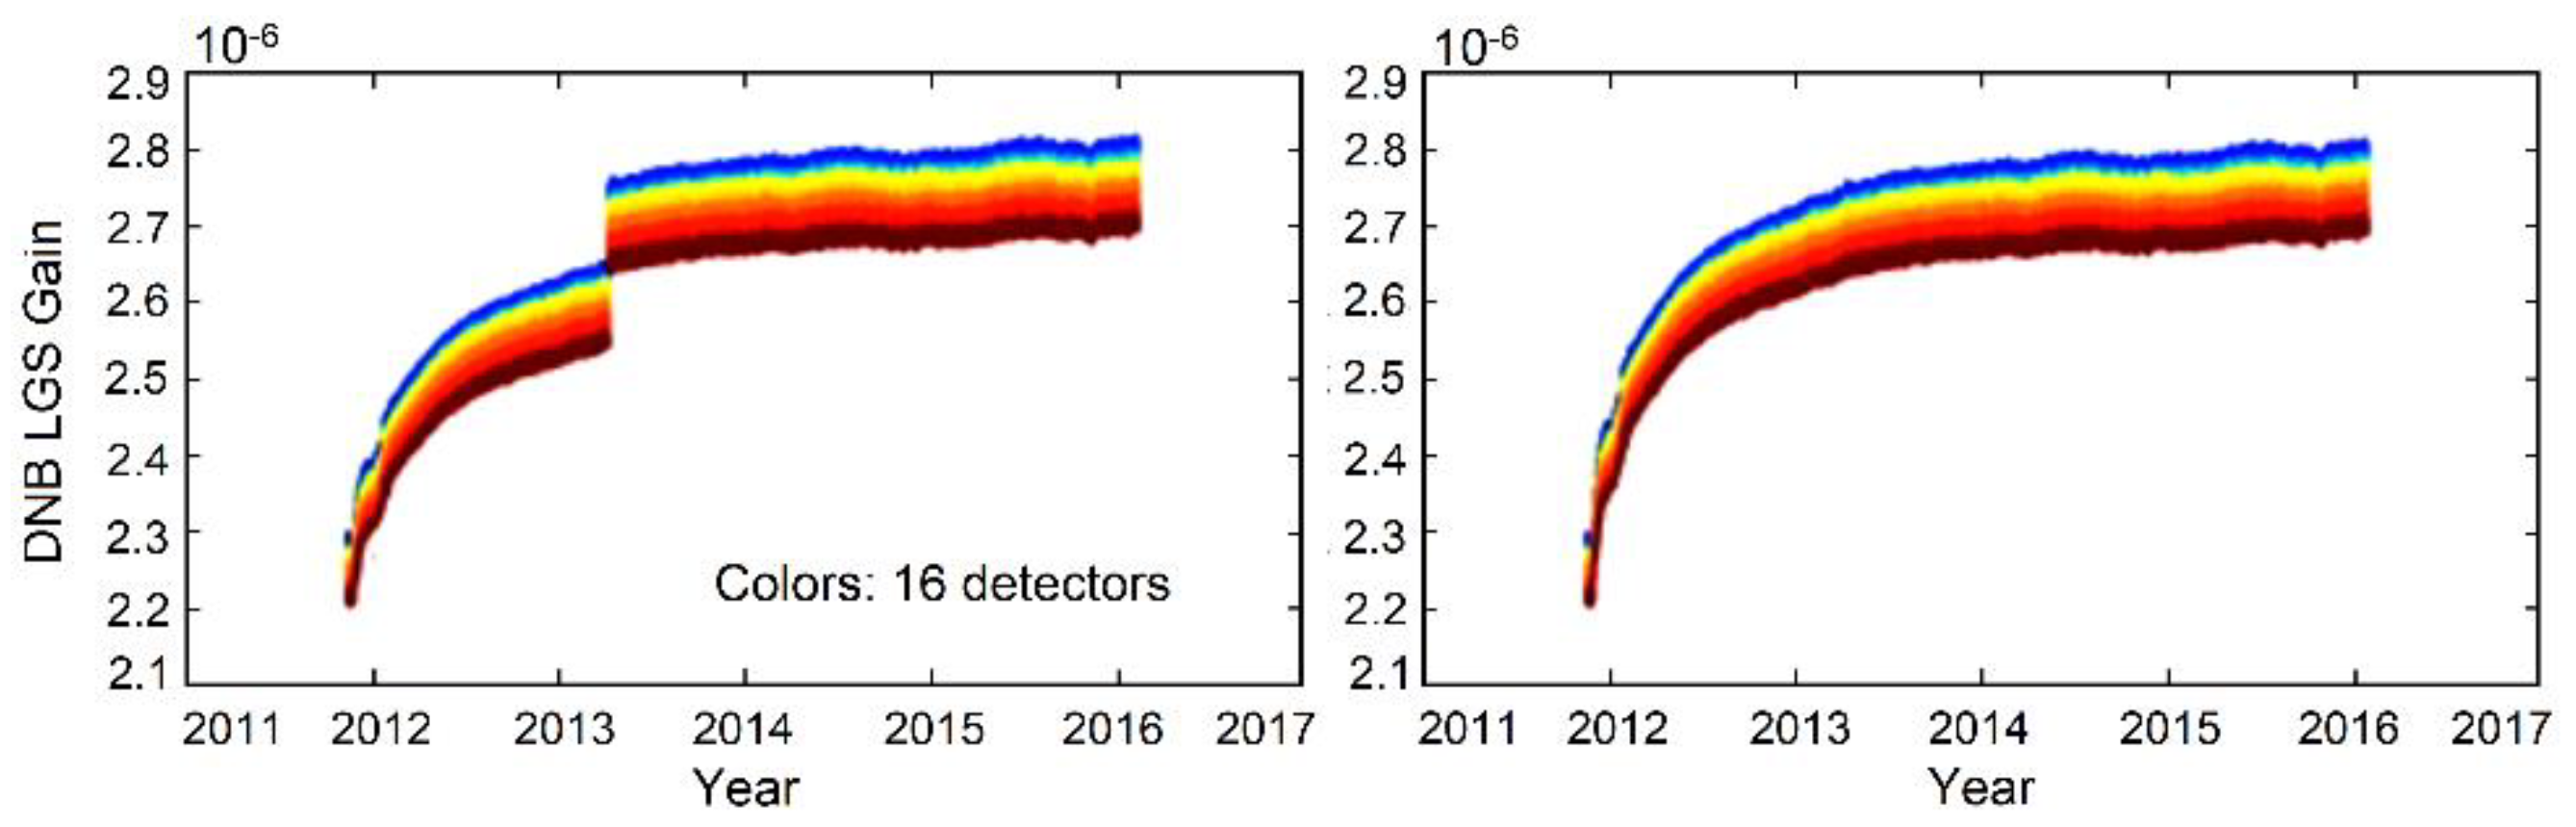
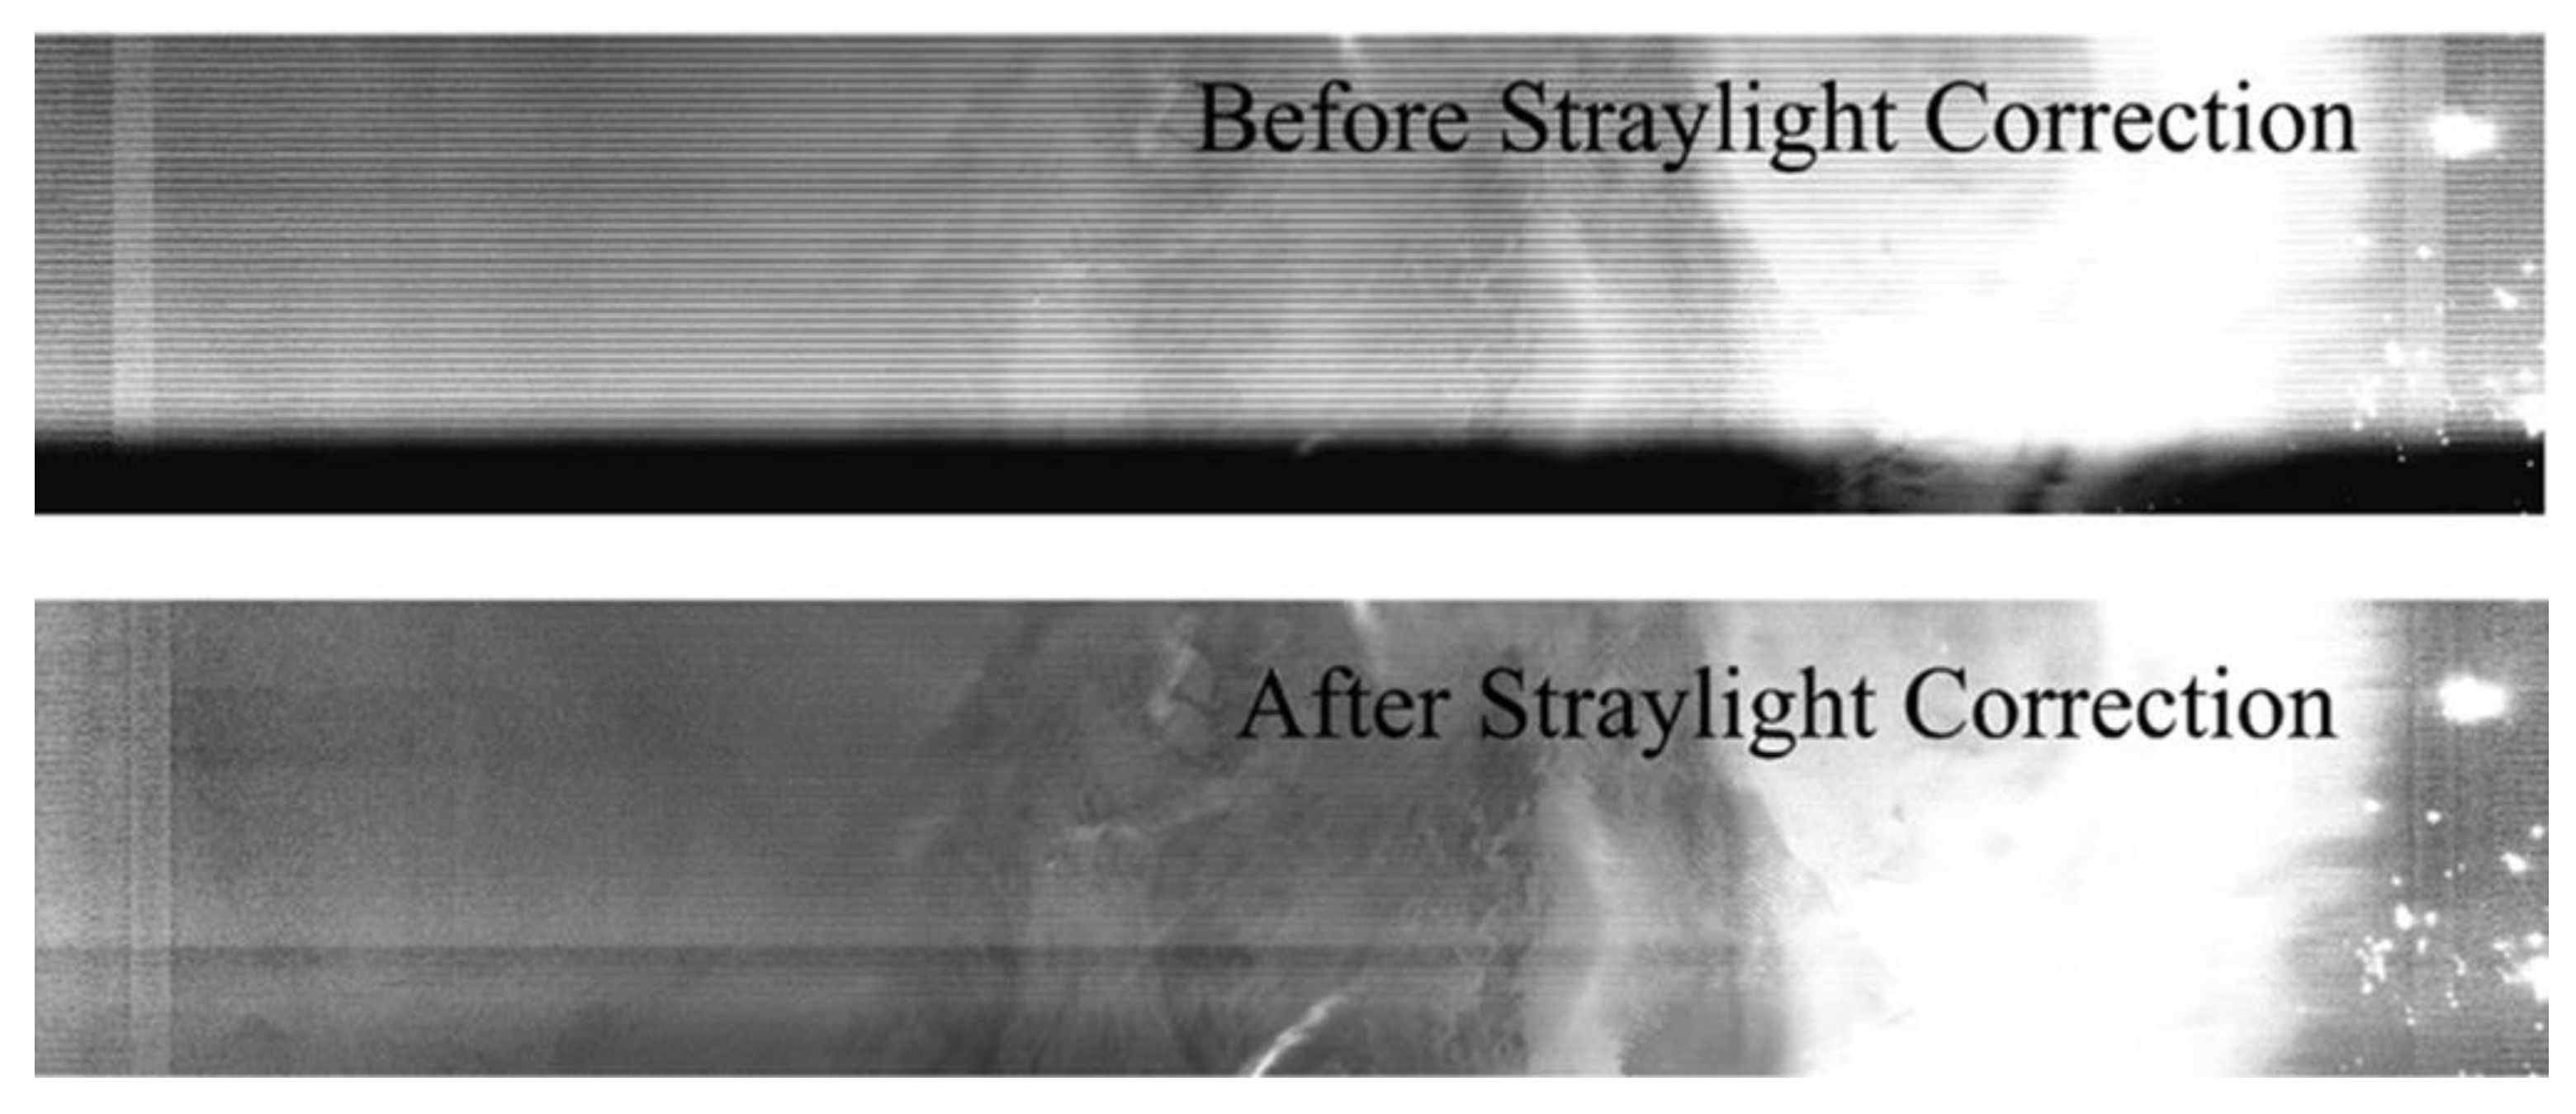
3.6. Recalibration Improvements for the DNB

VIIRS DNB operates with three different gain stages that have the same spectral range and cover a wide radiometric dynamic range. It uses Low-Gain Stage (LGS) for daytime scenes, Mid-Gain Stage (MGS) for twilight scenes and High-Gain Stage (HGS) for nighttime scenes. DNB maintains a constant spatial resolution across the scan by dividing the entire swath into 32 aggregation zones on each side of the nadir. Although NOAA operational DNB calibration meets the specification requirements, as discussed in [54], there are some major issues with DNB operational data: (1) on-orbit calibration coefficients were not updated until late March 2012 (previously prelaunch values used); (2) no accommodation of the Relative Spectral Response (RSR) change in operational calibration resulting from telescope throughput degradation until April 2013; (3) no straylight correction until the middle of 2013; (4) atmospheric airglow contamination for the first five years of nighttime data, resulting in low absolute accuracy and substantial presence of negative radiance; (5) the presence of strong striping in radiance for higher aggregation zones (29–32) before January 2017 [54].
The DNB is radiometrically calibrated by a linear equation
L = G × ( DN DN 0 ) / RVS
where dark offset (DN0) and gain coefficient (G) are two key parameters for converting the instrument-measured digital number (DN) to radiance (L). Response Versus Scan (RVS) accounts for scan angle. The dark offsets are kept constant prior to launch. However, after launch, dark offsets of all three gain stages were updated monthly using the nighttime measurements over the Pacific Ocean during a new moon through the VIIRS recommended operating procedures (VROPs) [55].
Due to its extremely high sensitivity, DNB HGS is capable of detecting a faint airglow [54,56]. In order to correctly estimate the artificial lights for different application studies, atmospheric airglow needs to be corrected. However, due to the large variability in airglow, this is always a challenge [54,56,57]. The SDRs produced using NOAA operational calibration before December 2017 were impacted by airglow. The dark Earth scenes collected during monthly dark offset collection over Pacific Ocean (ref: VROPs) include atmospheric airglow. This resulted in the overestimation of HGS dark offset for its EV calibration. As discussed in a previous study, the impact of airglow contamination in dark offset resulted in a significant impact at a low radiance level, i.e., at 3 nW/[cm2.sr] DNB radiance level, the radiometric accuracy is degraded by more than 10% [54]. The underestimation in radiance by nearly 10% at 3 nW/[cm2.sr] is also explained in the study by [58]. To remove the impact of airglow in calibration, an updated method similar to [59] was developed to derive the dark offset. The technique first determines a baseline HGS dark offset using the DNB observation of deep space collected once during the spacecraft pitch maneuver early in the mission [60]. Every month, the on-orbit based offset is updated after accounting for the drift computed using the onboard Blackbody (BB) data. The HGS dark offset determined by the updated method can significantly improve low-light radiance accuracy [54]. Although the updated method has been implemented in the operational calibration since January 2017, the recalibration uses the updated method for the entire VIIRS data record (Figure 7).
In addition to the improvement in the absolute accuracy of low-light radiance calibration, the airglow-free dark offset resulted in a significant reduction in negative radiance pixels. Previously, the operational calibration using the old technique of offset derivation for HGS (based on Pacific Ocean until Dec. 2016) led to the majority of pixels near the new moon having a negative radiance. The removal of airglow reduced offset, which moved most of those negative radiance pixels near the new moon to the positive range [54]. As explained in [54], after using airglow-free deep-space-based dark offset, the entire VIIRS-recalibrated data quality improved with the reduction in the negative radiance pixels by more than 70% near the nadir and by more than 40% near the edge of the scan. The remaining pixels with negative radiances occur at extremely low radiance levels, where the measurements are dominated by the sensor’s noise, an inherent nature of photon detection.
The determination of DNB gain coefficient is relatively complicated, due to the varying dynamic range from daytime (LGS) to nighttime (HGS) observations. The LGS gain is calibrated using the onboard SD when it is fully illuminated by the sun
G LGS = L SD dn SD
where dnSD is the offset-corrected LGS SD response. The expected solar radiance received by the SD (LSD) is calculated by the following equation
L SD =   H DNB × RSR DNB × RVS DNB × E sun × BRDF × τ SDS × cos ( θ inc ) 4 π d 2 d λ
where H is the H-factor-characterizing degradation of the SD, Esun is the solar spectral irradiance, BRDF is the bidirectional reflectance distribution function of the SD, τSDS is the transmission function of the screen in front of the SD, RSR is the relative spectral response function of the LGS, θinc is the incident angle of sunlight arriving at the SD, and d is the distance between the Sun and the satellite in the astronomical units. Due to the wider spectral response, the telescope throughput degradation in VIIRS leads to a continuous change in the DNB RSR. RSR was updated only once for operational calibration in April, which resulted in a discontinuity of 3%–4% (Figure 8) in the LGS gain, which eventually propagated to the MGS and HGS gain. However, recalibration used more than 50 sets of RSRs, accounting for a near continuous change in RSR over time. The details can be found in [54]. Since both MGS and HGS are saturated with SD view, their absolute gain is determined using the gain ratio approach: the LGS gain is transferred to the MGS gain by multiplying the gain ratios of MGS/LGS, and then transferred to the HGS gain by further multiplying the gain ratios of HGS/MGS.
G MGS = G MGS / LGS × G LGS
G HGS = G HGS / MGS × G MGS / LGS × G LGS
Both GMGS and GHGS are updated monthly using the DNB data collected in the twilight region. Gain ratios are determined using EV observation over the twilight region, where the gain stage transition happens. Unlike the dark offset, which changes significantly over time for HGS, gain ratio trends are nearly constant over time [54].
The DNB imagery near the terminator is degraded by straylight, which results from the solar illumination of the instrument when the satellite passes through the day–night terminator. Straylight is seen on the night side of the terminator when the satellite moves from either from daytime to nighttime over the northern hemisphere, or from nighttime to daytime over the southern hemisphere. Monthly stray-light LUTs were prepared over 12 months, and they are reused in similar months in consecutive years. There are several earlier studies which describe, in detail, how the DNB straylight is characterized and corrected using a monthly LUT [61,62]. Figure 9 shows a significant improvement in the DNB imagery after the straylight correction. Straylight correction was implemented during operational calibration in August 2013. In the recalibration, straylight correction was performed for the entire DNB time series since launch.
During recalibration, the prelaunch-based dark offset and gain coefficients used before 20 March 2012 were also replaced by the postlaunch-based values to establish consistency. All the major calibration updates, as discussed above, have led to a consistent radiometric calibration time series with improved absolute accuracy for the entire recalibrated VIIRS DNB sensor data record. Although reprocessing has resulted in consistent calibration over the entire mission of SNPP VIIRS DNB, for long-term studies that can involve multiple sensors, it is equally important for users to understand the relative radiometric consistency with other instruments. Past studies show how DNB observations over bright stars can be used to study the relative radiometric consistency between multiple VIIRS DNB sensors [63], and trending the gain of individual VIIRS DNB sensor [64]. Another study has shown how the moon-illuminated DCC at night can be used to evaluate the radiometric consistency among DNB sensors [65]. The reprocessing of the entire DNB archive using an airglow-free dark offset has improved the absolute calibration at low-light radiance. However, the absolute calibration of the DNB sensor on-orbit for nighttime imaging is very challenging. One such effort has been made through vicarious calibration by using a point light source in the ground [66], although the technique has large uncertainty due to atmospheric variabilities.

3.7. Geolocation Recalibration Improvements

Several major S-NPP VIIRS geometric calibration parameter updates were performed prior to 22 August 2013 to reduce errors in the VIIRS I-bands, M-bands, and DNB geolocation products. Moreover, DNB terrain correction was not implemented in the SNPP operational processing until 22 May 2015, while terrain correction was implemented for I-bands and M-bands geolocation from the beginning of the mission. Details of S-NPP VIIRS geometric calibration updates in the NOAA operational processing are available in [17]. During the version 2 reprocessing, optimal versions of GEO LUTs were used: version 8 GEO PARAM LUTs were used for data before 25 April 2013 15:20 UTC and version 9 GEO LUTs were used after this time. Terrain correction was applied to DNB geolocation from the beginning of the mission. An evaluation of geolocation improvements will be presented in Section 4.3.

4. Verification and Validation of Recalibrated Data

Calibration is the process of quantitatively defining the system response to known, controlled signal inputs, and validation is the process of assessing, by independent means, the quality of the data provided (CEOS http://ceos.org/ourwork/workinggroups/wgcv/ accessed on 31 November 2020). Operationally, calibration converts raw satellite measurements in counts into radiances with geophysical units using a computer system which consists of algorithms and software codes, with calibration input parameter datasets (or look-up tables). As far as recalibration is concerned, it has are three distinct sections: the raw satellite measurements or raw data record (RDR), the calibration algorithm, and the calibration input parameter datasets. Any change in the three quantities would lead to a change in the resultant radiance values. For our recalibration, the raw data record remains intact in most cases, except in the VIIRS DNB dark offset, where there is an algorithm change, which mainly occurs in the thermal emissive bands, as discussed in the previous section. Therefore, the majority of the changes in calibration occur in the input parameter datasets or LUTs, especially for the reflective solar bands (mostly captured in the F-factor or 1/gain). As a result, one approach to the verification and validation of the recalibrated data is to compare the F-factors from different versions, while validation of the calibration sensor data records can be performed over vicarious targets. In the following, we first evaluate the recalibration VIIRS RSB data over deep convective clouds. Then, the F-factors are compared between different versions.

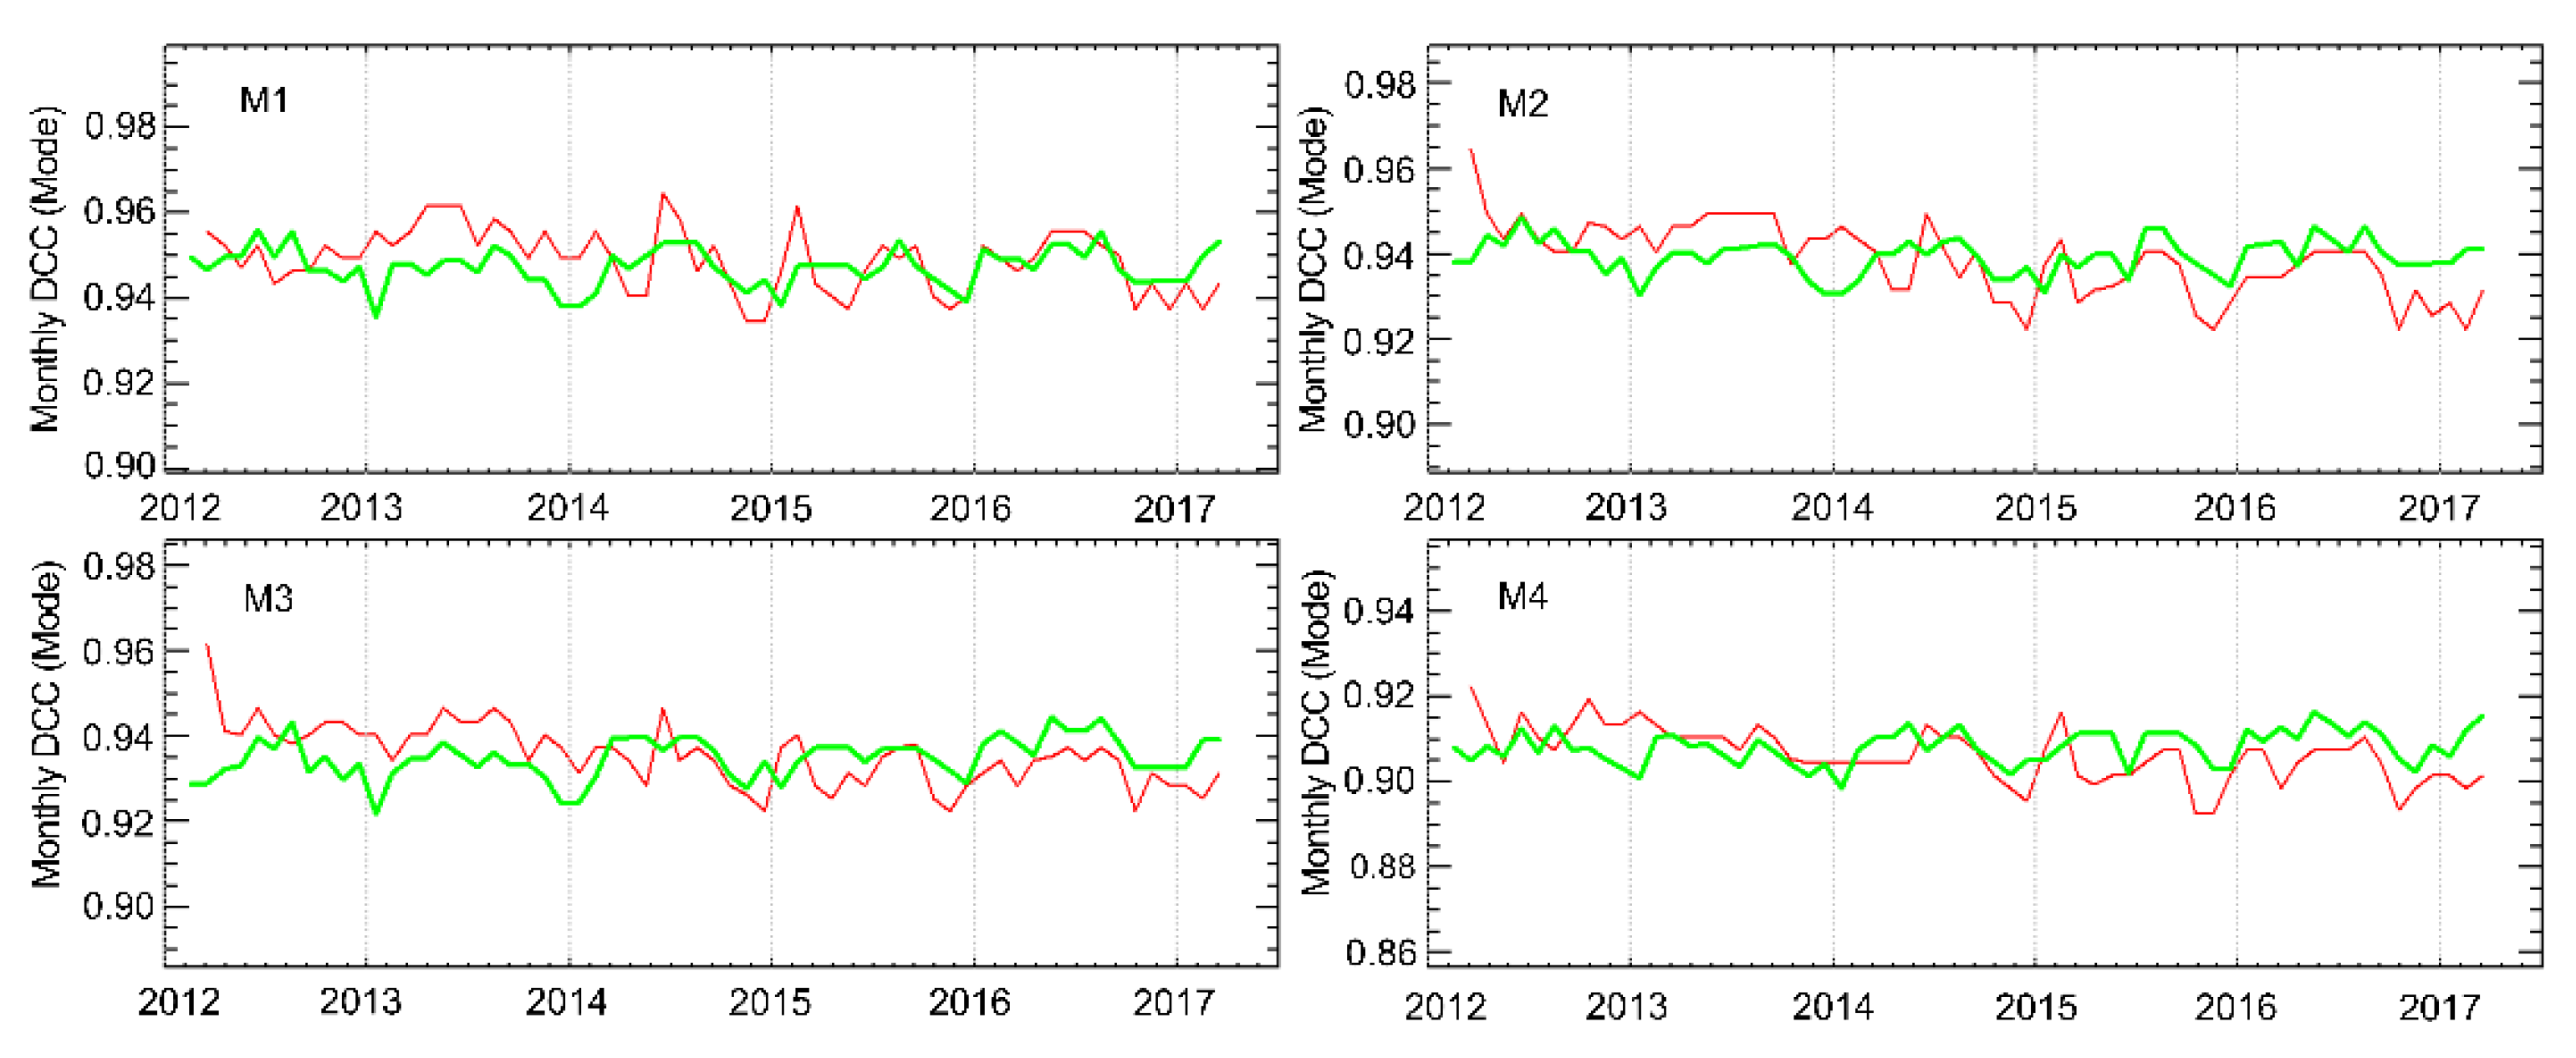
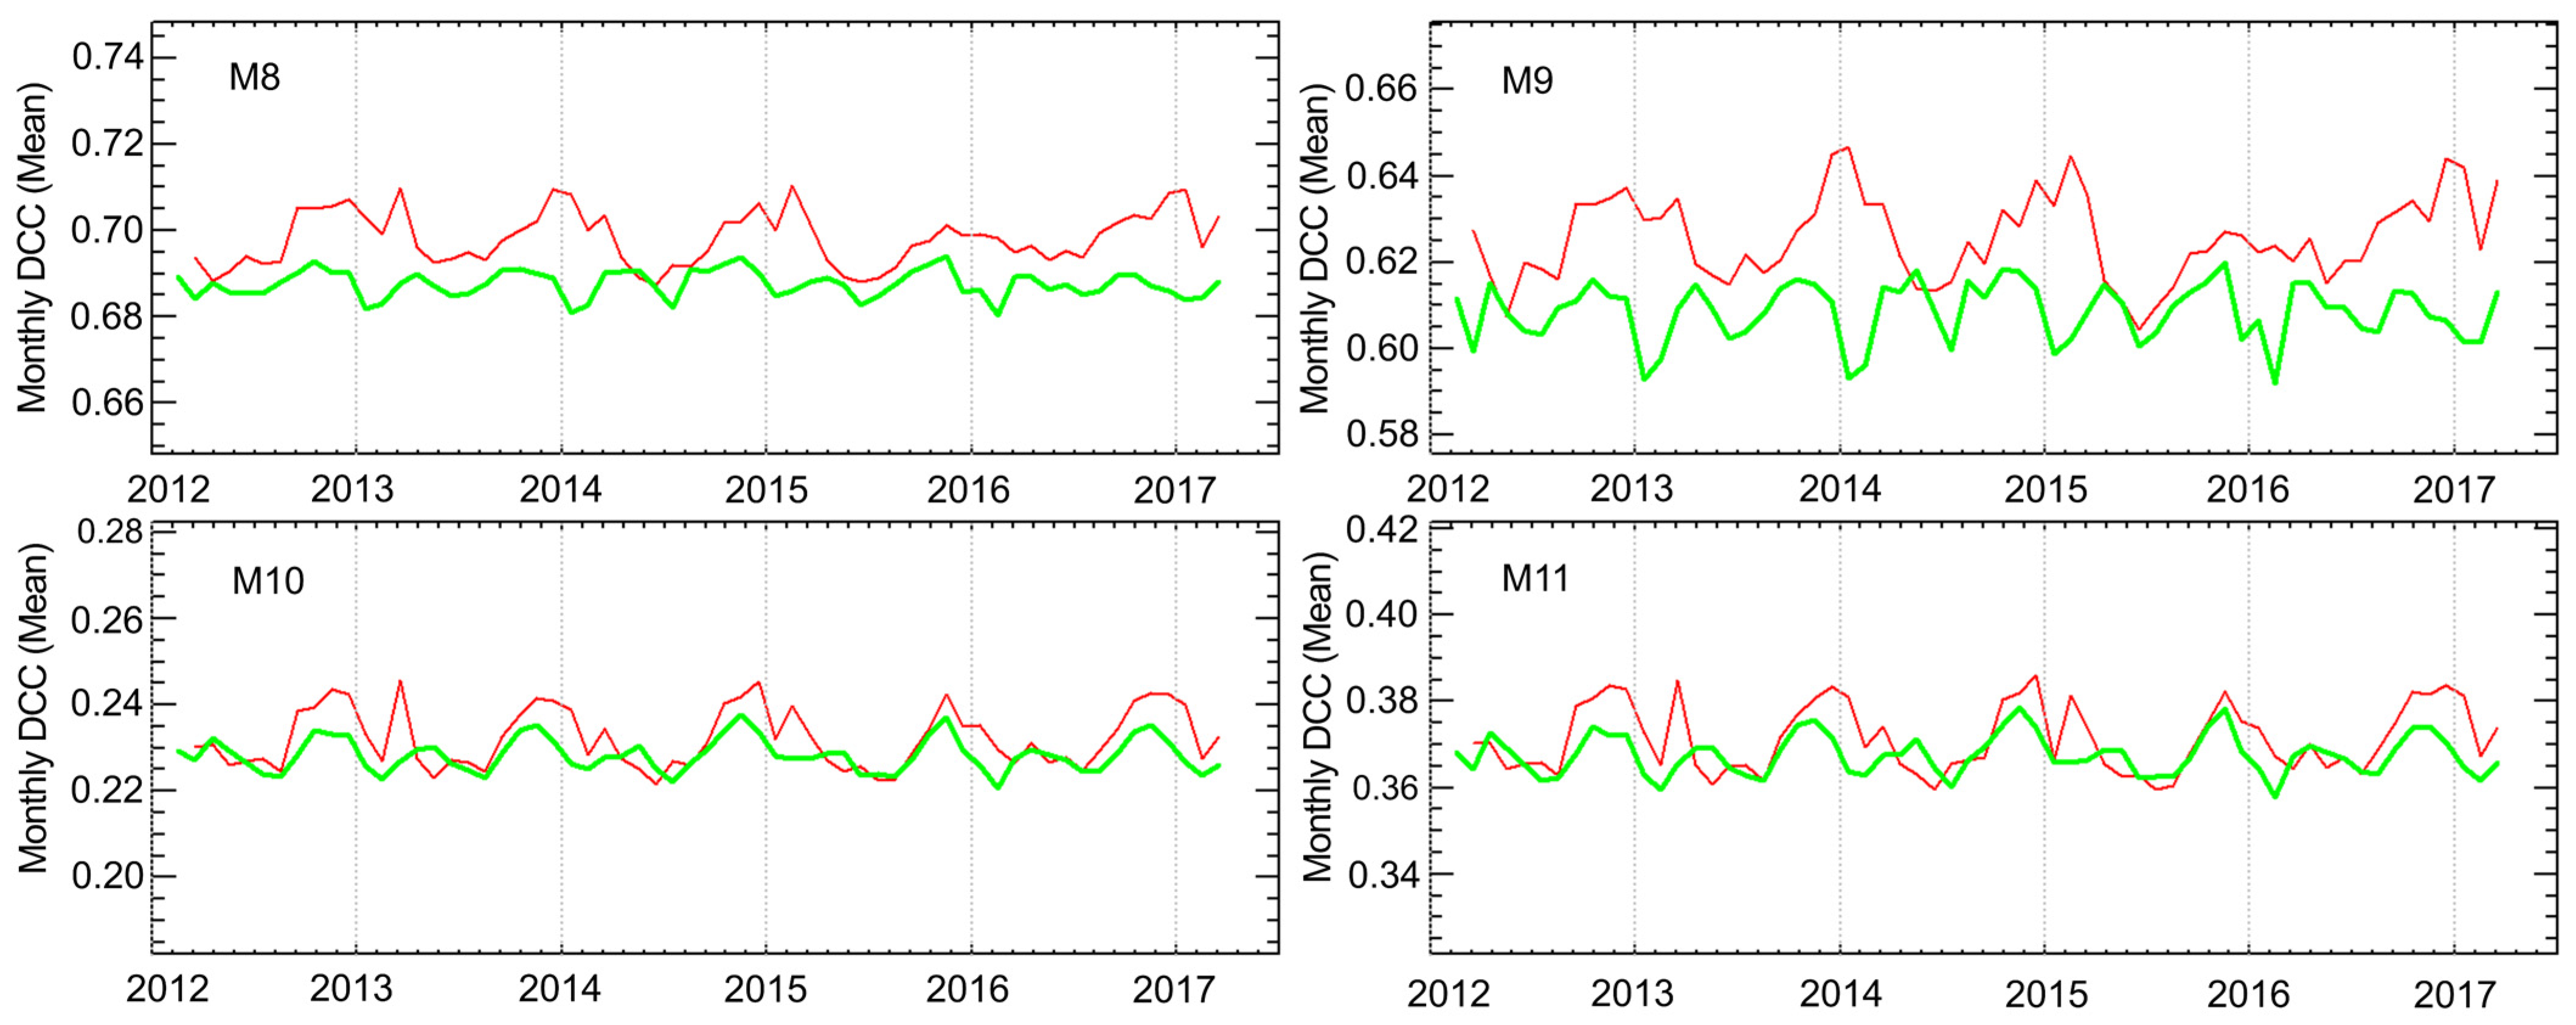
4.1. Evaluation of Version 2 Recalibrated S-NPP VIIR RSB SDR over DCCs

As discussed in earlier sections, improving the temporal stability and the absolute radiometric accuracy are the two major objectives of recalibration of VIIRS data record. To assess the improvement in data quality after recalibration, data need to be independently validated using different techniques, such as using stable vicarious sites, and deep convective clouds (DCC), lunar calibration, and comparisons with other well-calibrated sensors [4,16,23,35,48,67,68,69].
In this section, we used TOA reflectance trending over DCCs (after applying the Kalman-based correction) to evaluate the improvement in the temporal radiometric stability after recalibration. This study uses the mode (for VNIR bands) and mean (for SWIR bands) of monthly DCC reflectance to study the VIIRS recalibration performance. Drifts observed in the monthly PDF mode or mean values are used to analyze the calibration stability. Note that monthly DCC time series, derived using data after solar calibration, were used as one of the inputs, as well as SNOs and lunar F-factors, to generate Kalman-filter-based correction terms for VNIR band recalibration, except for M3 and M4. Strictly speaking, DCC observations are not independent of calibration for the reprocessed VNIR bands. However, DCC results may still provide some useful information about the long-term calibration stability after recalibration. Different from the VNIR bands, DCC time series were not used for the SWIR bands’ recalibration; therefore, they can be used to independently assess the recalibration improvements in these bands.
Figure 10 shows bands M1-M4 of monthly DCC time series before and after recalibration. Statistics of monthly DCC time series for all VNIR bands are summarized in Table 4. Our analysis shows that the recalibration is critical in reducing the residual degradation in the instrument. M1-M4 exhibit the largest improvement in temporal radiometric stability after recalibration among all VNIR bands. After recalibration, DCC-based reflectance trends indicate that the residual degradation trends are reduced to <0.3%, except for bands M3 and M4. The larger degradation for M3 and M4 could mainly be attributed to uncertainties in the DCC technique or the nonlinear calibration coefficients for the two bands (DCCs are very bright at the M3-M4 wavelengths). As we can observe in the Kalman Filtering (Figure 4), unlike bands M1 and M2, DCC trending for M3 and M4 does not align well with lunar trends, and hence the Kalman Filtering algorithm places less weight on DCC trends for these bands when deriving the gain. Since the SNOx trend aligns better with lunar trending for the M3 and M4 band, the SNOx-based time series, after recalibration, indicates better than 0.3% temporal stability for both M3 and M4. The larger trends in the DCC time series for M3 and M4 need to be further investigated in future. No significant residual degradation trends were observed in M1-M2. The results for M7 and I2 are similar to those of M1-M2. Small upward trends were observed in bands M3-M5 and I5. As explained earlier (Section 3.3), when the Kalman-filter-based gain is derived, two closely matching input trends are assigned the major weights for gain derivation. Interestingly, unlike bands M1 and M2, DCC trending for band M3-M5 and I1 does not align well with lunar trending. For M3, SNOx-based desert trending aligns better with lunar trending than DCC. One of the reasons for M3-M5 and I1 DCC trending being less aligned with the moon and SNOx could be the larger uncertainty in the BRDF correction. However, this needs to be further investigated in the future.
Figure 11 shows bands M8-M11 monthly DCC time series before and after the recalibration. The statistics of the monthly DCC time series for all SWIR bands are also summarized in Table 4. Our results indicate that the SRRS model (section X) performed well for the recalibration purpose. For SWIR bands, the residual calibration drifts are relatively small compared to VNIR bands. After recalibration, residual degradation trends are successfully minimized for M8-M9 and M11. M10 and I3 show relatively larger residual trends, of about −0.05%year.
DCC and SNOx trending results indicate that, after recalibration, VIIRS reflective bands meet the long-term stability requirement, and are well within the specification of 0.3%. Moreover, bands M1–M2, M7–M9, M11, and I2 are stable to well within 0.1%. This is a major achievement in RSB calibration and serves the broader user community well, including the ocean color community, which demands a stringent calibration stability requirement of better than 0.2%.

4.2. F-Factor Comparison with other Independent Calibrations

There are several versions of F factors for the reflective solar bands: the operational version, the latest Kalman filtering version (v2), the prior version (v1), the ocean color version (OC), and the NASA version. The differences in the F-factor between the latest version in recalibration over the previous versions represent improvements using the advanced methodology of Kalman filtering, as discussed in Section 3.3. We have compared the different versions of F factors in chronological order to show the improvements.

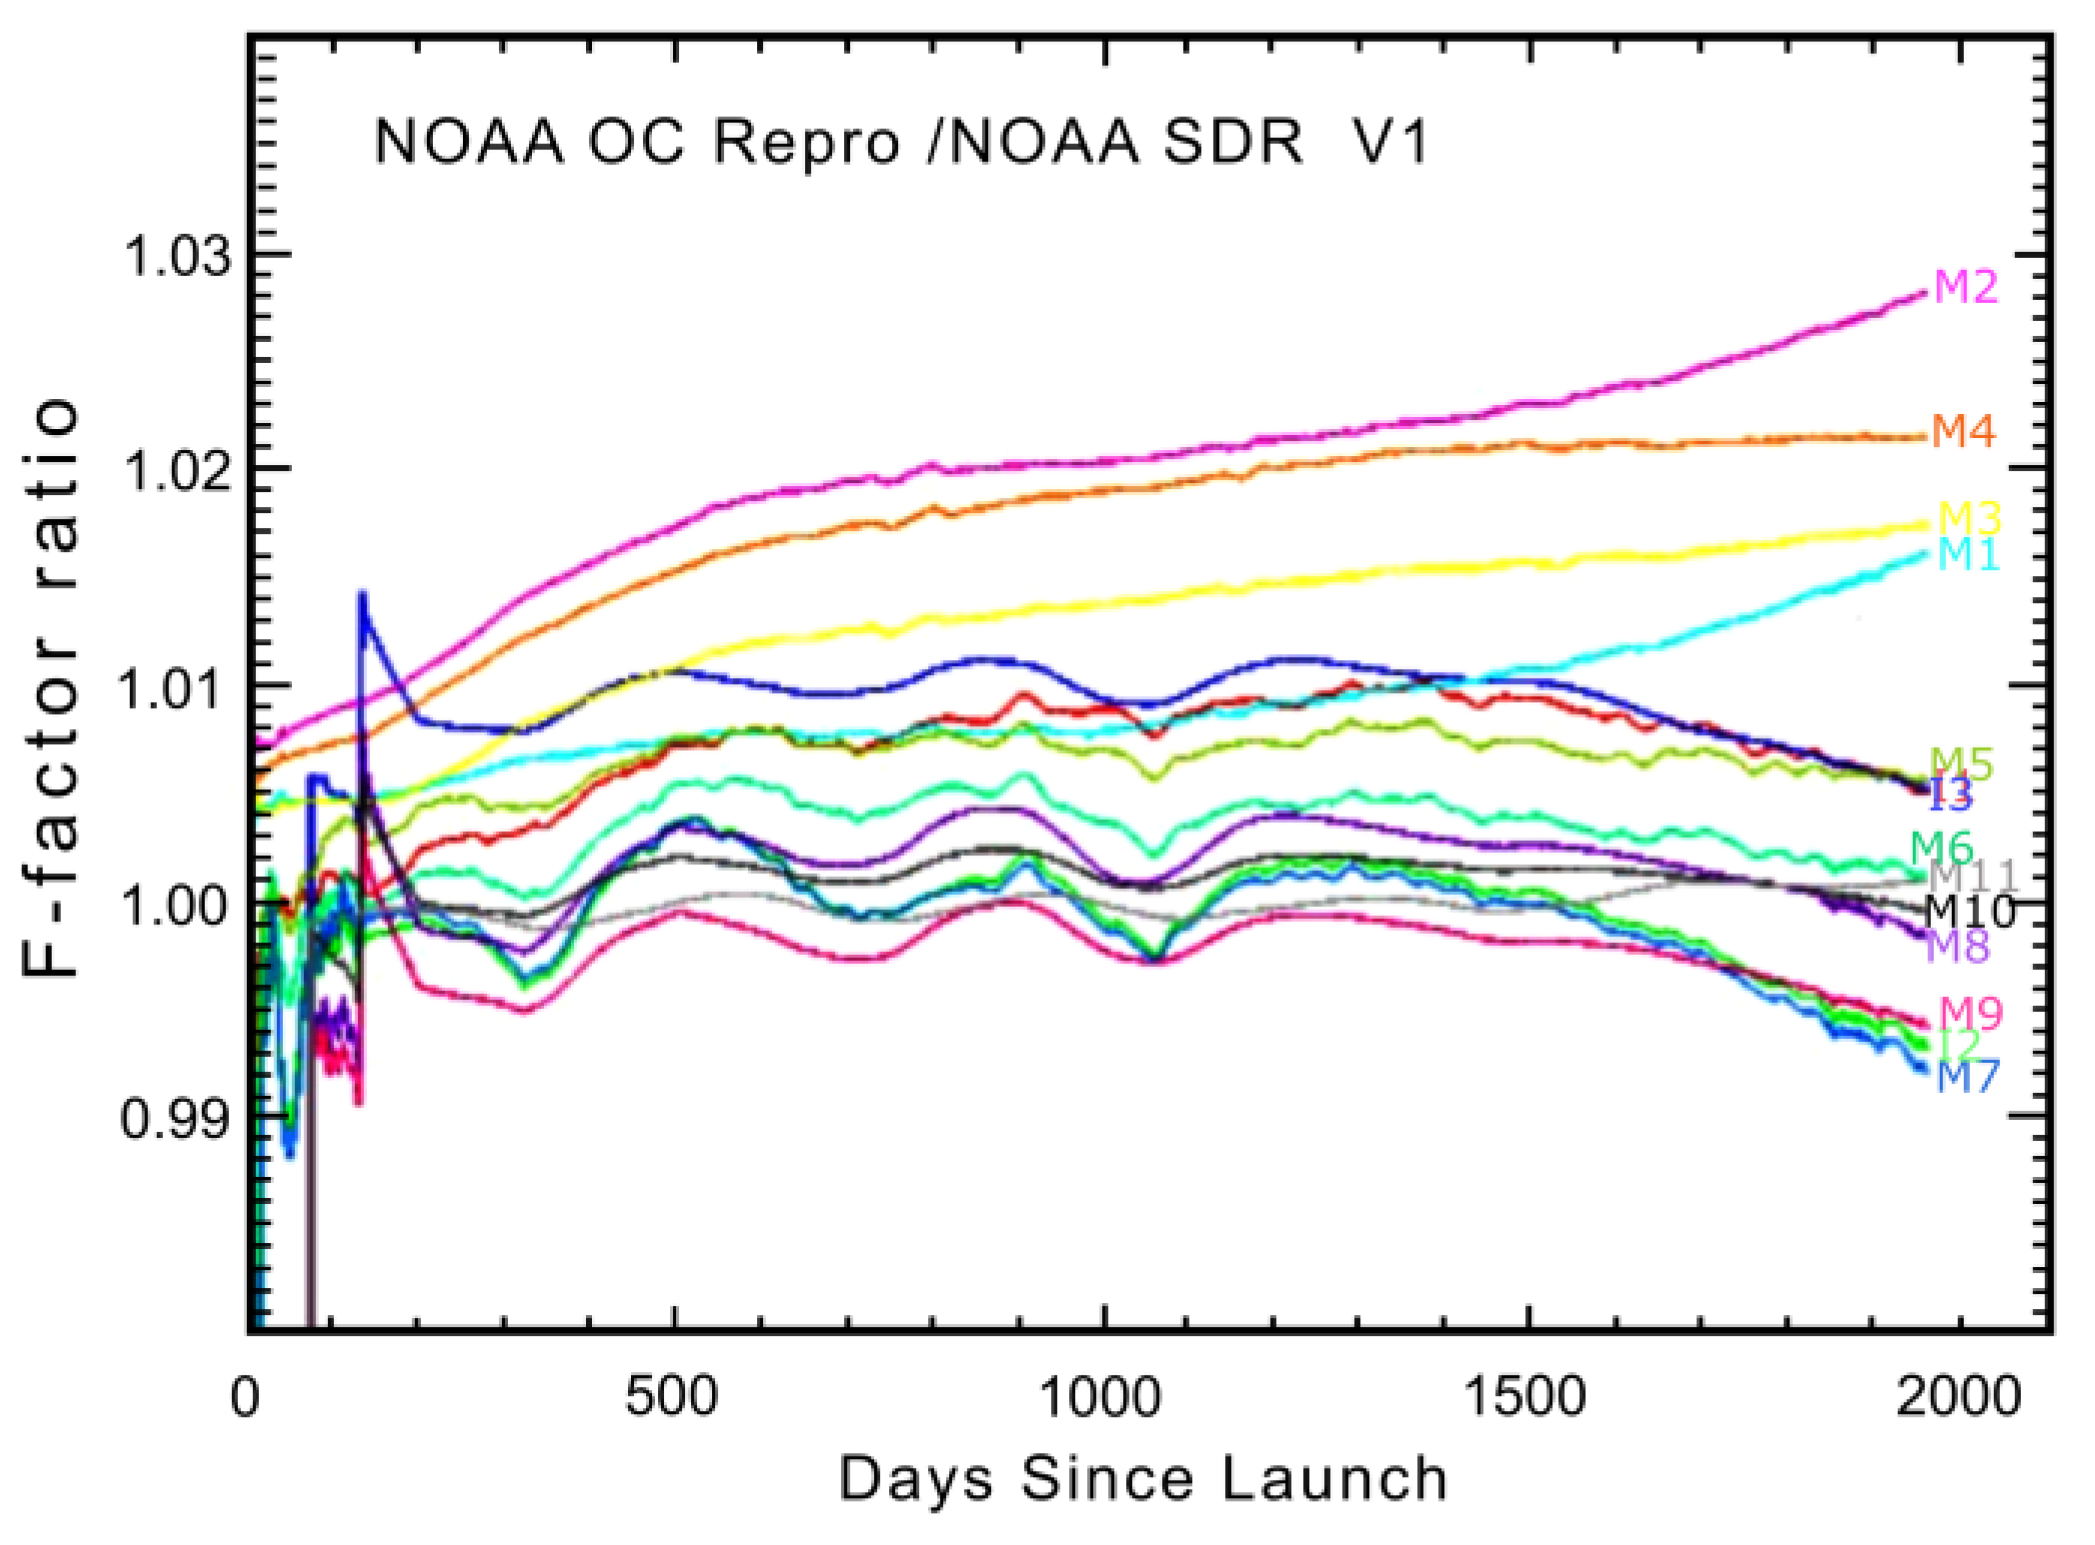
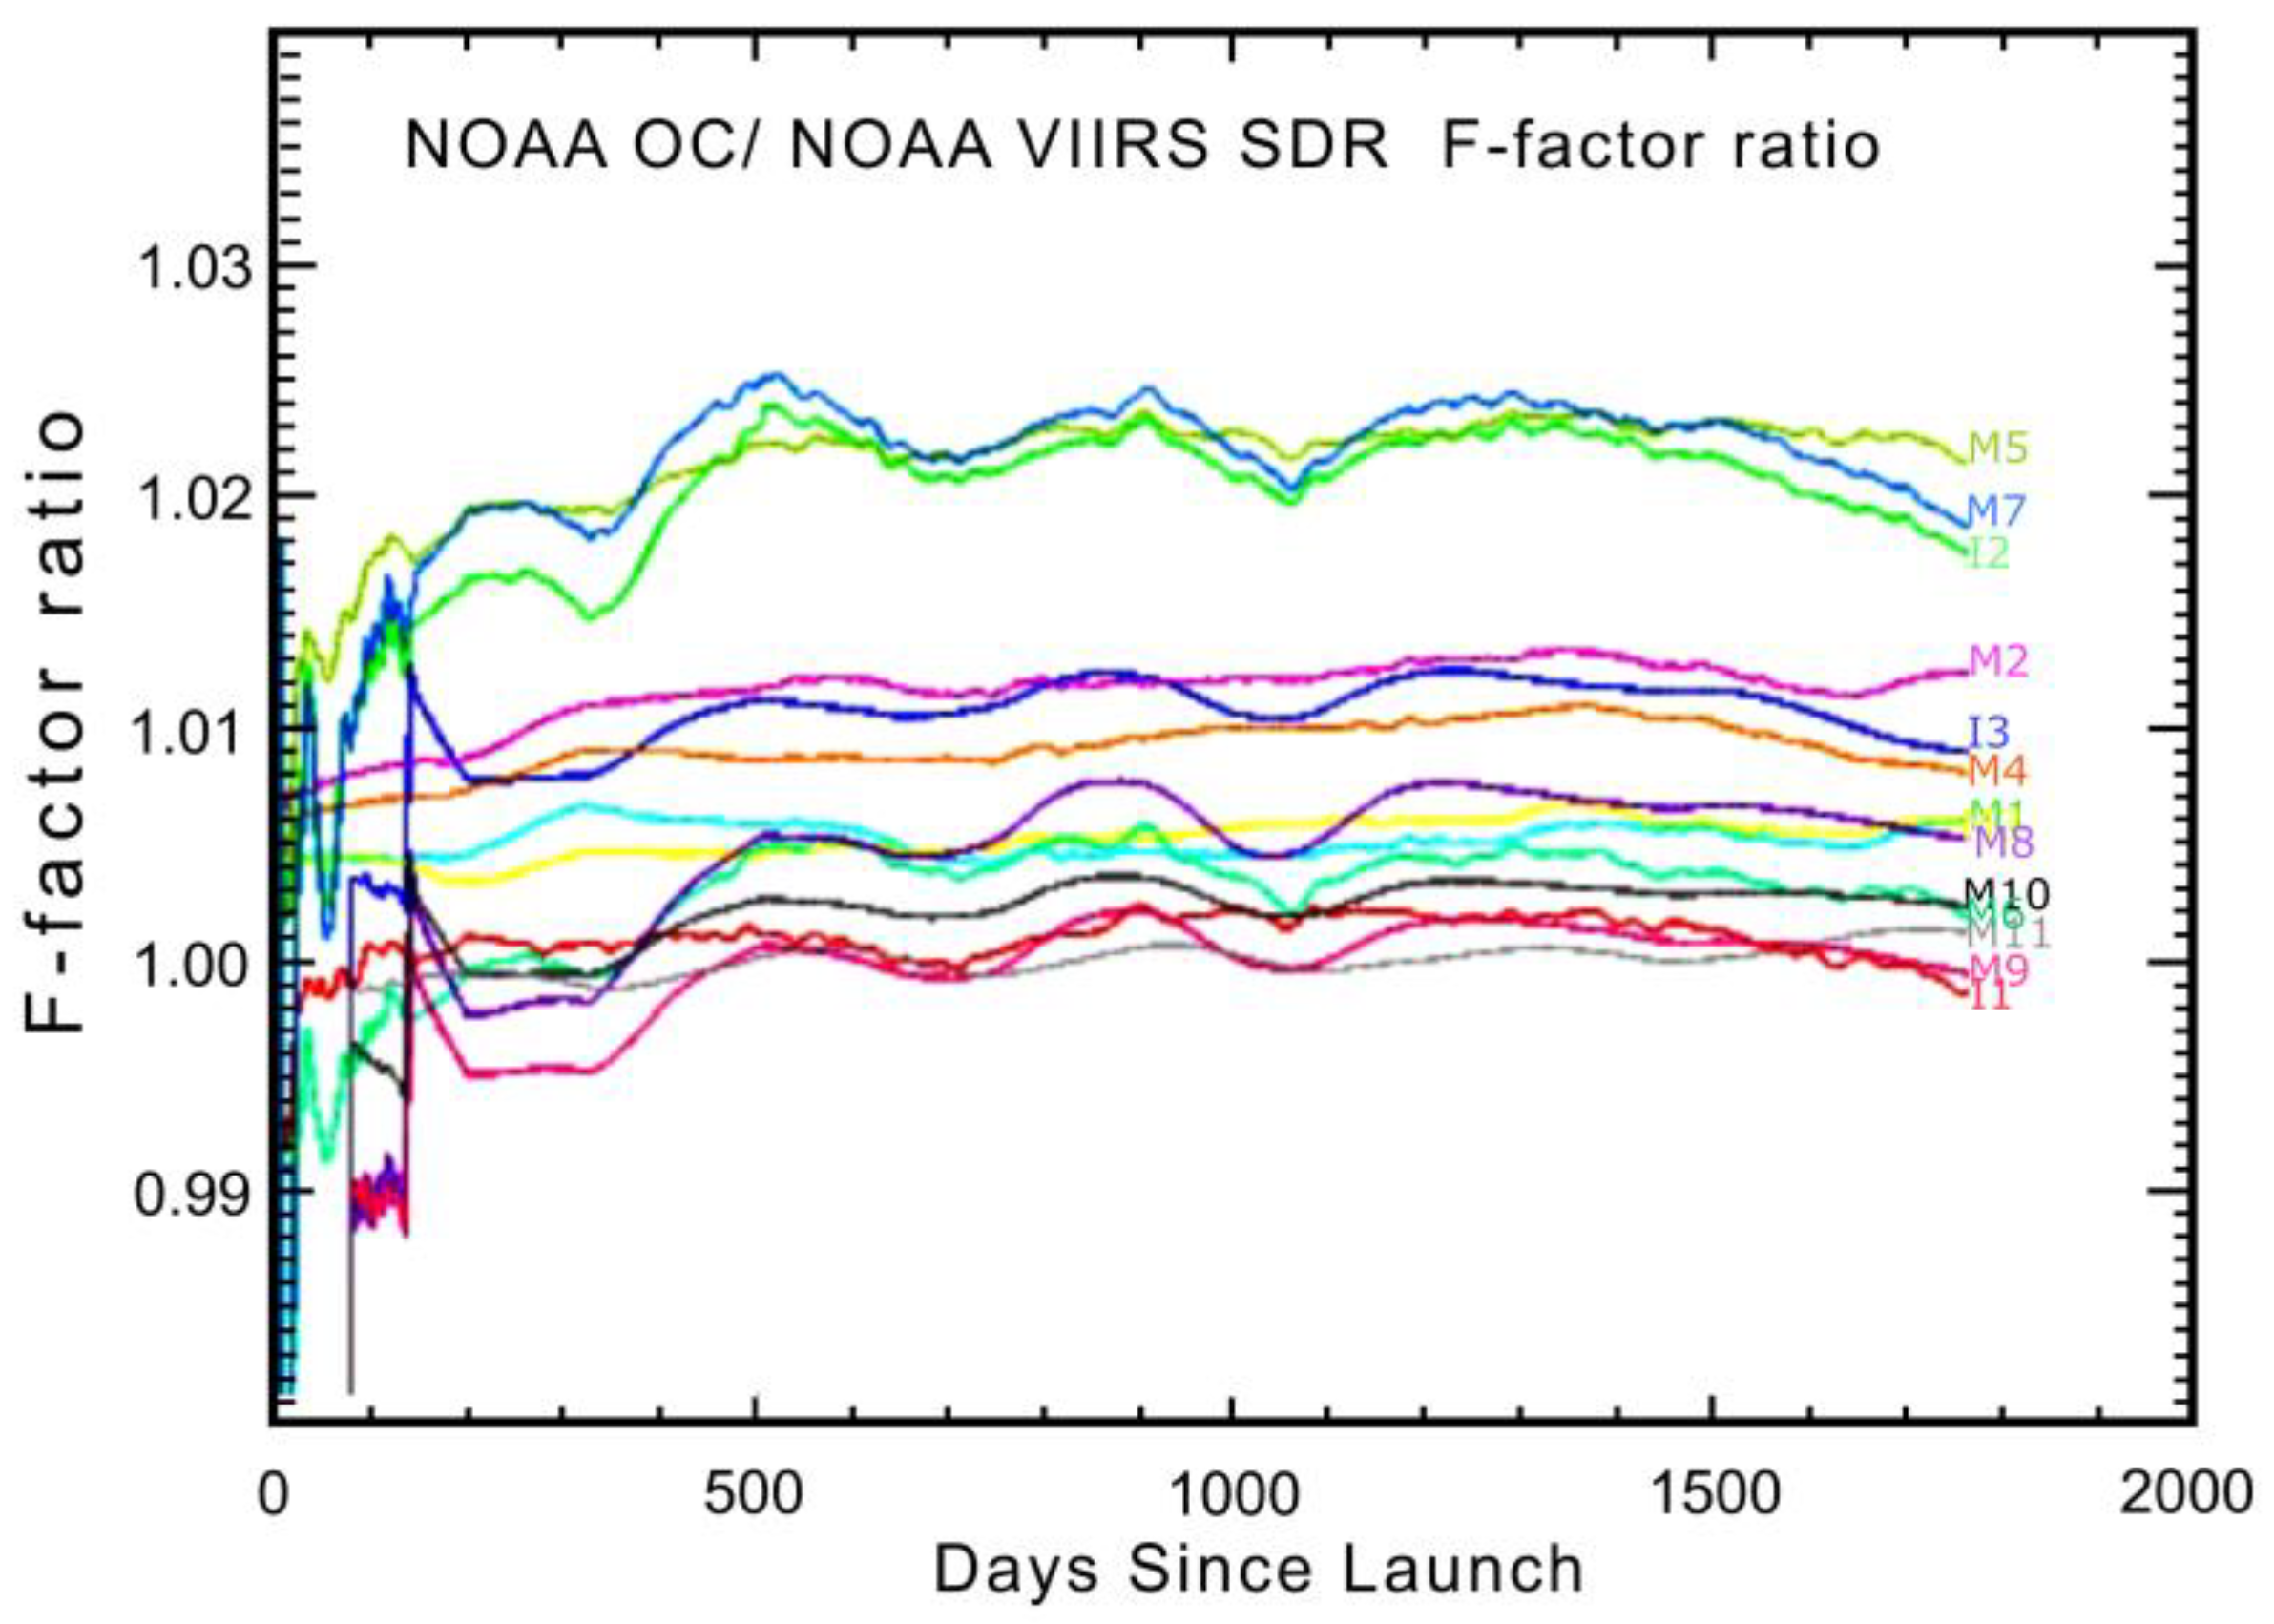
4.2.1. Comparisons between OC and V1 SD F-Factors

It is well known that the operational version of the F-factors has a number of inconsistencies resulting from major LUT updates. This led to the development of a consistent version, known as version 1 (V1). However, V1 recalibration was still solely based on onboard solar diffuser calibration. The deficiency of this approach is revealed when compared with the OC version (which incorporates the lunar calibration, especially in bands M1-M4), Figure 12. A key weakness of using onboard solar diffuser calibration alone is that residual degradation is not accounted for by the short wavelength bands. For example, the F-factor ratio between these two can be larger than 2%, which means that the residual degradation of not using the lunar calibration can be >2% in the long-term trend.

4.2.2. Comparison between V1, OC and V2 F-Factors

Recognizing this issue of residual degradation, the VIIRS SDR team developed a new and comprehensive approach to incorporate not only lunar, but also other independent calibration information, such as using a deep convective cloud, desert, and SNOs. All independent calibration is synthesized using the Kalman filtering approach, which is the latest version presented in this paper (referred to as V2). Figure 13 shows that the F-factor ratios are significantly reduced between V2 and OC. In addition, ratio trends are nearly flat indicating more stable calibration over the mission life. Note that high M5 and M7 biases are accounted for in the V2, but not accounted for in OC, and this stands out in the F-factor ratio. Solar irradiance model differences, which give static differences in each band, as explained in Section 3.1, are not reflected in these comparisons.

4.2.3. Comparisons between NASA F-Factors and NOAA V2 F-Factors

The static differences between the NASA and NOAA V2 F-factors are mostly caused by the solar irradiance differences. NASA F-factors are based on the MODTRAN solar irradiance model, whereas NOAA V2 F-factors use the Thuillier 2003 model, as mentioned previously. Figure 14 shows an F-factor in each band, with detector 1 and HAM side 1 in high- (or single-) gain state. The starting point differences are caused by the Esun, as shown in Figure 1. The additional static differences are observed in the short wavelength bands (M1-M4) in Figure 14a,c below. These differences are caused by the different filtering results from NASA and NOAA. NASA F-factors are biased to the initial two lunar F-factors that provided a greater increase in the first year of F-factors, as shown in Figure 14a,c [28]. On the other hand, NOAA version 2 F-factors are derived using the combination of the lunar, DCC, SNOx and SD trends, as shown in Figure 4.
The F-factors are very similar for bands M6, M7, M8 and I2, due to the very small solar irradiance differences of less than 0.2%. The long-term trends are also very similar in bands M5, I1 (Figure 14b) and M9-11 and I3, except for the solar irradiance differences. The large detector responsivity changes in these bands are well-captured by the NASA and NOAA F-factors.
As discussed earlier, a major improvement in VIIRS data after recalibration is the increased radiometric accuracy. Past studies on NOAA VIIRS operational data indicate that the radiometric bands’ M5 and M7 calibration was overestimated by 1.5% and 2%, respectively [33,34,70]. The rest of the RSBs suggest absolute calibration accuracy well within the specification of 2%. One exception is the VIIRS band M11, which does not meet the above specification and has a waiver. Similarly, imagery band I2, which spectrally matches with M7, also suggests a bias on the same order. Since these biases are not time-varying, a constant scaling in the recalibrated radiance/reflectance can directly improve the data quality. The scaling factors for M5, M7, and I2 are incorporated into the Kalman-Filtering-based bias correction value to account for the increased absolute calibration. Thus, for these three bands, both residual drift correction and absolute accuracy correction are performed in the recalibrated data.

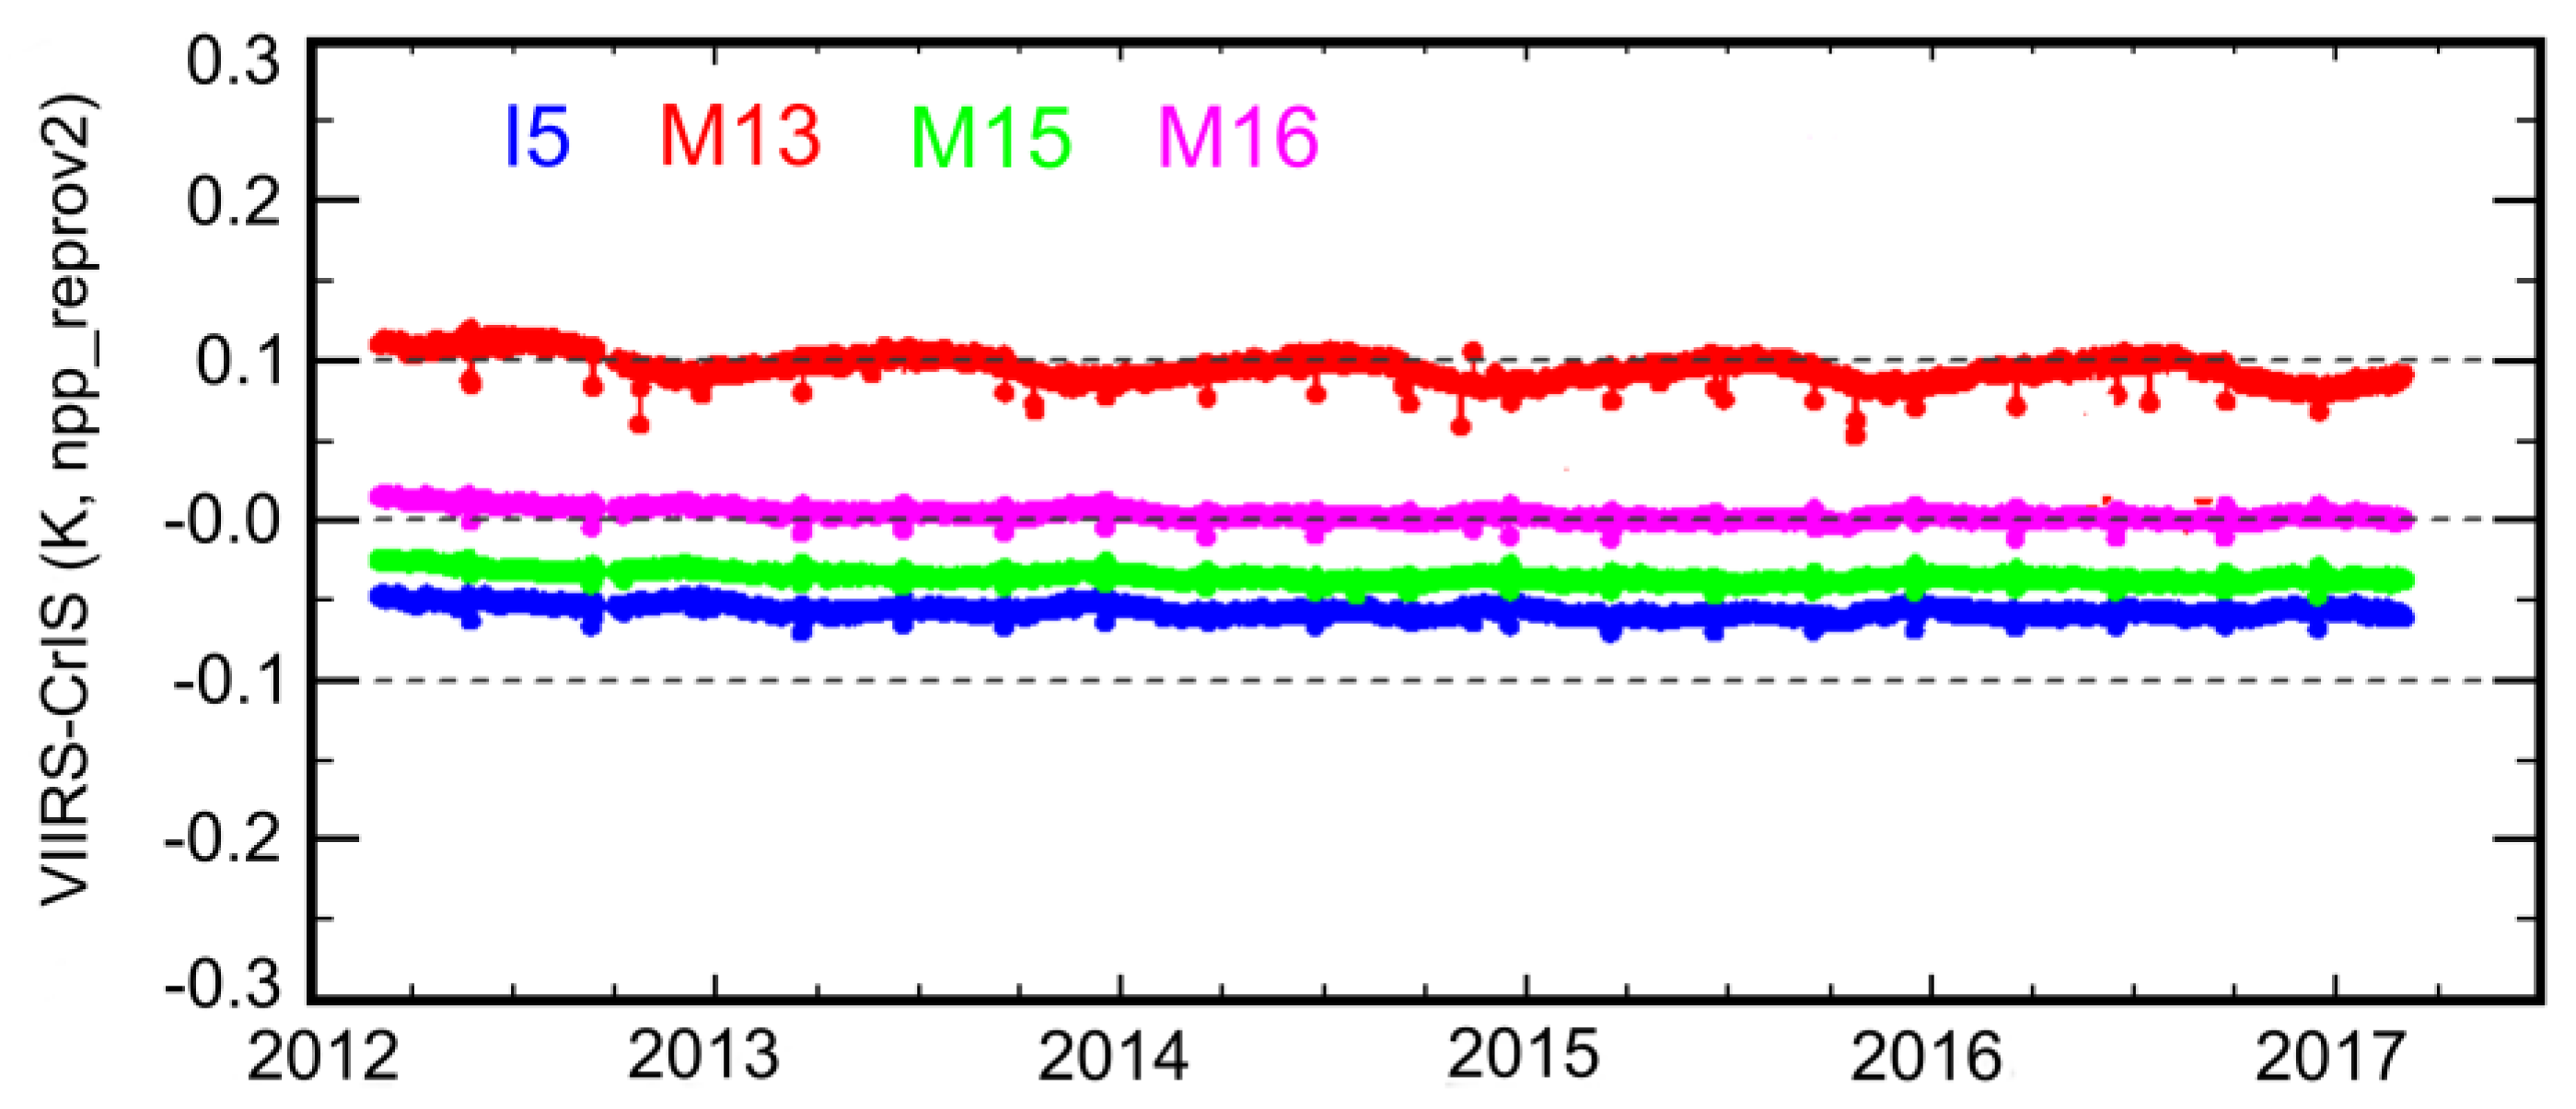
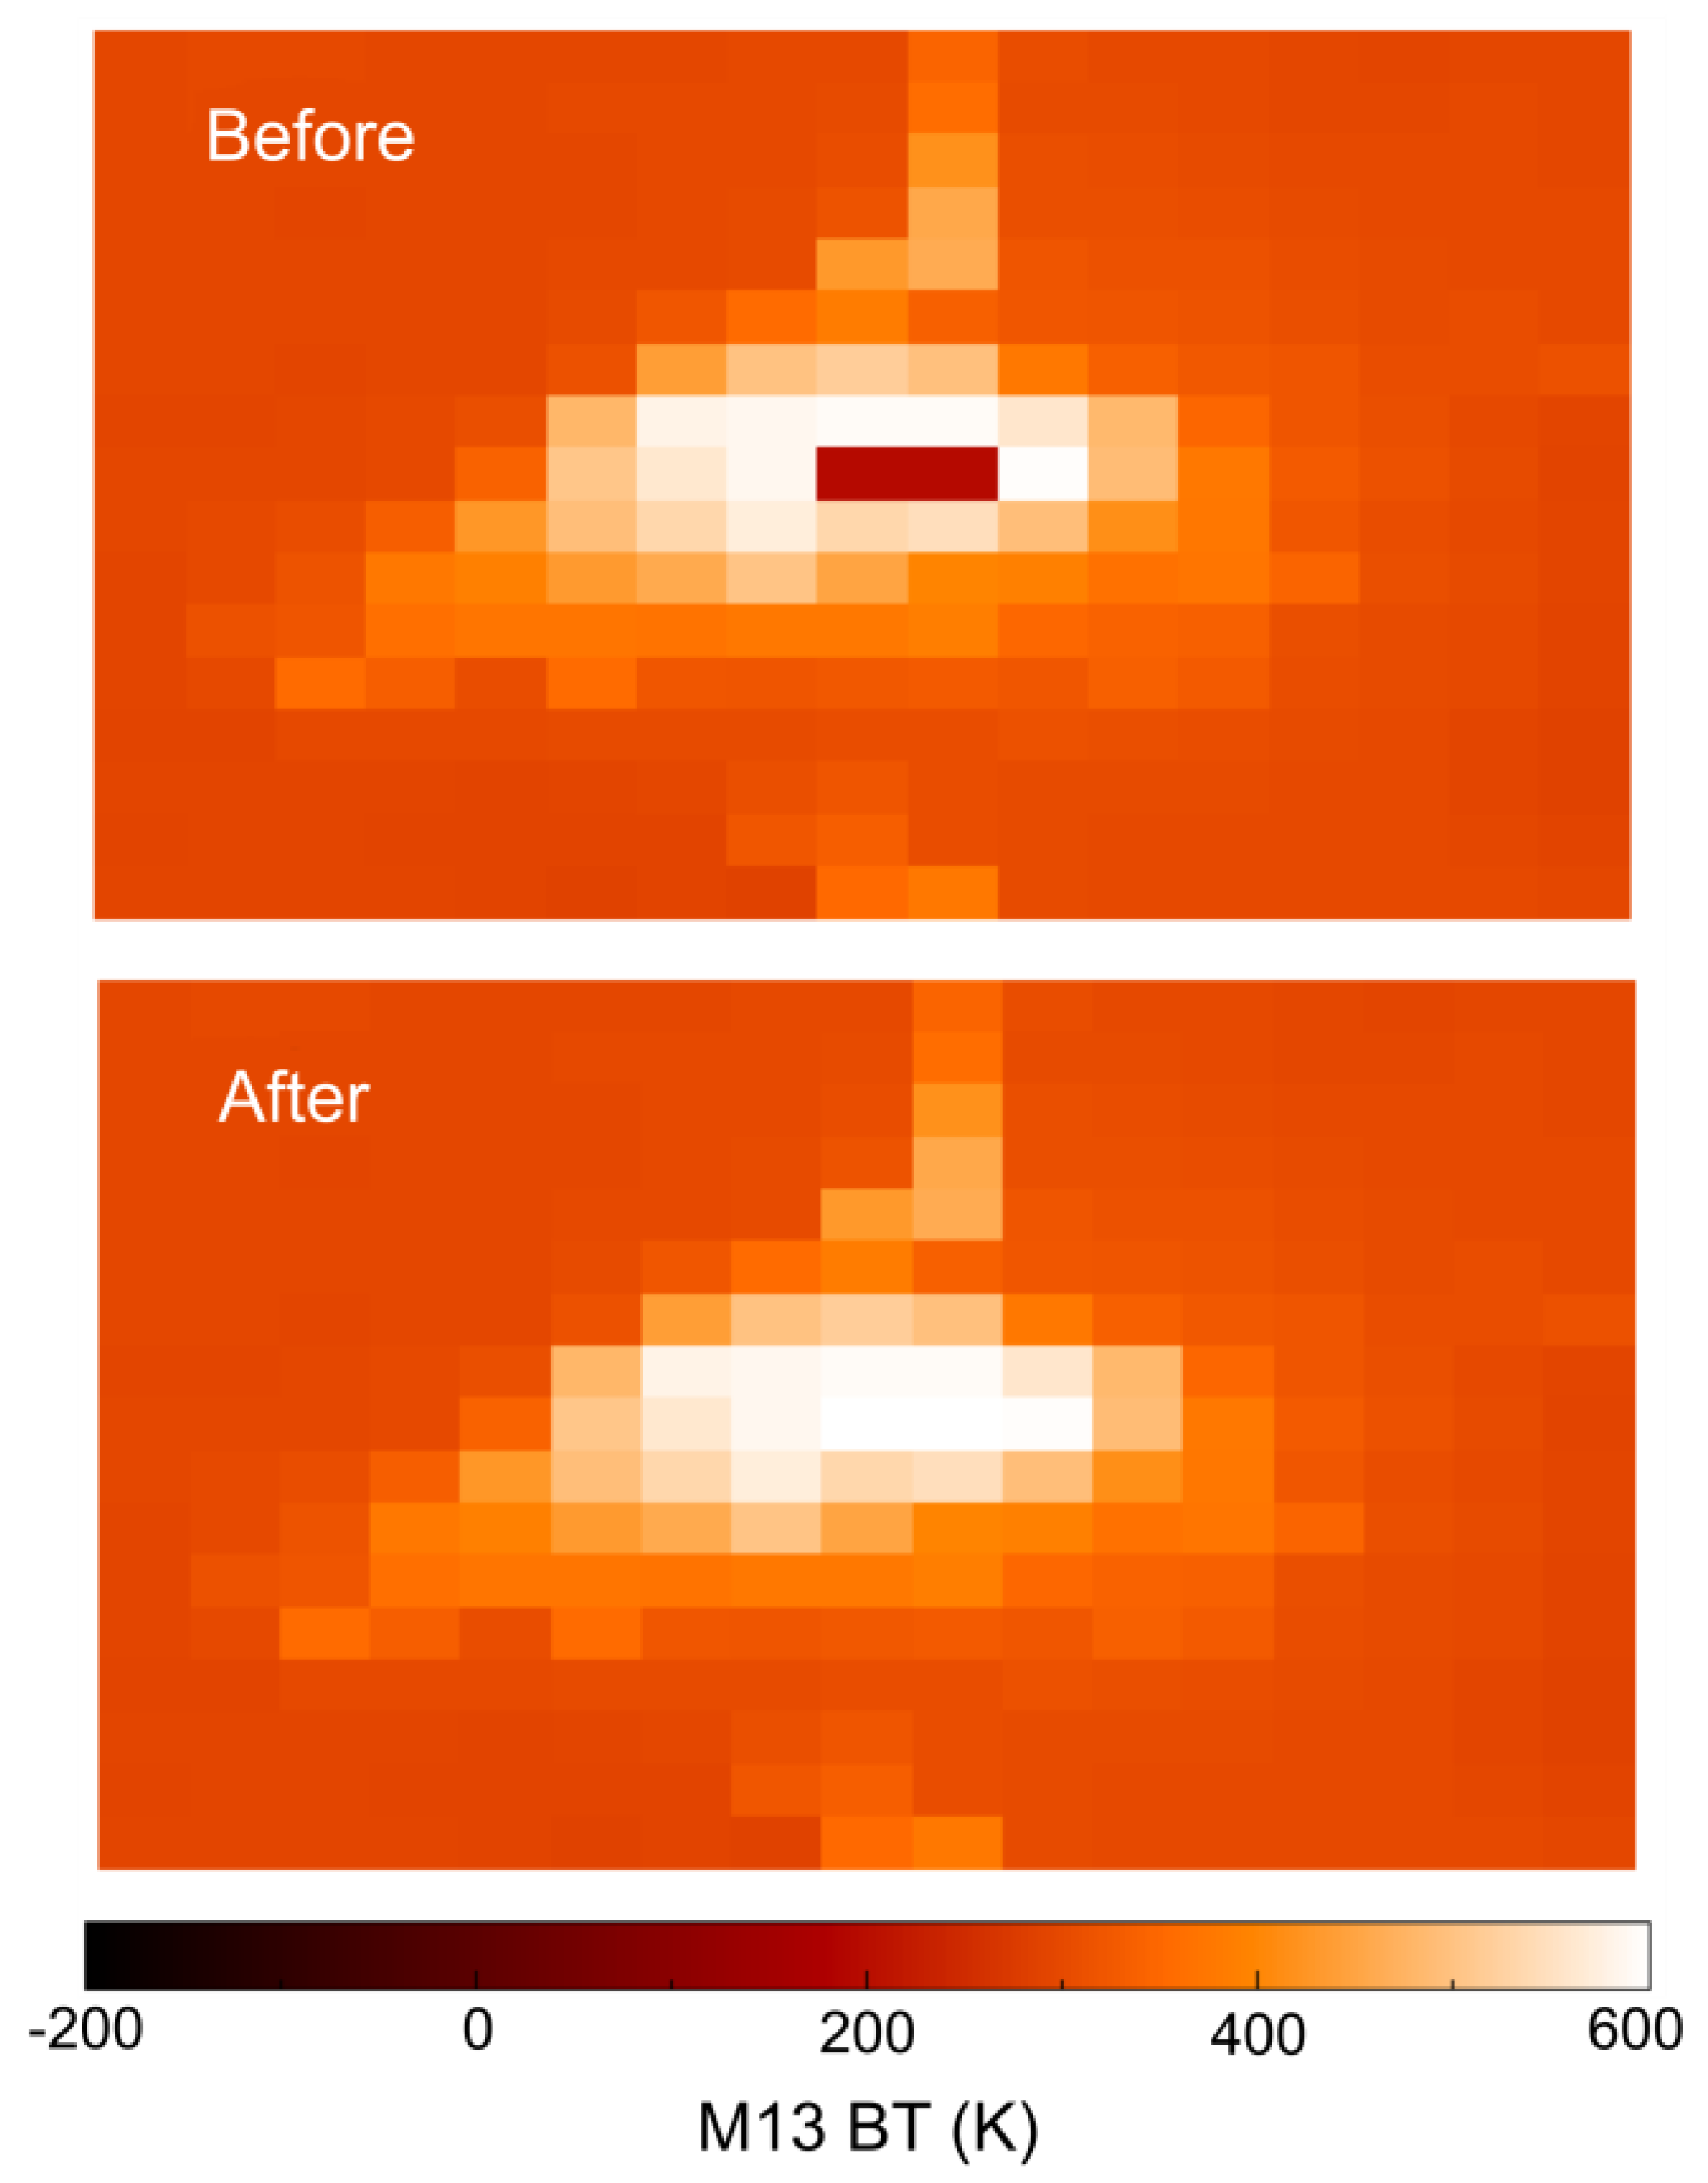
4.3. Evaluation of Version 2 Reprocessed S-NPP VIIR TEB SDRs

The Suomi NPP version 2 reprocessed TEB SDRs were evaluated using independent CrIS observations. Figure 15 shows daily averaged VIIRS-CrIS BT difference time series for bands I5, M13, and M15-M16 for the period from March 2012 to February 2017. The time series were generated using the reprocessed Suomi NPP VIIRS TEB SDRs and the reprocessed CrIS normal spectral resolution LWIR (overlapping with VIIRS M15-M16 and I5) and SWIR (overlapping with M13) SDR. It can be observed that VIIRS agrees with CrIS on the order of 0.1 K for all four bands. VIIRS bands I5 and M15-M16 agree with CrIS within 0.05 K. VIIRS M13 shows slightly larger biases relative to CrIS, ~0.1 K. Our analyses indicate that the larger M13 bias is mostly due to the coarse spectral resolution of the CrIS SWIR normal spectra data used [19]. M13 VIIRS–CrIS biases will be reduced by 0.09 K if the reprocessed CrIS full spectra SDRs are used. However, CrIS full-spectra RDRs are not available for the entire Suomi NPP mission. Therefore, they are not used in the long-term analysis in this study. Note that the spectral resolutions of CrIS LWIR spectra are the same in the normal- and full-spectra SDRs. Downward trends were observed in the VIIRS–CrIS BT difference time series. However, the trends are very small, about −0.001, −0.003, −0.002 and −0.002 K/year for I5, M13, and M15-M16, respectively. Residual WUCD biases after the WUCD bias correction are ~0.01 K in the reprocessed TEB SDRs, which is significantly reduced compared to the up to 0.1 K bias (for M15) observed in the NOAA operational products.
We also evaluated the TEB SDR improvement due to the use of the upgraded TEB radiance/BT limits (see Section 3.5). Figure 16 compares M13 aggregated radiance (March 11, 2014, 16:47 UTC, saturation occurs over sun glint) before (operational) and after the version 2 reprocessing. In the NOAA operational processing, two M13 SDR pixels are assigned to the minimum radiance, due to the fact that all un-aggregated sub-pixels are either saturated or beyond the EBBT LUT-defined limits. Because of the improved EBBT radiance/BT limits, improved radiances were produced using the unsaturated sub-pixels, and the two pixels became more consistent with the surrounding, good-quality pixels after the recalibration.

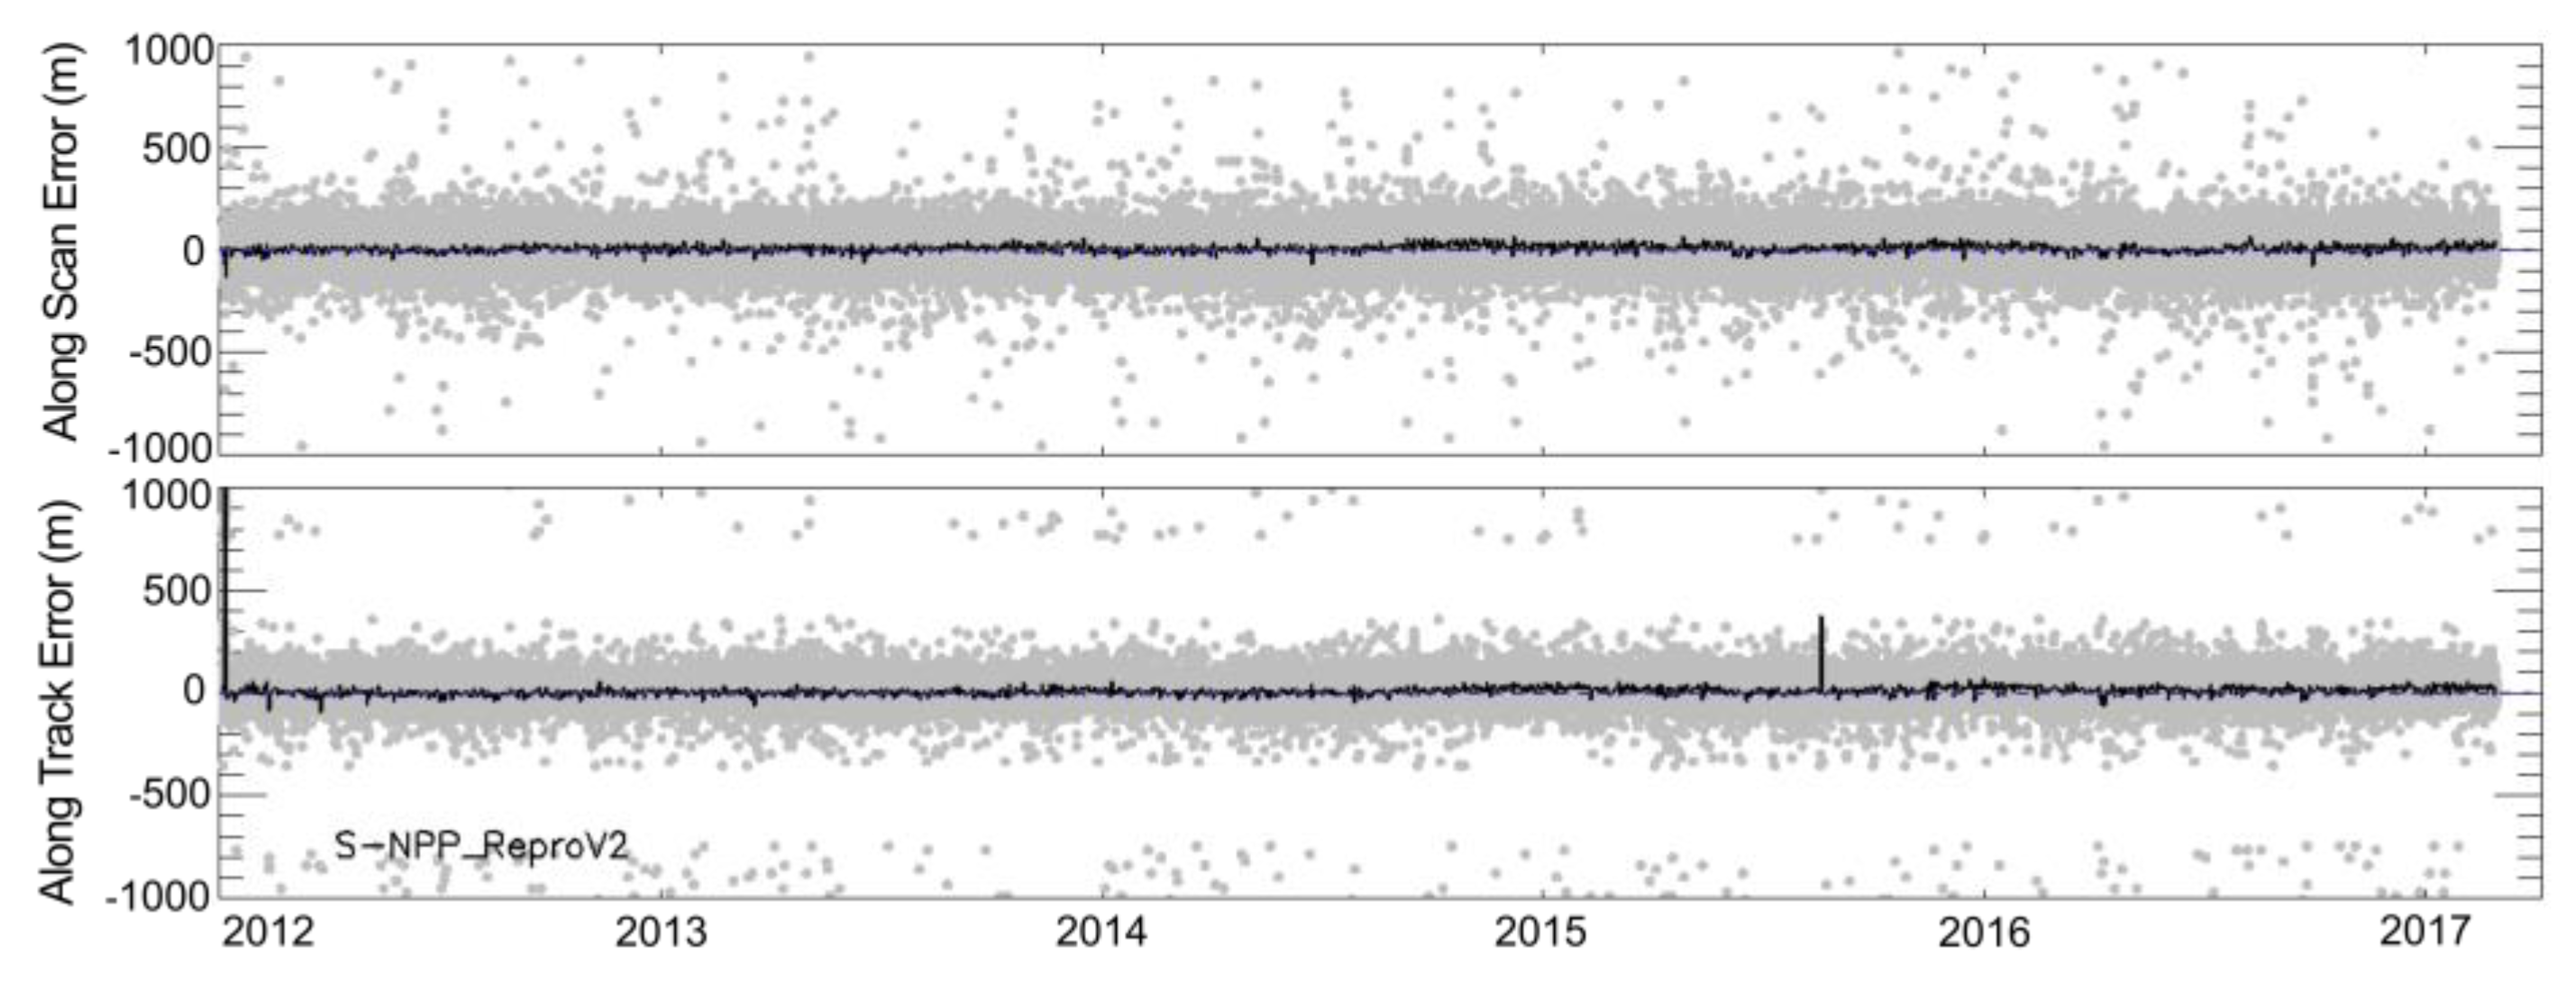
4.4. Evaluation of Version 2 Reprocessed S-NPP VIIRS Geolocation Products

Major improvements in the geolocation products from February 2012 to December 2016 were evaluated in our previous study over a sample area located in Northwestern Africa (for I-bands’/M-bands’ geolocation) and DNB nighttime point sources (for DNB geolocation) [17]. I-bands’ and M-bands’ geolocation errors were evaluated using the control point-matching (CPM) program developed by the National Aeronautics and Space Administration (NASA) using 1000+ globally distributed Landsat red band (0.65–0.67 µm) ground-control point chips [17]. Results show that all short-term geolocation anomalies from February 2012 to August 2013 were effectively minimized after reprocessing. Averaged DNB geolocation errors are within 0.5 pixels (0.375 km) and standard deviations are about 0.2 km. After the implementation of DNB terrain correction, DNB geolocation errors at off-nadir high elevation locations were reduced from ~9 to ~0.375 km. Results from the previous study can also be applied to the version 2 reprocessed geolocation products.
In this study, we further evaluated the entire reprocessed I-bands’ geolocation data records using the NASA CPM program. Figure 17 shows I-bands’ geolocation errors in the along-scan and along-track directions from January 2012 to February 2017. It can be observed that the reprocessed I-bands’ geolocation product performed well, with errors of ~6 ± 81 m (along-scan) and 9 ± 93 m (along-track). Two short-anomalies, which were not covered by our previous study [17], were observed in the reprocessed geolocation product. The first short-term anomaly lasts for 2-days (5–6 January 2012), caused by missing GPS data. The second short-term anomaly occurs on 19 August 2015 (around 14:20–21:12 h UTC), caused by a spacecraft control computer clock error (drifted relative to the GPS time). Note that the VIIRS I-bands and M-bands are well co-registered, band-by-band, with 2 × 2 I-band pixels nested to one M-band pixel. I-bands’ geolocation error results can also be applied to M-bands. These two short-term anomalies will be studied and mitigated in the future reprocessing.

5. Conclusions

This study provides a comprehensive analysis of the recalibration algorithms, processes, upgrades, and procedures for the recalibration and reprocessing of the Suomi NPP VIIRS sensor data records. In the recalibration, we resolved inconsistencies in the processing algorithms, terrain correction and straylight correction, and anomalies in the thermal bands. To improve the stability of the reflective solar bands, we developed a Kalman filtering model to incorporate onboard solar, lunar, desert site, inter-satellite calibration, and deep convective cloud calibration methodology. We further developed and implemented the solar diffuser surface roughness Rayleigh scattering model to account for the sensor responsivity degradation in the short-wave infrared bands. The recalibrated radiometric dataset (namely, the level 1b or sensor data records) also incorporates bias corrections for the reflective solar bands, which not only addresses known calibration biases, but also allows alternative calibration to be applied if so desired. The recalibrated dataset was validated using vicarious sites and alternative methods, and compared with independent processing from other organizations. The recalibrated data were proven to be of superior quality, with improved radiometric/geometric stability and accuracy. The recalibrated data are now available from 2012 to 2020 for all users, and will eventually be archived in the NOAA CLASS database.

Author Contributions

Conceptualization, C.C.; methodology, C.C.; software, B.Z.; validation, X.S., W.W., S.U., T.C., Y.G., Y.B. and S.B.; formal analysis, X.S., W.W., S.U., T.C. and S.B.; investigation, B.Z., X.S., W.W., S.U., T.C. and S.B.; resources, C.C., L.L., S.K.; data curation, B.Z.; writing—original draft preparation, C.C.; writing—review and editing, C.C., B.Z., X.S., W.W., S.U., T.C., Y.G., S.B., L.L. and S.K.; supervision, C.C. and S.K.; project administration, S.K.; funding acquisition, X.S. All authors have read and agreed to the published version of the manuscript.

Funding

This research was funded by NOAA grant NA19NES4320002 (Cooperative Institute for Satellite Earth System Studies -CISESS) at the University of Maryland, Earth System Science Interdisciplinary Center (UMD ESSIC).

Acknowledgments

Authors would like to thank NASA VIIRS Calibration Support Team (VCST) for providing NASA SD F-factors for the long-term trend comparisons. The scientific results and conclusions, as well as any views or opinions expressed herein, are those of the author(s) and do not necessarily reflect those of NOAA or the Department of Commerce.

Conflicts of Interest

The authors declare no conflict of interest.

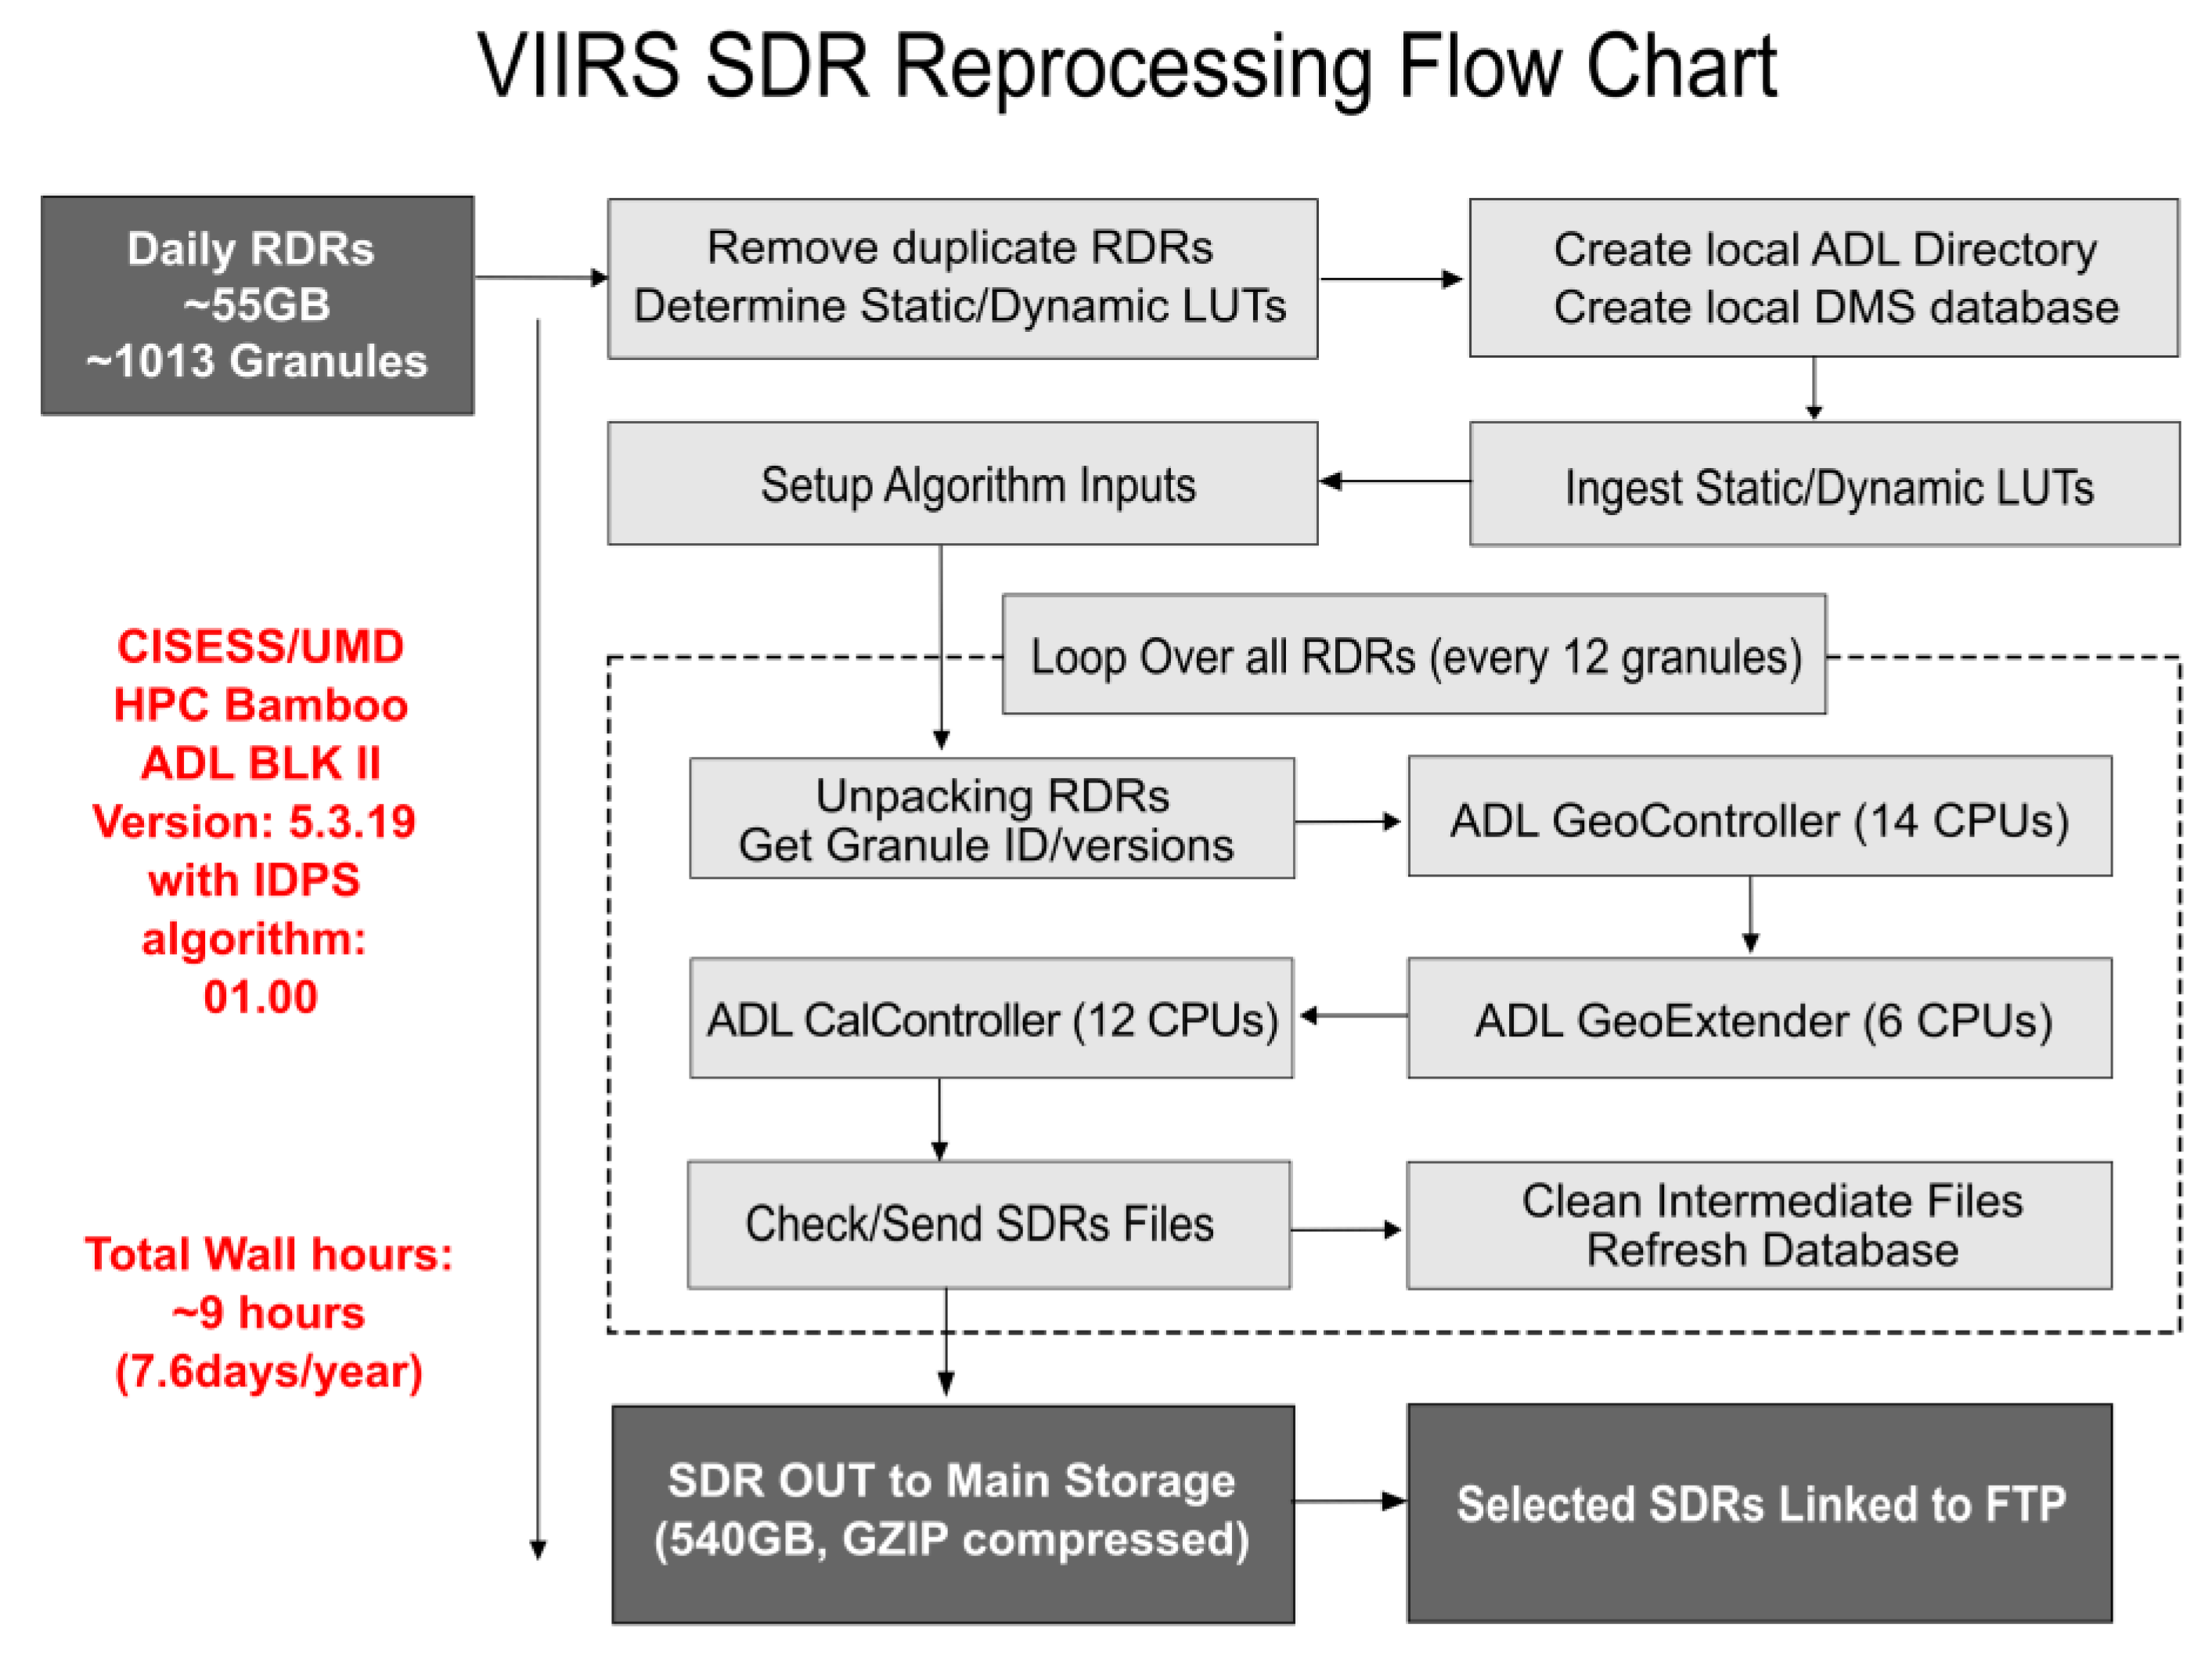
Appendix A. Recalibration Processing System with High-Performance Computing

The recalibration and algorithm improvements discussed in this paper provide the foundation for reprocessing. On the other hand, actual VIIRS SDR reprocessing is a major challenge due to its large data volume. Each day, about 1012 VIIRS RDRs (55GB) are processed into about 30,000 SDR files, with a total volume about 540 GB after compression, which also requires a high number of CPU hours. These large data volume and high CPU demands become a storage and processing bottleneck for reprocessing. For faster reprocessing of VIIRS SDR, an embarrassingly parallel (also called perfectly parallel) scheme has been developed for the Algorithm Development Library (ADL), which is a comprehensive ground-processing package that mirrors the official IDPS system for JPSS, using the super-computer clusters at University of Maryland (Figure 1).

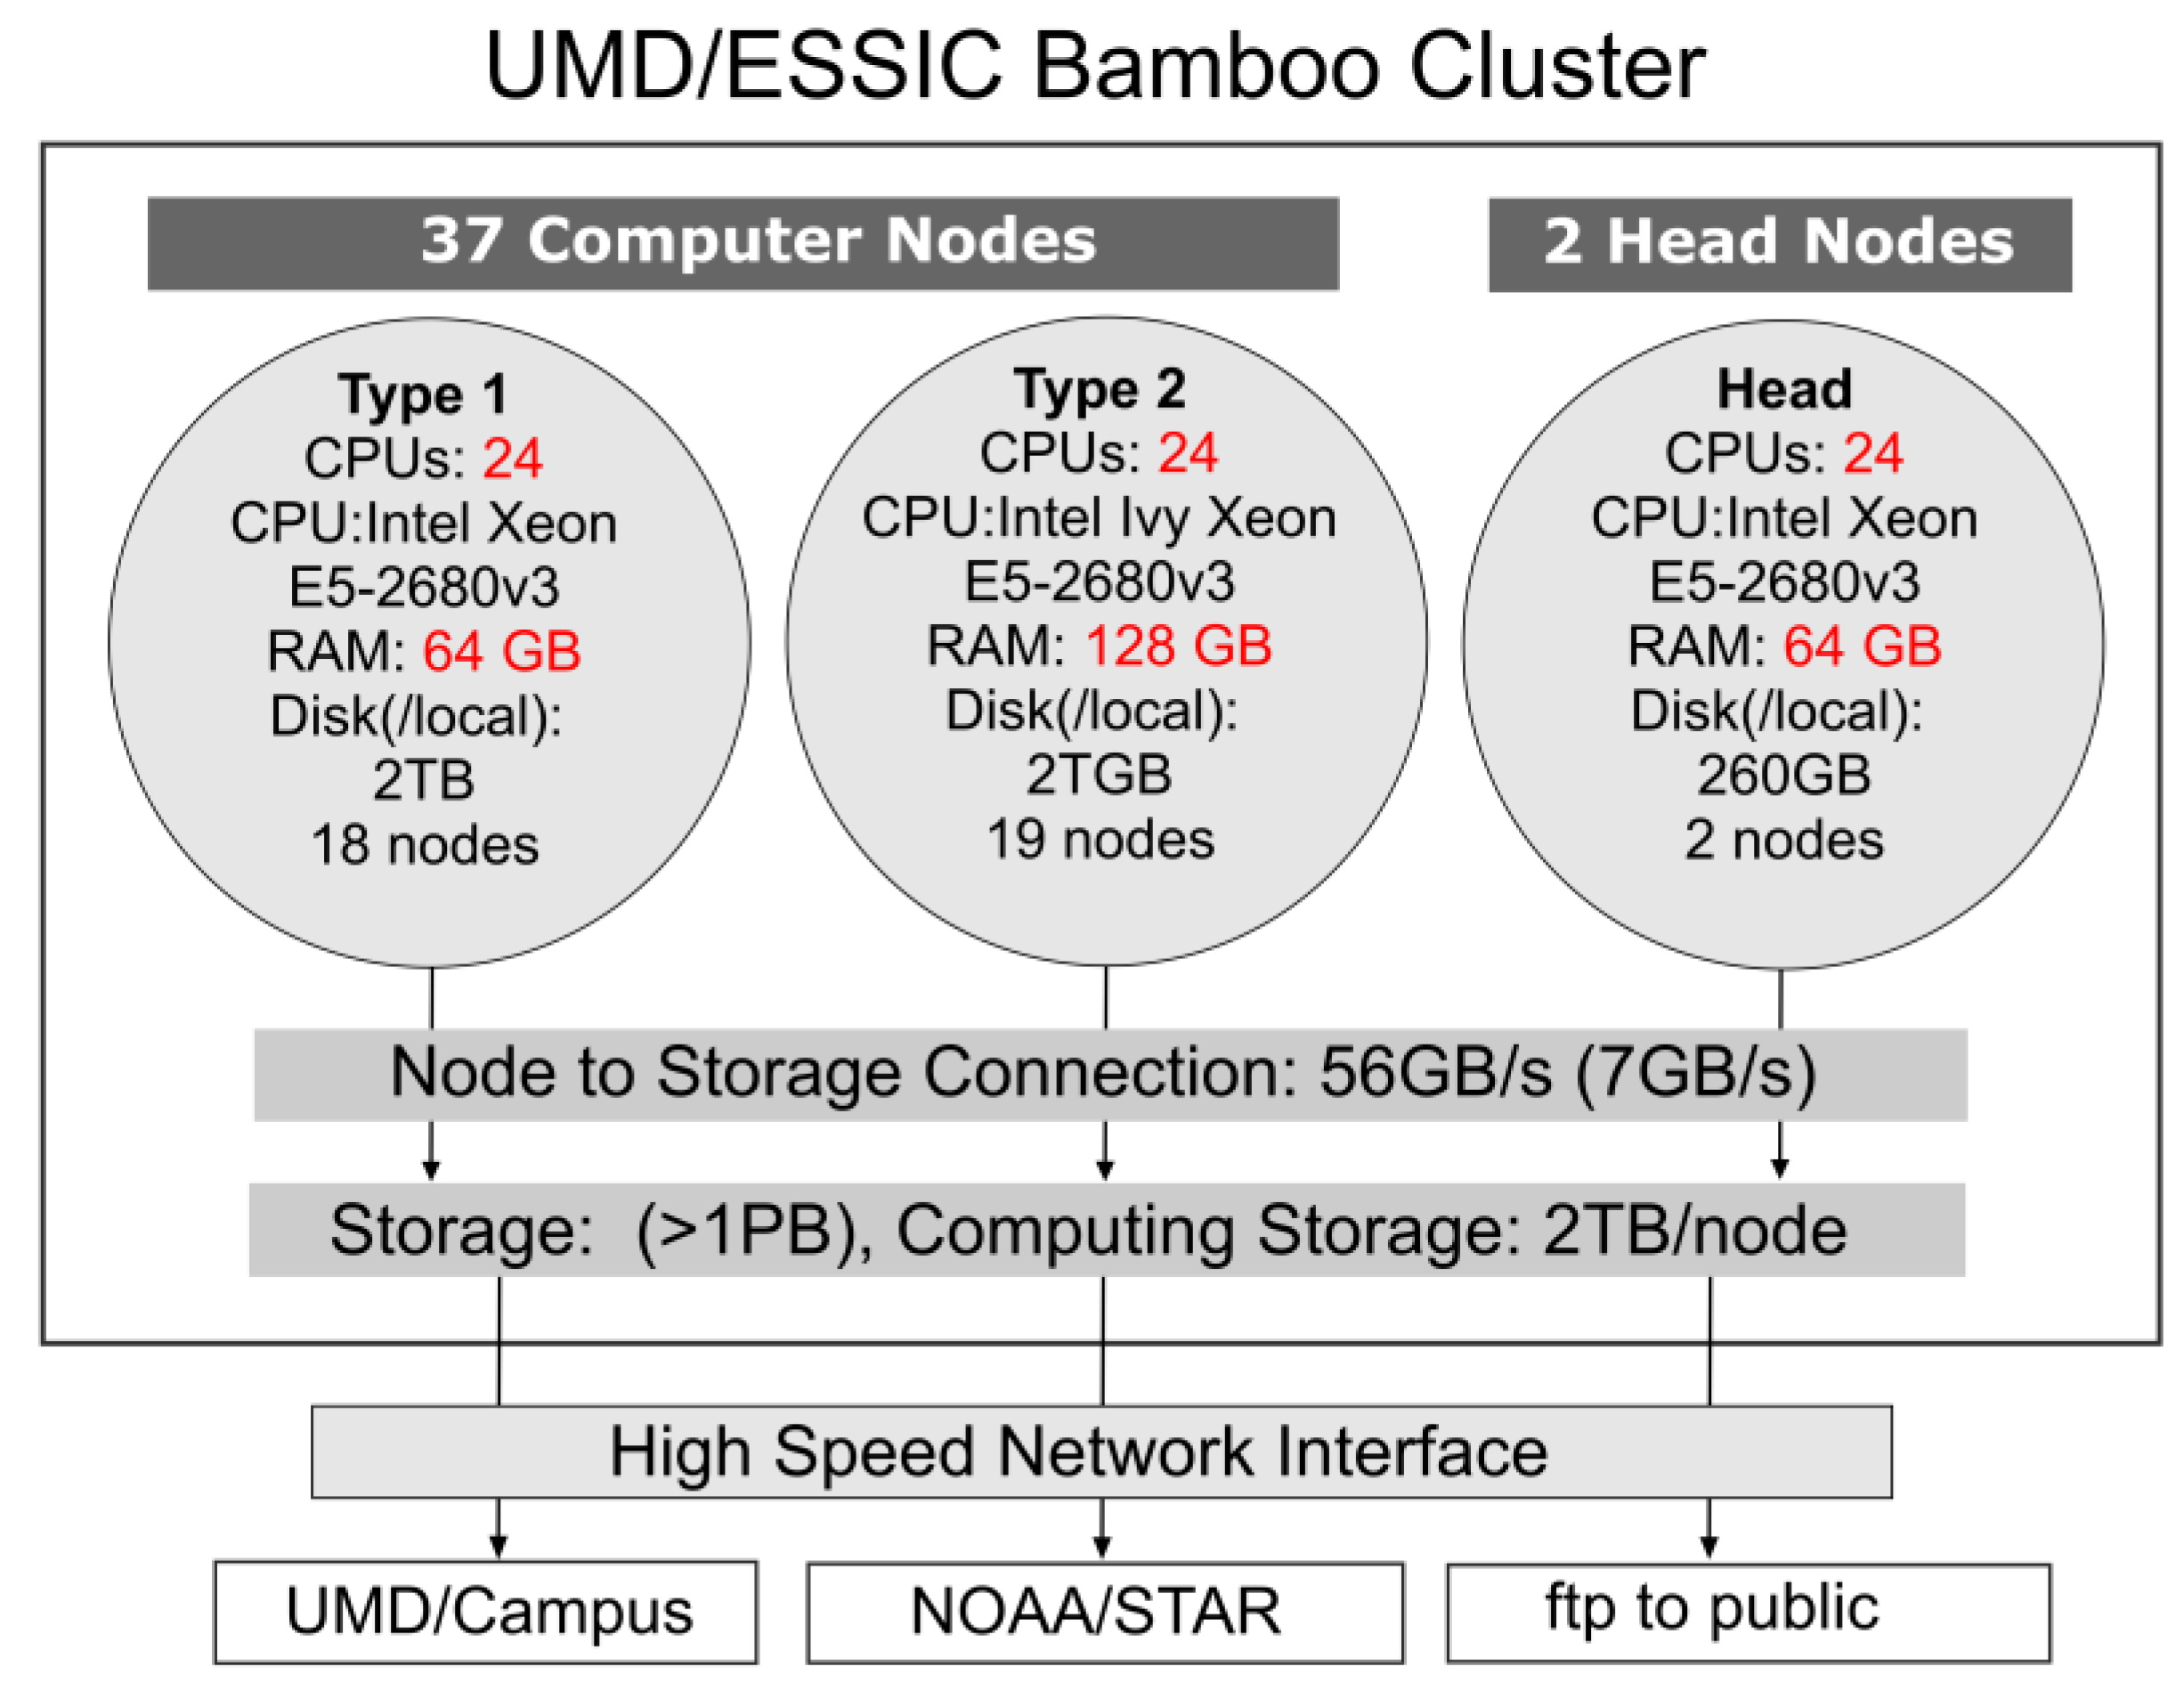
A.1. Super Computer System and Software for the Reprocessing

In embarrassingly parallel computing, we equally distribute ~1012 VIIRS SDR reprocessing calculations of each day into different cluster nodes/CPUs, so that we can utilize the multiple nodes and CPUs in the cluster efficiently. Besides the 55 GB RDR files, and the 540 GB output SDR files, there are millions of interim files of more than 1TB in volume that are generated/deleted in converting RDR to SDR for one-day VIIRS datasets. One bottleneck in the multiple granule calculation is the data transferal between worker nodes and the main storage. We have designed the code to utilize a local disk on each node and temporary file storage in RAM memory. In this way, we can avoid a heavy burden on hard drives due to massive and frequent writing/reading on the local and main storage. The bandwidth (56 Gbps) for main storage, and the memory size of each computing node, have been considered for optimized CPU numbers. The supercomputer used for this work is a cluster with 39 computing nodes, each with 24 CPUs (Figure A1). Its main storage was expanded to more than 1PB with an infinite bandwidth (56 Gbps) connected to slave nodes. In addition, transferring all VIIRS RDRs of the reprocessing period (~20 TB per year) from NOAA to the UMD supercomputer took a few weeks.
An ADL Block 2 (Version 5.3.19 with IDPS algorithm: 01.00) is used for the reprocessing. A major upgrade of this version is the use of the new NOVAS software, which leads to a 0.00001-degree improvement in latitude/longitude, or less than a meter in geolocation. In ADL BLK2, the SQLite database is also used to manage all kinds of inputs, outputs and intermediate files. In addition, the ADL code was upgraded for thermal-band radiance bias correction for a Warm-Up Cool-Down event. The Warm-Up Cool-Down algorithm is based on [19], which was implemented in the IDPS VIIRS SDR operational processing in 2019.
For the best processing efficiency, we allocated each computing node with one day’s VIIRS RDR to fully use the CPU and memory. The ADL processing for geolocation and radiometric calibration are separated. Each has a different memory requirement and, hence, the optimal adjustment of the CPU numbers for different processes is needed. Figure A2 shows a flow chart of the VIIRS SDR processing and time estimation on the bamboo cluster. Basically, using 18 computing nodes, one-year VIIRS SDR can be processed within an 8-day timeframe.

A.2. Calibration Parameter Input Datasets/Lookup Tables, Raw Data, and Data Volume Reduction

The radiometric and geolocation products for every band have frequent look-up table updates in the operations, to reflect the latest calibration changes, especially in the first few years. A selected list of the major LUTs updates used in operational SDR products is provided in Appendix B. Some of these LUT changes can be trivial, such as changes in the data format, while other changes can significantly affect the radiometric and geolocation accuracy. In the reprocessing, the latest and most mature recalibrated LUTs were used, which could be significantly different from what is used in the operations.
Handling VIIRS datasets can be frustrating, due to their large volume and limited disk space, I/O speed, network speed, etc. Early IDPS products did not use compression and, hence, the total daily VIIRS SDR file volume is extremely large, at more than 1.7 TB as of early 2014. During reprocessing, we apply H5 GZIP compression by modifying the ADL code to reduce the daily SDR datasets to 540GB. Figure A3 shows the data volume analysis of the daily reprocessed VIIRS SDR products (compressed in the same way as IDPS products after 2014). During reprocessing, we reduced the total volume size by removing the scarcely needed datasets. For example, the geolocation products mainly include the ellipsoid geolocation and terrain-corrected geolocations, and take up almost 50% of the total data storage. The ellipsoid geolocation takes up about 26%. The ellipsoid geolocation is not the true geolocation on the earth’s surface and is seldom used in EDR teams, and can be derived from terrain-corrected geolocation products, and hence the ellipsoid geolocation data were removed from reprocessing products. This can save at least 26% of disk space. Other intermediate products, such as VIIRS Calibrated Dual-Gain Band (IVCDB), are not kept, to save more space. Reprocessing these products later can be achieved through on-demand reprocessing for specific area/time. Through eliminating those scarcely needed datasets, we have achieved a total daily volume of about 340 Gb/day (about 120 TB/year).

A.3. Multiple Versions of RDR Consideration

Multiple versions of VIIRS RDRs can be found from NOAA/CLASS VIIRS SDR repository, such as versions of A1, A2, A3 for some granules. Generally, the higher the version of the RDRs, the more complete the information it stores. A general rule in reprocessing is that we use the highest version (or latest version) of RDRs for the same granule if multiple versions of RDRs exist, to avoid confusion. Some RDRs are missing from the RDR repository in either NOAA CLASS or GRAVITE, or do not have enough observation or calibration information. These missing RDRs can cause SDR gaps.

A.4. Data Format

The reprocessed VIIRS SDR dataset contains compressed HDF5 files, with GZIP compression inside H5 file. The name convention follows the ADL definition of HDF5 files similar to IDPS. Currently, data are stored as single-granule H5 files. However, if these data are transferred to an NCEI/NOAA CLASS data server, they will be concatenated using the NAGG software, combining every four granules into one file for each band or geolocation. The naming convention of the data still follows the IDPS definition, with the name in the following format.

A.5. Data Distribution

The initial goal for the VIIRS SDR data distribution was to transfer it to NOAA/NCEI CLASS for data distribution. However, the large volume of data makes this complicated, especially regarding data storage and public access. We created a temporary data distribution ftp site with direct access to the UMD bamboo data storage. A simple data selection web interface was also provided, for users to select their desired granules based on the time of interest and geographic windows. Temporary web access to the data is provided through the following link: https://ncc.nesdis.noaa.gov/VIIRS/index.php (accessed on 31 August 2020). This is used to take user requests for data at present, and may change in the future.
Figure A1. Supercomputer Configuration at the University of Maryland, Earth System Science Interdisciplinary Center (UMD ESSIC).
Remotesensing 13 01075 g0a1
Figure A2. Flow-chart of VIIRS sensor data record (SDR) reprocessing using the Supercomputer bamboo at the University of Maryland, Earth System Science Interdisciplinary Center (UMD ESSIC)
Remotesensing 13 01075 g0a2
Figure A3. Daily VIIRS SDR Average Data Volume (GB) for each type of SDR file (1013 granules).
Remotesensing 13 01075 g0a3

A.6. OnDemand Reprocessing

As discussed previously, a major challenge in the VIIRS SDR dataset is its data volume. The reprocessed VIIRS SDR from 2012 to 2020 requires ~1 Petabyte of data storage. This is a challenge even with today’s storage capabilities. On the other hand, the input data for the processing system are relatively smaller. The data volume ratio between output SDR and input RDR is in the order of 10:1. Additionally, the data can very often be generated quickly, as they are downloaded or transmitted over the network. This led us to experiment with a new reprocessing concept, called OnDemand reprocessing.
The basic concept of OnDemand reprocessing is simple: we do not need to generate all the SDRs at once. Instead, we can generate them as they are needed. This can effectively address the data volume and storage issue. In what follows, we discuss a scenario where this method can be used.
A remote enterprise user is interested in a particular time-period of reprocessed VIIRS SDR over a particular location. In this scenario, the user has two choices under the scheme of OnDemand Reprocessing:
  • The VIIRS SDR team could regenerate the dataset from scratch using the raw data record requested by the user, and provide the data to the user through the network. When this is done, the reprocessed SDR data can be removed from the server so they do not take up space;
  • Alternatively, the VIIRS SDR team can obtain an account on the user’s computer, install the processing software ADL, and the input files as well as the raw data records. Then, the VIIRS SDR data can be produced on the user’s computer.
It is recognized that OnDemand reprocessing highly depends on the coordination between the VIIRS SDR team and the enterprise user. This method may not work for everyone, especially ad hoc users. Nevertheless, this does address the data volume issue and it has been successfully tested multiple times.

Appendix B. Look Up Table Updates in the Operational Datasets

23 February 2012VIIRS-SDR-GEO-DNB-PARAM-LUT; VIIRS-SDR-GEO-IMG-PARAM-LUT;
VIIRS-SDR-GEO-MOD-PARAM-LUT;
29 February 2012VIIRS-SDR-DELTA-C-LUT; VIIRS-SDR-GAIN-LUT;
07 March 2012VIIRS-SDR-BB-TEMP-COEFFS-LUT; VIIRS-SDR-DELTA-C-LUT; VIIRS-SDR-GAIN-LUT;
VIIRS-SDR-RADIOMETRIC-PARAM-LUT; VIIRS-SDR-TELE-COEFFS-LUT;
15 March 2012VIIRS-SDR-DG-ANOMALY-DN-LIMITS-LUT; VIIRS-SDR-DNB-C-COEFFS-LUT;
29 March 2012VIIRS-SDR-GEO-DNB-PARAM-LUT;
24 April 2012VIIRS-SDR-DNB-C-COEFFS-LUT;
25 April 2012VIIRS-SDR-RADIOMETRIC-PARAM-LUT;
11 May 2012VIIRS-SDR-DNB-C-COEFFS-LUT;
24 May 2012VIIRS-SDR-RSR-LUT;
08 June 2012VIIRS-SDR-DNB-C-COEFFS-LUT;
09 July 2012VIIRS-SDR-DNB-C-COEFFS-LUT;
03 August 2012VIIRS-SDR-DNB-C-COEFFS-LUT;
09 August 2012VIIRS-SDR-DNB-C-COEFFS-LUT; VIIRS-SDR-QA-LUT; VIIRS-SDR-RSR-LUT;
10 August 2012VIIRS-SDR-DNB-C-COEFFS-LUT;
17 August 2012VIIRS-SDR-DG-ANOMALY-DN-LIMITS-LUT;
06 September 2012VIIRS-SDR-RSR-LUT;
27 September 2012VIIRS-SDR-DNB-C-COEFFS-LUT;
31 October 2012VIIRS-SDR-DNB-C-COEFFS-LUT;
29 November 2012VIIRS-SDR-DG-ANOMALY-DN-LIMITS-LUT; VIIRS-SDR-DNB-C-COEFFS-LUT;
11 December 2012VIIRS-SDR-GEO-DNB-PARAM-LUT; VIIRS-SDR-GEO-IMG-PARAM-LUT;
VIIRS-SDR-GEO-MOD-PARAM-LUT;
20 December 2012VIIRS-SDR-DNB-C-COEFFS-LUT;
24 January 2013VIIRS-SDR-DNB-C-COEFFS-LUT;
14 February 2013VIIRS-SDR-DNB-C-COEFFS-LUT; VIIRS-SDR-GEO-DNB-PARAM-LUT;
21 February 2013VIIRS-SDR-DG-ANOMALY-DN-LIMITS-LUT;
21 March 2013VIIRS-SDR-DNB-C-COEFFS-LUT;
28 March 2013VIIRS-SDR-DG-ANOMALY-DN-LIMITS-LUT;
05 April 2013VIIRS-SDR-RSR-LUT;
18 April 2013VIIRS-SDR-DNB-C-COEFFS-LUT; VIIRS-SDR-GEO-DNB-PARAM-LUT;
VIIRS-SDR-GEO-IMG-PARAM-LUT; VIIRS-SDR-GEO-MOD-PARAM-LUT;
VIIRS-SDR-GEO-MOD-PARAM-LUT;
16 May 2013VIIRS-SDR-DNB-C-COEFFS-LUT;
20 June 2013VIIRS-SDR-DNB-C-COEFFS-LUT;
10 July 2013VIIRS-SDR-RADIOMETRIC-PARAM-LUT;
18 July 2013VIIRS-SDR-DNB-C-COEFFS-LUT;
08 August 2013VIIRS-SDR-DG-ANOMALY-DN-LIMITS-LUT;
19 August 2013VIIRS-SDR-DNB-C-COEFFS-LUT;
23 August 2013VIIRS-SDR-GEO-DNB-PARAM-LUT;
VIIRS-SDR-GEO-IMG-PARAM-LUT; VIIRS-SDR-GEO-MOD-PARAM-LUT;
19 September 2013VIIRS-SDR-DNB-C-COEFFS-LUT;
14 November 2013VIIRS-RSBAUTOCAL-VOLT-LUT; VIIRS-SDR-CAL-AUTOMATE-LUT; VIIRS-SDR-RADIOMETRIC-PARAM-V2-LUT; VIIRS-SDR-RELATIVE-SPECTRAL-RESPONSE-LUT;
VIIRS-SDR-RELATIVE-SPECTRAL-RESPONSE-LUT;
18 March 2014VIIRS-SDR-RADIOMETRIC-PARAM-V3-LUT;
10 April 2014VIIRS-SDR-DG-ANOMALY-DN-LIMITS-LUT;
01 May 2014VIIRS-SDR-DELTA-C-LUT;
22 May 2014VIIRS-SDR-DG-ANOMALY-DN-LIMITS-LUT;
25 September 2014VIIRS-SDR-DG-ANOMALY-DN-LIMITS-LUT;
01 October 2014VIIRS-SDR-RELATIVE-SPECTRAL-RESPONSE-LUT;
06 March 2015VIIRS-SDR-DELTA-C-LUT;
22 June 2015VIIRS-SDR-EBBT-LUT;
30 November 2015VIIRS-SDR-CAL-AUTOMATE-LUT;
05 January 2017DNB-DN0
08 March 2017CMNGEO-PARAM-LUT; VIIRS-RSBAUTOCAL-VOLT-LUT; VIIRS-SDR-BB-TEMP-COEFFS-LUT;
VIIRS-SDR-CAL-AUTOMATE-LUT; VIIRS-SDR-COEFF-A-LUT; VIIRS-SDR-COEFF-B-LUT;
VIIRS-SDR-DELTA-C-LUT; VIIRS-SDR-DNB-FRAME-TO-ZONE-LUT;
VIIRS-SDR-DNB-RVF-LUT;
VIIRS-SDR-EBBT-LUT; VIIRS-SDR-EMISSIVE-LUT; VIIRS-SDR-GAIN-LUT;
VIIRS-SDR-HAM-ER-LUT; VIIRS-SDR-OBC-ER-LUT; VIIRS-SDR-OBC-RR-LUT;
VIIRS-SDR-OBS-TO-PIXELS-LUT; VIIRS-SDR-QA-LUT;
VIIRS-SDR-RADIOMETRIC-PARAM-V3-LUT;
VIIRS-SDR-REFLECTIVE-LUT; VIIRS-SDR-RELATIVE-SPECTRAL-RESPONSE-LUT;
VIIRS-SDR-RTA-ER-LUT;
VIIRS-SDR-RVF-LUT; VIIRS-SDR-SOLAR-IRAD-LUT; VIIRS-SDR-TELE-COEFFS-LUT;
In addition, RSBAUTOCAL_HISTORY_AUX LUT was updated daily from 15 November 2013; before that time, the F-PREDICT LUT, updated daily, was used for RSB F factor. For DNB, there were also periodical updates for DN0, LGS-GAIN and GAIN-RATIO LUTs. These periodically updated LUTs are not shown in the Tables above. During reprocessing, these LUTs were also different from operational ones.

References

  1. Zhou, L.; Divakarla, M.; Liu, X.; Layns, A.; Goldberg, M. An Overview of the Science Performances and Calibration/Validation of Joint Polar Satellite System Operational Products. Remote Sens. 2019, 11, 698. [Google Scholar] [CrossRef] [Green Version]
  2. Barrie, J.D.; Fuqua, P.D.; Meshishnek, M.J.; Ciofalo, M.R.; Chu, C.T.; Chaney, J.A.; Moision, R.M.; Graziani, L. Root cause determination of on-orbit degradation of the VIIRS rotating telescope assembly. In Proceedings of the Volume 8510, Earth Observing Systems XVII, San Diego, CA, USA, 15 October 2012; p. 85101. [Google Scholar] [CrossRef] [Green Version]
  3. Rausch, K.; Houchin, S.; Cardema, J.; Moy, G.; Haas, E.; De Luccia, F. Automated calibration of the Suomi National Polar-Orbiting Partnership (S-NPP) Visible Infrared Imaging Radiometer Suite (VIIRS) reflective solar bands. J. Geophys. Res. 2013, 118, 13–434. [Google Scholar] [CrossRef]
  4. Cao, C.; Xiong, J.; Blonski, S.; Liu, Q.; Uprety, S.; Shao, X.; Bai, Y.; Weng, F. Suomi NPP VIIRS Sensor Data Record Verification, Validation, and Long-Term Performance Monitoring. J. Geophys. Res. Atmos. 2013, 118, 11664–11678. [Google Scholar] [CrossRef]
  5. Thuillier, G.; Hersé, M.; Labs, D.; Foujols, T.; Peetermans, W.; Gillotay, D.; Simon, P.C.; Mandel, H. The Solar Spectral Irradiance from 200 to 2400 nm as Measured by the SOLSPEC Spectrometer from the ATLAS and EURECA Missions. Sol. Phys. 2003, 214, 1–22. [Google Scholar] [CrossRef]
  6. Xiong, X.; Angal, A.; Barnes, W.L.; Chen, H.; Chiang, V.; Geng, X.; Li, Y.; Twedt, K.; Wang, Z.; Wilson, T.; et al. Updates of Moderate Resolution Imaging Spectroradiometer on-orbit calibration uncertainty assessments. J. Appl. Remote Sens. 2018, 12, 034001. [Google Scholar] [CrossRef]
  7. JPSS GS Systems Engineering. Joint Polar Satellite System (JPSS) Ground Segment Data Product Specification (GSegDPS); Goddard Space Flight Center Greenbelt: Maryland, MD, USA, 2019.
  8. JPSS. Joint Polar Satellite System (JPSS) VIIRS Performance Requirements Document; Revision, H., Ed.; NASA GSFC: Maryland, MD, USA, 2017.
  9. JPSS. Joint Polar Satellite System (JPSS) National Environmental Satellite, Data, and Information Service (NESDIS) Environmental Satellite Processing Center (ESPC) Requirements Document (JERD) Volume 1; NASA GSFC: Maryland, MD, USA, 2018.
  10. Ohring, G.; Wielicki, B.; Spencer, R.; Emery, B.; Datla, R. Satellite Instrument Calibration for Measuring Global Climate Change. Bull. Am. Meteor. Soc. 2005, 86, 1303–1314. [Google Scholar] [CrossRef]
  11. Wielicki, B.A.; Young, D.F.; Mlynczak, M.G.; Thome, K.J.; Leroy, S.; Corliss, J.; Anderson, J.G.; Ao, C.O.; Bantges, R.; Best, F.; et al. Achieving climate change absolute accuracy in orbit. Bull. Am. Meteorol. Soc. 2013, 94, 1519–1539. [Google Scholar] [CrossRef] [Green Version]
  12. Fox, N.; Aiken, J.; Barnett, J.J.; Briottet, X.; Carvell, R.; Frohlich, C.; Groom, S.B.; Hagolle, O.; Haigh, J.D.; Kieffer, H.H.; et al. Traceable radiometry underpinning terrestrial-and helio-studies (TRUTHS). Adv. Space Res. 2003, 32, 2253–2261. [Google Scholar] [CrossRef]
  13. Fox, N.; Green, P. Traceable Radiometry Underpinning Terrestrial-and Helio-Studies (TRUTHS): An Element of a Space-Based Climate and Calibration Observatory. Remote Sens. 2020, 12, 2400. [Google Scholar] [CrossRef]
  14. Zou, C.Z.; Zhou, L.; Lin, L.; Sun, N.; Chen, Y.; Flynn, L.E.; Zhang, B.; Cao, C.; Iturbide-Sanchez, F.; Beck, T.; et al. The Reprocessed Suomi NPP Satellite Observations. Remote Sens. 2020, 12, 2891. [Google Scholar] [CrossRef]
  15. Blonski, S.; Cao, C. Suomi NPP VIIRS Reflective Solar Bands Operational Calibration Reprocessing. Remote Sens. 2015, 7, 16131–16149. [Google Scholar] [CrossRef] [Green Version]
  16. Uprety, S.; Cao, C.; Xiong, X.; Wang, W.; Zhang, B.; Taeyoung, C.; Blonski, S.; Shao, X. Improving S-NPP VIIRS Reflective Solar Band (RSB) Calibration Accuracy through Reprocessing. GSICS Q. 2018, 12. [Google Scholar] [CrossRef]
  17. Wang, W.; Cao, C.; Bai, Y.; Blonski, S.; Schull, M.A. Assessment of the NOAA S-NPP VIIRS Geolocation Reprocessing Improvements. Remote Sens. 2017, 9, 974. [Google Scholar] [CrossRef] [Green Version]
  18. Choi, T.; Shao, X.; Cao, C. On-orbit radiometric calibration of Suomi NPP VIIRS reflective solar bands using the Moon and solar diffuser. Appl. Opt. 2018, 57, 9533–9542. [Google Scholar] [CrossRef]
  19. Cao, C.; Wang, W.; Blonski, S.; Zhang, B. Radiometric traceability diagnosis and bias correction for the Suomi NPP VIIRS long-wave infrared channels during blackbody unsteady states. J. Geophys. Res. Atmos. 2017, 122, 5285–5297. [Google Scholar] [CrossRef]
  20. Wang, W.; Cao, C.; Ignatov, A.; Liang, X.; Li, Z.; Wang, L.; Zhang, B.; Blonski, S.; Li, J. Improving the Calibration of Suomi NPP VIIRS Thermal Emissive Bands During Blackbody Warm-Up/Cool-Down. IEEE Trans. Geosci. Remote Sens. 2018, 57, 1977–1994. [Google Scholar] [CrossRef]
  21. Lin, G.G.; Wolfe, R.E.; Dellomo, J.J.; Tan, B.; Zhang, P. SNPP and NOAA-20 VIIRS on-orbit geolocation trending and improvements. Earth Obs. Syst. XXV 2020, 11501, 1150112. [Google Scholar] [CrossRef]
  22. Sun, J.; Wang, M. Radiometric calibration of the Visible Infrared Imaging Radiometer Suite reflective solar bands with robust characterizations and hybrid calibration coefficients. Appl. Opt. 2015, 54, 9331–9342. [Google Scholar] [CrossRef]
  23. Choi, T.; Shao, X.; Cao, C.; Weng, F. Radiometric Stability Monitoring of the Suomi NPP Visible Infrared Imaging Radiometer Suite (VIIRS) Reflective Solar Bands Using the Moon. Remote Sens. 2016, 8, 15. [Google Scholar] [CrossRef] [Green Version]
  24. Lei, N.; Xiong, X. Estimation of the accuracy of the SNPP VIIRS SD BRDF degradation factor determined by the solar diffuser stability monitor. In Proceedings of the Earth Observing Systems XX, San Diego, CA, USA, 8 September 2015; Volume 9607. [Google Scholar]
  25. Sun, J.; Wang, M. On-orbit calibration of Visible Infrared Imaging Radiometer Suite reflective solar bands and its challenges using a solar diffuser. Appl. Opt. 2015, 54, 7210–7223. [Google Scholar] [CrossRef] [PubMed]
  26. Sun, J.; Wang, M. VIIRS Reflective Solar Bands Calibration Progress and Its Impact on Ocean Color Products. Remote Sens. 2016, 8, 194. [Google Scholar] [CrossRef] [Green Version]
  27. Choi, T.; Cao, C. S-NPP VIIRS on-orbit calibration coefficient improvements with yaw maneuver reanalysis. IEEE Trans. Geosci. Remote Sens. 2019, 57, 7460–7465. [Google Scholar] [CrossRef]
  28. Lei, N.; Xiong, X. Impacts of the Angular Dependence of the Solar Diffuser BRDF Degradation Factor on the SNPP VIIRS Reflective Solar Band On-Orbit Radiometric Calibration. IEEE Trans. Geosci. Remote Sens. 2017, 55, 1537–1543. [Google Scholar] [CrossRef]
  29. Xiong, X.; Butler, J.; Chiang, K.; Efremova, B.; Fulbright, J.; Lei, N.; McIntire, J.; Oudrari, H.; Wang, Z.; Wu, A. Assessment of S-NPP VIIRS On-Orbit Radiometric Calibration and Performance. Remote Sens. 2016, 8, 84. [Google Scholar] [CrossRef] [Green Version]
  30. Baker, N.; Kilcoyne, H. Joint Polar Satellite System (JPSS) VIIRS Radiometric Calibration Algorithm Theoretical Basis Document (ATBD); Goddard Space Flight Center: Greenbelt, MA, USA, 2013.
  31. Choi, T.; Sun, J.; Zhang, B.; Wang, Z.; Cao, C.; Weng, F.; Wang, M. Suomi-NPP VIIRS Initial Reprocessing Improvements and Validations in the Reflective Solar Bands. In Proceedings of the Earth Observing Systems XXII, San Diego, CA, USA, 5 September 2017. [Google Scholar]
  32. Ardanuy, P.E.; Puschell, J.J.; Moyer, D.; Vandermierden, N.; Rausch, K.; De Luccia, F. VIIRS reflective solar bands on-orbit calibration coefficient performance using imagery and moderate band intercomparisons. In Proceedings of the Remote Sensing System Engineering V, San Diego, CA, USA, 23 September 2014. [Google Scholar]
  33. Xiong, X.; Shimoda, H.; Fulbright, J.; Anderson, S.; Lei, N.; Efremova, B.; Wang, Z.; McIntire, J.; Chiang, K.; Xiong, X. The solar vector error within the SNPP Common GEO code, the correction, and the effects on the VIIRS SDR RSB calibration. In Proceedings of the Earth Observing Missions and Sensors: Development, Implementation, and Characterization III, Beijing, China, 19 November 2014. [Google Scholar]
  34. Uprety, S.; Cao, C. Suomi NPP VIIRS Reflective Solar Band On-Orbit Radiometric Stability and Accuracy Assessment Using Desert and Antarctica Dome C Sites. Remote Sens. Environ. 2015, 166, 106–115. [Google Scholar] [CrossRef]
  35. Uprety, S.; Cao, C.; Xiong, X.; Blonski, S.; Wu, A.; Shao, X. Radiometric Intercomparison between Suomi-NPP VIIRS and Aqua MODIS Reflective Solar Bands Using Simultaneous Nadir Overpass in the Low Latitudes. J. Atmos. Ocean. Technol. 2013, 30, 2720–2736. [Google Scholar] [CrossRef]
  36. Sayer, A.M.; Hsu, N.C.; Bettenhausen, C.; Holz, R.E.; Lee, J.; Quinn, G.; Veglio, P. Cross-calibration of S-NPP VIIRS moderate-resolution reflective solar bands against MODIS Aqua over dark water scenes. Atmos. Meas. Tech. 2017, 10, 1425–1444. [Google Scholar] [CrossRef] [PubMed] [Green Version]
  37. Kalman, R.E. A New Approach to Linear Filtering and Prediction Problems. J. Basic Eng. 1960, 82, 35–45. [Google Scholar] [CrossRef] [Green Version]
  38. Houtekamer, P.L.; Zhang, F. Review of the Ensemble Kalman Filter for Atmospheric Data Assimilation. Mon. Weather Rev. 2016, 144, 4489–4532. [Google Scholar] [CrossRef]
  39. Gao, J.B.; Harris, C.J. Some remarks on Kalman filters for the multisensor fusion. Inf. Fusion 2002, 3, 191–201. [Google Scholar] [CrossRef]
  40. Caron, F.; Duflos, E.; Pomorski, D.; Vanheeghe, F. GPS/IMU data fusion using multisensor Kalman filtering: Introduction of contextual aspects. Inf. Fusion 2006, 7, 221–230. [Google Scholar] [CrossRef]
  41. Loffeld, O.; Nies, H.; Knedlik, S.; Yu, W. Phase Unwrapping for SAR Interferometry—A Data Fusion Approach by Kalman Filtering. IEEE Trans. Geosci. Remote Sens. 2008, 46, 47–58. [Google Scholar] [CrossRef]
  42. Sun, J.; Wang, M. Visible Infrared Imaging Radiometer Suite solar diffuser calibration and its challenges using a solar diffuser stability monitor. Appl. Opt. 2014, 53, 8571–8584. [Google Scholar] [CrossRef]
  43. Shao, X.; Cao, C.; Liu, T.-C. Spectral Dependent Degradation of the Solar Diffuser on Suomi-NPP VIIRS Due to Surface Roughness-Induced Rayleigh Scattering. Remote Sens. 2016, 8, 254. [Google Scholar] [CrossRef] [Green Version]
  44. Shao, X.; Liu, T.; Xiong, X.; Cao, C.; Choi, T.; Angal, A. Surface Roughness-Induced Spectral Degradation of Multi-Spaceborne Solar Diffusers Due to Space Radiation Exposure. IEEE Trans. Geosci. Remote Sens. 2019, 57, 8658–8671. [Google Scholar] [CrossRef]
  45. Wang, W.; Cao, C. DCC radiometric sensitivity to spatial resolution, cluster size, and LWIR calibration bias based on VIIRS observations. J. Atmos. Ocean. Technol. 2015, 32, 48–60. [Google Scholar] [CrossRef]
  46. Wang, W.; Cao, C. Monitoring the NOAA operational VIIRS RSB and DNB calibration stability using monthly and semi-monthly deep convective clouds time series. Remote Sens. 2016, 8, 32. [Google Scholar] [CrossRef] [Green Version]
  47. Hu, Y.; Wielicki, B.A.; Yang, P.; Stackhouse, P.W.; Lin, B.; Young, D.F. Application of deep convective cloud albedo observation to satellite-based study of the terrestrial atmosphere: Monitoring the stability of spaceborne measurements and assessing absorption anomaly. IEEE Trans. Geosci. Remote Sens. 2004, 42, 2594–2599. [Google Scholar]
  48. Wang, W.; Cao, C. Evaluation of NOAA-20 VIIRS Reflective Solar Bands Early On-Orbit Performance Using Daily Deep Convective Clouds Recent Improvements. IEEE J. Sel. Top. Appl. Earth Obs. Remote Sens. 2020, 13, 3975–3985. [Google Scholar] [CrossRef]
  49. Cao, C.; Weinreb, M.; Xu, H. Predicting Simultaneous Nadir Overpasses among Polar-Orbiting Meteorological Satellites for the Intersatellite Calibration of Radiometers. J. Atmos. Ocean. Technol. 2004, 21, 537–542. [Google Scholar] [CrossRef]
  50. Grossman, E.; Gouzman, I. Space environment effects on polymers in low earth orbit. Nucl. Instrum. Methods Phys. Res. Sect. B Beam Interact. Mater 2003, 208, 48–57. [Google Scholar] [CrossRef]
  51. Shao, X.; Liu, T.-C.; Xiong, X.; Cao, C.; Choi, T.; Angal, A. Modeling spectral degradation of MODIS and VIIRS solar diffusers. In Proceedings of the Earth Observing Systems XXIV, San Diego, CA, USA, 9 September 2019. [Google Scholar]
  52. Lei, N.; Xiong, X. Suomi NPP VIIRS Solar Diffuser BRDF Degradation Factor at Short-Wave Infrared Band Wavelengths. IEEE Trans. Geosci. Remote Sens. 2016, 54, 6212–6216. [Google Scholar] [CrossRef]
  53. Ignatov, A.; Petrenko, B.; Kihai, Y.; Stroup, J.; Dash, P.; Liang, X.; Gladkova, I.; Zhou, X.; Sapper, J.; Xu, F. JPSS SST Products at NOAA. Am. Geophys. Union 2016, 2016, OD14B–2407. [Google Scholar]
  54. Uprety, S.; Cao, C.; Gu, Y.; Shao, X.; Blonski, S.; Zhang, B. Calibration improvements in S-NPP VIIRS DNB sensor data record using version 2 reprocessing. IEEE Trans. Geosci. Remote Sens. 2019, 57, 9602–9611. [Google Scholar] [CrossRef]
  55. Geis, J.; Florio, C.; Moyer, D.; Rausch, K.; De Luccia, F. VIIRS Day-Night Band gain and offset determination and performance. In Proceedings of the Earth Observing Systems XVII, San Diego, CA, USA, 15 October 2012; Volume 8510. [Google Scholar]
  56. De Miguel, A.S.; Kyba, C.C.; Zamorano, J.; Gallego, J.; Gaston, K.J. The nature of the diffuse light near cities detected in nighttime satellite imagery. Sci. Rep. 2020, 10, 1–16. [Google Scholar]
  57. Coesfeld, J.; Kuester, T.; Kuechly, H.U.; Kyba, C. Reducing Variability and Removing Natural Light from Nighttime Satellite Imagery: A Case Study Using the VIIRS DNB. Sensors 2020, 20, 3287. [Google Scholar] [CrossRef]
  58. Cao, C.; Bai, Y. Quantitative analysis of VIIRS DNB nightlight point source for light power estimation and stability monitoring. Remote Sens. 2014, 6, 11915–11935. [Google Scholar] [CrossRef] [Green Version]
  59. Lee, S.; McIntire, J.; Oudrari, H.; Schwarting, T.; Xiong, X. A new method for SUOMI-NPP VIIRS day–night band on-orbit radiometric calibration. IEEE Trans. Geosci. Remote Sens. 2015, 53, 324–334. [Google Scholar]
  60. Butler, J.J.; Xiong, X.; Barnes, R.A.; Patt, F.S.; Sun, J.; Chiang, K. An overview of Suomi NPP VIIRS calibration maneuvers. In Proceedings of the Earth Observing Systems XVII, San Diego, CA, USA, 15 October 2012; Volume 8510. [Google Scholar]
  61. Mills, S.; Weiss, S.; Liang, C. VIIRS day/night band (DNB) stray light characterization and correction. In Proceedings of the Earth Observing Systems XVIII, San Diego, CA, USA, 23 September 2013; Volume 8866. [Google Scholar]
  62. Shao, X.; Liu, T.-C.; Uprety, S.; Wang, W.; Zhang, B.; Cao, C. A light contamination ranking index-based method for automating VIIRS day/night band stray light correction. In Proceedings of the Earth Observing Systems XXIII, San Diego, CA, USA, 7 September 2018; Volume 10764. [Google Scholar]
  63. Wilson, T.; Xiong, X. Intercomparison of the SNPP and NOAA-20 VIIRS DNB high-gain stage using observations of bright stars. IEEE Trans. Geosci. Remote Sens. 2020, 58, 8038–8045. [Google Scholar] [CrossRef]
  64. Wilson, T.; Xiong, X. Performance assessments of the SNPP and N20 VIIRS DNB using observations of bright stars. In Proceedings of the Sensors, Systems, and Next-Generation Satellites XXIV, Online Only. 20 September 2020; Volume 11530. [Google Scholar]
  65. Cao, C.; Bai, Y.; Wang, W.; Choi, T. Radiometric Inter-Consistency of VIIRS DNB on Suomi NPP and NOAA-20 from Observations of Reflected Lunar Lights over Deep Convective Clouds. Remote Sens. 2019, 11, 934. [Google Scholar] [CrossRef] [Green Version]
  66. Ryan, R.E.; Pagnutti, M.; Burch, K.; Leigh, L.; Ruggles, T.; Cao, C.; Aaron, D.; Blonski, S.; Helder, D. The Terra Vega Active Light Source: A First Step in a New Approach to Perform Nighttime Absolute Radiometric Calibrations and Early Results Calibrating the VIIRS DNB. Remote Sens. 2019, 11, 710. [Google Scholar] [CrossRef] [Green Version]
  67. Doelling, D.R.; Wu, A.; Xiong, X.; Scarino, B.R.; Bhatt, R.; Haney, C.O.; Gopalan, A. The radiometric stability and scaling of collection 6 Terra-and Aqua-MODIS VIS, NIR, and SWIR spectral bands. IEEE Trans. Geosci. Remote Sens. 2015, 53, 4520–4535. [Google Scholar] [CrossRef]
  68. Doelling, D.R.; Hong, G.; Morstad, D.; Bhatt, R.; Gopalan, A.; Xiong, X. The characterization of deep convective cloud albedo as a calibration target using MODIS reflectances. In Proceedings of the Earth Observing Missions and Sensors: Development, Implementation, and Characterization, Incheon, Korea, 4 November 2010; Volume 7862. [Google Scholar]
  69. Bhatt, R.; Doelling, D.R.; Scarino, B.R.; Gopalan, A.; Haney, C.O. An initial assessment of the VIIRS onboard calibration using DCC and desert referenced to the Aqua-MODIS calibration. In Proceedings of the Earth Observing Systems XVIII, San Diego, CA, USA, 23 September 2013; Volume 8866, p. 88660K. [Google Scholar]
  70. Uprety, S.; Cao, C.; Blonski, S. Retrospective analysis of Suomi NPP VIIRS radiometric bias for reflective solar bands due to operational calibration changes. Int. J. Remote Sens. 2010, 37, 5472–5489. [Google Scholar] [CrossRef]
Figure 1. Radiometric biases due to the use of different solar irradiance models (MODTRAN 4.0 vs. Thuillier 2003) vary up to 3%, depending on the channel.
Remotesensing 13 01075 g001
Figure 2. Framework of Kalman-Filter-based Calibration Data Fusion (KFCDF) system for VIIRS (Reflective Solar Bands (RSBs) with wavelength < 1 µm).
Remotesensing 13 01075 g002
Figure 3. Five types of time series of VIIRS sensor radiometric performance monitoring measurements analyzed with trends illustrated using VIIRS M2 as an example. (a) The solar-F and lunar-F factor time series. (b,d) Time series of top-of-the-atmosphere (TOA) reflectance over Deep Convective Clouds (DCC) and Libya, respectively. (c) The percent difference in VIIRS M2 w.r.t. MODIS from SNOx; blue curve in each panel shows the trend in stability-monitoring measurement data after the preprocessing.
Remotesensing 13 01075 g003
Figure 4. Examples of Kalman-filtering-based assimilation of time series of solar-F, lunar-F, DCC-F and simultaneous nadir overpass (SNO)x-F factors for M1-M4 of SNPP VIIRS. In each panel, the black curve shows the optimal F factor time series estimated with the Kalman-filter-based calibration data fusion (KFCDF) model for the corresponding band.
Remotesensing 13 01075 g004
Figure 5. Schematics of KFCDF process for SNPP VIIRS data recalibration.
Remotesensing 13 01075 g005
Figure 6. (a) Solar diffuser reflectance degradation over time, as monitored by eight detectors in solar diffuser stability monitor (SDSM) (λ < 1 µm) of SNPP VIIRS. (b) Modeled degradation of SD reflectance for SNPP VIIRS near infrared (NIR) bands (M8-M11, λ > 1 µm) with Surface Roughness Raleigh Scattering (SRRS) model.
Remotesensing 13 01075 g006
Figure 7. Trends in the operational DNB high-gain stage (HGS) dark offset (updated monthly) and the reprocessed DNB HGS dark offset (updated weekly) [54].
Remotesensing 13 01075 g007
Figure 8. DNB low-gain stage (LGS) gain trends for the aggregation zone #1 (around nadir). (Left) Operational calibration showing discontinuity in LGS gain by using only one update in RSR on 4 April 2013. (Right) Recalibration showing smooth LGS gain trend after using continuous sets of time-dependent relative spectral responses (RSRs) [54].
Remotesensing 13 01075 g008
Figure 9. Sample DNB granule (Top) before and (Bottom) after straylight correction over the northern hemisphere. (Top) Operational radiance (16 December 2012) before straylight correction. (Bottom) Reprocessed radiance after straylight correction [54].
Remotesensing 13 01075 g009
Figure 10. Suomi NPP VIIRS bands’ M1–M4 monthly DCC reflectance time series before (red color, operational) and after (green color) recalibration.
Remotesensing 13 01075 g010
Figure 11. Suomi NPP VIIRS bands’ M8–M11 monthly DCC reflectance time series before (red color, operational) and after (green color) recalibration.
Remotesensing 13 01075 g011
Figure 12. F-factor differences between V1 and OC. M1-M4 bands show long-term calibration differences resulting from lunar-based OC calibration.
Remotesensing 13 01075 g012
Figure 13. Differences between SD F-factors with Kalman filter correction (V2) and OC SD F-factors. The calibration differences for M1-4 are within 2% level, nearly mitigated after the correction.
Remotesensing 13 01075 g013
Figure 14. F-factor comparison plots between NASA F-factors (solid lines) and NOAA version 2 F-factors (dotted lines) in the RSB bands.
Remotesensing 13 01075 g014
Figure 15. Daily averaged VIIRS–CrIS BT difference time series (March 2012 to February 2017). Reprocessed VIIRS and CrIS normal spectra data at nadir were used.
Remotesensing 13 01075 g015
Figure 16. Comparison of M13 radiance (11 March 2014, 16:47 UTC) before (operational) and after the version 2 reprocessing.
Remotesensing 13 01075 g016
Figure 17. S-NPP VIIRS I-bands’ geolocation errors in the along-scan (top) and along-track (bottom) directions for the version 2 reprocessed geolocation products.
Remotesensing 13 01075 g017
Table 1. Calibration Algorithms used in the Production of Visible Infrared Imaging Radiometry Suite (VIIRS) Sensor Data Records.
VersionsTime PeriodStatusSolar
Irradiance Model Used
ReferenceComments
OperationalOctober 2011–presentOperationally
produced and archived on CLASS
Modtran
4.3
[4]Not
consistent. Early data have many artifacts
RSBautocalJanuary 2012–May 2020Calibration coefficients regenerated but data not reprocessedModtran
4.3
[15]
Version 1 (removed Oscillation)January 2012–May 2020Incorporated in
version 2 bias
correction
Modtran
4.3
[27]
Hybrid (OC F-factor)January 2012–March 2017Generated by NOAA OC group for solar bandsModtran
4.3
[22]
V1.9 (using MODTRAN solar irradiance)November 2011–March 2018Calibration coefficients regenerated but data not reprocessedModtran
4.3
[27]
Kalman V2.0January 2012–May 2020Reprocessed and
ready for distribution
Thuillier 2003
Table 2. Reflective Solar Band Calibration Methodologies.
Calibration MethodAdvantagesLimitations
Onboard Solar Diffuser w/Solar diffuser stability monitor (SDSM)Frequent calibration (up to once per orbit); not affected by atmosphere; uniform and stable; absolute accuracy based on uncertainty budget analysisDiffuser itself degrades over time; residual degradation may not be accounted for even with the SDSM; NIR bands (M8-M11, I3) not covered by SDSM
Lunar calibrationLunar reflectance is extremely stable; monthly lunar calibration maneuver at same lunar phase angle can reduce uncertainties in stability down to sub-percent level in time seriesOnly 9 out of 12 months lunar cal is achievable (summer gap due to large spacecraft roll angle); each month only has one datapoint; requires longer time period (at least one year) to detect trend.
Desert/vicarious site calibrationDesert sites reflectance are considered pseudo-invariant; more accessible for all satellites; ground validation is possibleAtmospheric effect still exists; site bidirectional reflectance distribution function (BRDF) effect introduces seasonal uncertainties; site may not be stable; cloud contamination
reduces the number of useable samples. Not all sites are suitable.
SNO inter-satellite
calibration
Compares calibration with those from other satellites with low uncertainties using coincident observationsLimited to the polar regions for polar -orbiting satellites; extension to low latitudes compromises view angle and time widow; absolute values not established.
Deep convective cloudsNot affected by atmosphere due to height; bright and stable, spectrally relatively flat in the visible spectrum; more accessible globally.Clouds have no fixed location or shape; relies on large sample statistics to reduce uncertainties; absolute reflectance affected by BRDF
Table 3. Characteristics of Calibration Stability Monitoring Methods for VIIRS RSB.
Solar
Calibration
Lunar
Calibration
DCCSNOxDesert
Data
Frequency
Every orbitMonthly with
3–4 months gap each year
MonthlyAt most
8 days and
affected by cloud contamination.
At most
16-days and
affected by cloud contamination.
Starting Date8 November 20112 April 201215 February 20128 January 201218 January 2012
Table 4. Statistics of monthly DCC time series for the operational and reprocessed Suomi NPP VIIRS RSBs, including averaged monthly DCC reflectance (Avg.), standard deviation (SD,%), and linear trends (%/year).
Monthly DCC Reflectance
(Operational)
Monthly DCC Reflectance
(Reprocessed)
Avg.SD (%)Trend (%/year)AvgSD (%)Trend (%/year)
M10.9490.8−0.190.9470.5−0.01
M20.9390.9−0.440.9390.4−0.00
M30.9360.8−0.350.9350.50.11
M40.9070.7−0.300.9080.40.08
M50.9350.4−0.080.9290.40.05
M70.9240.40.070.9190.20.02
M80.6980.90.060.6880.5−0.00
M90.6261.60.110.6091.10.00
M100.2322.90.110.2281.7−0.04
M110.3712.10.090.3681.30.00
I10.8980.5−0.140.9000.40.05
I20.9250.5−0.210.9200.30.03
I30.2343.0−0.100.2291.7−0.05
Publisher’s Note: MDPI stays neutral with regard to jurisdictional claims in published maps and institutional affiliations.

