
UAS Identify and Monitor Unusual Small-Scale Rhythmic Features in the Bay of Cádiz (Spain)


Department of Earth Sciences, Faculty of Marine and Environmental Sciences, University of Cádiz, 11510 Puerto Real, Cádiz, Spain
*
Author to whom correspondence should be addressed.
Remote Sens. 2021, 13(6), 1188; https://0-doi-org.brum.beds.ac.uk/10.3390/rs13061188
Submission received: 19 February 2021
/
Revised: 15 March 2021
/
Accepted: 18 March 2021
/
Published: 20 March 2021
(This article belongs to the Special Issue UAV Application for Monitoring Coastal Morphology)
Abstract
:Unusual shore-normal and barred-like rhythmic features were found in Camposoto Beach (Bay of Cádiz, SW Spain) during a monitoring program using unmanned aerial systems (UAS). They appeared in the backshore and persisted for 6 months (October 2017–March 2018). Their characteristics and possible formation mechanism were investigated analyzing: (1) UAS-derived high-resolution digital elevation models (DEMs), (2) hydrodynamic conditions, and (3) sediment samples. The results revealed that the features did not migrate spatially, that their wavelength was well predicted by the edge wave theory, and that they shared characteristics with both small-scale low-energy finger bars (e.g., geometry/appearance and amplitude) and swash cusps (e.g., wavelength, seaward circulation pattern, and finer and better sorted material in the runnels with respect to the crests). Our findings pinpoint to highly organized swash able to reach the backshore during spring tides under low-energy and accretionary conditions as well as backwash enhanced by conditions of water-saturated sediment. This study demonstrates that rhythmic features can appear under different modalities and beach locations than the ones observed up to date, and that their unusual nature may be attributed to the low spatiotemporal resolution of the traditional coastal surveying methods in comparison with novel technologies such as UAS.
1. Introduction
Sandy coasts host a variety of well-known morphologies generated by the action of storms (e.g., washover fans and terraces, dune scarps). Apart from these, a wide spectrum of rhythmic features and/or mesoforms can develop alongshore on sandy coasts, under lower energy conditions and in different locations within the swash and surf zones [1]. This is due to the fact that sandy accumulations are constantly molded by the action of waves, an agent that presents harmonics as its main characteristic.
Different types of sandy bars, most of them rhythmic (e.g., crescentic or transverse bars or shoreface-connected ridges), are found in the swash and surf zones as well as in the inner shelf [1]. For instance, straight or crescentic shore-parallel bars present lengths that can range from 10 m to 3 km [2]. Crescentic bars, which are regularly spaced half-moon-shaped features with horns pointing landward and embayments pointing seaward, can migrate onshore, often causing the horns to reach the shoreline and remain attached to it. This leads to the formation of transverse bar systems, also known as “transverse bar and rip” (TBR), with shore-normal and/or oblique orientations [3]. However, these systems also appear by themselves, meaning that their origin is unrelated to any merging process of the offshore morphology with the shoreline, in environments characterized by low-intermediate wave energy [4,5]. In these situations, they are known as transverse finger bars, which present wavelengths that are typically much shorter than their cross-shore spans. Additional rhythmic features are beach cusps, defined as alternate horns and bays maintaining a seaward convex orientation that extends along the swash zone [6,7]. They have been classified following different criteria such as their longshore wavelengths (or spacing between consecutive horns) [8] or the hydrodynamic processes involved in their formation (nearshore circulation and/or the action of swash and backwash) [9]. Features with certain rhythmicity can also be found in the back-dune area, as is the case with sheetwash lineations. These rare bed forms, barely present in the scientific literature, derive from landward sheetwash linked to the action of extreme storms or tsunamis across barrier islands. They have been reported over uniform topographies (such as washover terraces) built hundreds of meters inland [10,11,12].
The formation mechanisms of these various rhythmic features are not yet fully understood. Regarding beach cusps, numerous studies in the past decades (e.g., [6,13,14]) have investigated the possible mechanisms responsible for their formation, with a special focus on two main theories. The first one, known as the standing edge wave theory, explains the formation of such rhythmic patterns as a consequence of a spatially variable hydrodynamic forcing acting on the sea bed, during which the swash from the incident waves is superimposed on the motion of a standing edge-wave, which are longshore periodic gravity waves that can be excited by wind-generated waves impinging on a beach [6]. The edge-wave can be of the zero sub-harmonic type or of the synchronous type. The result of this interaction leads to the formation of regular perturbations in the bed [6] exhibiting wavelengths that are predicted by Equations 1 and 2 for the zero sub-harmonic and the synchronous edge-wave modes, respectively:
where λ is the cusp spacing, g is the acceleration of gravity, Ti is the incident wave period, and tan β is the beach gradient. The second theory explaining the formation of beach cusps is the theory of self-organization [13,15]. This theory states that such rhythmicity in the beach-face results from the effect that the developing morphology has on the swash flow, which causes the growth of horns (positive feedback), also, the ulterior effect that the swash flow itself has in the sediment transport along the developing morphology, which leads to the erosion of the bays (negative feedback). Such interaction is considered to contribute to the stabilization of cuspate systems [16]. In this case, the alongshore distance between the resulting horns (or bays) can be predicted by applying the following expression:
where f is a factor with values ranging from 1 to 3 (1.6 in the field, according to [14]), and S is the swash excursion. Despite the common constraints associated to the uncertainty of the estimation of the parameters in the previous formulations (such as the swash excursion, the incident wave period, and/or the beach gradient) and/or to the lack of accurate in situ morphological and hydrodynamic data during their formation [17,18,19], the above theories have been able to predict cusp wavelengths that adjust with moderate accuracy to the ones observed in the field [7,9,19,20,21]. In some cases, the problem lied in the fact that both theories led to accurate predictions, making it difficult to reach a clear conclusion [13,14,18,22]; furthermore, [23] reproduced with success the formation of cusps by using a model that coupled both the edge wave and the self-organization theories. Aside from cusps, the self-organization theory has also been linked to the formation of crescentic and transverse finger bars [24,25,26,27].
More recent investigations [28,29] state that all the rhythmic features form, migrate, and evolve in a way that can be explained in the context of a depth-averaged shallow water model, in which the initial development of the rhythmic pattern responds to a self-organizing mechanism involving the joint action of gradients in the depth-averaged sediment concentration (DASC) and the flow. In other words, as waves and currents approach the shore they exert shear stresses over the sea bed, resulting in the erosion and transport of sediment [28]. Deposition (erosion) occurs where the current flows from high (low) to lower (higher) concentrations of sediment, or also where the flow experiences divergence (convergence) [29]. This approach is based on the premise that feedback mechanisms exist between the morphology and the hydrodynamics, since the convergence/divergence of sediment transport leads to morphological changes in the bed, which in turn influences the wave and current fields. Therefore, it seems that the most recent investigations tend to favor self-organization mechanisms between morphology and the flow for explaining the growth of rhythmic features, rather than assuming that an edge-wave imposes the pattern in the bed, as pointed above.
Additional rhythmic patterns, similar to ripples, can also be found in unpaved sandy roads or highways due to a process known as washboarding or corrugation. These rhythmic patterns occur under the influence of a flow of vehicle traffic and exhibit wavelengths between 0.5 and 1 m, as well as amplitudes up to 50 mm [30]. These rhythmic patterns have been modelled [31,32] or analyzed in theoretical and laboratory experiments [33], as they cause the deterioration of unpaved roads.
Patches of barred-like features with significant rhythmicity alongshore were identified in Camposoto Beach (Bay of Cádiz, SW coast of Spain) in October 2017. They were spotted in the backshore, an unusual location for the formation of rhythmic features, during a monthly monitoring program (between 01/2017 and 03/2018) based on the use of unmanned aerial systems (UAS) that was being performed in the area. However, no information was available regarding the time of their formation or the mechanism involved, since the UAS surveys were suspended from May until October 2017, when the surveys were resumed and the features were detected. They persisted and were monitored during the following 6 months until March 2018, when they disappeared due to the erosion caused by a severe storm that impacted the area. In order to gain knowledge about the possible origin and nature of these unusual backshore rhythmic features, their possible formation mechanism and evolution were investigated by analyzing their geometry from high-resolution digital elevation models (DEMs) derived from the UAS surveys, complemented with Google Earth imagery, as well as the oceanographic conditions, and the results obtained from grain-size sediment analyses.
The introduction of cost-effective new technologies for taking fast and low aerial images such as UAS allows a better identification and monitoring of these features.
Study Site
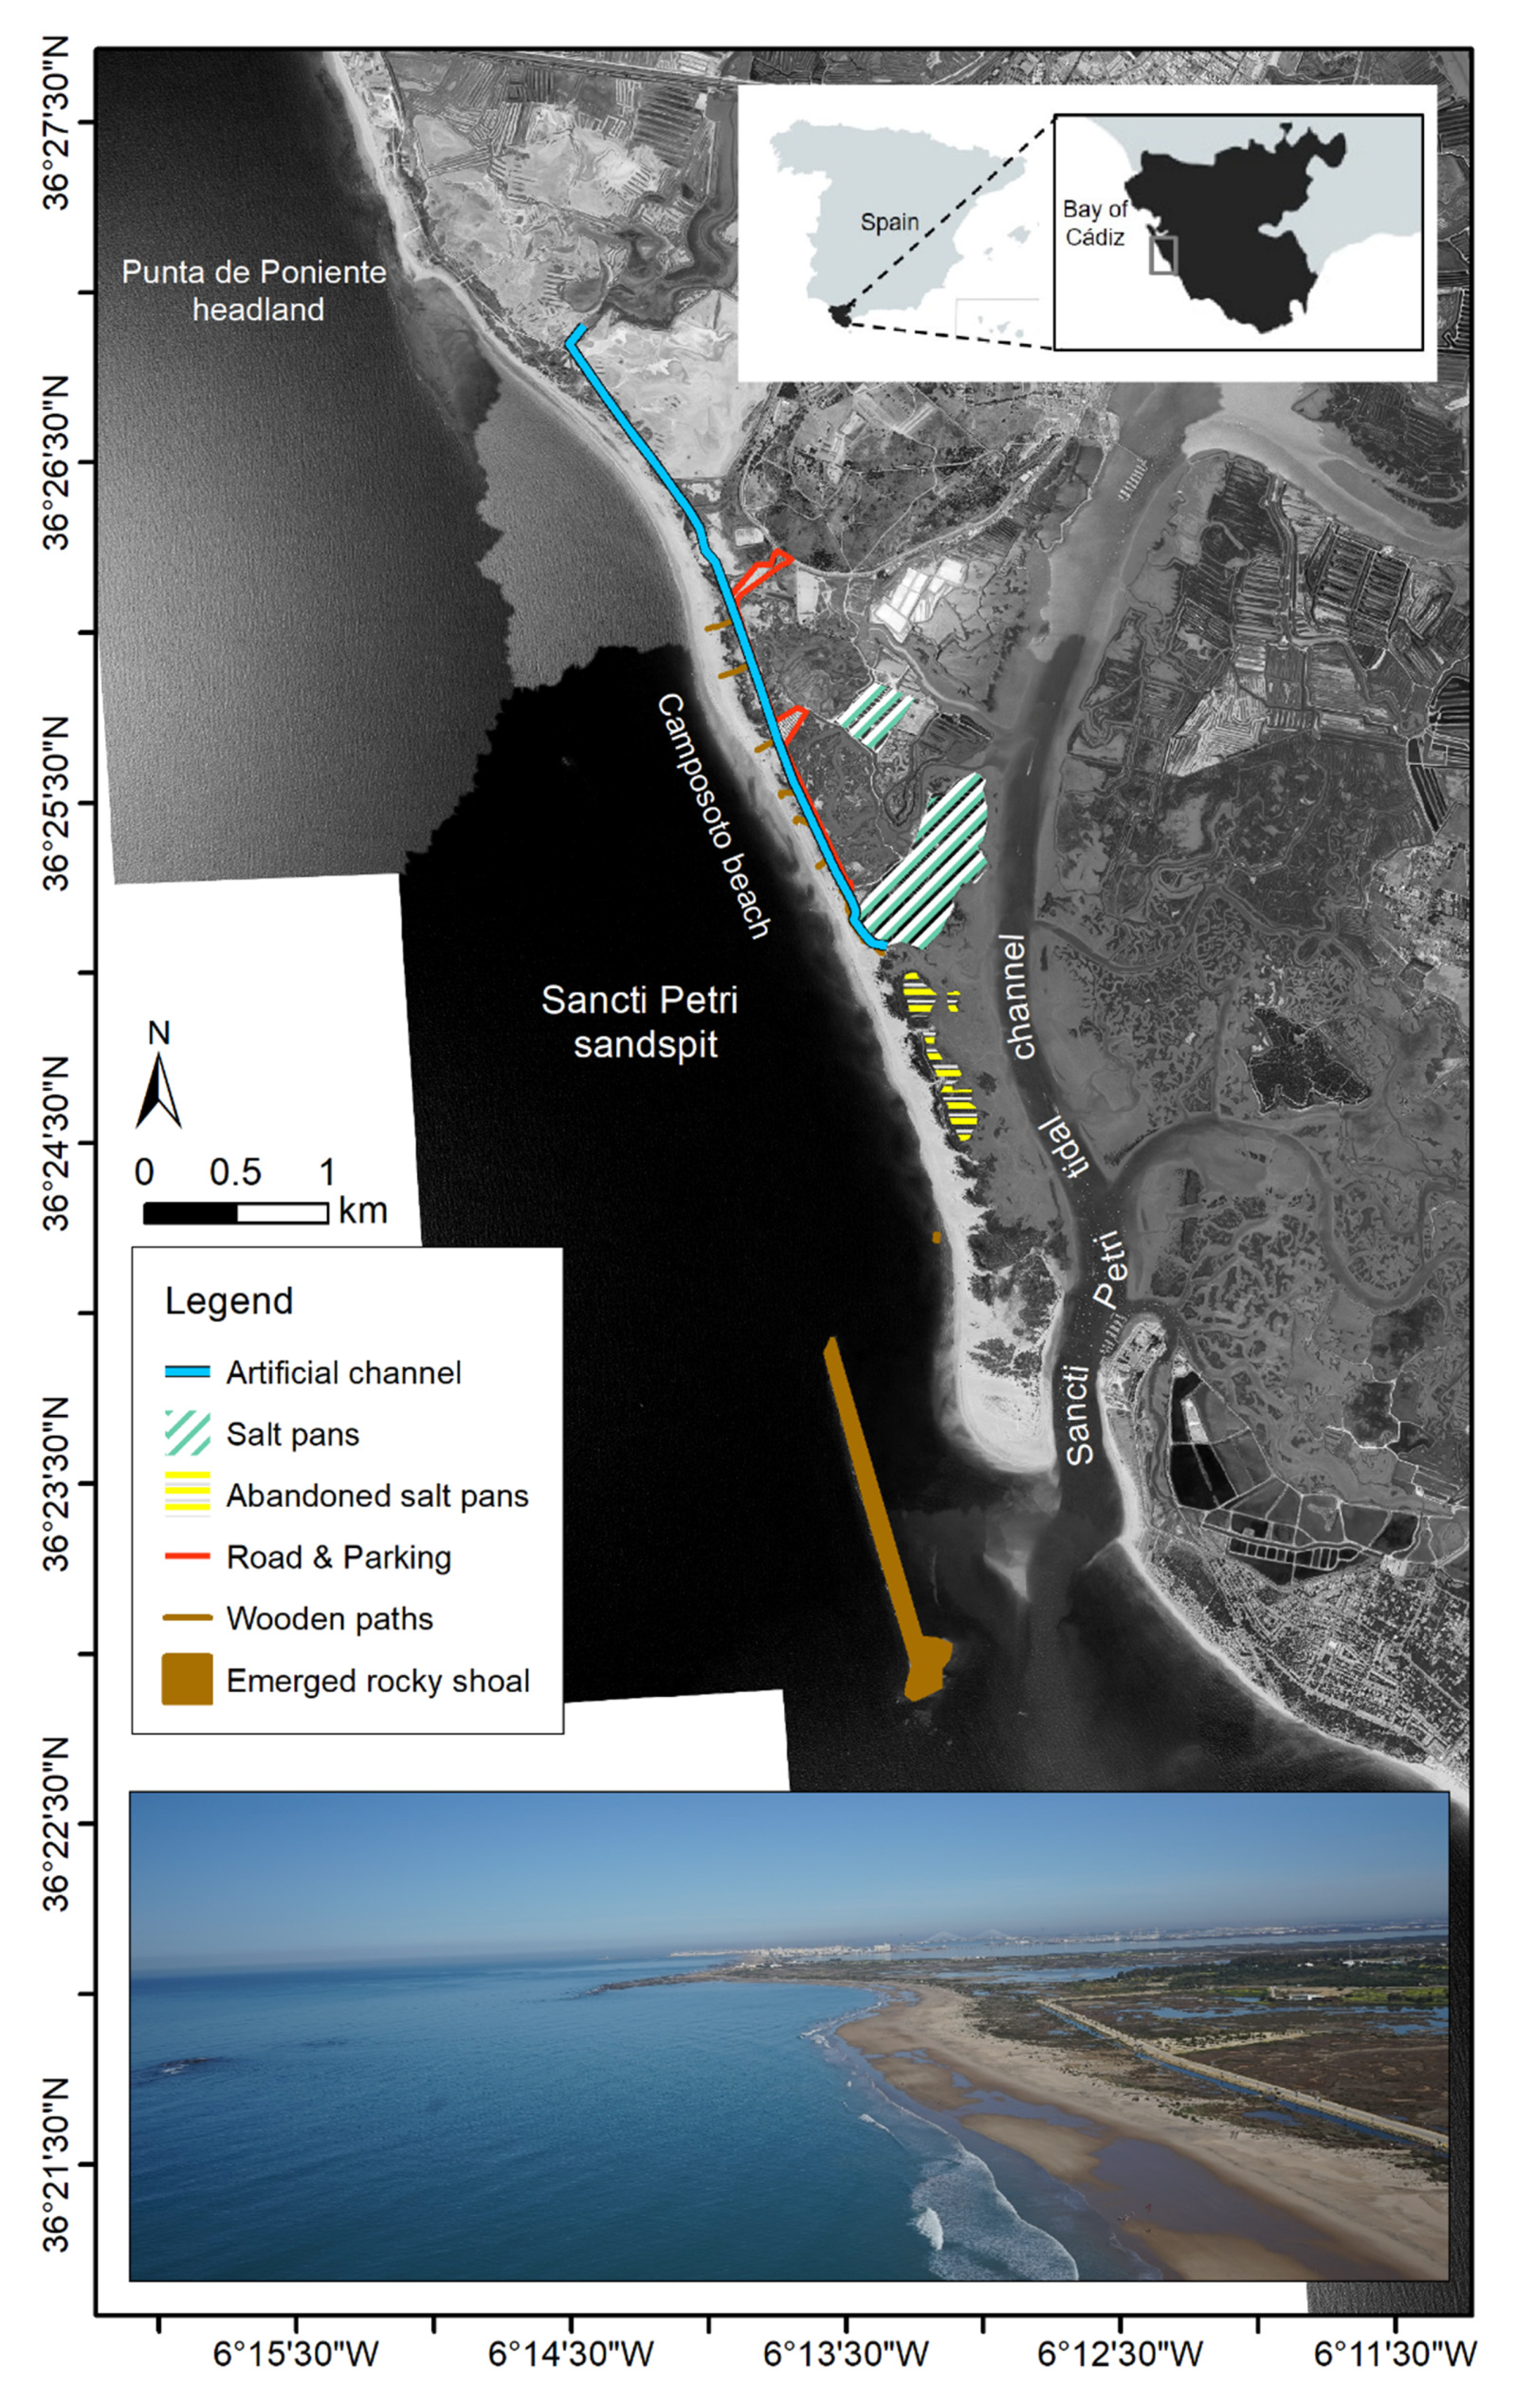
Camposoto Beach is located in the Sancti Petri spit, which is a NNW-SSE-oriented sandy spit-barrier located in the south Atlantic margin of the Spanish coast, in the province of Cádiz (Figure 1). The spit extends from Punta de Poniente headland to the north, to Sancti Petri tidal channel to the south [34], with a total length of approximately 7 km and a width that increases from north (circa 200 m) to south (circa 450 m) (Figure 1). The spit belongs to the Bay of Cádiz Natural Park due to the high ecological value of the different ecosystems present in the area, namely, sandy beaches, dunes, and salt marshes. However, it is considered as a semi-natural environment, since its northern sector presents a road and an artificial water channel, parking lots, and wooden pathways that give access to Camposoto Beach (Figure 1). The beach is subject to a high touristic pressure during the summer season, and recreational facilities are installed across the beach and dunes at that time.
The Sancti Petri spit mostly evolves during the winter season, time in which sea and swell waves linked to Atlantic low pressure systems hit the coast, mainly approaching from the west and/or southwest directions, rising significant wave heights that can exceed 4 m [35]. Nonetheless, it is considered as a low-energy coast given that 70% of the annual waves show heights below 1 m. Easterly storms are less frequent and less energetic due to the coastline orientation, which provides limited fetch. The tidal regime is characterized by a semidiurnal type and a mesotidal range [36], with a mean spring tidal range (MSTR) of 2.96 m. The beach profile type in Camposoto is intermediate-dissipative, and it follows a seasonal behavior [37]. The sediment in the area is quartz-rich and presents medium-grained sand [38], which is coarser at the lower beach and finer at the upper beach area [39]. The entire spit is sheltered by an offshore shore-parallel submerged rocky shoal [40] located at a distance of approximately 800 m (see an emerged part during low tide in the bottom picture of Figure 1), which presents certain discontinuities and depths that vary from 1 to 14 m, respectively, below the hydrographic zero, which modify the incident waves [41].
The combination of spring tides and storms triggers the occurrence of overwash processes, which lead to the presence of multiple washover fans along the spit. Despite several artificial nourishment actions having been undertaken in the northern sector of the spit, it is retreating over the medium-term at an average rate of 1 m/year [35]. Proof of this retreating trend are the presence of outcrops of a peat layer at the foreshore, corresponding to fossil salt marshes, the reactivation of the present washover deposits (even during non-storm conditions) [42], and the presence of human infrastructures in the intertidal area, which were originally placed on top of the foredune several decades ago.
2. Materials and Methods
A total number of 5 high-resolution digital elevation models (DEMs) were used to analyze the aforementioned rhythmic features between October 2017 and March 2018. The DEMs presented vertical accuracies of 8 cm approximately and were generated from the images obtained during different UAS-based surveys. These were performed using an octocopter equipped with a RGB Sony Alpha camera flying at a height of 95 m. A more detailed description of the configurations of the UAS flights and the workflow followed regarding the field work and the image processing can be found in [43].
In order to check for spatial and temporal variability of these features during the time in which they persisted in the area, the monthly DEMs were imported as ASCII files in ArcMap (®ESRI).
Two alongshore profiles were drawn at the areas where the patches of rhythmic features were more prominent, in order to check for possible time-dependent migration rates. The changes observed in the previously mentioned alongshore profiles were compared and correlated with time series of hydrodynamic conditions during the analyzed period, namely tide, significant wave height, and peak wave period. The wave data were obtained from the SIMAR point 6,012,036 provided by the Spanish National Port Authority (Puertos del Estado 2017–2018, [44]), and the tide signal was obtained from the tidal station of Cádiz Port, which belongs to the Spanish Institute of Oceanography (http://indamar.ieo.es, accessed on 31 January 2018) and is referred to as the hydrographic zero. The rhythmic features were already formed when they were mapped for the first time in October 2017, so no in situ hydrodynamic or morphological measurements were available during their formation.
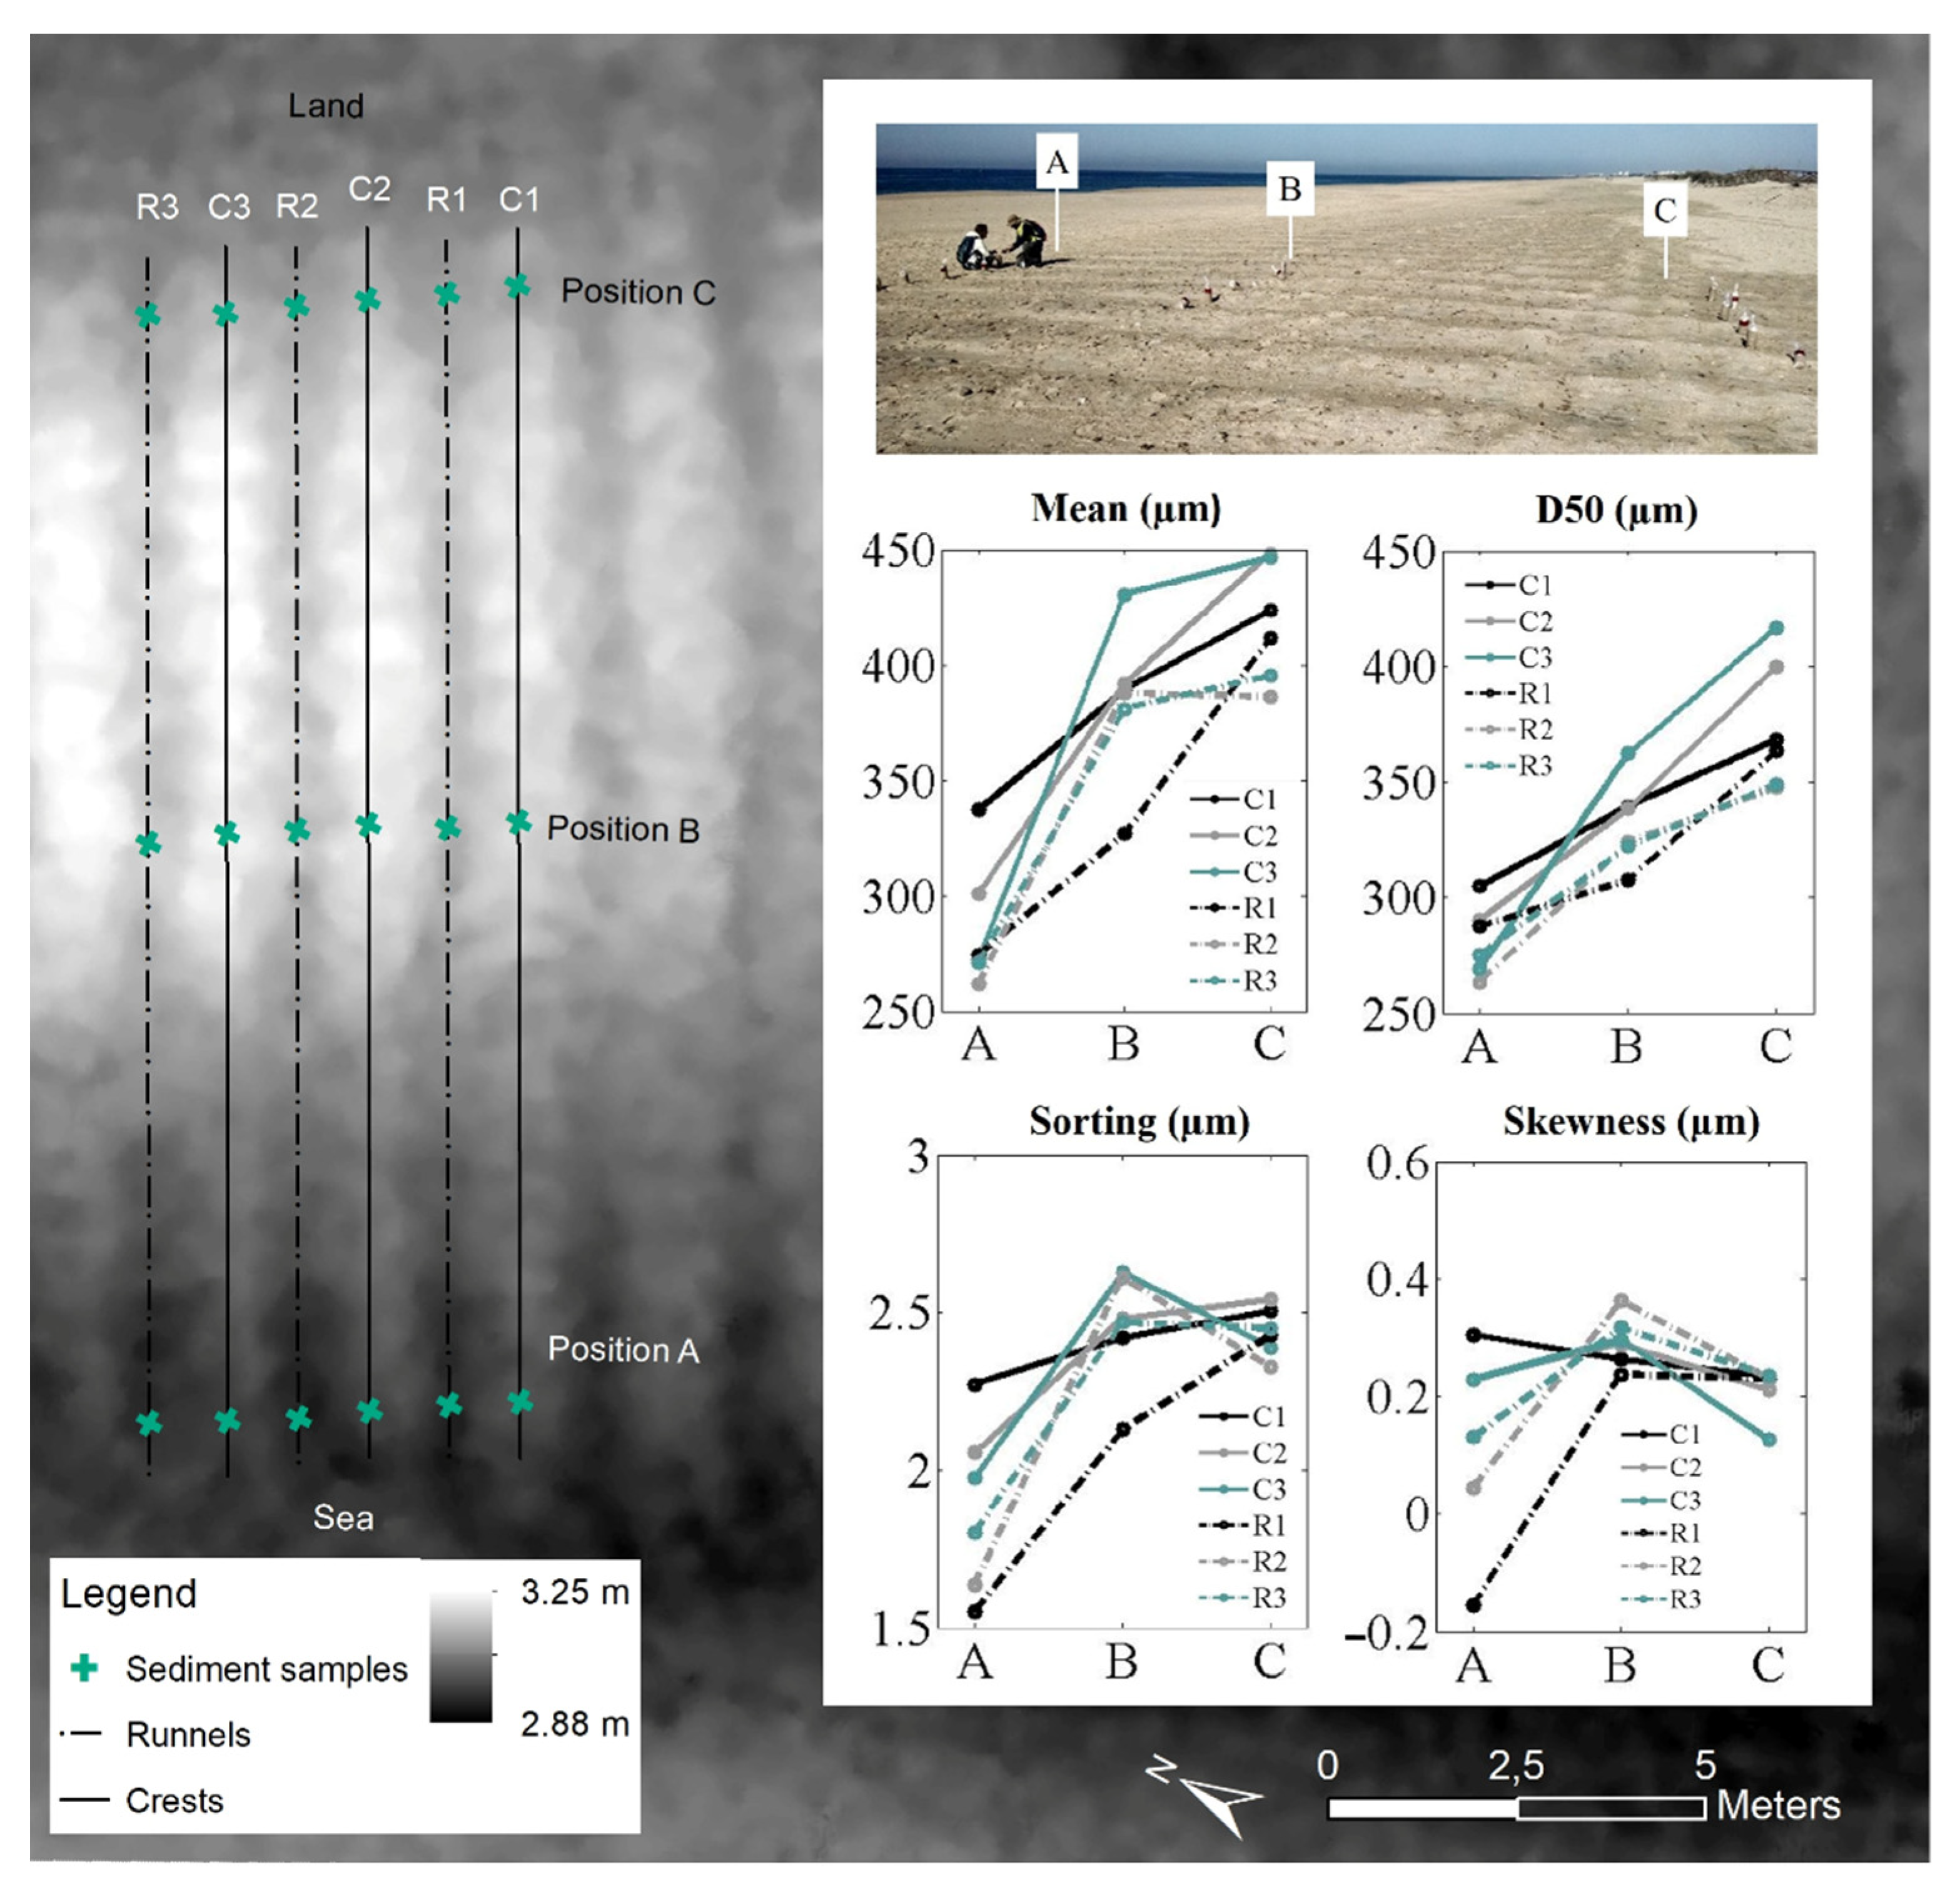
Sediment sampling was also performed in the beach sector where the rhythmic features were more prominent. In this area, 18 sediment samples (approximately 10 cm in depth) were taken along three consecutive crests and runnels and brought to the laboratory for grain-size sediment analysis. The samples were dried in an oven at 90 degrees for 24 hours and sieved for 10 minutes using a column equipped with seven sieves (4000, 2000, 1000, 500, 250, 125, and 63 microns). Granulometric parameters of the sediment samples were obtained according to the geometric Folk and Ward method using GRADISTAT software [45].
In addition, analyses of the Google Earth satellite imagery available for the Sancti Petri spit were also performed in an attempt to find the features at any other time. The possible appearance of these features was analyzed over the last few years (2002–2018) along the entire spit. In those images where they appeared, their extension was measured, as well as their length and spacing.
Aiming to elucidate the possible origin of the rhythmic features, diverse tests were performed in order to check whether the observed spacing between them could adjust to those predicted by the edge-wave theory (the self-organization theory could not be tested due to the lack of sufficient data), even though this theory has always been linked to processes occurring in the surf and swash zones instead of the backshore as in this case. However, spring tides and/or long-period waves are factors that module the onshore shifting of the swash and surf zones [46], making swash processes temporarily active in the backshore under those conditions. In order to test the edge-wave theory, oceanographic variables from the previous spring tide, which may have covered the beach prior to the appearance of the features, were collected. Significant wave heights as well as peak periods were extracted from the previously mentioned SIMAR point. Additionally, the beach gradient was calculated from the DEMs and also from RTK-DGPS profile measurements that were performed to validate the vertical resolution of the DEMs, and the observed spacing was measured in order to test the possible formation theories.
3. Results
3.1. Geometry of the Rhythmic Shoreline Features
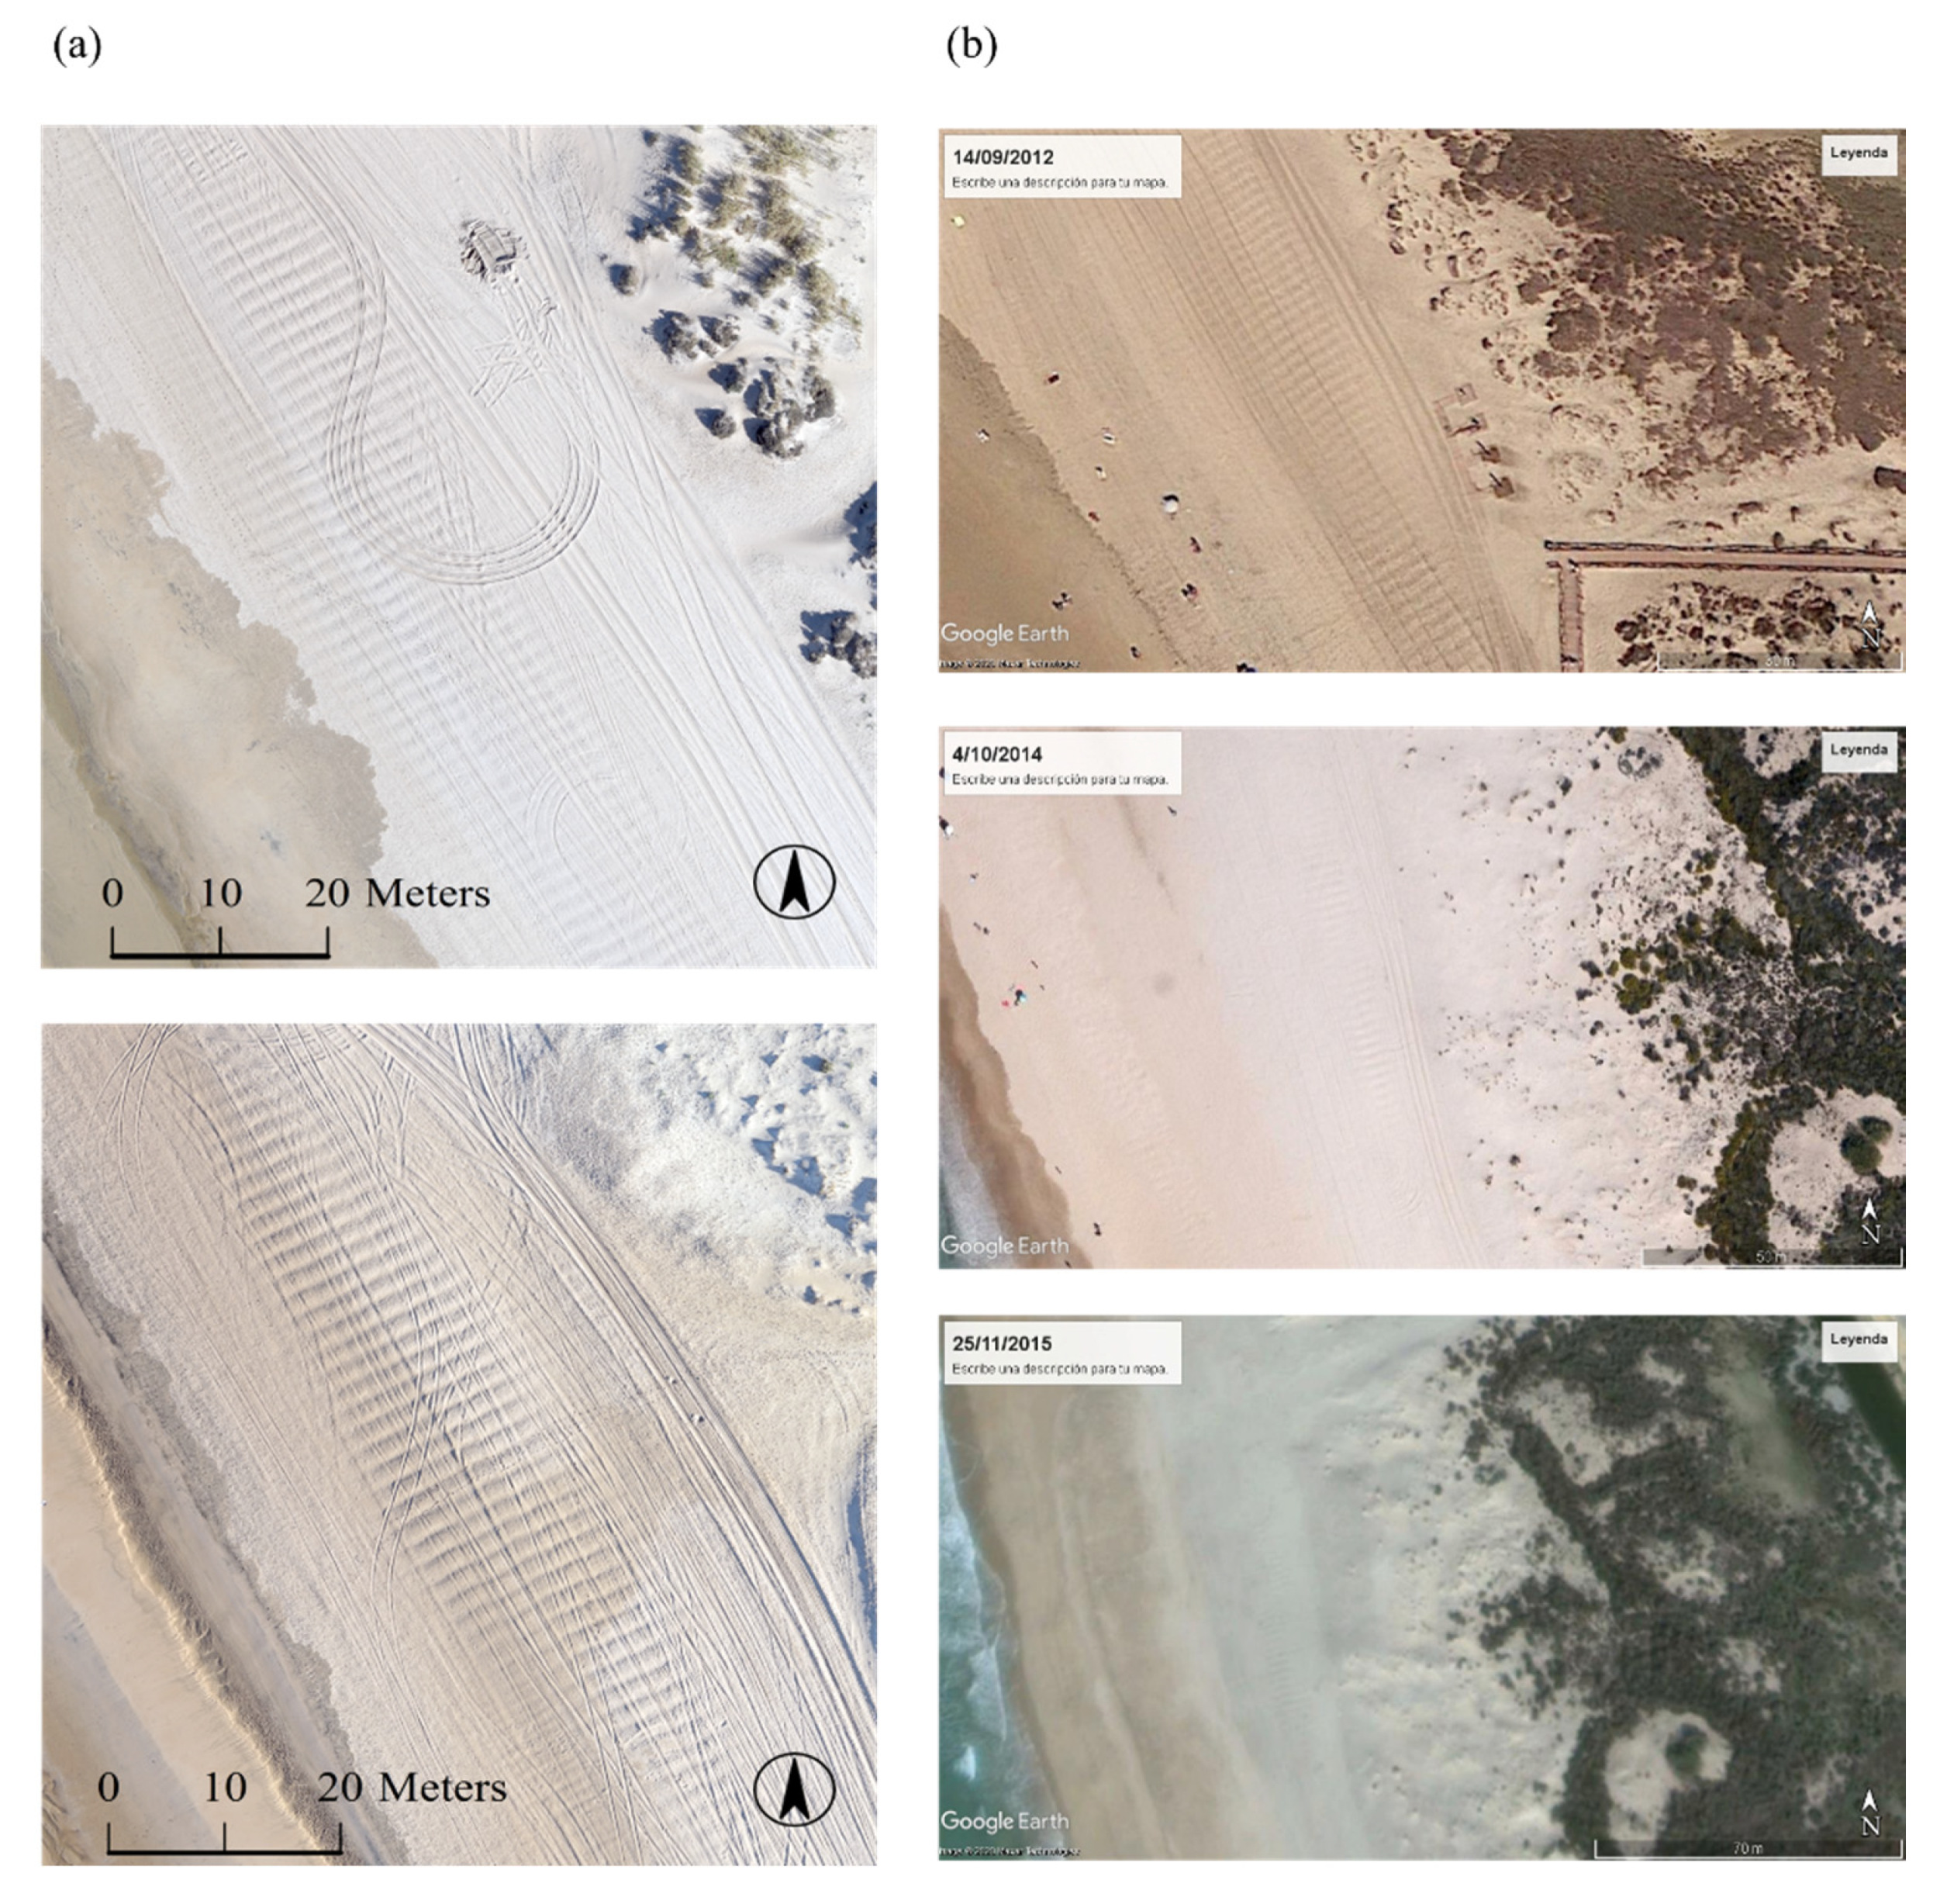
The exact moment in which these rhythmic features were formed is unknown, but they were absent in the pre-summer UAS survey performed on May 2017, and as mentioned above, they were later detected in the survey carried out on October 2017. In addition, these features did not appear during the previous 2-year monitoring program performed in this area. The rhythmic features observed during the field surveys were shore-perpendicular and formed by parallel bar-like features consisting in alternate, evenly spaced crests and runnels that presented varying cross-shore spans (Figure 2a), ranging from 3 m to up to 34 m, with an average cross-shore length of around 10 m. The spacing between consecutive crests (or runnels) remained almost constant around 2 m, with minimum and maximum values of 1.7 and 2.5 m, respectively. More difference in spacing was found laterally than between different surveys. The amplitude of the undulations varied alongshore. In the patches where they were more prominent, it was of approximately 10 cm.
Similar length and spacing were also observed in the features recorded in the 2012, 2014, and 2015 Google Earth images (Figure 2b) (in the rest of Google Earth images the features were absent or not visible). It could also be observed that these features tended to appear roughly in the same area of the spit, characterized by a greater width of the dry beach during autumn conditions, presumably before the arrival of storms. They were found mainly in the area around P1 (Figure 3) both in the surveys carried out with UAS and in the images extracted from Google Earth, although they also appeared less developed in the P2 area. In the P1 zone, they usually appeared in sections of around 500 m length. In general, these features covered extensions of hundreds of meters, although in some images, such as in 2015, they appeared in very small sections of less than 100 m long (although, in this image, they were blurred, which could mean that they were relict). Table 1 and Table 2 show the main characteristics of the rhythmic features in the UAS-derived mosaics and DEMs (Table 1) and in the Google Earth imagery (Table 2).
The average elevation at which they appeared was slightly superior to 3 m (above the hydrographic zero), which corresponds to the average range of spring tides in Cádiz. As can be seen in the Google Earth images as well as in the DEMs (Figure 2), these features were always located inland of the berm, an area of the beach that would only be affected by swash during spring tidal conditions.
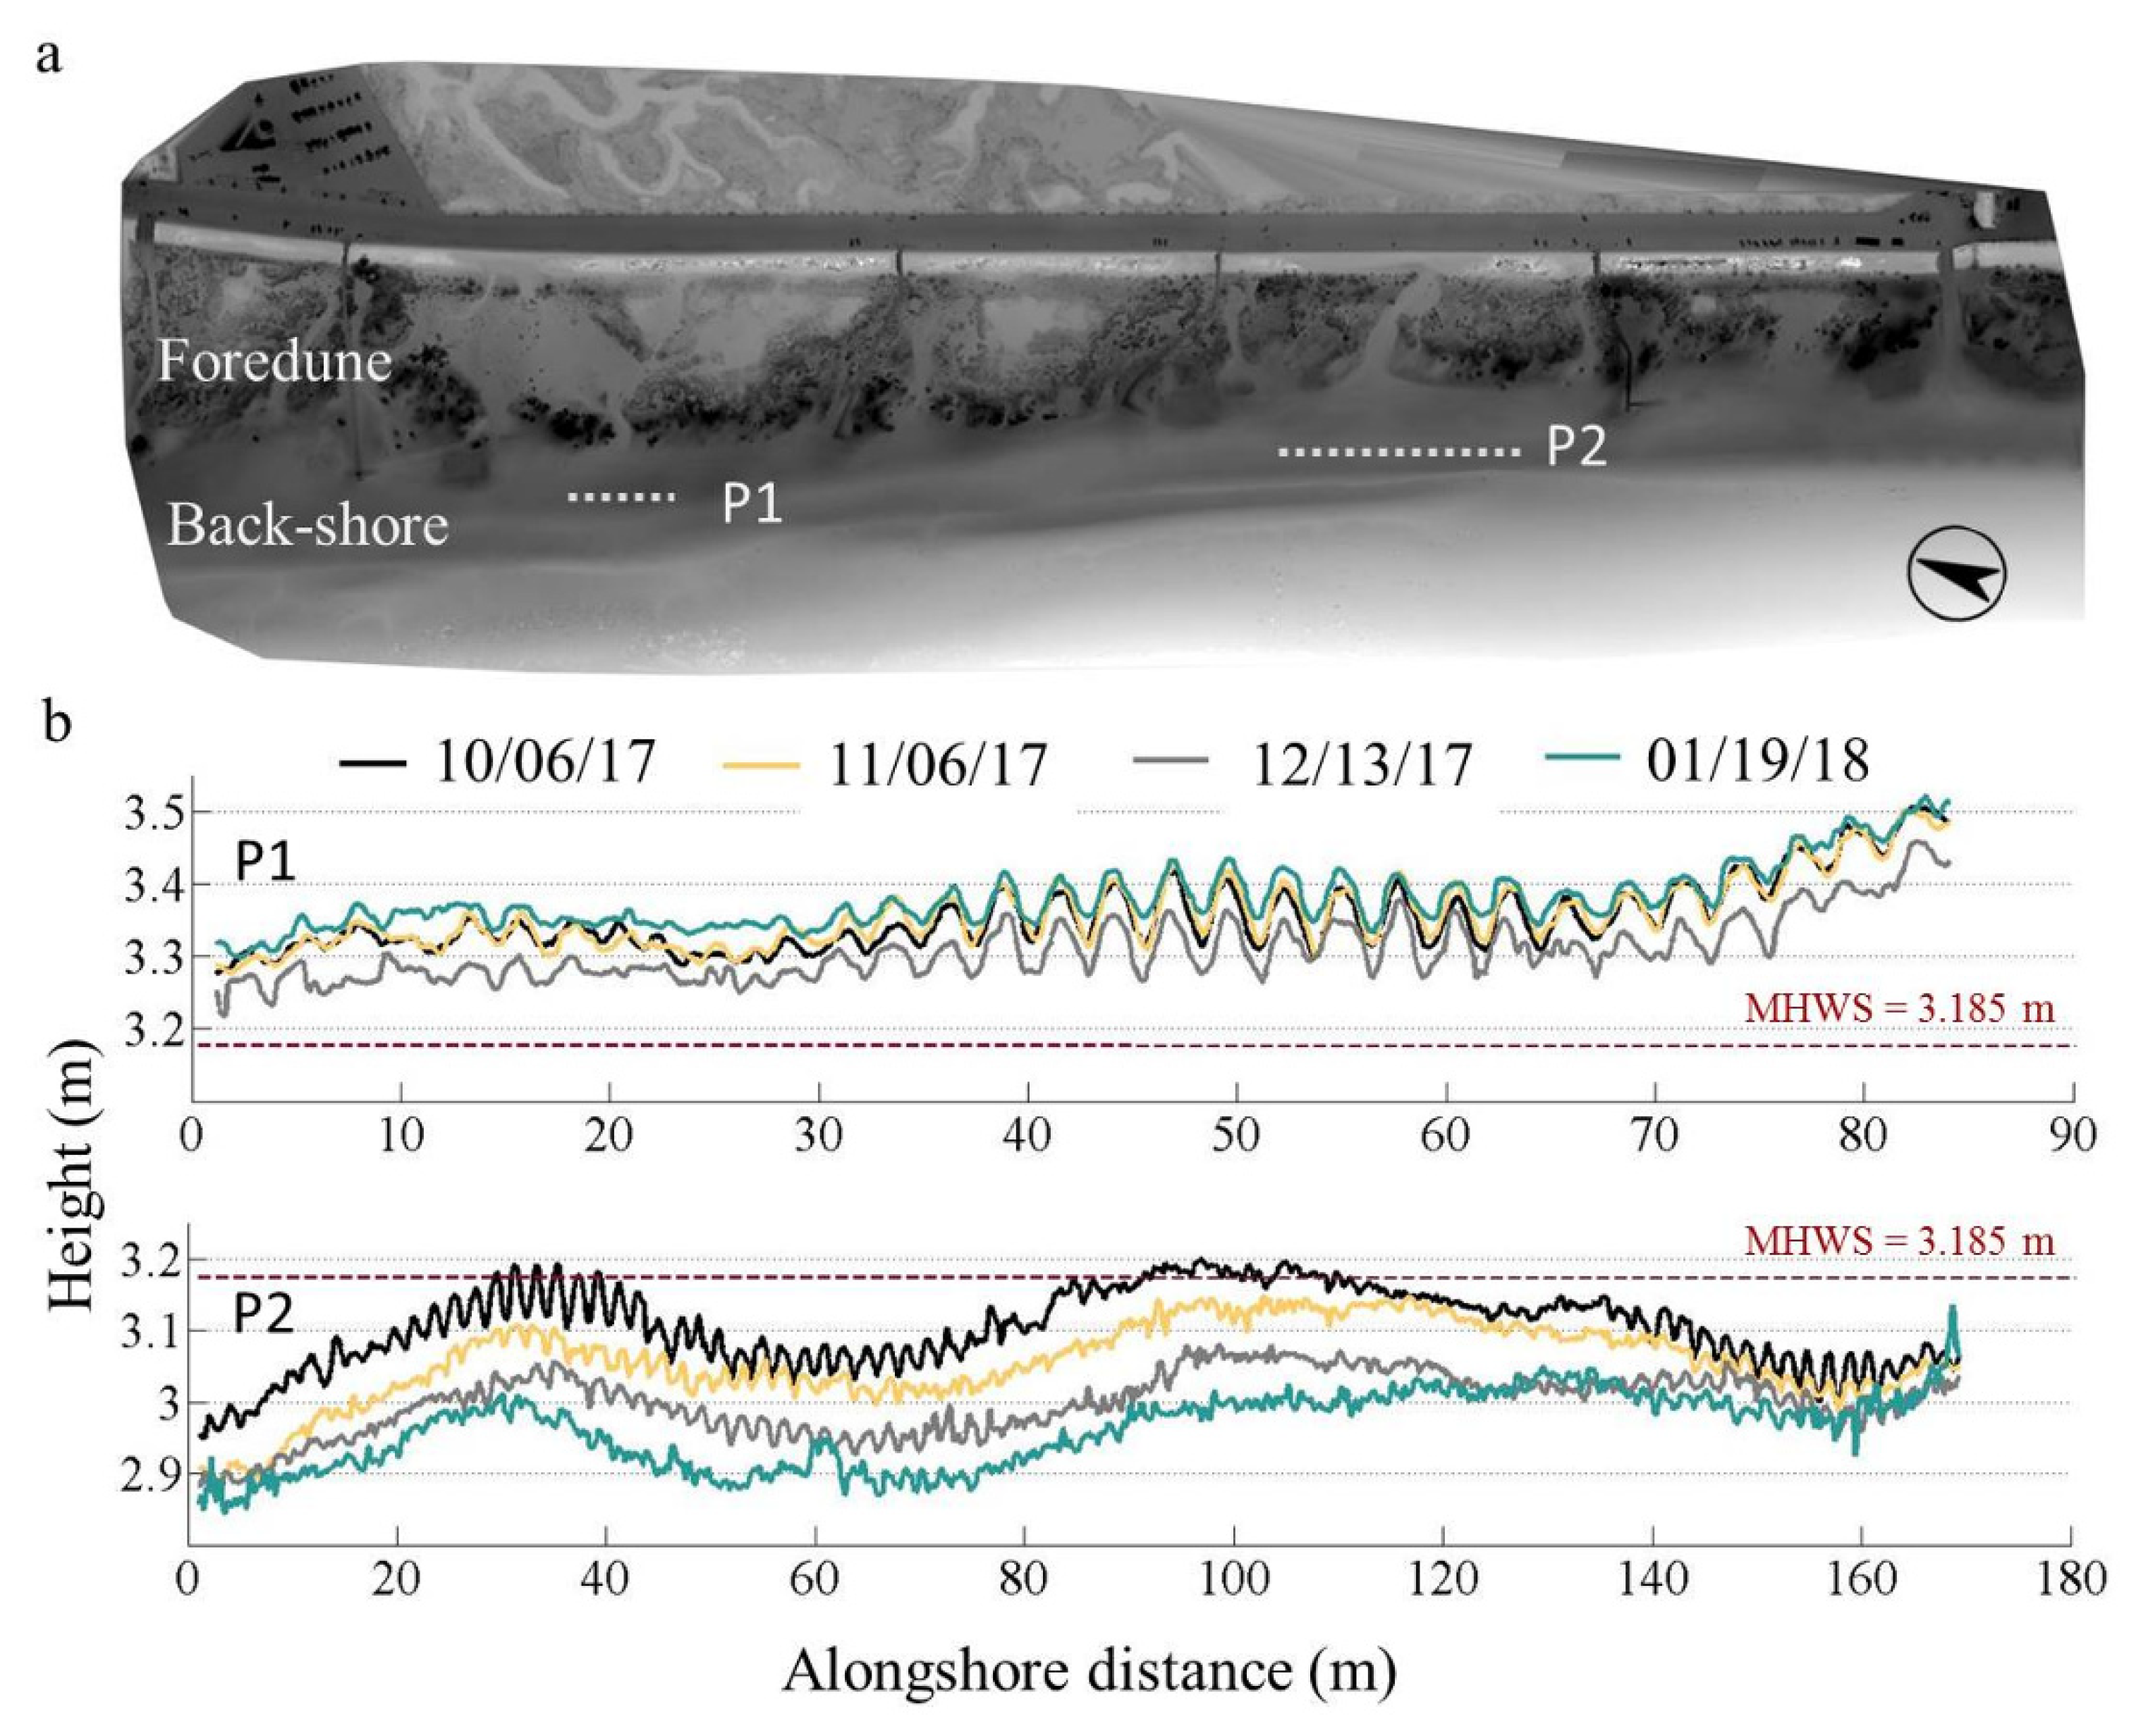
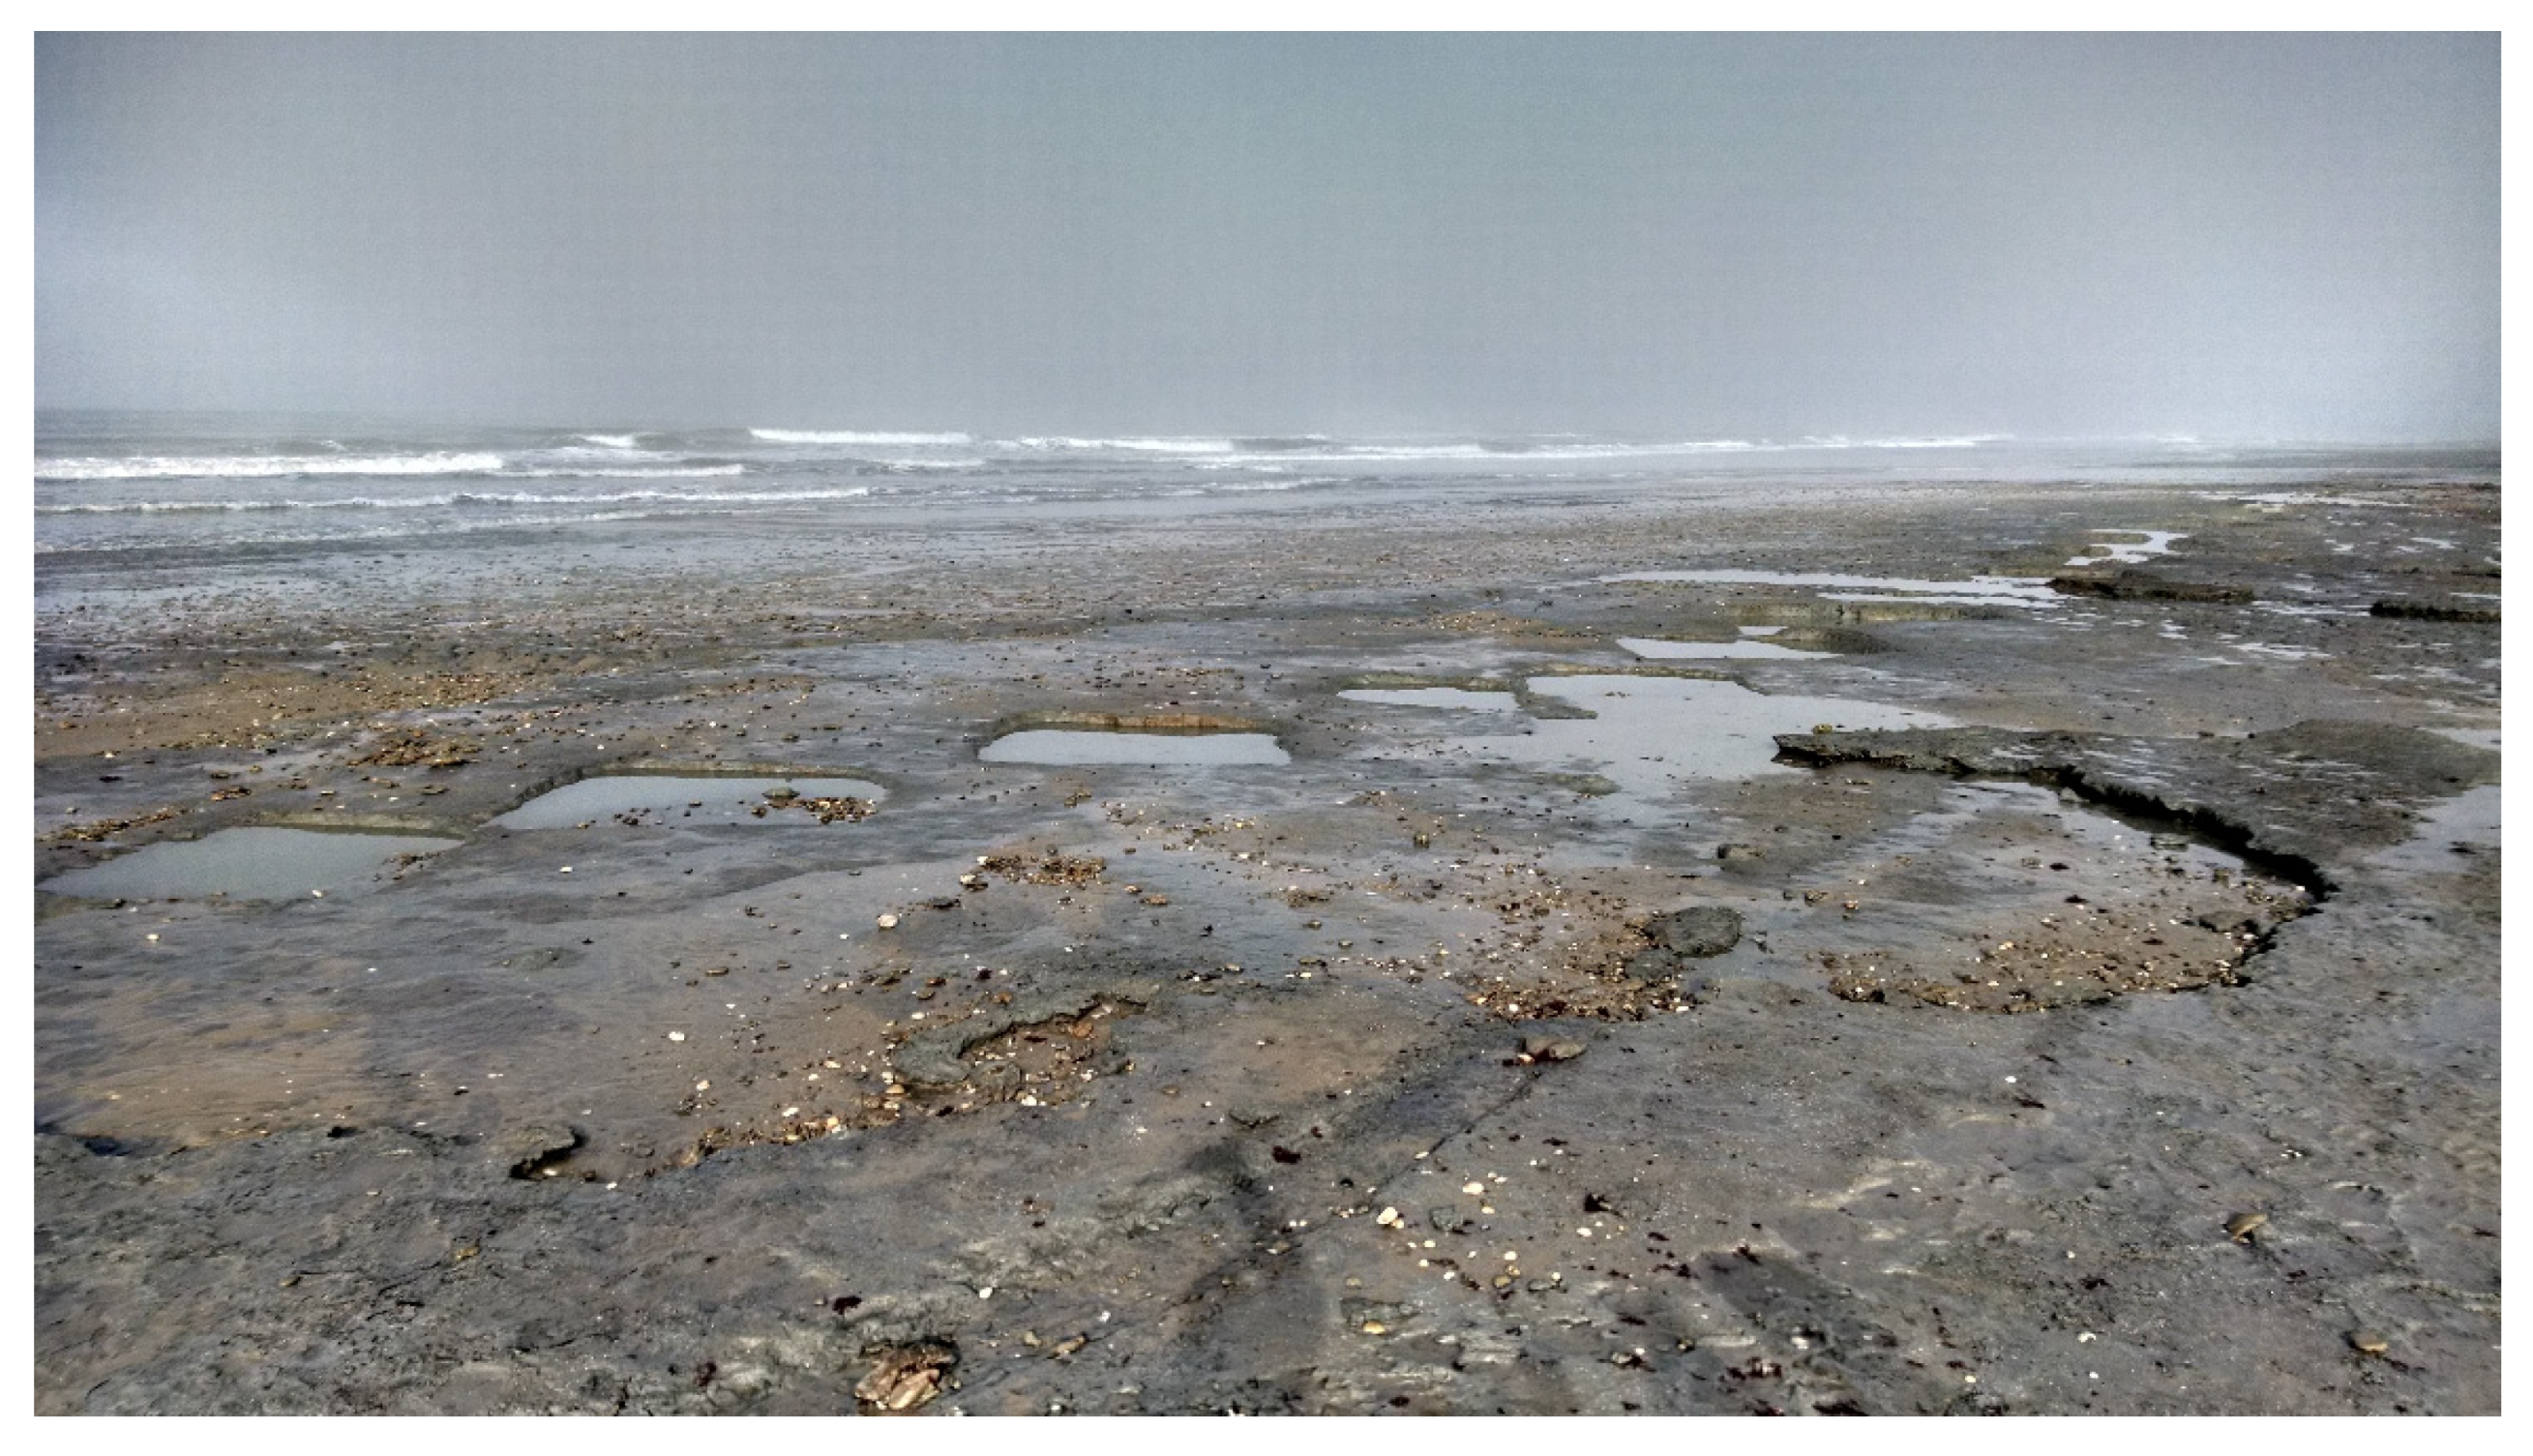
The alongshore profiles extracted from the DEMs revealed that the features did not migrate or move laterally during the topographic surveys (October 2017–January 2018), since the crests and/or runnels maintained exactly their initial positions within the topographic surface (see P1 and P2 in Figure 3a,b). On the other hand, these elongated features evolved simultaneously with the vertical shifts of the topography in the backshore, which in turn progressed responding to the varying hydrodynamic conditions of that period (described below). Thus, the features located at the southern sector (P2 in Figure 3a) became deformed as the backshore progressively flattened, although in the penultimate survey (January 2018), they were still visible (see P2 in Figure 3b). On the contrary, the ones situated in the northern sector (P1 in Figure 3a) maintained their shape more or less (see P1 in Figure 3b). This contrasting temporal behavior between P1 and P2 can be explained by the slightly different elevations of the backshore between both areas. The elevation of the area where P2 was extracted is lower than the area where P1 was built, and thus, it was more exposed to the hydrodynamic forcing and experienced stronger erosion from October 2017 to January 2018. Afterwards, a severe storm made landfall in March 2018, and the parallel features completely disappeared due to average vertical erosion of the foreshore of approximately 1 m [47]. The erosion was such that it caused the exposure of an extensive patch of impermeable peat along the foreshore (Figure 4) [47].
With respect to the features that appeared in the images of Google Earth, evidently their temporal evolution could not be studied, but it can be observed how those of 11/25/2015 (Figure 2b) appeared much more flattened and blurred, which is in accordance with the above and would indicate that they were remnant features of previous hydrodynamic conditions.
In general, from a morphological point of view, it has been observed how these features presented fairly constant characteristics in all the periods studied and did not show any significant temporal changes.
In order to test the edge-wave theory as the possible mechanism leading the formation of the investigated features, their wavelength (spacing) and the beach gradient (0.0255), estimated using RTK-DGPS profile measurements, were introduced in Equation (1) (sub-harmonic edge-wave mode) and Equation (2) (synchronous edge-wave mode), and the results obtained are shown in Table 3. Due to both the uncertainties in the estimation of the swash excursion and the lack of measurements regarding the depth-averaged sediment concentration and currents, neither the self-organization theory (Equation (3)) nor the DASC-based method could be tested. However, different swash excursion values were introduced in Equation (3), and none of them led to the observed spacing of 2.2 m.
3.2. Textural Analysis of Sediment
Mean and D50 statistical parameters revealed that the sediment along crests and runnels (positions A, B, and C in Figure 5) was medium sand (250–500 µm), although the runnels (dashed lines in Figure 5) presented slightly smaller grain sizes than the crests (solid lines in Figure 5), as occurs in beach cusps. In addition, grain size increased in the landward direction along both crests and runnels. On the other hand, the sorting parameter exhibited poorly classified sediment in all the samples (2–4 µm) without distinction along crests. However, the samples were moderately sorted and moderately well sorted (1.62–2 and 1.41–1.62 µm, respectively) in the seaward ends of the runnels (A position). With regard to the spatial distribution of the skewness parameter, it showed coarse (or positive) skewness of the sediment along crests C1, C2 C3, and runnel R3; although, in the seaward position (A), the sediment size distributions in runnels R2 and R3 were symmetrical and fine (or negatively) skewed, respectively (Figure 5).
3.3. Hydrodynamic Conditions
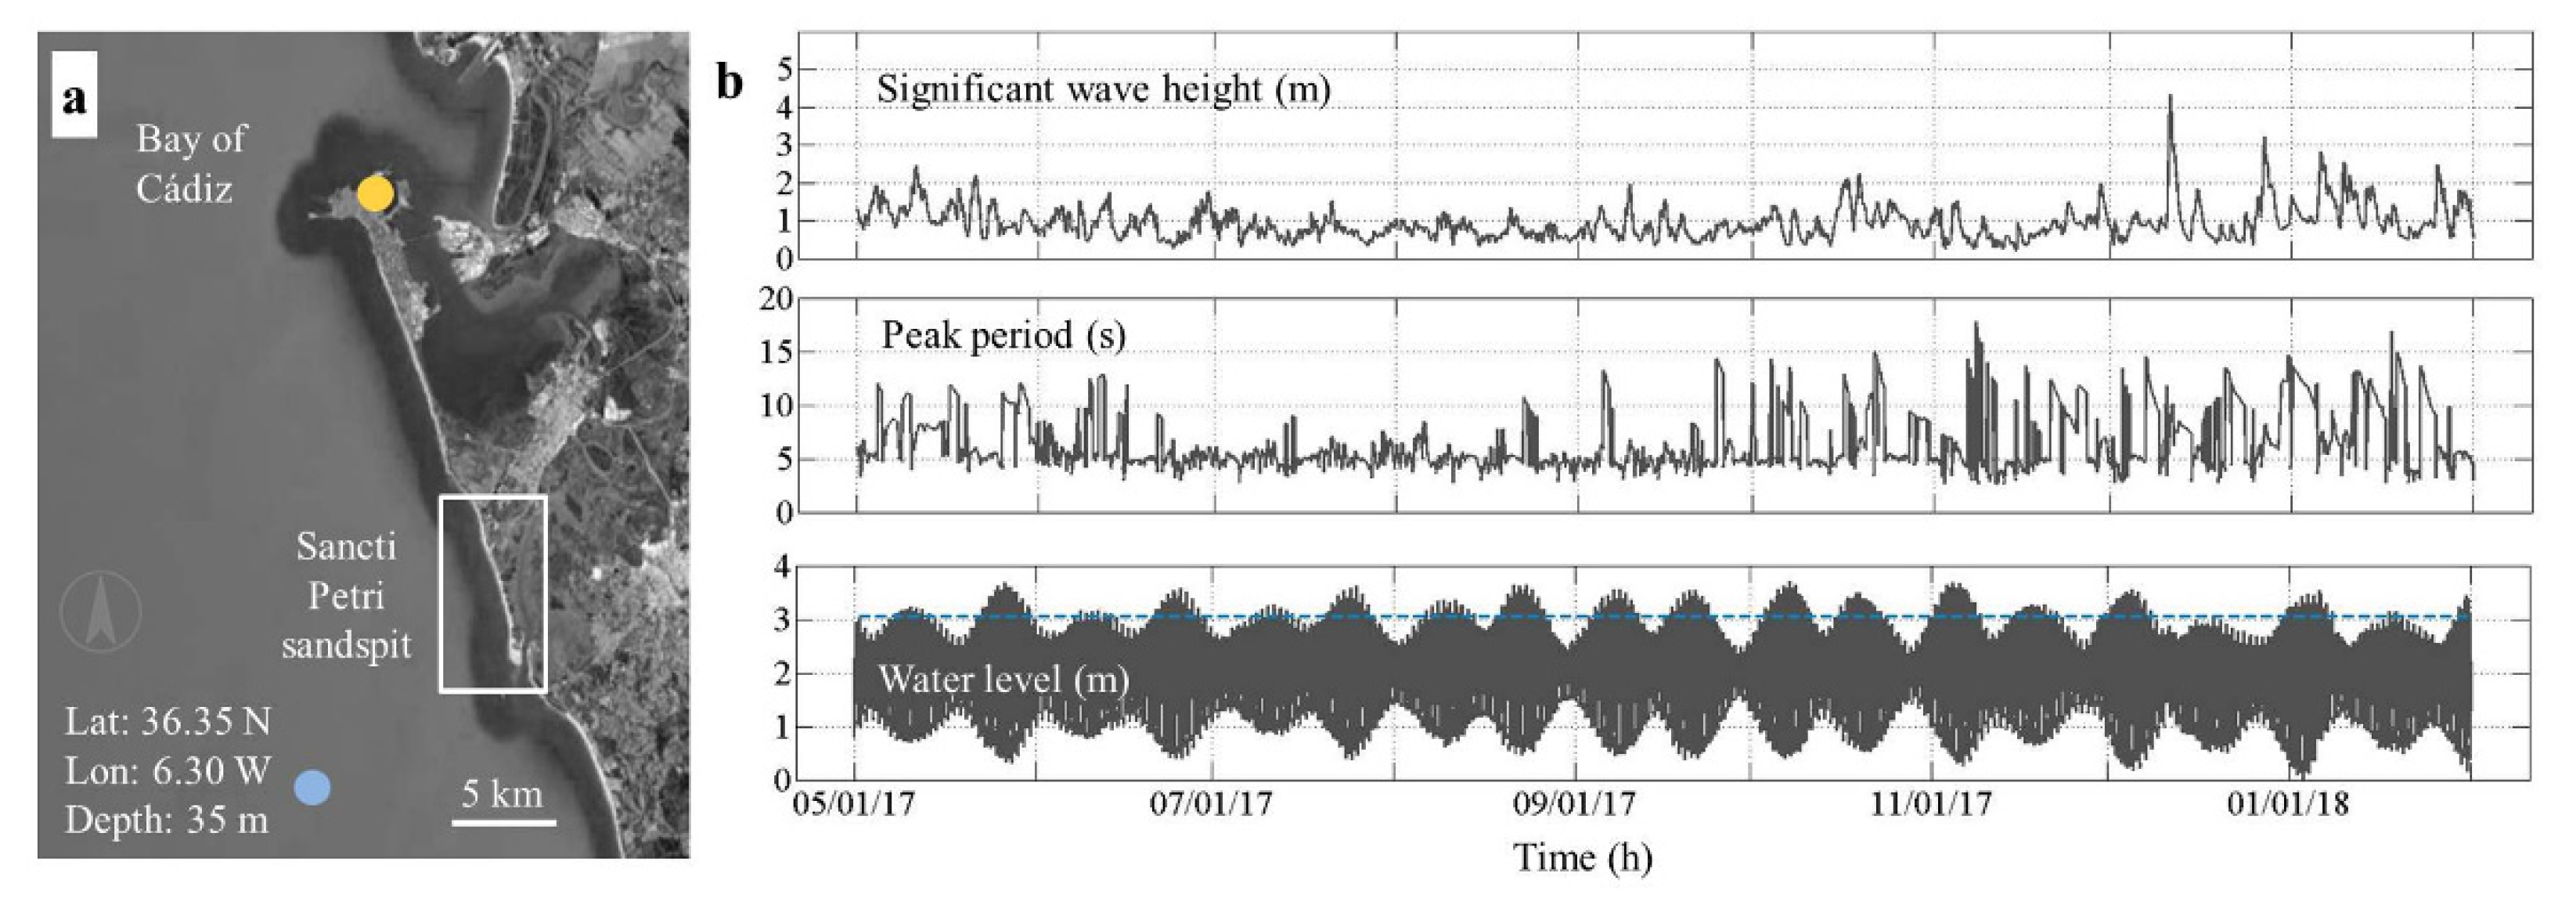
The period during which the rhythmic features captured in the DEMs may have formed (between May 2017 and October 2017) presented a constant wave regime, with average significant wave heights of around 1 m, and average peak periods of 5.5 s. The periods oscillated between 5 and 8 s and showed sudden increases associated with occasional swells at the end of August and the beginning of September (wave peak periods of 11 and 13 s, respectively) (Figure 6). From then on, the wave energy increased and presented longer wave periods that could have caused the progressive deformation of the rhythmic features. Apart from that, the spring and equinoctial spring tides (September 2017) were able to overtop the elevation of the berm (3.05 m) measured in October 2017 (see Figure 6b).
In the case of the features observed in the Google Earth imagery, given the elevation at which they were found, it was decided to analyze the oceanographic conditions from the previous spring tide, when the swash could reach this area. In this respect, very similar wave conditions were observed for the 2012 and 2014 images, with wave heights around 0.4 m and periods around 5.5 seconds. In the case of 2015, higher data were recorded, with wave heights of 0.5 m and somewhat longer periods (9 s).
4. Discussion
Based on the characteristics previously described, the possible anthropic origin of the rhythmic features due to the circulation of vehicles was ruled out, although the fact that the investigated features did not extend seaward beyond the berm could initially lead to consider the possibility of them being formed by washboarding/corrugation by vehicle traffic. This process has been widely documented in dry and unpaved sandy or gravel roads [31,32,33,48], where there is a repeated traffic of vehicles circulating at speeds higher than 12.8 km/h [49], and it can even be observed in concrete roads [50]. In these conditions, the rolling wheels may cause the development of transverse ripples, similar in shape as the rhythmic features shown here. [32] found out that the essential component of the dynamics, which gives rise to pattern emergence, pattern migration, pattern growth, and stability in unpaved roads, is the effect of iteration over time. However, it is important to note that driving on beaches in Spain is strictly prohibited, and the only vehicles that access this beach are cleaning tractors during the summer months. Beach tractors in Camposoto travel at very low speeds and during very short periods of time, so the possibility of the features being formed by washboarding/corrugation is really unlikely (due to the low number of vehicles and their reduced speed). Moreover, washboarding happens on roads where the traffic is constrained over a narrower cross section, and here, we could observe rhythmic features with widths in excess of 30 m, whose crests were linear and coherent over the entire span making vehicle formation extremely unlikely. In fact, it looks clear that the tractor tracks cross-cut the features, making these vehicle tracks a post-formative disturbance to the features (Figure 2).
At first glance, the appearance of such evenly spaced and elongated features presented remarkable similarity with sheetwash lineations [10,11,12]. However, these are typically formed over extensive washover terraces, not in the area located behind the berm; furthermore, in this case, no extreme or modal storm could have favored their formation, although the possibility of these being built by lower energy oceanographic conditions in the backshore was considered. On the other hand, in terms of geometry, the thin and long-crested shape of the features that were identified in this work is also similar to the typical geometry of transverse finger bars. These were first defined by [51], and they usually present cross-shore spans 2–5 times larger than their wavelengths [49], which matches the geometry of the investigated features in some cases. Transverse finger bars were classified by [52] according to their characteristics (bar wavelengths and cross-shore spans) and to the type of wave energy environment in which they form (low, medium, or high) [28]. In this regard, small-scale low-energy finger bars are the type of morphology that physically resembles the most to the investigated rhythmic features. According to this category, small-scale finger bars form under low energy and accretionary conditions, which are also in agreement with the hydrodynamic conditions that dominated in Camposoto Beach. Moreover, the amplitude of the features, which was around 10 cm in the most prominent patches, agrees with the amplitude of the intertidal finger bars found by [52] in the Bay of Santander (North Spain). In addition, according to [24], wave fields of relatively constant wave heights during at least half a day are necessary to create them. These were also the conditions that prevailed during the summer in the study site. However, small-scale low-energy finger bars have been mainly described in the surf zone where, in addition, the slopes of the beach are lower (> 0.005 [24]) than those found in the Camposoto beach-face.
It must be noted that the dimensions of the rhythmic features in the study area differ from the published observations for small-scale finger bars, which are characterized by wavelengths spanning from 15 to 80 m and cross-shore spans ranging from 40 to 250 m [53,54,55]. In this case, the investigated features presented cross-shore spans from 3 to 18 times larger than the spacing observed between crests (depending on the area), aspect ratio not contemplated in the previous classification [52], being closer to the spacing observed for beach or lake cusps [9,56]. Furthermore, most of the small-scale low-energy finger bars in the literature are obliquely oriented, and no significant migration rates have been found due to the lack of data [24], so this aspect could not be contrasted here.
On the other hand, some of these features (finger bars) are formed by littoral currents [53] and located in the subtidal zone. As this same author as well as [57] stated, finger bars correspond to what they define as rhythmic and submerged topography generated by stationary currents. However, the Camposoto Beach features were found in the emerged beach; therefore, they would be considered as cusps according to these authors.
Predicted incident wave periods leading to the observed spacing of 2.2 m (5 and 7 s for the zero subharmonic and synchronous edge-wave modes, respectively, see Table 3) were common in the area during the mid and late months of the summer and early autumn, as stated before, and the average peak period during the summer season was 5.5 s. Moreover, after checking the hydrodynamic conditions prevailing in September 2012 and October 2014 (when the rhythmic features were also observed in the Google Earth imagery at the study site), it was found that the wave period fluctuated around 5 s too. As it can be seen, the observed spacing along the rhythmic features adjusts reasonably well with the theoretical incident wave periods according to the edge-wave theory for the modes zero subharmonic and synchronous edge waves, so one of these could have been involved somehow in the development of the rhythmic features being investigated here. Wind action could perhaps have excited the motion of zero subharmonic or synchronous edge-wave modes over ponded water in the trough located behind the incipient berm (see the cross-shore profile in Figure 7). Nonetheless, without in situ hydrodynamic data, there is no way to either discard or corroborate this hypothesis or to fully understand the formation mechanism and origin of these features. Apart from that, the fact that the edge-wave theory seems to apply reasonably well is not indicative of the type of rhythmic feature either.
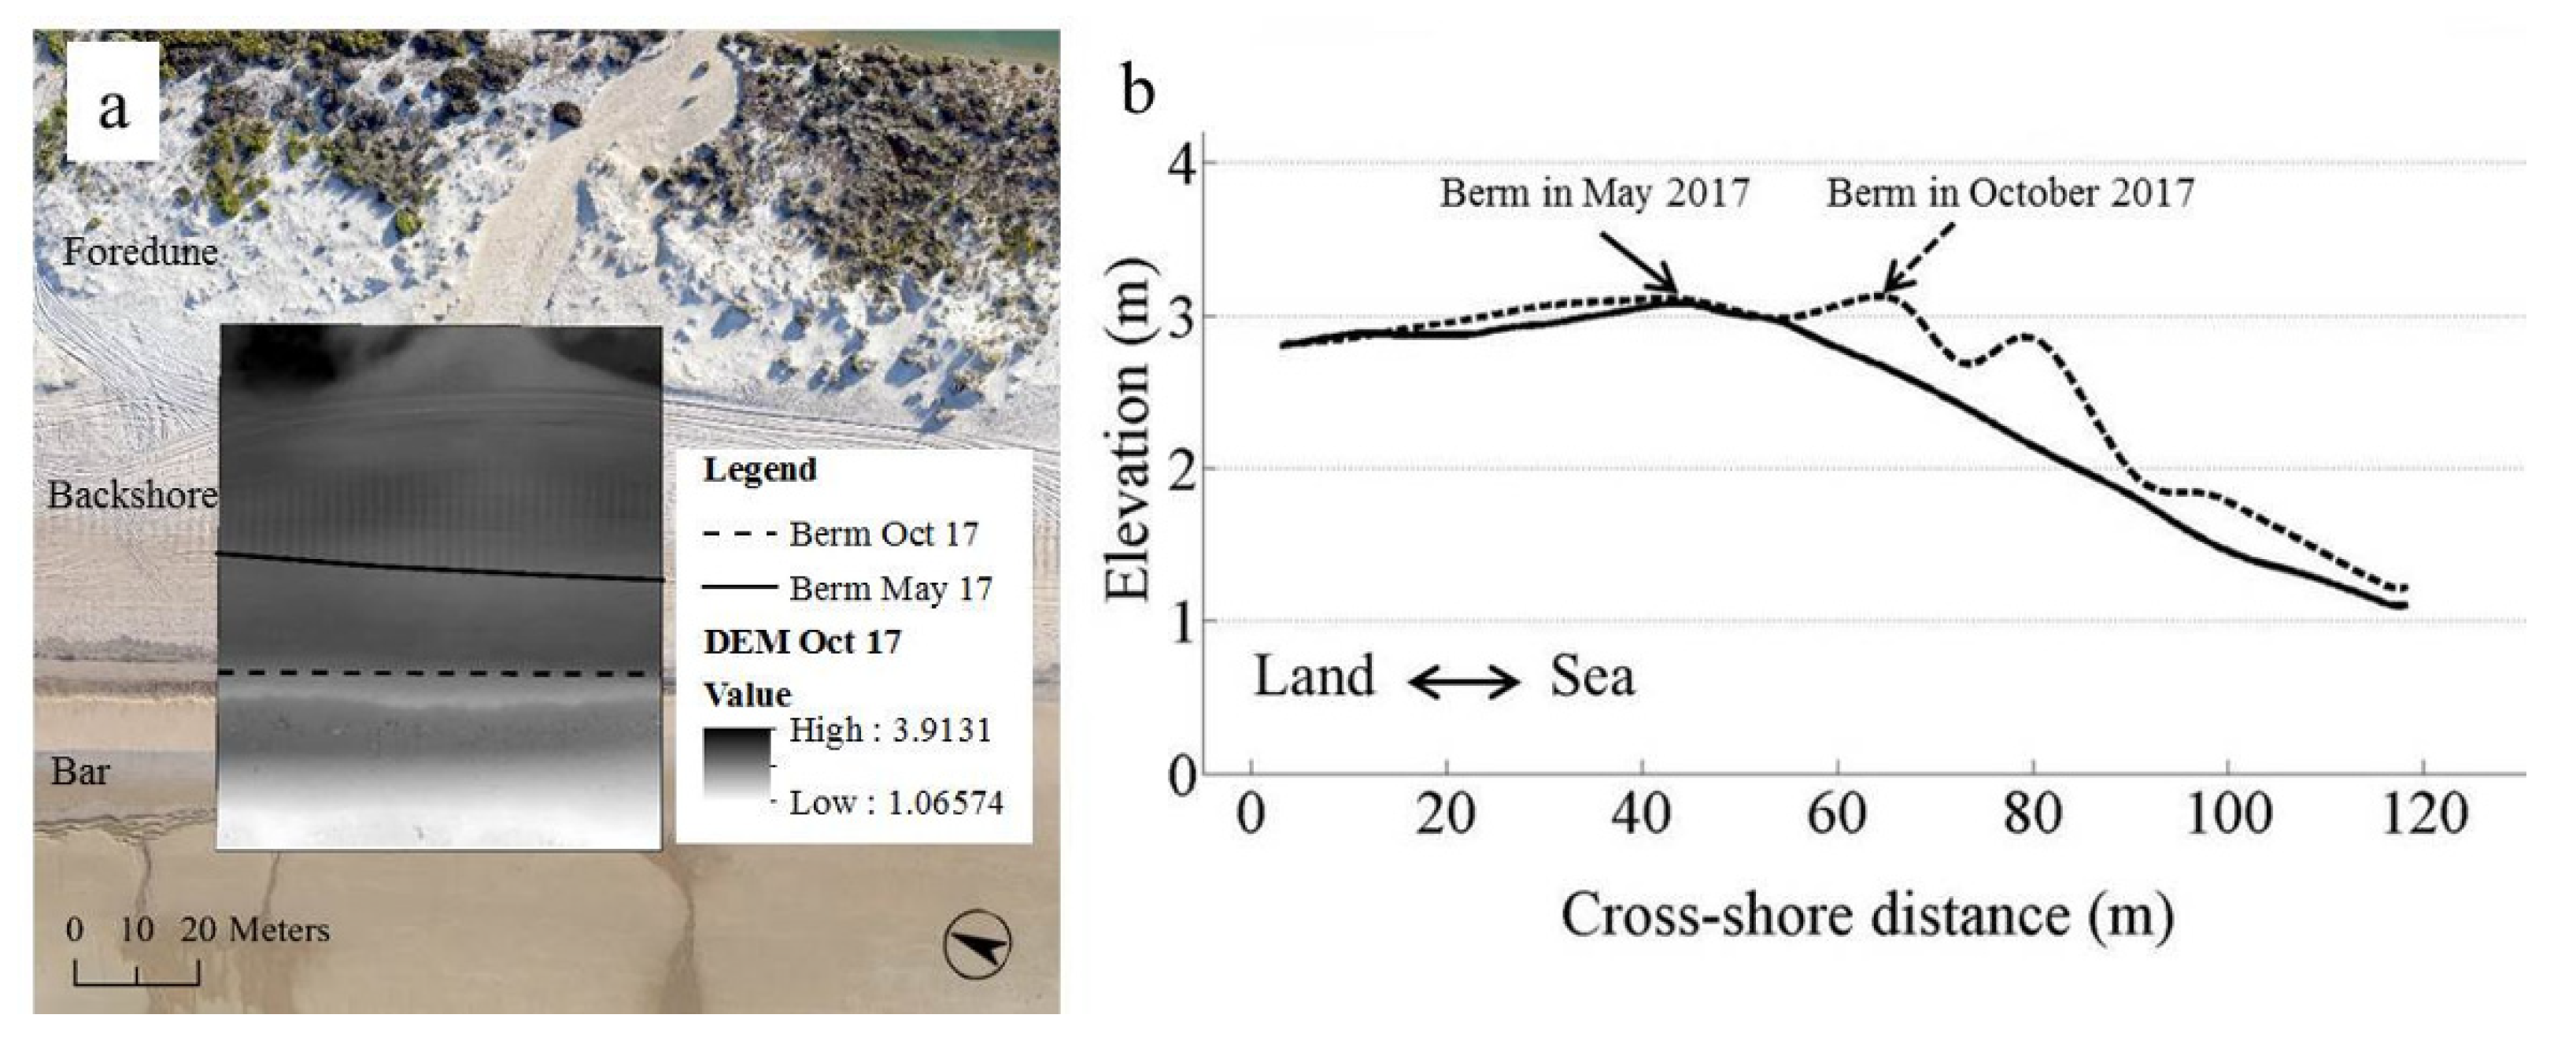
As for the conditions leading to the formation of the features, during summer 2017, the accretionary conditions and the onshore sediment transport led to berm development process in the upper foreshore [42] (see the berm evolution and the formation of a bar in Figure 7a,b), allowing sufficient room for the ulterior formation of both the rhythmic morphologies and a steep beach-face. Their formation was probably linked with spring or equinoctial spring tides and/or longer period waves, processes that may have favored the total water level to reach the backshore. Moreover, their varying cross-shore spans were probably influenced by variations in the swash excursion. As a consequence of this, swash motions could have existed in the backshore during those hydrodynamic conditions. Spring or equinoctial spring tides could have also contributed to the formation of these features in September 2012, October 2014, and November 2015, when they were spotted in the backshore and with similar spacing in the Google Earth satellite imagery (Figure 2b, Table 2).
The results from the granulometric analyses performed reveal both a net onshore transport of sediment typical of summer conditions [56] as well as subtle seaward transport of sediment along both crests and runnels, since the coarser and poorly sorted sediment remained at the landward side, and slightly finer and better sorted sediment was deposited in the distal seaward ends. Moreover, the fact that the mean grain sizes and the D50 were coarser in the crests with respect to the runnels possibly indicates that the flow circulation was slightly more accentuated in the runnels. Interestingly, these results differ from the sediment grain sizes obtained along the previously mentioned intertidal finger bars at El Puntal, in the Bay of Santander [52], which showed no variations in grain size between the crests and troughs. Besides, [28] stated that despite the lack of observations in the literature, the horizontal flow pattern over small-scale and low-energy finger bars (explained from applying the DASC methodology) consists of an onshore current flowing along the bars (crests) and an offshore current flowing along the troughs (runnels). This flow pattern was observed by [51] as well as by [53] over shore-normal and oblique finger bar configurations, respectively. The circulation pattern deduced from the granulometric analyses in the study area (offshore direction along crests and runnels) disagrees with that typical of finger bars. On the other hand, it must be noted that for this reason, the initial consideration of the investigated rhythmic features as being sheetwash lineations was discarded; otherwise, the sediment transport would have followed an onshore direction. It is worth mentioning that the observed subtle seaward sediment transport and coarser material on the crests with respect to the runnels could also imply that these rhythmic features relate to a type of backwash circulation. As a matter of fact, backwash could have been favored by saturated conditions in the backshore enhanced by the presence of the aforementioned impermeable peat layer located underneath. In fact, the position of the water table under the beach surface is an important factor in beach erosion and deposition [58]. When the water table is high, the swash is unable to percolate into the sand, thus causing certain volume of water to produce effective erosion by backwash [46].
The role of swash and backwash in rhythmic features such as beach cusps is not new. Swash cusps were defined as morphologies formed by swash and backwash acting directly on the beach-face and berm [9], although they are more frequent on steep reflective beaches where the incident waves produce substantial surge of swash up the beach-face [6]. In Camposoto Beach, the features appeared at the end of summer, where the beach showed higher slopes, except in the case of November 2015, where these features appeared blurred. The typical description found in the literature of flow circulation patterns during cusp formation involves a swash that runs up the beach-face to the cusp horns (crests here), where it diverges and flows as backwash that converges into the cusp bays (runnels here), causing their erosion [9,13,15]. As a result, coarser grain sizes are found at the horns (crests), whereas the finer ones are found along the bays (runnels) [13,15,16]. This somehow resembles the granulometric pattern found in the investigated features, although across an elongated bar-like feature formed over a flat surface (backshore), rather than a cuspate feature built in an area with a high beach gradient (berm).
To sum up, so far it seems that the identified rhythmic features maintain remarkable geometrical resemblance with small-scale low-energy finger bars. Moreover, these are typically formed under low-energy and accretionary oceanographic conditions, which is in agreement with the summer forcing conditions that dominated in the study area. Nevertheless, their aspect ratio has never been observed in previous scientific literature. Furthermore, the characteristic flow circulation patterns typically found for small-scale low-energy finger bars are opposite to those observed here; these relate more to a type of elongated swash (and backwash) features, sharing sediment characteristics commonly attributed to beach cusps rather than finger bars, or at least those that have been described so far (see Table 4). However, the features investigated here could constitute a new form of supratidal small-scale and low-energy finger bar, formed due to highly organized swash processes acting on a flat and uniform area at the backshore during spring tides and longer wave periods, as well as backwash processes enhanced by saturated conditions.
Lastly, a clear disadvantage for the study of these rhythmic features was that the UAS-based surveys had to be suspended during the summer for complying with the national UAS regulations. These restrict UAS flights over groups of people for security, so the monitoring program was interrupted during the summer touristic season. For this reason, the shore-normal rhythmic features at the backshore were not reported until the monitoring program was resumed in October 2017. However, if it were not for the high-resolution UAS-derived mosaics and DEMs obtained, these features would have probably gone overlooked, and their monitoring would not have been possible, as their amplitude was very small, and they were actually not observable from the ground during the fieldwork performed in October 2017.
In fact, the study and monitoring of cusps and other types of rhythmic bars or features has traditionally relied on remote sensing techniques, mainly video monitoring systems [22,59,60] and/or orthophotos [61]. Investigations based on the use of UAS for this purpose are still scarce in the literature, although they could be frequent in the upcoming future.
5. Conclusions
The unusual patches of rhythmic features found at the backshore in Camposoto Beach were analyzed using high-resolution and UAS-derived DEMs, hydrodynamic conditions, and sediment samples. The results obtained revealed that the investigated barred-like features were reminiscent of swash and/or surf zone rhythmic features such as small-scale low-energy finger bars (resembling in geometry and amplitude), although with an unreported aspect ratio, while other characteristics relate more to swash and backwash cuspate systems (wavelength, sediment grain size distribution, and flow circulation pattern). Moreover, the mechanism involved in their formation could be swash and backwash processes linked to the combination of spring and/or equinoctial spring tides, longer period waves, as well as saturated conditions in the upper foreshore favored by the presence of an impermeable peat layer, which greatly influences the position of the water table relative to the beach surface. However, in order to shed some light regarding the nature and formation mechanism of these features, both in situ hydrodynamic and morphodynamic measurements during their formation would be needed.
Their spacing could be possibly associated to the presence of edge waves (either the zero subharmonic or the synchronous mode). In any case, it would be necessary to carry out new tests with the rest of theories such as self-organization, for which in situ experiments aimed at measuring the swash excursion would be essential. Nevertheless, these findings could serve to demonstrate that patches of shore-normal-oriented rhythmic features can appear under different modalities and beach locations than the ones observed up to date in coastal areas.
Lastly, UAS are tools that offer a unique perspective over the coastal zones, helping to look at coastal phenomena in a new way. The reason behind the unusual nature of the investigated features may be attributed to the performance and the technical capabilities of the different methods traditionally employed for the acquisition of coastal topography, which in turn, could have been biasing and/or limiting our view, understanding, and ultimately, our current knowledge of coastal features occurring at smaller spatial and temporal scales.
Author Contributions
Conceptualization, L.T. and J.B.; methodology, L.T.; formal analysis, L.T.; investigation, L.T.; data curation, L.T.; writing—original draft preparation, L.T.; writing—review and editing, J.B. and L.D.R.; visualization, L.T.; supervision, J.B. and L.D.R.; funding acquisition, L.D.R. All authors have read and agreed to the published version of the manuscript.
Funding
This research was funded by the EMAS grant (Earth and Marine Sciences joint doctorate program between University of Cádiz and the University of Ferrara) and the research plan of the University of Cádiz. It is also a contribution to the project ADACOSTA (CGL2014-53153-R), funded by the Spanish MINECO and ERDF, CRUNCH (FEDER-UCA18-107062), funded by Junta de Andalucia and ERDF, the research groups RNM-328 and RNM-160 of the PAI, and the project RNM-6547 funded by the Regional Government of Andalusia.
Informed Consent Statement
Not applicable.
Data Availability Statement
The data presented in this study are available on request from the corresponding author.
Acknowledgments
The authors acknowledge Puertos del Estado, the UAS Service of the University of Cádiz, and the great help of Pedro Zarandona.
Conflicts of Interest
The authors declare no conflict of interest.
References
- Wright, L.D.; Short, A.D. Morphodynamic variability of surf zones and beaches: A synthesis. Mar. Geol. 1984, 56, 93–118. [Google Scholar] [CrossRef]
- Van Enckevort, I.M.J.; Ruessink, B.G.; Coco, G.; Suzuki, K.; Turner, I.L.; Plant, N.G.; Holman, R.A. Observations of nearshore crescentic bars. J. Geophys. Res. 2004, 109, C06028. [Google Scholar] [CrossRef]
- Ribas, F.; Falqués, A.; Garnier, D. Chapter 13: Nearshore sand bars. In Atlas of Bedforms in the Western Mediterranean; Guillén, J., Acosta, J., Latino-Chiocci, F., Palanques, A., Eds.; Springer: Cham, Switzerland, 2017; pp. 73–79. [Google Scholar] [CrossRef] [Green Version]
- Konicki, K.M.; Holman, R.A. The statistics and kinematics of transverse sand bars on an open coast. Mar. Geol. 2000, 169, 69–101. [Google Scholar] [CrossRef]
- Wijnberg, K.M.; Kroon, A. Barred beaches. Geomorphology 2002, 48, 103–120. [Google Scholar] [CrossRef]
- Guza, R.T.; Inman, D.L. Edge waves and beach cusps. J. Geophys. Res. 1975, 80, 2997–3012. [Google Scholar] [CrossRef]
- Sallenger, A.H. Beach-cusp formation. Mar. Geol. 1979, 29, 23–37. [Google Scholar] [CrossRef]
- Dolan, R.; Ferm, J.C. Concentric landforms along the Atlantic coast of the United States. Science 1968, 159, 627–629. [Google Scholar] [CrossRef]
- Inman, D.L.; Guza, R.T. The origin of swash cusps on beaches. Mar. Geol. 1982, 49, 133–148. [Google Scholar] [CrossRef]
- Morton, R.A.; Sallenger, A.H. Morphological impacts of extreme storms on sandy beaches and barriers. J. Coast. Res. 2003, 19, 560–573. [Google Scholar]
- Keen, T.R.; Rowley, C.; Dykes, J. Oceanographic factors and erosion of the outer banks during hurricane Isabel. In Proceedings of the Hurricane Isabel in Perspective Conference, Linthicum Heights, MD, USA, 15–17 November 2004; Sellner, K.G., Ed.; Chesapeake Research Consortium: Edgewater, MD, USA, 2005; pp. 65–72. [Google Scholar]
- Phantuwongraj, S.; Choowong, M.; Nanayama, F.; Hisada, K.I.; Charusiri, P.; Chutakositkanon, V.; Pailoplee, S.; Chabangbon, A. Coastal geomorphic conditions and styles of storm surge washover deposits from Southern Thailand. Geomorphology 2013, 192, 43–58. [Google Scholar] [CrossRef]
- Werner, B.T.; Fink, T.M. Beach cusps as self-organized patterns. Science 1993, 260, 968–971. [Google Scholar] [CrossRef] [PubMed]
- Coco, G.; O’Hare, T.J.; Huntley, D.A. Beach cusps: A comparison of data and theories for their formation. J. Coast. Res. 1999, 15, 741–749. [Google Scholar]
- Coco, G.; Huntley, D.A.; O’Hare, T.J. Investigation of a self-organization model for beach cusp formation and development. J. Geophys. Res. 2000, 105, 21991–22002. [Google Scholar] [CrossRef]
- Coco, G.; Burnet, T.K.; Werner, B.T.; Elgar, S. Test of self-organization in beach cusp formation. J. Geophys. Res. 2003, 108. [Google Scholar] [CrossRef]
- Holland, K.T. Beach cusp formation and spacings at Duck, USA. Cont. Shelf Res. 1998, 18, 1081–1098. [Google Scholar] [CrossRef]
- Masselink, G.; Russel, P.; Coco, G.; Huntley, D. Test of edge wave forcing during formation of rhythmic beach morphology. J. Geophys. Res. 2004, 109. [Google Scholar] [CrossRef]
- Benavente, J.; Harris, D.L.; Austin, T.P.; Vila-Concejo, A. Medium term behavior and evolution of a beach cusps system in a low energy beach, Port Stephens, NSW, Australia. J. Coast. Res. 2011, SI64, 170–174. [Google Scholar]
- Huntley, D.A.; Bowen, A.J. Field observations of edge waves. Nature 1978, 243, 160–162. [Google Scholar] [CrossRef]
- Masselink, G. Alongshore variation in beach cusp morphology in a coastal embayment. Earth Surf. Proc. Land 1999, 24, 335–347. [Google Scholar] [CrossRef]
- Almar, R.; Coco, G.; Bryan, K.R.; Huntley, D.A.; Short, A.D.; Senechal, N. Video observations of beach cusp morphodynamics. Mar. Geol. 2008, 254, 216–223. [Google Scholar] [CrossRef]
- Dodd, N.; Stoker, A.; Calvete, D.; Sriariyawat, A. On beach cusp formation. J. Fluid Mech. 2008, 597, 145–169. [Google Scholar] [CrossRef] [Green Version]
- Ribas, F.; Kroon, A. Characteristics and dynamics of surfzone transverse finger bars. J. Geophys. Res. Earth Surf. 2007, 112. [Google Scholar] [CrossRef] [Green Version]
- Caballeria, M.; Coco, G.; Falqués, A.; Huntley, D.A. Self-organization mechanisms for the formation of nearshore crescentic and transverse sand bars. J. Fluid Mech. 2002, 4465, 379–410. [Google Scholar] [CrossRef] [Green Version]
- Ribas, F.; Doeschate, A.T.; De Swart, H.E.; Ruessink, B.G.; Calvete, D. Observations and modeling of surf zone transverse finger bars at the Gold Coast, Australia. Ocean Dyn. 2014, 64, 1193–1207. [Google Scholar] [CrossRef] [Green Version]
- Ribas, F.; De Swart, H.E.; Calvete, D.; Falqués, A. Modeling and analyzing observed transverse sand bars in the surf zone. J. Geophys. Res. 2012, 117, F02013. [Google Scholar] [CrossRef] [Green Version]
- Ribas, F.; Falqués, A.; De Swart, H.E.; Dodd, N.; Garnier, R.; Calvete, D. Understanding coastal morphodynamic patterns from depth-averaged sediment concentration. Rev. Geophys. 2015, 53, 362–410. [Google Scholar] [CrossRef] [Green Version]
- Calvete, D.; Falqués, A.; De Swart, H.; Dodd, N.; Ribas, F.; Garnier, R. The role of depth-averaged concentration in coastal morphodynamics. Coast. Dyn. 2009, 91. [Google Scholar] [CrossRef] [Green Version]
- Kurtze, D.A.; Hong, D.C.; Both, J.A. The genesis of washboard roads. Int. J. Mod. Phys. B 2001, 15, 3344–3346. [Google Scholar] [CrossRef]
- Both, J.A.; Hong, D.C.; Kurtze, D.A. Corrugation of roads. Phys. A 2001, 301, 545–559. [Google Scholar] [CrossRef] [Green Version]
- Mays, D.C.; Faybishenko, B.A. Washboards in unpaved highways as a complex dynamic system. Complexity 2000, 5, 51–60. [Google Scholar] [CrossRef]
- Bitbol, A.F.; Taberlet, N.; Morris, S.W.; McElwaine, J.N. Scaling and dynamics of washboard road. Phys. Rev. E 2014, 79, 061308. [Google Scholar] [CrossRef] [PubMed] [Green Version]
- Fernández-Montblanc, T.; Del Río, L.; Izquierdo, A.; Gracia, F.J.; Bethencourt, M.; Benavente, J. Shipwrecks and man-made coastal structures as indicators of historical shoreline position. An interdisciplinary study in the Sancti Petri sand spit (Bay of Cádiz, SW Spain). Mar. Geol. 2017, 395, 152–167. [Google Scholar] [CrossRef]
- Del Río, L.; Plomaritis, T.A.; Benavente, J.; Valladares, M.; Ribera, P. Establishing storm thresholds for the Spanish Gulf of Cádiz coast. Geomorphology 2012, 143, 13–23. [Google Scholar] [CrossRef]
- Benavente, J.; Del Río, L.; Plomaritis, T.A.; Menapace, W. Impact of coastal storms in a sandy barrier (Sancti Petri, Spain). J. Coast. Res. 2013, SI65, 666–671. [Google Scholar] [CrossRef]
- Plomaritis, T.A.; Anfuso, G.; Benavente, J.; Del Río, L. Storm impact and recovery patterns in natural and urbanised beaches in Cádiz (SW Spain). In Proceedings of the EGU General Assembly, Vienna, Austria, 19–24 April 2009; EGU2009-1409. Geophysical Research Abstracts. Volume 11. [Google Scholar]
- Bellido, C.; Anfuso, G.; Plomaritis, T.A.; Rangel-Buitrago, N. Morphodynamic behavior, disturbance depth and longshore transport at Camposoto Beach (Cadiz, SW Spain). J. Coast. Res. 2011, SI64, 35–39. [Google Scholar]
- Poizot, E.; Anfuso, G.; Méar, Y.; Bellido, C. Confirmation of Beach Accretion by grain-size trend analysis: Camposoto beach, Cádiz, SW Spain. Geo-Mar. Lett. 2013, 33, 263–272. [Google Scholar] [CrossRef]
- Benavente, J.; Martínez-del-Pozo, J.A.; Gracia, F.J.; Reyes, J.L.; Del Río, L. Procesos de desbordamiento en la flecha litoral de Sancti-Petri (Bahía de Cádiz): Riesgos asociados. In Estudios Recientes en Geomorfología; Serrano, E., García de Celis, A., Eds.; Universidad de Valladolid: Valladolid, Spain, 2002; pp. 23–32. [Google Scholar]
- Fernández-Montblanc, T.; Izquierdo, A.; Quinn, R.; Bethencourt, M. Waves and wrecks: A computational fluid dynamic study in an underwater archaeological site. Ocean. Eng. 2018, 163, 232–250. [Google Scholar] [CrossRef]
- Talavera, L.; Del Río, L.; Benavente, J.; Barbero, L.; López-Ramírez, J.A. UAS & SfM-based approach to monitor overwash dynamics and beach evolution in a sandy spit. J. Coast. Res. 2018, 85, 221–225. [Google Scholar] [CrossRef]
- Talavera, L.; Del Río, L.; Benavente, J.; Barbero, L.; López-Ramírez, J.A. UAS as tools for rapid detection of storm-induced morphodynamic changes at Camposoto beach; SW Spain. Int. J. Remote Sens. 2018, 39, 5550–5567. [Google Scholar] [CrossRef]
- Puertos del Estado (2017–2018). National Ports Authority; Ministry of Development. Available online: www.puertos.es (accessed on 31 January 2018).
- Blott, S.J.; Kenneth, P. Gradistat: A grain size distribution and statistics package for the analysis of unconsolidated sediments. Earth Surf. Proc. Land 2001, 26, 1237–1248. [Google Scholar] [CrossRef]
- Duncan, J.R., Jr. The effects of water table and tide cycle on swash-backwash sediment distribution and beach profile development. Mar. Geol. 1964, 2, 186–197. [Google Scholar] [CrossRef]
- Talavera, L.; Del Río, L.; Benavente, J. UAS-based high-resolution record of the response of a seminatural sandy spit to a severe storm. J. Coast. Res. 2020, 95, 679–683. [Google Scholar] [CrossRef]
- Taberlet, N.; Morris, S.W.; McElwaine, J.N. Washboard road: The dynamics of granular ripples formed by rolling wheels. Phys. Rev. Lett. 2007, 99. [Google Scholar] [CrossRef] [PubMed] [Green Version]
- Rehmeyer, J. Road bumps: Why dirt roads develop a washboard surface. Sci. News 2007, 172, 102. [Google Scholar] [CrossRef]
- Mather, K.B. Why do roads corrugate? Sci. Am. 1963, 208, 128–137. [Google Scholar] [CrossRef]
- Niederoda, A.W.; Tanner, W.F. Preliminary study on transverse bars. Mar. Geol. 1970, 9, 41–62. [Google Scholar] [CrossRef]
- Pellón, E.; Garnier, R.; Medina, R. Intertidal finger bars at El Puntal; Bay of Santander, Spain: Observation and forcing analysis. Earth Surf. Dyn. 2014, 2, 349–361. [Google Scholar] [CrossRef] [Green Version]
- Falqués, A. Formación de topografía rítmica en el Delta del Ebro. Rev. Geofis. 1989, 45, 143–156. [Google Scholar]
- Bruner, K.R.; Smosna, R.A. The movement and stabilization of beach sand on transverse bars, Assateague Island, Virginia. J. Coast. Res. 1989, 5, 593–601. [Google Scholar]
- Eliot, M.J.; Travers, A.; Eliot, I. Morphology of a low-energy beach; Como Beach, Western Australia. J. Coast. Res. 2006, 22, 63–77. [Google Scholar] [CrossRef]
- Komar, P.D. Beach Processes and Sedimentation, 2nd ed.; Prentice Hall: Englewood Cliffs, NJ, USA, 1998. [Google Scholar]
- Sonu, C.J. Three-dimensional beach changes. J. Geol. 1973, 81, 42–64. [Google Scholar] [CrossRef]
- Grant, U.S. Influence of the water table on beach aggradation and degradation. J. Mar. Res. 1948, 7, 655–660. [Google Scholar]
- Garnier, R.; Ortega-Sánchez, M.; Losada, M.A.; Falqués, A.; Dodd, N. Beach cusps and inner surf zone processes: Growth or destruction? A case study of Trafalgar Beach (Cádiz, Spain). Sci. Mar. 2010, 74, 539–553. [Google Scholar] [CrossRef] [Green Version]
- Montes, J.; Simarro, G.; Benavente, J.; Plomaritis, T.; Del Río, L. Morphodynamics Assessment by Means of Mesoforms and Video-Monitoring in a Dissipative Beach. Geosciences 2018, 8, 448. [Google Scholar] [CrossRef] [Green Version]
- Mujel-Colilles, A.; Grifoll, M.; Falqués, A. Rhythmic morphology in a microtidal low-energy beach. Geomorphology 2019, 334, 151–164. [Google Scholar] [CrossRef]
Figure 1.
Location of the study site and a photograph showing Punta de Poniente headland as well as an emerged part of the rocky shoal during low tide.
Figure 1.
Location of the study site and a photograph showing Punta de Poniente headland as well as an emerged part of the rocky shoal during low tide.

Figure 2.
(a) Unmanned aerial systems (UAS)-derived mosaics showing the general geometry of the rhythmic features in the beach sectors were they were more prominent, (b) Google Earth imagery (2012, 2014, and 2015) showing similar rhythmic features.
Figure 2.
(a) Unmanned aerial systems (UAS)-derived mosaics showing the general geometry of the rhythmic features in the beach sectors were they were more prominent, (b) Google Earth imagery (2012, 2014, and 2015) showing similar rhythmic features.

Figure 3.
(a) Locations of the alongshore profiles P1 and P2; (b) temporal evolution of the rhythmic features from October 2017 to January 2018 in both profiles. Note the mean high water spring level (MHWS) of 3.185 m in the dashed red line.
Figure 3.
(a) Locations of the alongshore profiles P1 and P2; (b) temporal evolution of the rhythmic features from October 2017 to January 2018 in both profiles. Note the mean high water spring level (MHWS) of 3.185 m in the dashed red line.

Figure 4.
Impermeable peat layer that outcropped along the foreshore after March 2018 storm.

Figure 5.
Left: sketch showing the location of the sediment samples as well as the position of the crests and runnels (background image: October 2017 DEM). Right: statistical parameters obtained from the grain-size analyses in GRADISTAT.
Figure 5.
Left: sketch showing the location of the sediment samples as well as the position of the crests and runnels (background image: October 2017 DEM). Right: statistical parameters obtained from the grain-size analyses in GRADISTAT.

Figure 6.
(a) Location of the tidal station (yellow dot) and the SIMAR point 6,012,036 (blue dot); (b) oceanographic conditions from May 2017 to January 2018 (the dashed blue line in the water level time series represents the berm elevation measured in October 2017).
Figure 6.
(a) Location of the tidal station (yellow dot) and the SIMAR point 6,012,036 (blue dot); (b) oceanographic conditions from May 2017 to January 2018 (the dashed blue line in the water level time series represents the berm elevation measured in October 2017).

Figure 7.
(a) DEM from October 2017 in the area close to P1, displaying the berm from May 2017 (solid line) and October 2017 (dashed line); (b) cross-shore profiles of the study site (close to P1) displaying the berms in May 2017 (solid line) and October 2017 (dashed line).
Figure 7.
(a) DEM from October 2017 in the area close to P1, displaying the berm from May 2017 (solid line) and October 2017 (dashed line); (b) cross-shore profiles of the study site (close to P1) displaying the berms in May 2017 (solid line) and October 2017 (dashed line).


Table 1.
Characteristics of the rhythmic features in the UAS-derived DEMs and mosaics (E = elevation, CL = cross-shore length, MAL = mean along-shore length, MS = mean slope).
Table 1.
Characteristics of the rhythmic features in the UAS-derived DEMs and mosaics (E = elevation, CL = cross-shore length, MAL = mean along-shore length, MS = mean slope).
| Dates | E (m) | CL (m) | MAL (m) | MS (%) | ||||
|---|---|---|---|---|---|---|---|---|
| Mean | Min | Max | Mean | Min | Max | |||
| 06 October 2017 | 3.16 | 2.71 | 3.77 | 11.91 | 3.03 | 34 | 404 | 3.25 |
| 06 November 2017 | 3.26 | 2.90 | 3.77 | 9.50 | 3.6 | 17.12 | 82.5 | 3.91 |
| 13 December 2017 | 3.10 | 2.87 | 3.38 | 7.15 | 3.64 | 10.8 | 38 | 8.53 |
| 19 January 2018 | 3.27 | 2.86 | 3.82 | 8.26 | 4.18 | 13.14 | 41.5 | 5.01 |
Table 2.
Characteristics of the rhythmic features in the Google Earth imagery (W = wavelength, CL = cross-shore length, MAL = mean along-shore length).
Table 2.
Characteristics of the rhythmic features in the Google Earth imagery (W = wavelength, CL = cross-shore length, MAL = mean along-shore length).
| Dates | W (m) | CL (m) | MAL (m) | ||||
|---|---|---|---|---|---|---|---|
| Mean | Min | Max | Mean | Min | Max | ||
| 14 September 2012 | 2.2 | 2 | 2.5 | 15 | 20 | 30 | 550 |
| 04 October 2014 | 2.2 | 1.81 | 2.22 | 17 | 12 | 22 | 530 |
| 25 November 2015 | 2.19 | 1.56 | 2.54 | 5 | 3 | 8 | 54 |
Table 3.
Predicted incident wave peak periods.
| EDGE-WAVE MODES | Observed Wavelength (m) | Beach Gradient | Predicted Wave Period Ti (s) |
|---|---|---|---|
| Sub-harmonic | 2.2 | 0.0255 | 5.01 |
| Synchronous | 2.2 | 0.0255 | 7.08 |
Table 4.
Characteristics of the observed features and their similarities with either cusps or finger bars.
Table 4.
Characteristics of the observed features and their similarities with either cusps or finger bars.
| Criteria | Observed Characteristics | Cusps | Finger Bars |
|---|---|---|---|
| Geometric aspect | Cross-shore>>Long-shore | o | |
| Wavelength | 2.2 m | o | |
| Beach location | (Temporary) swash zone | o | o |
| Sediment grain size distribution | Coarser in crests than in runnels | o | |
| Flow circulation pattern | Swash–backwash processes | o | |
| Environment | Low energy, accretionary | o | o |
Publisher’s Note: MDPI stays neutral with regard to jurisdictional claims in published maps and institutional affiliations. |
© 2021 by the authors. Licensee MDPI, Basel, Switzerland. This article is an open access article distributed under the terms and conditions of the Creative Commons Attribution (CC BY) license (http://creativecommons.org/licenses/by/4.0/).
Share and Cite
MDPI and ACS Style
Talavera, L.; Benavente, J.; Del Río, L. UAS Identify and Monitor Unusual Small-Scale Rhythmic Features in the Bay of Cádiz (Spain). Remote Sens. 2021, 13, 1188. https://0-doi-org.brum.beds.ac.uk/10.3390/rs13061188
AMA Style
Talavera L, Benavente J, Del Río L. UAS Identify and Monitor Unusual Small-Scale Rhythmic Features in the Bay of Cádiz (Spain). Remote Sensing. 2021; 13(6):1188. https://0-doi-org.brum.beds.ac.uk/10.3390/rs13061188
Chicago/Turabian StyleTalavera, Lara, Javier Benavente, and Laura Del Río. 2021. "UAS Identify and Monitor Unusual Small-Scale Rhythmic Features in the Bay of Cádiz (Spain)" Remote Sensing 13, no. 6: 1188. https://0-doi-org.brum.beds.ac.uk/10.3390/rs13061188
Note that from the first issue of 2016, this journal uses article numbers instead of page numbers. See further details here.