
Object-Based Predictive Modeling (OBPM) for Archaeology: Finding Control Places in Mountainous Environments


1
Department of History, Human Sciences and Education—University of Sassari, 07100 Sassari, Italy
2
Department of Cultural Heritage: Archaeology and History of Art, Cinema and Music—University of Padova, 35139 Padova, Italy
*
Author to whom correspondence should be addressed.
Remote Sens. 2021, 13(6), 1197; https://0-doi-org.brum.beds.ac.uk/10.3390/rs13061197
Submission received: 30 January 2021
/
Revised: 18 March 2021
/
Accepted: 19 March 2021
/
Published: 21 March 2021
(This article belongs to the Special Issue New Trends in High Resolution Imagery Processing)
Abstract
:This contribution examines the potential of object-based image analysis (OBIA) for archaeological predictive modeling starting from elevation data, by testing a ruleset for the location of “control places” on two test areas in the Alpine environment (northern Italy). The ruleset was developed on the western Asiago Plateau (Vicenza Province, Veneto) and subsequently re-applied (semi)automatically in the Isarco Valley (South Tirol). Firstly, we considered the physiographic, climatic, and morphological characteristics of the selected areas and we applied 3 DTM processing techniques: Slope, local dominance, and solar radiation. Subsequently, we employed an object-based approach to classification. Solar radiation, local dominance, and slope were visualized as a three-layer RGB image that was segmented with the multiresolution algorithm. The classification was implemented with a ruleset that selected only image–objects with high local dominance and solar radiation, but low slope, which were considered more suitable parameters for human occupation. The classification returned five areas on the Asiago Plateau that were remotely and ground controlled, confirming anthropic exploitation covering a time span from protohistory (2nd-1st millennium BC) to the First World War. Subsequently, the same model was applied to the Isarco Valley to verify the replicability of the method. The procedure resulted in 36 potential control places which find good correspondence with the archaeological sites discovered in the area. Previously unknown contexts were further controlled using very high-resolution (VHR) aerial images and digital terrain model (DTM) data, which often suggested a possible (pre-proto)historic human frequentation. The outcomes of the analysis proved the feasibility of the approach, which can be exported and applied to similar mountainous landscapes for site predictivity analysis.

1. Introduction
Predictive modeling is a process aimed at creating or choosing mathematical/statistical tools able to predict with accuracy the probability of an outcome [1,2]. In archaeology, this usually implies the ability to envisage the location of ancient sites in a given area (terra incognita), based on a training set of known contexts (terra cognita) or on assumptions about the past human behavior [3]. These simulations can thus be classified as data-driven, i.e., founded on an inductive approach, or theory-driven, i.e., founded on a deductive approach [4]. Yet, it was argued that pure data-driven or theory-driven protocols do not exist in real life—the selection of potentially significant variables is theory-laden and explanatory models are always produced in the light of at least partial knowledge of the universe of application [5].
Nowadays, targeted hybridization strategies are becoming more and more important as a source of cross-validation of the predictors. It is not our intention to enter into the debate on the reliability of predictive models in archaeology. The topic has already been discussed on other occasions and is also deeply rooted in the dichotomy between processual and post-processual archaeology [4,6,7,8,9]. What we intend to stress is the importance of a validation protocol, which is the core of any ArchaeOBIA project [10].
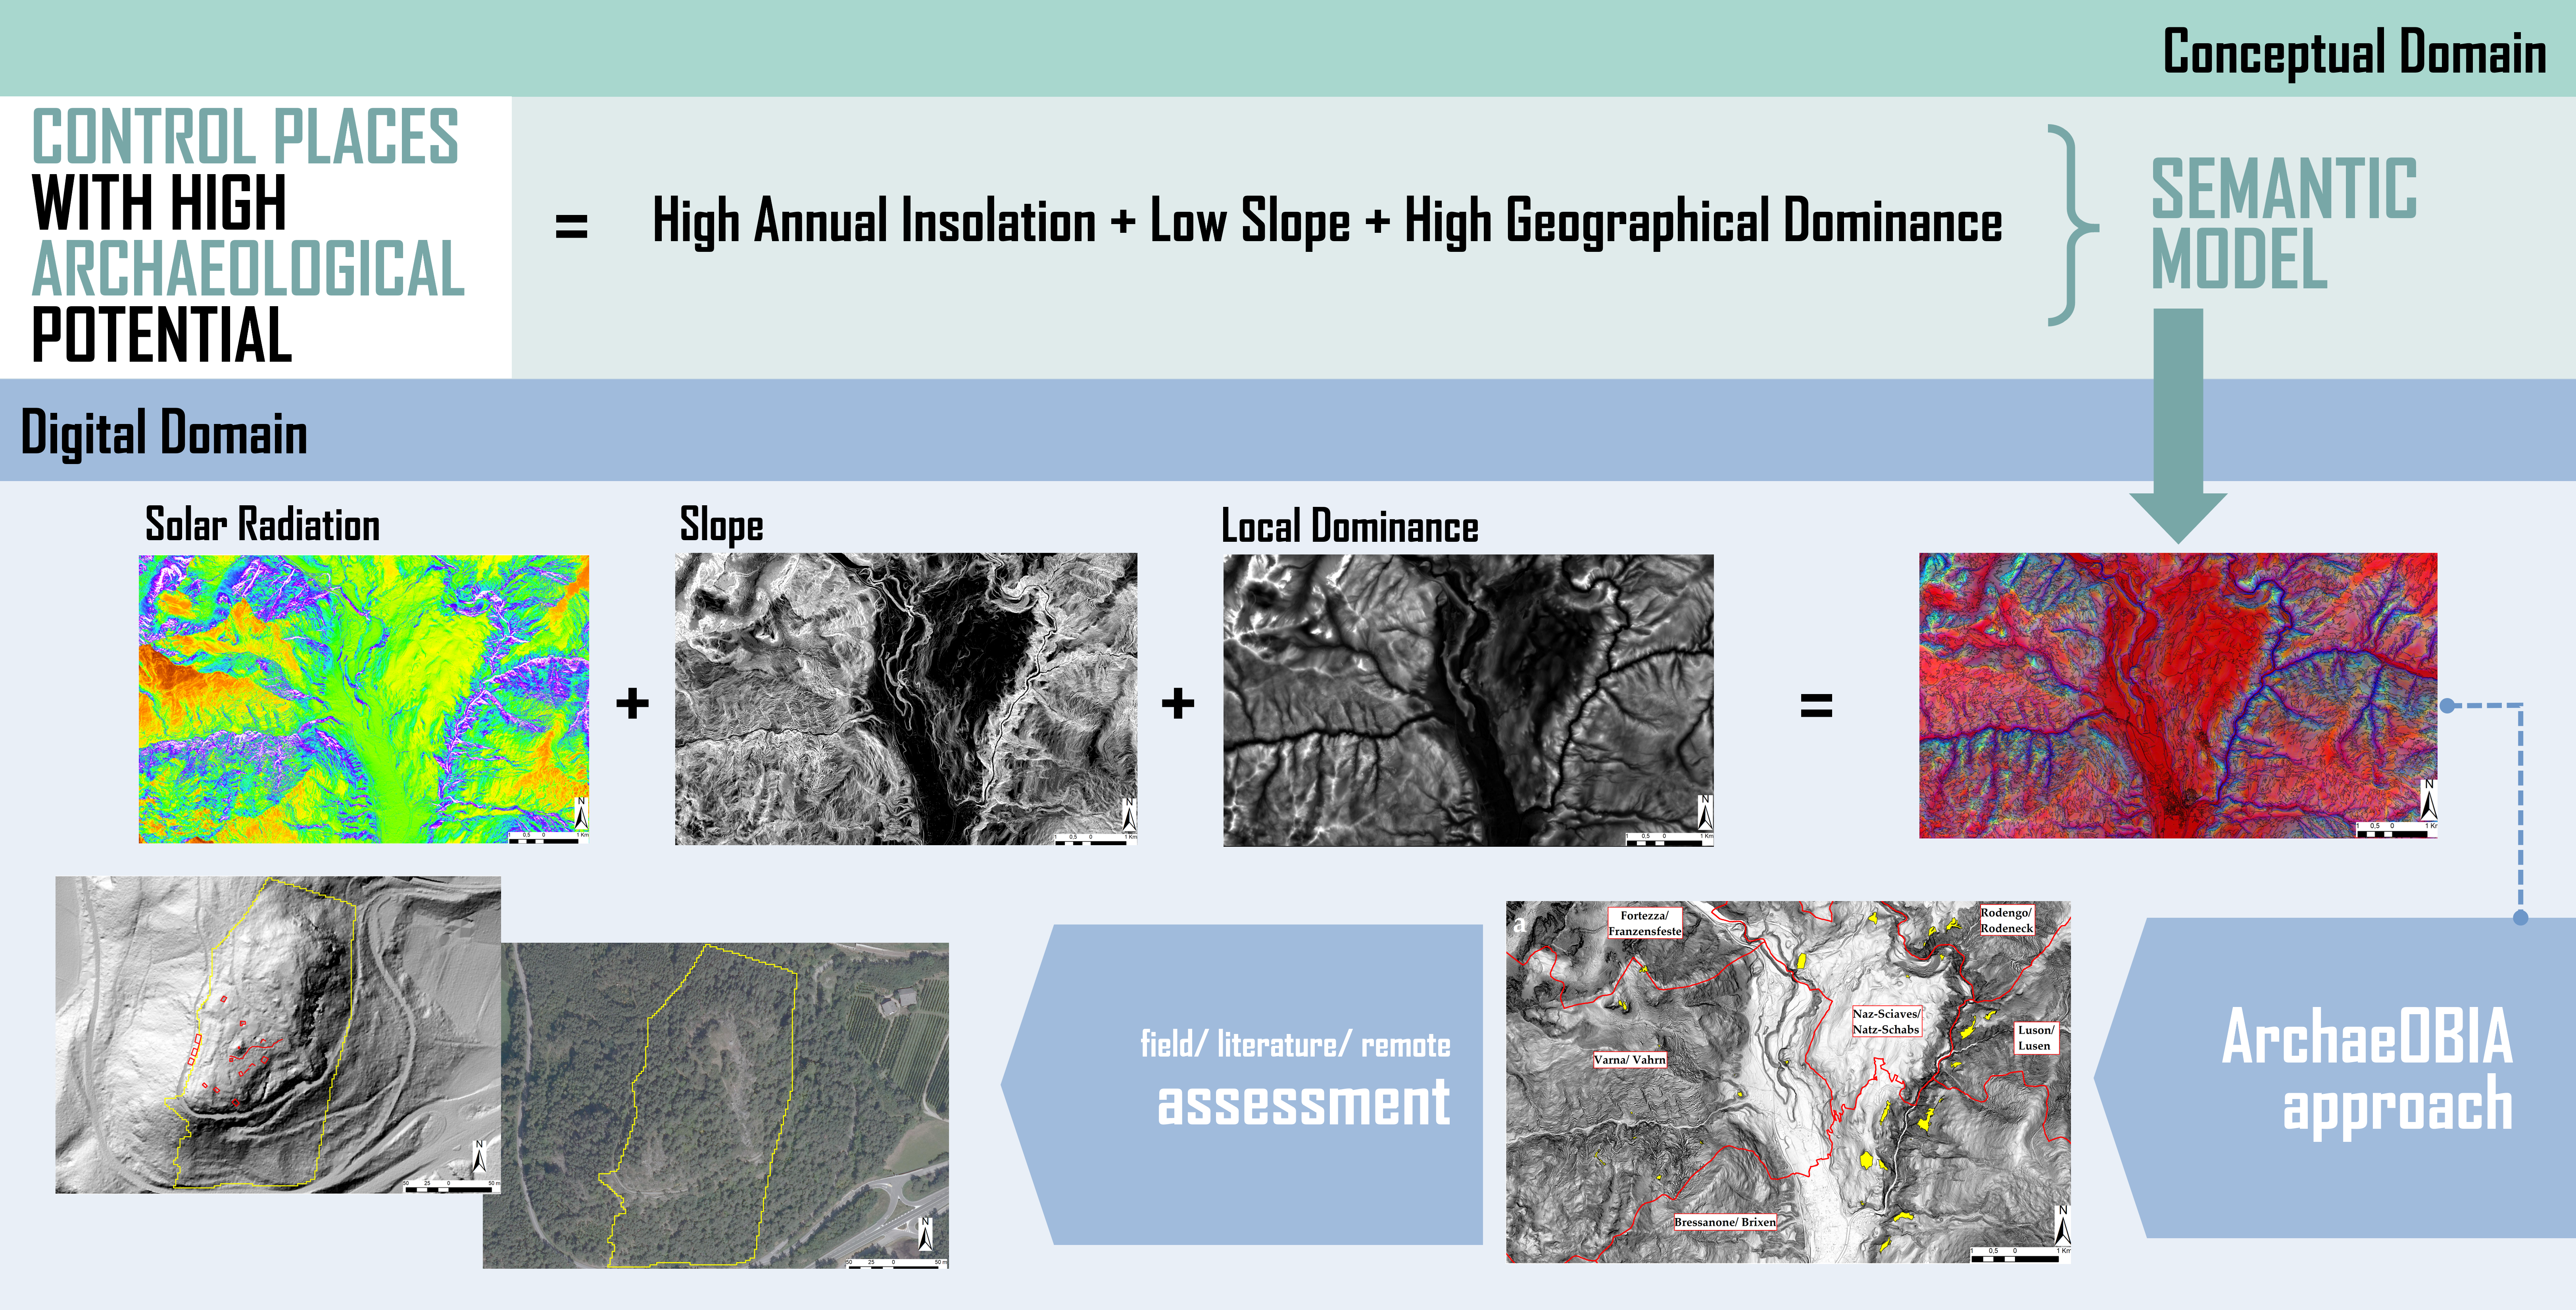
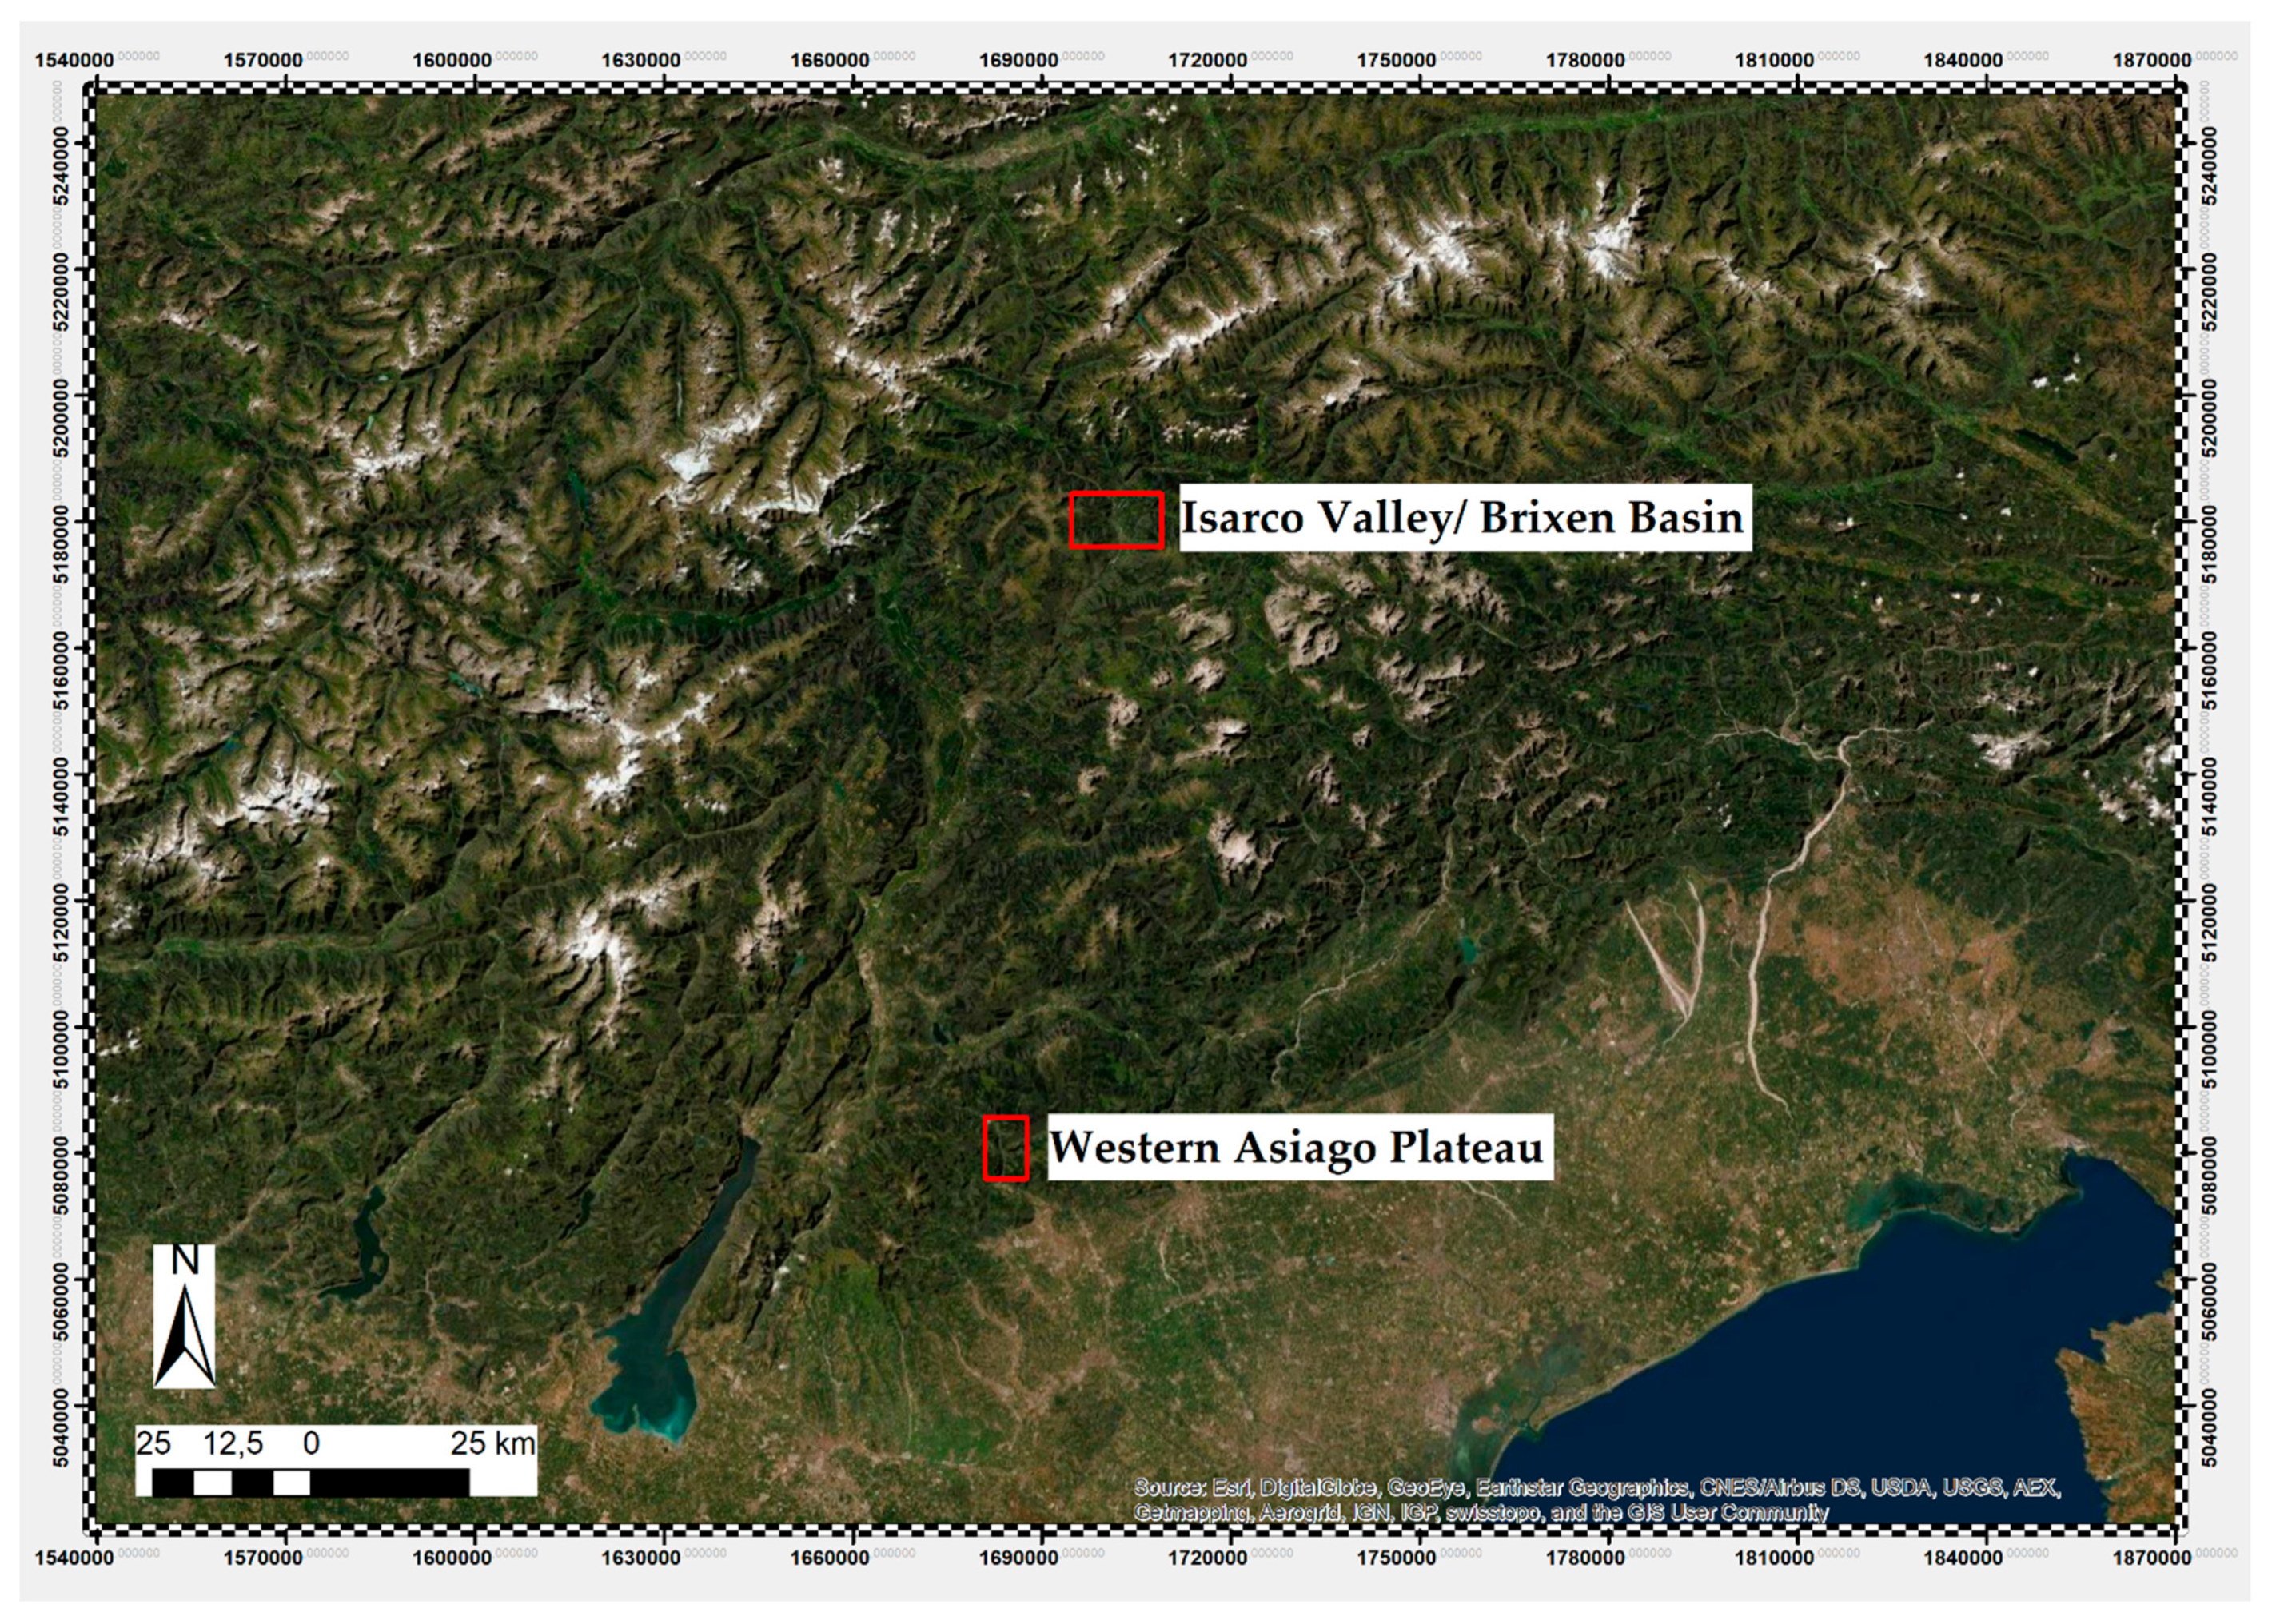
In this framework, we propose an object-based approach [11] that integrates knowledge-based descriptors selection and parameter evaluation within the structure of a decision tree classification. With this method, the results of the predictive analysis coincide with the class resulting from the classification process. In particular, we will focus on the (semi)automatic identification of control places in the Alpine environment, proposing two case studies in northern Italy (Figure 1) in order to demonstrate the replicability of our ruleset. The contexts analyzed include the western side of the Asiago Plateau (Vicenza Province, Veneto) and the Isarco Valley (Bolzano/Bozen Province, South Tirol), which host numerous archaeological sites dating from prehistoric times to modern conflicts, with a high concentration of Bronze and Iron Age hillfort settlements mostly dated to the 2nd and 1st millennium BC [12,13,14,15]. The expression “control place” is an umbrella term covering a wide range of contexts sharing a significant geographical control over the surrounding landscape; it may include (but is not limited to) hilltop settlements and shrines, castles, forts, oppida, or ritual/religious structures located in topographically prominent positions.
For their predominance in the landscape, control places play an important role in understanding the settlement patterns, the intra-polity conflictuality, the commercial routes, and even the sacral role of a given area. Their presence, which is heavily (even if not exclusively) affected by spatial and geo-morphological constraints, is diachronically and geographically widespread in the Alpine environment. However, hillforts are also some of the characterizing elements of the northern European and Mediterranean landscape from prehistory to medieval and even modern times (see, e.g., [16,17,18,19,20,21]). Identifying their location and distribution means adding a fundamental piece to our understanding of the socio-economic and political structure of the ancient societies. Moreover, this approach will grant crucial outcomes in terms of protection and monitoring of the archaeological heritage in the investigated regions and will hopefully contribute to sustainable environmental planning, which is increasingly required considering the progressive urbanization of marginal mountainous areas [22,23,24].
2. Materials and Methods
2.1. ArchaeOBIA: Basic Principles and Semantic Model Design
ArchaeOBIA was defined as the application of object-based image analysis (OBIA) to archaeological research, irrespectively of the scale of investigation [10]. In general terms, OBIA is an iterative segmentation and classification method based on pixel aggregates known as image–objects. Image–objects constitute the elementary unit of the computation and are characterized by unique shape, size, texture, spatial and spectral properties, including relational and hierarchic links with other image–objects, which differ based on the segmentation algorithm and parameters employed [25]. Looking at the previous literature, the multiresolution algorithm has demonstrated to be the best solution for archaeological applications (see, e.g., [26,27,28,29]).
For these reasons, object-based image analysis is particularly suitable for the creation of classification tree-based predictive models. OBIA, in fact, allows researchers to analyze and classify an extensive range of data (both raster and vector) and implement a wide spectrum of variables in the classification process. This method has already shown some promising results: Verhagen and Drăguţ [30] were the first to employ object-based image analysis for this task. Their work focused on the delineation and classification of landform units starting from digital elevation models (DEMs). Their aim was to create detailed landscape maps, as the starting point to predict the location of archaeological sites with traditional methods. Conversely, our work is intended to identify specific areas in mountainous environments (comprising one or more contiguous image–objects) with high archaeological potential linked to the presence of control places suitable for human exploitation.
Minimality is the key to obtaining rulesets that can be readily exported in new geographical contexts or for diachronic studies [31]. In fact, starting from a few well-selected parameters, it is possible to create models with a broader spectrum of applications that can be eventually refined at a later stage by adding new geo-morphological, socio-political or even cognitive variables. By borrowing one of the (unofficial) principles of computer coding known as KISS (an acronym for “keep it simple stupid” and variants), it is possible to state that simplicity is an added value in the design of the classification ruleset; therefore, unnecessary complications should be avoided, especially when flexibility and exportability are strongly required, as in this case.
When it comes to archaeological case studies related to predictive modeling, researchers must always be aware that the relationship between individuals and the environment largely depends on the characteristics of the landscape itself and on how the human groups perceived and exploited them in antiquity. Certain areas, based on their specific features (e.g., proximity to water basins, food resources or economically significant materials, terrestrial or aquatic communication routes, etc.), are thus generally more attractive than others [4]. Considering the physiographic, climatic, and geomorphological characteristics of the two investigated contexts, we could observe that numerous factors classically used for archaeological predictive modeling, such as the availability of water, timber, pastures, and quarries, were all abundant in our target areas. For this reason, our theory-driven semantic model took into account three different parameters, which constitute the starting point for the location of control places in the Alpine environment, namely, (1) good solar exposure, which is fundamental to overcome the rigid mountain winters and to assist seasonal agricultural/pastoral activities; (2) good local dominance, hence an excellent geographic control over the surroundings, which might have hold defensive, commercial and/or socio-economic convenience; and (3) low slope in order to support the development of settlements or complex structures (in this sense, the human groups could either choose naturally flat areas or transform specific spots by leveling and terracing).
2.2. Datasets
Light detection and ranging (LiDAR) data constitute an incredible opportunity for archaeologists to obtain a tridimensional representation of the landscape including trees and buildings (digital surface model (DSM)) or a filtered morphology of the bare ground (digital terrain model (DTM)) [32,33,34,35,36]. LiDAR is an active sensor able to calculate the distance between the instrument and a given target by measuring the time elapsed between the emitted laser pulse and either the first or last return [37]. For landscape applications, the laser scanner is usually mounted on aerial platforms (ALS), either drones, helicopters, or fixed-wing aircraft systems.
For the western Asiago Plateau, we used a 5 m resolution LiDAR-derived DTM freely available on the regional cartographic portal (https://idt2.regione.veneto.it/). The flight was performed in 2009–2011 with a Leica ALS from a quote of approx. 4500 m and scan overlapping between 55–70%. Georeferencing occurred via a global positioning system and inertial navigation system (further details here: Technical Documentation, Veneto: https://www.regione.veneto.it/web/ambiente-e-territorio/documentazione-tecnica-riferimento and DTM 5x5-Metadata: https://servizigis.regione.emilia-romagna.it/ctwmetadatiRER/metadatoISO.ejb?stato_FileIdentifier=iOrg01iEnP1fileIDr_emiro:2016-08-08T155835) (accessed on 30 January 2021).
Conversely, for the Isarco Valley, we employed a 2.5 m resolution DTM acquired in 2004–2006 and downloadable for the GeoCatalogue of the Autonomous Province of Bolzano/Bozen (GeoCatalogue Bolzano Province: http://gis2.provinz.bz.it/geobrowser/?project=geobrowser_pro&view=geobrowser_pro_atlas-b&locale=it for further details, see Cartography Inventory: http://www.provinz.bz.it/natur-umwelt/natur-raum/downloads/Inventory_cartography.pdf) (accessed on 30 January 2021)
According to our experience, elevation data with a resolution in the range of 2.5–5 m (and up to 20 m) offer an optimal compromise in balancing processing speed and accuracy of the results for this type of regional-level applications.
In the last phase of the work on the Isarco Valley case study, we also employed a DTM with 0.5 m resolution acquired in autumn 2013 during the Interreg Project Solar Tirol [38] and various sets of very high-resolution (VHR) aerial orthophotos for time series analysis (for further details regarding the acquisitions, please refer to the following link: Cartography Inventory: http://www.provinz.bz.it/natur-umwelt/natur-raum/downloads/Inventory_cartography.pdf, accessed on 30 January 2021). These data were not used for building the object-based predictive model (OBPM), but only for a final photo interpretation aimed at verifying the accuracy of the results.
2.3. DTM Processing and Visualizations
The morphological data at 2.5 and 5 m resolutions were processed in order to create thematic maps connected to the proposed semantic model. In particular, the global annual insolation was calculated using Solar Analyst, a modeling tool developed by Fu and Rich [39,40,41] and implemented as an Esri ArcGIS extension (Figure 2a). The annual global insolation takes into account both the direct and diffuse radiation. The annual direct insolation map has lower values for north-facing slopes with respect to south-facing slopes. It should also be noted that minor direct insolation can reach areas with substantial sky obstruction along the sun path (i.e., in presence of high mountains oriented in east–west direction). On the other hand, the annual diffuse insolation varies on the basis of the slope and the obstruction of the sky in all directions [39].
As reported by the authors “the Solar Analyst generates an upward-looking hemispherical viewshed, in essence producing the equivalent of a hemispherical (fisheye) photograph for every location on a DEM. The hemispherical viewsheds are used to calculate the insolation for each location and produce an accurate insolation map. It accounts for site latitude and elevation, surface orientation, shadows cast by surrounding topography, daily and seasonal shifts in solar angle, and atmospheric attenuation” ([39], p. 4).
Slope is one of the most common visualization techniques for DTMs (Figure 2b)—it represents the gradient trend in a set of elevation data and is particularly useful for highlighting features with reasonably steeply sloping slides [42]. In this case, the slope was calculated using the dedicated Esri ArcGIS tool.
Finally, local dominance (LD) was determined using a dedicated algorithm implemented in the relief visualization toolbox (RVT), an open-source application for processing high-resolution digital elevation data [43,44]. This visualization technique can compute the visual dominance of a standing human observer over the surrounding area by considering the average steepness of the angle at which the observer can look down at the surroundings (Figure 2c). For this reason, it returns higher values for points on local elevations and slopes and lower values for points located in flat or depressed areas. Specifically, we used it to assess the local visibility, and therefore, to evaluate the level of control over the landscape. The parameters chosen for both case studies are a minimum radius of 25 m, and a maximum radius of 2.5 km.
The algorithm generally recommended for this type of analysis in the archaeological literature is the so-called cumulative visibility [44]; however, we chose LD because it takes into consideration the average steepness of the angle at which the observer looks down at the surrounding land surface, which is particularly useful in mountainous environments. Tests were also carried with the cumulative visibility, which, however, presented a series of critical issues; for example, it returned very high visibility values even for some inner areas of the plateau, whose general geographical dominance over the territory, and especially over the valleys, was not particularly significant.
3. Case Studies: Results and Discussion
3.1. The Western Asiago Plateau
3.1.1. Results
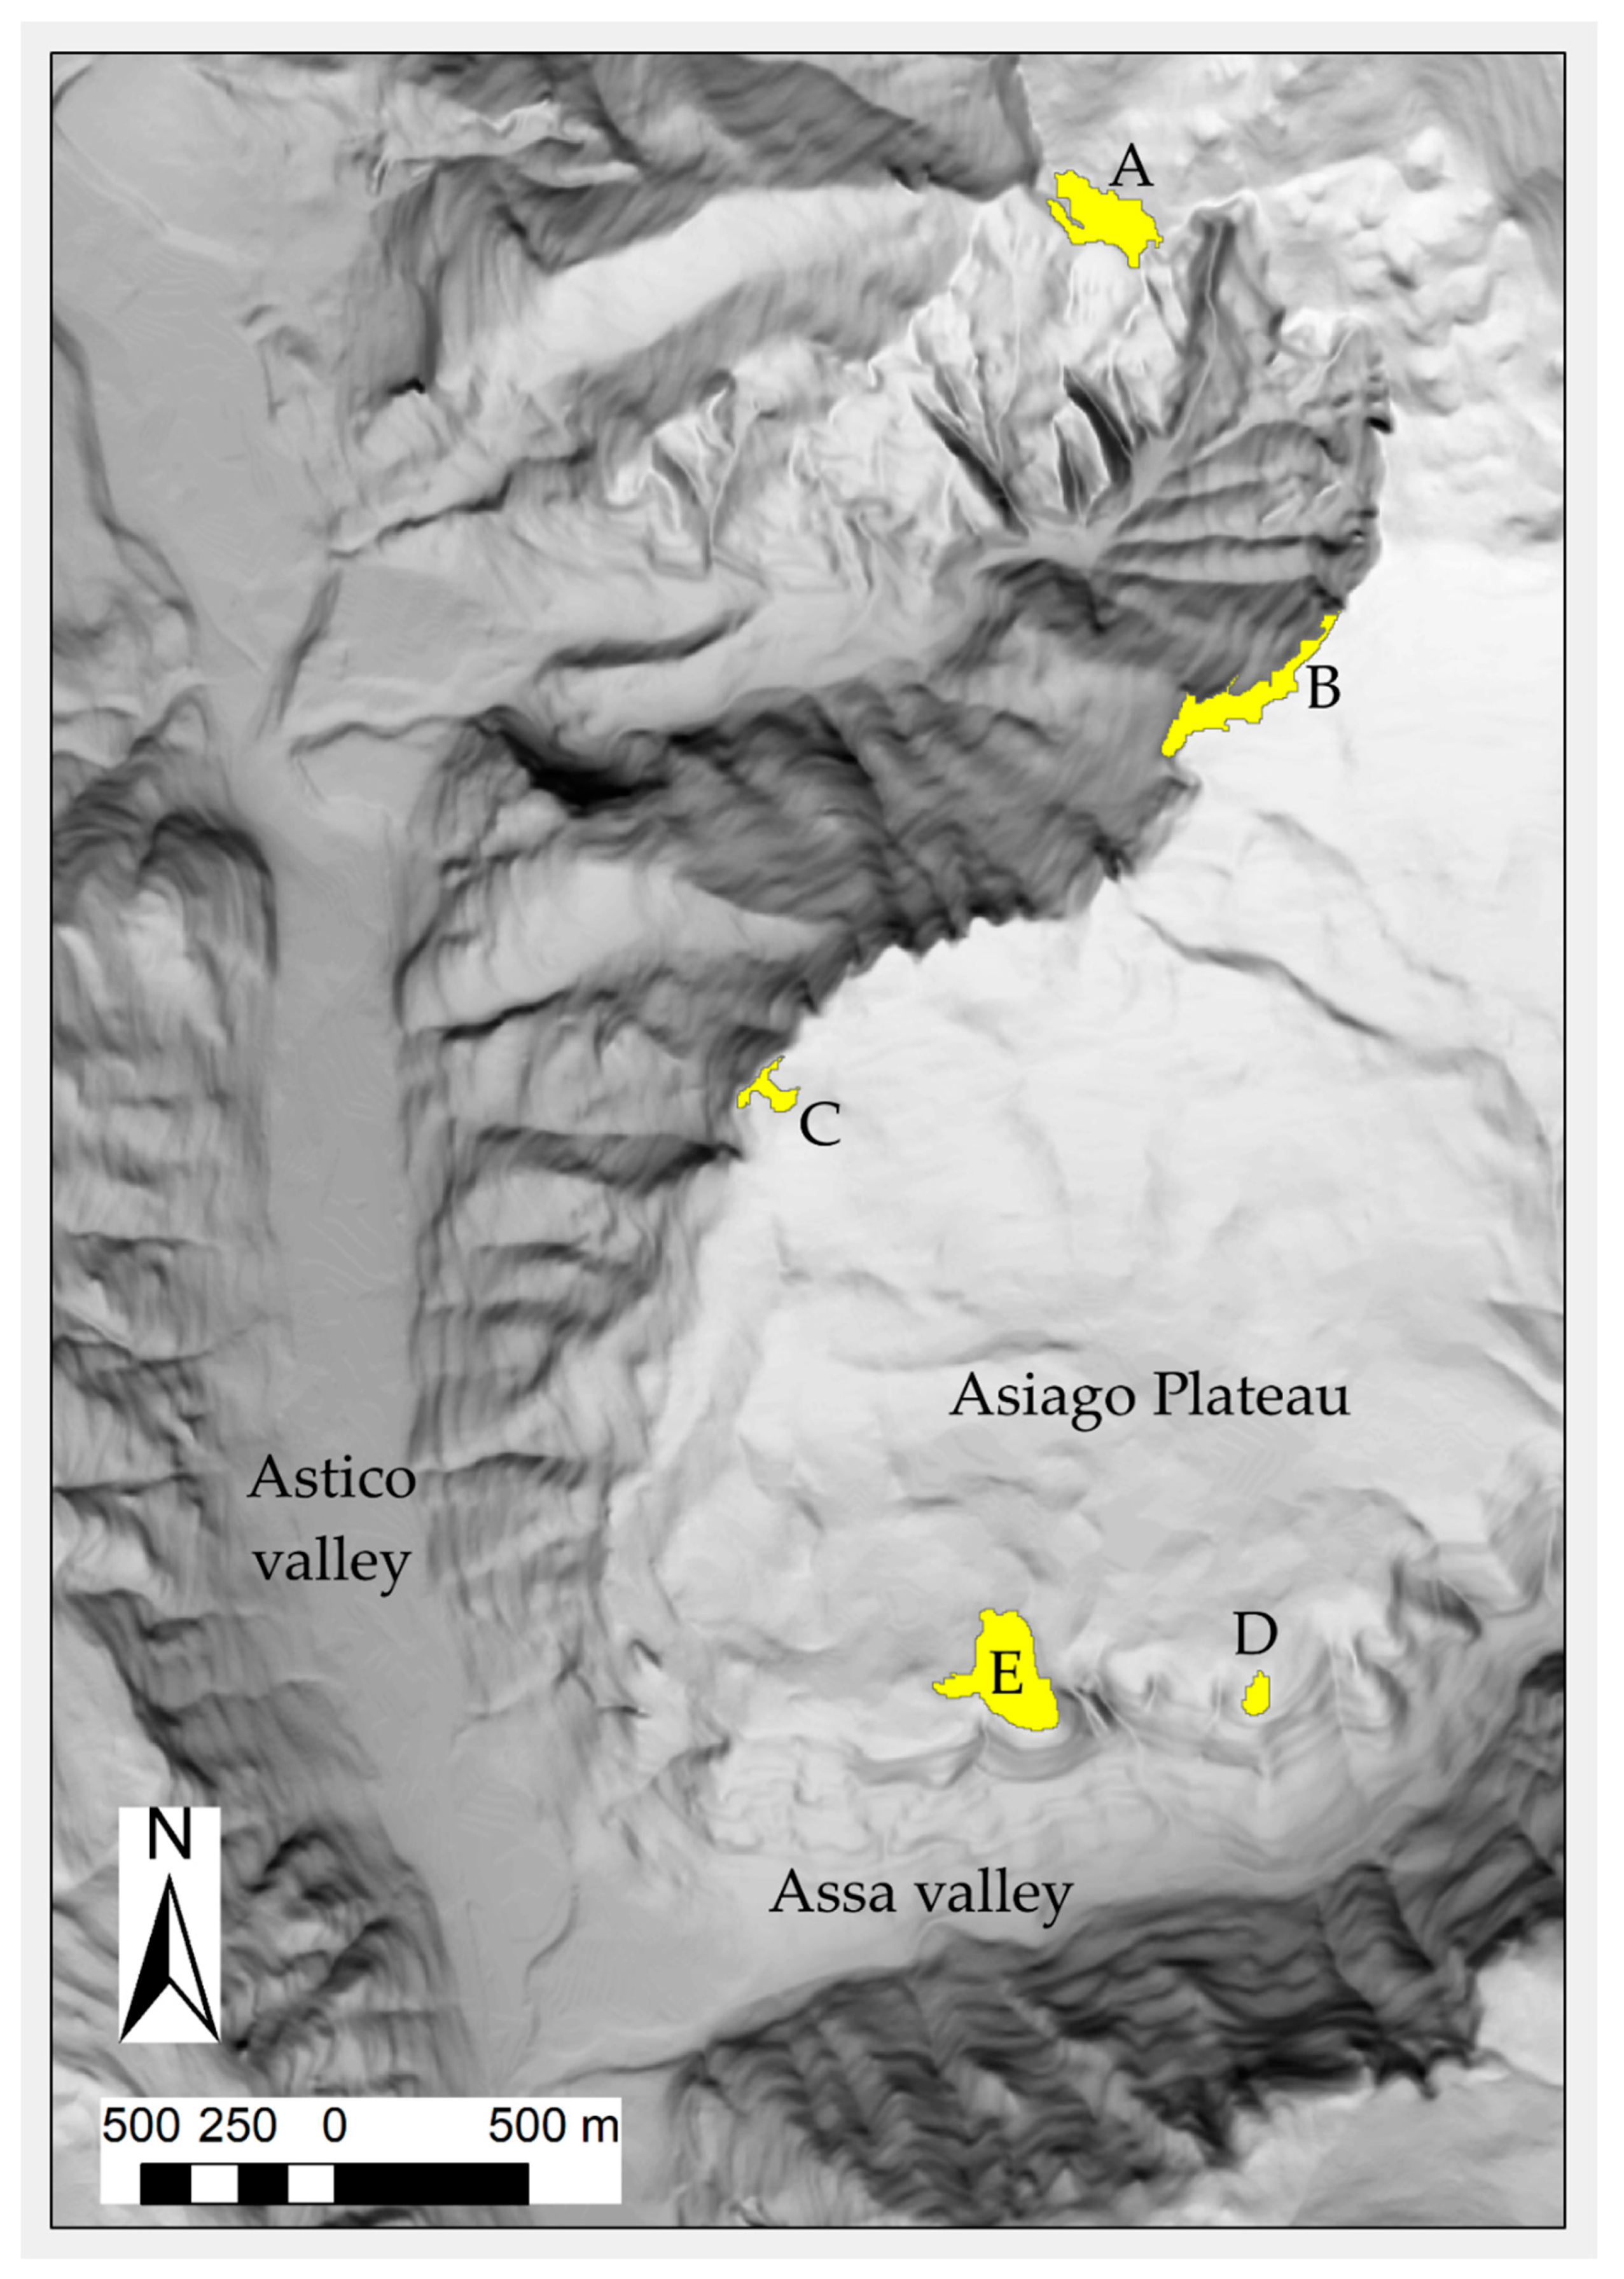
The first test area was chosen in the broader framework of the STEMPA (acronym for “Scavo, Telerilevamento, studio dei Materiali e del Paesaggio dell’Altopiano dei 7 Comuni”, STEMPA is also the name of a witch from the local folklore) project, which aims at investigating, in a diachronic perspective, the Asiago Plateau (northern Italy) and especially the proto-historic village of Bostel di Rotzo [14]. This case study focused on examining the area around the settlement, i.e., the western area of the Asiago Plateau, for an extension of approximately 52 km2.
The predictive model was designed in order to (semi)automatically identify all control places present in the test area, and particularly on the ridges of the Assa and the Astico valleys, that control numerous important communication routes connecting the lowland of Veneto with the Alpine area (Figure 3).
As a by-product of the investigation, we also intended to verify with an objective method the actual topographical dominance of the Bostel village, which has traditionally been described as a control place on the surrounding valleys [45,46]. It should be noted that during the classification, we did not consider the specific characteristics of the Bostel promontory as a starting point for a parametrization of the semantic model. Rather, we employed object-feature values derived from our mental model of control places. In this way, we were also able to evaluate with a computational perspective the original assumption that the site was voluntarily established in a dominant location, as frequently reported in the archaeological literature.
The next phase involved the actual creation of the predictive model itself through an object-based approach. The model was designed to classify areas contemporary satisfying the following parameters: good solar exposure; high dominance on the surrounding topography; reasonably flat; of sufficient size for the development of structured control points, which may have left visible traces on the ground (or underground). Operatively, solar radiation, LD, and slope were visualized as a three-layer RGB image, which was segmented with the multiresolution algorithm in eCognition Developer 9.2. The scale, shape, and compactness parameters were, respectively, set to 1200, 0.1, and 0.6, thus granting a high weight to the color during the segmentation process.
As a first step (see Table 1), we included in the class “control places” all the image–objects that had high values of solar radiation. The threshold selected lays in the first quartile of the mean annual insolation received by the image–objects considered. For the following steps, we used a subtractive approach which helped us to refine the OBPM by eliminating image–objects that did not meet the criteria selected in the framework of our knowledge-based semantic model. Particularly, during step 2 (Table 1), we unclassified image–objects having low values of LD. The threshold selected allowed us to discard those image–objects whose mean LD values were lower than the 50th percentile of the overall computed LD. As a next step (number 3 in Table 1), image–objects with a slope higher than 20 degrees were also removed from the class “control places.”
At this point (step number 4 in Table 1), we applied the merge region algorithm to combine neighboring classified image–objects and subsequently discounted from the classification all objects with areas smaller than approximately 0.2 ha, which were considered too small for the development of structured outposts (step number 5 in Table 1). This allowed us, for example, to remove some residual mountain peaks.
Finally, a relational object feature was used to broaden and better define the areas identified by the model. In detail, we also included in the final classification those image–objects that shared with classified objects (or parent process objects) at least 30% of the total perimeter (step number 6 in Table 1). In the end, we merged again neighboring image objects (step number 7 in Table 1) to guarantee a more accurate numeric quantification of the control places identified and of their spectral, textural, and morphometric characteristics.
3.1.2. Discussion and Ground Survey Validation
The model classified five sites as possible control places in the test area. The reliability of the method was verified using a two-steps protocol, i.e., (1) first a remote assessment combining historical aerial photographs and multispectral satellite images (WorldView 2 with eight bands, 1.6 m multispectral resolution, and 0.5 m panchromatic resolution) and (2) a ground survey. Looking at the results of the classification, it was soon apparent that the Bostel site is among the areas identified by the model (Figure 3, image–object E). On one hand, this further confirms the vocation of the settlement as a control place, while on the other hand, this validates the efficiency of the predictive model itself because the site is the only known protohistoric hilltop settlement in the considered region.
Considering the other image–objects classified and shown in Figure 3, the northern area (indicated as image–object A) is occupied by Campolongo Fort, one of the most important Italian fortifications controlling the Astico Valley and the Austro-Hungarian border during the First World War [29,47]. Its strategic location facilitated the observation of the enemy and was at the same time easily defensible. The second area just below (image–object B in Figure 3), located near the Spitz Rotzo mountain peak, revealed a great potential. During the ground survey, we could identify an impressive infrastructure related to the First World War (WWI) with containment walls, machine-gun places, barracks, and defensive positions that had never been archaeologically mapped before. In the exact spot indicated by the model, we found a heavy artillery placement, a trench, and a large wall hidden under the wood canopy. The visibility over the surroundings was excellent—it was possible to see almost the entire Astico Valley, the site of Campolongo Fort, and the Bostel Village.
The third area (image–object C in Figure 3) is located southwest of the Obergrubele peak and shares similar characteristics with Bostel, both in terms of altitude and visibility. Unfortunately, during the survey, we realized that the area was affected by a recent anthropic leveling for easing the passage of vehicles for timber transport—its low slope is thus of modern origin and the cause of an unexpected bias in the predictive model. However, as already pointed out in Section 2.1, artificially flat areas should not be automatically considered of recent age. In the Alpine environment, a process of progressive anthropization can be perceived as early as the Neolithic (approx. 5th-4th millennium BC). This is well testified, for example, by the terraces that emerged in the sites of Aica di Fié/Völser Aicha and Villandro/Plunacker, both in the Bolzano/Bozen Province [48]. These infrastructures were intended to expand the surface for agricultural, pastoral, or household activities, dramatically improving the socio-economic potential of the human groups.
The last context identified is the Groementeche (image–object D in Figure 3), located on another small promontory east of Bostel—the two sites are also connected through a historical path. The area is still known in local legends for having a magic–religious aura, which was probably triggered by the presence of two stone slabs intentionally stuck in the ground in a sub-vertical position (their chronology is very dubious, but they were surely placed there before the 19th century). The location and proximity to the Bostel settlement have suggested a possible relationship for the practice of ritual ceremonies, but the total absence of anthropic material on the surface (except for some non-diagnostic pottery fragments) and the impossibility of opening stratigraphic windows still prevent from going into the detail of its effective archaeological potential. In this regard, it is also important to underline that the concept of “control place” may also comprise areas of religious significance, which are frequently associated with topographic anomalies such as summits and sudden slope variations, which are known to frequently host hilltop shrines, Passfunde, Brandopferplätze, and more recently Christian churches [17,49,50].
3.2. The Brixen Basin
3.2.1. Results of the Fine-Tuning and Automatic Reapplication
Once the reliability of the process tree was verified in the Asiago Plateau case study, we decided to test the same ruleset on a different area that shares similar (but not identical) characteristics from an archaeological and geomorphological perspective. Specifically, we selected a region for which we had detailed previous archaeological knowledge and a wide dataset suitable for verifying the results. The choice fell on an area of 110 km2 in the Isarco Valley around the municipality of Bressanone/Brixen, in South Tirol. The work was divided into two steps: (1) fine-tuning and reapplication of the ruleset on the new test area; (2) assessment of the results using the geodatabase of the archaeological sites of the Autonomous Province of Bolzano, VHR orthophotos, and DTM data.
Again, the DTM was treated with the three previously mentioned visualization techniques (Figure 4a–d). The same semantic model proposed for the previous case study was reapplied by slightly adapting some parameters to the new geographical context (Table 2). This is essentially due to the different resolutions of the digital terrain model available for the two case studies, 5 m for the Asiago Plateau and 2.5 m for the Brixen Basin. Since in the multiresolution segmentation the scale parameter is inversely proportional to the resolution, it was necessary to double its value, passing from 1200 to 2400. It should also be noted that the absolute values of solar radiation and LD were visibly lower here due to the orography of the area. While the first case study was implemented in an extended plateau with a rather constant elevation and moderate peaks, the Isarco Valley is characterized by significant elevation gradients and narrower valleys.
3.2.2. Discussion and Remote Validation
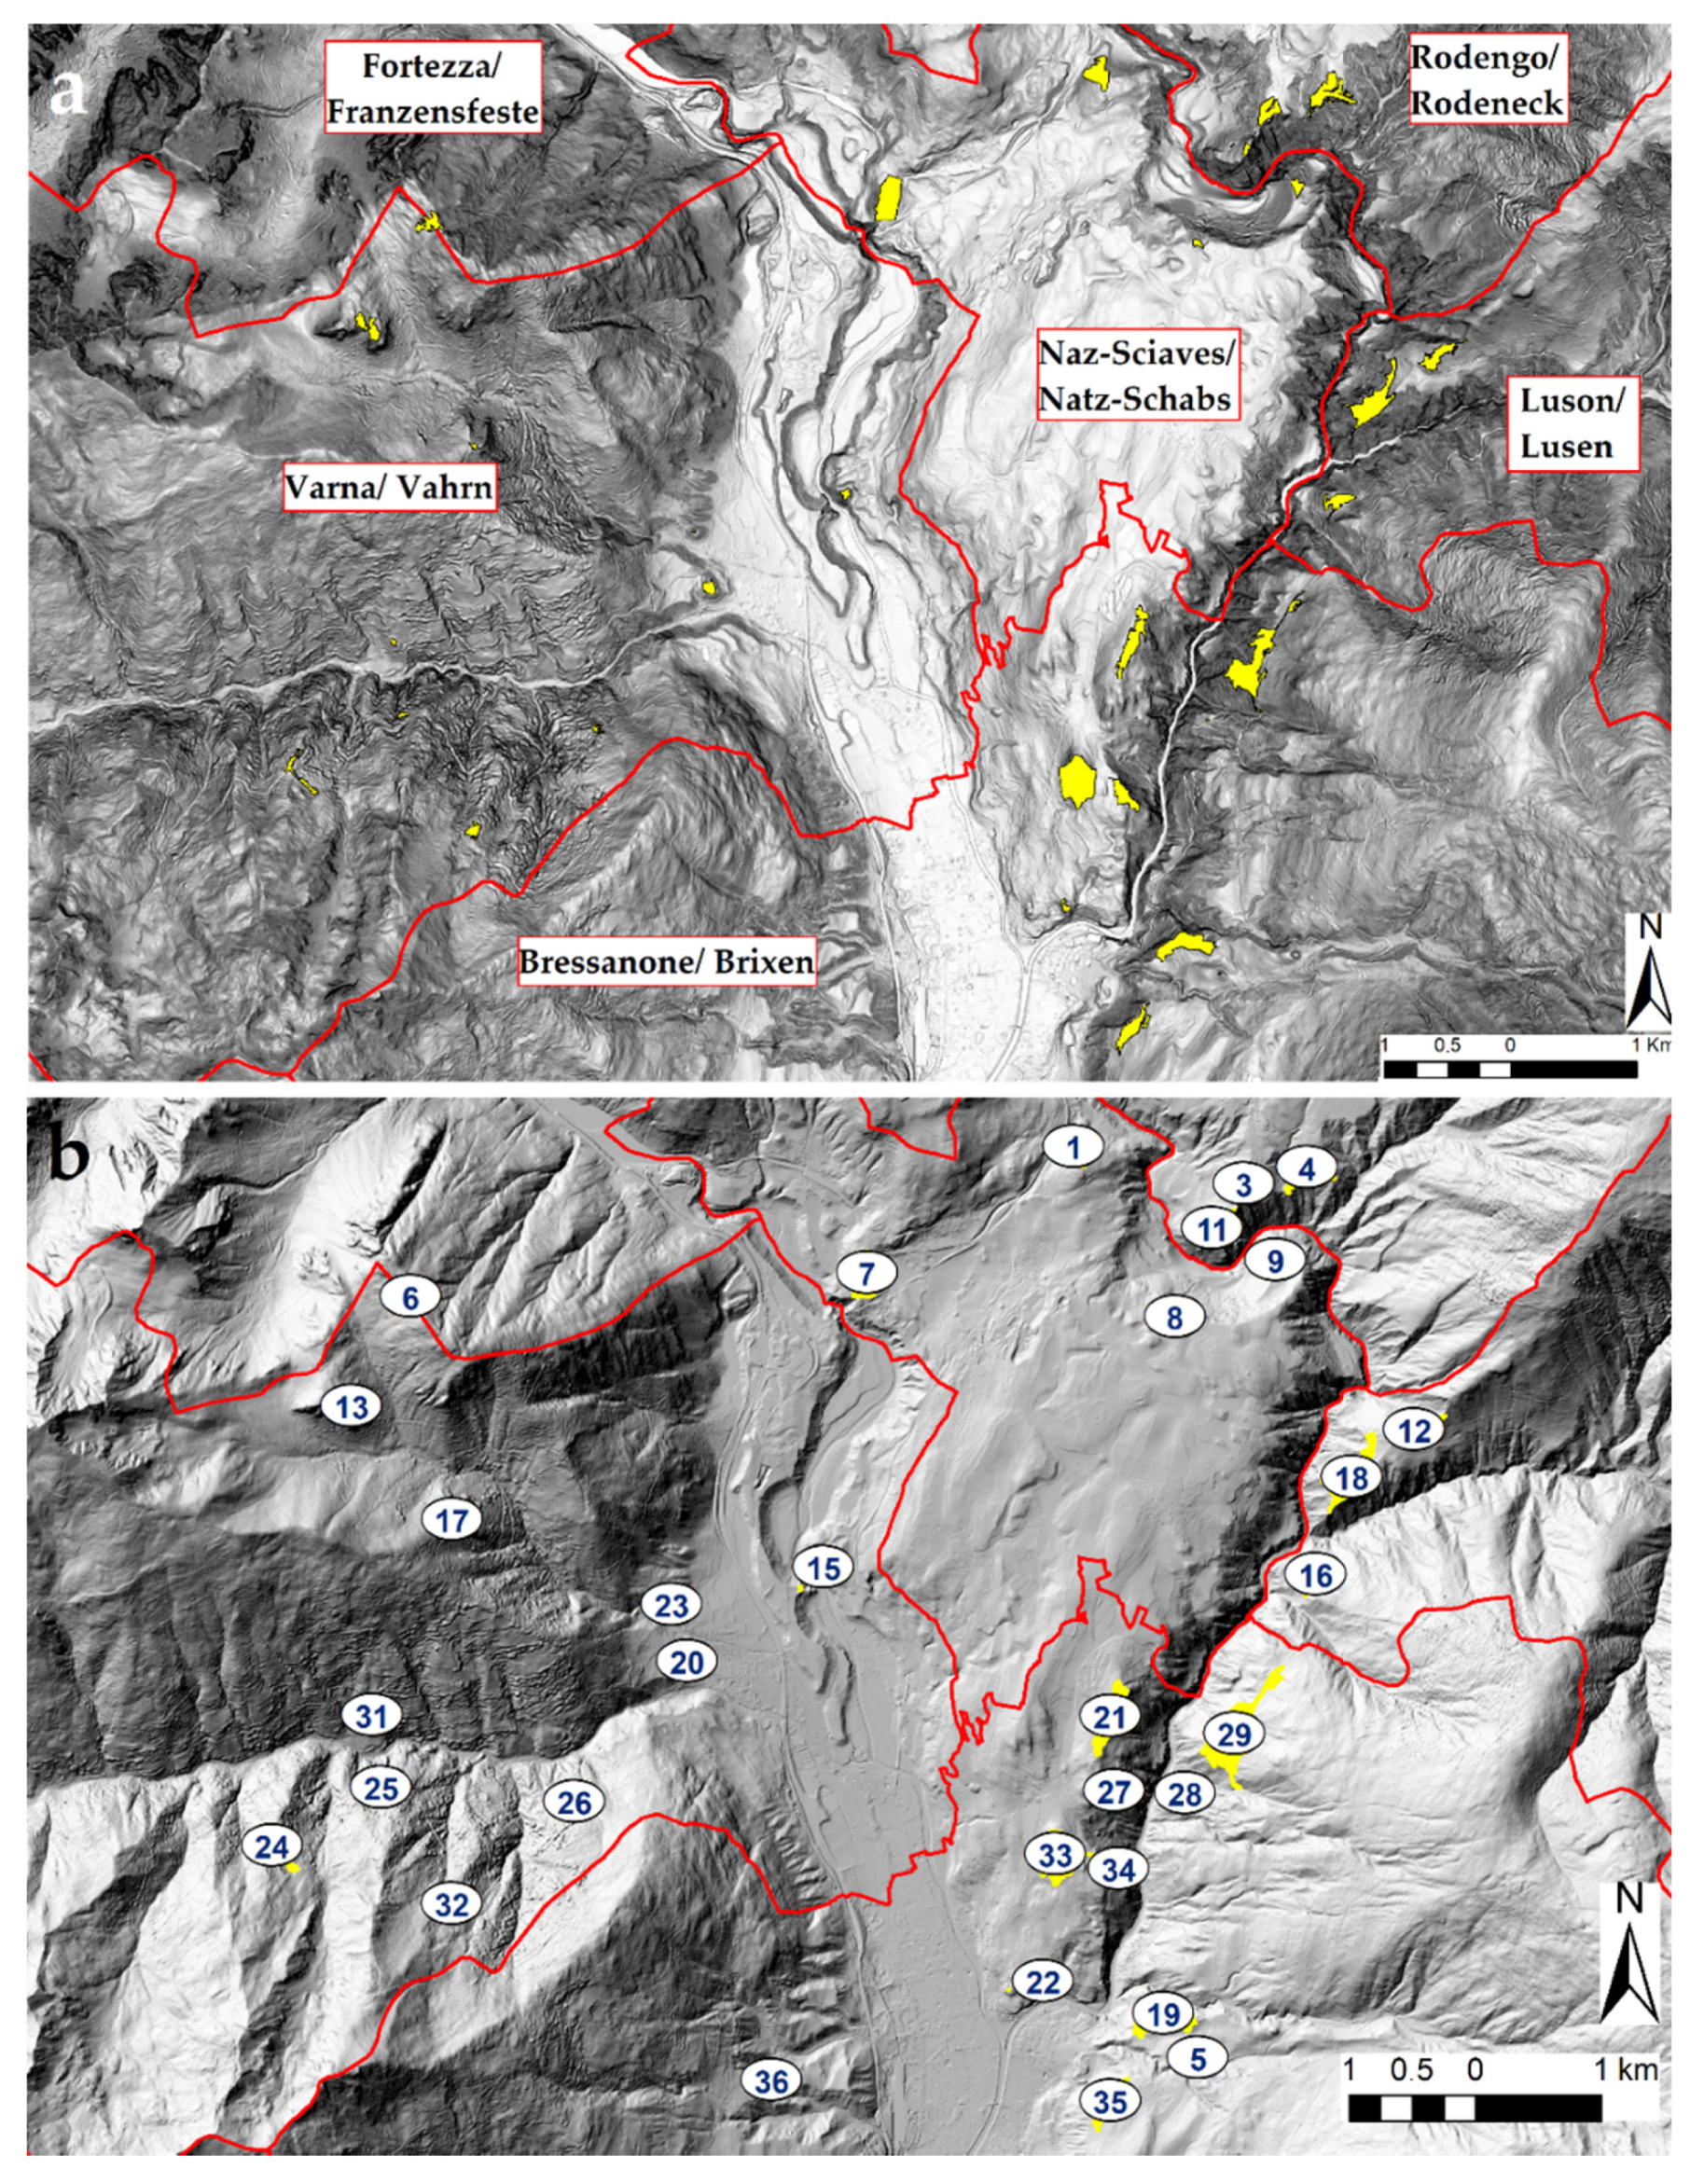
The procedure resulted in 36 potential control places (Figure 5), the majority of which find good correspondence with the archaeological sites already reported in the area. In fact, 23 of the classified occurrences are also cataloged in the open-access Archeobrowser of the Autonomous Province of Bolzano, which collects all the cadastral parcels with probable or certain archaeological potential that are protected by the national and provincial laws (Table 3). Out of the 23 control places identified, 15 areas host structural or material traces of protohistoric occupation, including various hillforts/hilltop settlements (12), a cemetery (1), and surface distributions of diagnostic pottery (2). Out of the 18 pre-protohistoric settlements already known in the investigated area, 12 were successfully identified by our predictive model (i.e., Figure 6). Four of the remaining six settlements are located on the lower valley and cannot be considered as control places, and hence their absence should not be considered as a flaw of the model. Only two known Bronze Age hillforts were actually omitted from the classification procedure because of their high slope values (24° and 26°, respectively), with a success rate of 85.7%.
As for the historical buildings, the model correctly identified all Medieval castles in the area (3), confirming the effectiveness of this approach also from a diachronic perspective. Out of the two castles located in Varna municipality, the one in Spelonca/Voisberg lies over a Middle-to-Recent Bronze Age village; this is further proof of the attractivity of control places in the settlement choices of (pre-proto)historical societies, as it is widely recognized in the literature [13,17,51]. It should also be noted that the complex of Rodengo Castle was partitioned into four different image–objects, one including the remains of the oldest structure dating to the 12th century AD, one the extension of the 14th century AD, one the inner courtyard, and one the church with its small cemetery. Two other Medieval/early modern religious buildings were also identified on the western side of the valley.
The remaining 13 objects identified by the model but absent from the Archeobrowser were remotely controlled by time series analysis of high-resolution (HR) and VHR orthophotos and, where available, a LiDAR-derived DTM with 0.5 m resolution processed with various visualization techniques including hillshade, local relief model, sky-view factor, positive/negative openness and Principal Component Analysis of 16 hillshades. The interpretation of the data confirmed the presence of anomalies related to buried structures and infrastructures for at least half of them, evidencing possible anthropic exploitation covering a time span going at least from protohistory (Bronze/Iron Age) to modern times. The most promising results are related to image–objects number 16, 18, 29, and especially 4 and 12 that host various squared structures with a side of approximately 10 m, very well visible in the hillshaded DTM but absent from any set of available aerial orthophotos (Figure 7 and Figure 8). The areas identified were signaled to the local heritage office that will promote further ground investigations in the near future.
4. Conclusions and Perspectives
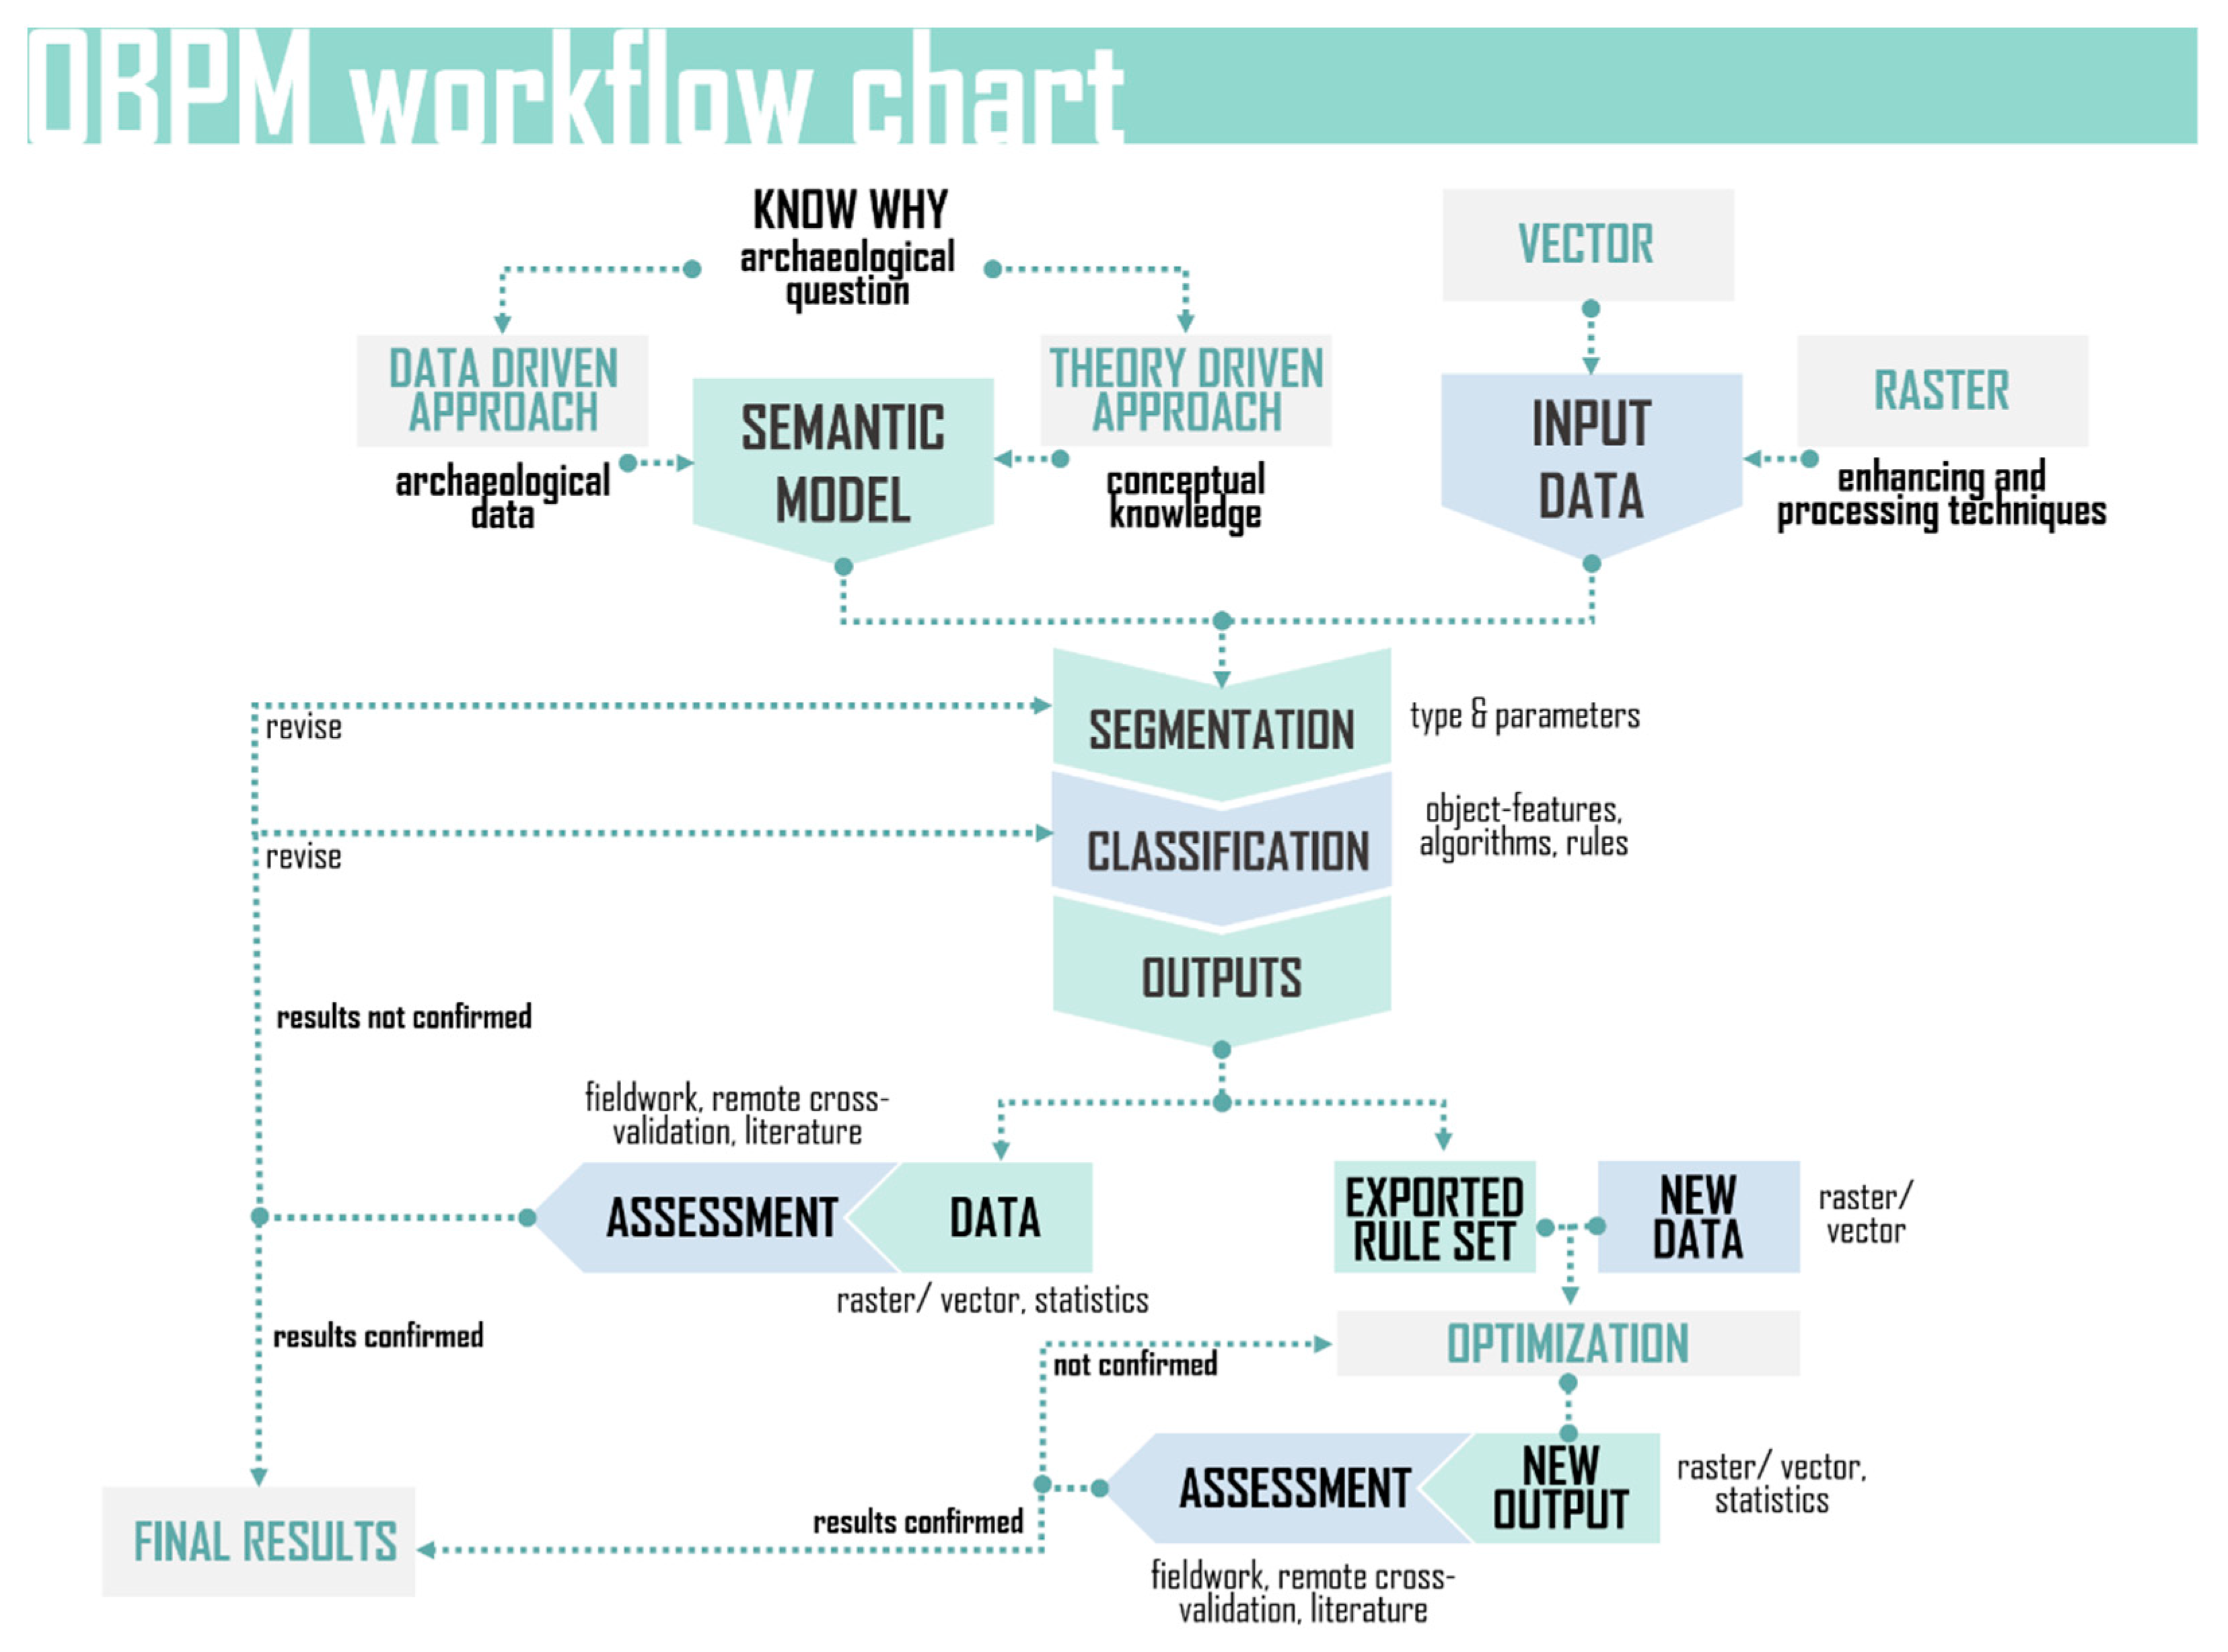
Control points represent crucial elements in the ancient and modern landscapes of power [51,52]. For this reason, we implemented an object-based predictive model (OBPM) starting from DTM-derived thematic maps aimed at their (semi)automatic recognition in mountainous environments, following the protocol summarized in Figure 9. While the proposed OBPM was specifically developed for the Alpine region, the use of a well-tailored but simple semantic model sets the basis for further reapplications in a wide range of archaeological contexts, provided that a fine-tuning of the parameters and object-features is performed.
The main drawback of the method is that the overall performance is strictly entangled with the expertise of the human operator in building an efficient and locally sensitive semantic model. The selection of adequate criteria and parameters is indeed of crucial importance for predicting with a good level of accuracy the location of the target sites, and this is why the archaeological expertise is always required at any level of an OBPM project: for the development of the mental model, during the parametrization of the ruleset, and the assessment of the results. In the two case studies presented throughout this work, each of the four criteria selected (annual insolation, local dominance, slope, and area) was equally important for a satisfactory location of control places in Alpine environments. On the contrary, the (small) differences in the resolution of the DTMs available for the two areas had no relevant influence on the thematic maps and, thus, on the final results.
Despite the problems connected with the geographical constraints and the current limits in investigating the private areas identified as most promising with systematic excavations or geophysical surveys, the case studies presented throughout this paper offer an interesting starting point for evaluating the potential and the reliability of OBIA for the creation of predictive models. In fact, the method offers the chance to create exportable rulesets that can be easily and quickly reapplied in new geographical areas, after minor changes. Moreover, the basic ruleset can be further expanded to include more variables and parameters, thus refining the predictive model and customizing it for each specific context. This is essentially due to the interactive nature and the wide adaptability offered by the method, and the possibility of processing different types of data at the same time. For this reason, we believe that OBIA can provide an effective means for mapping the archaeological potential of a given area and for offering predictive hypotheses related to the presence of buried sites. By combining OBPMs and remote or ground–truth validation protocols, it is now possible to speed up the preliminary survey of wide regions, contributing to a time and cost-effective management of the archaeological heritage.
Author Contributions
Conceptualization, L.M. and C.B.; methodology, L.M.; software, L.M.; validation, C.B. and L.M.; formal analysis, L.M. and C.B.; investigation, C.B. and L.M.; data curation, L.M.; writing—original draft preparation, C.B.; writing—review and editing, L.M.; visualization, C.B. All authors have read and agreed to the published version of the manuscript.
Funding
LM’s position is funded by the PON Research and Innovation 2014–2020, Action I.2 AIM-LINE 1 (Mobility of the Researchers), D.R. n. 3647, prot. n. 131845 of 26/11/2019; CB’s position is funded in the framework of the POR-FESR 2014–2020 project nr. 10354404 “Re-living the Past” (Veneto region).
Institutional Review Board Statement
Not applicable.
Informed Consent Statement
Not applicable.
Data Availability Statement
file:///C:\Users\luigi\Desktop\università\Articolo_predictive_modelling\Data (accessed on 30 January 2021) available on request.
Acknowledgments
The authors would like to thank the four anonymous reviewers for improving the overall quality of the paper with their comments.
Conflicts of Interest
The authors declare no conflict of interest.
References
- Geisser, S. Predictive Inference: An Introduction; Springer: Boston, MA, USA, 1993; ISBN 978-0-412-03471-8. [Google Scholar]
- Kuhn, M.; Johnson, K. Applied Predictive Modeling; Springer: New York, NY, USA, 2013; ISBN 978-1-4614-6848-6. [Google Scholar]
- Kohler, T.A.; Parker, S.C. Predictive Models for Archaeological Resource Location. Adv. Archaeol. Method Theory 1986, 9, 397–452. [Google Scholar]
- Verhagen, J.W.H.P. Case Studies in Archaeological Predictive Modelling; Leiden University Press: Leiden, The Netherlands, 2007; ISBN 9789087280079. [Google Scholar]
- De Guio, A. Cropping for a Better Future. Vegetation Indices in Archaeology. In Detecting and Understanding Historic Landscapes; Chavarria Arnau, A., Reynolds, A., Eds.; SAP: Mantova, Italy, 2015; pp. 109–152. ISBN 9788887115994. [Google Scholar]
- Wheatley, D.; Gillings, M. Spatial Technology and Archaeology; Taylor & Francis: Abingdon, UK, 2002; ISBN 978-0-203-35603-6. [Google Scholar]
- Whitley, T.G. GIS as an interpretative tool for addressing risk management and cognitive spatial dynamics in a slave society. In Proceedings of the CAA 2002. The Digital Heritage of Archaeology. Computer Applications and Quantitative Methods in Archaeology. Proceedings of the 30th Conference, Heraklion, Crete, 16–19 October April 2002, Archive of Monuments and Publications; Doerr, M., Sarris, A., Eds.; Hellenic Ministry of Culture: Heraklion, Greece, 2003; pp. 209–215. [Google Scholar]
- Predictive Modelling for Archaeological Heritage Management: A Research Agenda; van Leusen, P.M.; Kamermans, H. (Eds.) National Service for Archaeological Heritage: Amersfoort, The Netherlands, 2005. [Google Scholar]
- Archaeological Prediction and risk Management; Kamermans, H.; van Leusen, M.; Verhagen, P. (Eds.) Leiden University Press: Leiden, The Netherlands, 2009. [Google Scholar]
- Magnini, L.; Bettineschi, C. Theory and practice for an object-based approach in archaeological remote sensing. J. Archaeol. Sci. 2019, 107, 10–22. [Google Scholar] [CrossRef]
- Blaschke, T.; Hay, G.J.; Kelly, M.; Lang, S.; Hofmann, P.; Addink, E.; Queiroz Feitosa, R.; van der Meer, F.; van der Werff, H.; van Coillie, F.; et al. Geographic Object-Based Image Analysis—Towards a new paradigm. ISPRS J. Photogramm. Remote Sens. 2014, 87, 180–191. [Google Scholar] [CrossRef] [Green Version]
- Parnigotto, I. Condizioni ambientali e popolamento nel II millennio a.C. in Alto Adige: Gli esempi delle conche di Bressanone e Brunico. In Höhensiedlungen der Bronze- und Eisenzeit. Kontrolle der Verbindungswege über die Alpen—Abitati d’altura dell’età del Bronzo e del Ferro. Controllo delle vie di Comunicazione Attraverso le Alpi; Dal Ri, L., Gamper, P., Steiner, H., Eds.; Temi: Trento, Italy, 2010; pp. 307–324. [Google Scholar]
- Tecchiati, U. Dinamiche insediative e gestione del territorio in Alto Adige tra la fine del III e la fine del I millennio a.C. In Höhensiedlungen der Bronze- und Eisenzeit. Kontrolle der Verbindungswege über die Alpen—Abitati d’altura dell’età del Bronzo e del Ferro. Controllo delle vie di Comunicazione Attraverso le Alpi; Dal Ri, L., Gamper, P., Steiner, H., Eds.; Temi: Trento, Italy, 2010; pp. 487–559. [Google Scholar]
- Magnini, L.; Bettineschi, C.; De Guio, A.; Burigana, L.; Colombatti, G.; Bettanini, C.; Aboudan, A. Multisensor-Multiscale Approach in Studying the Proto-historic Settlement of Bostel in Northern Italy. Archeol. e Calc. 2019, 30, 347–365. [Google Scholar] [CrossRef]
- De Guio, A. Storie e scorie di formaggio e di rame… I siti pre-protostorici della Pedemontana dell’area vicentina. In Proceedings of the Conference “Lana, pecore, pastori. Tra il monte e il piano”; Rodighiero, C.F., Ed.; Attilio Fraccaro Editore: Bassano del Grappa, Italy, 2019; pp. 11–24. [Google Scholar]
- Wheeler, S.M.; Richardson, K.M. Hill-Forts of Northern France; Society of Antiquaries of London: London, UK, 1957. [Google Scholar]
- Kidd, A. Hillforts and churches: A coincidence of locations? Rec. Buckinghamsh. 2004, 44, 105–110. [Google Scholar]
- Jordá-Pardo, J.F.; Rey Castiñeira, J.; Picón Platas, I.; Abad Vidal, E.; Marín Suárez, C. Radiocarbon and Chronology of the Iron Age Hillforts of Northwestern Iberia. In Interpretierte Eisenzeiten. Fallstudien, Methoden, Theorie. Tagungsbeiträge der 3 Linzer Gespräche zur interpretativen Eisenzeitarchäologie. Studien zur Kulturgeschichte von Oberösterreich; Karl, R., Leskovar, J., Eds.; Oberösterreichisches Landesmuseum: Linz, Austria, 2009; pp. 81–98. [Google Scholar]
- Cook, M. Paradigms, Assumptions, Enclosure, and Violence: The Hillforts of Strathdon. J. Confl. Archaeol. 2013, 8, 77–105. [Google Scholar] [CrossRef]
- Vengalis, R. Old and middle iron Age settlements and hillforts. In A Hundred Years of Archaeological Discoveries in Lithuania; Zabiela, G., Baubonis, Z., Marcinkevičiūtė, E., Eds.; Society of the Lithuanian Archaeology: Vilnius, Lithuania, 2016; pp. 160–181. [Google Scholar]
- Hillforts: Britain, Ireland and the Nearer Continent; Papers from the Atlas of Hillforts of Britain and Ireland Conference, June 2017; Lock, G.; Ralston, I. (Eds.) Archaeopress: Summertown, UK, 2019. [Google Scholar]
- Lasanta, T.; Beltrán, O.; Vaccaro, I. Differences in landscape evolution between two Pre-pyrenean municipalities (Alquézar and Valle de Lierp) during the second half of the 20th century. Pirineos 2013, 168, 103–128. [Google Scholar] [CrossRef] [Green Version]
- Huang, G. Modeling Urban Spatial Growth in Mountainous Regions of Western China. Mt. Res. Dev. 2017, 37, 367–376. [Google Scholar] [CrossRef]
- Ding, Y.; Peng, J. Impacts of Urbanization of Mountainous Areas on Resources and Environment: Based on Ecological Footprint Model. Sustainability 2018, 10, 765. [Google Scholar] [CrossRef] [Green Version]
- Blaschke, T. Object based image analysis for remote sensing. ISPRS J. Photogramm. Remote Sens. 2010, 65, 2–16. [Google Scholar] [CrossRef] [Green Version]
- Sevara, C.; Pregesbauer, M.; Doneus, M.; Verhoeven, G.; Trinks, I. Pixel versus object—A comparison of strategies for the semi-automated mapping of archaeological features using airborne laser scanning data. J. Archaeol. Sci. Rep. 2016, 5, 485–498. [Google Scholar] [CrossRef]
- Witharana, C.; Ouimet, W.B.; Johnson, K.M. Using LiDAR and GEOBIA for automated extraction of eighteenth–late nineteenth century relict charcoal hearths in southern New England. GISci. Remote Sens. 2018, 55, 183–204. [Google Scholar] [CrossRef]
- Davis, D.S.; Sanger, M.C.; Lipo, C.P. Automated mound detection using lidar and object-based image analysis in Beaufort County, South Carolina. Southeast. Archaeol. 2019, 38, 23–37. [Google Scholar] [CrossRef]
- Magnini, L.; Bettineschi, C.; De Guio, A. Object-based Shell Craters Classification from LiDAR-derived Sky-view Factor. Archaeol. Prospect. 2017, 24, 211–223. [Google Scholar] [CrossRef]
- Verhagen, P.; Drăguţ, L. Object-based landform delineation and classification from DEMs for archaeological predictive mapping. J. Archaeol. Sci. 2012, 39, 698–703. [Google Scholar] [CrossRef]
- Simplicity, Inference and Modelling; Zellner, A.; Keuzenkamp, H.A.; McAleer, M. (Eds.) Cambridge University Press: Cambridge, UK, 2002; ISBN 9780521803618. [Google Scholar]
- Crutchley, S. Light detection and ranging (lidar) in the Witham Valley, Lincolnshire: An assessment of new remote sensing techniques. Archaeol. Prospect. 2006, 13, 251–257. [Google Scholar] [CrossRef]
- Štular, B.; Kokalj, Ž.; Oštir, K.; Nuninger, L. Visualization of lidar-derived relief models for detection of archaeological features. J. Archaeol. Sci. 2012, 39, 3354–3360. [Google Scholar] [CrossRef]
- Burigana, L.; Magnini, L. Image processing and analysis of radar and lidar data: New discoveries in Verona southern lowland (Italy). STAR Sci. Technol. Archaeol. Res. 2017, 3, 490–509. [Google Scholar] [CrossRef] [Green Version]
- Chen, F.; Lasaponara, R.; Masini, N. An overview of satellite synthetic aperture radar remote sensing in archaeology: From site detection to monitoring. J. Cult. Herit. 2017, 23, 5–11. [Google Scholar] [CrossRef]
- Risbøl, O.; Gustavsen, L. LiDAR from drones employed for mapping archaeology—Potential, benefits and challenges. Archaeol. Prospect. 2018, 25, 329–338. [Google Scholar] [CrossRef]
- Crutchley, S. Using Airborn Lidar in Interpreting Archaeological Landscapes. In Detecting and Understanding Historic Landscapes; Chavarria Arnau, A., Raynolds, A., Eds.; SAP: Mantova, Italy, 2015; pp. 67–92. [Google Scholar]
- Petitta, M.; Wagner, J.; Costa, A.; Monsorno, R.; Innerebner, M.; Moser, D.; Zebisch, M. Solar Tyrol project: Using climate data for energy production estimation. The good practice of Tyrol in conceptualizing climate services. In Proceedings of the EGU General Assembly 2014, Vienna, Austria, 27 April–2 May 2014. [Google Scholar]
- Fu, P.; Rich, P.M. Design and implementation of the Solar Analyst: An ArcView extension for modeling solar radiation at landscape scales. In Proceedings of the Nineteenth Annual ESRI User Conference, San Diego, CA, USA, 26–30 July 1999; pp. 1–31. [Google Scholar]
- Fu, P.; Rich, P.M. The Solar Analyst 1.0 User Manual; Helios Environmental Modeling Institute: Reston, VA, USA, 2000. [Google Scholar]
- Fu, P.; Rich, P.M. A geometric solar radiation model with applications in agriculture and forestry. Comput. Electron. Agric. 2002, 37, 25–35. [Google Scholar] [CrossRef]
- Challis, K.; Forlin, P.; Kincey, M. A Generic Toolkit for the Visualization of Archaeological Features on Airborne LiDAR Elevation Data. Archaeol. Prospect. 2011, 18, 279–289. [Google Scholar] [CrossRef]
- Hesse, R. Visualisierung hochauflösender Digitaler Geländemodelle mit LiVT. In 3D-Anwendungen in der Archäologie: Computeranwendungen und quantitative Methoden in der Archäologie; Lieberwirth, U., Herzog, I., Eds.; Edition Topoi: Berlin, Germany, 2016; pp. 109–128. [Google Scholar]
- Kokalj, Ž.; Hesse, R. Airborne Laser Scanning Raster Data Visualization: A Guide to Good Practice; Zalozba ZRC: Ljubljana, Slovenia, 2017. [Google Scholar]
- Leonardi, G.; Ruta Serafini, M. L’abitato protostorico di Rotzo (Altipiano di Asiago). Preist. Alp. 1981, 17, 7–75. [Google Scholar]
- De Guio, A.; Bressan, C.; Ferrari, G.; Mantoan, R.; Gamba, M.; Migliavacca, M.; Padoan, C.; Nicosia, C. Bostel di Rotzo (VI)—stato di avanzamento delle ricerche. Quad. di Archeol. del Veneto 2011, 27, 168–183. [Google Scholar]
- Magnini, L.; Rovera, G.; De Guio, A.; Azzalin, G. Before and after the. In Military Geoscience in Peace and War; Bondesan, A., Ehlen, J., Eds.; Springer: Berlin/Heidelberg, Germany, under review.
- Tecchiati, U. Il frutto di un buio seme. Riflessioni sulla formazione del paesaggio antropizzato nel Neolitico e nell’età del Rame dell’alto bacino dell’Adige. Atti dell’Accademia Roveretana Degli Agiati 2012, 262, 61–102. [Google Scholar]
- Roghi votivi alpini. Archeologia e scienze naturali. In Alpine Brandopferplätze: Archäologische und naturwissenschaftliche Untersuchungen; Steiner, H., Ed.; Temi: Trento, Italy, 2010. [Google Scholar]
- Ballmer, A. Ritual Practice and Topographic Context. Considerations on the Spatial Forms of Memory in the Central Alps During the Late Bronze Age. In Between Memory Sites and Memory Networks. New Archaeological and Historical Perspectives; Hofmann, K.P., Bernbeck, R., Sommer, U., Eds.; Edition Topoi: Berlin, Germany, 2017; pp. 71–96. [Google Scholar]
- Rajala, U. The landscapes of power: Visibility, time and (dis)continuity in central Italy. Archeol. e Calc. 2004, 15, 393–408. [Google Scholar]
- Renfrew, C. Space, Time and Man. Trans. Inst. Br. Geogr. 1981, 6, 257–278. [Google Scholar] [CrossRef]
Figure 1.
Location of the two test-areas in the context of northern Italy. Coordinate system: Monte Mario Italy 1; projection: Transverse Mercator; EPSG: 3003.
Figure 1.
Location of the two test-areas in the context of northern Italy. Coordinate system: Monte Mario Italy 1; projection: Transverse Mercator; EPSG: 3003.

Figure 2.
Asiago Plateau case study: (a) annual solar radiation; (b) slope; (c) local dominance; and (d) segmented RGB composition of the three digital terrain model (DTM)-derived thematic maps in Figure 2a–c.
Figure 2.
Asiago Plateau case study: (a) annual solar radiation; (b) slope; (c) local dominance; and (d) segmented RGB composition of the three digital terrain model (DTM)-derived thematic maps in Figure 2a–c.

Figure 3.
Asiago Plateau case study: detail of the hillshade visualization showing in yellow the five image objects classified with the ruleset for the location of control places in Table 1. Each of them is associated with a reference letter which is used in Section 3.1.2. The biggest image object in the southern part of the area labeled as “E” corresponds to the Iron Age Village of Bostel (Rotzo Municipality, Vicenza, Italy).

Figure 4.
Brixen Basin case study: (a) annual solar radiation; (b) slope; (c) local dominance; and (d) segmented RGB composition of the three DTM-derived thematic maps in Figure 4a–c.
Figure 4.
Brixen Basin case study: (a) annual solar radiation; (b) slope; (c) local dominance; and (d) segmented RGB composition of the three DTM-derived thematic maps in Figure 4a–c.

Figure 5.
Brixen Basin case study: a base map showing the municipal borders (in red) and (a) the names of the municipalities reported in Table 3 and the extension of the 36 classified image objects (in yellow); (b) the 36 classified image objects, each associated with a progressive number (object-based predictive model (OBPM) label) used in the text. Specific data regarding the areas cataloged in the provincial GeoDatabase can be found in Table 3. Note that the classified image–objects nr. 4, 6, 12, 13, 16, 18, 21, 24, 25, 26, 29, 32, and 35 are not present in the provincial GeoDatabase and were thus subject to a remote check as validation procedure.

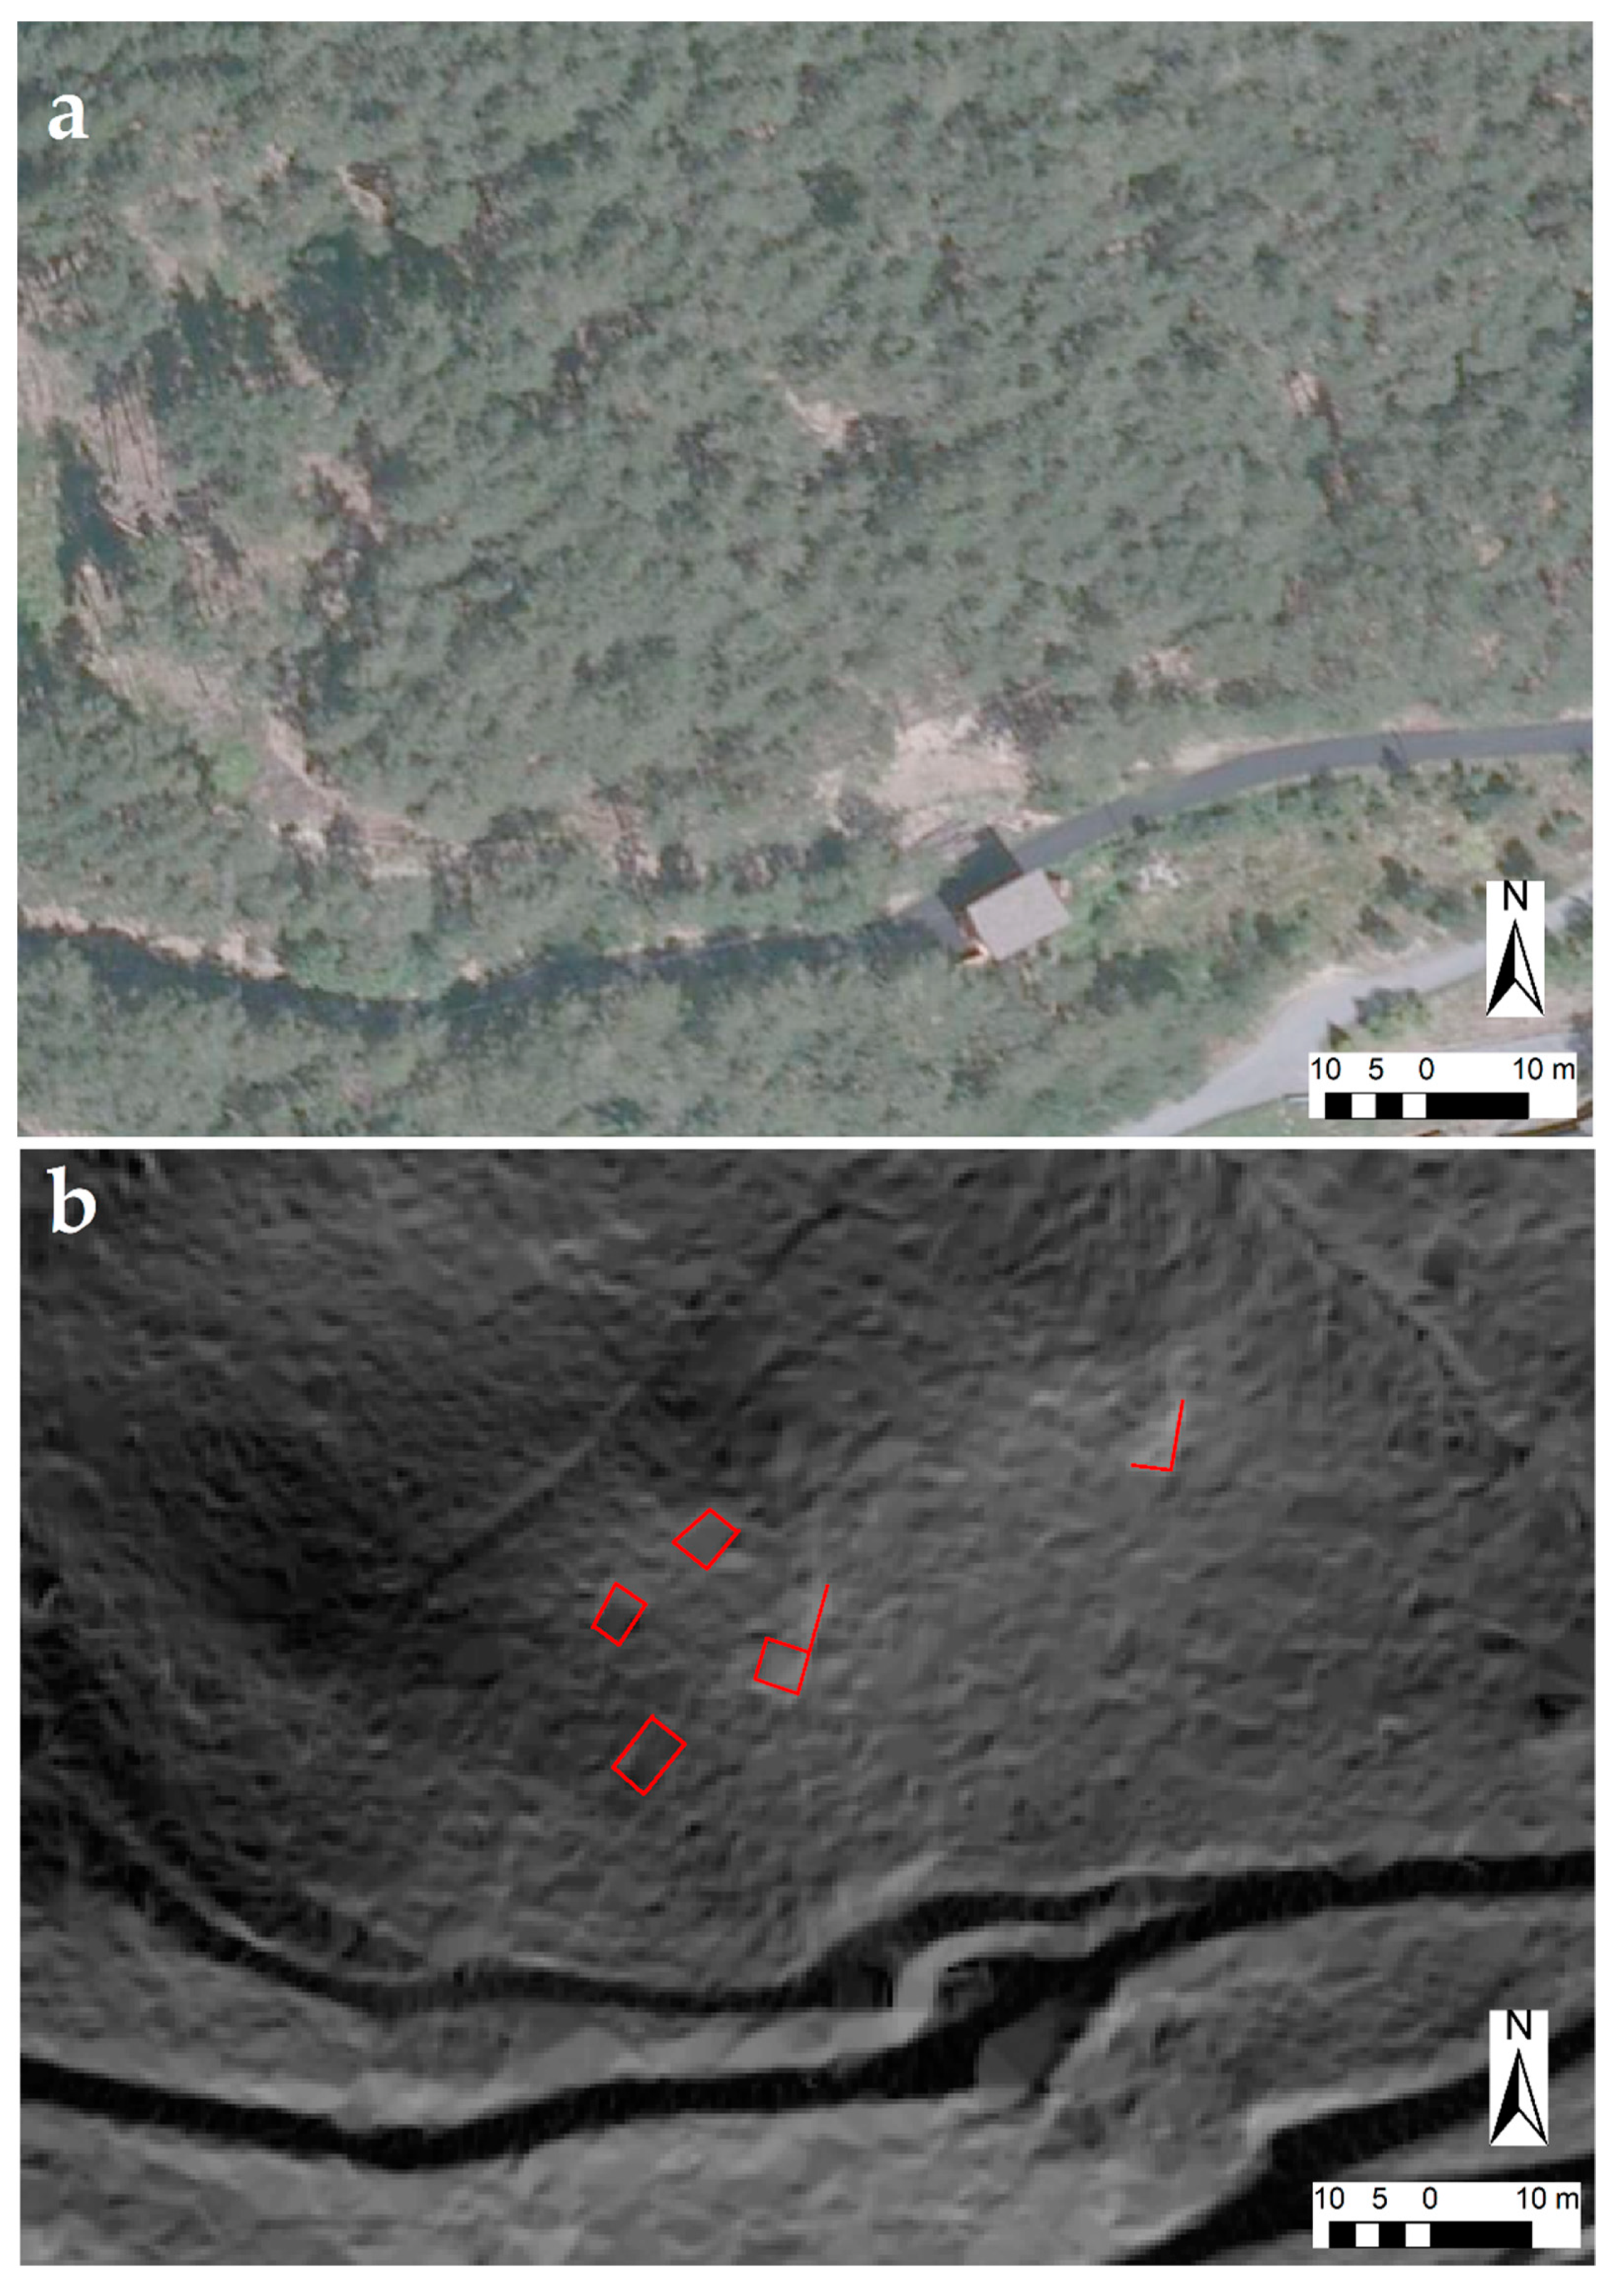
Figure 6.
Hilltop settlement of Aica/Col de Bovi. In yellow the perimeter of the image–object with OBPM label 7 (see Table 3 for further details). Very high-resolution (VHR) digital orthophoto (a) and photo-interpreted hillshade derived from 0.5 m resolution DTM-data (b) showing a series of previously unknown traces, possibly related to the protohistoric settlement.

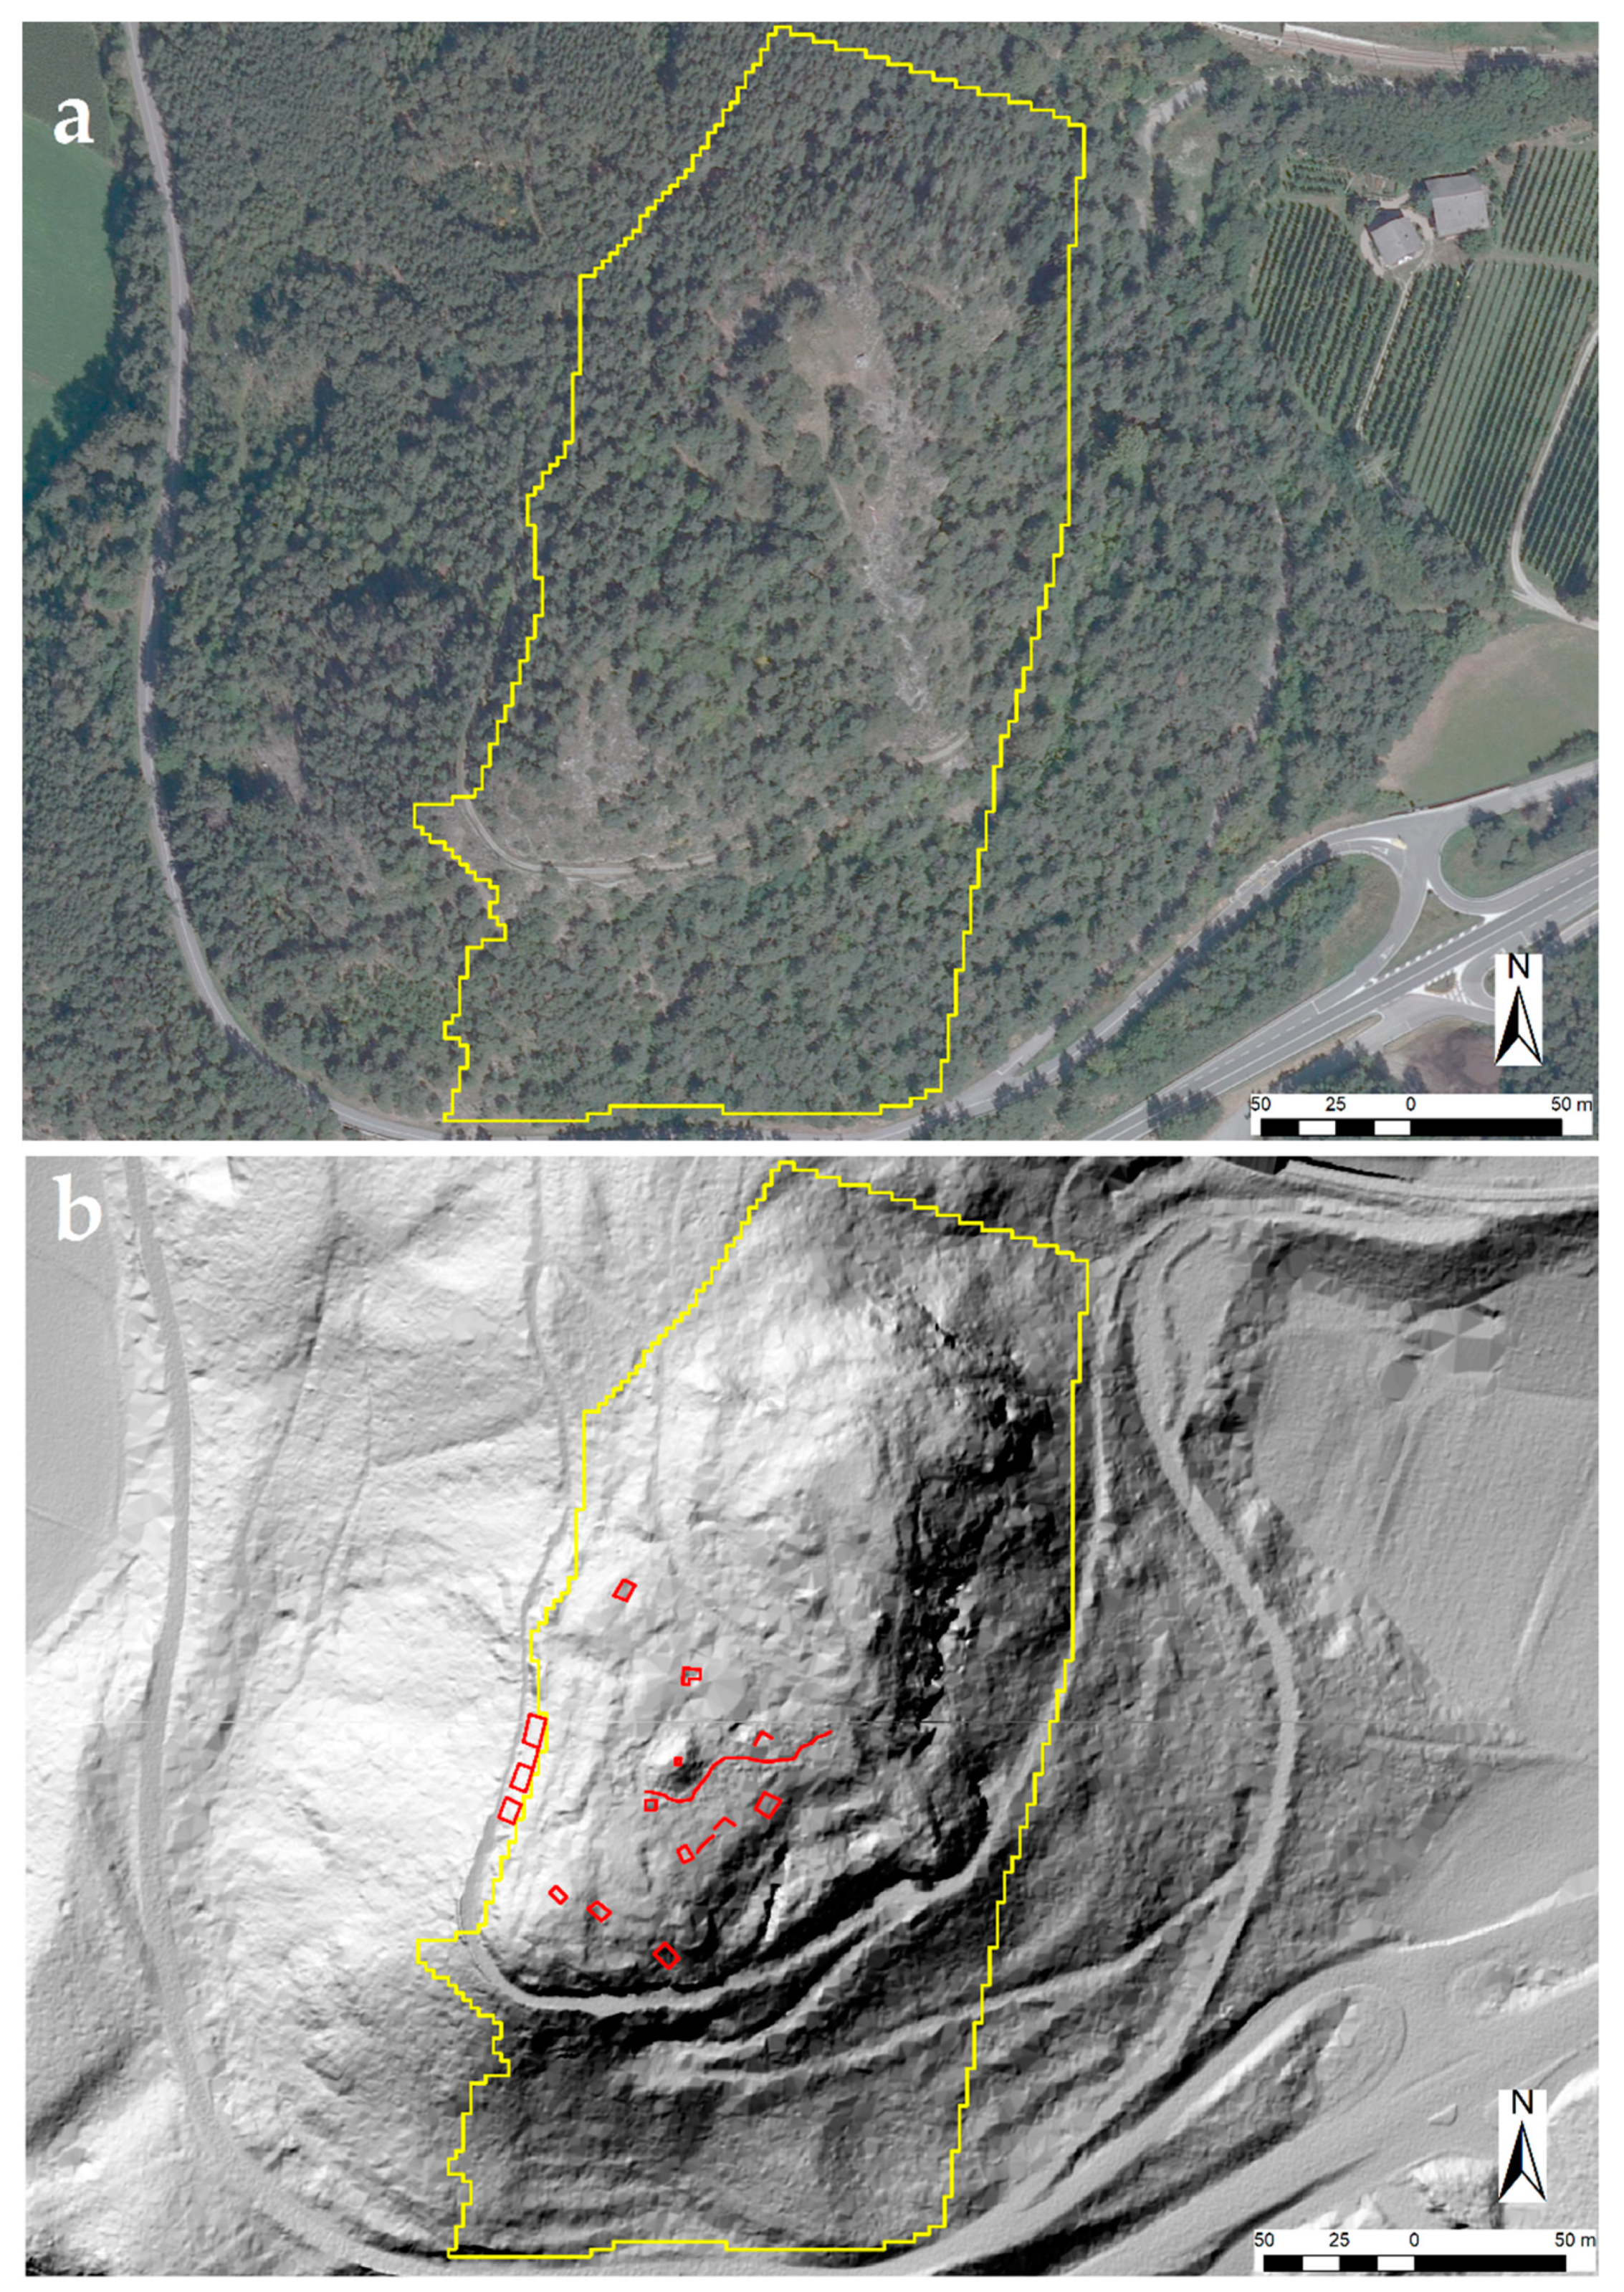
Figure 7.
Image-object with OBPM label 4—Rodengo/Rodeneck municipality. VHR digital orthophoto (a) and photo-interpreted hillshade derived from 0.5 m resolution DTM-data (b) showing a series of previously unknown traces, which confirm the anthropic exploitation suggested on the basis of the results of our predictive model.

Figure 8.
Image-object with OBPM label 12—Luson/Lusen municipality, area Kreuz. VHR digital orthophoto (a) and photo-interpreted slope derived from 0.5 m resolution DTM-data (b) showing a series of previously unknown traces, which confirm the anthropic exploitation suggested on the basis of the results of our predictive model.

Figure 9.
Chart representing the general workflow of an OBPM project.


Table 1.
Segmentation parameters and object-feature values of the proposed “control places” ruleset for the case study of the western Asiago Plateau.
Table 1.
Segmentation parameters and object-feature values of the proposed “control places” ruleset for the case study of the western Asiago Plateau.
| Multiresolution Segmentation: Scale 1200, Shape 0.1, Compactness 0.6 | |||
|---|---|---|---|
| Object Feature | Value | Class | |
| 1 | mean Solar Radiation | >= 1,285,123 kWh/m2 | CONTROL PLACES |
| 2 | CONTROL PLACES, mean Local Dominance | <55 | unclassified |
| 3 | CONTROL PLACES, mean Slope | >20° | unclassified |
| 4 | CONTROL PLACES, merge region | ||
| 5 | CONTROL PLACES, area | <0.2 ha | unclassified |
| 6 | unclassified, relative border to CONTROL PLACES | <0.3 (i.e., 30%) | CONTROL PLACES |
| 7 | CONTROL PLACES, merge region | ||
Table 2.
Segmentation parameters and object-feature values of the proposed “control places” ruleset for the case study of the Brixen Basin.
Table 2.
Segmentation parameters and object-feature values of the proposed “control places” ruleset for the case study of the Brixen Basin.
| Multiresolution Segmentation: Scale 2400, Shape 0.1, Compactness 0.6 | |||
|---|---|---|---|
| Object Feature | Value | Class | |
| 1 | mean Solar Radiation | >=158,300 kWh/m2 | CONTROL PLACES |
| 2 | CONTROL PLACES, mean Local Dominance | <17.5 | unclassified |
| 3 | CONTROL PLACES, mean Slope | >20° | unclassified |
| 4 | CONTROL PLACES, merge region | ||
| 5 | CONTROL PLACES, area | <0.2 ha | unclassified |
| 6 | unclassified, relative border to CONTROL PLACES | <0.3 (i.e., 30%) | CONTROL PLACES |
| 7 | CONTROL PLACES, merge region | ||
Table 3.
List of the 23 classified image objects that are also present in the provincial GeoDatabase including OBPM label (cfr. Figure 5b), name of the area, municipality, GeoDatabase ID(s) associated to the cadastral parcels, a short description and dating of the major and minor archaeological remains discovered.
| OBPM Label | Name of the Area | Municipality | Online Geodatabase Id(S) | Major Archaeological Remains | General Chronology | Minor Traces | General Chronology |
|---|---|---|---|---|---|---|---|
| 1 | Stiflerbüel or Stögerbühel | Naz-Sciavez/Natz-Schabs | 21614327 | surface material distribution | Bronze Age and Early Iron Age | - | - |
| 2 | Rodengo Castle | Rodengo/Rodeneck | 21649697; 21642609 | castle, later extension | Medieval | material distribution | Protohistory to Roman |
| 3 | Rodengo Castle | Rodengo/Rodeneck | 21628626; 21631007; 21612983; 21655613; 21658019; 21676634; 21660416; 21626015; 21618125; 21619378; 21612720; 21645618; 21654733; 21655423; 21649930; 21622501; 21640581; 21620275; 21624337 | church and cemetery | Medieval | material distribution | Protohistory to Roman |
| 5 | Cornale/Kirchbühel | Bressanone/Brixen | 21612550; 21634087 | hilltop settlement | Bronze Age | - | - |
| 7 | Aica-Col de Bovi | Naz-Sciavez/Natz-Schabs | 21661532; 21670409 | hilltop settlement | Bronze Age | - | - |
| 8 | Fiumes-Kirchbüel | Naz-Sciavez/Natz-Schabs | 21674639; 21672063 | hilltop settlement | Bronze Age | - | - |
| 9 | Fiumes-Maulwaldeck o Roßhimmel | Naz-Sciavez/Natz-Schabs | 21620759 | surface material distribution | Protohistory | - | - |
| 10 | Rodengo Castle | Rodengo/Rodeneck | 21628626; 21622264 | castle courtyard | Medieval | material distribution | Protohistory to Roman |
| 11 | Rodengo Castle | Rodengo/Rodeneck | 21653466; 21630408; 21673989; 21672850; 21651806; 21644875; 21670468; 21635340; 21621561; 21617352 | original castle | Medieval | material distribution | Protohistory to Roman |
| 14 | Punterbüel | Varna/Vahrn | 21620955 | probable hilltop settlement | Bronze Age | - | - |
| 15 | Nössing | Varna/Vahrn | 21633653; 21674031 | hilltop settlement | Bronze Age | - | - |
| 17 | Spelonca-Burgstallegg | Varna/Vahrn | 21658649; 21666306 | hilltop settlement (seasonal) | Bronze Age | - | - |
| 19 | Cornale/Putzerbühel | Bressanone/Brixen | 21616908; 21655385; 21669110; 21613253; 21621018; 21647169; 21661089; 21673685 | hilltop settlement | Bronze Age | - | - |
| 20 | Castel Salern | Varna/Vahrn | 21628477; 21676800 | castle | Medieval | - | - |
| 22 | Costa di Elvas—area 1 | Bressanone/Brixen | 21630412; 21629787; 21662848; 21615239; 21635779; 21644823; 21643693; 21619324; 21657864; 21650608 | hilltop settlement | Bronze Age to early Roman | - | - |
| 23 | Spelonca-Voisberg | Varna/Vahrn | 21611693 | castle | Medieval | settlement | Bronze Age |
| 27 | Elvas/Vogeltenne | Bressanone/Brixen | 21651445; 21663945 | cemetery | Bronze Age | - | - |
| 28 | Colcucco di Sotto /Guggenbichl | Bressanone/Brixen | 21650517; 21617271; 21652450; 21623748; 21659820; 21611063 | hilltop settlement | Bronze Age | - | - |
| 30 | Costa di Elvas—area 2 | Bressanone/Brixen | 21628640 | hilltop settlement | Bronze Age and Iron Age | - | - |
| 31 | Scaleres | Varna/Vahrn | 21610641; 21653486; 21675537; 21625715; 21656715; 21676522; 21672543 | church (St. Wolfgang) | Modern (XV cent. AD) | - | - |
| 33 | Pinatz—hilltop settlement | Bressanone/Brixen | 21618455; 21619461; 21643393; 21654211 | hilltop settlement | Bronze Age | - | - |
| 34 | Pinatz | Bressanone/Brixen | 21673425; 21626481; 21653094; 21615521; 21630815; 21630712; 21669106 | material distribution | Bronze Age | - | - |
| 36 | Tiles | Bressanone/Brixen | 21626665 | church (St. Cirillo) | Medieval | - | - |
Publisher’s Note: MDPI stays neutral with regard to jurisdictional claims in published maps and institutional affiliations. |
© 2021 by the authors. Licensee MDPI, Basel, Switzerland. This article is an open access article distributed under the terms and conditions of the Creative Commons Attribution (CC BY) license (http://creativecommons.org/licenses/by/4.0/).
Share and Cite
MDPI and ACS Style
Magnini, L.; Bettineschi, C. Object-Based Predictive Modeling (OBPM) for Archaeology: Finding Control Places in Mountainous Environments. Remote Sens. 2021, 13, 1197. https://0-doi-org.brum.beds.ac.uk/10.3390/rs13061197
AMA Style
Magnini L, Bettineschi C. Object-Based Predictive Modeling (OBPM) for Archaeology: Finding Control Places in Mountainous Environments. Remote Sensing. 2021; 13(6):1197. https://0-doi-org.brum.beds.ac.uk/10.3390/rs13061197
Chicago/Turabian StyleMagnini, Luigi, and Cinzia Bettineschi. 2021. "Object-Based Predictive Modeling (OBPM) for Archaeology: Finding Control Places in Mountainous Environments" Remote Sensing 13, no. 6: 1197. https://0-doi-org.brum.beds.ac.uk/10.3390/rs13061197
Note that from the first issue of 2016, this journal uses article numbers instead of page numbers. See further details here.