
UAV Recognition Based on Micro-Doppler Dynamic Attribute-Guided Augmentation Algorithm


1
Department of Informatics, Xiamen University, Xiamen 361001, China
2
Department of Electronic Science and Engineering, Xiamen University, Xiamen 361001, China
3
College of Engineering, Tibet University, Lhasa 850000, China
4
Department of Electrical Engineering, Wright State University, Dayton, OH 45435, USA
*
Author to whom correspondence should be addressed.
Remote Sens. 2021, 13(6), 1205; https://0-doi-org.brum.beds.ac.uk/10.3390/rs13061205
Submission received: 16 February 2021
/
Revised: 14 March 2021
/
Accepted: 18 March 2021
/
Published: 22 March 2021
(This article belongs to the Special Issue Remote Sensing Data and Classification Algorithms)
Abstract
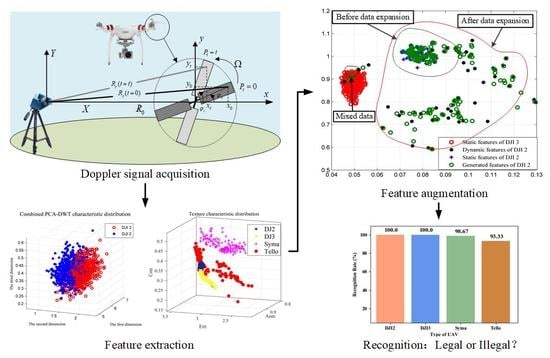
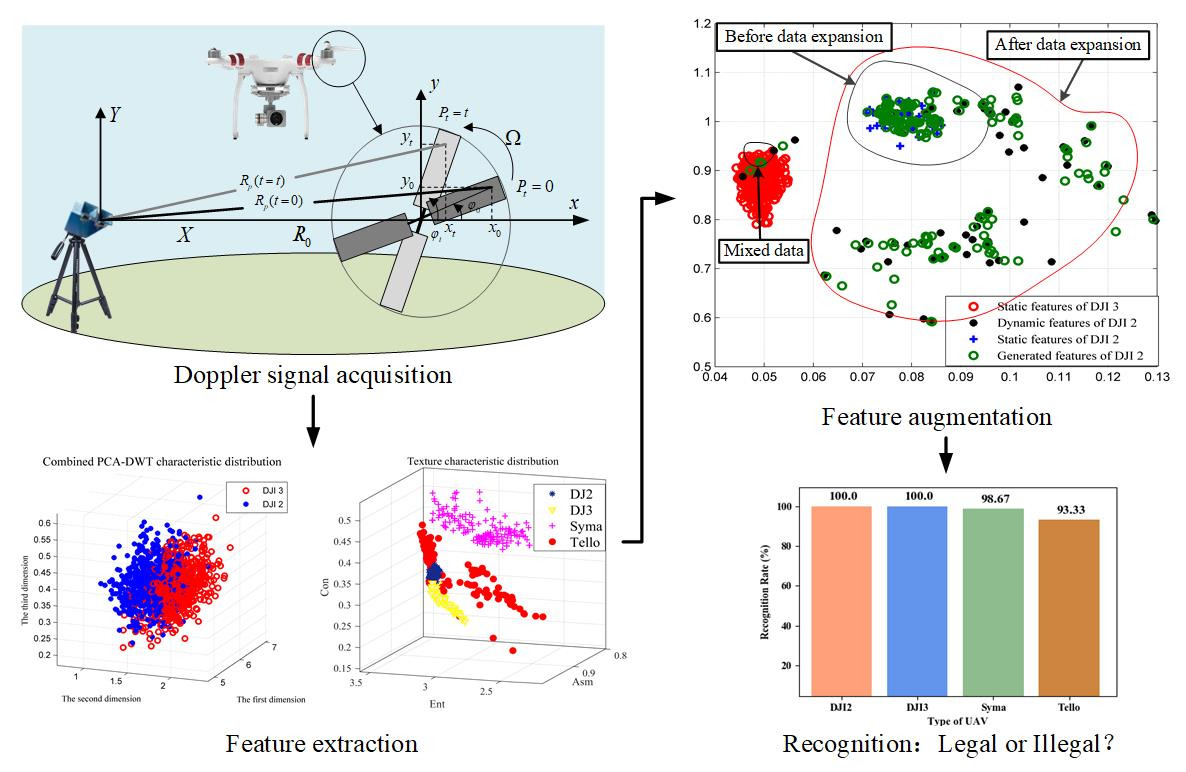
:A micro-Doppler signature (m-DS) based on the rotation of drone blades is an effective way to detect and identify small drones. Deep-learning-based recognition algorithms can achieve higher recognition performance, but they needs a large amount of sample data to train models. In addition to the hovering state, the signal samples of small unmanned aerial vehicles (UAVs) should also include flight dynamics, such as vertical, pitch, forward and backward, roll, lateral, and yaw. However, it is difficult to collect all dynamic UAV signal samples under actual flight conditions, and these dynamic flight characteristics will lead to the deviation of the original features, thus affecting the performance of the recognizer. In this paper, we propose a small UAV m-DS recognition algorithm based on dynamic feature enhancement. We extract the combined principal component analysis and discrete wavelet transform (PCA-DWT) time–frequency characteristics and texture features of the UAV’s micro-Doppler signal and use a dynamic attribute-guided augmentation (DAGA) algorithm to expand the feature domain for model training to achieve an adaptive, accurate, and efficient multiclass recognition model in complex environments. After the training model is stable, the average recognition accuracy rate can reach 98% during dynamic flight.
1. Introduction
In recent years, the number of small UAVs has grown exponentially due to their significant improvement of flight performance, low cost, and easy manipulation. UAVs are widely applied in professional photography, shooting, agricultural applications, and disaster search-and-rescue [1]. They are used for criminal activities such as invasion, reconnaissance, and transport of explosives [2]. However, due to their small size, slow flying speed, and low flying altitude, UAVs are easily blocked by buildings or misjudged as birds, so they are not easy to detect. Regardless of whether small UAVs are used in military or civil fields, these characteristics will pose a considerable threat to security. As a result, the market demand for stable and reliable small UAVs monitoring systems is snowballing.
Among the numerous radar signal processing technologies, the analysis of the target’s m-DS is the most commonly used method, and the micro-Doppler signal generated by the rotors can also be used to identify UAVs [3]. In [4], the feasibility of detecting and identifying small UAVs based on the fuselage and the characteristics of rotors’ rotation was confirmed. The radar cross-section (RCS) and micro-Doppler profile of four-rotor and eight-rotor UAVs are measured, and the m-DS of UAV rotating blades are analyzed. Simulation and experimental results of electromagnetic scattering from rotor blades of small UAVs are given in [5]. The changes in these reflections as functions of variables such as polarization, frequency, and azimuth angle Doppler components under different polarization conditions are analyzed. The method proposed in [6] studies the feasibility of the m-DS’s extraction of UAV rotors under the non-line-of-sight condition of radar. It can also detect m-DS of rotors, revolutions per minute, and rotor type.
The focus of small UAV detection and recognition based on micro-Doppler features is to model and analyze flight status, extract micro-Doppler features, and select a classification model [7]. The classification performance is also affected by different variables, including different rotors, the presence or absence of loads, and even the Doppler shift caused by the vibration of birds’ wings, which will also lead to the decrease of UAV identification accuracy. In [8], the authors extracted the physical features from the radar time velocity diagrams, and used a boosting classifier to distinguish UAV and birds, confirming that the micro-Doppler radar has a broad prospect in UAV target detection and classification. In [9], the authors introduced the use of multistatic radar and micro-Doppler analysis technology to detect and identify UAVs. The classification accuracy of hovering small drones is greater than 90%. Feature extraction methods, such as singular value decomposition (SVD) and empirical mode decomposition (EMD), are used in [10,11]. The complexity of SVD algorithm is too high, whereas the EMD algorithm has the problem of modal aliasing. A convolutional neural network classification model based on spectral diagram and cadence velocity diagram is proposed in [12], which achieves a 94.7% recognition rate of two types of UAVs.
The above feature-based small drone’s detection and recognition require a large amount of data to train the model. However, the data collection process not only takes time but also leads to a deviation of the original features due to dynamic changes of UAVs, such as vertical, pitch, forward and backward, roll, lateral, yaw, and other movements. In the process of extracting the UAVs m-DS, the dynamic changes may affect the feature distribution, so it is difficult to collect the UAV signals in all cases. The data can be augmented by expanding the feature domain [13]. Jian et al. [14] studied the m-DS that can be used to identify small UAVs and found that the angular micro-Doppler feature can be used as a supplementary feature to identify small UAVs. In the field of image recognition, data extension algorithms can be used for reference. In [15], the authors proposed a data augmentation generation adversarial network (DAGAN) for data expansion and proved its effectiveness through experiments. Nevertheless, deep learning methods, such as generating adversarial networks, will increase the complexity of the model. In [16], to solve related problems in the field of image processing, an attribute-based augmentation (attribute-guided augmentation, AGA) algorithm was proposed to deal with the phenomenon of feature deviation caused by different radial distances between the observer and the target by projecting the image into the attribute space for data augmentation. Chawla et al. [17] proposed a synthetic minority oversampling technique (SMOTE) upsampling algorithm to solve the problem of constructing a classifier in the case of imbalanced data sets, which can improve the sensitivity of the classifier to a small number of classes.
In this paper, we use the combination of feature attribute enhancement and machine learning algorithms to solve the problems with difficulty in identifying targets, poor robustness to scene transformation, and insufficient adaptive ability. The related methods of feature extraction and migration and expansion domain are investigated to form an intelligent recognition model that can adaptively, accurately, and efficiently cope with complex multiclassification environments. While reducing the complexity, the DAGA algorithm effectively expands the training domain of the signals and achieves the recognition of small dynamic UAVs in the case of multiclassification of small samples. When the number of dynamic samples reaches 300, the model reaches a stable state with an average recognition rate of 97.75%.
The rest of this article is organized as follows. In the second section, we describe and analyze the micro-Doppler signals of small UAVs. In the third section, the m-DS detection and recognition algorithm based on DAGA is developed. In the fourth section, feature extraction and analysis of UAV micro-Doppler signals are performed, including combined PCA-DWT features and texture features. In the fifth section, experiments are carried out to verify the effectiveness of the proposed algorithm and test the performance of small UAV recognition in the flight process under the condition of insufficient dynamic features. Conclusions are given in the last section.
2. Micro-Doppler Signature Model of Small UAVs
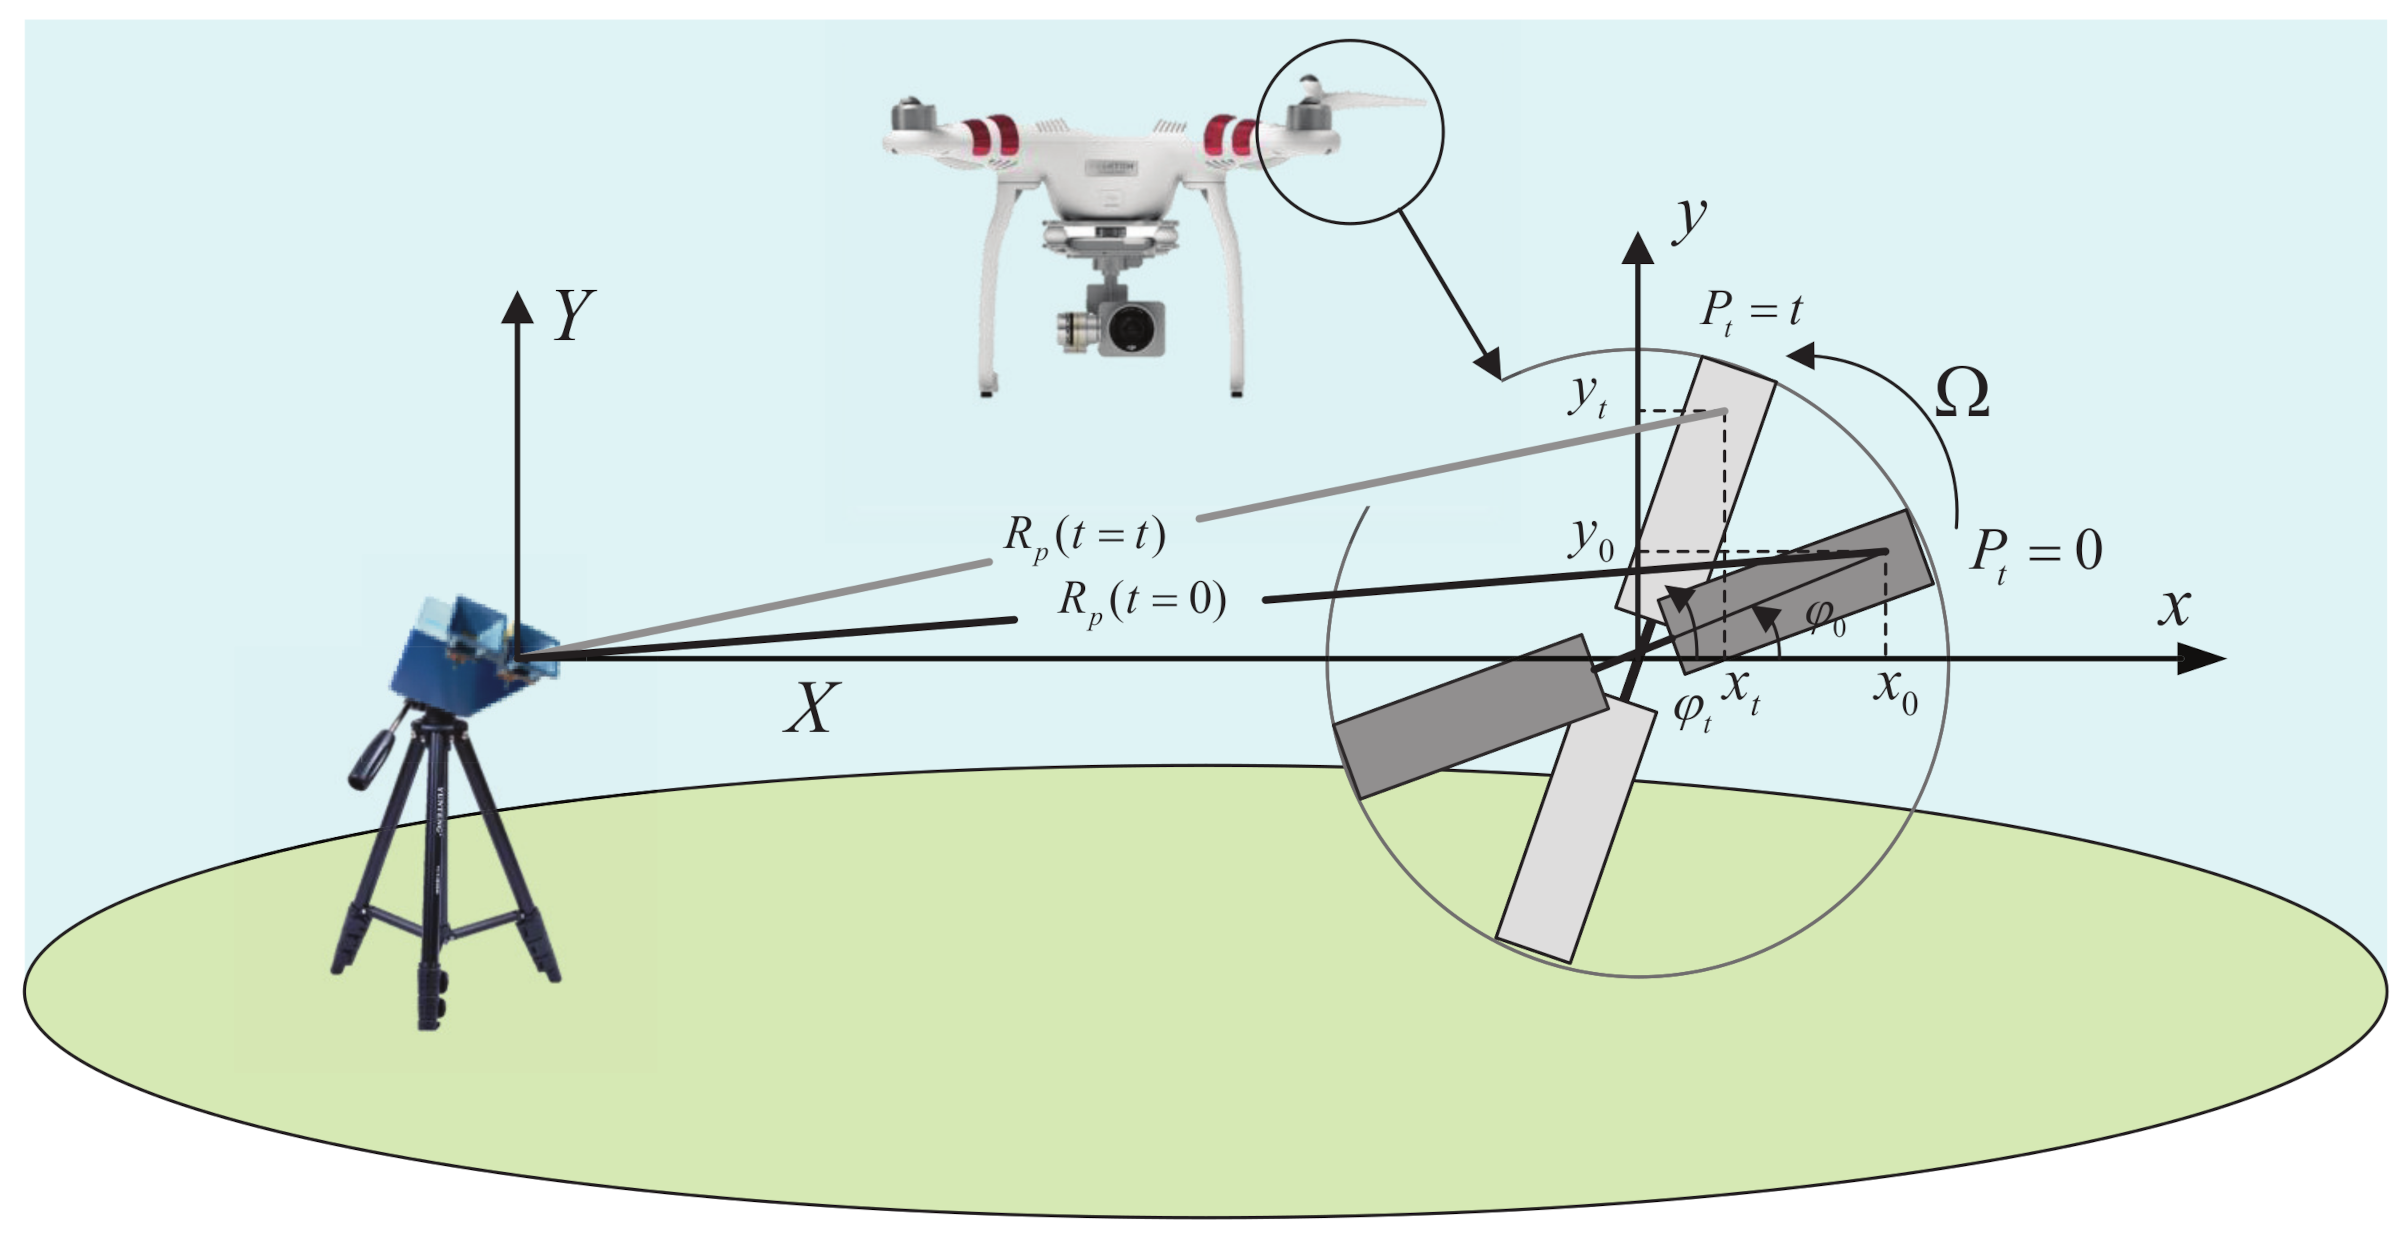
Doppler frequency shift is recognized to be a unique feature of targets with vibration, rotation, or other nonuniform motions [18]. From the perspective of electromagnetic scattering, each blade of the rotor is composed of scattering centers. Each scattering center is considered as a point with a particular reflectivity. For simplicity, assume that the same reflectivity is assigned to all scattering centers, as shown in Figure 1. Take point P on the blade as an example: the blade of the UAV rotates in an angular velocity around the z-axis. The distance from the radar to the blade center is . As the initial rotation angle of the UAV changes from to , the blade will generate a Doppler modulation on the echo. The m-DS generated by the rotating target can then be used for classification and recognition of UAVs. Next, we will discuss the m-DS model of the rotor blade of small UAVs.
2.1. Analysis of a Micro-Doppler Model of UAVs
The radar sends electromagnetic signals to the small UAVs and receives the echo signals. If the UAV is moving, the frequency of the received signals will deviate from that of the transmitted signal, resulting in a Doppler frequency shift. At the same time, the rotation of the UAV rotor causes additional frequency modulation on the echo signal. It generates side frequencies near the Doppler shift frequency of the transmission signal, which is generated by the main part movement. This is called the micro-Doppler effect [19]. The radar uses micro-Doppler effect to detect the micromotion characteristics of small UAV rotors, which can be extracted by a quadrature-phase detector. The quadrature phase detector generates the in-phase component I and quadrature-phase component Q from the input signal. The received signal is as in (1) [19].
In (1), A is the amplitude of the received signal, is the carrier frequency of the transmitted signal, is the Doppler frequency shift, and is the phase shift on the received signal caused by small movement of the rotating rotor of the UAV. By mixing transmission signals with (2) [19] and combining I and Q outputs, a micro-Doppler complex output signal can be obtained, as shown in (3) [19].
The complex output signal in (3) can be used to extract and analyze the m-DS of small UAVs. The conventional methods of analyzing micro-Doppler signals are instantaneous frequency analysis and joint time–frequency analysis. When a small multirotor UAV is used for target recognition, its micro-Doppler signal is a multicomponent signal with prominent time–frequency characteristics. The instantaneous frequency analysis only provides one frequency value at a time, which is not suitable for the signal with different oscillation frequency components at the same time. The traditional Fourier transform cannot provide the time-related spectrum description. Therefore, the joint time–frequency method is considered in this paper to extract and analyze the m-DS.
2.2. Rotor Echo Modeling for UAV
For UAVs, the echoes are superimposed by several single rotor echoes. In the entire radar coordinate system, the distance between the rotors is relatively small and can be ignored. Therefore, according to the helicopter rotor model [19], the echo signal model of the small UAV rotor is represented in (4) [20].
The phase formula is as follows:
where and N indicate the number of drone rotors and the number of single rotor blades, respectively, and is the rotor blade length. is the distance from the radar to the center of the ith blade. indicates the height of the ith rotor blade. , , and represent the pitch angle of the radar to the center of the ith rotor, the rotation frequency, and the initial rotation angle of the ith rotor, respectively.
Rotating characteristics of rotor blades are essential features for identifying UAVs. The short-time Fourier transform is used to generate a joint time–frequency transform to obtain the m-DS of the rotating blades. The number and phase of the characteristic curve are related to the number of blades. Therefore, from the characteristics, information such as the number of blades, the length of the blades, and the rotation speed of the rotor can be estimated.
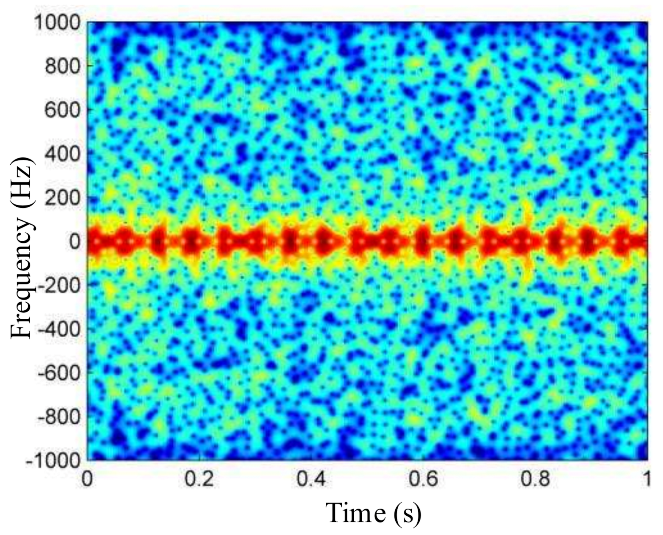
As shown in Figure 2, the m-DS spectrum of the rotating rotor of UAVs’ blades has unique periodicity characteristics, which can be used to estimate the rotation speed of the rotor for later feature analysis and state estimation. According to the sampling parameter of the radar and the periodicity of the rotating rotor, the rotation rate of the rotor in the hovering state can be calculated. As shown in (6), and T indicate the periodic time and the total sampling time, respectively. is the number of periodic sampling points and N is the total number of sampling points.
Take DJI Phantom2 and DJI Phantom3 produced by DJI Innovation Technology Co., Limited as examples. Both products have a pair of propellers, including a pair of positive and negative blades, and the diameter of each blade is 24 cm. The rotation rate is approximate 30–40 r/s. In general, the bird’s wing rate is not higher than 15 r/s, which is much lower than the rotation rate of the UAV rotor. Therefore, the rate estimation can be used as a first step to distinguish small UAVs from birds.
2.3. Dynamic Characteristics Analysis of UAV Micro-Doppler
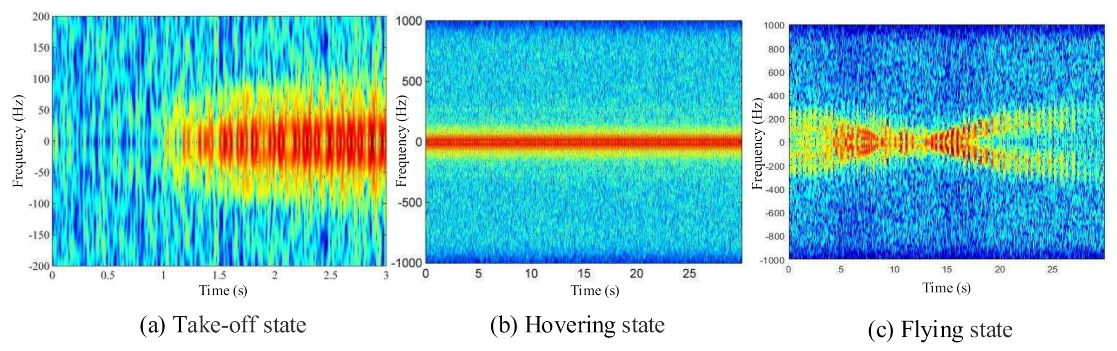
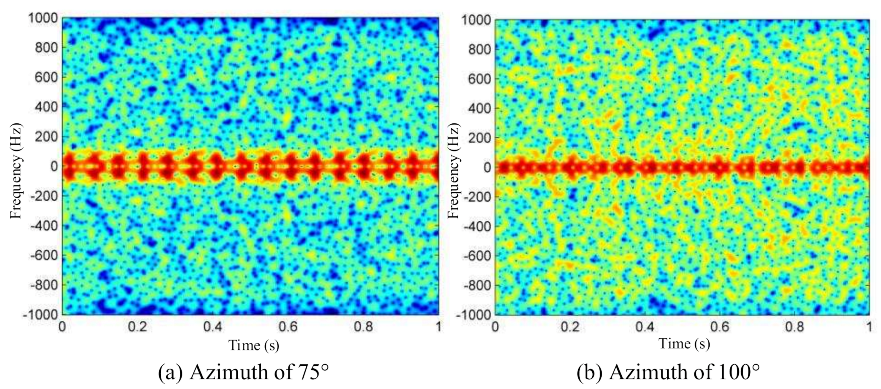
The amplitude and phase of the m-DS curve of the UAV are easily affected by the flight status and initial phase. The UAV m-DS in different states is shown in Figure 3. Figure 3a shows the UAV’s m-DS during takeoff; it can be seen that the rotor speed is gradually accelerating, and the period is correspondingly changed and eventually converges to a stable value. Figure 3b,c show the m-DS of the UAV in hovering and flying state, respectively. When the UAV is flying freely in the air, its m-DS will change significantly with the change of azimuth angle. Figure 4 illustrates the m-DS of UAV at different azimuth angles in flying state.
It can be observed from these figures that the period and amplitude of these features are affected by the rotor speed, angle, and distance of the received signal. It is difficult to collect m-DS covering all conditions because the attitude of the UAV varies greatly when it flies freely in the air. Therefore, it is necessary to realize effective identification of UAV in dynamic flight without sufficient features.
3. UAV Recognition Based on Dynamic Attribute-Guided Augmentation Algorithm
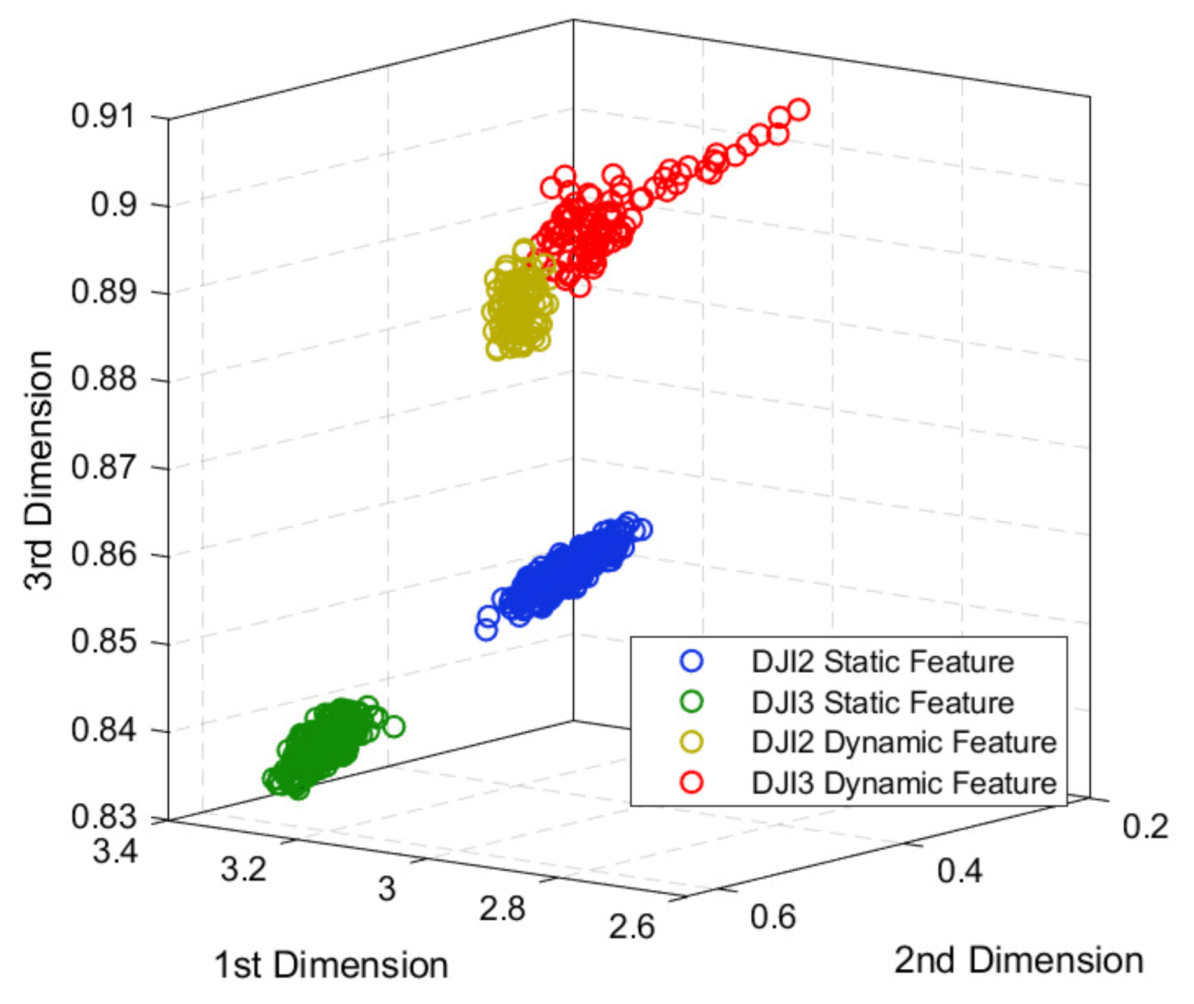
In practice, the sneaky behavior and changeable flight status of the UAVs make their feature distribution change. Figure 5 takes texture features as an example, and we take the first three dimensions for visualization. Among them, the static and dynamic features of DJI Phantom 2 and DJI Phantom 3 are concentrated in different areas, and the dynamic features of different drones are closer. We define the features acquired by hovering UAVs as static features, and by flying UAVs with various gestures as dynamic features. Therefore, it is not enough to train the model using only static features. Dynamic features need to be considered as well. However, due to the complex flight status of UAVs, such as vertical, pitch, and roll, dynamic features are difficult to be collected completely, and it is difficult to train a suitable model based on the small number of existing dynamic features. In this paper, a DAGA algorithm is proposed to achieve UAV recognition during flight. Specifically, by learning the mapping of the data, the DAGA algorithm generates synthetic samples and enhances the feature attributes.
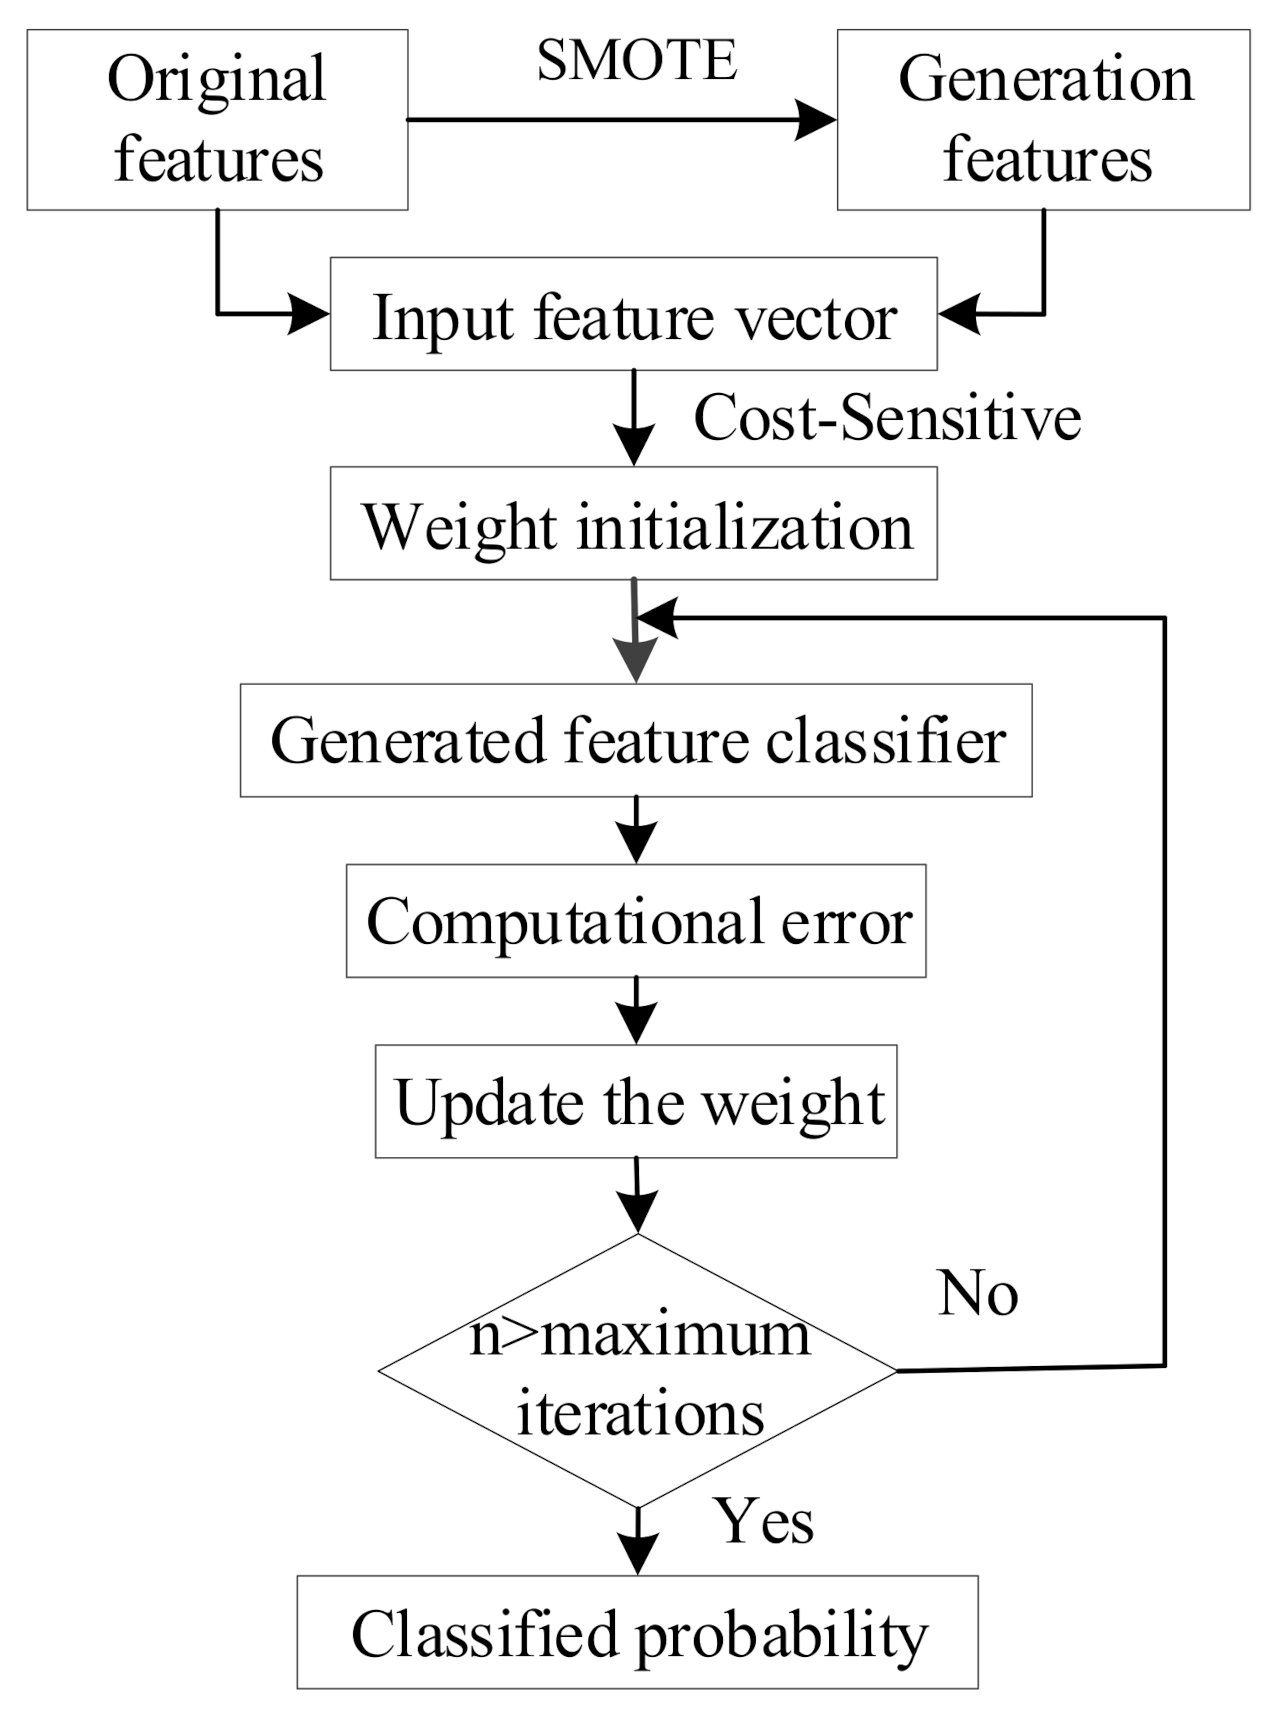
When training a small sample multiclass model, we can expand the training domain by generating new dynamic features of UAVs. Commonly used multisample synthesis methods include the SMOTE algorithm [17], hard example mining algorithm [21], and neighborhood risk minimization [22]. The SMOTE algorithm is a frequently-used upsampling method in image data expansion. In this paper, SMOTE algorithm is adopted to expand the training domain of dynamic samples on the feature level, as shown in Figure 6. The dynamic features and static features of a UAV are taken as the original features, and the generation features are obtained through the nearest neighbor interpolation between them. Next, the weights of the generation features are set according to a cost-sensitive algorithm [23], and the input feature vector is formed together with the original feature to train the classifier. Until the training times n reaches the maximum iterations and the model is stable, the training process ends and the final classification result is obtained.
Assume that a training set has two classes, which are defined as a minority class and a majority class according to the number of class samples. The number of samples of the minority class and the majority class is T and , respectively. Take a sample i from the minority class, whose feature vector is , and M is the dimension of i. k nearest neighbors (in regard of Euclidean distance) of the are found from all the T sample feature vectors of the minority class and recorded as . A sample feature vector is randomly selected from the k neighbors, and a new feature vector is synthesized from the random number using (7).
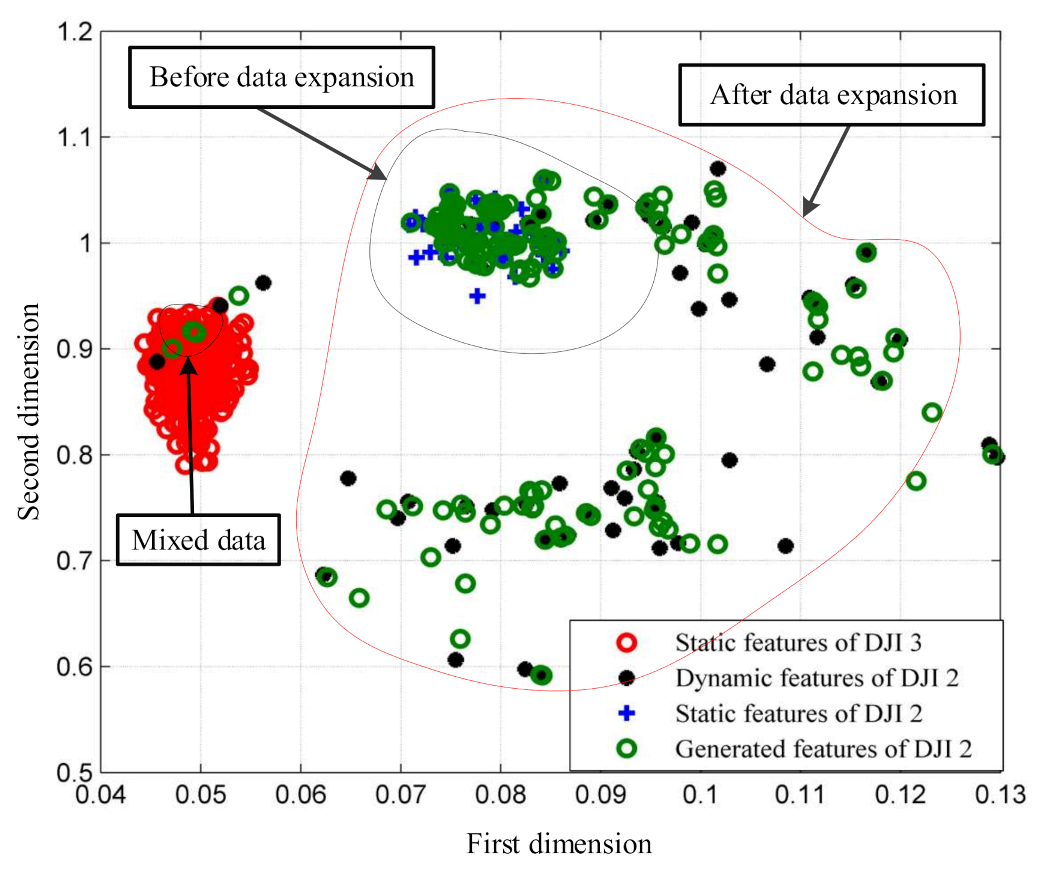
The sampling rate is set according to the sample imbalance ratio N of the minority class and the majority class. A new feature vector is synthesized for each sample in the minority class. The effect of data expansion is shown in Figure 7. DJI Phantom 2 is attributed to a minority class, whereas DJI Phantom 3 to a majority class. The feature samples of DJI Phantom 2, including static and dynamic features, are fed to the model. Note that there are far more static features than dynamic features, and the total number of feature samples of DJI Phantom 2 is much smaller than the number of samples of DJI Phantom 3. Next, we generate synthesized DJI Phantom 2 features according to the imbalance ratio.
The SMOTE algorithm is prone to the problem of distribution marginalization, and artificial samples will increasingly be on the edge of the sample set, making the boundaries of different categories blurred. As shown in Figure 7, some of the generated features of DJI Phantom 2 will overlap with the static features of DJI Phantom 3, and it is necessary to discard such features through further feature selection.
Let us calculate the Euclidean distances of the k nearest neighbor feature vectors of the feature vector in the same group and different groups, denoted as and , respectively. The formula is as follows:
By comparing the values of and , we set the initial weight of the feature vector as 0.5, if is higher than . Otherwise, we set it as 0, and the initial weights of the original samples as 0.5. The generated dynamic samples and the original samples are fed to different classifiers. The final classification results are obtained after the model is trained stably. The classifiers can be replaced according to the requirements of the actual scenario. Here, we chose k-nearest neighbor (k-NN) [24] and support vector machine (SVM) [25] for comparison. For k-NN, the parameter called nearest neighbors is set to the default value 5. As for SVM, the penalty parameter of a SVM is set to 1.0, and the kernel function is the radial basis kernel function. The kernel function of SVM is shown in (10).
Then, we use the AdaBoost algorithm [26] to select appropriate features to update the feature vector library and classifier, as described in (11), where is the error rate and is the weight of the classifier. If the classification probability is higher than the previous classification probability, the weight is updated following (12) and (13) until the training error rate becomes 0 or a specified number of training iterations is reached.
The resulting classifier is shown in (14), where is the weight coefficient, is the classification probability of the classifier, and is the final total classification result.
DAGA combines the idea of cost-sensitive algorithm and ensemble learning to help solve the classification problem of unbalanced category proportion. It can avoid overfitting under the training of few samples and improve the generalization performance of classifier.
4. Micro-Doppler Signature Extraction of UAV
Existing methods for analyzing m-DS include time–frequency analysis, image processing, orthogonal matching pursuit decomposition, empirical mode decomposition (EMD), and high-order moment function analysis [27]. Among them, the orthogonal matching pursuit decomposition [28] method and EMD method [3] are mainly used for signal decomposition and reconstruction. In the process of feature extraction, there are too many parameters to be searched and the calculation time is too long. The high-order moment function analysis [29] method can extract m-DS features in the form of rotation and vibration, but the method has poor antinoise performance. Considering the complexity and practicability of the algorithm, this paper extracts the PCA-DWT feature and texture feature of the UAV Doppler signal from the perspective of time–frequency analysis and image processing, and selects a better feature for UAV recognition through comparison.
4.1. Feature Extraction Based on Combined PCA-DWT
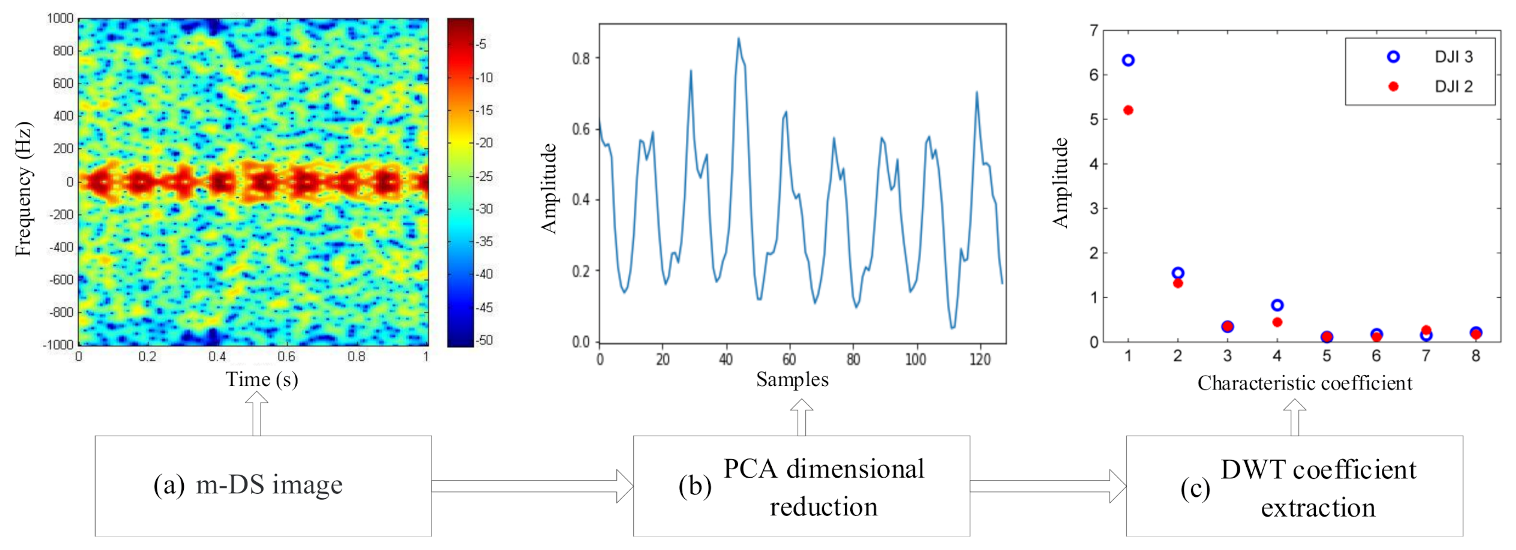
The UAV m-DS is intercepted in one cycle and reduced to one dimension by PCA to obtain the signal features in the time domain. Then DWT is performed to extract eight feature values. The specific signal extraction process is shown in Figure 8, where Figure 8a illustrates a partial m-DS image with a dimension of 128 × 512, and the signal of Figure 8b has a dimension of 128 × 1 after being reduced by PCA. Figure 8c is the 8 × 1 characteristic coefficient obtained after DWT.
The purpose of PCA dimensionality reduction is to extract the high-frequency components of the signal and reduce the data complexity while minimizing the loss of information. Suppose there are n UAV m-DS samples , the dimension of each sample data is , and the sample data are mapped to the subspace of and decentralized, as shown in (15). In this article, A =128, p =512, and .
The calculation of the covariance matrix is shown in (16), where X is the centralized data, is a symmetric matrix, and the eigenvalue decomposition is performed on the covariance matrix .
The eigenvalue is obtained, and the proportion of the first k eigenvalues representing the total variance of the data is . A projection matrix is formed by selecting as the feature vector, and the original sample is projected onto the new feature space to obtain a new dimension-reduced sample with the dimension .
After PCA dimensionality reduction, DWT feature extraction is performed on the UAV sample features. Assume that the UAV micro-Doppler signal after dimension reduction is , and the wavelet transform is shown in (17).
In (17), is the wavelet base coefficient, represent the frequency resolution and time shift, respectively. Perform finite layer decomposition on the signal, as shown in Equation (18).
where is the approximate component and is the detail component.
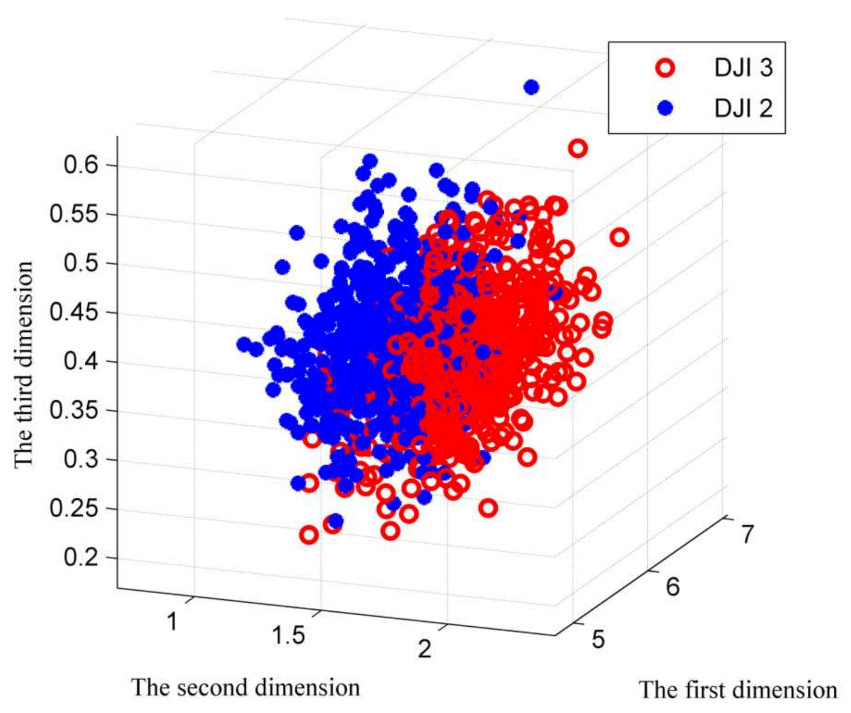
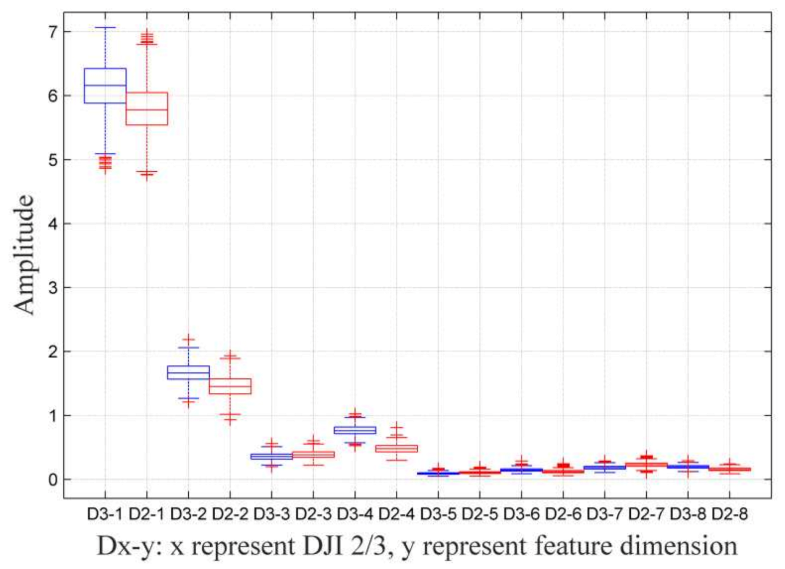
The wavelet coefficient can express the energy distribution of the micro-Doppler signal of small UAV in the time domain and the frequency domain. After the wavelet transform, classification is performed and the norm of the approximate coefficient array node is obtained, i.e., . Eight nodes are considered in this paper. We compare the wavelet features of DJI Phantom 2 and DJI Phantom 3. Although the two UAVs have the same rotating blades, DJI Phantom 3 rotates faster and has higher stability than DJI Phantom 2. As a direct result, the UAV ’s m-DS are clearly distinguishable, as shown in Figure 9 and Figure 10. Among them, Figure 9 is a three-dimensional visualization diagram of PCA-DWT features and Figure 10 is a statistical box diagram of PCA-DWT features.
4.2. Texture Feature Extraction Based on Micro-Doppler Signal
In image processing, mathematical morphological image methods such as Hough change are used to perform edge detection to extract signal contours and other important micromotion features. The differences in drones and rotors will result in different texture features, so the feature matrix formed by the texture features can be used to recognize small UAVs.
When m-DS is processed as time–frequency images, texture features of the images can be analyzed for drones of different flight states and types. In the analysis of texture features, the gray-level co-occurrence matrix (GLCM) [30] can be used to calculate the distribution of the image to distinguish different textures. Commonly used ones include angle second moment (ASM), correlation, contrast, and incomplete difference matrix (IDM). In this paper, we use these four statistics as the characteristics of micro-Doppler signals.
(1) ASM can measure the uniformity of gray distribution and texture thickness of m-DS of small UAVs. When the m-DS texture distribution is uniform and regular, the ASM is small. In (19), is a micro-Doppler feature image, i and j are image dimensions. When the performance of the small UAV is more stable, then the ASM obtained is smaller; otherwise, the ASM is larger.
(2) Correlation measures the similarity of m-DS of small UAVs in the row or column direction and exhibits the local gray-scale correlation in the image. The higher the change in the micro-Doppler image, the stronger the correlation is. When the flying state of the small drone changes, the more the image changes, the higher the correlation is. The correlation can be represented by (20).
(3) Contrast can measure the sharpness of the m-DS of small drones and the depth of the grooves in the texture. The clearer the texture, the greater the contrast is. Correspondingly, the higher the contrast is, the clearer the visual effect is. In (21), when the small drone is farther away from the radar, the more the image noise is, the larger the contrast Con is, and vice versa.
(4) The IDM shows the tightness of the elements in the m-DS image of the small UAV regarding the diagonal distribution. It can measure the sharpness and regularity of the micro-Doppler texture features of small UAVs. When the texture is clear and regular, the homogeneity value is high, as denoted through (22). When the small UAV is in a static state such as hovering, the stronger the regularity of the m-DS, the larger the IDM is.
After obtaining the texture features of the m-DS, a four-dimensional feature matrix can be formed by (23).
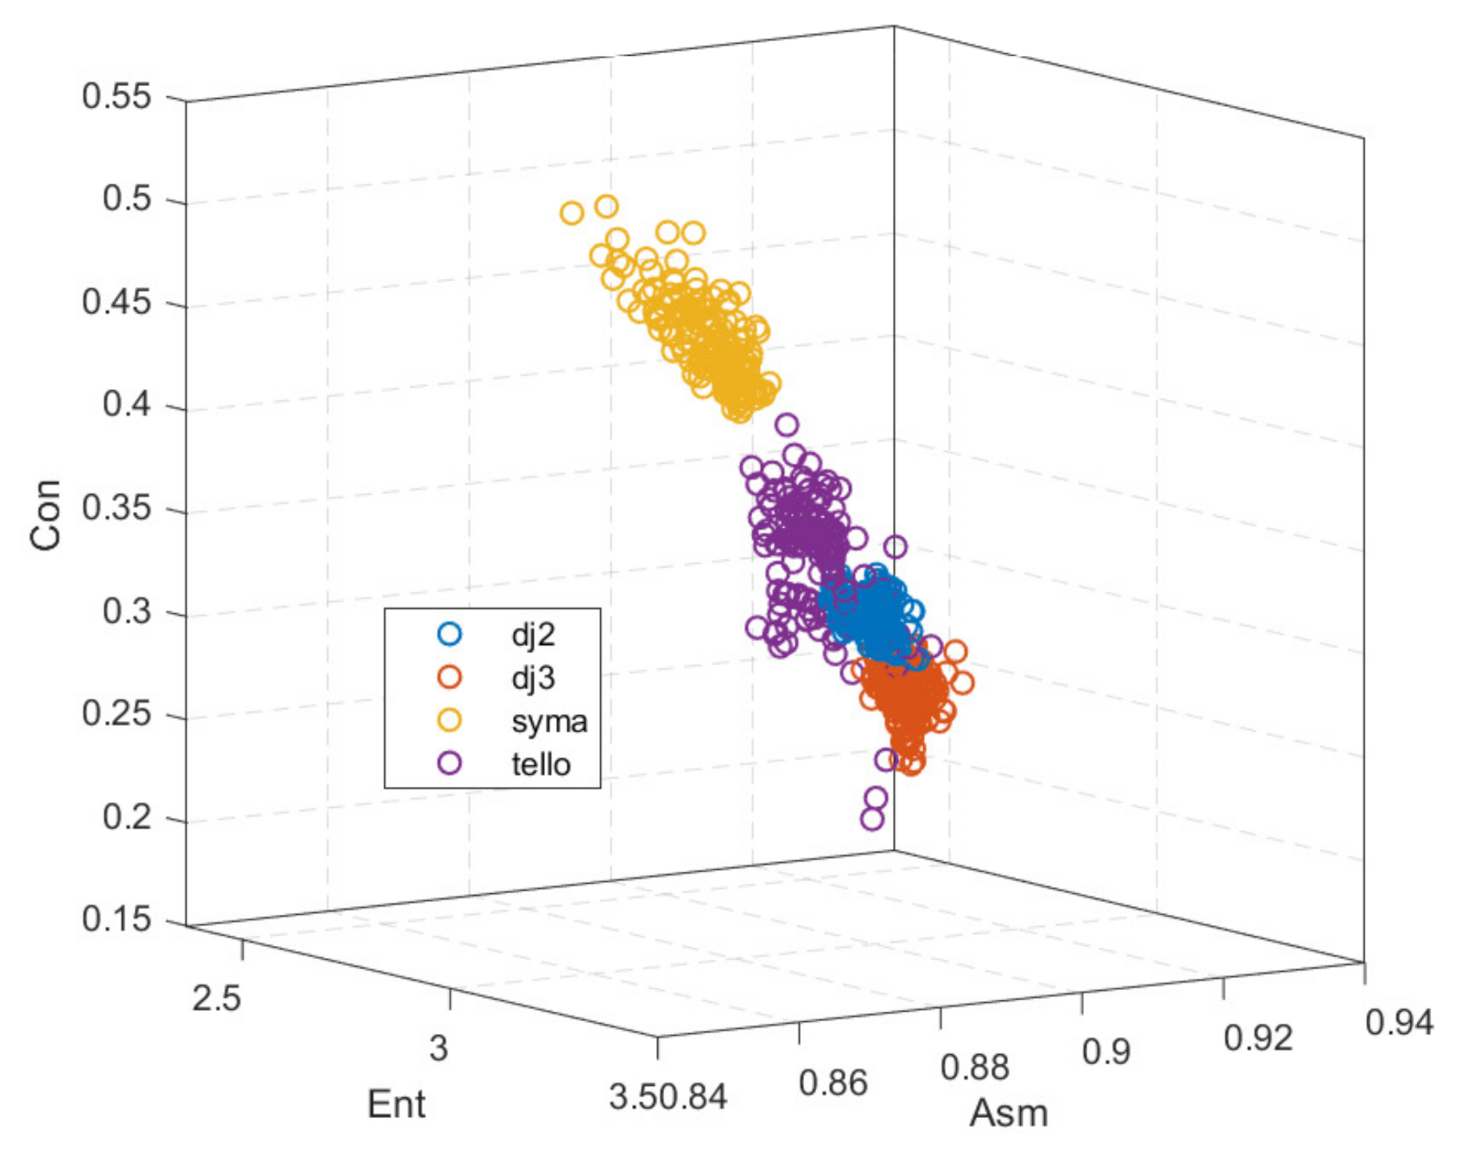
An example of 3D feature visualization of texture features of the UAV micro-Doppler image is shown in Figure 11. The drone models include DJI Phantom 2, DJI Phantom 3, SYMA, and TELLO.
5. Experiment
In this section, the performance of the algorithm is experimentally verified. Figure 12 shows the framework of the dynamic feature attribute enhanced recognition model.
5.1. Signal Acquisition and Analysis
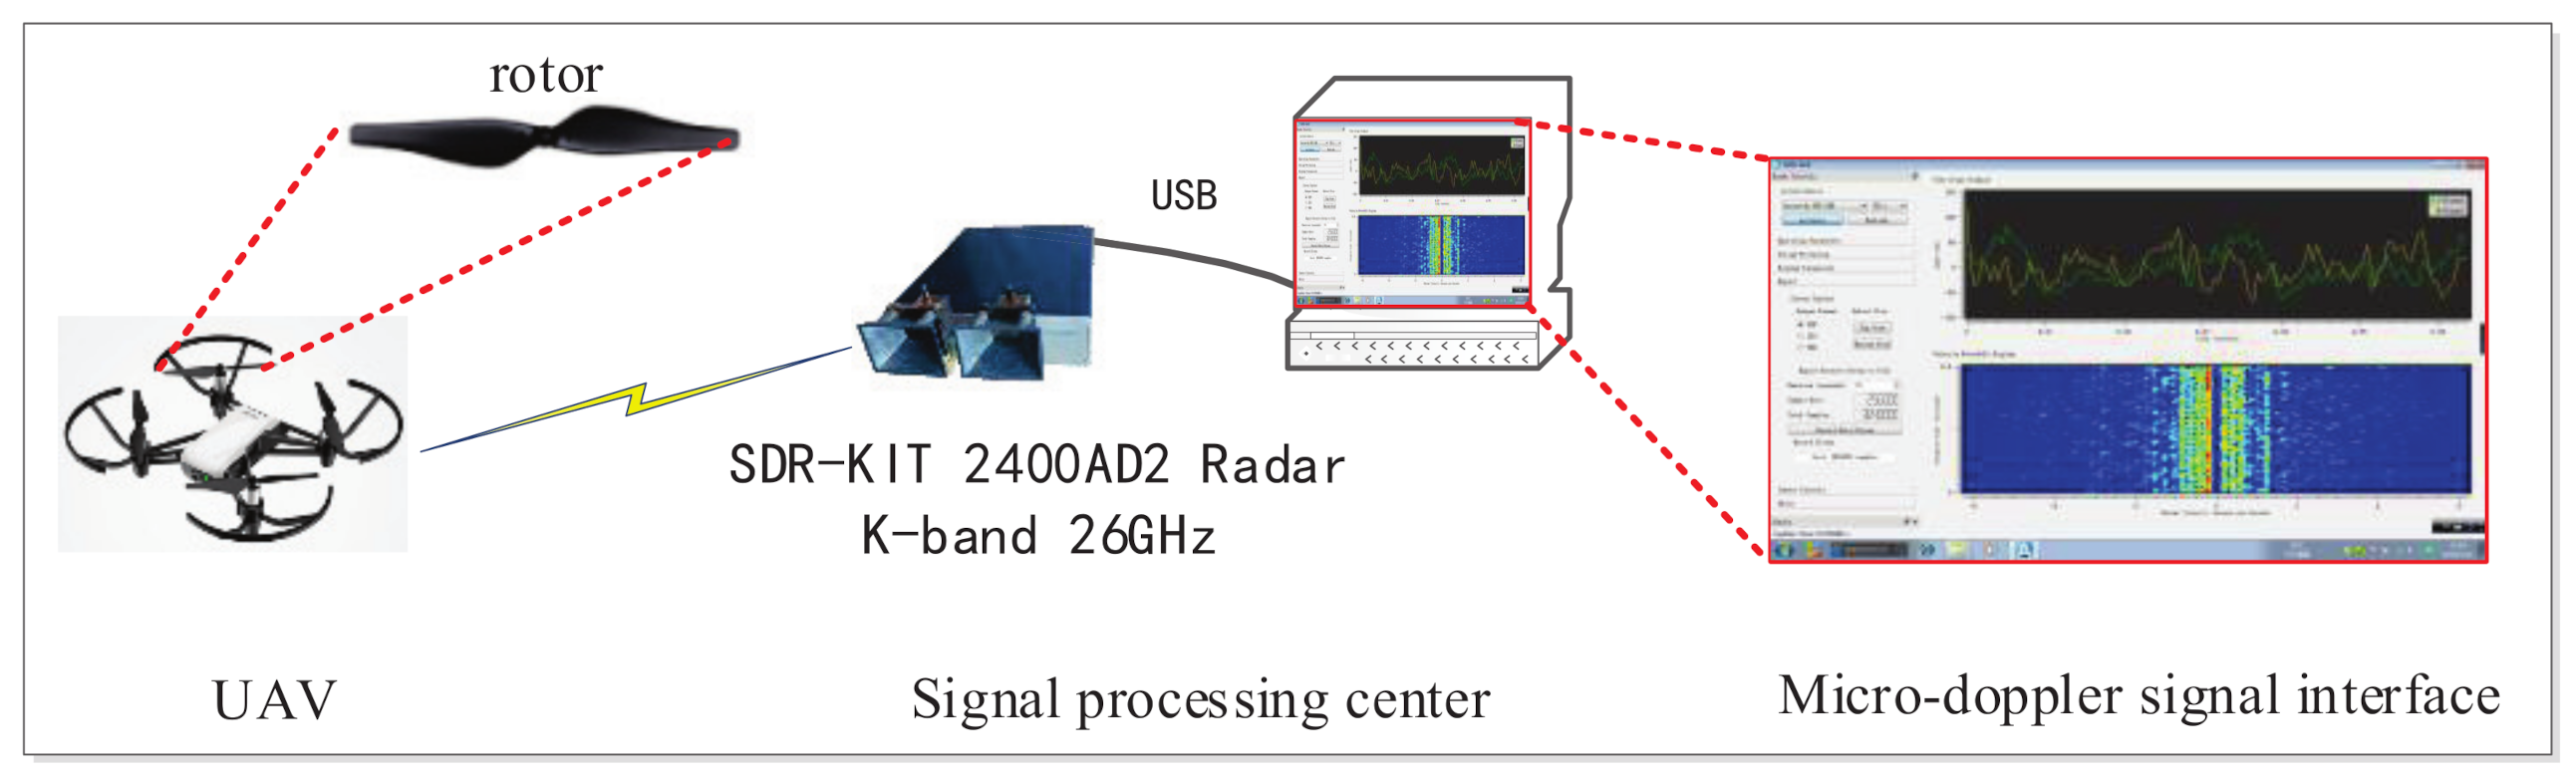
The experiments used different types of drones for testing, including DaJiang Innovation Phantom 2/3(DJI 2/3), SYMA remote drones, and Tello aerial drones. The radar model used in the experiment is SDR-KIT 2400AD2. The scanning time was set to 1 ms to reduce the impact of the UAV rotor speed on the m-DS. The number of sampling points was set to 128 to reduce the computational complexity. The signal acquisition block diagram is shown in Figure 13, and the quantitative analysis is performed by collecting the characteristics of a single rotary rotor of a UAV.
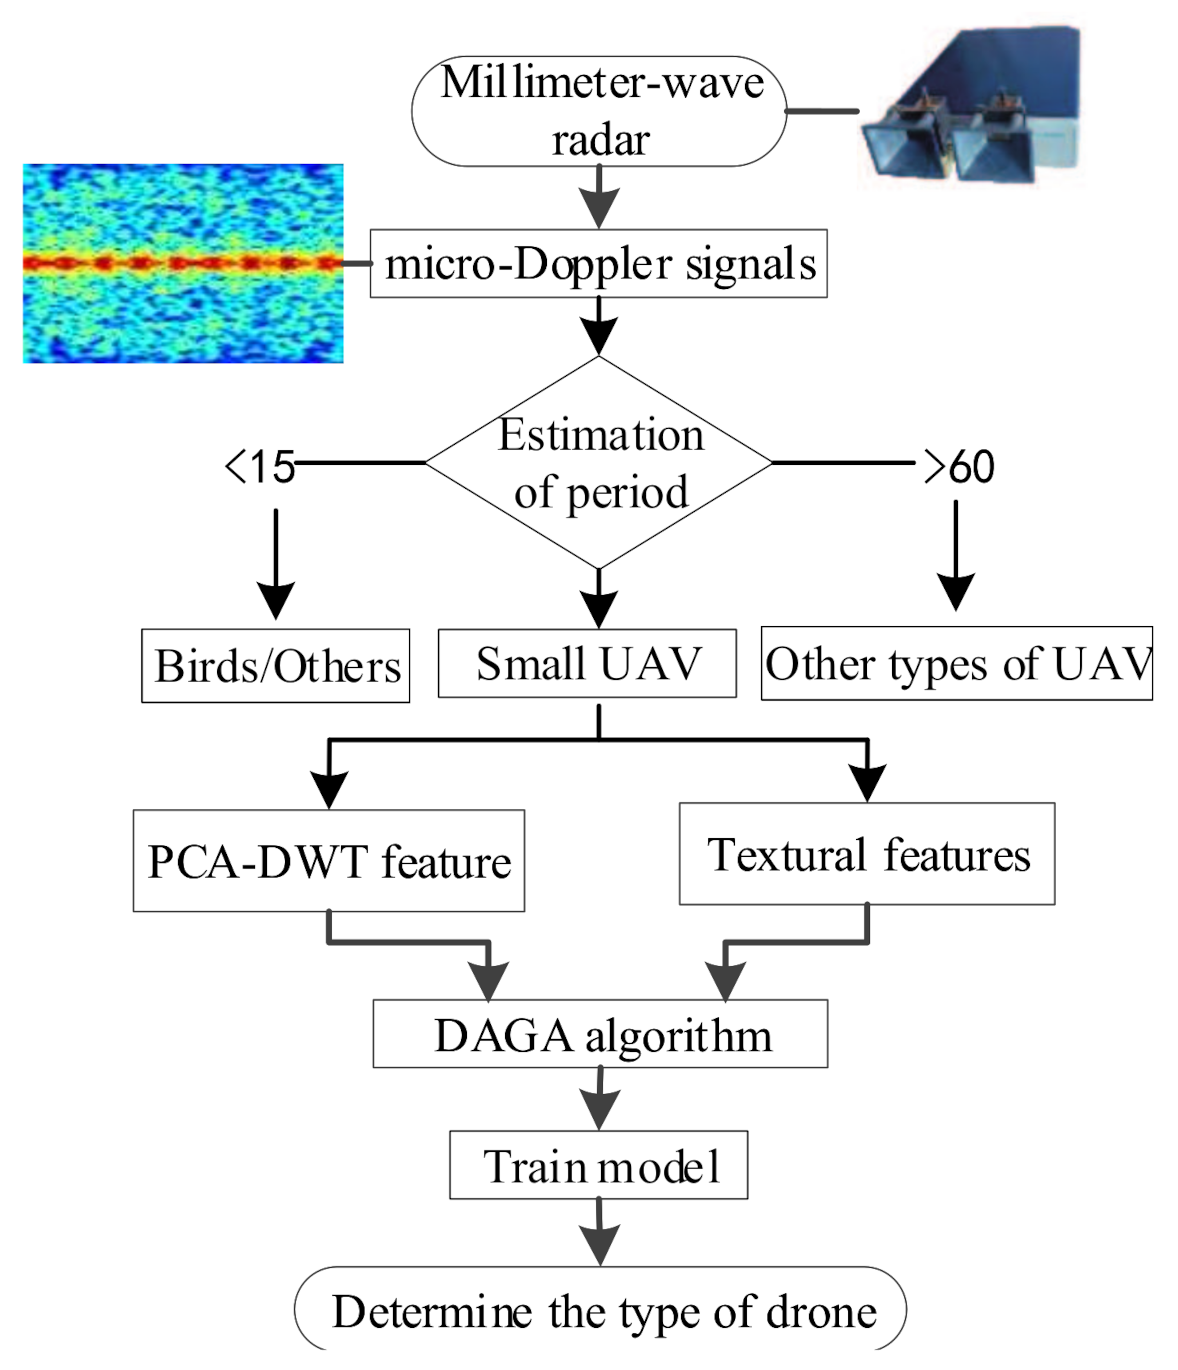
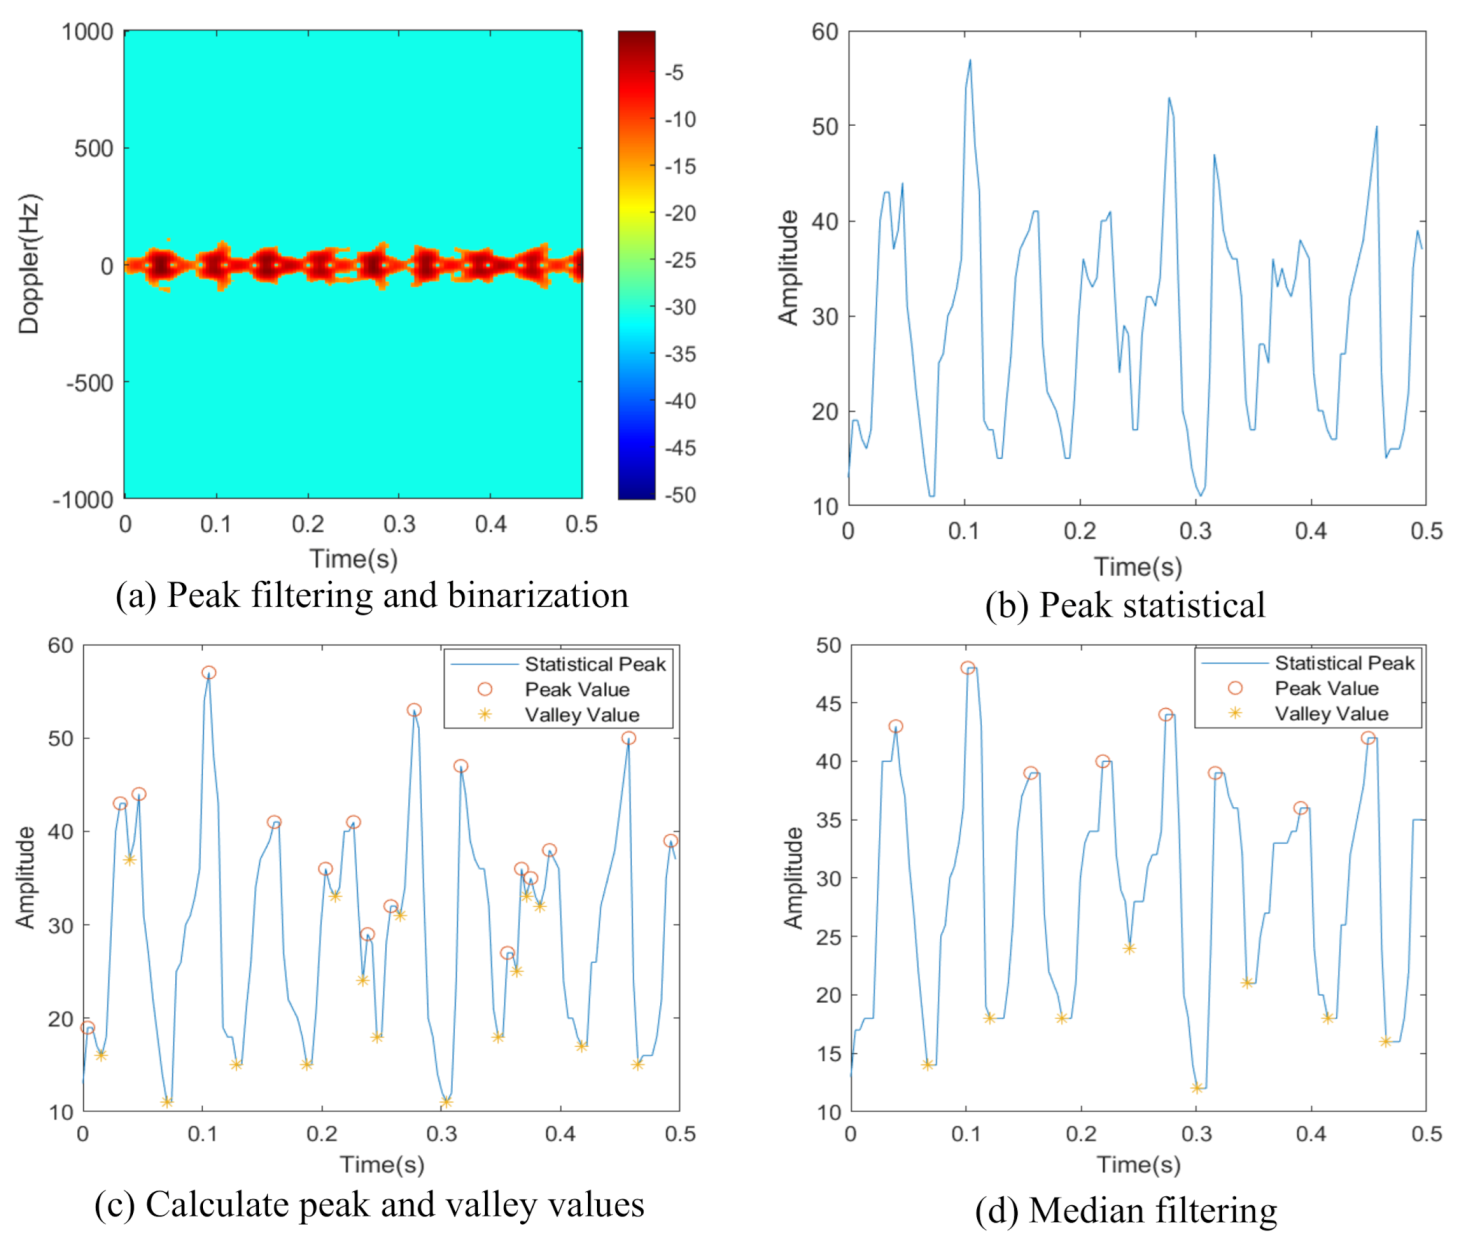
The m-DS of small UAVs may be affected by the environment, including birds, kites, balloons, trees, and other factors. Therefore, after the signal acquisition is completed, a preliminary judgment can be made by period estimation to make a distinction between UAVs and determine the flight status of UAVs. The specific process of period estimation is shown in Figure 14, where (a) is peak filtering and binarization, (b) is the peak statistical process, (c) is the calculation process of peak and valley values, and (d) is median filtering.
First, the micro-Doppler signals of the UAV are collected. In order to facilitate processing, the long signal is divided into bins of 0.5 s, and the time–frequency spectrum is obtained by short-time Fourier transform.
Then, the binarization process is performed. Calculate the mean value of the time–frequency spectrum in each time period (0.5 s) and take it as the threshold value. The spectral value at each time point is compared to this threshold. If the value of a point is greater than the threshold, the value does not change. Otherwise, change the value as this threshold. The binarization results are shown in Figure 14a.
Next, at each time point, we count the number of time–frequency spectrum that is higher than the threshold, as shown in Figure 14b, and count the peaks and valleys of the threshold, which is shown in Figure 14c.
Finally, as shown in Figure 14d, median filtering is performed, and peak and valley values are calculated to estimate the rotation speed of UAV.
The formula used to estimate the rotation speed of UAV is as follows:
where P is the number of peaks, and t is the total sampling time. N and n are the total number of sampling points and the number of partial sampling points (within 0.5 s). We can determine that the speed of the UAV rotary rotor is 31 r/s, which is consistent with the theoretical value.
5.2. Performance Analysis of Dynamic Attribute Enhancement Algorithm
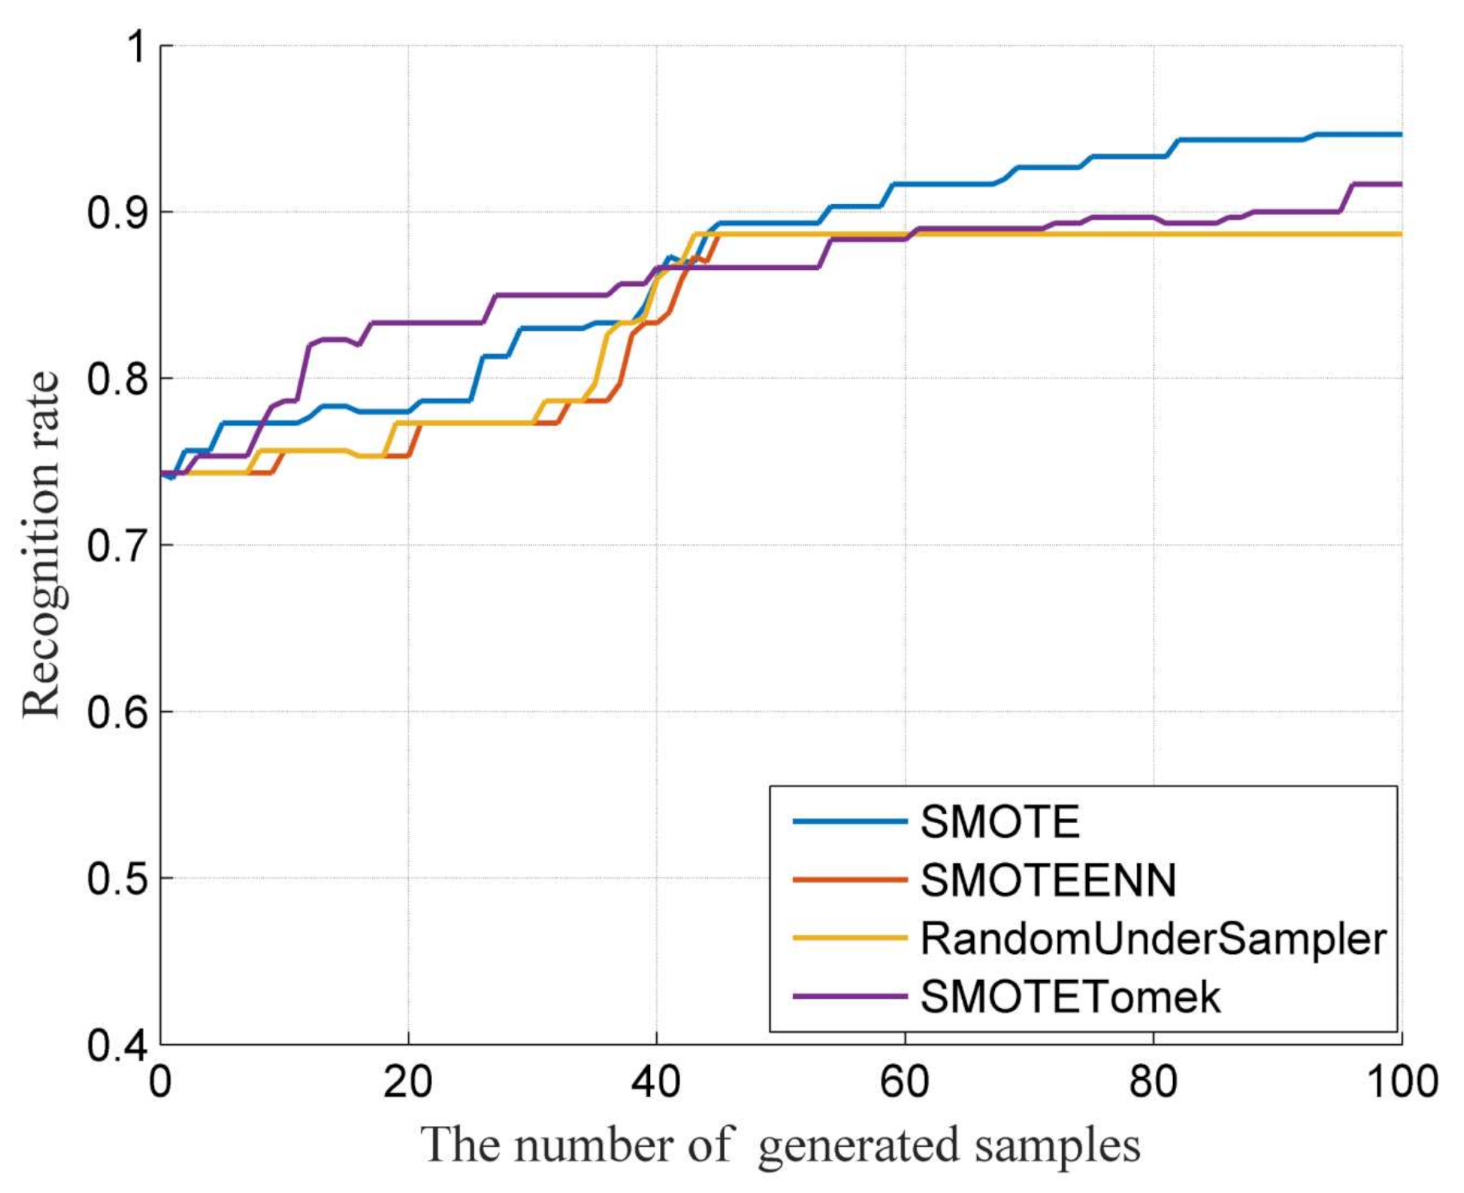
In order to verify the performance of feature generation algorithms, we compared the recognition effects of various sample generation algorithms. Let us take DJI 2/3 as an example, and the result is shown in Figure 15. Among them, the method of generating new sample feature vectors includes the SMOTE algorithm, SMOTEENN algorithm (SENN), the Random Under Sampler algorithm (RUS), and SMOTE Tomek algorithm (ST) [31]. It can be seen that after adding the feature vectors generated by different algorithms, the recognition rate of the classifiers is significantly different. The recognition rate of the SMOTE algorithm is most evident with the increase in the number of generated dynamic samples. Therefore, in this paper, this algorithm is selected to generate features.
The expanded features are the inputs of the model for classification, and the recognition rate of the four UAVs are listed in Table 1, where the word “Static” represents static features, “Dynamic” represents dynamic features, and “SMOTE” represents the generated features expanded by SMOTE algorithm. When static features and generated features are used as training sample sets, there are 300 samples in each category, and 1200 samples in total. Since it is difficult to collect dynamic features, when they are used as training samples, the training data of each category is 75 samples, with 300 total samples. The dynamic features of UAVS have been adopted for test samples, with a total of 300 samples and 75 samples in each category. During the training process, the ratio of training set to verification set is 4:1.
For the above three different training sample sets, SVM and k-NN have been used to compare the recognition effects. The results show that the recognition rate of the classifier trained only by static features is low, and the recognition rate of some UAVs is 0%. In the case of adding dynamic features or using SMOTE algorithm for data expansion, the average identification of UAV is significantly improved. On this basis, we use the AdaBoost algorithm to calculate the error of classifier and update the weight of the original SVM and k-NN, and finally get the identification results of test samples on DAGA-SVM and DAGA-k-NN, which perform much better than the previous methods. Table 1 shows that the DAGA algorithm is more suitable for k-NN classifier but not the SVM classifier. The overall performance of texture feature is better than that of the PCA-DWT feature, which is more suitable for the recognition of small UAVs in flight state. Due to the small rotor diameter of Tello and SYMA, the signal acquisition is much difficult, and the features are not stable and obvious, so the recognition rate is reduced. However, when DAGA-k-NN is used, the average recognition rate of the four UAVs’ texture features is still up to 98%. In general, when the number of dynamic samples of small UAVs is limited, DAGA algorithm can be used to effectively improve the recognition rate of UAV in dynamic flight state.
6. Conclusions
In the challenging task of small UAV detection and identification, the drone has many flight states, and its dynamic characteristics are difficult to collect. This paper proposes a UAV micro-Doppler feature recognition method based on dynamic feature enhancement. The texture features and the combined PCA-DWT features of the micro-Doppler signal are extracted, and the training domain is expanded by the DAGA algorithm to effectively improve the recognition of the drone in flight, with an average recognition rate of 98%. This paper focuses on the single rotor of the UAV. In future research, we will conduct deep analysis of multirotor UAVs.
Author Contributions
C.Z. presented the idea and proposed the experimental method; G.L. carried out relevant theoretical analysis and experiments; Y.W. wrote the first draft of the manuscript; C.C. validated this paper; Z.W. supervised this paper. All authors have read and agreed to the published version of the manuscript.
Funding
This work was supported in part by the National Natural Science Foundation of China under Grant No. 61971368, in part by the Natural Science Foundation of Fujian Province of China No. 2019J01003, and in part by the National Natural Science Foundation of China under Grant No. U20A20162.
Acknowledgments
The authors would like to thank the anonymous referees whose comments greatly strengthened this paper.
Conflicts of Interest
The authors declare no conflict of interest.
References
- Zhao, Y.; Su, Y. Cyclostationary Phase Analysis on Micro-Doppler Parameters for Radar-Based Small UAVs Detection. IEEE Trans. Instrum. Meas. 2018, 67, 2048–2057. [Google Scholar] [CrossRef]
- Matsuda, T.; Yataka, R.; Gocho, M.; Tanaka, T. Micro-Doppler Analysis under Various Aspect Angles for Small UAV Classification. In Proceedings of the 2019 IEEE Asia-Pacific Microwave Conference (APMC), Singapore, 10–13 December 2019; pp. 102–104. [Google Scholar]
- Oh, B.S.; Guo, X.; Wan, F.; Toh, K.A.; Lin, Z. Micro-Doppler mini-UAV classification using empirical-mode decomposition features. IEEE Geosci. Remote Sens. Lett. 2017, 15, 227–231. [Google Scholar] [CrossRef]
- Schroder, A.; Renker, M.; Aulenbacher, U.; Murk, A.; Boniger, U.; Oechslin, R.; Wellig, P. Numerical and experimental radar cross section analysis of the quadrocopter DJI Phantom 2. In Proceedings of the 2015 IEEE Radar Conference, Johannesburg, South Africa, 27–30 October 2015; pp. 463–468. [Google Scholar]
- Ritchie, M.; Fioranelli, F.; Griffiths, H.; Torvik, B. Micro-drone RCS analysis. In Proceedings of the 2015 IEEE Radar Conference, Johannesburg, South Africa, 27–30 October 2015; pp. 452–456. [Google Scholar]
- Harmanny, R.I.A.; de Wit, J.J.M.; Cabic, G.P. Radar micro-Doppler feature extraction using the spectrogram and the cepstrogram. In Proceedings of the 2014 11th European Radar Conference, Rome, Italy, 8–10 October 2014; pp. 165–168. [Google Scholar]
- Patel, J.S.; Fioranelli, F.; Anderson, D. Review of radar classification and RCS characterisation techniques for small UAVs or drones. IET Radar Sonar Navig. 2018, 12, 911–919. [Google Scholar] [CrossRef]
- Björklund, S. Target detection and classification of small drones by boosting on radar micro-doppler. In Proceedings of the 2018 15th European Radar Conference (EuRAD), Madrid, Spain, 26–28 September 2018; pp. 182–185. [Google Scholar]
- Molchanov, P.; Harmanny, R.I.A.; de Wit, J.J.M.; Egiazarian, K.; Astola, J. Classification of small UAVs and birds by micro-Doppler signatures. Int. J. Microw. Wirel. Technol. 2014, 6, 435–444. [Google Scholar] [CrossRef] [Green Version]
- De Wit, J.J.; Harmanny, R.I.; Molchanov, P. Radar micro-Doppler feature extraction using the singular value decomposition. In Proceedings of the 2014 International Radar Conference, Lille, France, 13–17 October 2014; pp. 1–6. [Google Scholar]
- Fioranelli, F.; Ritchie, M.; Griffiths, H. Performance Analysis of Centroid and SVD Features for Personnel Recognition Using Multistatic Micro-Doppler. IEEE Geosci. Remote Sens. Lett. 2016, 13, 725–729. [Google Scholar] [CrossRef] [Green Version]
- Kim, B.K.; Kang, H.; Park, S. Drone Classification Using Convolutional Neural Networks With Merged Doppler Images. IEEE Geosci. Remote Sens. Lett. 2017, 14, 38–42. [Google Scholar] [CrossRef]
- Torralba, A.; Efros, A.A. Unbiased look at dataset bias. In Proceedings of the CVPR, Colorado Springs, CO, USA, 20–25 June 2011; Volume 1, pp. 1521–1528. [Google Scholar]
- Jian, M.; Lu, Z.; Chen, V.C. Experimental study on radar micro-Doppler signatures of unmanned aerial vehicles. In Proceedings of the 2017 IEEE Radar Conference (RadarConf), Seattle, WA, USA, 8–12 May 2017; pp. 854–857. [Google Scholar]
- Antoniou, A.; Storkey, A.; Edwards, H. Data augmentation generative adversarial networks. arXiv 2017, arXiv:1711.04340. [Google Scholar]
- Dixit, M.; Kwitt, R.; Niethammer, M.; Vasconcelos, N. AGA: Attribute-Guided Augmentation. In Proceedings of the 2017 IEEE Conference on Computer Vision and Pattern Recognition (CVPR); 2017; pp. 3328–3336. [Google Scholar]
- Chawla, N.V.; Bowyer, K.W.; Hall, L.O.; Kegelmeyer, W.P. SMOTE: Synthetic minority over-sampling technique. J. Artif. Intell. Res. 2002, 16, 321–357. [Google Scholar] [CrossRef]
- Thayaparan, T.; Abrol, S.; Riseborough, E.; Stankovic, L.; Lamothe, D.; Duff, G. Analysis of radar micro-Doppler signatures from experimental helicopter and human data. IET Radar Sonar Navig. 2007, 1, 289–299. [Google Scholar] [CrossRef] [Green Version]
- Chen, V.C. The Micro-Doppler Effect in Radar; Artech House: Norwood, MA, USA, 2019. [Google Scholar]
- Ma, J.; Dong, Y.; Li, Y.; Li, L.; Yang, J. Multi-rotor UAV’s micro-Doppler characteristic analysis and feature extraction. J. Univ. Chin. Acad. Sci. 2019, 36, 235–243. [Google Scholar]
- Shrivastava, A.; Gupta, A.; Girshick, R. Training region-based object detectors with online hard example mining. In Proceedings of the IEEE Conference on Computer Vision and Pattern Recognition, Las Vegas, NV, USA, 27–30 June 2016; pp. 761–769. [Google Scholar]
- Zhang, H.; Cisse, M.; Dauphin, Y.N.; Lopez-Paz, D. mixup: Beyond empirical risk minimization. arXiv 2017, arXiv:1710.09412. [Google Scholar]
- Xiyang, Z.; Xiaodan, W.; Yang, J.; Tong, W. Multi-class cost sensitive AdaBoost algorithm based on cost sensitive exponential loss function. In Proceedings of the 2017 29th Chinese Control And Decision Conference (CCDC), Chongqing, China, 28–30 May 2017; pp. 6161–6166. [Google Scholar]
- Peterson, L.E. K-nearest neighbor. Scholarpedia 2009, 4, 1883. [Google Scholar] [CrossRef]
- Hearst, M.A.; Dumais, S.T.; Osuna, E.; Platt, J.; Scholkopf, B. Support vector machines. IEEE Intell. Syst. Their Appl. 1998, 13, 18–28. [Google Scholar] [CrossRef] [Green Version]
- Hastie, T.; Rosset, S.; Zhu, J.; Zou, H. Multi-class adaboost. Stat. Its Interface 2009, 2, 349–360. [Google Scholar] [CrossRef] [Green Version]
- Chen, V.C. Micro-Doppler effect of micromotion dynamics: A review. Independent Component Analyses, Wavelets, and Neural Networks. In Proceedings of the International Society for Optical Engineering (SPIE), Orlando, FL, USA, 29 March 2003; Volume 5102, pp. 240–249. [Google Scholar]
- Luo, Y.; Zhang, Q.; Qiu, C.; Li, S.; Yeo, T.S. Micro-Doppler feature extraction for wideband imaging radar based on complex image orthogonal matching pursuit decomposition. IET Radar Sonar Navig. 2013, 7, 914–924. [Google Scholar] [CrossRef]
- Ding, Y.; Tang, J. Micro-Doppler trajectory estimation of pedestrians using a continuous-wave radar. IEEE Trans. Geosci. Remote Sens. 2014, 52, 5807–5819. [Google Scholar] [CrossRef]
- Haralick, R.M.; Shanmugam, K.; Dinstein, I.H. Textural features for image classification. IEEE Trans. Syst. Man, Cybern. 1973, 6, 610–621. [Google Scholar] [CrossRef] [Green Version]
- More, A. Survey of resampling techniques for improving classification performance in unbalanced datasets. arXiv 2016, arXiv:1608.06048. [Google Scholar]
Figure 1.
Micro-Doppler effect of UAV’s rotor.

Figure 2.
Micro-Doppler signature of rotors.

Figure 3.
Micro-Dppler signature of different status of UAV.

Figure 4.
Micro-Doppler signature of drones at different azimuth angle.

Figure 5.
Three-dimensional feature distribution of UAVs.

Figure 6.
Flowchart of the dynamic attribute-guided augmentation (DAGA) algorithm.

Figure 7.
Distribution of generated features.

Figure 8.
Combined PCA-DWT feature extraction flow chart.

Figure 9.
Three-dimensional visualization diagram of PCA-DWT features.

Figure 10.
Statistical box diagram of PCA-DWT features.

Figure 11.
Texture feature distribution of different UAV micro-Doppler images.

Figure 12.
Recognition framework based on dynamic feature attributes.

Figure 13.
UAV micro-Doppler signal acquisition block diagram.

Figure 14.
The process of period estimation.

Figure 15.
The recognition rate of different generation algorithms.


Table 1.
Comparison of recognition results of different algorithms.
| Recognition Algorithms | Different Features | DJI 2 | DJI 3 | Tello | SYMA |
|---|---|---|---|---|---|
| SVM (Static) | Texture | 0.00% | 80.00% | 92.00% | 0.00% |
| PCA-DWT | 0.00% | 2.29% | 98.04% | 0.00% | |
| k-NN (Static) | Texture | 0.00% | 0.00% | 98.67% | 0.00% |
| PCA-DWT | 14.28% | 31.60% | 25.49% | 52.17% | |
| SVM (Dynamic) | Texture | 94.67% | 100.00% | 1.33% | 77.33% |
| PCA-DWT | 64.06% | 79.31% | 32.35% | 93.48% | |
| k-NN (Dynamic) | Texture | 97.33% | 75.29% | 86.67% | 70.67% |
| PCA-DWT | 64.06% | 79.31% | 26.00% | 91.30% | |
| SVM (SMOTE) | Texture | 66.67% | 78.67% | 68.00% | 76.00% |
| PCA-DWT | 93.47% | 80.59% | 79.71% | 94.12% | |
| k-NN (SMOTE) | Texture | 96.00% | 100.00% | 85.33% | 92.00% |
| PCA-DWT | 71.73% | 87.31% | 91.17% | 93.47% | |
| DAGA-SVM | Texture | 98.67% | 98.67% | 90.67% | 94.67% |
| PCA-DWT | 98.91% | 91.04% | 76.81% | 85.29% | |
| DAGA-k-NN | Texture | 100.00% | 100.00% | 93.33% | 98.67% |
| PCA-DWT | 100.00% | 94.78% | 84.06% | 100.00% |
Publisher’s Note: MDPI stays neutral with regard to jurisdictional claims in published maps and institutional affiliations. |
© 2021 by the authors. Licensee MDPI, Basel, Switzerland. This article is an open access article distributed under the terms and conditions of the Creative Commons Attribution (CC BY) license (http://creativecommons.org/licenses/by/4.0/).
Share and Cite
MDPI and ACS Style
Zhao, C.; Luo, G.; Wang, Y.; Chen, C.; Wu, Z. UAV Recognition Based on Micro-Doppler Dynamic Attribute-Guided Augmentation Algorithm. Remote Sens. 2021, 13, 1205. https://0-doi-org.brum.beds.ac.uk/10.3390/rs13061205
AMA Style
Zhao C, Luo G, Wang Y, Chen C, Wu Z. UAV Recognition Based on Micro-Doppler Dynamic Attribute-Guided Augmentation Algorithm. Remote Sensing. 2021; 13(6):1205. https://0-doi-org.brum.beds.ac.uk/10.3390/rs13061205
Chicago/Turabian StyleZhao, Caidan, Gege Luo, Yilin Wang, Caiyun Chen, and Zhiqiang Wu. 2021. "UAV Recognition Based on Micro-Doppler Dynamic Attribute-Guided Augmentation Algorithm" Remote Sensing 13, no. 6: 1205. https://0-doi-org.brum.beds.ac.uk/10.3390/rs13061205
Note that from the first issue of 2016, this journal uses article numbers instead of page numbers. See further details here.