
Spatio-Temporal Distribution of Deep Convection Observed along the Trans-Mexican Volcanic Belt


Abstract
:
1. Introduction
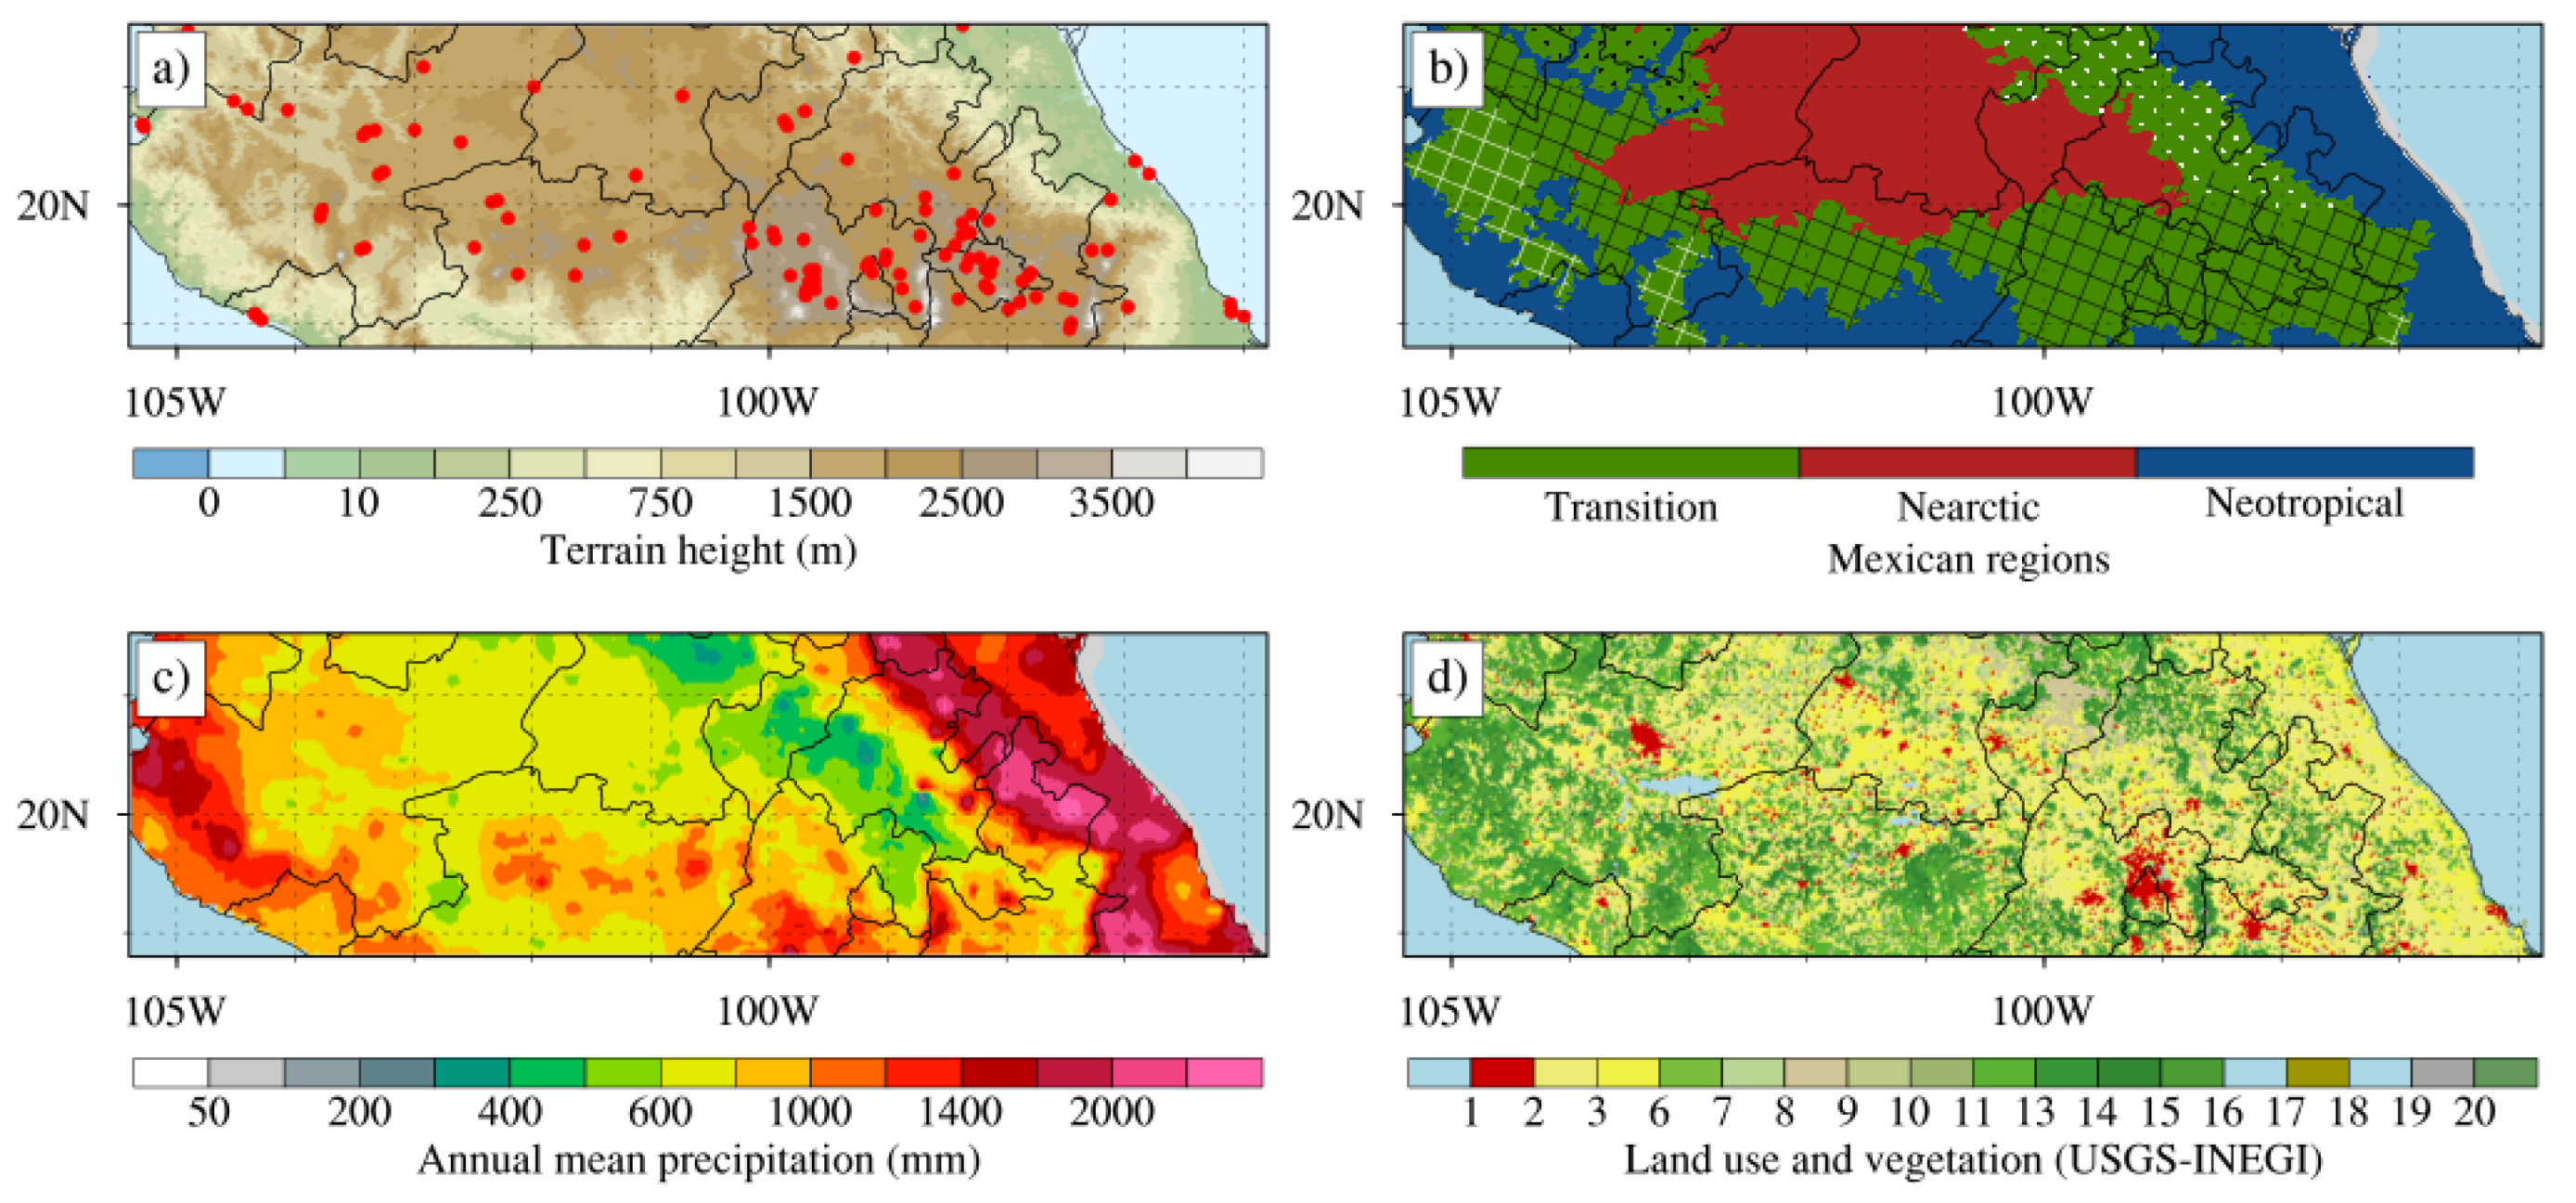
2. Study Area
3. Material and Methods
3.1. MODIS Data
3.2. Definition of Deep Convective Cloud
3.3. CHIRPS Data
4. Results and Discussion
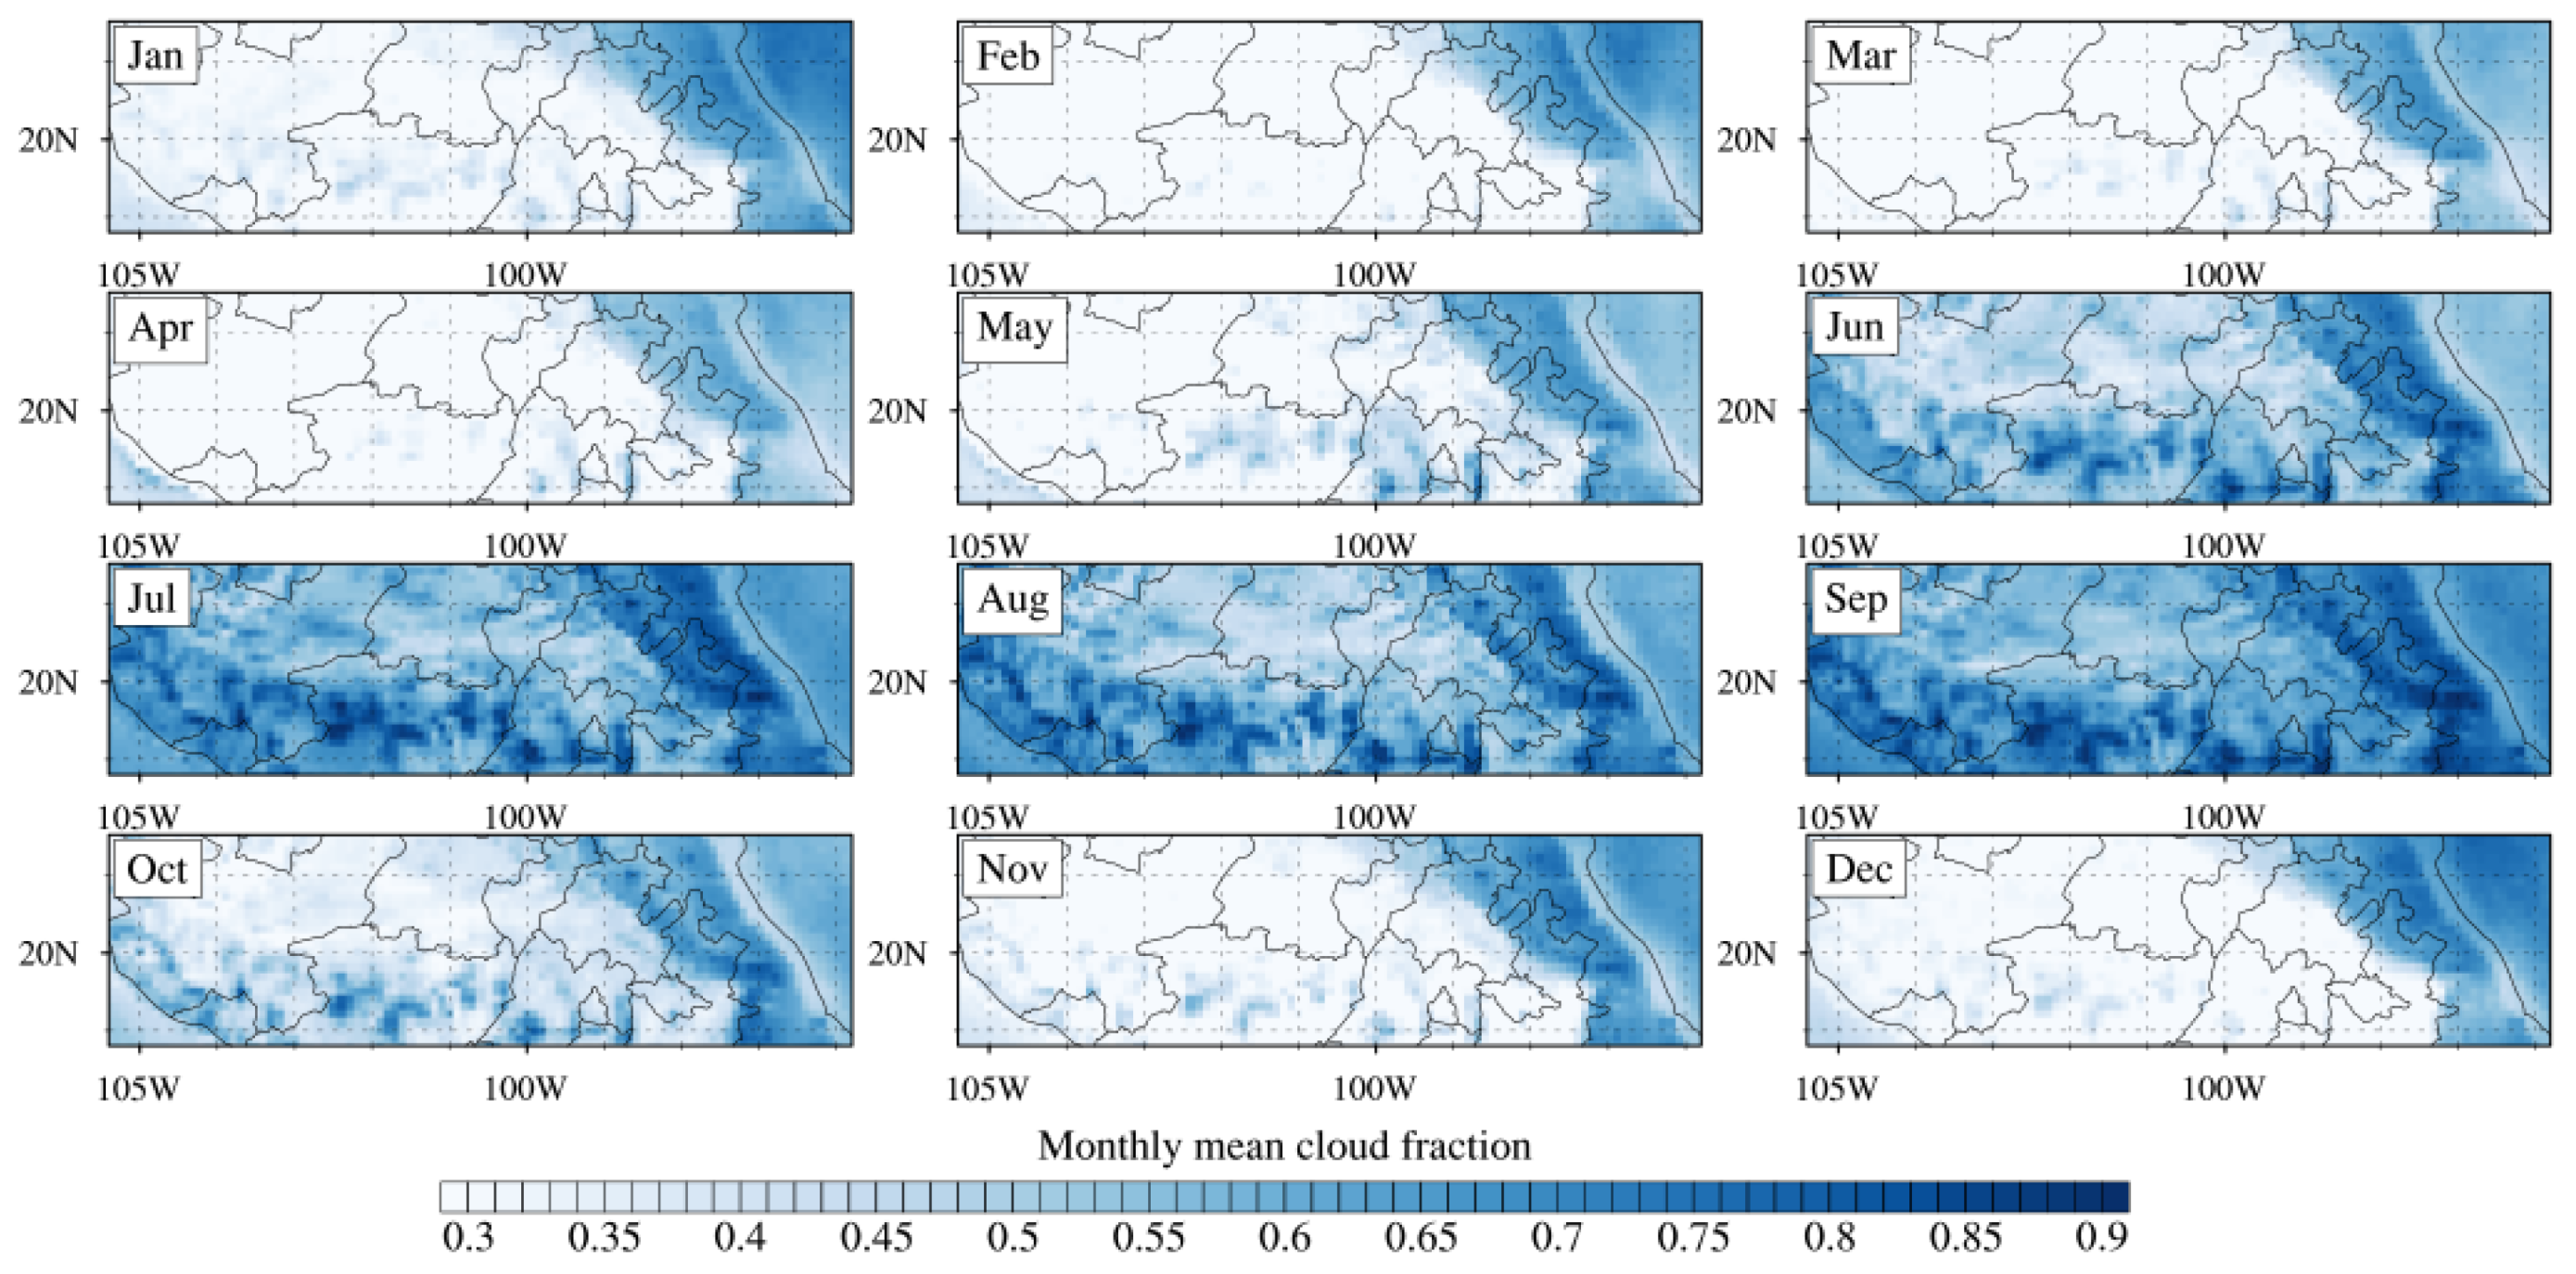
4.1. Spatio-Temporal Distribution of Cloud Fraction
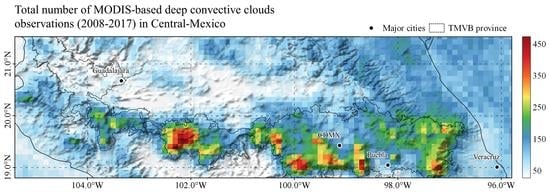
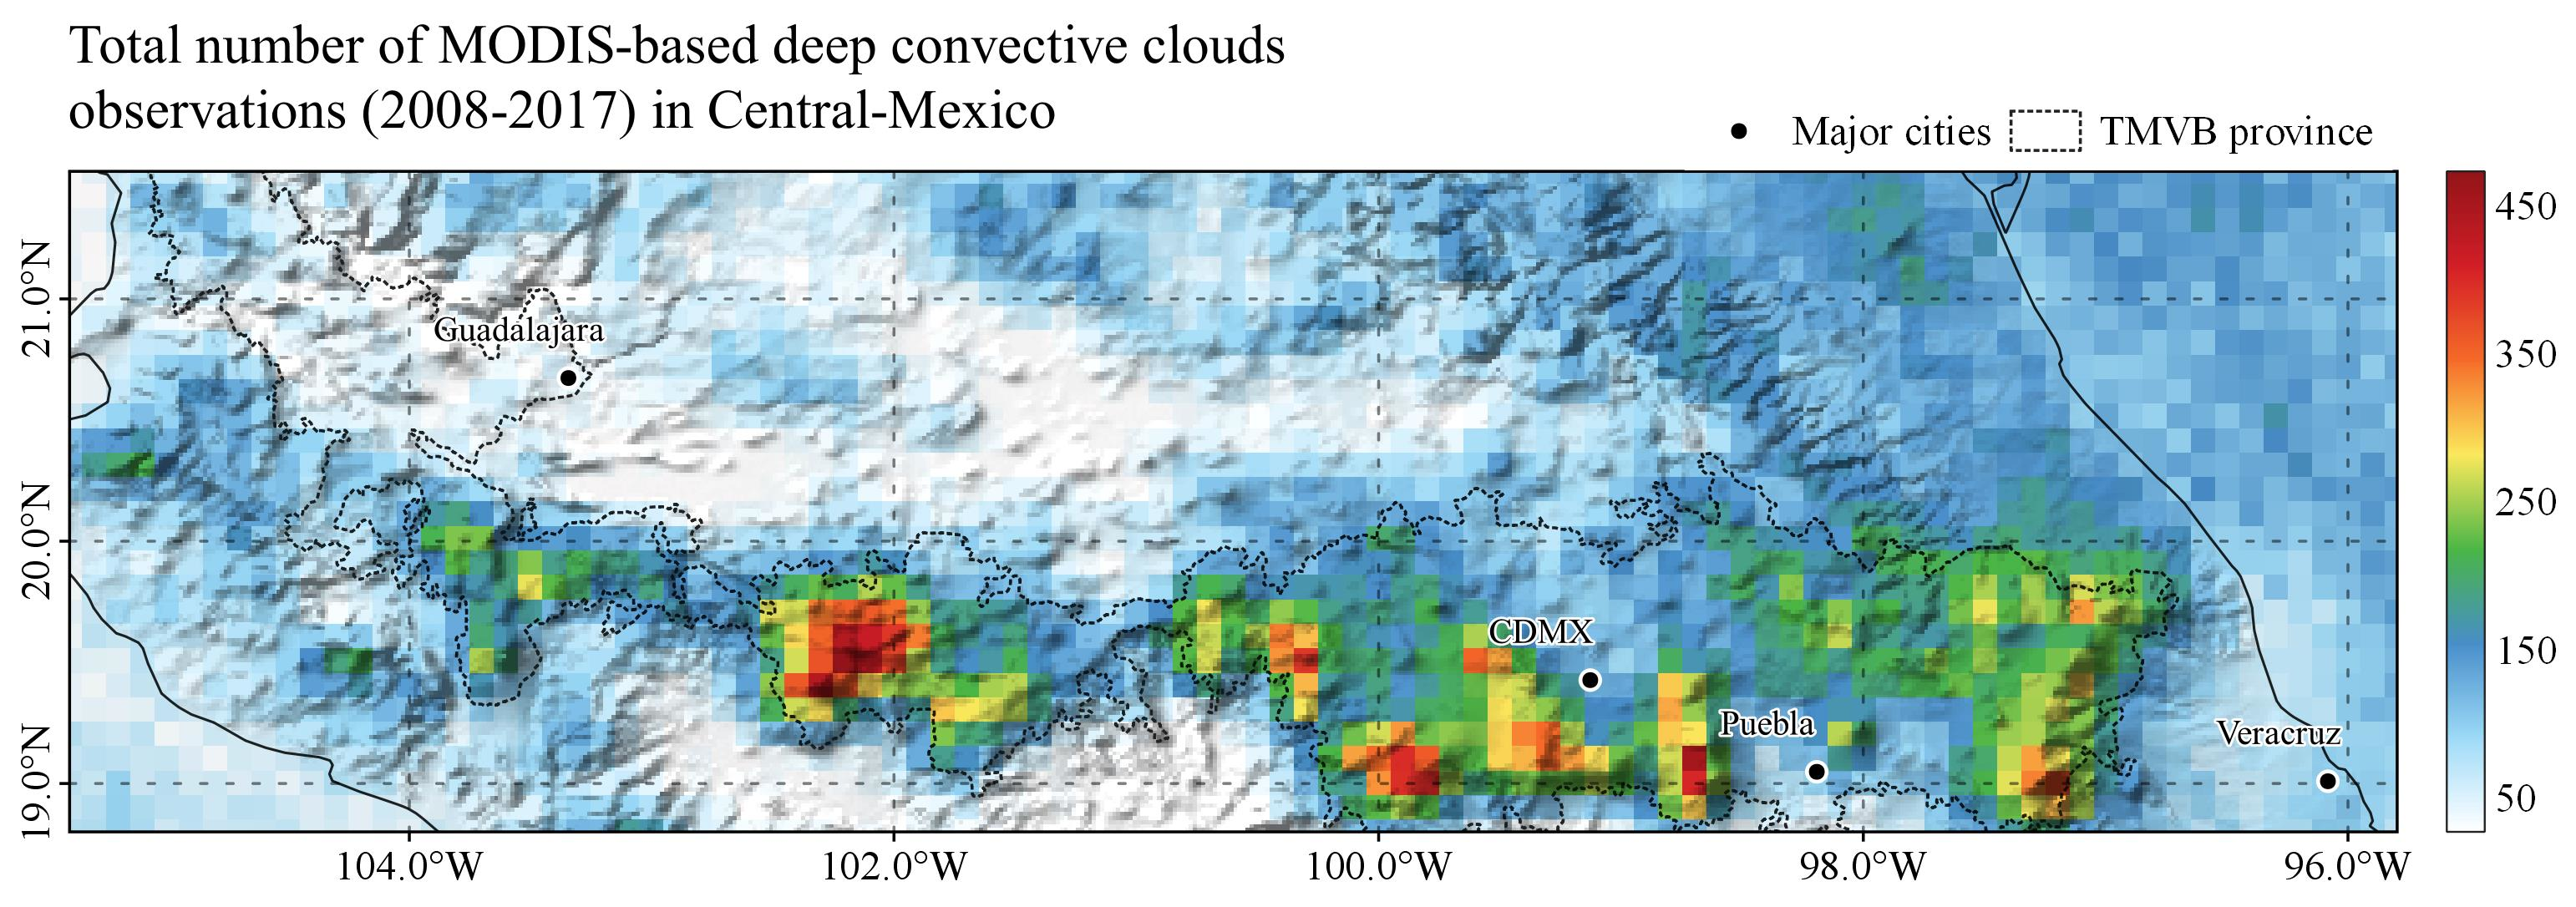
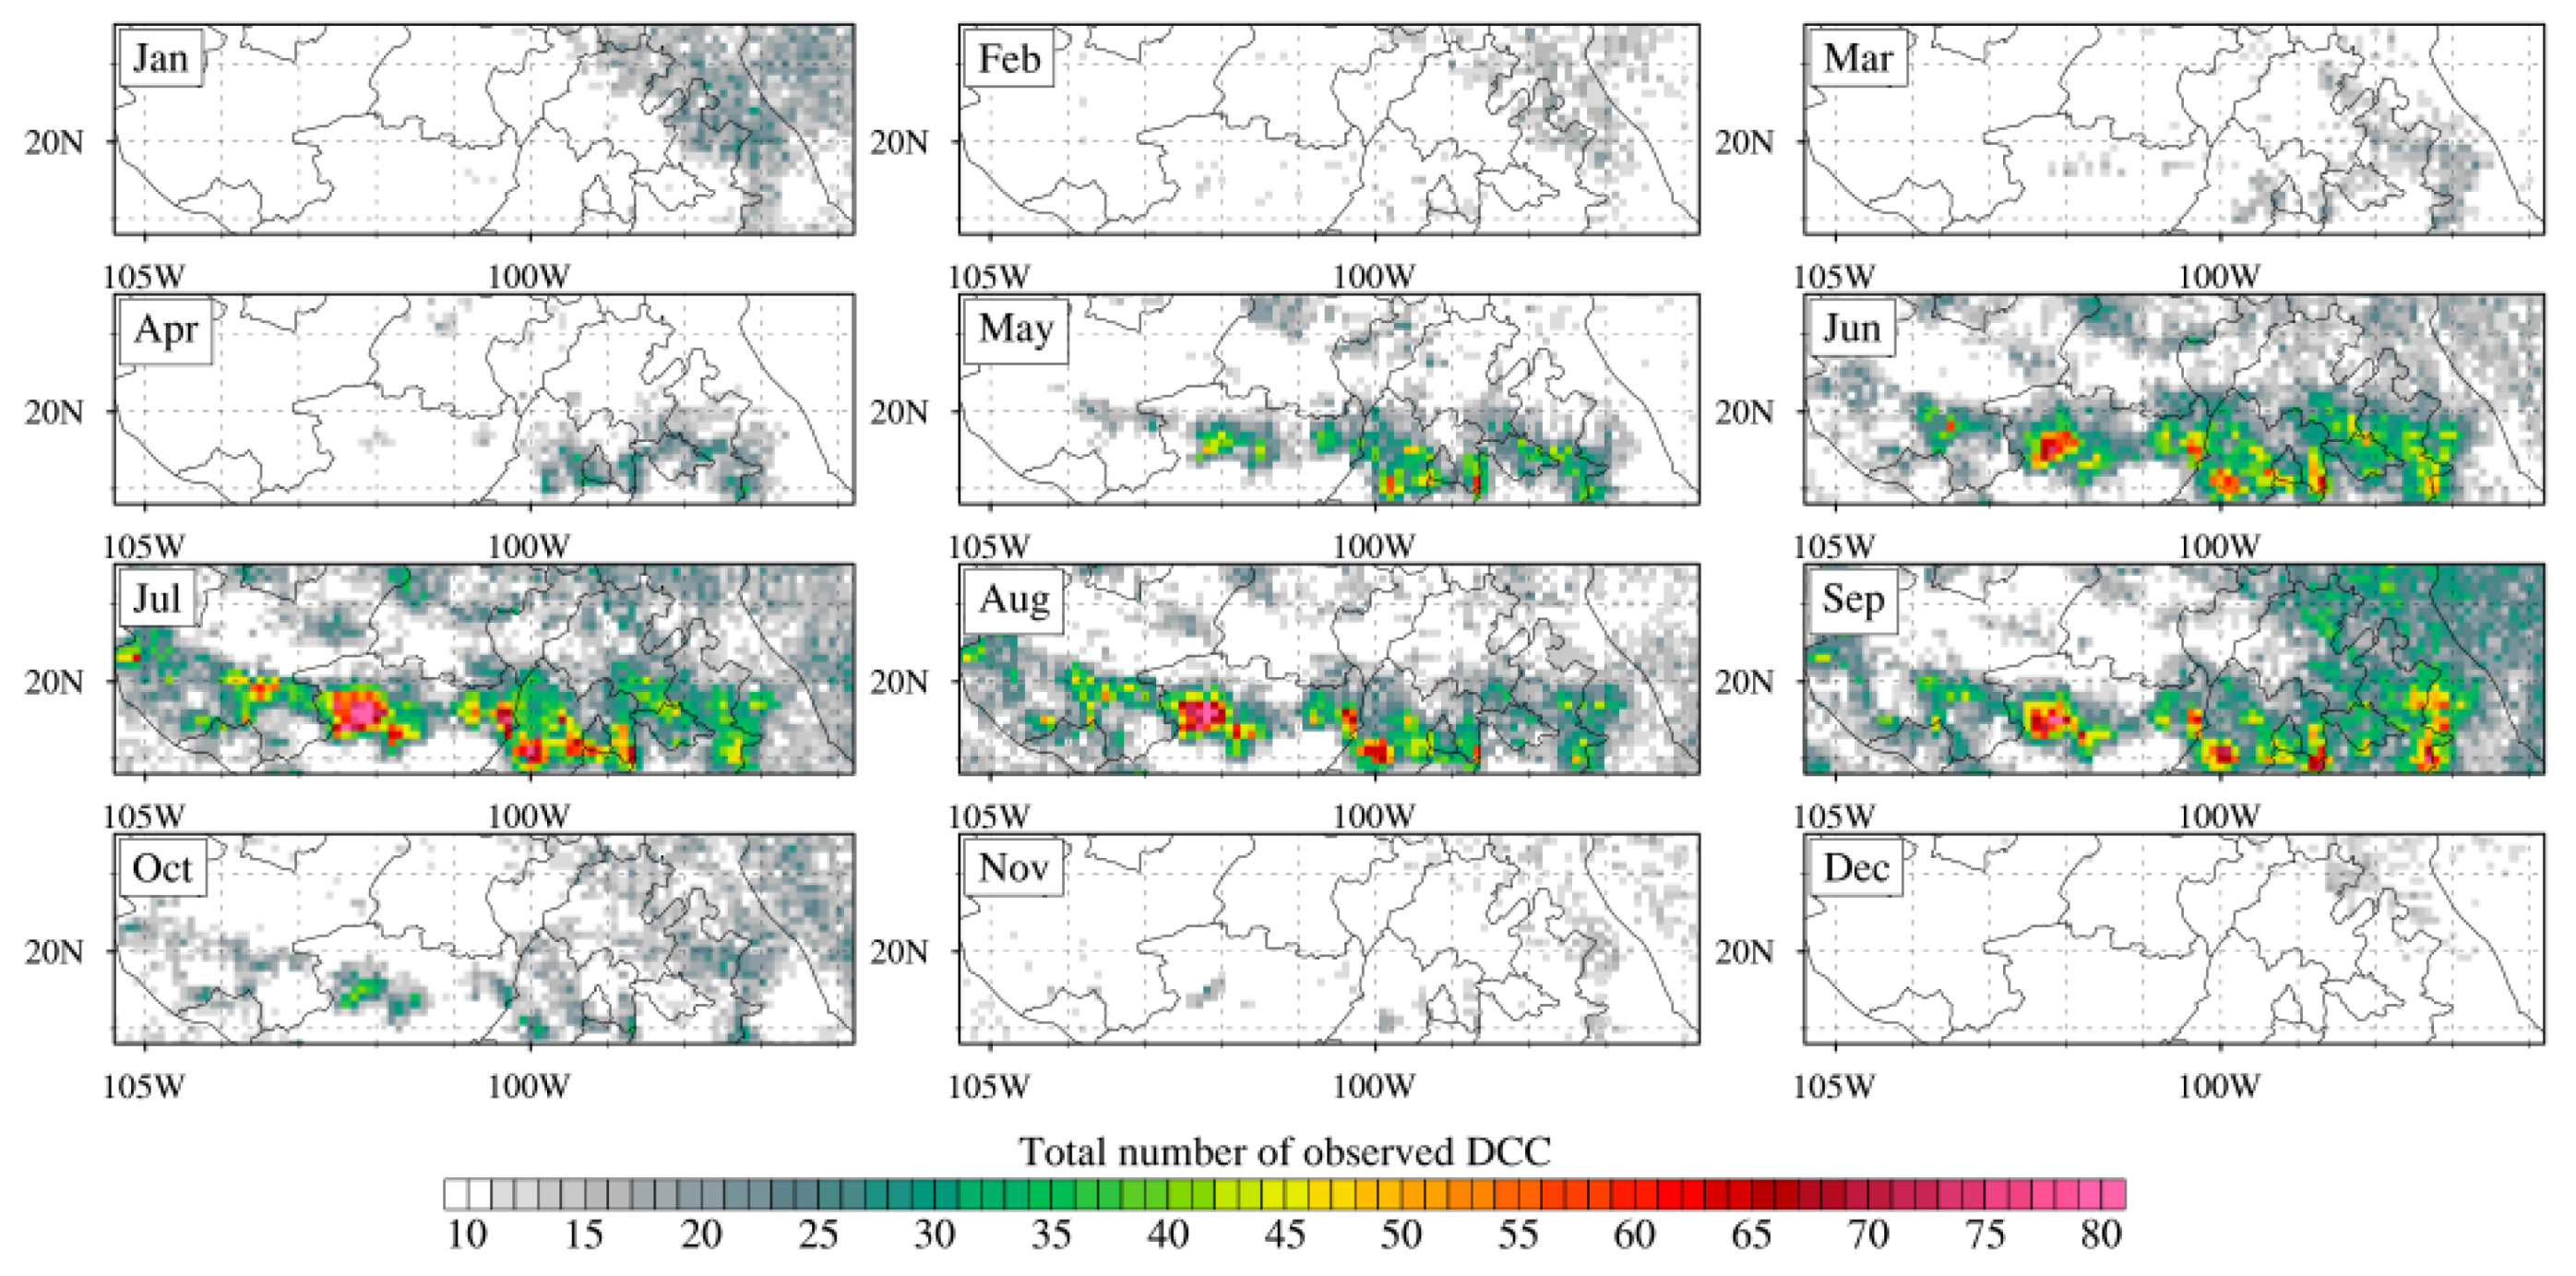
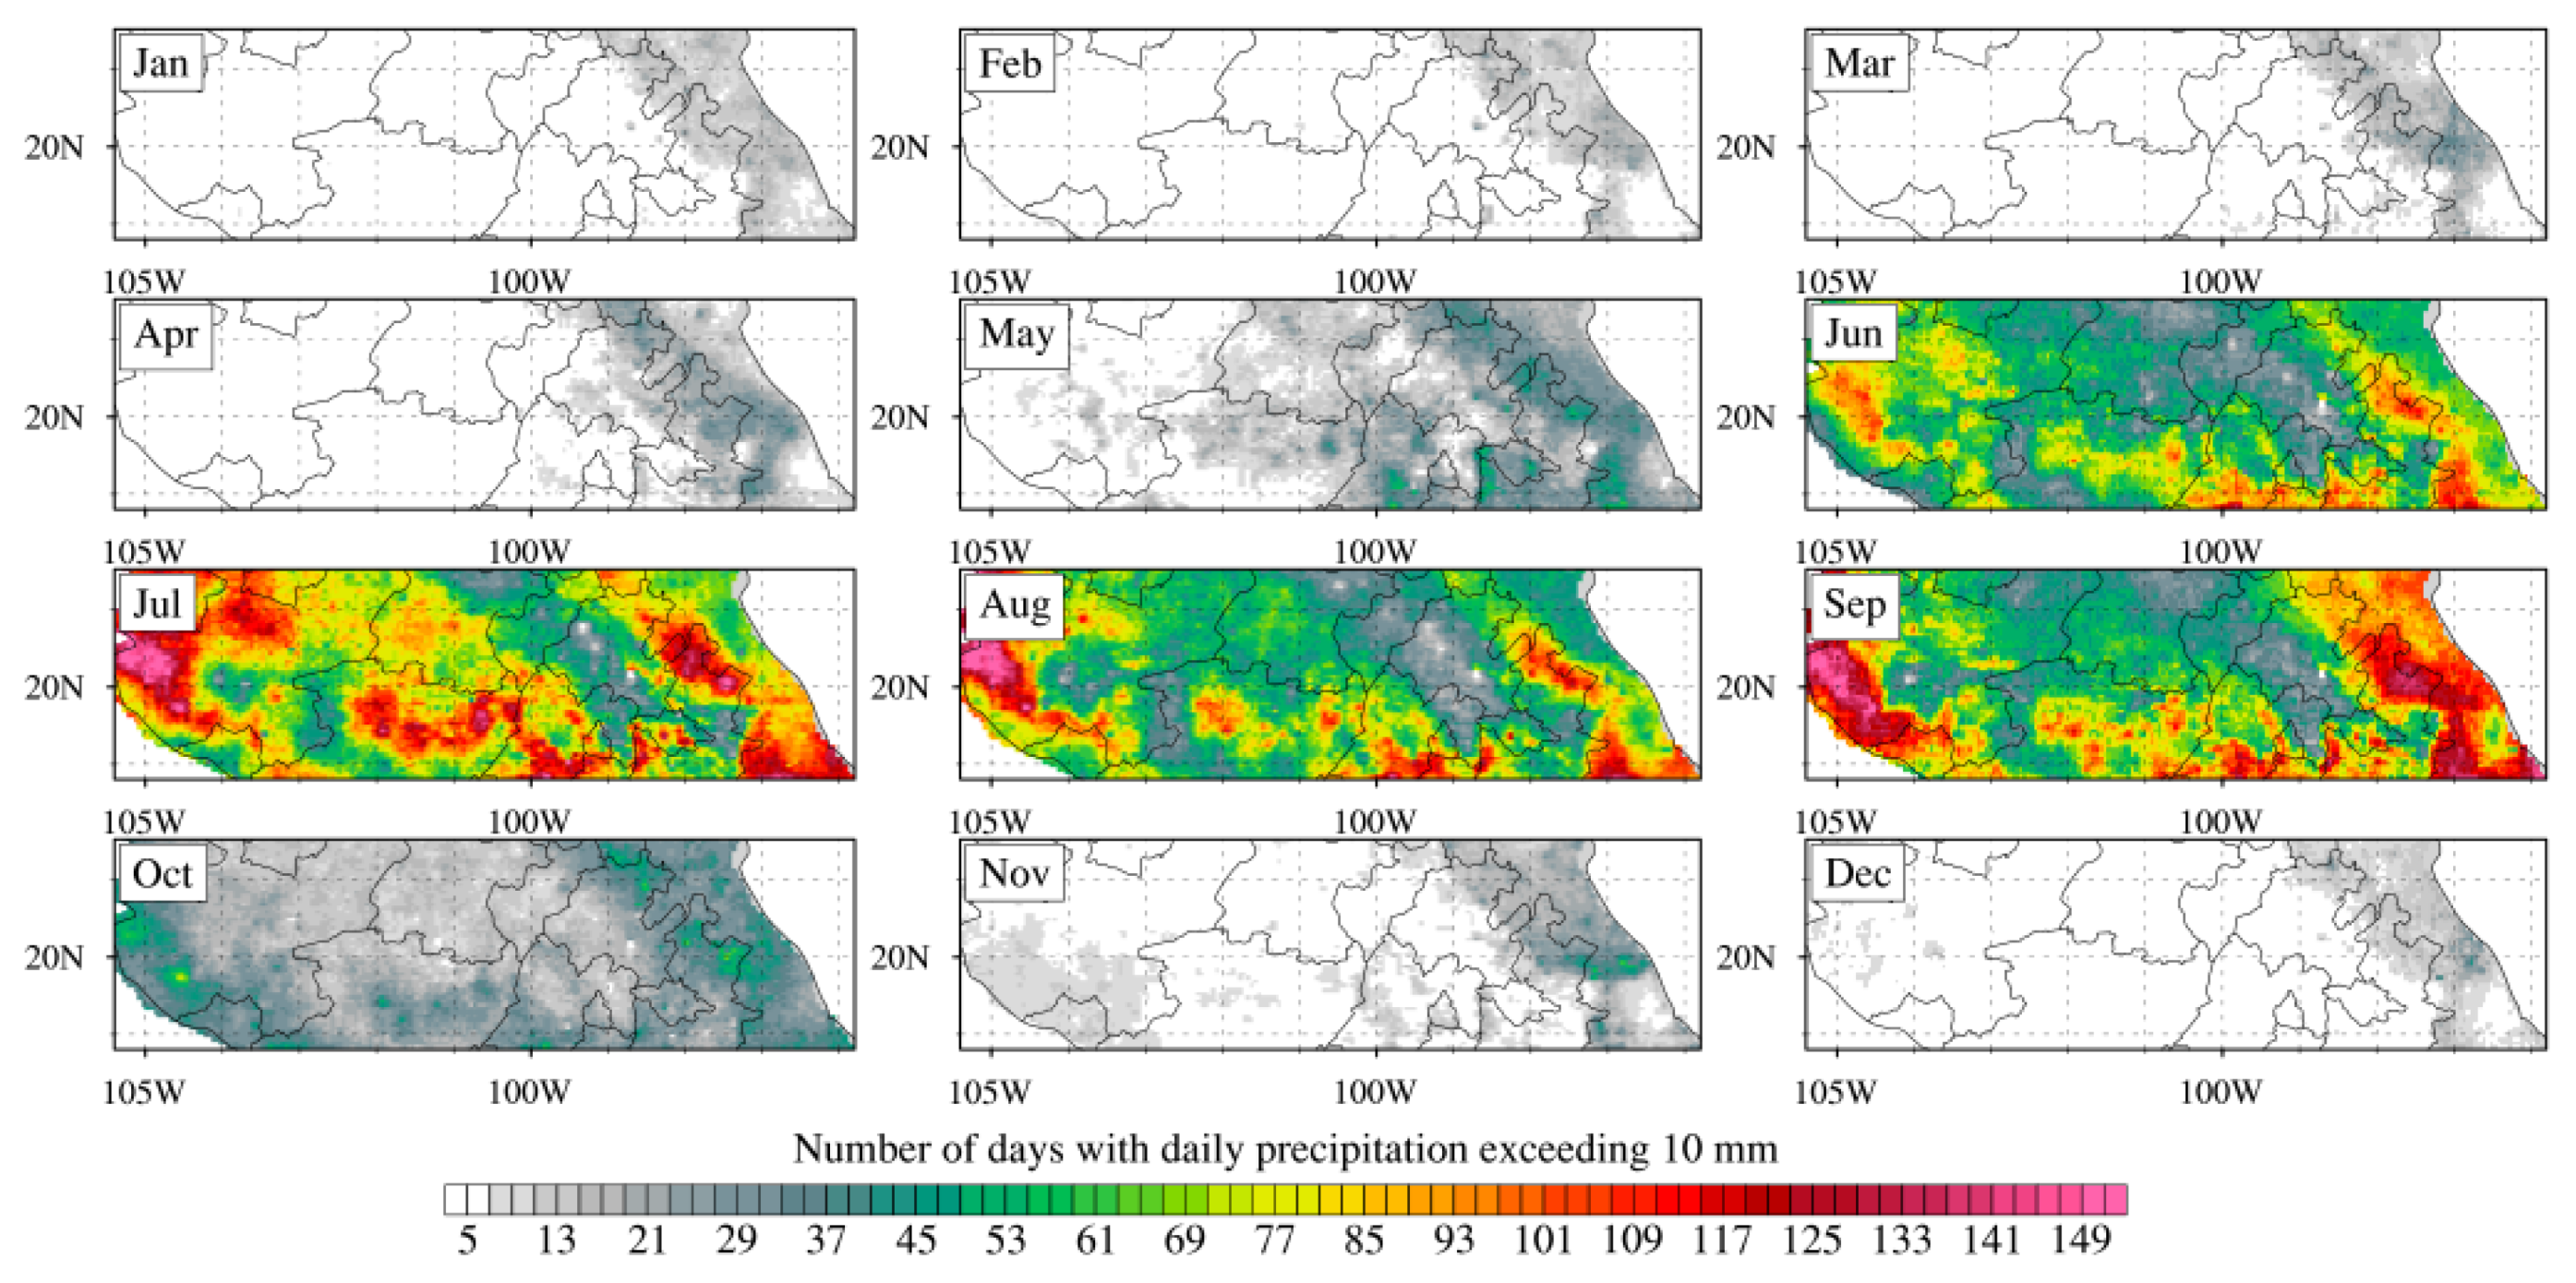
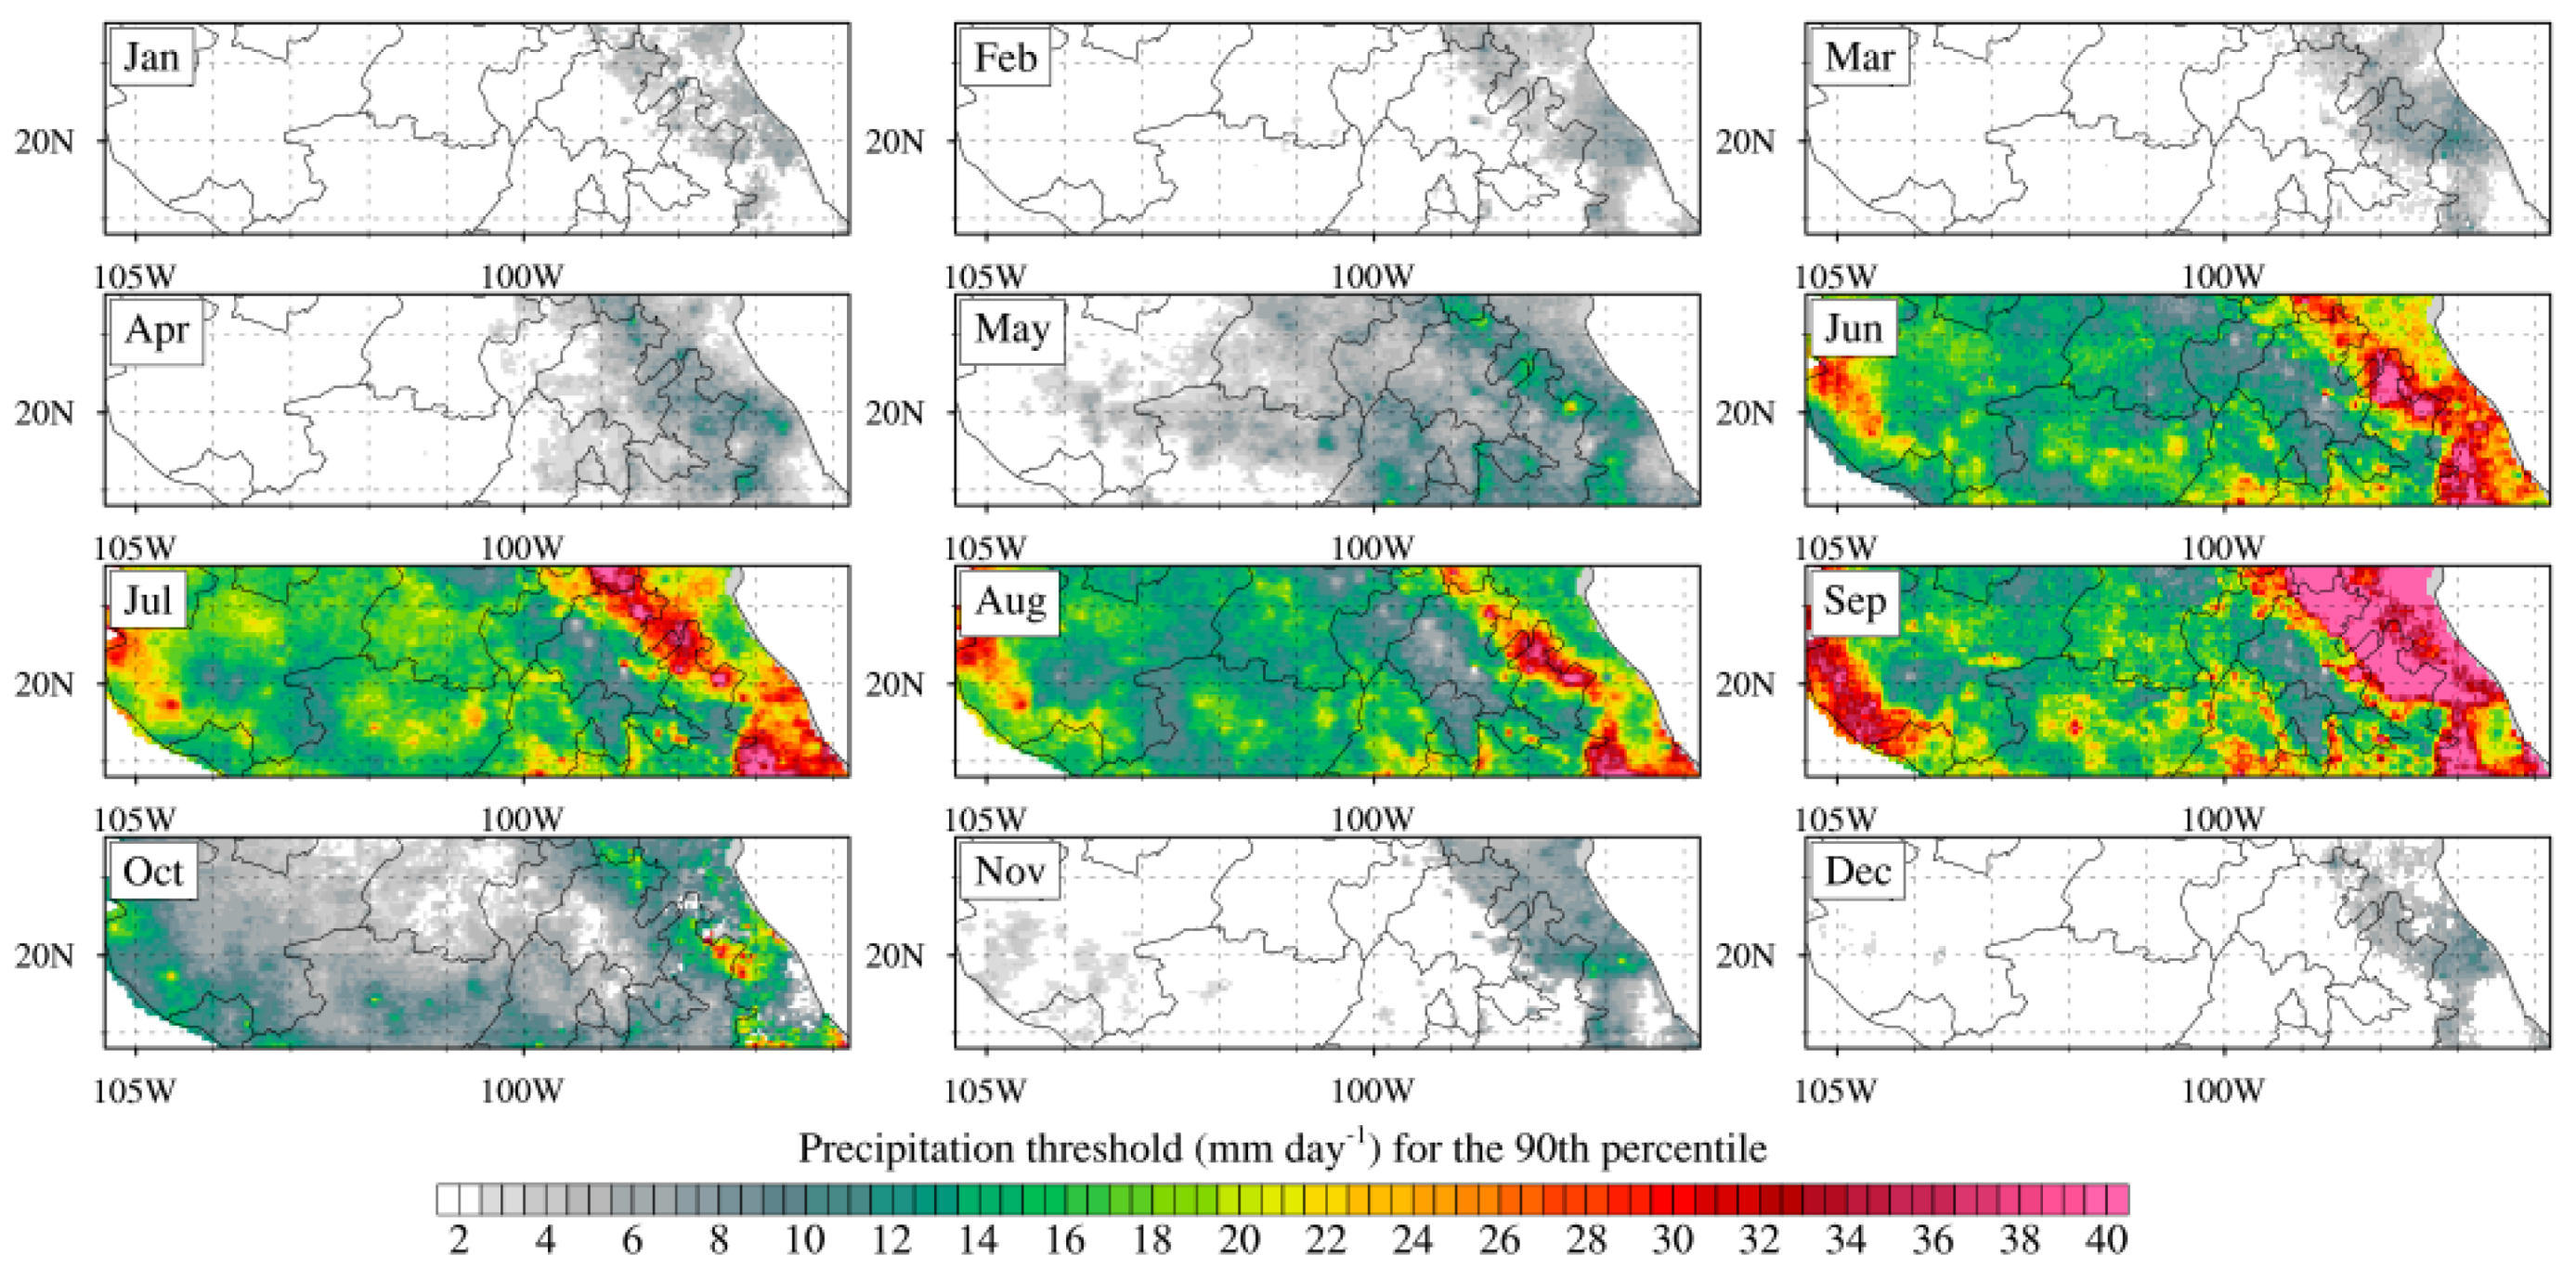
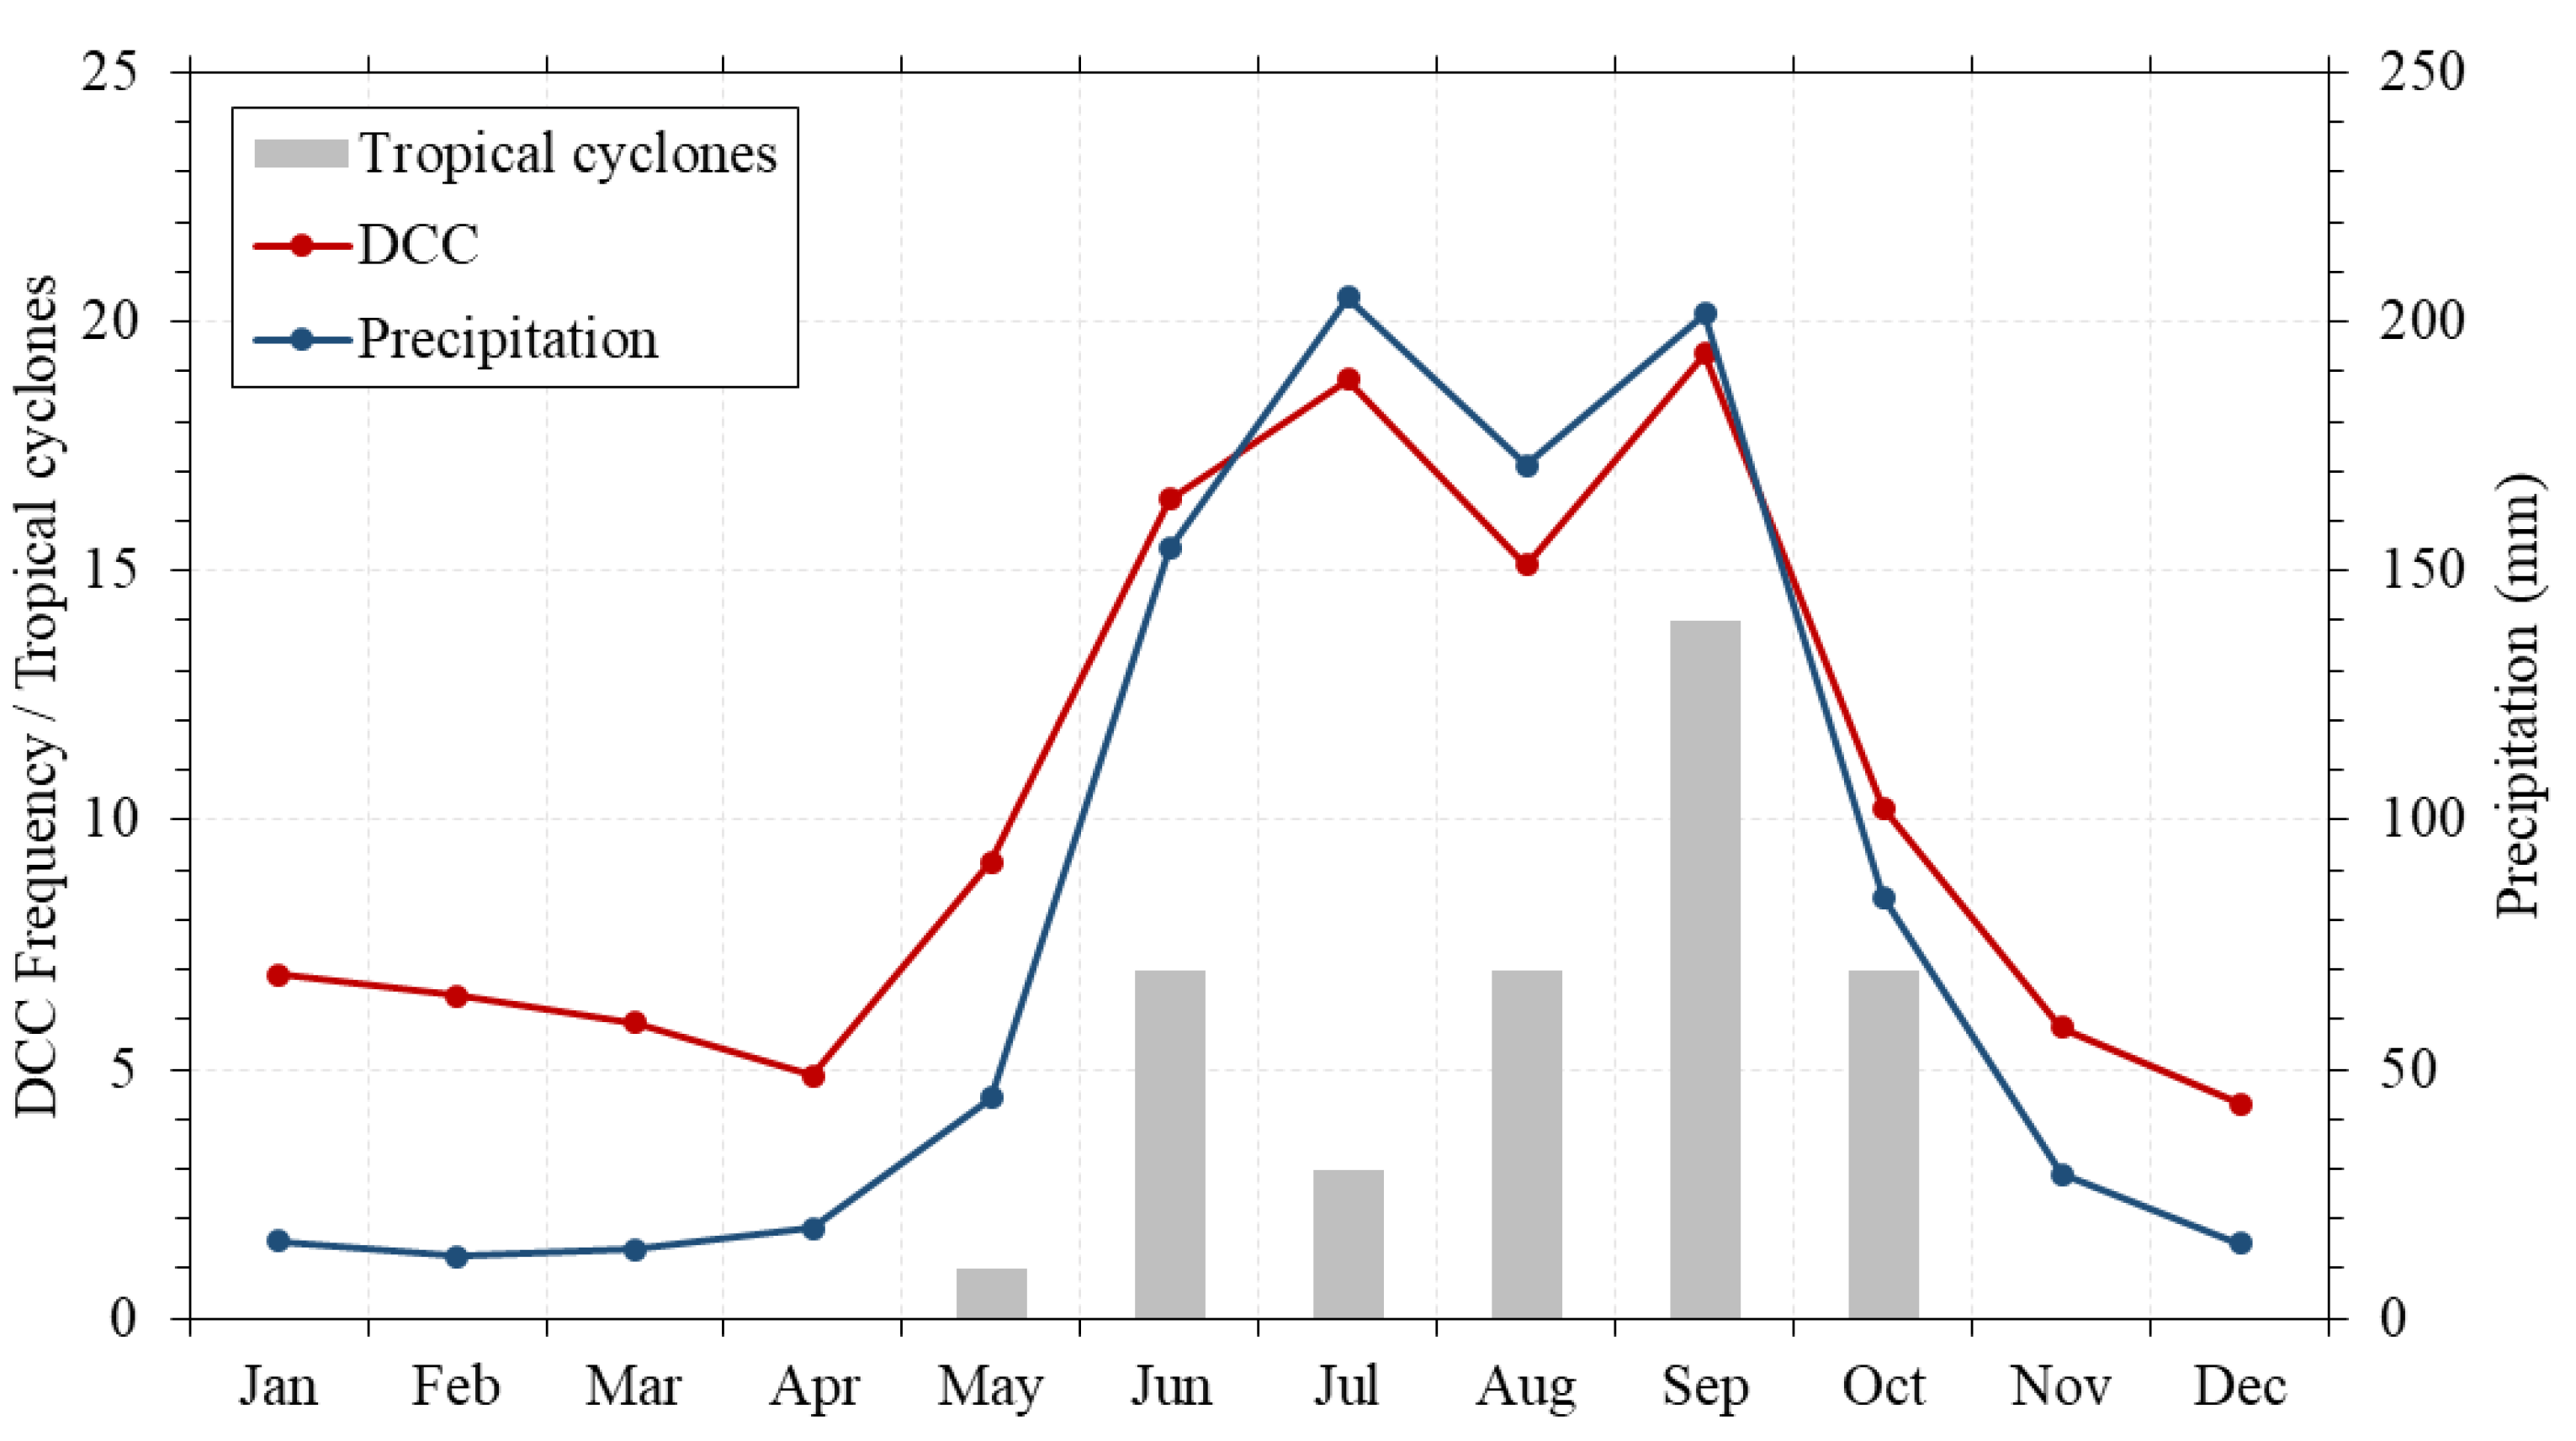
4.2. Spatio-Temporal Distribution of Deep Convective Clouds and Severe Weather Events
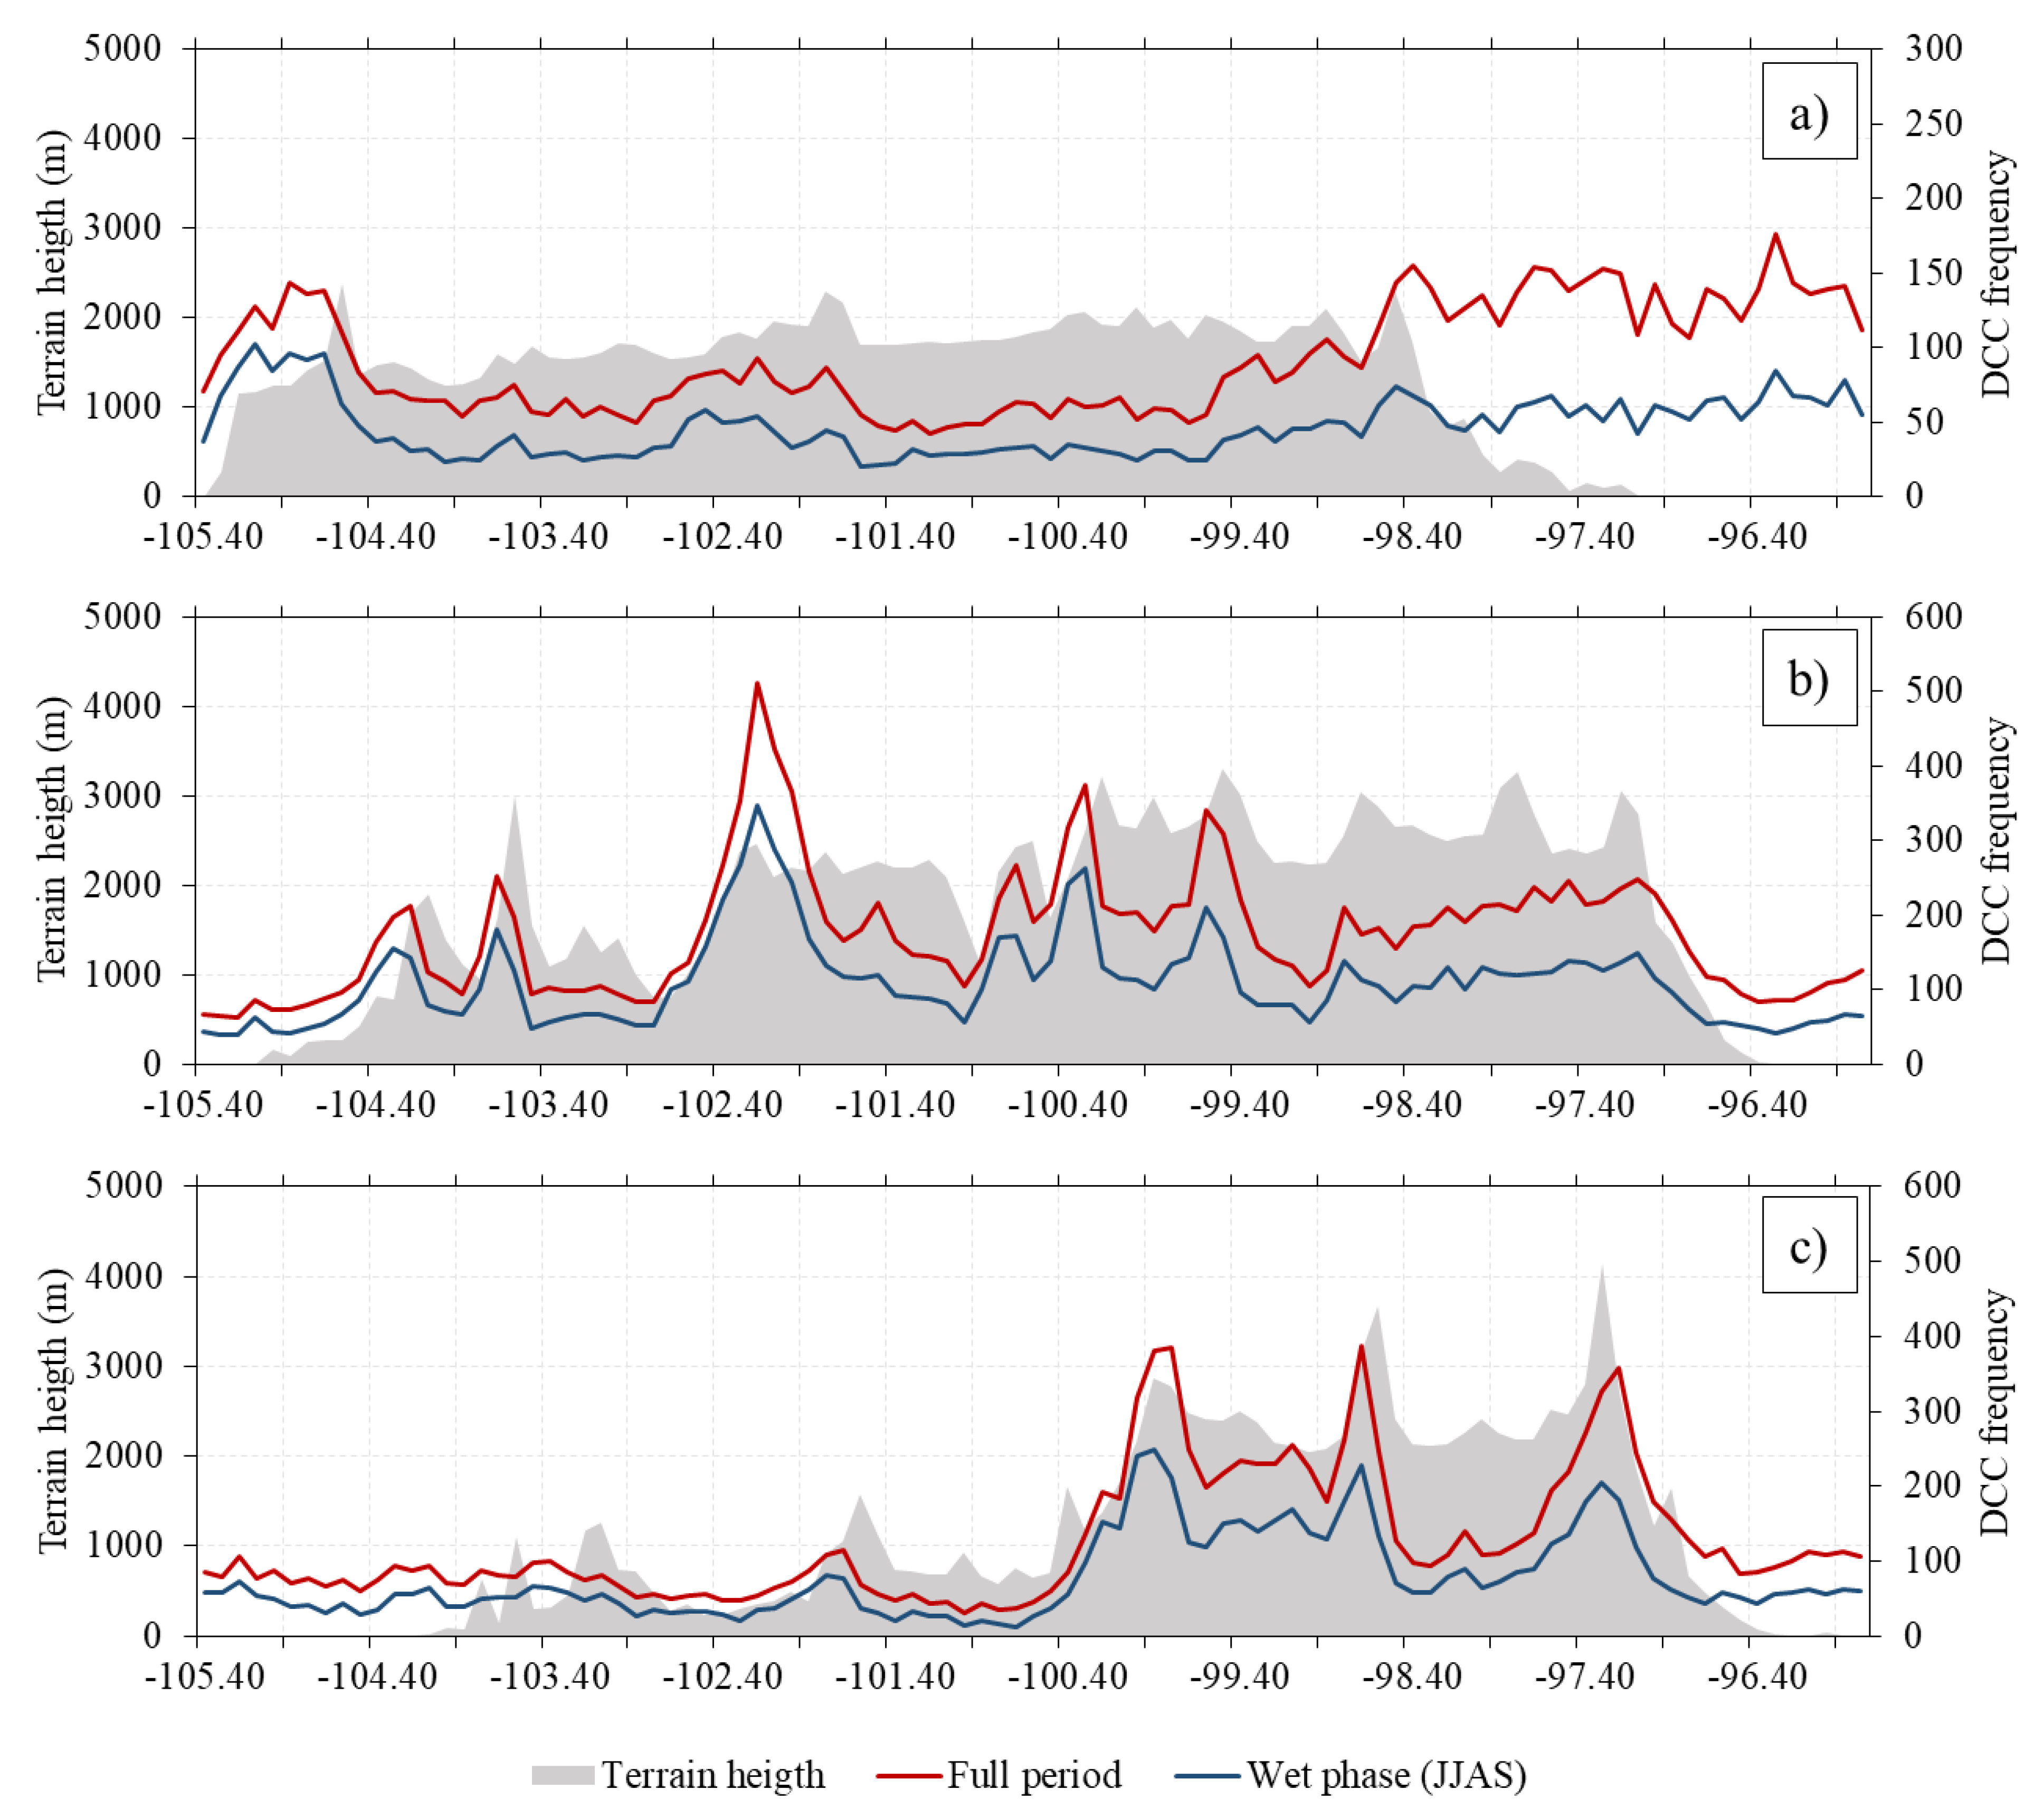
4.3. Relation to Terrain Height
4.4. Sub-Region Analysis
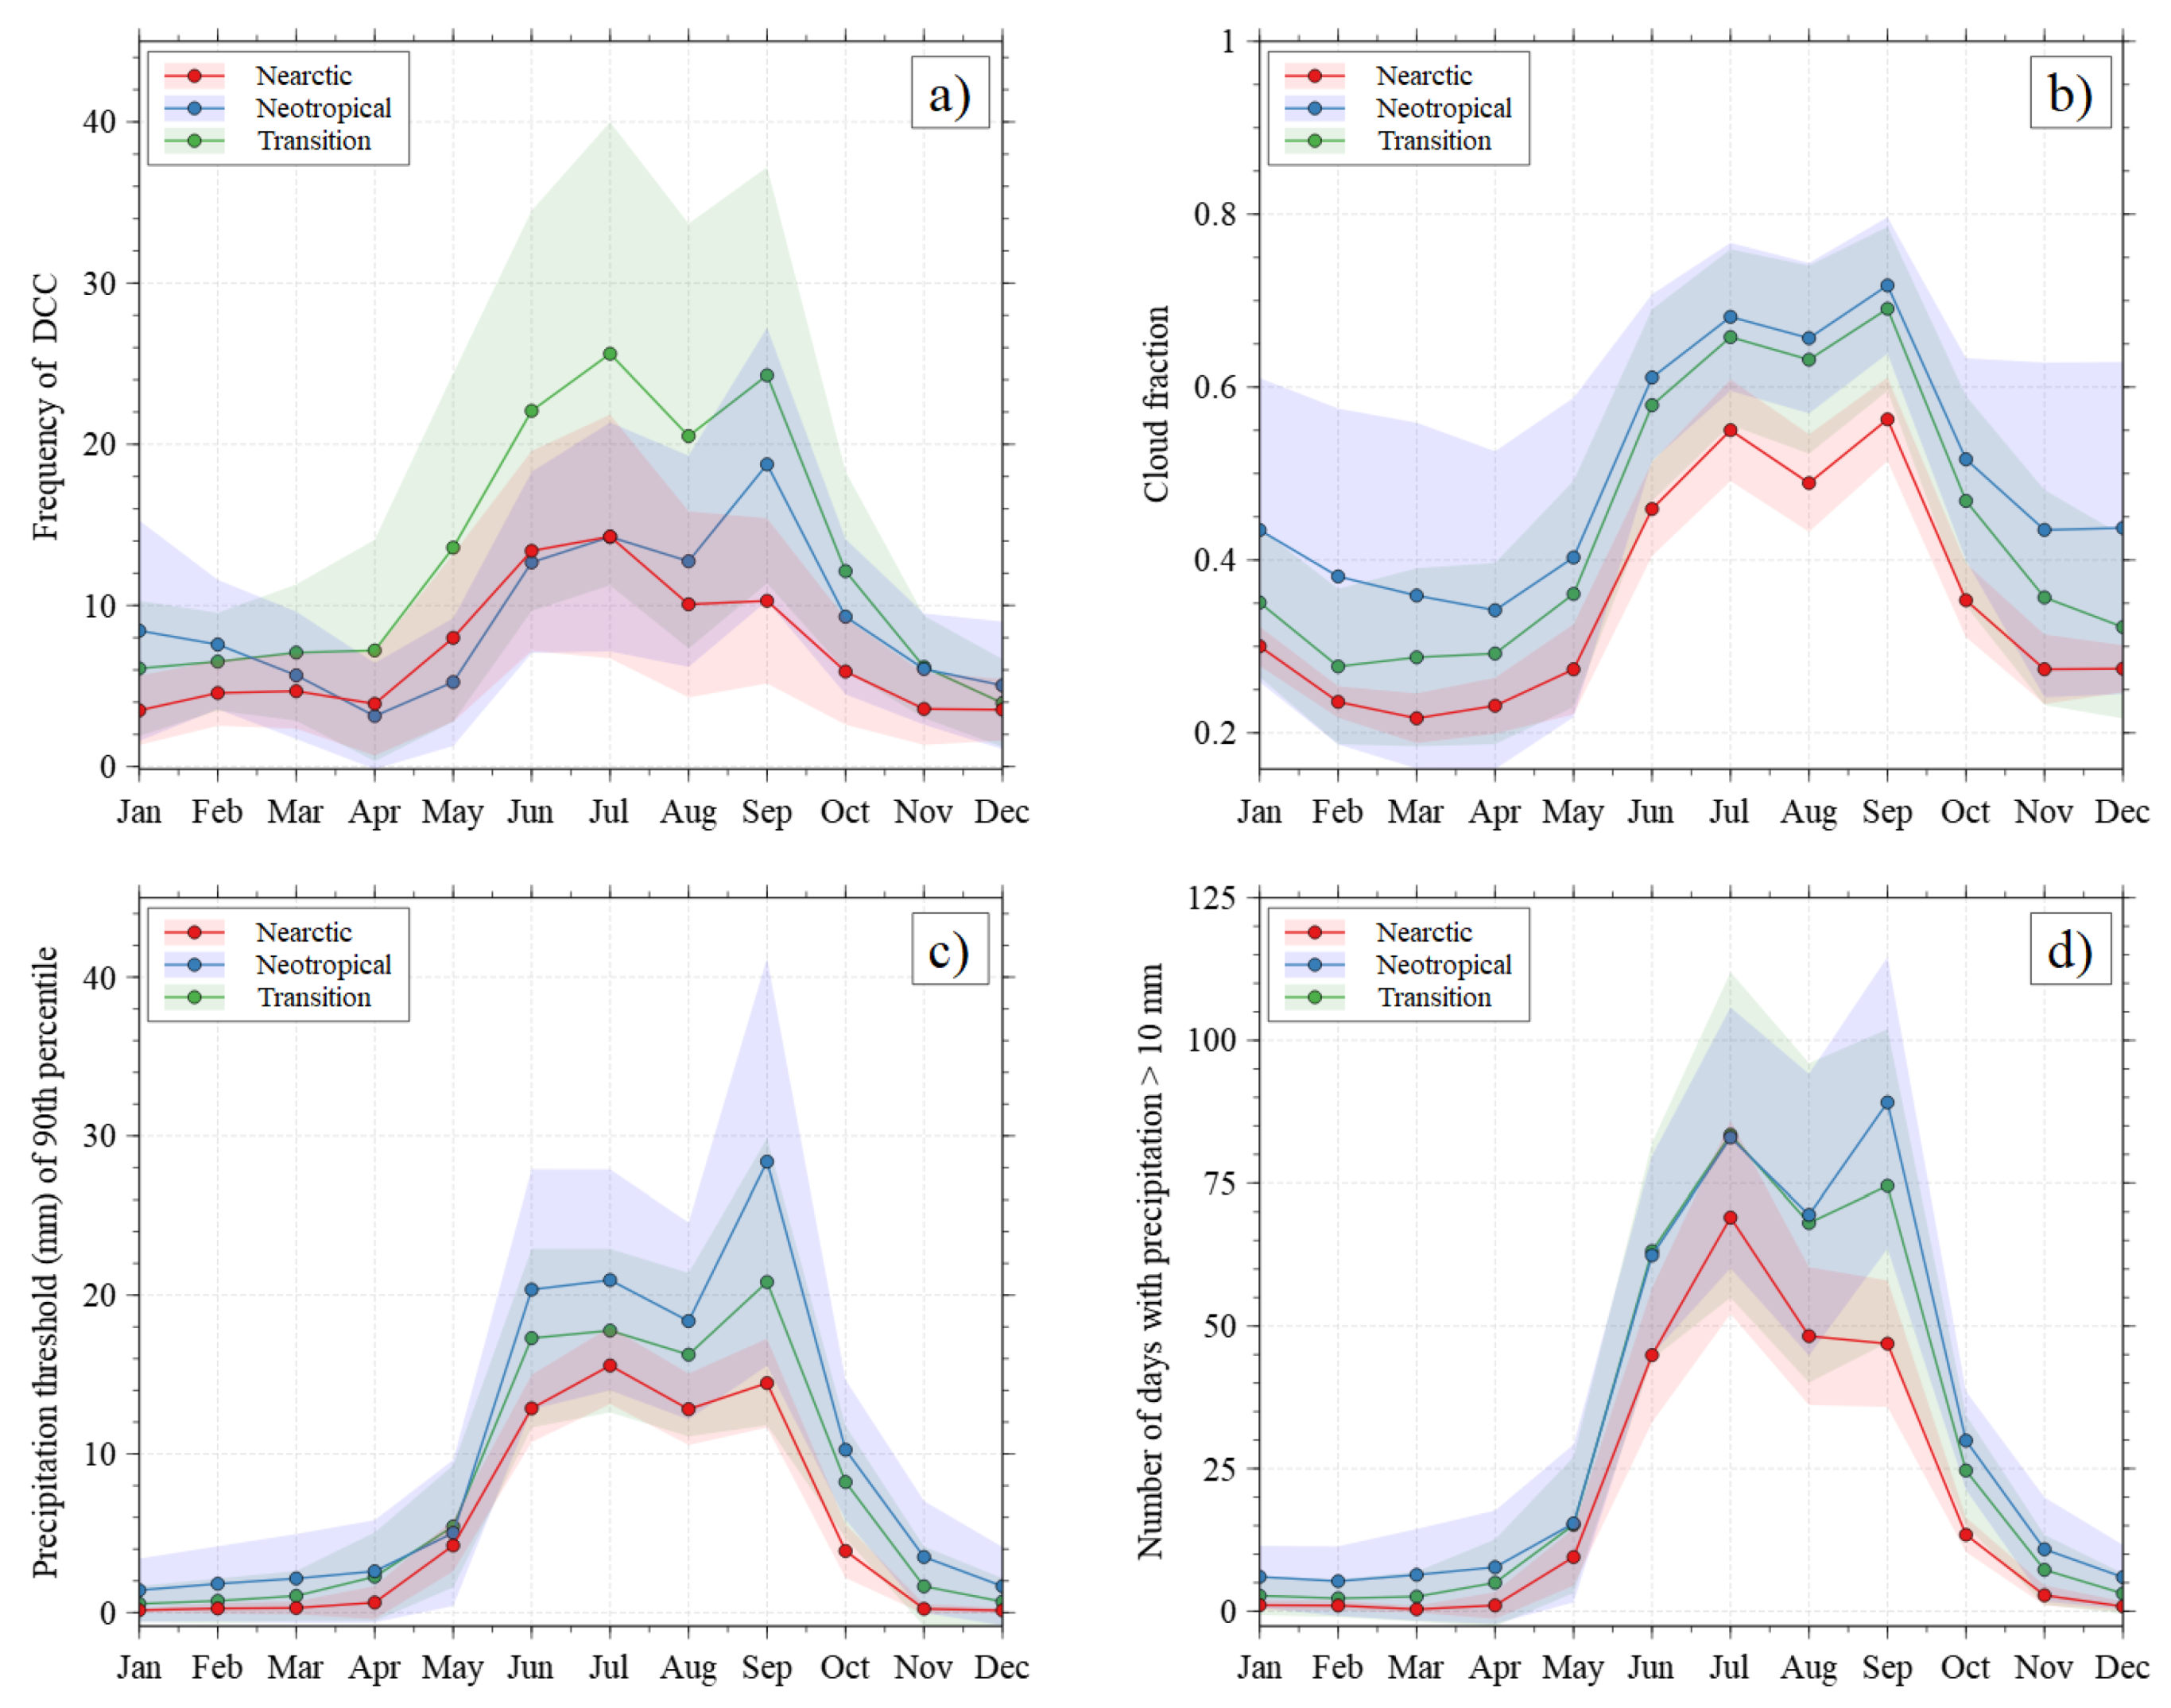
4.5. Inter-Annual Variability
5. Conclusions
Supplementary Materials
Author Contributions
Funding
Data Availability Statement
Acknowledgments
Conflicts of Interest
Abbreviations
| AVHRR | Advanced Very-High Resolution Radiometer |
| CHIRPS | Climate Hazards Group Infrared Precipitation with Station data |
| CF | Cloud fraction |
| COT | Cloud optical thicknesses |
| CTP | Cloud top pressure |
| DCC | Deep convective cloud |
| GOES | Geostationary Operational Environmental Satellite |
| ISCCP | International Satellite Cloud Climatology Project |
| MCS | Mesoscale convective systems |
| MODIS | Moderate Resolution Imaging Spectroradiometer |
| TMVB | Trans-Mexican Volcanic Belt |
Appendix A
| 1 | Urban and built-up land |
| 2 | Dryland cropland and pasture |
| 3 | Irrigated cropland and pasture |
| 4 | Mixed dryland/irrigated cropland and pasture |
| 5 | Cropland/grassland mosaic |
| 6 | Cropland/woodland mosaic |
| 7 | Grassland |
| 8 | Shrubland |
| 9 | Mixed shrubland/grassland |
| 10 | Savanna |
| 11 | Deciduous broadleaf forest |
| 12 | Deciduous needleaf forest |
| 13 | Evergreen broadleaf forest |
| 14 | Evergreen needleaf forest |
| 15 | Mixed forest |
| 16 | Water bodies |
| 17 | Herbaceous wetland |
| 18 | Wooded wetland |
| 19 | Barren or sparsely vegetated |
| 20 | Herbaceous tundra |
| 21 | Wooded tundra |
| 22 | Mixed tundra |
| 23 | Bare ground tundra |
| 24 | Snow or ice |
| 100 | Unclassified |
References
- Bony, S.; Stevens, B.; Frierson, D.M.; Jakob, C.; Kageyama, M.; Pincus, R.; Shepherd, T.G.; Sherwood, S.C.; Siebesma, A.P.; Sobel, A.H.; et al. Clouds, circulation and climate sensitivity. Nat. Geosci. 2015, 8, 261. [Google Scholar] [CrossRef]
- Stephens, G.L. Cloud feedbacks in the climate system: A critical review. J. Clim. 2005, 18, 237–273. [Google Scholar] [CrossRef] [Green Version]
- Fu, Q.; Yang, P.; Sun, W. An accurate parameterization of the infrared radiative properties of cirrus clouds for climate models. J. Clim. 1998, 11, 2223–2237. [Google Scholar] [CrossRef]
- Tselioudis, G.; Jakob, C. Evaluation of midlatitude cloud properties in a weather and a climate model: Dependence on dynamic regime and spatial resolution. J. Geophys. Res. Atmos. 2002, 107, AAC-14. [Google Scholar] [CrossRef] [Green Version]
- King, M.D.; Platnick, S.; Menzel, W.P.; Ackerman, S.A.; Hubanks, P.A. Spatial and temporal distribution of clouds observed by MODIS onboard the Terra and Aqua satellites. IEEE Trans. Geosci. Remote Sens. 2013, 51, 3826–3852. [Google Scholar] [CrossRef]
- Tan, J.; Jakob, C.; Rossow, W.B.; Tselioudis, G. Increases in tropical rainfall driven by changes in frequency of organized deep convection. Nature 2015, 519, 451–454. [Google Scholar] [CrossRef] [PubMed]
- Hoeppe, P. Trends in weather related disasters—Consequences for insurers and society. Weather Clim. Extrem. 2016, 11, 70–79. [Google Scholar] [CrossRef] [Green Version]
- Groenemeijer, P.; Púčik, T.; Holzer, A.M.; Antonescu, B.; Riemann-Campe, K.; Schultz, D.M.; Kühne, T.; Feuerstein, B.; Brooks, H.E.; Doswell, C.A., III; et al. Severe convective storms in Europe: Ten years of research and education at the European severe storms laboratory. Bull. Am. Meteorol. Soc. 2017, 98, 2641–2651. [Google Scholar] [CrossRef]
- Alcántara-Ayala, I. Disasters in Mexico and Central America: A little bit more than a century of natural hazards. Dev. Earth Surf. Process. 2009, 13, 75–97. [Google Scholar]
- Yano, J.I.; Ziemiański, M.Z.; Cullen, M.; Termonia, P.; Onvlee, J.; Bengtsson, L.; Carrassi, A.; Davy, R.; Deluca, A.; Gray, S.L.; et al. Scientific challenges of convective-scale numerical weather prediction. Bull. Am. Meteorol. Soc. 2018, 99, 699–710. [Google Scholar] [CrossRef]
- Sun, J.; Xue, M.; Wilson, J.W.; Zawadzki, I.; Ballard, S.P.; Onvlee-Hooimeyer, J.; Joe, P.; Barker, D.M.; Li, P.W.; Golding, B.; et al. Use of NWP for nowcasting convective precipitation: Recent progress and challenges. Bull. Am. Meteorol. Soc. 2014, 95, 409–426. [Google Scholar] [CrossRef] [Green Version]
- Martius, O.; Hering, A.; Kunz, M.; Manzato, A.; Mohr, S.; Nisi, L.; Trefalt, S. Challenges and Recent Advances in Hail Research. Bull. Am. Meteorol. Soc. 2018, 99, ES51–ES54. [Google Scholar] [CrossRef] [Green Version]
- Johnson, R.H.; Mapes, B.E. Mesoscale processes and severe convective weather. In Severe Convective Storms; Springer: Berlin, Germany, 2001; pp. 71–122. [Google Scholar]
- Serafin, S.; Adler, B.; Cuxart, J.; De Wekker, S.F.; Gohm, A.; Grisogono, B.; Kalthoff, N.; Kirshbaum, D.J.; Rotach, M.W.; Schmidli, J.; et al. Exchange processes in the atmospheric boundary layer over mountainous terrain. Atmosphere 2018, 9, 102. [Google Scholar] [CrossRef] [Green Version]
- Doswell, C.A., III; Brooks, H.E.; Maddox, R.A. Flash flood forecasting: An ingredients-based methodology. Weather Forecast. 1996, 11, 560–581. [Google Scholar] [CrossRef]
- Brooks, H.E.; Lee, J.W.; Craven, J.P. The spatial distribution of severe thunderstorm and tornado environments from global reanalysis data. Atmos. Res. 2003, 67, 73–94. [Google Scholar] [CrossRef]
- Taszarek, M.; Brooks, H.E.; Czernecki, B.; Szuster, P.; Fortuniak, K. Climatological aspects of convective parameters over Europe: A comparison of ERA-interim and sounding data. J. Clim. 2018, 31, 4281–4308. [Google Scholar] [CrossRef]
- Matsudo, C.; Salio, P.V. Severe weather reports and proximity to deep convection over Northern Argentina. Atmos. Res. 2011, 100, 523–537. [Google Scholar] [CrossRef]
- Goudenhoofdt, E.; Delobbe, L. Statistical characteristics of convective storms in Belgium derived from volumetric weather radar observations. J. Appl. Meteorol. Climatol. 2013, 52, 918–934. [Google Scholar] [CrossRef]
- Devasthale, A.; Fueglistaler, S. A climatological perspective of deep convection penetrating the TTL during the Indian summer monsoon from the AVHRR and MODIS instruments. Atmos. Chem. Phys. 2010, 10, 4573–4582. [Google Scholar] [CrossRef] [Green Version]
- Takahashi, H.; Luo, Z.J. Characterizing tropical overshooting deep convection from joint analysis of CloudSat and geostationary satellite observations. J. Geophys. Res. Atmos. 2014, 119, 112–121. [Google Scholar] [CrossRef]
- Carbajal Henken, C.; Schmeits, M.J.; Deneke, H.; Roebeling, R.A. Using MSG-SEVIRI cloud physical properties and weather radar observations for the detection of Cb/TCu clouds. J. Appl. Meteorol. Climatol. 2011, 50, 1587–1600. [Google Scholar] [CrossRef]
- Rosenfeld, D.; Woodley, W.L.; Lerner, A.; Kelman, G.; Lindsey, D.T. Satellite detection of severe convective storms by their retrieved vertical profiles of cloud particle effective radius and thermodynamic phase. J. Geophys. Res. Atmos. 2008, 113. [Google Scholar] [CrossRef] [Green Version]
- Valdés-Manzanilla, A. Mesoscale convective systems in NW Mexico during the strong ENSO events of 1997–1999. Atmósfera 2015, 28, 143–148. [Google Scholar] [CrossRef] [Green Version]
- Zúñiga, E.; Magaña, V. Vulnerability and risk to intense rainfall in Mexico: The effect of land use cover change. Investig. Geogr. 2018, 95, 1–18. [Google Scholar]
- Kucieńska, B.; Raga, G.; Rodríguez, O. Cloud-to-ground lightning over Mexico and adjacent oceanic regions: A preliminary climatology using the WWLLN dataset. In Annales Geophysicae; Copernicus GmbH: Antalya, Turkey, 2010; Volume 28, pp. 2047–2057. [Google Scholar]
- Novo, S.; Raga, G.B. The properties of convective storms in central Mexico: A radar and lightning approach. Atmósfera 2013, 26, 461–472. [Google Scholar] [CrossRef] [Green Version]
- Edwards, R. Supercells of the Serranías del Burro (Mexico). In Proceedings of the 23rd Confeference on Severe Local Storms, St. Louis, MO, USA, 6–10 November 2006. [Google Scholar]
- León-Cruz, J.F.; Carbajal, N.; Pineda-Martínez, L.F. Meteorological analysis of the tornado in Ciudad Acuña, Coahuila State, Mexico, on May 25, 2015. Nat. Hazards 2017, 89, 423–439. [Google Scholar] [CrossRef]
- León-Cruz, J.F.; Carbajal, N.; Pineda-Martínez, L. The role of complex terrain in the generation of tornadoes in the west of Mexico. Nat. Hazards 2019, 97, 1–19. [Google Scholar] [CrossRef]
- Carbajal, N.; León-Cruz, J.F.; Pineda-Martínez, L.F.; Tuxpan-Vargas, J.; Gaviño-Rodríguez, J.H. Occurrence of Anticyclonic Tornadoes in a Topographically Complex Region of Mexico. Adv. Meteorol. 2019, 2019, 1–11. [Google Scholar] [CrossRef]
- León-Cruz, J.F. Climatología y Meteorología de Tornados en México. Ph.D. Thesis, Instituto Potosino de Investigación Científica y Tecnológica, A.C., San Luis Potosí, Mexico, 2019. [Google Scholar]
- Morrone, J.J.; Escalante, T.; Rodríguez-Tapia, G. Mexican biogeographic provinces: Map and shapefiles. Zootaxa 2017, 4277, 277–279. [Google Scholar] [CrossRef]
- Abatzoglou, J.T.; Hatchett, B.J.; Fox-Hughes, P.; Gershunov, A.; Nauslar, N.J. Global Climatology of Synoptically-Forced Downslope Winds. Int. J. Climatol. 2020, 41, 31–50. [Google Scholar] [CrossRef]
- Platnick, S.; Ackerman, S.; King, M.; Meyer, K.; Menzel, W.; Holz, R.; Baum, B.; Yang, P. MODIS atmosphere L2 cloud product (06_L2). NASA MODIS Adapt. Process. Syst. Goddard Space Flight Cent. 2015, 10, 1–53. [Google Scholar]
- Platnick, S.; Meyer, K.G.; King, M.D.; Wind, G.; Amarasinghe, N.; Marchant, B.; Arnold, G.T.; Zhang, Z.; Hubanks, P.A.; Holz, R.E.; et al. The MODIS cloud optical and microphysical products: Collection 6 updates and examples from Terra and Aqua. IEEE Trans. Geosci. Remote Sens. 2016, 55, 502–525. [Google Scholar] [CrossRef] [Green Version]
- Platnick, S.; King, M.D.; Ackerman, S.A.; Menzel, W.P.; Baum, B.A.; Riédi, J.C.; Frey, R.A. The MODIS cloud products: Algorithms and examples from Terra. IEEE Trans. Geosci. Remote Sens. 2003, 41, 459–473. [Google Scholar] [CrossRef] [Green Version]
- Yuan, T.; Li, Z. General macro-and microphysical properties of deep convective clouds as observed by MODIS. J. Clim. 2010, 23, 3457–3473. [Google Scholar] [CrossRef] [Green Version]
- Jin, D.; Oreopoulos, L.; Lee, D.; Tan, J.; Kim, K.M. Large-Scale Characteristics of Tropical Convective Systems Through the Prism of Cloud Regime. J. Geophys. Res. Atmos. 2020, 125, e2019JD031157. [Google Scholar] [CrossRef] [PubMed]
- Ntwali, D.; Chen, H. Diurnal spatial distributions of aerosol optical and cloud micro-macrophysics properties in Africa based on MODIS observations. Atmos. Environ. 2018, 182, 252–262. [Google Scholar] [CrossRef]
- Rossow, W.B.; Schiffer, R.A. Advances in understanding clouds from ISCCP. Bull. Am. Meteorol. Soc. 1999, 80, 2261–2288. [Google Scholar] [CrossRef] [Green Version]
- Young, A.H.; Bates, J.J.; Curry, J.A. Application of cloud vertical structure from CloudSat to investigate MODIS-derived cloud properties of cirriform, anvil, and deep convective clouds. J. Geophys. Res. Atmos. 2013, 118, 4689–4699. [Google Scholar] [CrossRef]
- Price, C. Global thunderstorm activity. In Sprites, Elves and Intense Lightning Discharges; Springer: Berlin, Germany, 2006; pp. 85–99. [Google Scholar]
- Funk, C.; Peterson, P.; Landsfeld, M.; Pedreros, D.; Verdin, J.; Shukla, S.; Husak, G.; Rowland, J.; Harrison, L.; Hoell, A.; et al. The climate hazards infrared precipitation with stations—a new environmental record for monitoring extremes. Sci. Data 2015, 2, 150066. [Google Scholar] [CrossRef] [Green Version]
- Katsanos, D.; Retalis, A.; Michaelides, S. Validation of a high-resolution precipitation database (CHIRPS) over Cyprus for a 30-year period. Atmos. Res. 2016, 169, 459–464. [Google Scholar] [CrossRef]
- Katsanos, D.; Retalis, A.; Tymvios, F.; Michaelides, S. Analysis of precipitation extremes based on satellite (CHIRPS) and in situ dataset over Cyprus. Nat. Hazards 2016, 83, 53–63. [Google Scholar] [CrossRef]
- Paredes-Trejo, F.J.; Barbosa, H.; Kumar, T.L. Validating CHIRPS-based satellite precipitation estimates in Northeast Brazil. J. Arid. Environ. 2017, 139, 26–40. [Google Scholar] [CrossRef]
- Martinez-Lopez, B.; Quintanar, A.; Cabos-Narvaez, W.; Gay-Garcia, C.; Sein, D. Nonlinear trends and nonstationary oscillations as extracted from annual accumulated precipitation at Mexico City. Earth Space Sci. 2018, 5, 473–485. [Google Scholar] [CrossRef]
- Perdigón-Morales, J.; Romero-Centeno, R.; Pérez, P.O.; Barrett, B.S. The midsummer drought in Mexico: Perspectives on duration and intensity from the CHIRPS precipitation database. Int. J. Climatol. 2018, 38, 2174–2186. [Google Scholar] [CrossRef]
- Climate Hazards Center. CHIRPS: Rainfall Estimates from Rain Gauge and Satellite Observations; Climate Hazards Center: Santa Barbara, CA, USA, 2015. [Google Scholar]
- Ochoa, C.A.; Quintanar, A.I.; Raga, G.B.; Baumgardner, D. Changes in intense precipitation events in Mexico City. J. Hydrometeorol. 2015, 16, 1804–1820. [Google Scholar] [CrossRef]
- Pérez-Méndez, M.; Tejeda-Martínez, A.; Fitzjarrald, D.R. Diurnal Variation of Rainfall in a Tropical Coastal Region with Complex Orography. Atmosphere 2019, 10, 604. [Google Scholar] [CrossRef] [Green Version]
- Miller, S.; Keim, B.; Talbot, R.; Mao, H. Sea breeze: Structure, forecasting, and impacts. Rev. Geophys. 2003, 41. [Google Scholar] [CrossRef] [Green Version]
- Passalacqua, G.; Sheinbaum, J.; Martinez, J. Sea surface temperature influence on a winter cold front position and propagation: Air–sea interactions of the ‘Nortes’ winds in the Gulf of Mexico. Atmos. Sci. Lett. 2016, 17, 302–307. [Google Scholar] [CrossRef]
- Luna-Niño, R.; Cavazos, T. Formation of a coastal barrier jet in the Gulf of Mexico due to the interaction of cold fronts with the S ierra M adre O riental mountain range. Q. J. R. Meteorol. Soc. 2018, 144, 115–128. [Google Scholar] [CrossRef]
- Cavazos, T.; Hastenrath, S. Convection and rainfall over Mexico and their modulation by the Southern Oscillation. Int. J. Climatol. 1990, 10, 377–386. [Google Scholar] [CrossRef]
- Pineda-Martinez, L.F.; Carbajal, N.; Campos-Ramos, A.A.; Noyola-Medrano, C.; Aragón-Piña, A. Numerical research of extreme wind-induced dust transport in a semi-arid human-impacted region of Mexico. Atmos. Environ. 2011, 45, 4652–4660. [Google Scholar] [CrossRef]
- Giovannettone, J.P.; Barros, A.P. A remote sensing survey of the role of landform on the organization of orographic precipitation in central and southern Mexico. J. Hydrometeorol. 2008, 9, 1267–1283. [Google Scholar] [CrossRef]
- Knapp, K.R.; Kruk, M.C.; Levinson, D.H.; Diamond, H.J.; Neumann, C.J. The international best track archive for climate stewardship (IBTrACS) unifying tropical cyclone data. Bull. Am. Meteorol. Soc. 2010, 91, 363–376. [Google Scholar] [CrossRef]
- Jáuregui, E. Climatology of landfalling hurricanes and tropical storms in Mexico. Atmósfera 2003, 16, 193–204. [Google Scholar]
- Pineda-Martinez, L.F.; Carbajal, N. Mesoscale numerical modeling of meteorological events in a strong topographic gradient in the northeastern part of Mexico. Clim. Dyn. 2009, 33, 297–312. [Google Scholar] [CrossRef]
- Pineda-Martínez, L.F.; Carbajal, N. Climatic analysis linked to land vegetation cover of Mexico by applying multivariate statistical and clustering analysis. Atmósfera 2017, 30, 233–242. [Google Scholar] [CrossRef] [Green Version]
- Magaña, V.; Amador, J.A.; Medina, S. The midsummer drought over Mexico and Central America. J. Clim. 1999, 12, 1577–1588. [Google Scholar] [CrossRef]
- Magaña, V.; Vázquez, J.L.; Pérez, J.L.; Pérez, J.B. Impact of El Niño on precipitation in Mexico. Geofísica Int. 2003, 42, 313–330. [Google Scholar]
- Breña-Naranjo, J.A.; Pedrozo-Acuña, A.; Pozos-Estrada, O.; Jiménez-López, S.A.; López-López, M.R. The contribution of tropical cyclones to rainfall in Mexico. Phys. Chem. Earth Parts A/B/C 2015, 83, 111–122. [Google Scholar] [CrossRef]
- Mo, K.C.; Chelliah, M.; Carrera, M.L.; Higgins, R.W.; Ebisuzaki, W. Atmospheric moisture transport over the United States and Mexico as evaluated in the NCEP regional reanalysis. J. Hydrometeorol. 2005, 6, 710–728. [Google Scholar] [CrossRef]
- Gimeno, L.; Dominguez, F.; Nieto, R.; Trigo, R.; Drumond, A.; Reason, C.J.; Taschetto, A.S.; Ramos, A.M.; Kumar, R.; Marengo, J. Major mechanisms of atmospheric moisture transport and their role in extreme precipitation events. Annu. Rev. Environ. Resour. 2016, 41, 117–141. [Google Scholar] [CrossRef] [Green Version]
- Serra, Y.L.; Kiladis, G.N.; Hodges, K.I. Tracking and mean structure of easterly waves over the Intra-Americas Sea. J. Clim. 2010, 23, 4823–4840. [Google Scholar] [CrossRef]
- Bhushan, S.; Barros, A. A numerical study to investigate the relationship between moisture convergence patterns and orography in central Mexico. J. Hydrometeorol. 2007, 8, 1264–1284. [Google Scholar] [CrossRef]
- Xu, H.; Xie, S.P.; Wang, Y.; Small, R.J. Effects of Central American mountains on the eastern Pacific winter ITCZ and moisture transport. J. Clim. 2005, 18, 3856–3873. [Google Scholar] [CrossRef]
- Pavia, E.G.; Graef, F.; Reyes, J. PDO–ENSO effects in the climate of Mexico. J. Clim. 2006, 19, 6433–6438. [Google Scholar] [CrossRef]
- Barlow, M.; Salstein, D. Summertime influence of the Madden-Julian Oscillation on daily rainfall over Mexico and Central America. Geophys. Res. Lett. 2006, 33. [Google Scholar] [CrossRef]
- Bravo-Cabrera, J.L.; Azpra-Romero, E.; Zarraluqui-Such, V.; Gay-García, C. Effects of El Niño in Mexico during rainy and dry seasons: An extended treatment. Atmósfera 2017, 30, 221–232. [Google Scholar] [CrossRef] [Green Version]
- Schmit, T.J.; Gunshor, M.M.; Menzel, W.P.; Gurka, J.J.; Li, J.; Bachmeier, A.S. Introducing the next-generation Advanced Baseline Imager on GOES-R. Bull. Am. Meteorol. Soc. 2005, 86, 1079–1096. [Google Scholar] [CrossRef]
- Schmit, T.J.; Griffith, P.; Gunshor, M.M.; Daniels, J.M.; Goodman, S.J.; Lebair, W.J. A closer look at the ABI on the GOES-R series. Bull. Am. Meteorol. Soc. 2017, 98, 681–698. [Google Scholar] [CrossRef]


Publisher’s Note: MDPI stays neutral with regard to jurisdictional claims in published maps and institutional affiliations. |
© 2021 by the authors. Licensee MDPI, Basel, Switzerland. This article is an open access article distributed under the terms and conditions of the Creative Commons Attribution (CC BY) license (http://creativecommons.org/licenses/by/4.0/).
Share and Cite
León-Cruz, J.F.; Carbajal Henken, C.; Carbajal, N.; Fischer, J. Spatio-Temporal Distribution of Deep Convection Observed along the Trans-Mexican Volcanic Belt. Remote Sens. 2021, 13, 1215. https://0-doi-org.brum.beds.ac.uk/10.3390/rs13061215
León-Cruz JF, Carbajal Henken C, Carbajal N, Fischer J. Spatio-Temporal Distribution of Deep Convection Observed along the Trans-Mexican Volcanic Belt. Remote Sensing. 2021; 13(6):1215. https://0-doi-org.brum.beds.ac.uk/10.3390/rs13061215
Chicago/Turabian StyleLeón-Cruz, José Francisco, Cintia Carbajal Henken, Noel Carbajal, and Jürgen Fischer. 2021. "Spatio-Temporal Distribution of Deep Convection Observed along the Trans-Mexican Volcanic Belt" Remote Sensing 13, no. 6: 1215. https://0-doi-org.brum.beds.ac.uk/10.3390/rs13061215