Article

Spatio-Temporal Changes of Vegetation Net Primary Productivity and Its Driving Factors on the Qinghai-Tibetan Plateau from 2001 to 2017

School of Remote Sensing and Information Engineering, Wuhan University, Wuhan 430079, China
*
Author to whom correspondence should be addressed.
Submission received: 16 February 2021 / Revised: 14 April 2021 / Accepted: 16 April 2021 / Published: 17 April 2021

Abstract

:
The Qinghai-Tibetan Plateau (QTP) is the highest plateau in the world. Under the background of global change, it is of unique significance to study the net primary productivity (NPP) of vegetation on the QTP. Based on the Google Earth Engine (GEE) cloud computing platform, the spatio-temporal variation characteristics of the NPP on the QTP from 2001 to 2017 were studied, and the impacts of climate change, elevation and human activity on the NPP in the QTP were discussed. The mean and trend of NPP over the QTP were “high in the southeast and low in the northwest” during 2001–2017. The trend of NPP was mostly between 0 gC·m−2·yr−1 and 20 gC·m−2·yr−1 (regional proportion: 80.3%), and the coefficient of variation (CV) of NPP was mainly below 0.16 (regional proportion: 89.7%). Therefore, NPP was relatively stable in most regions of the QTP. Among the correlation coefficients between NPP and temperature, precipitation and human activities, the positive correlation accounted for 81.1%, 48.6% and 56.5% of the QTP area, respectively. Among the two climatic factors, the influence of temperature on NPP was greater than that of precipitation. The change of human activities and the high temperature at low altitude had positive effects on the increase of NPP.

1. Introduction

Vegetation net primary productivity (NPP) refers to the amount of organic matter accumulated by green plants per unit area and per unit time, which is reflected in the part of the organic carbon fixed by photosynthesis that is deducted from the respiration consumption of the plants themselves [1,2,3,4,5,6]. NPP not only directly reflects the productivity of vegetation communities under natural environmental conditions and represents the quality status of terrestrial ecosystems, but also plays an important role in determining the carbon source and confluence of ecosystems in regulating ecological processes, playing an important role in global change and carbon balance [7,8,9]. The Qinghai-Tibet Plateau (QTP), with a large area of forest, snow and ice resources, is the initiating and regulating region of climate change in the Northern Hemisphere [10]. Therefore, it is necessary to study the temporal and spatial evolution and influencing factors of vegetation NPP on the QTP.
NPP can represent the production capacity of plant communities under natural conditions. Scientific evaluation of ecosystem response to climate change is of great significance to the formulation of environmental policies [11,12]. Research on the relationship between vegetation NPP and climatic factors have made great progress in the 20th century [13]. Raich et al. [14] used the Terrestrial Ecosystem Model (TEM) to estimate the NPP value of vegetation in South America and found that water availability is the main factor affecting the interannual change of NPP in South America, but there are differences in influencing factors among different vegetation types. In recent years, with the continuous development and maturity of the remote sensing and geographic information system, many scholars have used the improved Carnegie–Ames–Stanford approach (CASA) model to study the spatial pattern characteristics and driving factors of NPP in the Heihe River Basin, northwest arid region, Guangxi province and northeast China [15,16,17,18]. The Moderate Resolution Imaging Spectroradiometer (MODIS) Net Primary Productivity (NPP) product (MOD17A3), an annual NPP derived from the biome-biogeochemical cycles (BIOME-BGC) remote-sensing process model, has also been widely used. Liu et al. [19] analyzed spatio-temporal variation characteristics of NPP of vegetation in Shandong province from 2000 to 2015 using MOD17A3 data, and the research shows that NPP as a whole presented an increasing trend, and human activities are the core factor to change NPP. Based on MOD17A3 data, Wang et al. [20] studied the spatio-temporal characteristics of NPP in China from 2000 to 2006. Furthermore, there are many studies on NPP in QTP. Piao et al. [21] used remote-sensing data and the CASA model to simulate the temporal and spatial variation characteristics of NPP on the QTP. Li et al. [22] simulated the NPP based on the CASA model and quantitatively assessed the relative roles of climate change and human activities in the desertification process of QTP. Guo et al. [23] found that in 2000–2015, the annual average NPP in the QTP decreased from southeast to northwest, and the center of gravity of NPP shifted significantly to the east in the arid region, where temperature and rainfall were the dominant factors of vegetation NPP, while in the rainforest-monsoon ecological zone in southeastern Tibet, slope aspect parameter was the dominant factor of vegetation NPP. Yang et al. The study of Yang et al. [24] showed that the spatial distribution of NPP in the main valley grassland on the southern slope of the Qilian Mountains increased from northwest to southeast.
Google Earth Engine (GEE) is a remote-sensing big data cloud computing platform with massive global earth science data. GEE has powerful computing power and efficiency, which can greatly reduce the amount of offline data needed, and then provide support for remote sensing data processing with long time series and large range. At present, the GEE cloud platform is being used for a lot of scientific research work [25,26,27,28,29], including global water and vegetation dynamic change detection, crop yield estimation, global forest change, etc. Yin et al. [30] studied the effects of different impact factors on NPP of forest, as well as the responses of forests with different NPP levels to climate change and short-term climate fluctuations using the GEE platform, and understood the temporal and spatial dynamics of NPP of global forest. Robinson et al. [31] developed two separate resolutions (30 m and 250 m) gross primary productivity (GPP) and NPP products for the conterminous United States region through GEE. GEE has become a powerful research tool in geoscience and related fields.
In recent decades, the analysis of the variation trend and characteristics of NPP have focused on a large scale and long time series. In the research of driving factors of NPP spatial change, the aforementioned studies have been based on factors including temperature, precipitation, and so on. Herein, we propose a framework for analyzing the temporal and spatial variation characteristics and influencing factors (temperature, precipitation, human activity and topography) of NPP in the QTP, China, using GEE. This aims to enrich the relevant research results of regional environmental change in the QTP, and provide decision support and scientific basis for the rational use of land resources and the protection of the ecological environment.

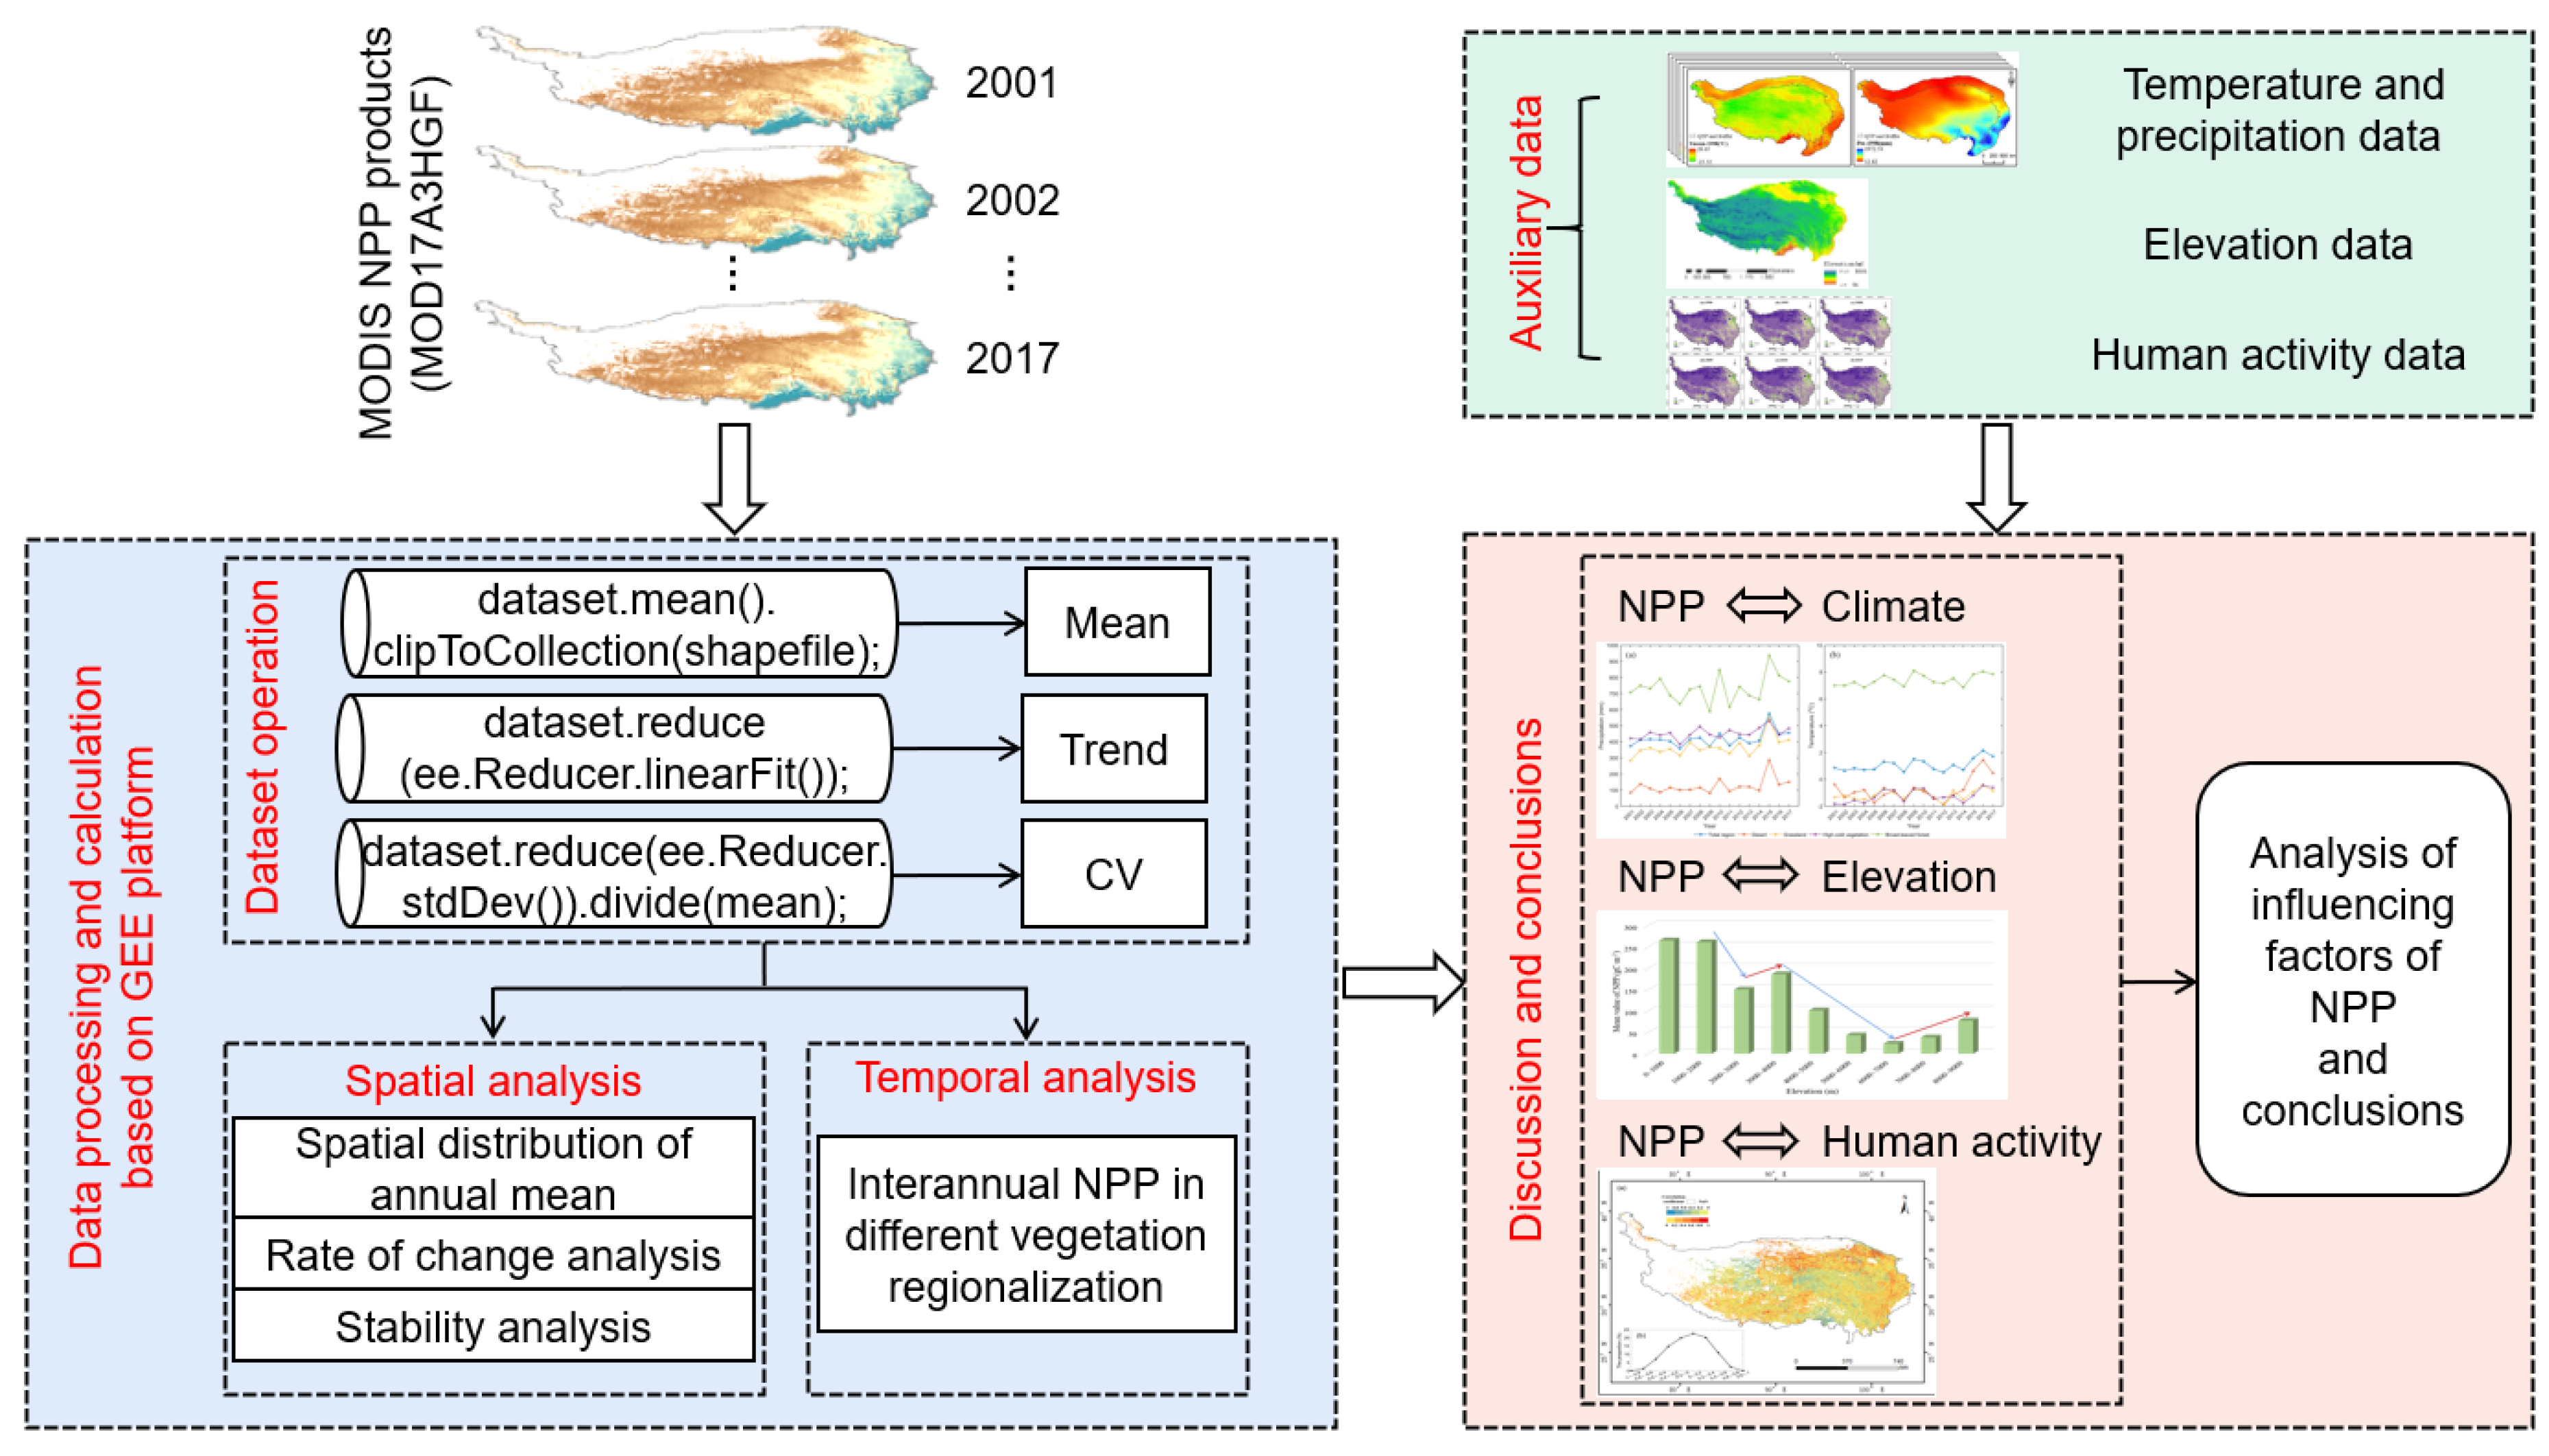
2. Materials and Methods

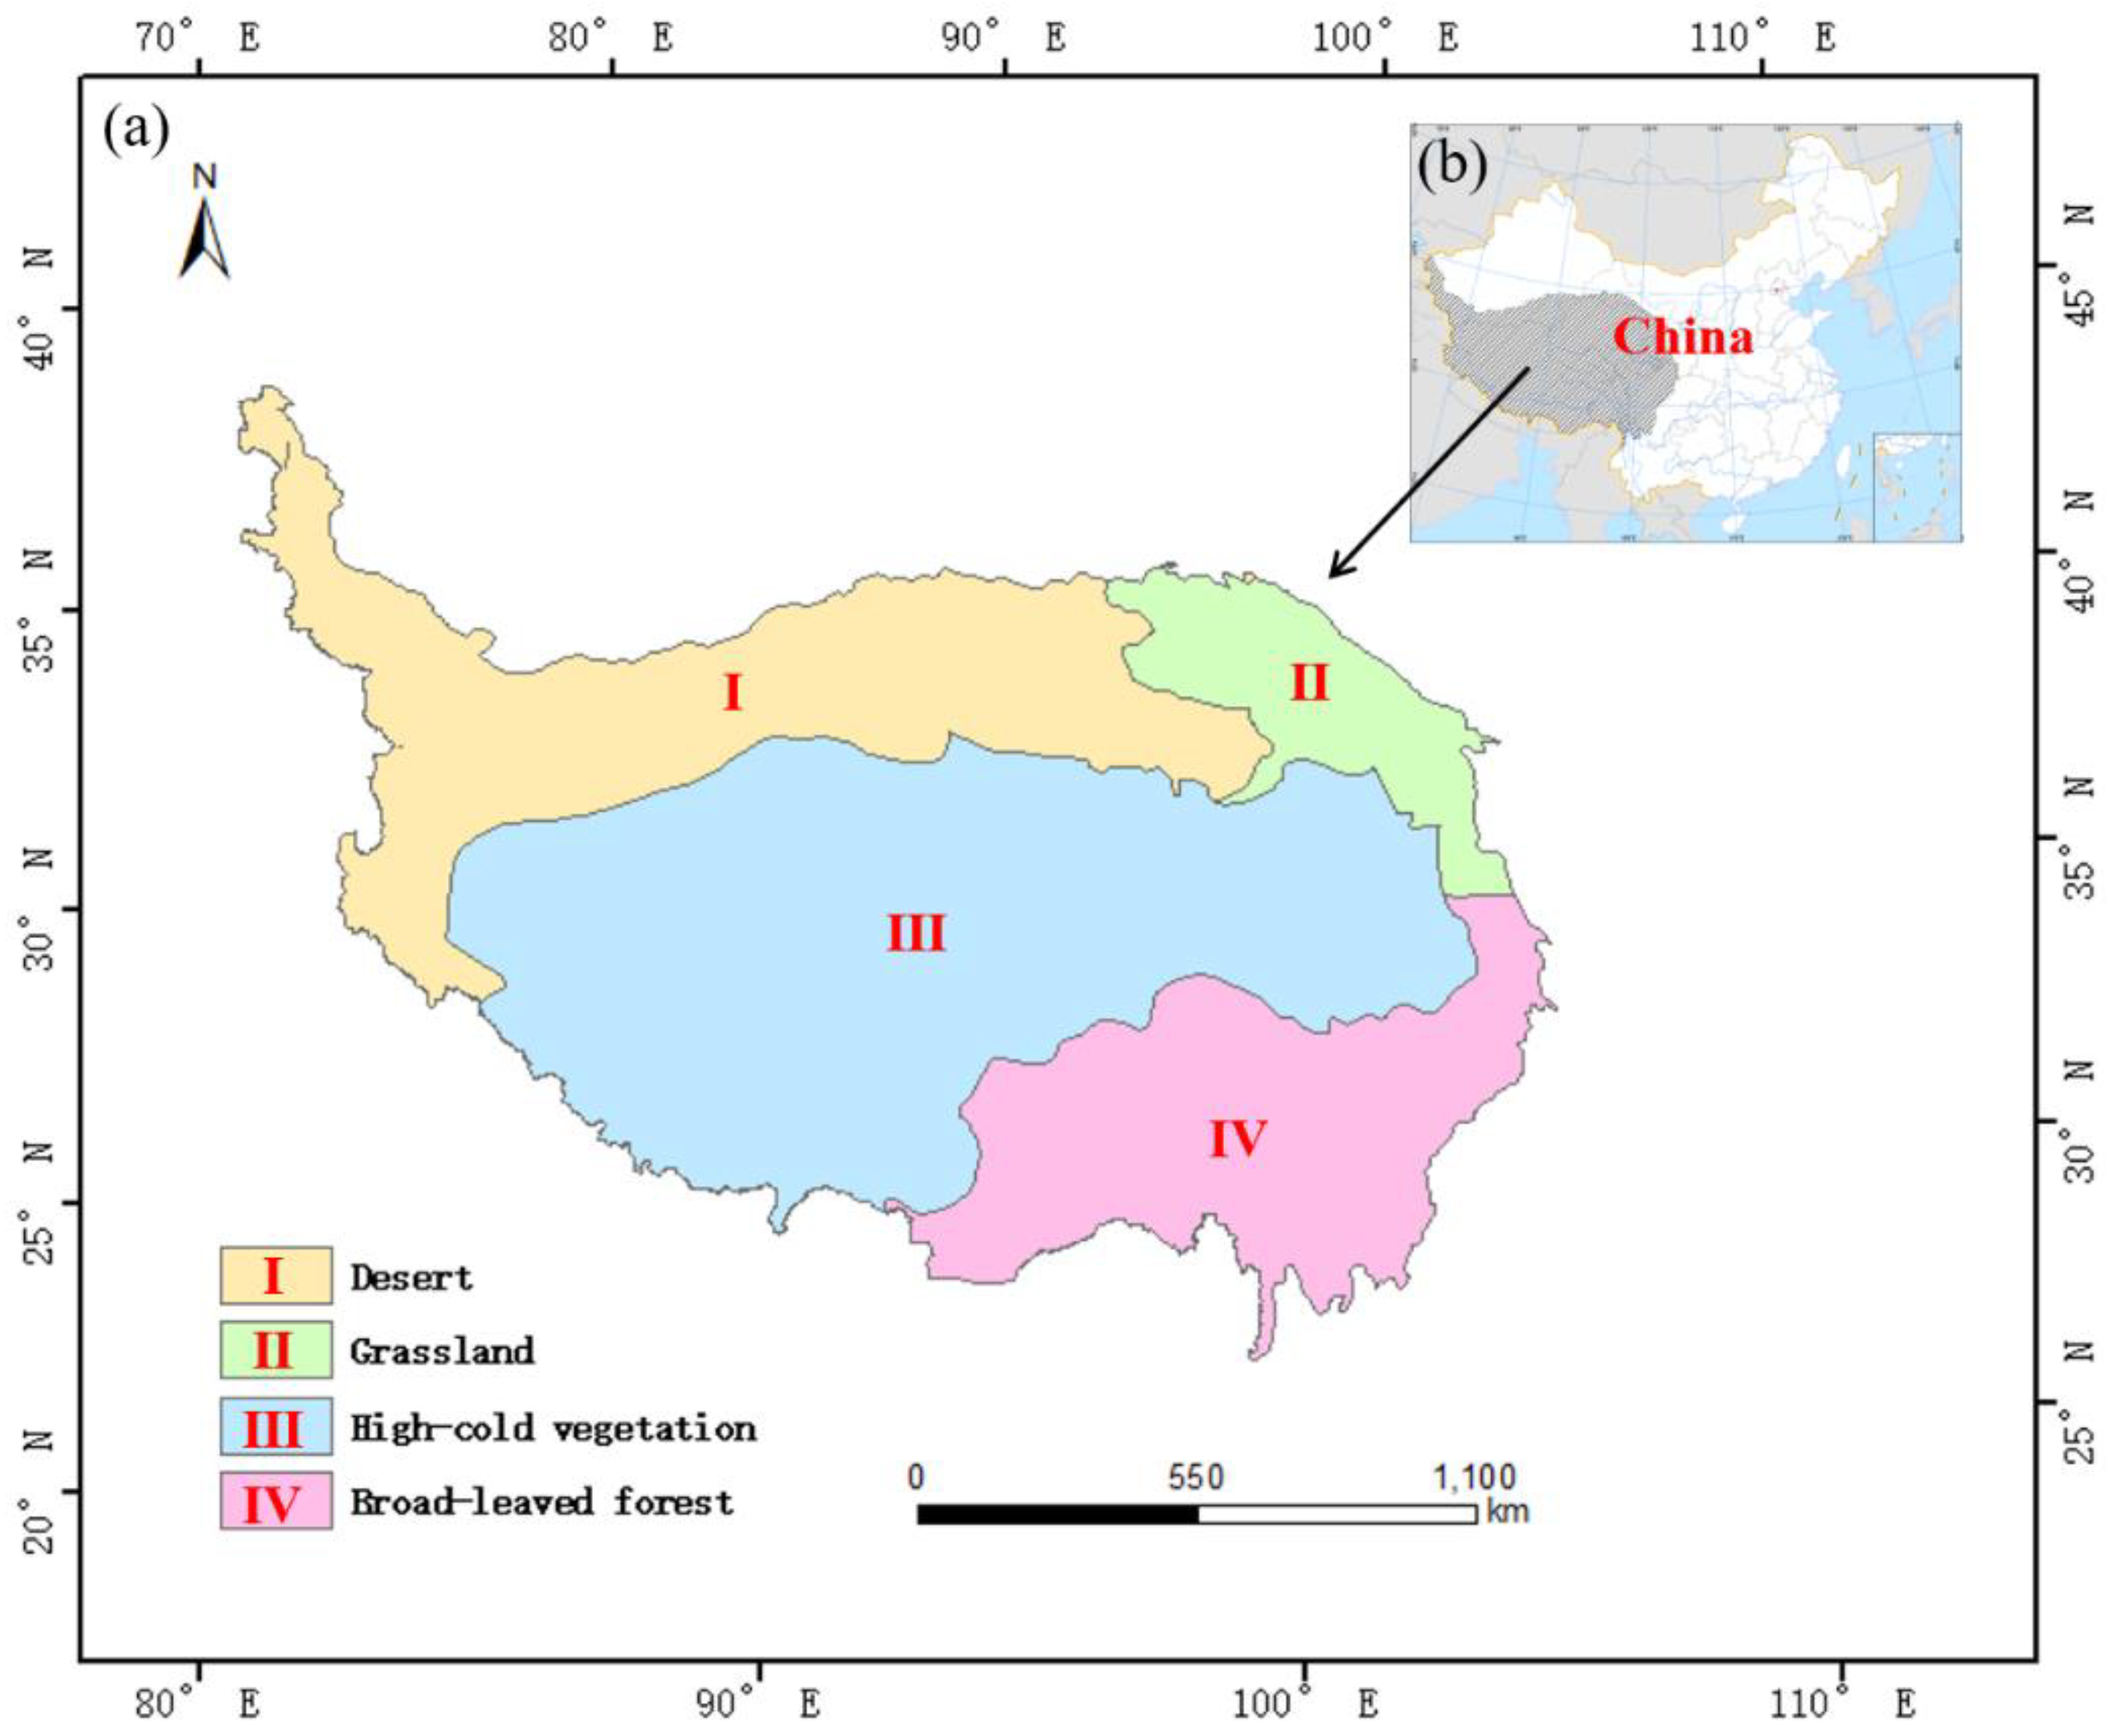
2.1. Study Area and Data

2.1.1. Study Area

With an average altitude of over 4000 m and a total area of about 2.5 × 10⁶ square kilometers, the QTP (26°00′12″ ~ 39°46′50″ N, 73°18′52″ ~ 104°46′59″ E) mainly includes the whole Tibet and the sub-regions of Qinghai, Xinjiang, Gansu, Sichuan and Yunnan. The mountains on the QTP vary greatly in size. The high-altitude areas above 4000 m account for 60.9% of Qinghai province and 86.1% of Tibet Autonomous Region [32]. There are Mount Everest (8848.86 m), the world’s highest peak and the Jinsha River (1503 m). The average elevation of the Himalayas is about 6000 m, while the average elevation of the Yarlung Zangbo River Valley is 3000 m. Generally speaking, the terrain of the QTP is high in the west and low in the east. In contrast to the undulation of the edge of the plateau, there exists a region with low undulation inside the plateau. Vegetation distribution in the QTP has obvious zonal differentiation due to the regional differences of hydrothermal assemblage in slope and vertical directions. According to the differences of vegetation types and their geographical distribution characteristics [33], it can be divided into four vegetation types: desert, grassland, high-cold vegetation and broad-leaved forest (Figure 1). As one of the most important forest areas in China, the QTP has various forest types, but the forest coverage rate is low, and the distribution is uneven. The forest area is small, but its forest volume and unit area volume are high, especially in Tibet, where the forest volume reaches 2.27 billion cubic meters.

2.1.2. Net Primary Productivity (NPP) Data

In this study, we used the GEE platform to get annual NPP data (MOD17A3HGF.006) with a pixel resolution of 500 m [34]. The NPP dataset (MOD17A3HGF.006) was derived from the sum of all 8-day net photosynthetic (PSN) products in a given year, where the PSN value was the difference between gross primary productivity (GPP) and maintenance respiration (MR). The function to get the NPP dataset in GEEis ee.ImageCollection(“MODIS/006/MOD17A3HGF”).

2.1.3. Meteorological Data

Meteorological data were derived from the “grid data of temperature and precipitation over the QTP and surrounding areas from 1998 to 2017” released by the National Qinghai-Tibetan Plateau Scientific Data Center [35]. The dataset included the interannual temperature and precipitation data (the spatial resolution of this dataset is 1 km) of the QTP from 1998 to 2017. According to the needs of this study, we used the nearest neighbor interpolation method to resample the spatial resolution of the meteorological data (from 2001 to 2017) to 500 m, which ensured the spatial resolution of NPP and meteorological data consistent.

2.1.4. Digital Elevation Model Data

The digital elevation model (DEM) data with 90m resolution was derived from the Shuttle Radar Topography Mission (SRTM) data provided by the GEE platform (function: ee.Image(“CGIAR/SRTM90_V4”)). The spatial coordinate system of the data was WGS 1984 geographic coordinates [36]. We used vector data of the QTP and image.clip() function to clip SRTM data to the extent of the study area. We downloaded these clipped data from GEE to study the effect of elevation on NPP. In order to study the influence of elevation on NPP, we divided the elevation of QTP into nine sections with an equal interval of 1000 m and calculated the mean value of NPP within each elevation range.

2.1.5. Human Footprint Dataset

Human footprint data on the QTP were obtained from Chinese scientific data [37]. By using six spatial data sources (population density, land use, grazing density, night light, railway and road) to represent human activities, Duan et al. [37] completed the preparation of six human footprint datasets with a spatial resolution of 1 km on the QTP in 1990, 1995, 2000, 2005, 2010 and 2015. For this study, we resampled the spatial resolution of this human footprint dataset to 500 m by nearest neighbor interpolation.

2.2. Methods

Using interannual data of NPP based on GEE cloud computing platform (Section 2.1.2), we analyzed the spatio-temporal variation characteristics of NPP on the QTP from 2001 to 2017 (Section 3.1) using functions of GEE as follows: dataset.mean().clipToCollection(shapefile),dataset.reduce(ee.Reducer.linearFit()), dataset.reduce(ee.Reducer.stdDev()).divide(mean). The influencing factors of NPP change were discussed (Section 3.2 and Section 4) combining climate, elevation and human activity data (Section 2.1.3, Section 2.1.4 and Section 2.1.5). Figure 2 shows the research route of this paper.

2.2.1. Trend of NPP and Climate Data

In order to study the time series variation trend of the NPP/temperature/precipitation on the QTP from 2001 to 2017, we adopted the unary linear regression method to analyze the NPP/temperature/precipitation and used the least square method to solve the slope of the regression line ( θ t r e n d ) [38]. The equation is as follows:
θ t r e n d = n i = 1 n i X i i = 1 n i i = 1 n X i n i = 1 n i 2 ( i = 1 n i ) 2  
where i represents the order of years. n represents the total number of years. X is the sequential NPP/temperature/precipitation data. θ t r e n d is the slope of the changing trend of NPP/temperature/precipitation data. θ t r e n d greater than zero indicates an increasing trend, while θ t r e n d less than zero indicates a decreasing trend.
Moreover, we used the non-parametric Mann–Kendall (MK) test to single out significant NPP, temperature and precipitation trends [39], and the significance level was set to 0.05. Therefore, the NPP, temperature and precipitation change trends can be classified as a significant positive (negative) trend or no trend.

2.2.2. Correlation between NPP and Climatic Factors

The correlation coefficient between NPP and temperature/precipitation data is calculated as follows [40]:
r = i = 1 n ( x i x ¯ ) ( y i y ¯ ) i = 1 n ( x i x ¯ ) 2 i = 1 n ( y i y ¯ ) 2
where yi is the value of climatic factors in the ith year, and y ¯ represents the mean value of climatic factors during 2001–2017. Furthermore, xi is the value of NPP in the ith year, and x ¯ represents the mean value of NPP during 2001–2017.

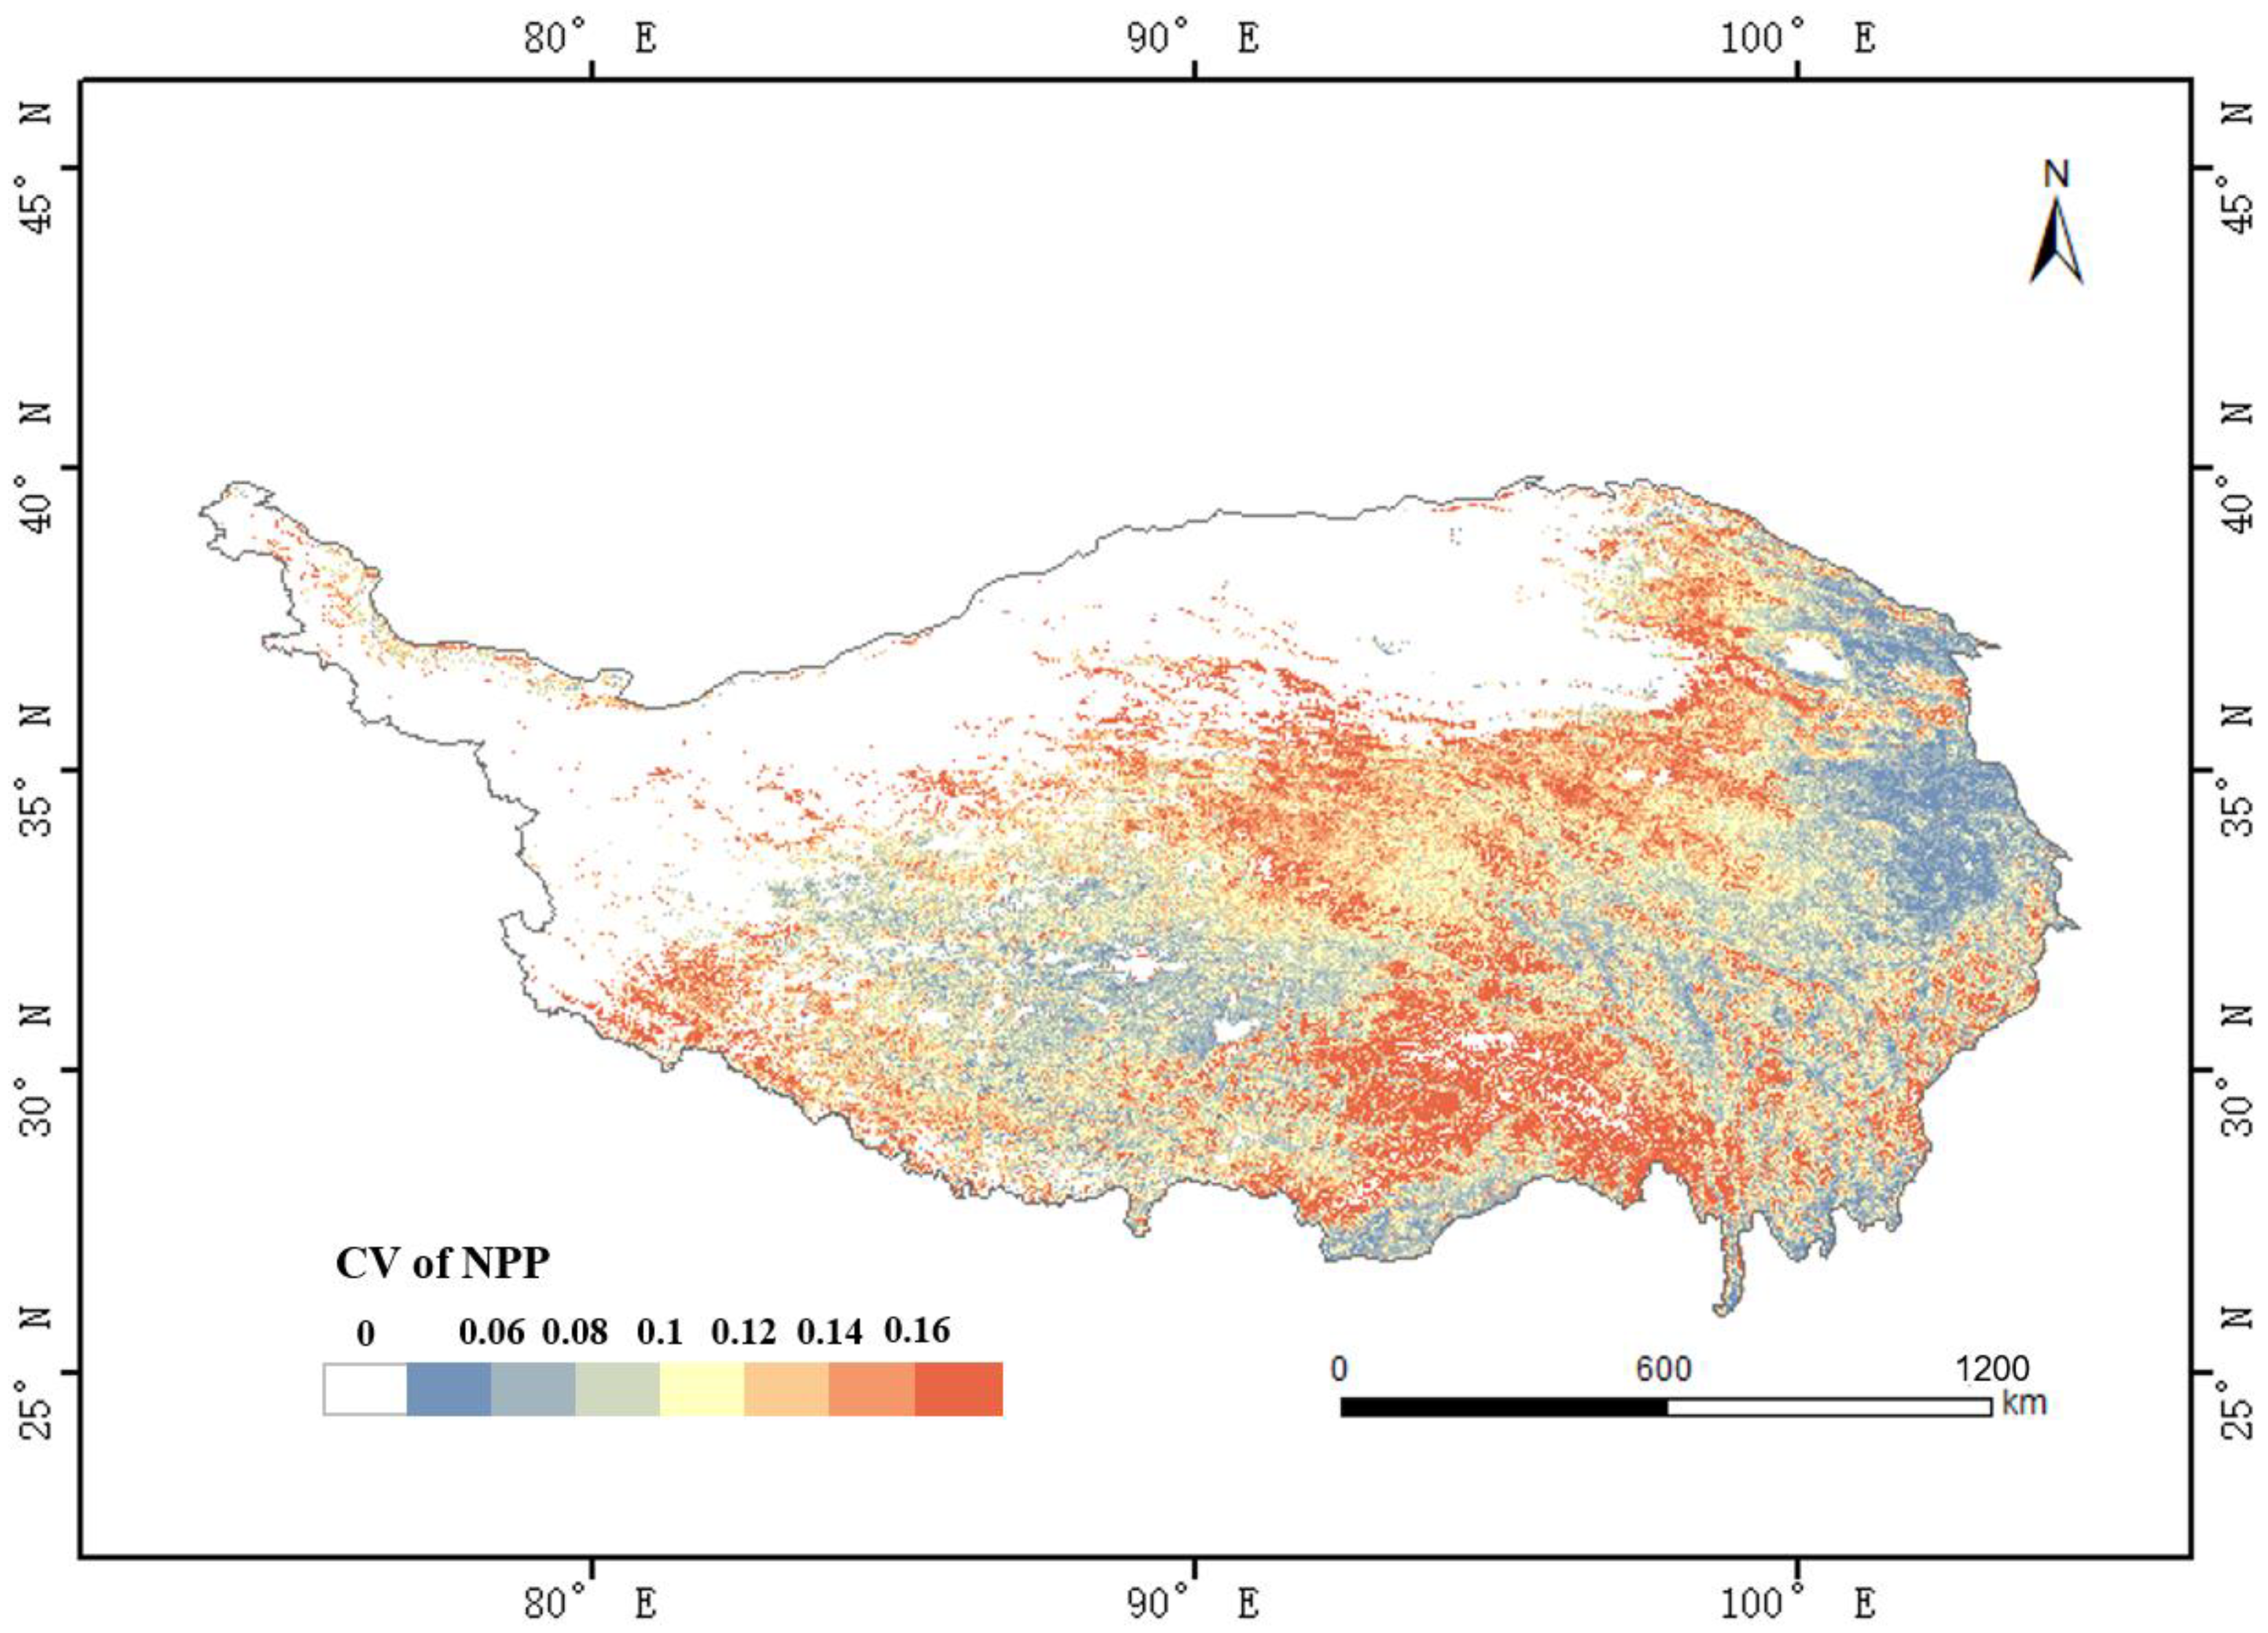
2.2.3. Stability Analysis

The coefficient of variation (CV) is a statistic to measure and evaluate the degree of variation of each observed value [41]. The CV can display the different degrees of time series NPP data. The smaller the CV is, the more stable the NPP is. In this study, the CV was used to evaluate the stability of NPP data. The CV is calculated as follows:
CV = i = 1 n ( NPP i NPP ¯ ) 2 n 1 NPP ¯
where n is the total number of years. In this study, n equals 17. NPPi is the NPP value in the ith year, and NPP ¯ is the average value from 2001 to 2017.

2.2.4. Cubic Spline Interpolation

Cubic spline interpolation is a process of obtaining a smooth curve based on data points [42]. There were only four issues of human activity index data from 2001 to 2017: 2001, 2005, 2010 and 2015. Therefore, the human footprint data of 2000, 2005, 2010 and 2015 were used as nodes, and we used the interp1 function [43] in MATLAB to interpolate the human footprint data pixel by pixel to obtain the year-by-year pixel data of the QTP region from 2001 to 2017. Then, the correlation between human footprint data and NPP data is calculated by the Equation (2) in Section 2.2.2, and the impact of human activities on NPP is evaluated by the correlation coefficient.

3. Results

3.1. Spatio-Temporal Variation of NPP

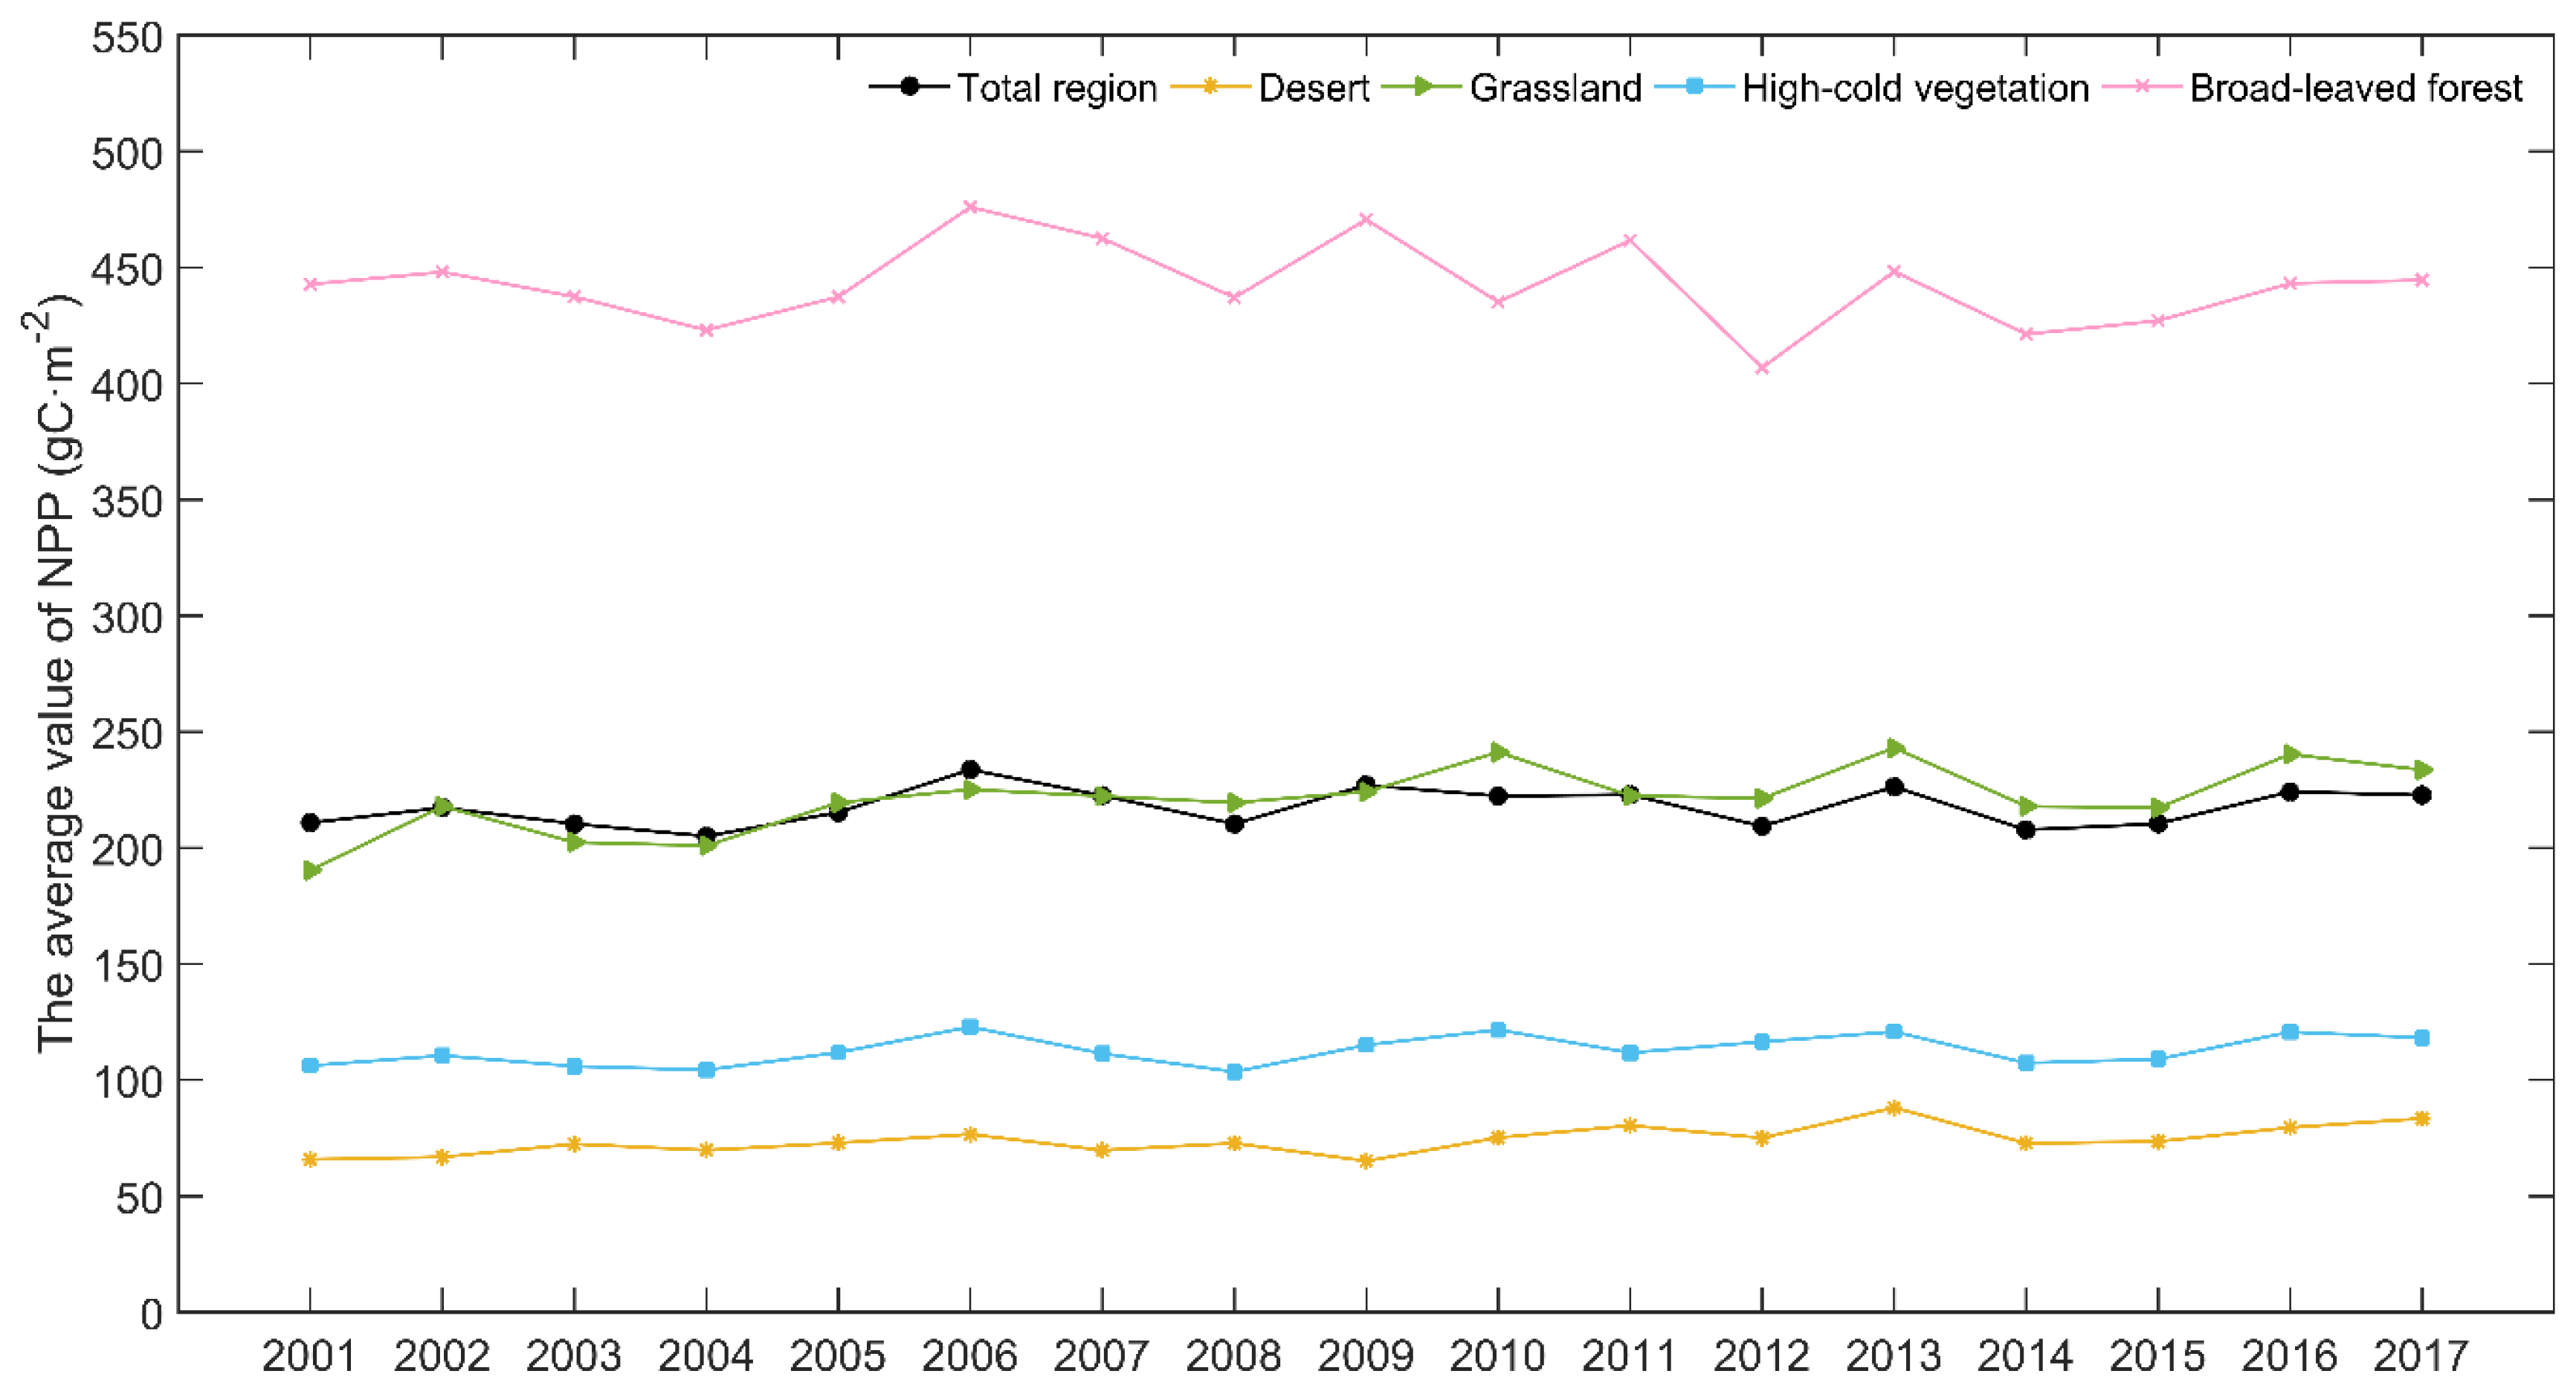
3.1.1. Temporal Analysis of NPP Change

The average NPP of each area is shown in Figure 3. The mean value of NPP, change trend of NPP with significance test results as well as R2 (Goodness of Fit in regression analysis), root mean squared error (RMSE) in each vegetation type division are listed in Table 1.
The NPP of the region as a whole was similar to that of the grassland with a mean difference of 3.59 gC·m−2. The NPP of the broad-leaved forest region was the highest with an average of 442.52 gC·m−2, and the NPP of the desert region was the lowest with an average of 74.17 gC·m−2. Except for the broad-leaved forest area, the change of NPP was a negative trend: −0.633 gC·m−2·yr−1, the NPP of other areas was positive trend. The NPP increased significantly in desert and grassland region, which were 0.8127 gC·m−2·yr−1 and 1.9177 gC·m−2·yr−1, respectively. Environmental protection and ecological improvement projects, including afforestation, have resulted in a significant increase in NPP in desert areas. The RMSE of the NPP trend in each region were below 17.2538 gC·m−2.

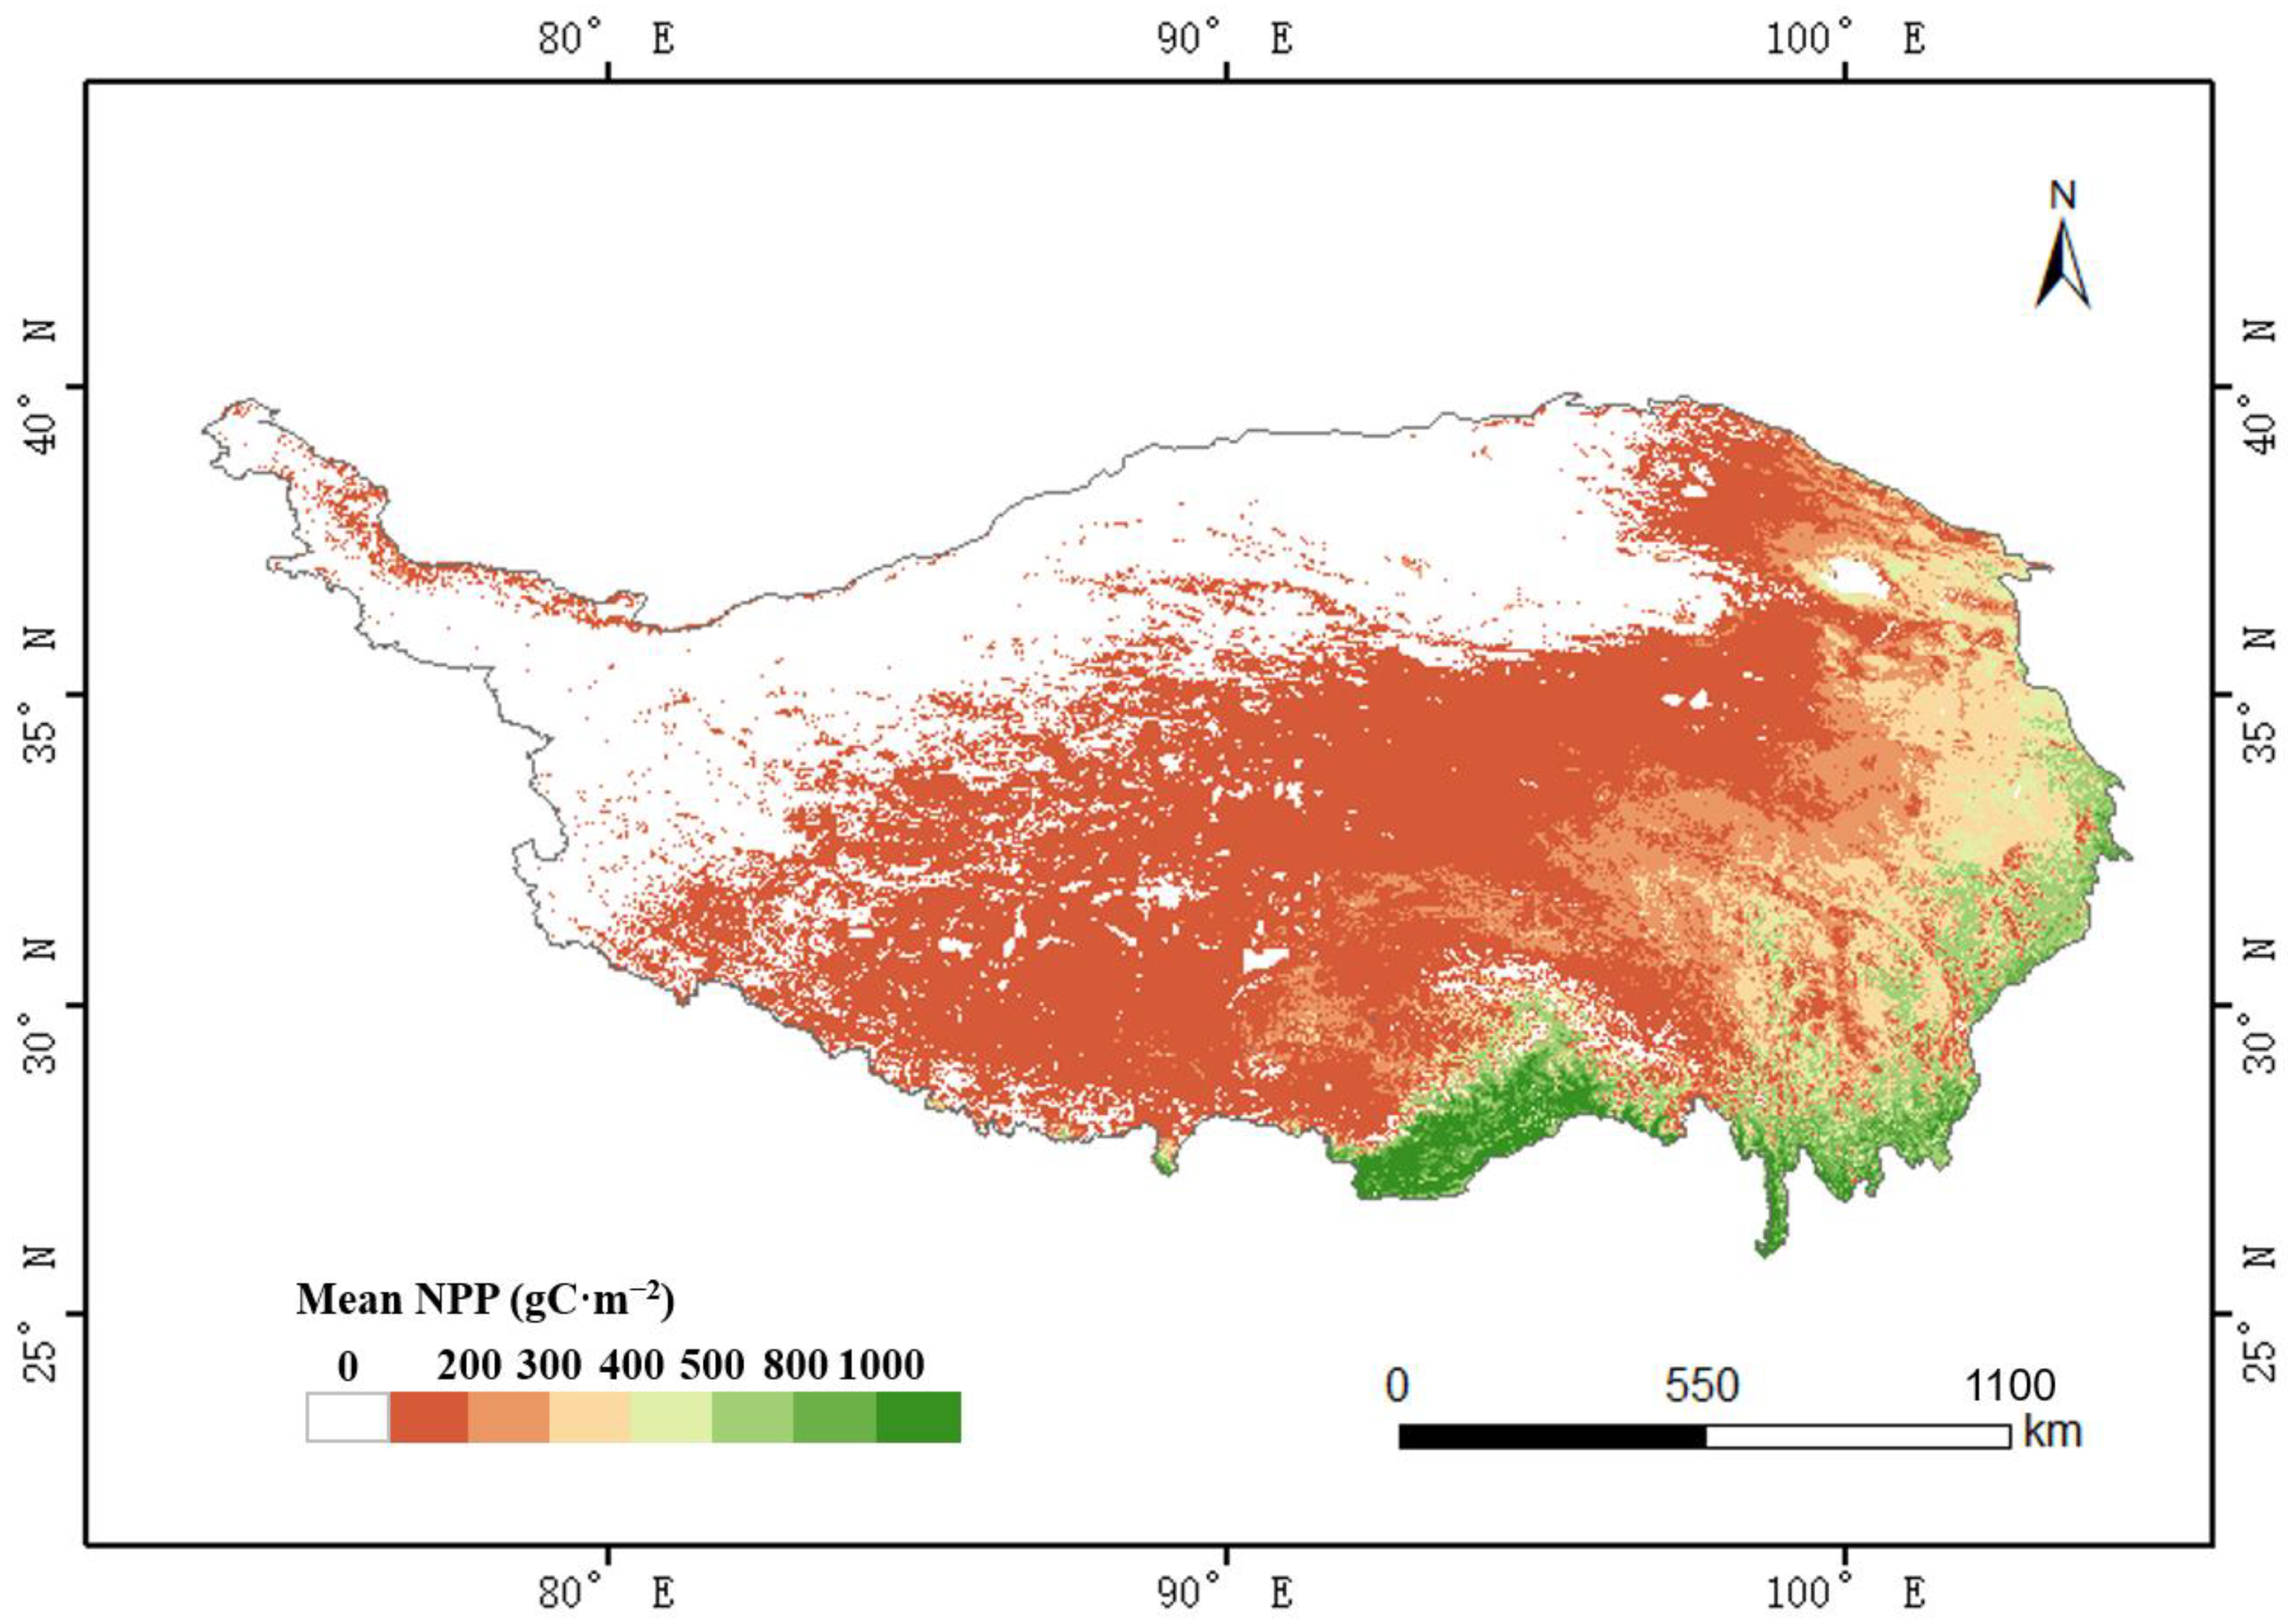
3.1.2. Spatial Analysis of NPP Change

The spatial distribution of the mean value of NPP from 2001 to 2017 in QTP is shown in Figure 4. Figure 4 indicates the spatial distribution characteristics of NPP in QTP. The NPP of vegetation in QTP presented obvious differences in space. The regional differences were manifested as “high southeast to low northwest”. This was consistent with the results of a previous study by Guo et al. [23]. The average NPP value in the northwest region was concentrated in 0 ~ 200 gC·m−2, which was lower than the average level of the whole QTP. The average NPP value in the southeast region was concentrated above 500 gC·m−2, which was higher than the regional average. Table 2 illustrates the proportion of different ranges of the mean of NPP in QTP from 2001 to 2017. The area with the average value of 0 ~ 200 gC·m−2 accounted for the largest proportion (41.3%). The area with 0 gC·m−2 accounted for 34.9% of the whole QTP. The regions with NPP greater than 800 gC·m−2 were mainly concentrated in the eastern and southern parts of the broad-leaved forest region, accounting for 2.8% of the area of QTP.
According to Equation (1) in Section 2.2.1, the trend of NPP on the QTP from 2001 to 2017 was obtained (Figure 5). In most areas of northwest QTP, the interannual rate of change was 0 gC·m−2·yr−1. In the eastern part of the QTP, the NPP showed an increasing trend, while the interannual variation rate at the southern periphery of the broad-leaved forest region was negative, and the NPP was decreasing. The NPP of desert, lake and snow mountain were 0 gC·m−2·yr−1 all the year round, so the interannual variation rate of NPP in these areas were 0 gC·m−2·yr−1, which accounted for 39.9% of the whole QTP. Among the regions with changing trends, the regions with trends ranging from 0 gC·m−2·yr−1 to 10 gC·m−2·yr−1 accounted for the largest proportion (29.5%). The proportion of the regions with interannual variation rate less than −50 gC·m−2·yr−1 was 2.2%, and that with interannual variation rate greater than 30 gC·m−2·yr−1 was 3.6%. Although the average NPP in the southern part of the broad-leaved forest was larger than that of other regions, it showed a decreasing trend. The average NPP in the southern of Qinghai Lake was relatively small, but it showed a significant increasing trend. The area with increased NPP accounted for almost half the area of the QTP (47.9%), while the area with the NPP decreasing accounted for 12.2% of the QTP, and the areas with an increasing trend were 35.7% more than the areas with a decreasing trend.
The CV of NPP in QTP was obtained by Equation (3) in Section 2.2.3. The results are shown in Figure 6. The NPP in the lake, snow and northwest desert areas were 0 gC·m−2 all year round, so the CV of NPP in the above areas were also 0. The CV values of Southern QTP and the boundary between desert and non-desert areas were large, which showed that NPP fluctuated greatly in those regions. In order to further quantitatively understand the distribution of CV of NPP in the QTP, we calculated the proportions of different CV of NPP (Table 2). In 34.9% of the area of the QTP (including desert, lake and snow), the CV of NPP was 0. In the high-cold vegetation area, NPP changed greatly, and CV values were mostly above 0.14. The CV of grassland area was smaller than that of other regions, most of which were lower than 0.08. The NPP of Huangnan Tibetan Autonomous Prefecture and Gannan Tibetan Autonomous Prefecture was relatively stable, CV value was below 0.06. The downward trend of NPP in Linzhi city made the CV value greater than 0.16.

3.2. Analysis of Influencing Factors of NPP Change

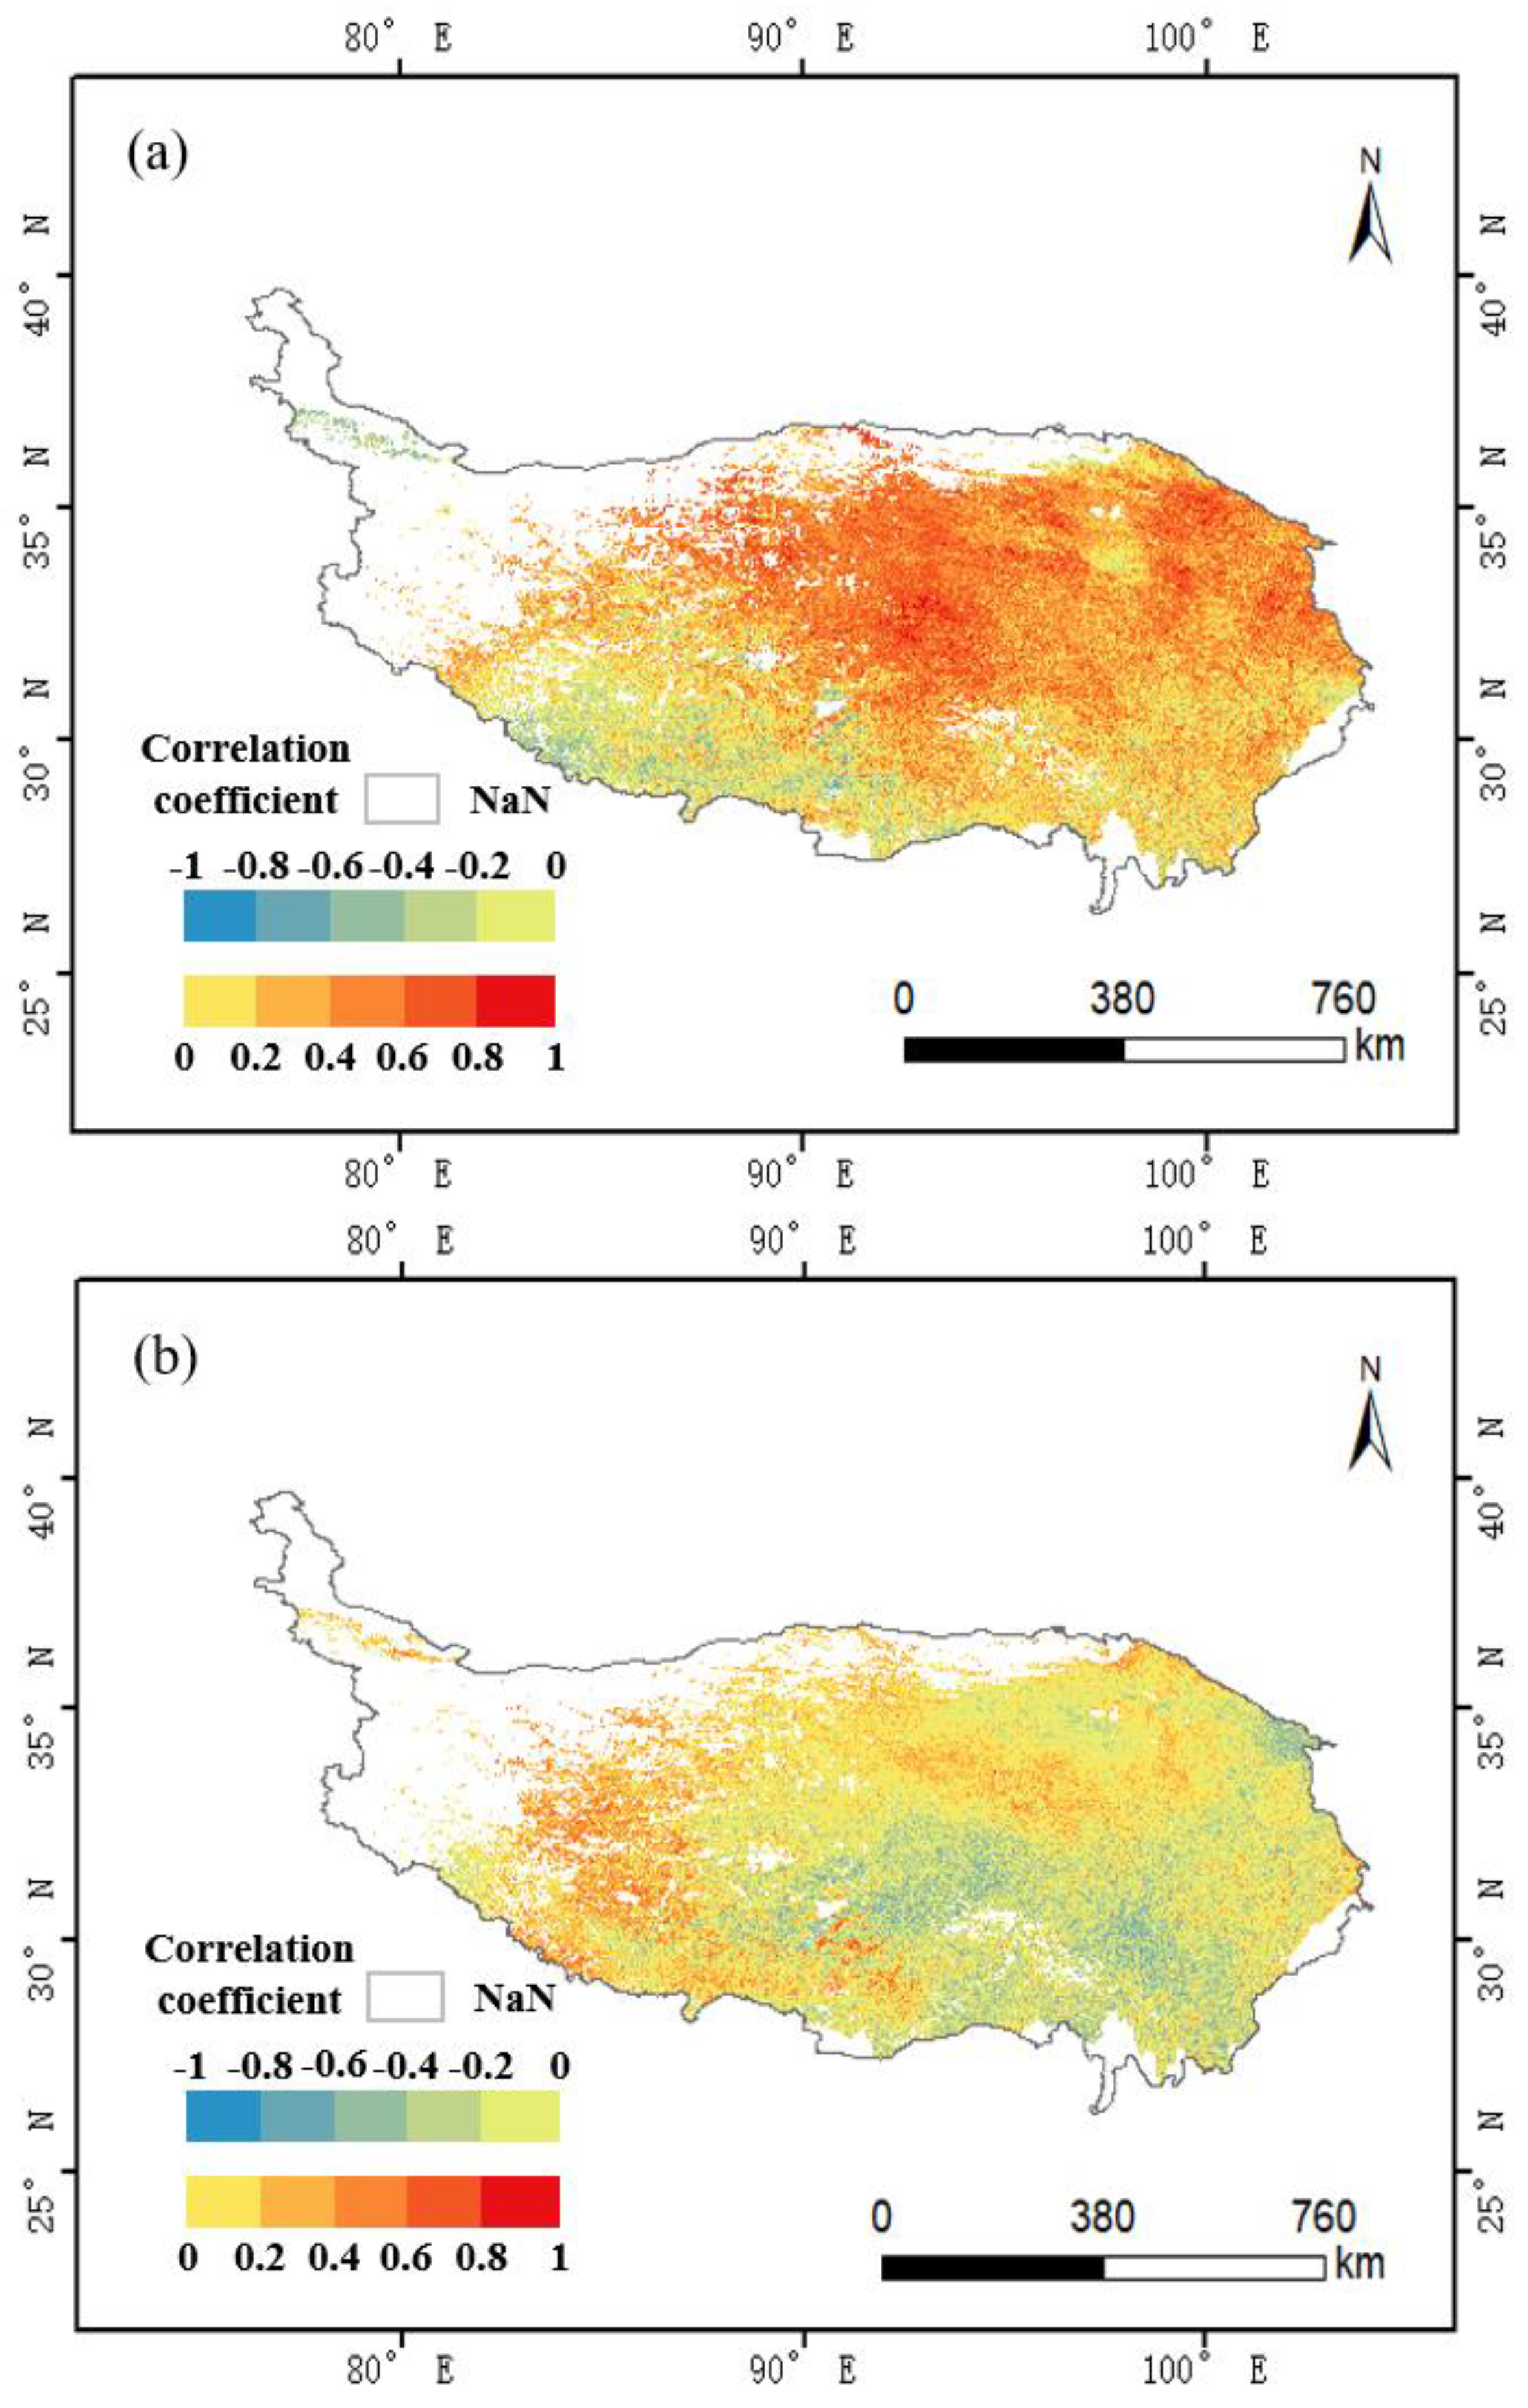
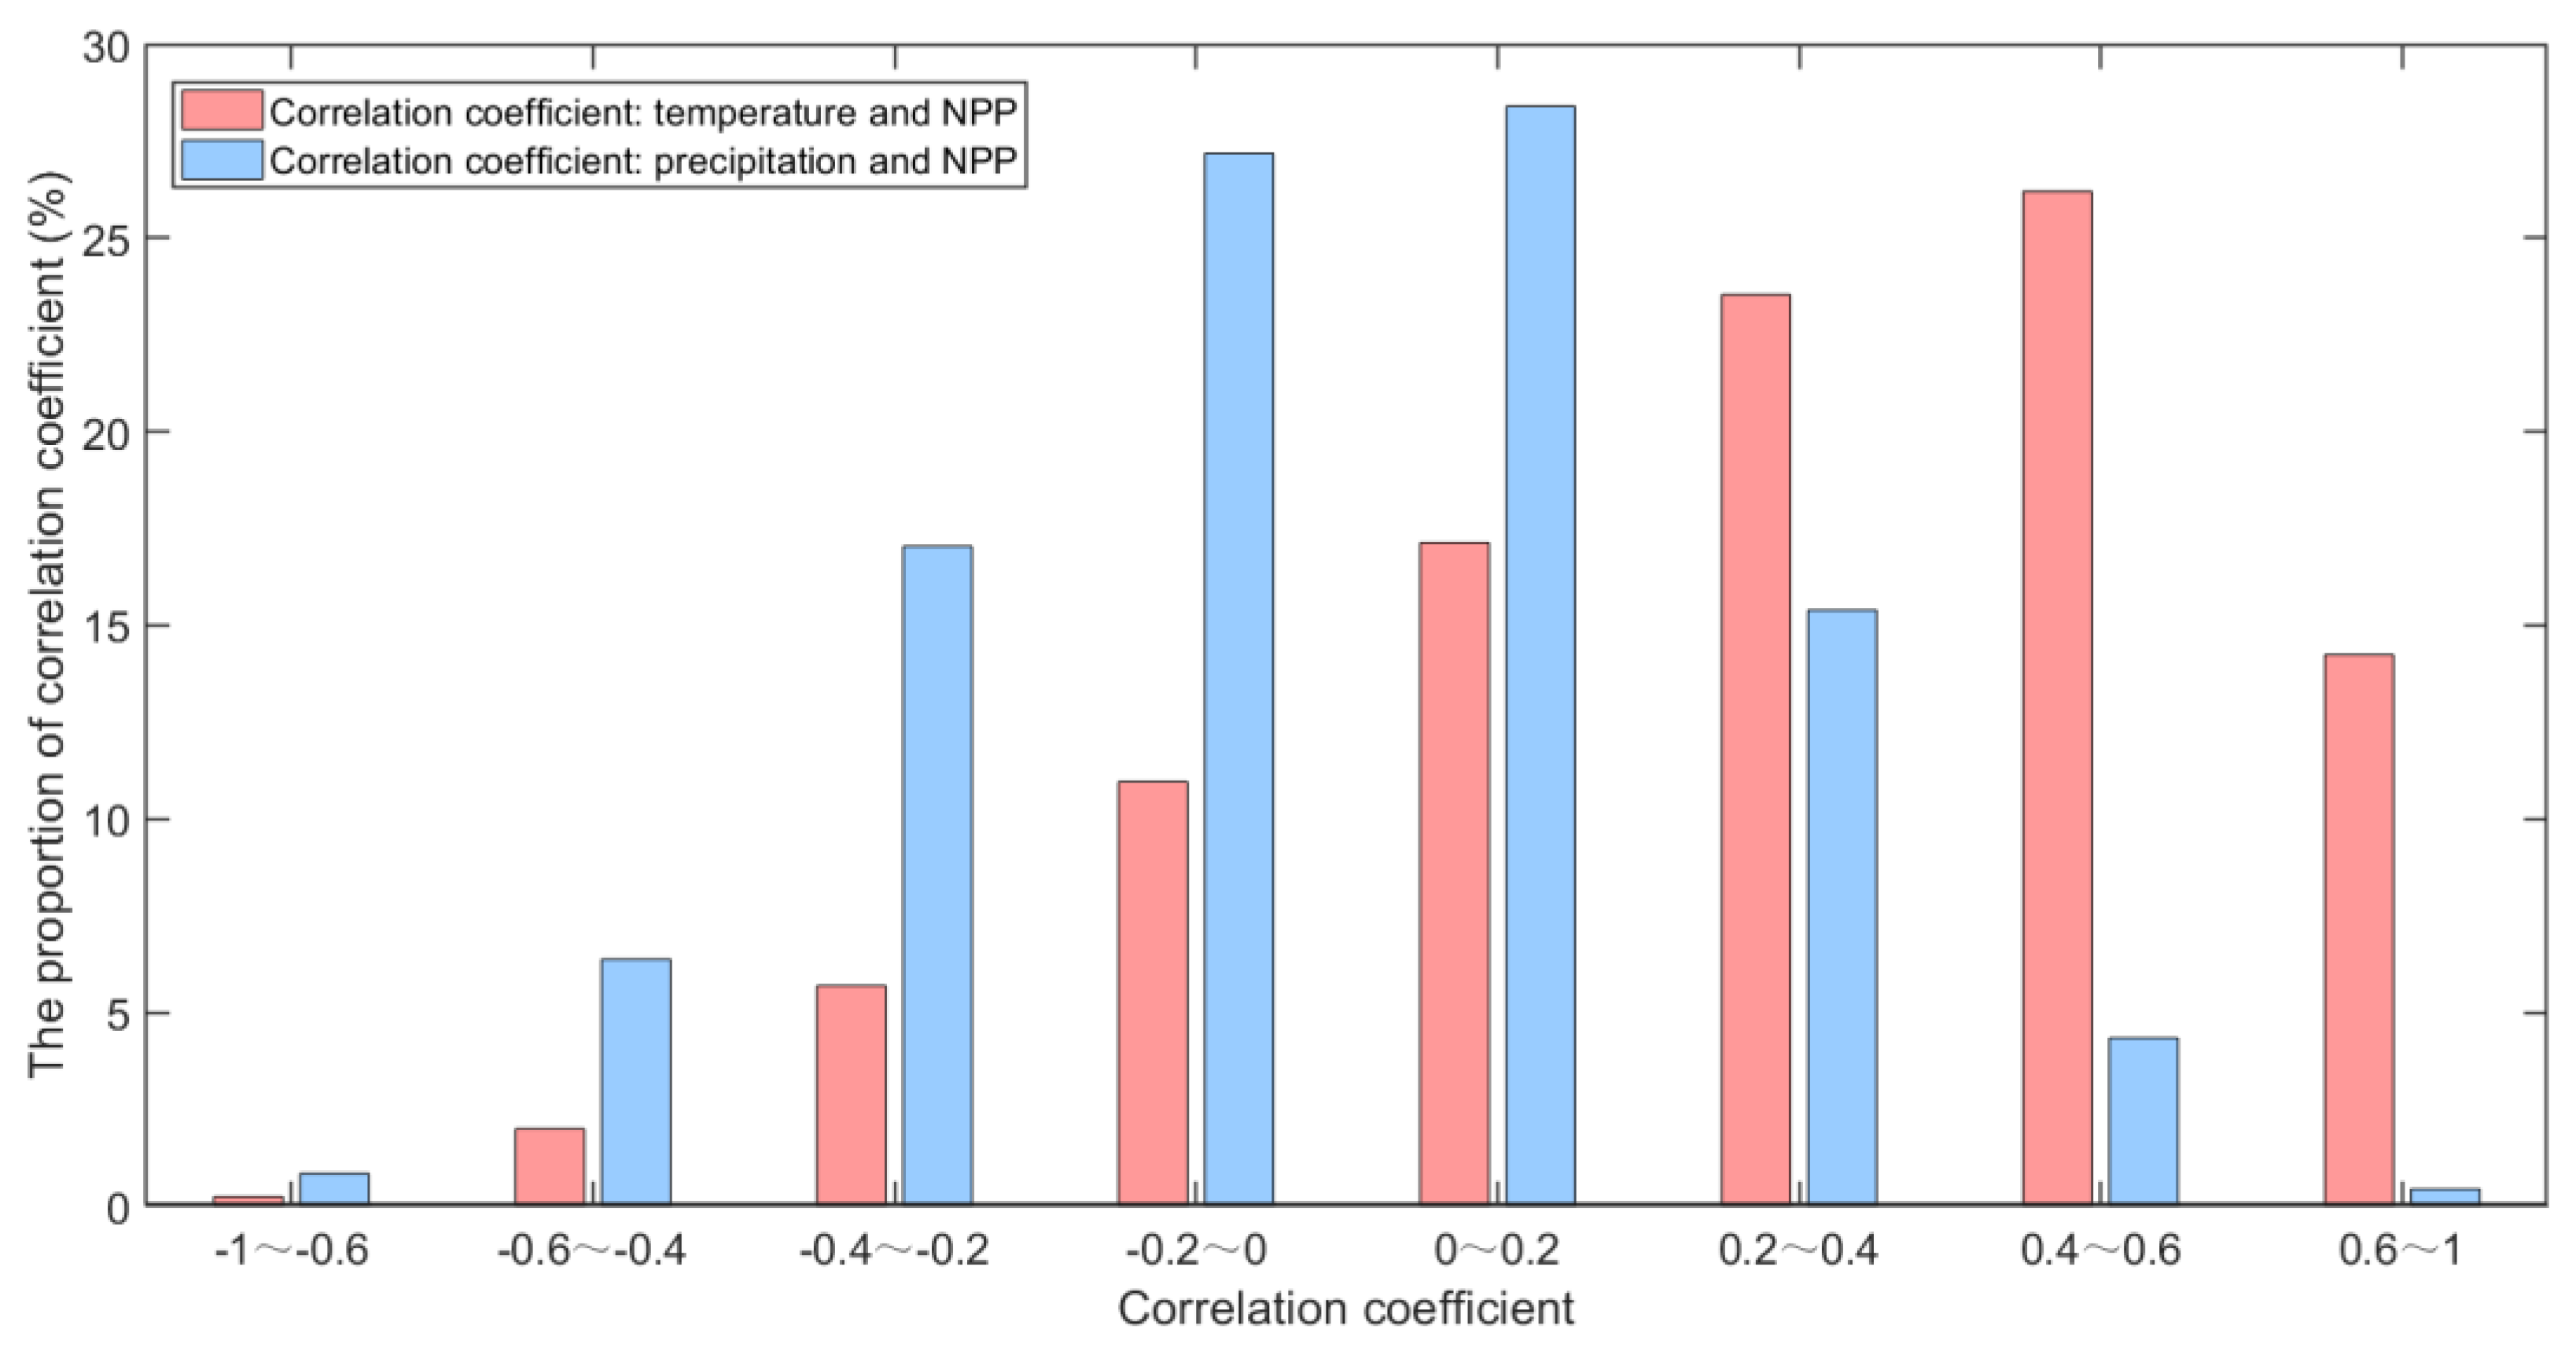
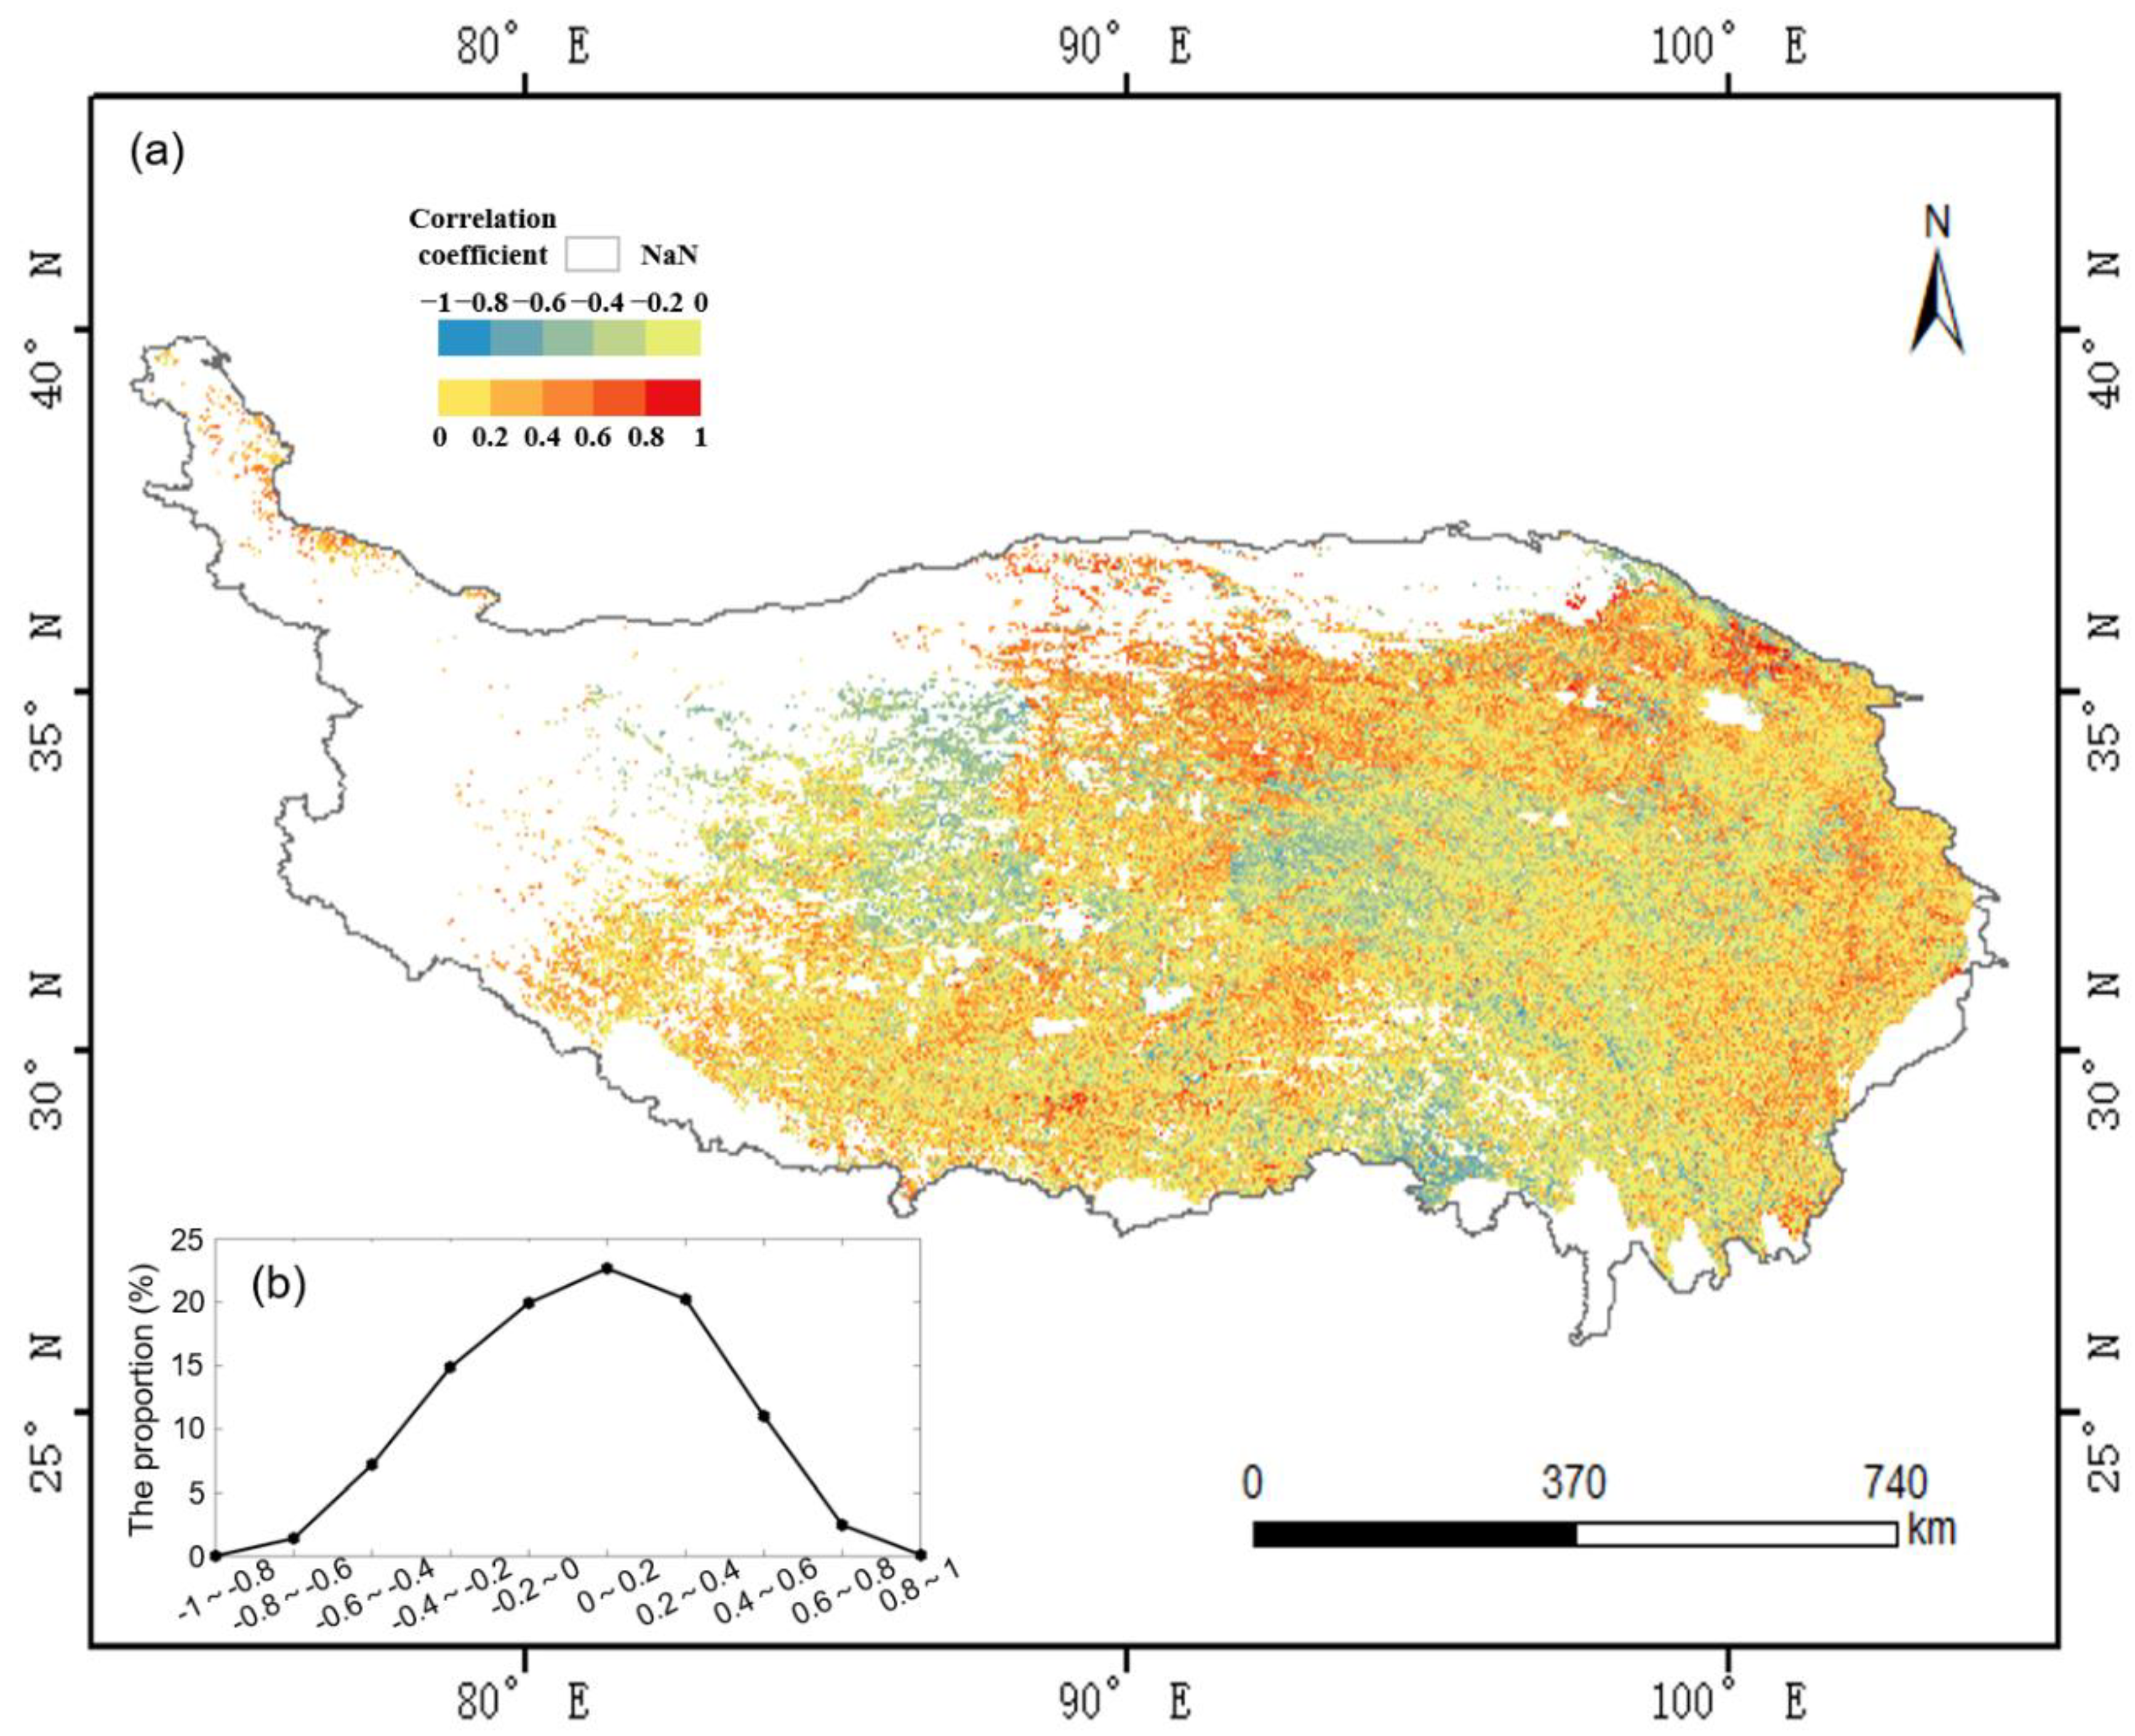
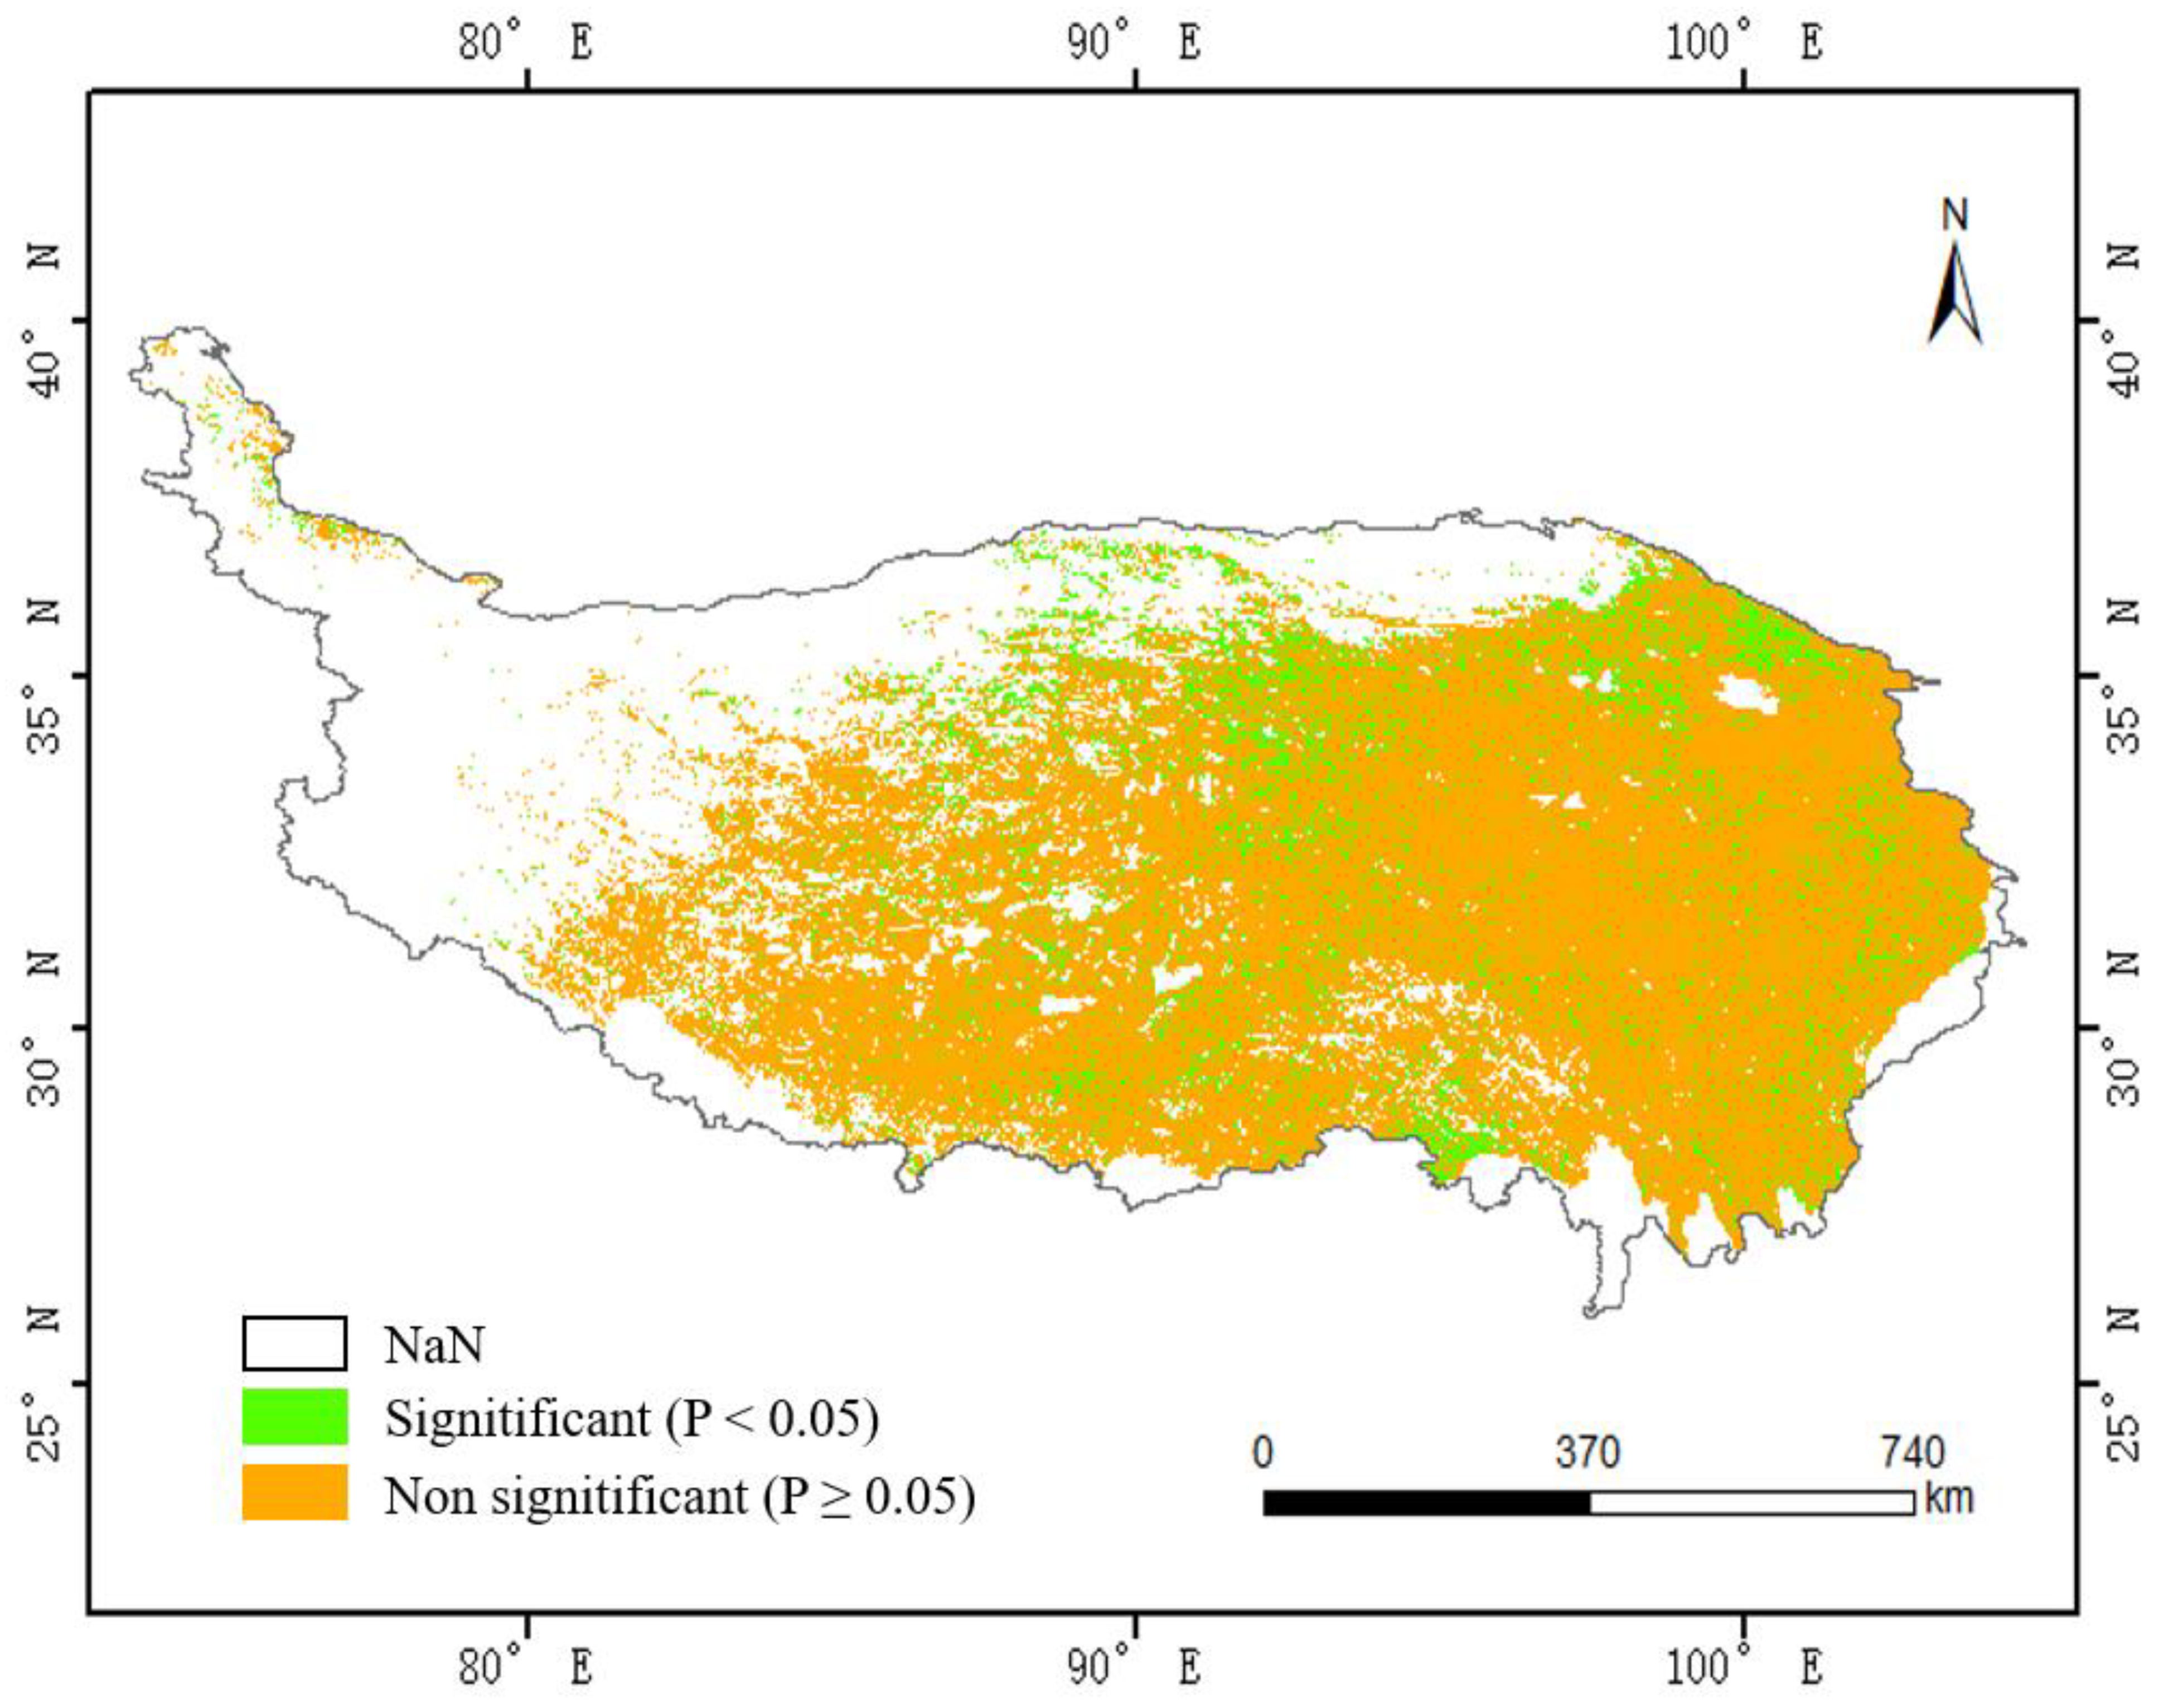
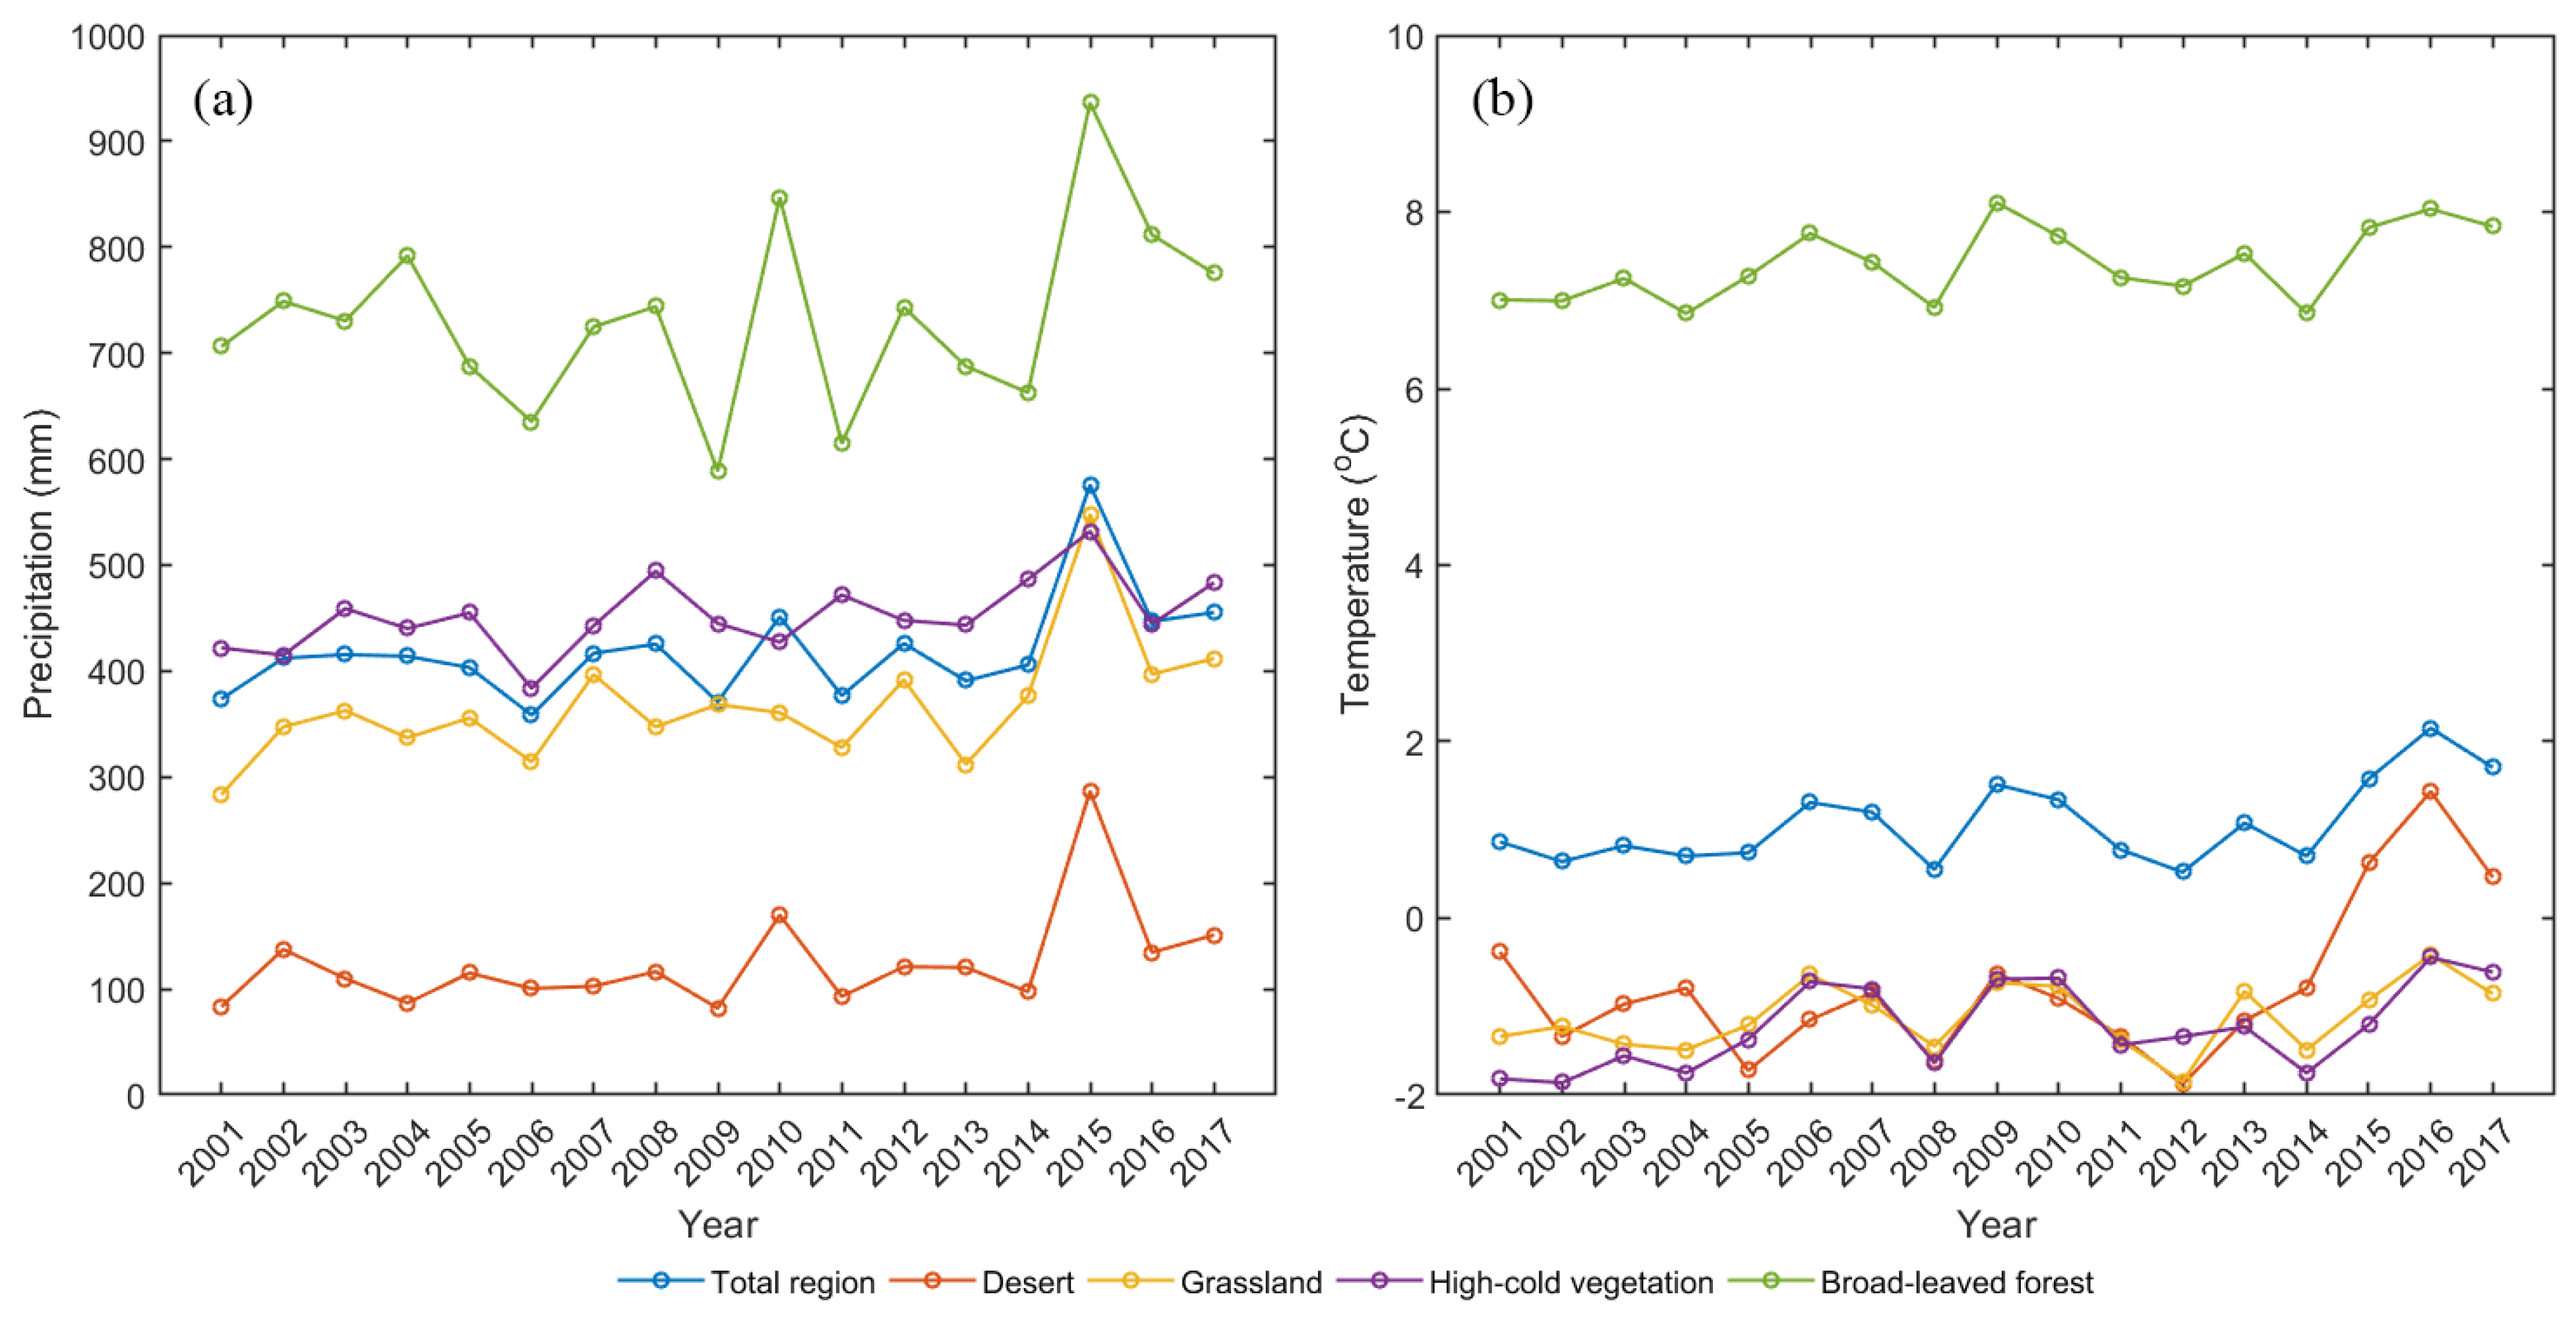
3.2.1. Influence of Climate on NPP

Based on the meteorological data of the QTP in Section 2.1.3, the temperature and precipitation data of each vegetation regionalization from 2001 to 2017 was obtained through statistical analysis, and the results are displayed in Figure 7. The interannual changes of rainfall and temperature were active, and the years with high precipitation and temperature values alternated with those with low values. The temperature and precipitation in the broad-leaved forest region were larger than those in the other three regions. The desert region received the least precipitation. The regions with lower temperature were desert, grassland and high-cold vegetation.
The results of trend analysis with significance test results, R2, RMSE and mean value of climate data on different regions are depicted in Table 3 and Table 4. The temperature (mean value: 7.4 °C) and precipitation (mean value: 731.6 mm) in the broad-leaved forest region were larger, while the temperature (mean value: −0.76 °C) and precipitation (mean value: 123.91 mm) in the desert region were smaller. The precipitation in grassland and high-cold vegetation regions increased significantly, which were 6.41 mm/yr and 3.69 mm/yr, respectively. The temperature of each area (except grassland area) showed a significant increasing trend. The trend of temperature variation in desert, high-cold vegetation and broad-leaved forest were 0.0872 °C/yr, 0.0493 °C/yr and 0.0419 °C/yr, respectively. In combination with Table 1, it could be found that low temperature and less rain in desert areas were not conducive to the growth and development of vegetation, so the NPP value in this area was the lowest. Precipitation and suitable temperature made the vegetation in the broad-leaved forest area flourish and the NPP value was relatively high.
The Pearson correlation analysis results of NPP and climate factors in each region are displayed in Table 5. We described the strength of the correlation using the guide proposed by Evans [44].
In the QTP region as a whole, NPP was positively significantly correlated with air temperature, with a correlation coefficient of 0.578 (passing the significance test with a confidence level of 0.05). The correlation coefficient between NPP and precipitation was −0.314, and its absolute value was less than 0.4, showing a weak negative correlation. The correlation coefficient between temperature and NPP was positive in each region. The correlation coefficient between temperature and NPP in grassland and high-cold vegetation area showed a strong positive significant correlation, indicating that the increase of temperature had a significant promoting effect on the increase of NPP. The correlation coefficient between precipitation and NPP in the broad-leaved forest region showed a moderate negative significant correlation. Excessive rainwater affected the normal aerobic respiration of vegetation and was not conducive to the growth of plants, thus inhibiting NPP. The correlation coefficients of temperature, precipitation and NPP in the desert area showed a weak positive correlation. The correlation coefficient between temperature and NPP in the broad-leaved forest region showed a moderate positive correlation, while the correlation coefficient between precipitation and NPP in the high-cold vegetation region showed a moderate negative correlation.
The correlation coefficient between annual average NPP value and annual average temperature (Figure 8a) and annual average precipitation (Figure 8b) in the QTP region from 2001 to 2017. In recent 17 years, the NPP based on pixels in the QTP was mainly positively correlated with the mean annual temperature. Especially in the middle of the high-cold vegetation region and grassland region of the QTP, there was a very strong positive correlation. The area of strong positive correlation between NPP and precipitation was relatively small, sporadically distributed in the southwest part of the QTP. The correlation coefficient (between NPP and precipitation) of most areas was within 0.2, and the correlation coefficient (between NPP and precipitation) of the central and southern part of the QTP and the eastern part of the Qinghai Lake was negative. The response of temperature to NPP was greater than that of precipitation in the central QTP and grassland.
The proportion of different value ranges of correlation coefficient (between NPP and temperature, between NPP and precipitation) is indicated in Figure 9. The regions with positive correlation between temperature and precipitation accounted for 81.1% and 48.6% of the area of QTP, respectively. The effect of temperature on vegetation NPP was positive in about four-fifths of the region of the QTP. The regions with strong positive correlation between NPP and temperature and precipitation accounted for 14.2% and 0.4% of the area of QTP, respectively. The correlation coefficient between precipitation and NPP was evenly distributed, and the proportion of positive correlation and negative correlation was approximately equal. The distribution of correlation coefficient between temperature and NPP was not balanced, and the proportion of positive correlation coefficient was greater than that of negative correlation coefficient. The correlation coefficient between NPP and air temperature showed that the proportion of moderate and strong positive correlation was much higher than that between NPP and precipitation.

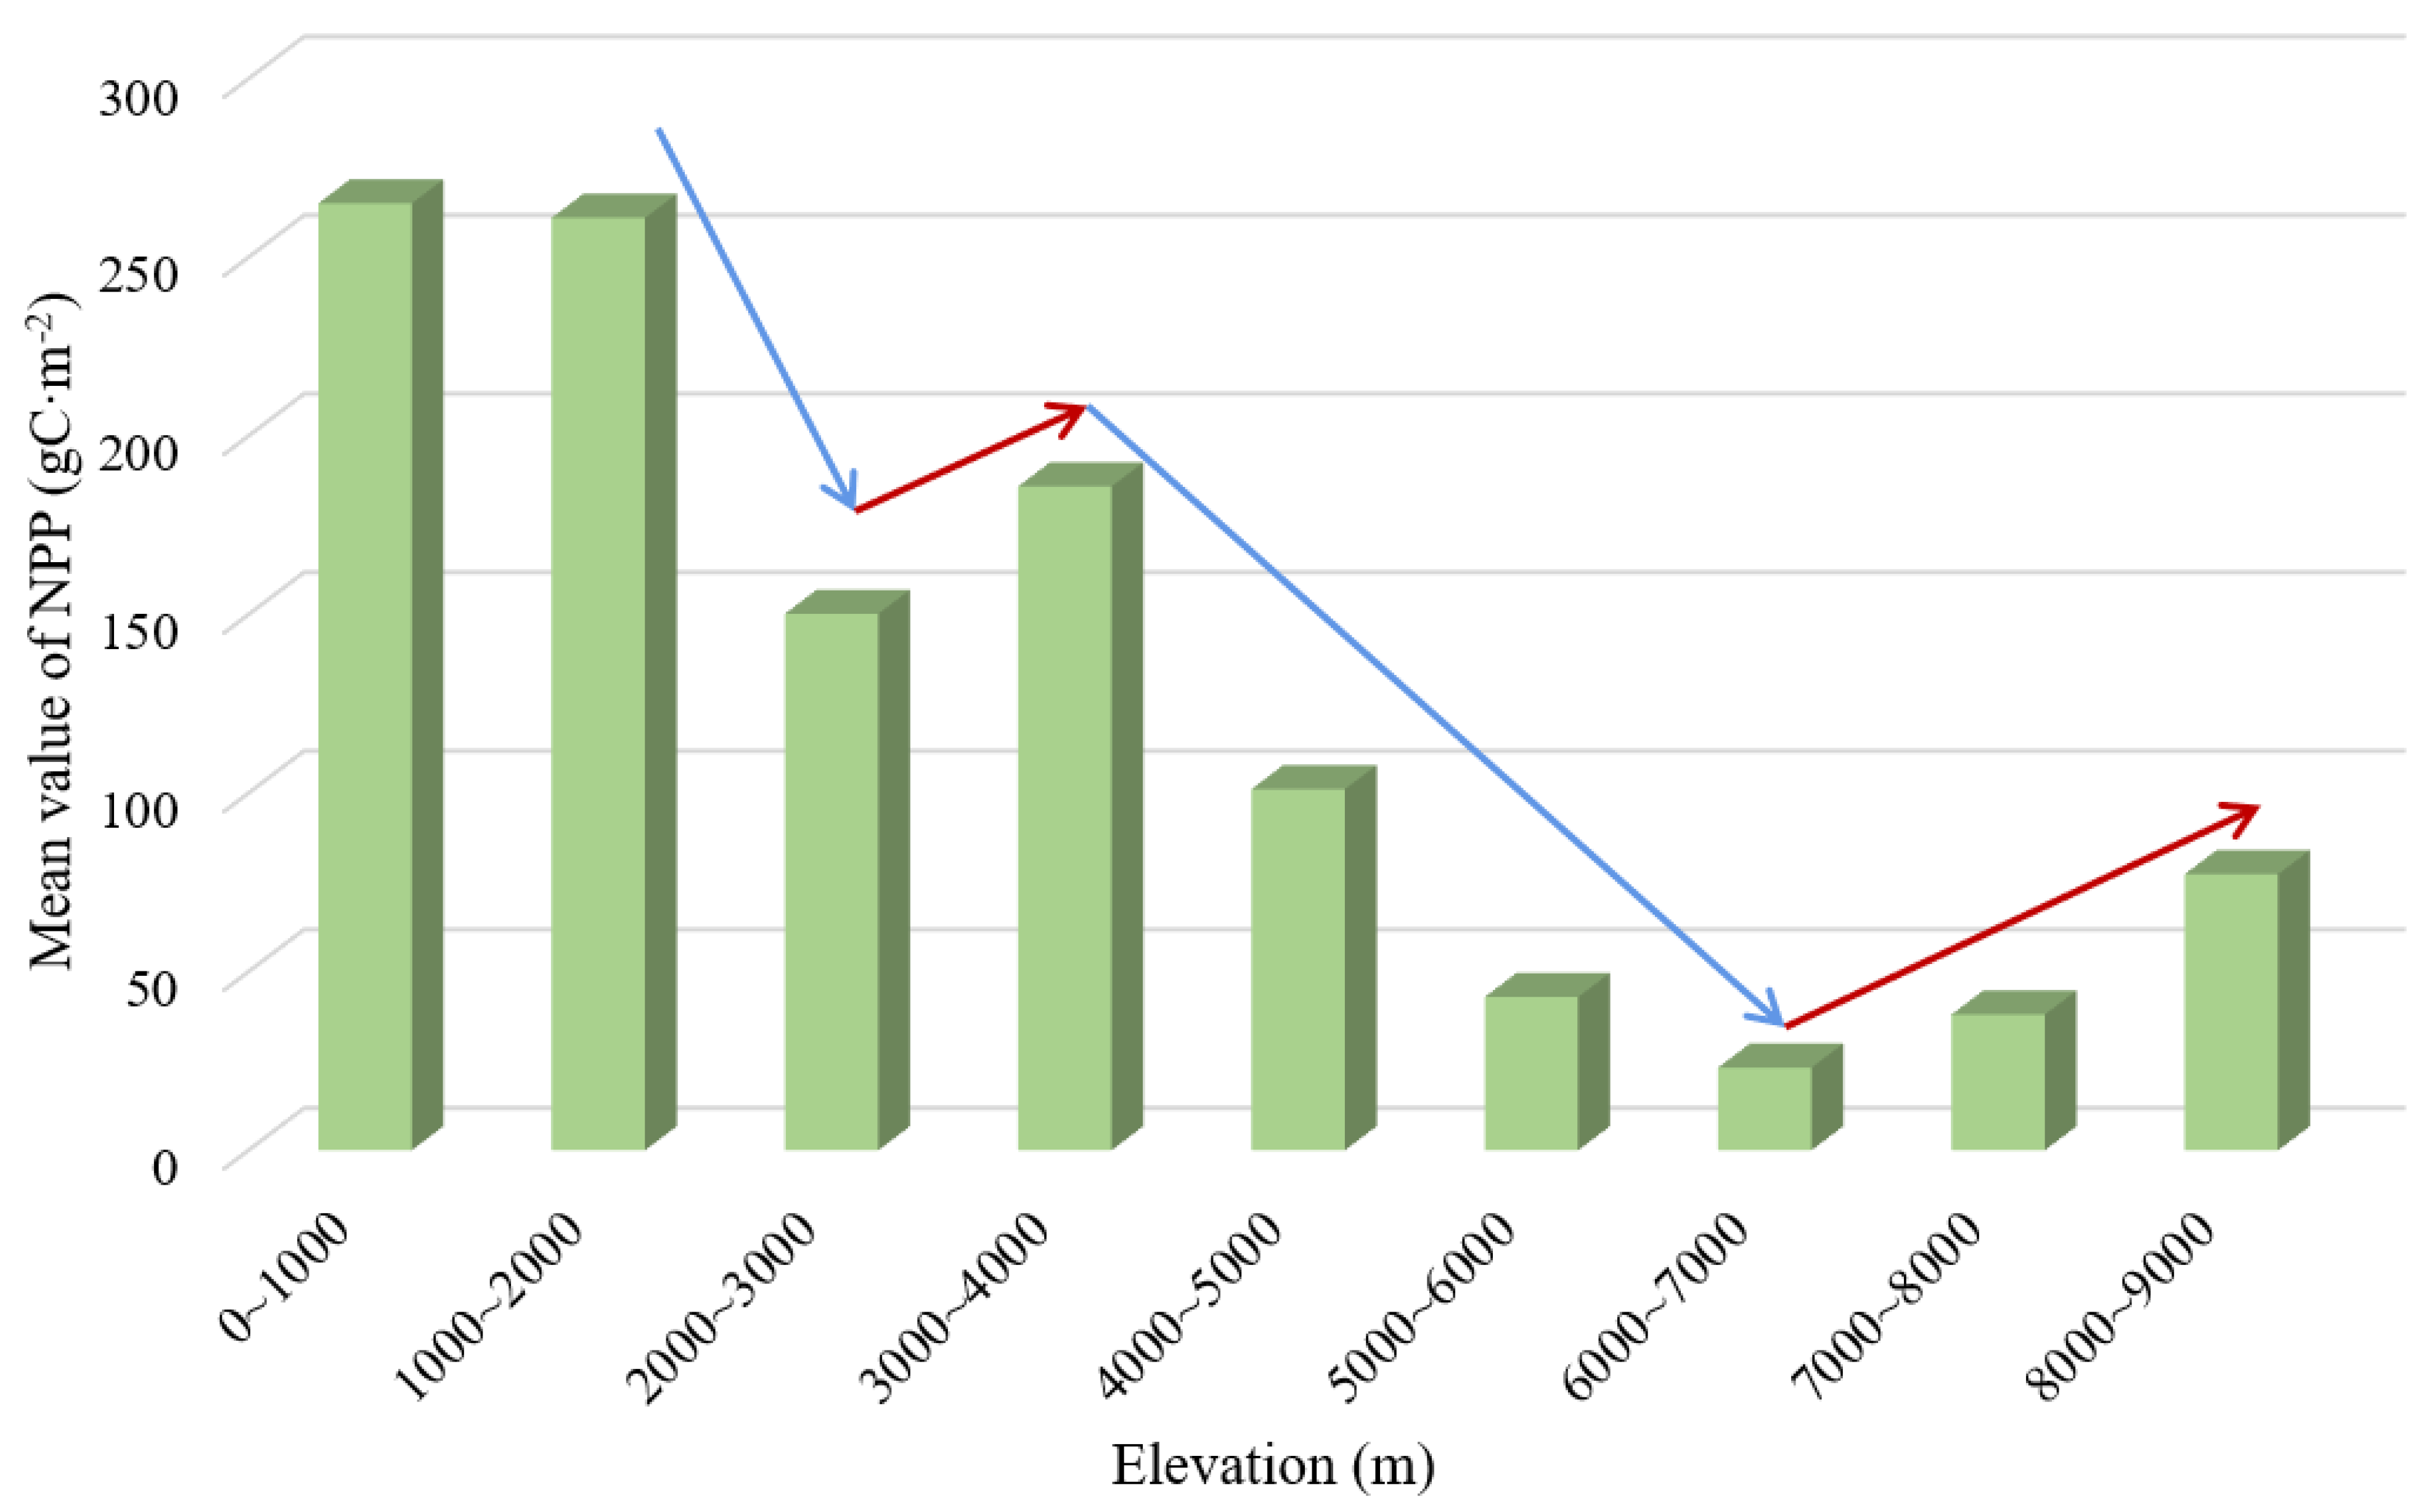
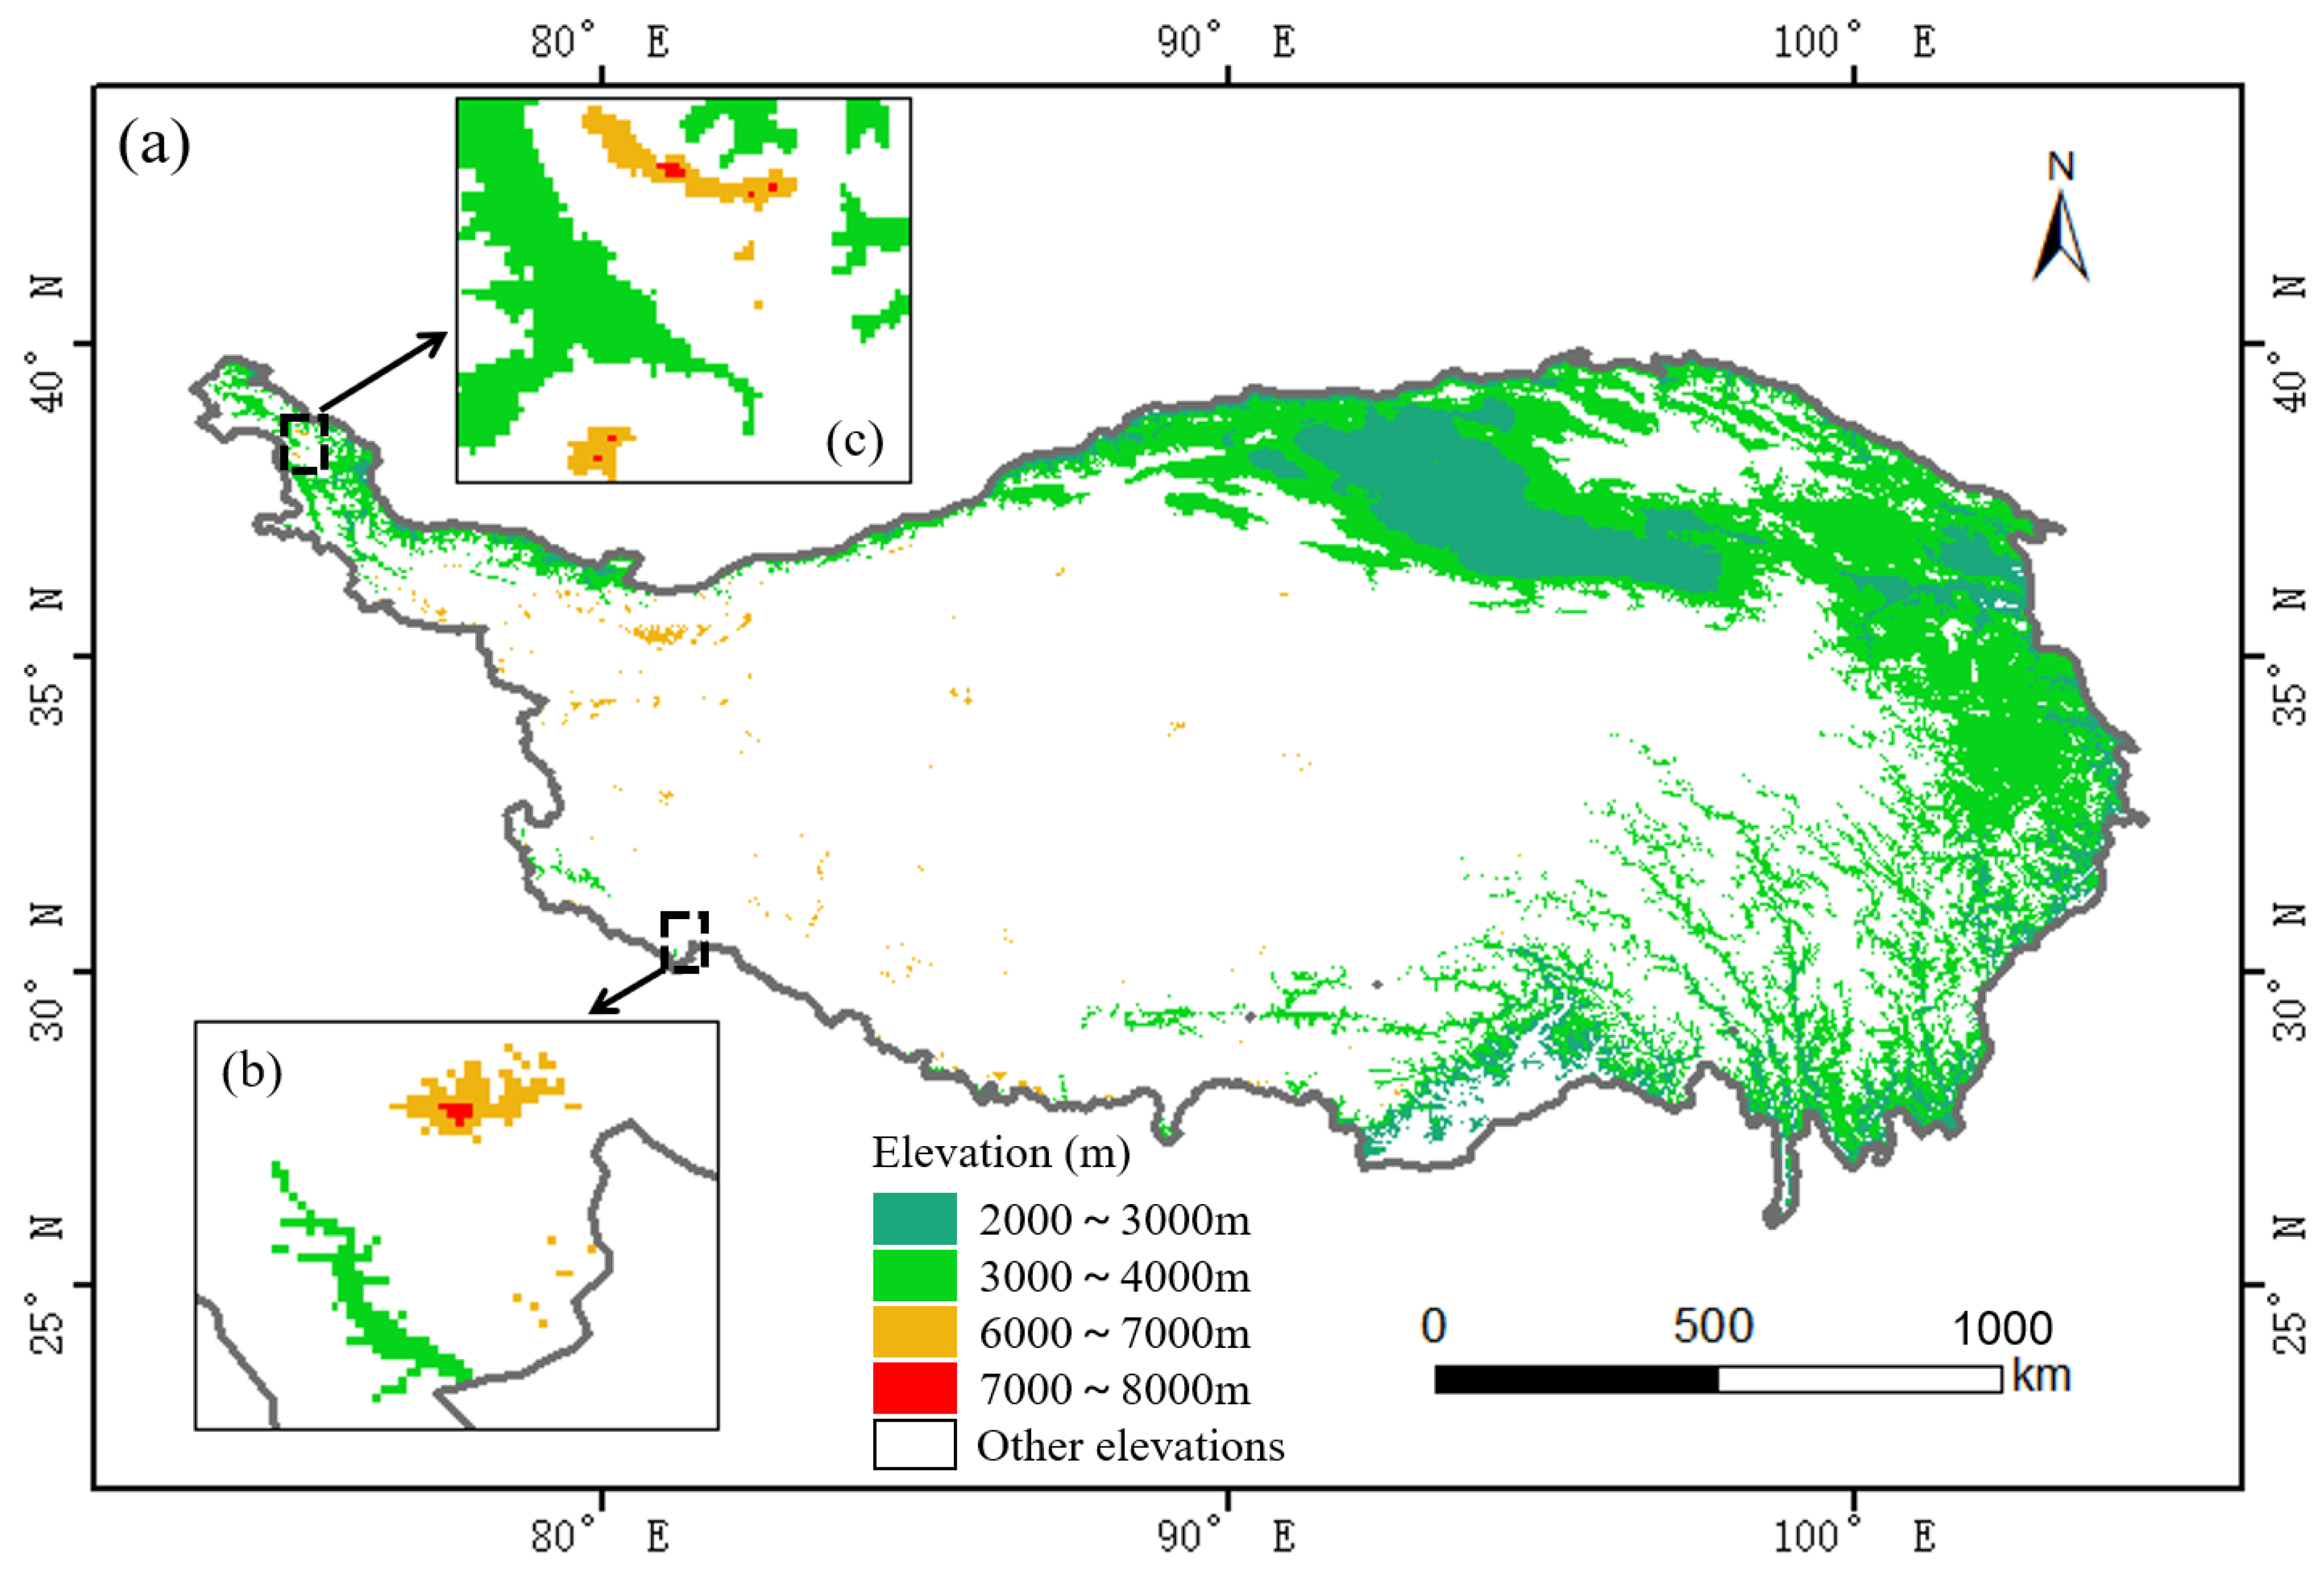
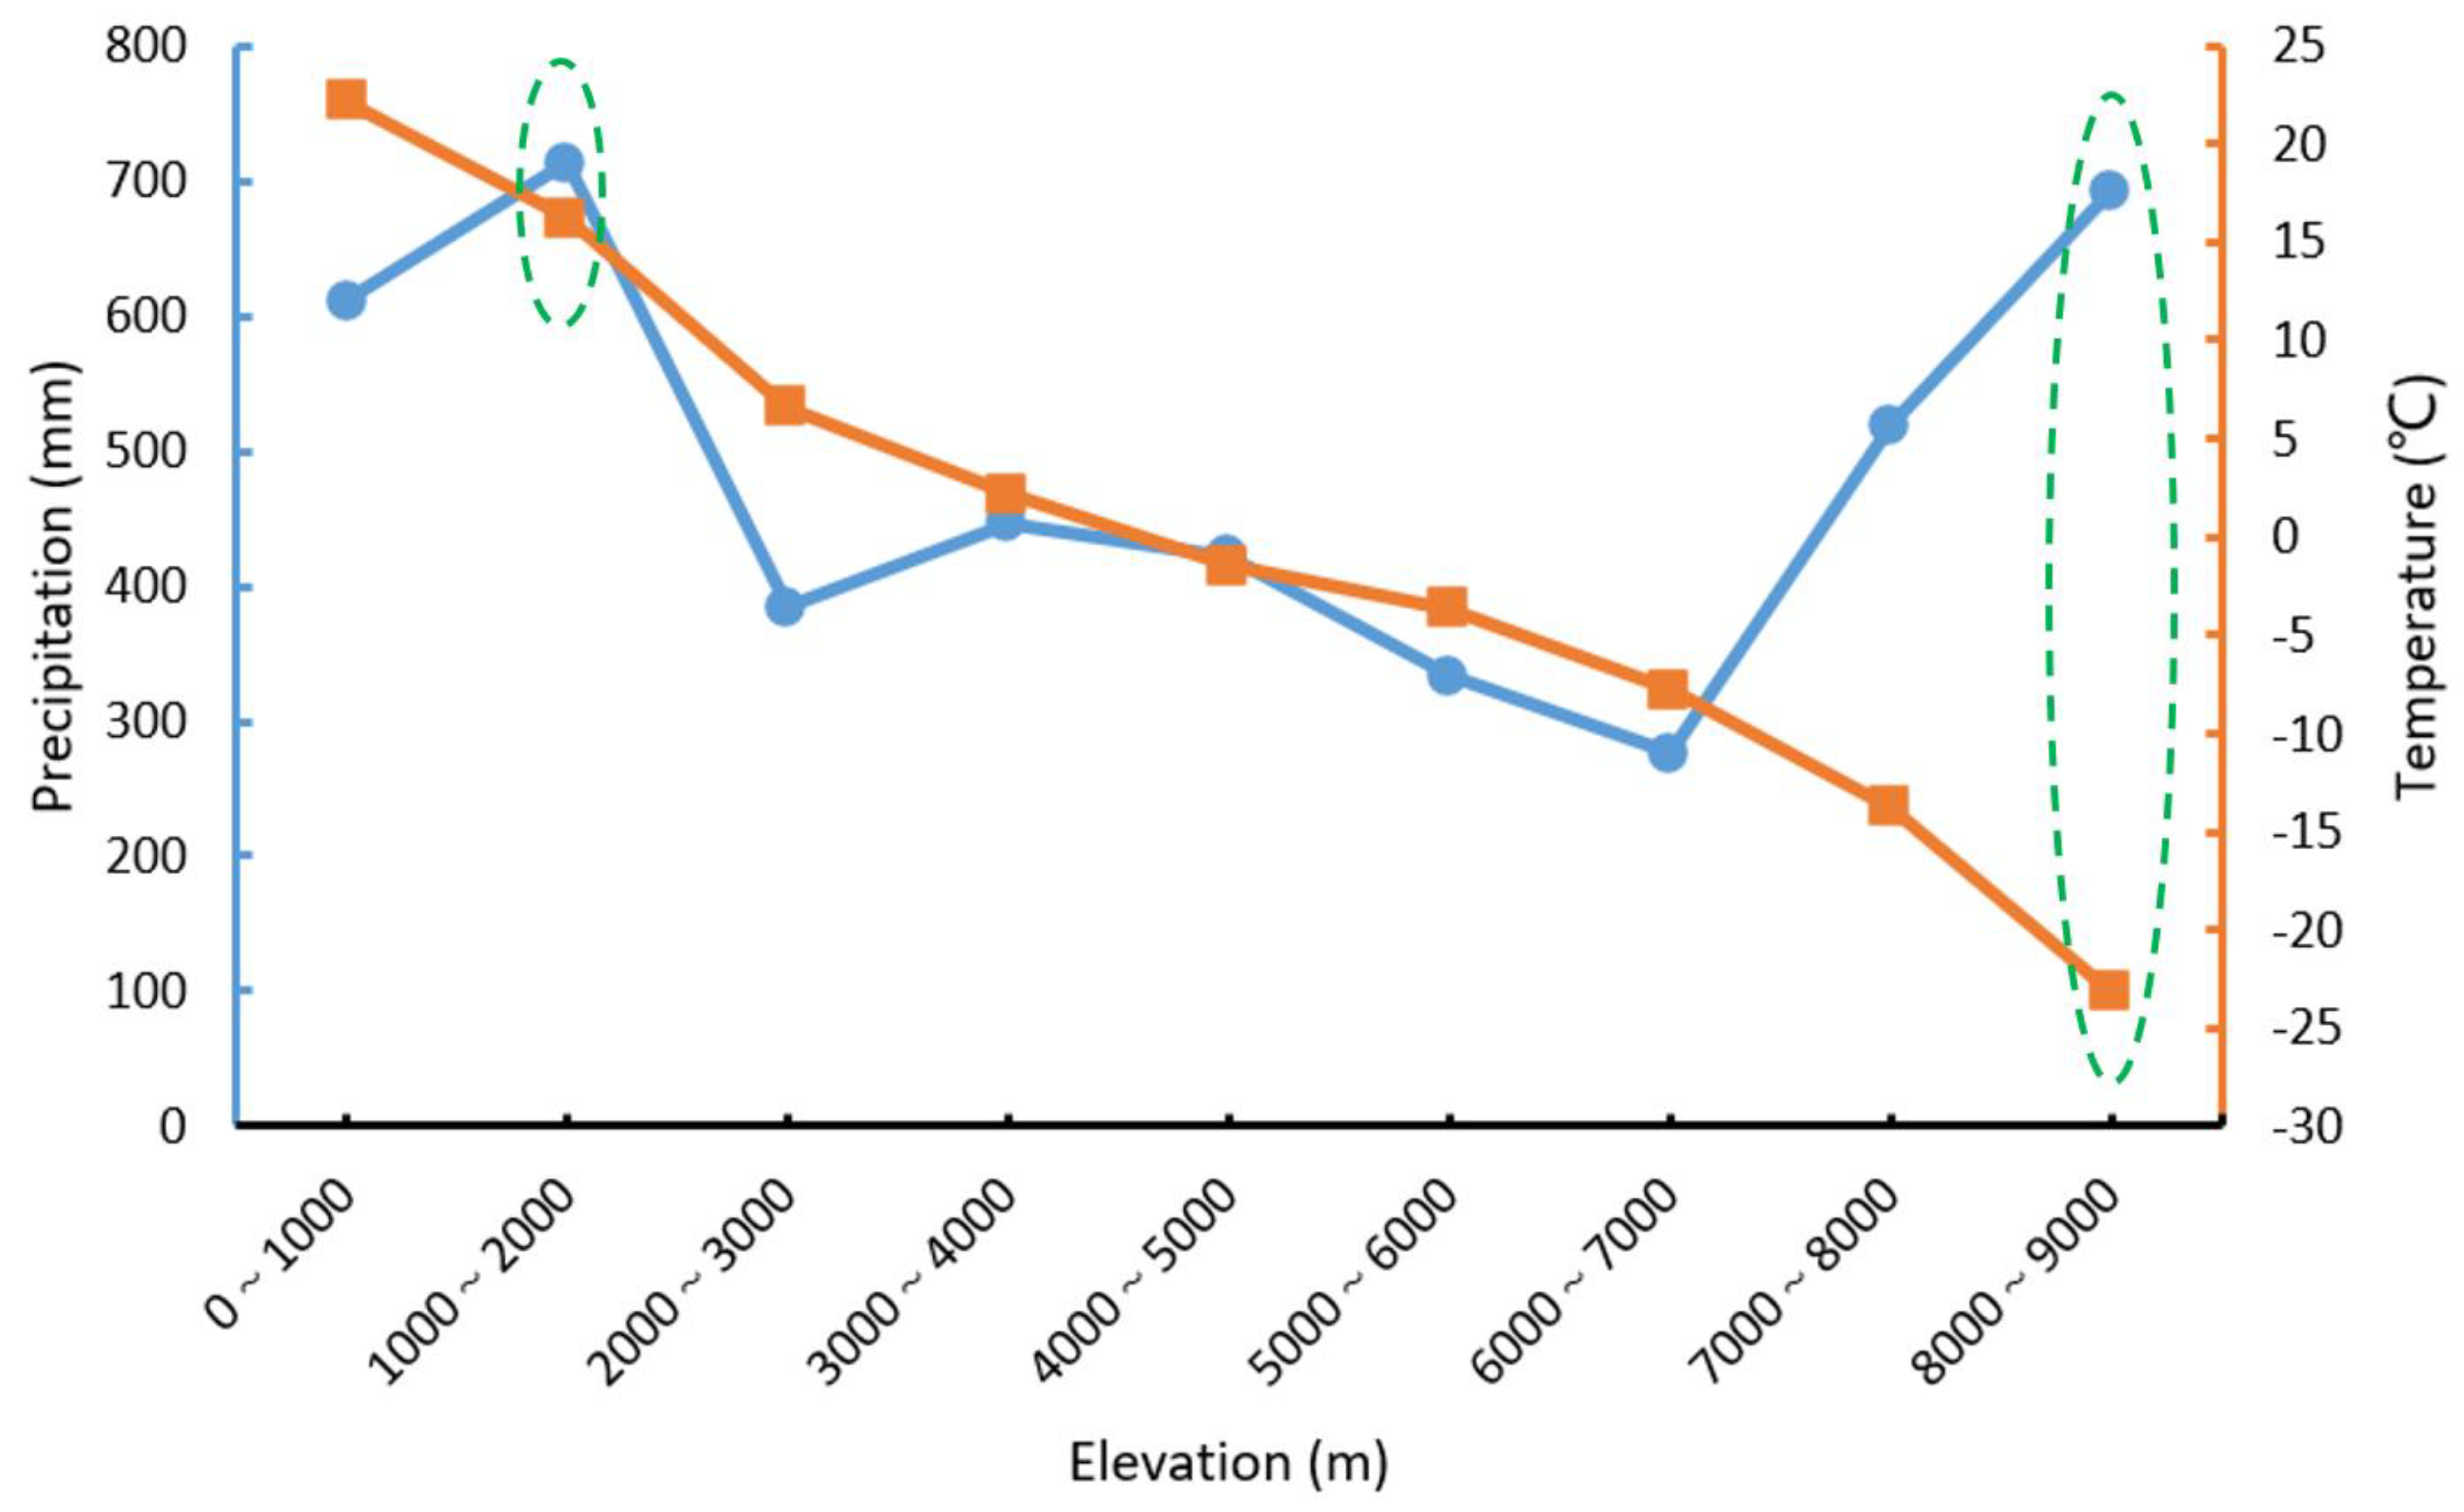
3.2.2. Influence of Altitude on NPP

The change situation of NPP value with elevation increase was “decrease—slightly increase—decrease again—slightly increase again” (Figure 10). NPP reached the maximum value (265.13 gC·m−2) between 0 m and 1000 m, followed by 1000 ~ 2000 m (261.07 gC·m−2) and the minimum value was 23.16 gC·m−2 between 6000 m and 7000 m. The average value of NPP was 215.57 gC·m−2 in the range of 0 ~ 4000 m, 159.07 gC·m−2 more than that in the range of 4000 ~ 9000 m. The turning point occurred at 2000m (decreasing), 3000 m (increasing), 4000 m (decreasing) and 7000 m (increasing), respectively. NPP decreased gradually in the elevation segment of 3000 ~ 7000 m, and the NPP between 6000 m and 7000 m was 162.72 gC·m−2 lower than the NPP in the elevation segment of 3000 ~ 4000 m. However, NPP gradually increased in the elevation segment of 6000 ~ 9000 m, and the NPP between 8000 m and 9000 m was 54.14 gC·m−2 higher than the NPP in the elevation segment of 6000 ~ 7000 m. Overall, with the increase of height, NPP showed a downward trend, with a change rate of −30.293 gC·m−2·km−1 (R2 = 0.7869; RMSE = 40.702 gC·m−2).
We calculated the average temperature and precipitation at different altitudes from 2001 to 2017 (Figure 11). The value of precipitation was mainly distributed between 275.82 mm and 712.89 mm, and its variation trend was similar to that of NPP in different elevation sections. The temperature was mainly distributed between −23.15 °C and 22.15 °C, and the higher the altitude, the lower the temperature. In the elevation range of 1000 ~ 2000 m and 8000 ~ 9000 m, the precipitation was roughly the same, but the difference of NPP value (183.77 gC·m−2) was caused by the difference of temperature. Therefore, elevation affected the NPP by affecting the value of temperature and precipitation.

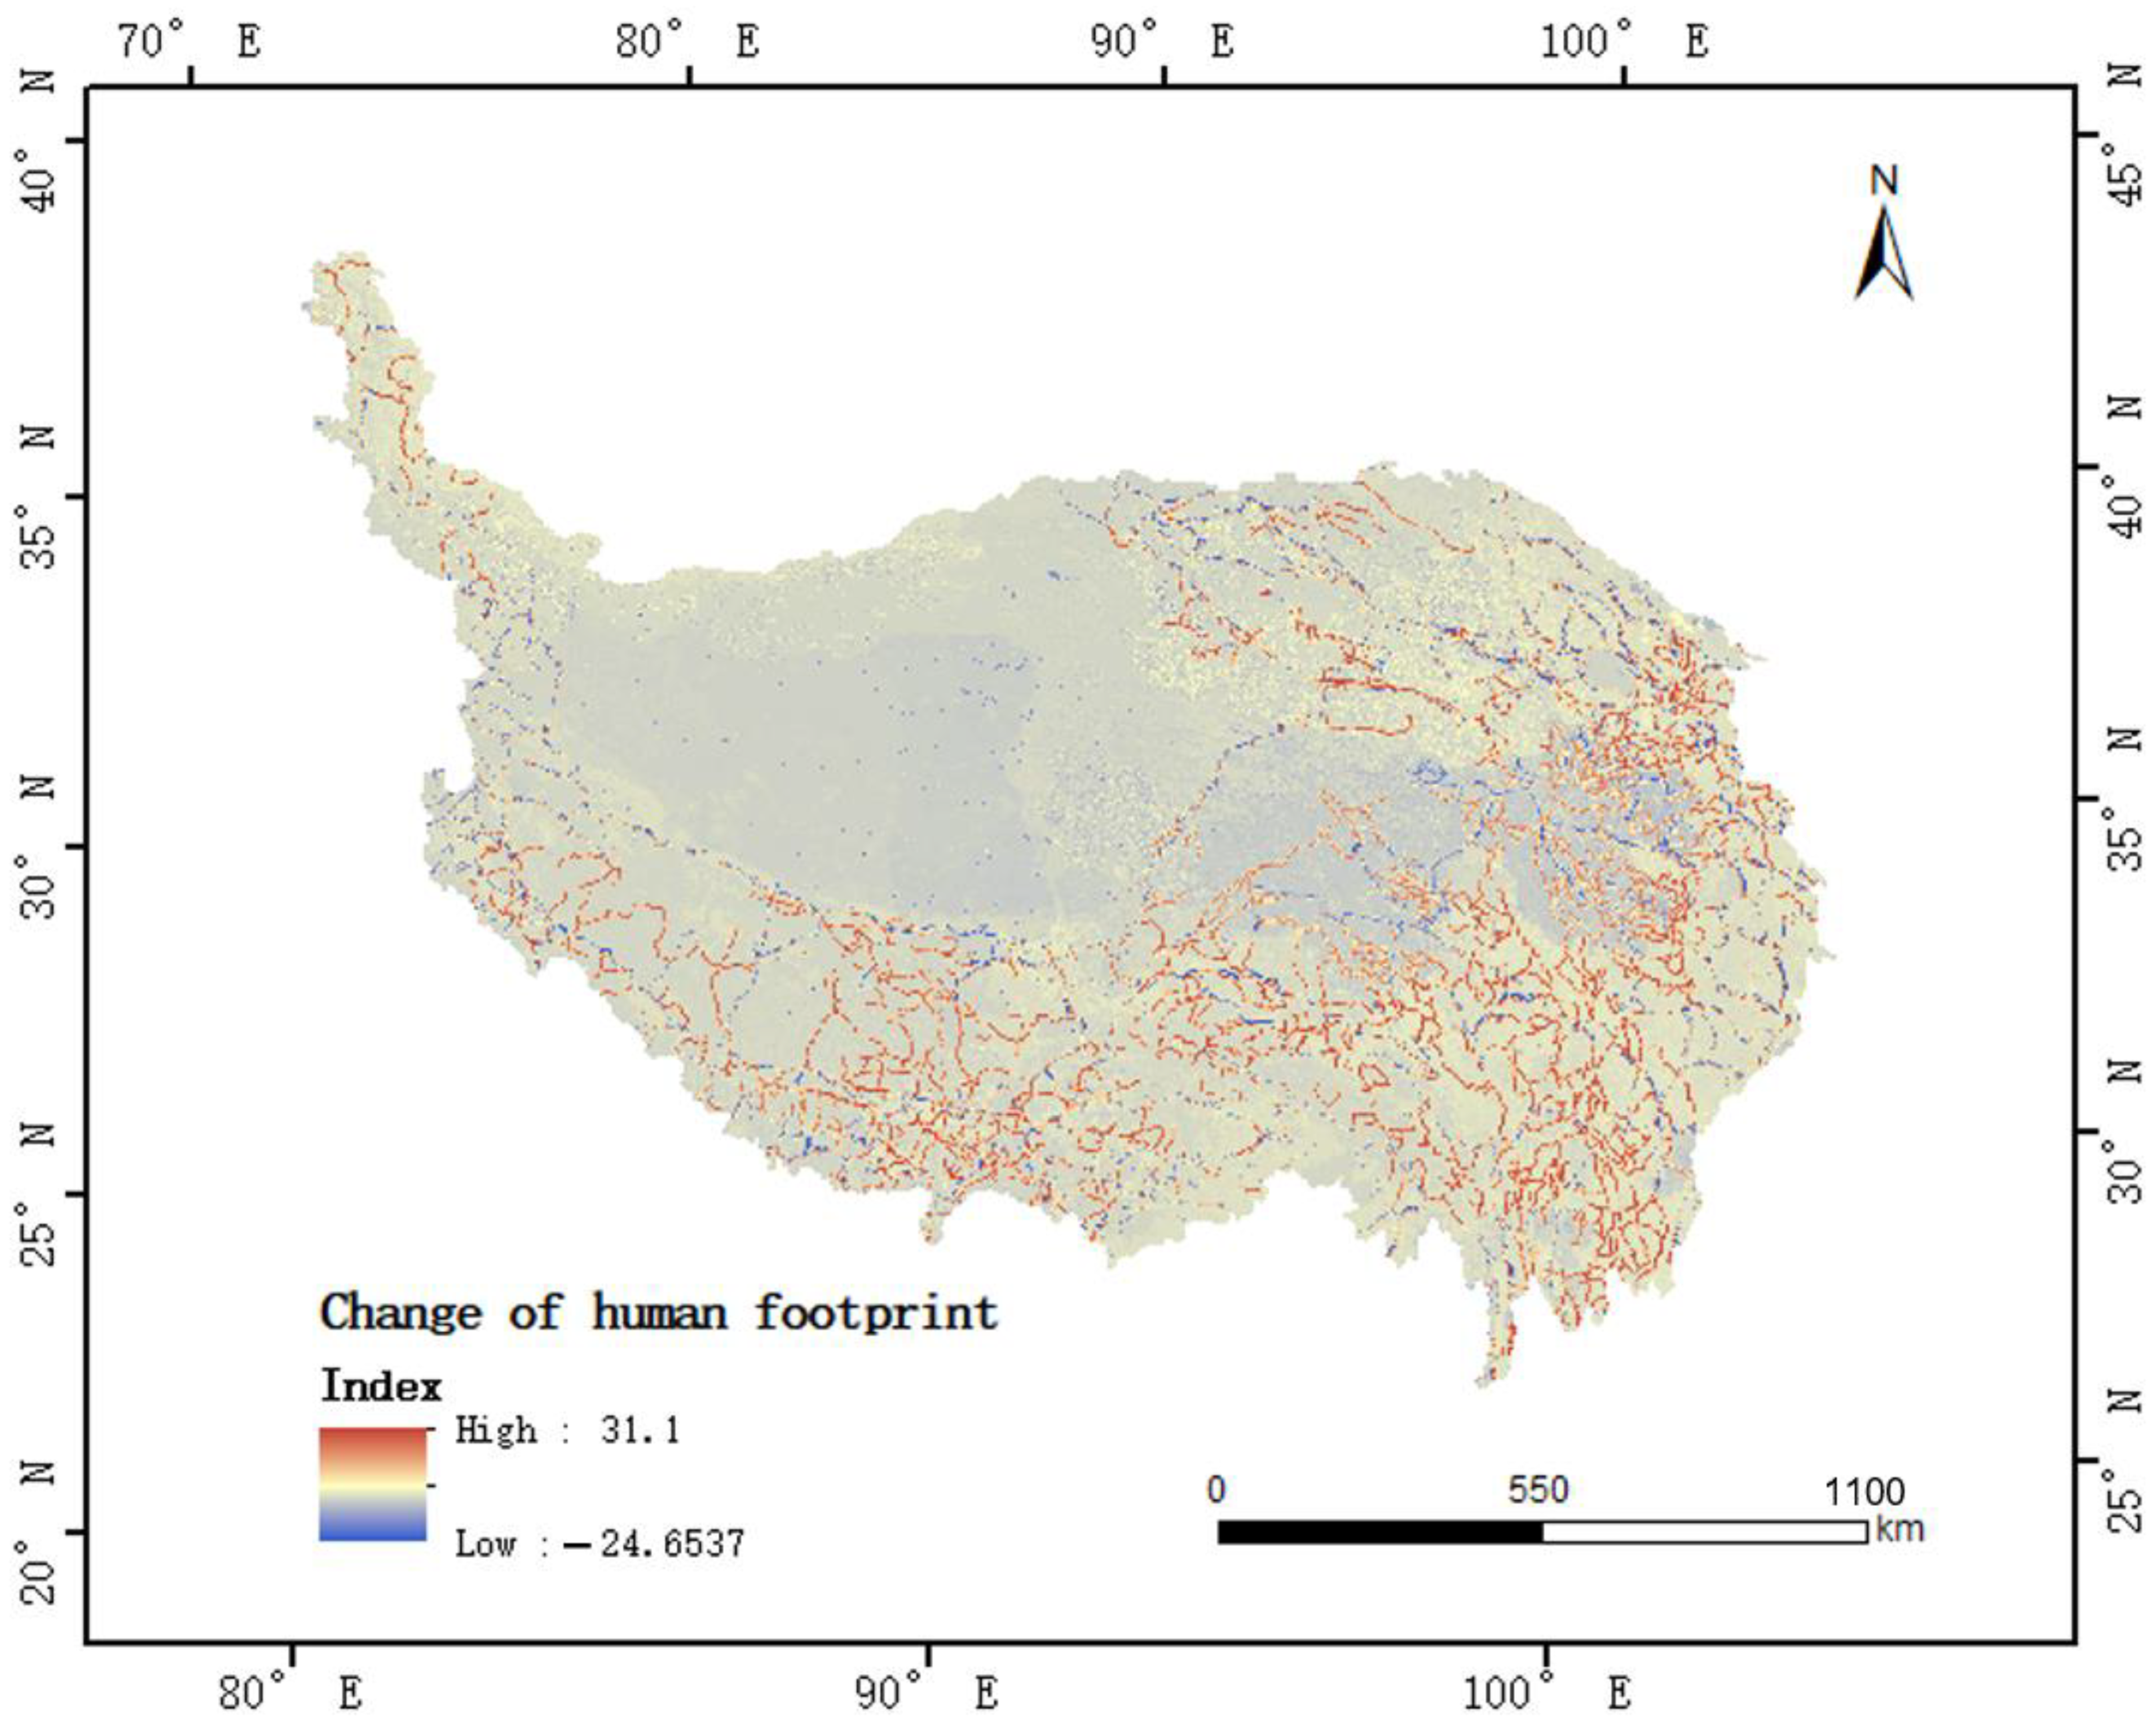
3.2.3. Response of NPP Changes to Human Activities

Due to the short vegetation growth season, the alpine and hypoxic geographic ecological environment in the QTP made the ecosystem very fragile and vulnerable to the disturbance and influence of human activities. In terms of vegetation growth, biomass and self-recovery after destruction, the QTP was inferior to the ecosystem in the low-altitude regions with a more suitable climate. The fragile ecosystem made this region vulnerable to human interference.
As can be seen from the distribution of the correlation coefficient, the strong positive correlation was mainly in the north and southeast, while the negative correlation was mainly in the central and western areas of the QTP (Figure 12). In the northwest part of QTP (south of the Kashgar region), there was a positive correlation. Among the correlation coefficients between NPP and human activities, the areas with positive correlation accounted for 13% more than the areas with negative correlation. The proportion of positive correlation between NPP and human activities was more than that of negative correlation. It was indicated that human activities had a great promoting effect on NPP.
We performed a significant test of the correlation coefficient in Figure 12 (confidence level was set as 0.05). Figure 13 displays the spatial distribution results of the significant test of correlation coefficients between NPP and human activities. Among them, the significant region accounted for about 14.3%, which was mainly distributed around Qinghai Lake, the southeastern part of the QTP, and Yushu, Naqu, Lhasa and other areas in the central part of the QTP.

4. Discussion

The QTP accounts for 25% of China’s total mainland and is composed of magnificent mountains. Its climate change is significantly different from other regions of China, including the climate change characteristics of various types of terrain (subtropical and tropical forests, alpine deserts) [45,46]. In recent years, the response of vegetation NPP to climate change has been one of the research hotspots, and different scholars have expressed different views [47,48,49,50,51,52,53]. Through spatio-temporal simulation analysis of China’s land NPP, Tao et al. [47] showed that national vegetation NPP was greatly affected by the El Niño phenomenon. The research results of Yao et al. [48] showed that the vegetation NPP in the source area of the Yangtze River changed from “cold and dry type” to “warm and wet type” from 1959 to 2008, and the vegetation NPP also shows an obvious rising trend. The research results of this paper showed that both NPP and temperature of the QTP increased year by year. The results of some studies about the NPP responding to climate change also confirmed the fact that the QTP temperature was warming [49,50], and the QTP NPP was increasing in general [51,52,53].
In our research, NPP was positively correlated with air temperature, and negatively correlated with precipitation (Figure 8 and Figure 9). Since temperature and precipitation showed a positive growth trend (Table 3 and Table 4) from 2001 to 2017, and NPP also showed a growth trend (Table 1) from 2001 to 2017, the impact of temperature on NPP was greater than that of precipitation on NPP. Among the two factors of temperature and precipitation, the temperature was the main factor affecting vegetation NPP. Our research was consistent with the previous research results [51,52].
In addition, we also analyzed the changes in the intensity of human activities on the QTP. Figure 14 shows the difference between 2015 and 2000 human footprint index data. The human activity index in eastern and southern QTP showed an upward trend, and the human activity index increased the most in roads and railways. The human activity index in the centre of the desert region and northwest of high-cold vegetation region showed a downward trend. The gradual accumulation of human beings (mainly to the east and south) increased the area of natural areas disturbed by human beings and gradually restored the ecology, which was also one of the main reasons for the increasing trend of NPP.
In Table 1, the NPP in the desert region showed a significant increase trend, indicating that people’s views on desert governance are gradually strengthened. In order to achieve better environmental governance effects, the Chinese government had planted a large number of diversifolious poplar in the desert area and achieved good results. Therefore, the NPP in the desert area showed a significant trend.
Topographic factors were one of the important factors affecting the heterogeneity pattern of the environment and vegetation, which generally controlled its precipitation, temperature conditions (Figure 11) and soil conditions through different processes and affected other environmental variables, and thus exerted an important influence on the regional vegetation pattern [54,55]. The QTP is densely covered with mountains and rivers, with steep and changeable terrain that is complex. Its average altitude is far higher than that of the surrounding areas at the same latitude. Therefore, it is of great significance to analyze the relationship between altitude and temperature, precipitation and their influence on NPP. The overall NPP value of QTP was low when the elevation exceeded 4000 m (Figure 10), which was consistent with the overall NPP value of northwest QTP in the spatial distribution (Figure 4). In the low elevation range, NPP value was relatively high, which was consistent with the higher NPP value in the southeast part of the region. Although NPP was closely related to climate and altitude, the interference of strong human activities on NPP could not be ignored. The increasing point of NPP (Figure 10) occurred at 3000 m and 7000 m, respectively. Combing with the elevation distribution (Figure 15) and change of human footprint (Figure 14) on QTP, we found anomalies in the NPP values near 3000 m and 7000 m (contrary to the tendency of NPP to decrease with increasing altitude). In the area of 3000 ~ 4000 m, human activities were relatively intense. People have carried out a series of activities to promote ecological environment protection and established the natural protected area system and ecological compensation system [56]. A relatively complete ecological and environmental monitoring system has been established. People’s ecological culture had gradually formed, and the awareness of protecting the ecological environment has also been strengthened, which made the NPP value in the area of 3000 ~ 4000 m higher. The area of 7000 ~ 8000 m (compared with the area of 6000 ~ 7000 m, with roughly the same temperature but more precipitation, according to Figure 11) had a higher sunlight intensity, and the vegetation received a higher sunlight intensity and a longer sunshine duration at the top of the mountain, so the NPP at 7000 ~ 8000 m was larger than that at 6000 ~ 7000 m.
The NPP data used in this paper are global data with a resolution of 500 m. Although they can be applied to provincial scale, problems such as low resolution, incomplete correction of atmospheric influence and mixed pixel will lead to errors in the analysis. In future research, higher resolution, multi-source and multi-temporal remote-sensing image data should be used to better reveal the vegetation changes in the study area. Furthermore, climatic factors also include wind speed, surface and subsurface runoff, etc., and we will explore the effects of other factors on vegetation NPP in the future.

5. Conclusions

We proposed an analysis framework for NPP of QTP and its driving factors based on a remote-sensing cloud computing platform. Based on the annual NPP data of QTP from 2001 to 2017, combined with the GEE cloud computing platform, the spatial and temporal evolution characteristics of NPP were analyzed by using linear regression, coefficient of variation, mathematical statistics. Pearson correlation coefficient was used to further analyze the relationship between NPP change and two main climate factors (temperature and precipitation). In addition, we also studied the impact of terrain and human activities on the NPP.
The mean value of NPP over the QTP was “high in the southeast and low in the northwest”. The average NPP in the broad-leaved forest area was the highest, which was 442.52 gC·m−2. The average NPP in the desert area was the lowest (74.17 gC·m−2). The NPP of grassland and high-cold vegetation area showed a positive increasing trend, while the NPP of the southwest part of the broad-leaved forest area showed a negative increasing trend. The CV of NPP was mainly concentrated in small variation (≤0.1), accounting for 59.2% of the QTP area, which indicated that the multi-year NPP of the QTP was relatively stable in general. In terms of climate factors, the increase of temperature was the main factor affecting the increase of NPP in the QTP. In the correlation coefficient between human activity intensity and NPP, the positive (strong) correlation accounted for 56.5% (2.6%) of the region as a whole of QTP. NPP around Qinghai Lake and in the central part of the QTP was significantly correlated with human activities, and the trend of NPP in these areas was positive. NPP showed a downward trend with the increase of altitude (trend: −30.293 gC·m−2·km−1). Among them, human activities and difference of temperature and precipitation caused by elevation were the main reasons for the increase of NPP at 3000 m and 7000 m.

Author Contributions

Conceptualization, Methodology, Code, Data curation, Writing-Original draft preparation, Y.Z.; Investigation and supervision, Q.H.; Visualization, F.Z. All authors have read and agreed to the published version of the manuscript.

Funding

This research was funded by the National Key R&D Program of China, grant number No: 2017YFD0600904, and the Key Laboratory for National Geographic Census and Monitoring, National Administration of Surveying, Mapping and Geoinformation, grant number No: 2015NGCM01.

Institutional Review Board Statement

Not applicable.

Informed Consent Statement

Not applicable.

Data Availability Statement

The codes of this study are available online at https://code.earthengine.google.com/286a008316b0f6843b7accd16193b450 (accessed on 17 April 2021).

Acknowledgments

The research was supported by the National Key R&D Program of China, grant number No: 2017YFD0600904, and the Key Laboratory for National Geographic Census and Monitoring, National Administration of Surveying, Mapping and Geoinformation, grant number No: 2015NGCM01.

Conflicts of Interest

The authors declare no conflict of interest.

References

  1. Choudhury, B.J. Carbon use efficiency, and net primary productivity of terrestrial vegetation. Adv. Space Res. 2000, 26, 1105–1108. [Google Scholar] [CrossRef]
  2. Jassal, R.S.; Andrew Black, T.; Cai, T.; Morgenstern, K.; Li, Z.; Gaumont-Guay, D.; Nesic, Z. Components of ecosystem respiration and an estimate of net primary productivity of an intermediate-aged Douglas-fir stand. Agric. For. Meteorol. 2007, 144, 44–57. [Google Scholar] [CrossRef]
  3. Jiao, W.; Chen, Y.; Li, W.; Zhu, C.; Li, Z. Estimation of net primary productivity and its driving factors in the Ili River Valley, China. J. Arid Land. 2018, 10, 781–793. [Google Scholar] [CrossRef] [Green Version]
  4. Piao, S.; Fang, J.; Chen, A. Seasonal dynamics of terrestrial net primary production in response to climate changes in China. Acta Bot. Sin. 2003, 45, 269–275. [Google Scholar]
  5. Bondeau, A.; Kicklighter, D.W.; Kaduk, J. Comparing global models of terrestrial net primary productivity (NPP): Importance of vegetation structure on seasonal NPP estimates. Glob. Chang. Boil. 1999, 5, 35–45. [Google Scholar] [CrossRef]
  6. Turner, D.P.; Ritts, W.D.; Cohen, W.B.; Gower, S.T.; Running, S.W.; Zhao, M.; Costa, M.H.; Kirschbaum, A.A.; Ham, J.M.; Saleska, S.R.; et al. Evaluation of MODIS NPP and GPP products across multiple biomes. Remote Sens. Environ. 2006, 102, 282–292. [Google Scholar] [CrossRef]
  7. Chemodanov, A.; Jinjikhashvily, G.; Habiby, O.; Liberzon, A.; Israel, A.; Yakhini, Z.; Golberg, A. Net primary productivity, biofuel production and CO2 emissions reduction potential of Ulva sp. (Chlorophyta) biomass in a coastal area of the Eastern Mediterranean. Energy Conv. Manag. 2017, 148, 1497–1507. [Google Scholar] [CrossRef]
  8. Zhang, Y.; Qi, W.; Zhou, C.; Ding, M.; Liu, L.; Gao, J.; Bai, W.; Wang, Z.; Zheng, D. Spatial and temporal variability in the net primary production of alpine grassland on the Tibetan Plateau since 1982. J. Geogr. Sci. 2014, 24, 269–287. [Google Scholar] [CrossRef]
  9. Brasil, L.S.; Silverio, D.V.; Cabette, H.S.R.; Batista, J.D.; Vieira, T.B.; Dias-Silva, K.; de Oliveira-Junior, J.M.B.; de Carvalho, F.G.; Calvao, L.B.; Macedo, M.N.; et al. Net primary productivity and seasonality of temperature and precipitation are predictors of the species richness of the Damselflies in the Amazon. Basic Appl. Ecol. 2019, 35, 45–53. [Google Scholar] [CrossRef]
  10. Sun, H.; Zheng, D.; Yao, T.; Zhang, Y. Protection and construction of the national ecological security shelter zone on Tibetan Plateau. Acta Geogr. Sin. 2012, 67, 3–12. [Google Scholar]
  11. Wang, L.; Gong, W.; Zhang, M.; Ma, Y. Dynamic monitoring of vegetation NPP in Wuhan based on MODIS. Geom. Inf. Sci. Wuhan Univ. 2013, 38, 548–552. [Google Scholar]
  12. Zhou, W.; Sun, Z.; Li, J.; Gang, C.; Zhang, C. Desertification dynamic and the relative roles of climate change and human activities in desertification in the Heihe River Basin based on NPP. J. Arid Land. 2013, 5, 465–479. [Google Scholar] [CrossRef] [Green Version]
  13. Etherington, J.R. Environment and Plant Ecology; John Wiley & Sons: London, UK, 1989. [Google Scholar]
  14. Raich, J.W.; Rastetter, E.B.; Melillo, J.M.; Kicklighter, D.W.; Steudler, P.A.; Peterson, B.J.; Grace, A.L.; Moore, B., 3rd; Vorosmarty, C.J. Potential net primary productivity in south America: Application of a global model. Ecol. Appl. 1991, 1, 399. [Google Scholar] [CrossRef] [PubMed] [Green Version]
  15. Zhang, F.; Feng, Q.; Li, X.; Wei, Y. Remotely-sensed estimation of NPP and its spatial-temporal characteristics in the Heihe River Basin. Journal of Desert Research. Chin. J. Ecol. 2014, 34, 1657–1664. [Google Scholar]
  16. Zhu, Y.; Han, L.; Zhao, Y.; Ao, Y.; Li, J.; Xu, K.; Liu, B.; Ge, Y. Simulation and spatio-temporal pattern of vegetation NPP in northwest China. Chin. J. Ecol. 2019, 38, 1–13. [Google Scholar]
  17. Li, Y.; Pan, X.; Wang, C.; Liu, Y.; Zhao, Q. Changes of vegetation net primary productivity and its driving factors from 2000 to 2011 in Guangxi, China. Acta Ecol. Sin. 2014, 34, 5220–5228. [Google Scholar]
  18. Mao, D.; Wang, Z.; Han, J.; Ren, C. Spatio-temporal pattern of net primary productivity and its driven factors in northeast China in 1982–2010. Sci. Geogr. Sin. 2012, 32, 1106–1111. [Google Scholar]
  19. Liu, Y.; Zhang, J.; Zhang, C.; Xiao, B.; Liu, L.; Cao, Y. Spatial and temporal variations of vegetation net primary productivity and its responses to climate change in Shandong Province from 2000 to 2015. Chin. J. Ecol. 2019, 38, 1464–1471. [Google Scholar]
  20. Wang, L.; Niu, Z.; Kuang, D. An Analysis of the terrestrial NPP from 2002 to 2006 in China based on MODIS data. Remote Sens. Land Resour. 2010, 4, 113–116. [Google Scholar]
  21. Piao, S.; Fang, J.; He, J. Variations in vegetation net primary production in the Qinghai-Xizang Plateau, China, from 1982 to 1999. Clim. Chang. 2006, 74, 253–267. [Google Scholar] [CrossRef]
  22. Li, Q.; Zhang, C.; Shen, Y.; Jia, W.; Li, J. Quantitative assessment of the relative roles of climate change and human activities in desertification processes on the Qinghai-Tibet Plateau based on net primary productivity. Catena 2016, 147, 789–796. [Google Scholar] [CrossRef]
  23. Guo, B.; Han, B.; Yang, F.; Chen, S.; Liu, Y.; Yang, W. Determining the contributions of climate change and human activities to the vegetation NPP dynamics in the Qinghai-Tibet Plateau, China, from 2000 to 2015. Environ. Monit. Assess. 2020, 192, 663. [Google Scholar] [CrossRef]
  24. Yang, R.; Cao, G.; Cao, S.; Lan, Y.; Zhang, Z.; Chen, Z.; Chen, Z. Temporal and spatial variation of NPP and its response to climatic factors in main river valleys on the southern slope of Qilian Mountains. E3S Web Conf. 2019, 131, 1044. [Google Scholar] [CrossRef]
  25. Dong, J.; Xiao, X.; Menarguez, M.A.; Zhang, G.; Qin, Y.; Thau, D.; Biradar, C.; Moore, B., III. Mapping paddy rice planting area in northeastern Asia with Landsat 8 images, phenology-based algorithm and Google Earth Engine. Remote Sens. Environ. 2016, 185, 142–154. [Google Scholar] [CrossRef] [Green Version]
  26. Huang, H.; Chen, Y.; Clinton, N.; Wang, J.; Wang, X.; Liu, C.; Gong, P.; Yang, J.; Bai, Y.; Zheng, Y.; et al. Mapping major land cover dynamics in Beijing using all Landsat images in Google Earth Engine. Remote Sens. Environ. 2017, 202, 166–176. [Google Scholar] [CrossRef]
  27. Lobell, D.B.; Thau, D.; Seifert, C.; Engle, E.; Little, B. A scalable satellite-based crop yield mapper. Remote Sens. Environ. 2015, 164, 324–333. [Google Scholar] [CrossRef]
  28. Pekel, J.F.; Cottam, A.; Gorelick, N.; Belward, A.S. High-resolution mapping of global surface water and its long-term changes. Nature 2016, 540, 418–422. [Google Scholar] [CrossRef]
  29. Hansen, M.C.; Potapov, P.V.; Moore, R.; Hancher, M.; Turubanova, S.A.; Tyukavina, A.; Thau, D.; Stehman, S.V.; Goetz, S.J.; Loveland, T.R.; et al. High-resolution global maps of 21st-century forest cover change. Science 2013, 342, 850–853. [Google Scholar] [CrossRef] [Green Version]
  30. Yin, S.; Wu, W.; Zhao, X.; Gong, C.; Li, X.; Zhang, L. Understanding spatiotemporal patterns of global forest NPP using a data-driven method based on GEE. PLoS ONE 2020, 15, e0230098. [Google Scholar]
  31. Robinson, N.P.; Allred, B.W.; Smith, W.K.; Jones, M.O.; Moreno, A.; Erickson, T.A.; Naugle, D.E.; Running, S.W. Terrestrial primary production for the conterminous United States derived from Landsat 30 m and MODIS 250 m. Remote Sens. Ecol. Conserv. 2018, 4, 264–280. [Google Scholar] [CrossRef]
  32. Zou, F.; Li, H.; Hu, Q. Responses of vegetation greening and land surface temperature variations to global warming on the Qinghai-Tibetan Plateau, 2001–2016. Ecol. Indic. 2020, 119, 106867. [Google Scholar] [CrossRef]
  33. Hou, X.Y. 1:1,000,000 Vegetation Atlas of China; China Cartographic Publishing House: Beijing, China, 2001. [Google Scholar]
  34. Running, S.W.; Glassy, J.M.; Thornton, P.E. MODIS Daily Photosynthesis (PSN) and Annual Net Primary Production (NPP) Product (MOD17) Algorithm Theoretical Basis Document, 1999; 1–59.
  35. Ding, M. Temperature and Precipitation Grid Data of the Qinghai Tibet Plateau and Its Surrounding Areas in 1998–2017 Grid Data of Annual Temperature and Annual Precipitation on The Tibetan Plateau and Its Surrounding Areas During 1998–2017; National Tibetan Plateau Data Center: Beijing, China, 2019. [Google Scholar] [CrossRef]
  36. Rabus, B.; Eineder, M.; Roth, A.; Bamler, R. The shuttle radar topography mission-a new class of digital elevation models acquired by spaceborne radar. ISPRS J. Photogramm. Remote Sens. 2003, 57, 241–262. [Google Scholar]
  37. Duan, Q.; Luo, L. A dataset of human footprint over the Qinghai-Tibet Plateau during 1990–2015. Sci. Data Bank 2019. [Google Scholar] [CrossRef]
  38. Tian, Z.; Zhang, D.; He, X.; Guo, H.; Wei, H. Spatio-temporal variations in vegetation net primary productivity and their driving factors in Yellow River Basin from 2000 to 2015. Res. Soil Water Conserv. 2019, 26, 255–262. [Google Scholar]
  39. Mann, H.B. Nonparametric test against trend. Econometrica 1945, 13, 245–259. [Google Scholar] [CrossRef]
  40. Bartko, J.J. The Intraclass Correlation Coefficient as a Measure of Reliability. Psychol. Rep. 1966, 19. [Google Scholar] [CrossRef]
  41. Reed, G.F.; Lynn, F.; Meade, B.D. Use of Coefficient of Variation in Assessing Variability of Quantitative Assays. Clin. Diagn. Lab. Immunol. 2003, 10, 1162. [Google Scholar] [CrossRef] [Green Version]
  42. McKinley, S.; Levine, M. Cubic spline interpolation. Colg. Redw. 1998, 45, 1049–1060. [Google Scholar]
  43. THE MATHWORKS Inc. Signal Processing ToolboxTM: User’s Guide, Version 6.16 (Release 2018); The Mathworks Inc.: Natick, MA, USA, 2018. [Google Scholar]
  44. Evans, J.D. Straightforward Statistics for the Behavioral Sciences; Brooks/Cole Publishing: Pacific Grove, CA, USA, 1996. [Google Scholar]
  45. Yang, Y.; Piao, S. Variations in grassland vegetation cover in relation to climatic factors on the Tibetan plateau. J. Plant Ecol. 2006, 30, 1–8. [Google Scholar]
  46. Ye, C.; Sun, J.; Liu, M.; Xiong, J.; Zong, N.; Hu, J.; Huang, Y.; Duan, X.; Tsunekawa, A. Concurrent and lagged effects of extreme drought induce net reduction in vegetation carbon uptake on Tibetan Plateau. Remote Sens. 2020, 12, 2347. [Google Scholar] [CrossRef]
  47. Tao, B.; Li, K.; Shao, X.; Cao, M. Temporal and spatial characteristics simulation of net primary productivity in China. Acta Geogr. Sin. 2003, 3, 372–380. [Google Scholar]
  48. Yao, Y.; Yang, J.; Wang, R.; Lu, D.; Zhang, X. Responses of net primary productivity of natural vegetation to climatic change over source regions of Yangtze River in 1959–2008. J. Glaciol. Geocryol. 2011, 33, 1286–1293. [Google Scholar]
  49. Niu, T.; Chen, L.; Zhou, Z. The characteristics of climate change over the Tibetan Plateau in the last 40 years and the detection of climatic jumps. Adv. Atmos. Sci. 2004, 21, 193–203. [Google Scholar] [CrossRef]
  50. Rangwala, I.; Miller, J.R. Climate change in mountains: A review of elevation-dependent warming and its possible causes. Clim. Chang. 2012, 114, 527–547. [Google Scholar] [CrossRef]
  51. Deji, Y.; Lu, X. Net primary productivity of Tibetan Plateau vegetation and its response to climate change. Green Technol. 2013, 10, 4–6. [Google Scholar]
  52. Gao, Y.; Zhou, X.; Wang, Q.; Wang, C.; Zhan, Z.; Chen, L.; Yan, J.; Qu, R. Vegetation net primary productivity and its response to climate change during 2001–2008 in the Tibetan Plateau. Sci. Total Environ. 2012, 444, 356–362. [Google Scholar] [CrossRef]
  53. Guo, B.; Zang, W.; Yang, F.; Han, B.; Chen, S.; Liu, Y.; Yang, X.; He, T.; Chen, X.; Liu, C.; et al. Spatial and temporal change patterns of net primary productivity and its response to climate change in the Qinghai-Tibet Plateau of China from 2000 to 2015. J. Arid Land. 2020, 12, 1–17. [Google Scholar] [CrossRef] [Green Version]
  54. García-Romero, A.; Aceves-Quesada, J.F.; Arredondo-León, C. Landform instability and land-use dynamics in tropical high mountains, Central Mexico. J. Mt. Sci. 2012, 9, 414–430. [Google Scholar] [CrossRef]
  55. Garcia-Aguirre, M.; Ortiz, M.; Zamorano, J.; Reyes, Y. Vegetation and landform relationships at Ajusco volcano Mexico, using a geographic information system (GIS). For. Ecol. Manag. 2007, 239, 1–12. [Google Scholar] [CrossRef]
  56. Xu, Z.; Zhang, Y.; Cheng, S.; Zheng, D. Scientific basis and the strategy of sustainable development in Tibetan Plateau. Sci. Technol. Rev. 2017, 35, 108–114. [Google Scholar]
Figure 1. Vegetation regionalization of the Qinghai-Tibet Plateau (QTP) (a), and the location of the study area (b).
Remotesensing 13 01566 g001
Figure 2. The workflow of the methods.
Remotesensing 13 01566 g002
Figure 3. The average net primary productivity (NPP) in different vegetation regionalization from 2001 to 2017.
Remotesensing 13 01566 g003
Figure 4. Spatial distribution of annual average of NPP over the QTP from 2001 to 2017.
Remotesensing 13 01566 g004
Figure 5. Spatial distribution of the trend of NPP over the QTP from 2001 to 2017.
Remotesensing 13 01566 g005
Figure 6. Spatial distribution of the coefficient of variation (CV) of NPP over the QTP from 2001 to 2017.
Remotesensing 13 01566 g006
Figure 7. The interannual variation characteristics of (a) precipitation and (b) temperature in QTP during 2001–2017.
Remotesensing 13 01566 g007
Figure 8. Correlation analysis of vegetation NPP with temperature (a) and precipitation (b) in QTP during 2001–2017. NaN represents no change in NPP or climate data for the region from 2001 to 2017 (the denominator in the correlation coefficient equation (Equation (2) in Section 2.2.2) was zero).
Remotesensing 13 01566 g008
Figure 9. The proportion of different correlation coefficient ranges.
Remotesensing 13 01566 g009
Figure 10. The response of NPP change to elevation: average value of NPP in different elevation sections.
Remotesensing 13 01566 g010
Figure 11. Changes of precipitation and temperature at different elevations.
Remotesensing 13 01566 g011
Figure 12. Correlation analysis of vegetation NPP with human activities (a). NaN represents no change in NPP or human activities data for the region from 2001 to 2017 (the denominator in the correlation coefficient equation (Equation (2) in Section 2.2.2) was zero). The proportional distribution of correlation coefficient between NPP and human activities (b).
Remotesensing 13 01566 g012
Figure 13. The significance test of correlation coefficient.
Remotesensing 13 01566 g013
Figure 14. Changes in the intensity of human activities.
Remotesensing 13 01566 g014
Figure 15. Elevation (2000 ~ 3000 m, 3000 ~ 4000 m, 6000 ~ 7000 m and 7000 ~ 8000 m) distribution of QTP (a). Demonstration of elevation of 7000 ~ 8000 m (b,c).
Remotesensing 13 01566 g015
Table 1. NPP mean value and trend analysis results of each region.
RegionTrend (gC·m−2·yr−1)SignificanceGoodness of Fit (R2)Root Mean Squared Error (RMSE) (gC·m−2) Mean (gC·m−2)
Total region0.345p = 0.420.04417.8653217.57
Desert0.8127p < 0.050.44244.469874.17
Grassland1.9177p < 0.050.47089.9612221.16
High-cold vegetation0.5788p = 0.070.20795.5342112.85
Broad-leaved forest−0.633p = 0.500.031317.2538442.52
Table 2. The proportion of different ranges of the NPP mean, trend and CV in QTP from 2001 to 2017.
Mean (gC·m−2)Trend ((gC·m−2)/yr)Coefficient of Variation (CV)
RangeProportion (%)RangeProportion (%)RangeProportion (%)
034.9<−502.2034.9
0 ~ 20041.3−50 ~ −251.10 ~ 0.062.9
200 ~ 3009.3−25 ~ 08.90.06 ~ 0.088.7
300 ~ 4006.4039.90.08 ~ 0.112.7
400 ~ 50020 ~ 1029.50.1 ~ 0.1213
500 ~ 8003.310 ~ 2010.90.12 ~ 0.1410.5
800 ~ 10001.420 ~ 303.90.14 ~ 0.167
>10001.4>303.6>0.1610.3
Table 3. Trend analysis and mean value of precipitation on each region.
RegionTrend (mm/yr)SignificanceR2RMSE (mm) Mean (mm)
Total region4.69p = 0.05 0.231141.93418.75
Desert4.29p = 0.070.20141.94123.91
Grassland6.41p < 0.050.314246.41366.94
High-cold vegetation3.69p < 0.050.295727.88452.54
Broad-leaved forest4.38p = 0.320.064981.38731.6
Table 4. Trend analysis and mean value of temperature on each region.
RegionTrend (°C/yr)SignificanceR2RMSE (°C)Mean (°C)
Total region0.0509p < 0.050.30220.3791.07
Desert0.0872p < 0.050.25090.7379−0.76
Grassland0.0254p = 0.190.11140.3509−1.12
High-cold vegetation0.0493p < 0.050.2690.3981−1.23
Broad-leaved forest0.0419p < 0.050.25560.34997.4
Table 5. Correlation between NPP and climatic factors in each vegetation regionalization of QTP.
TemperaturePrecipitation
Correlation
Coefficient
SignificanceCorrelation
Coefficient
Significance
Total region0.578 *p < 0.05−0.314p = 0.22
Desert0.164p = 0.53 0.19p = 0.46
Grassland0.629 ** p < 0.010.17p = 0.51
High-cold vegetation0.787 ** p < 0.01 −0.416p = 0.10
Broad-leaved forest0.458 p = 0.06 −0.543 * p < 0.05
** means passing the significance test with a confidence level of 0.01, and * means passing the significance test with a confidence level of 0.05.
Publisher’s Note: MDPI stays neutral with regard to jurisdictional claims in published maps and institutional affiliations.

