
On the Geopolitics of Fire, Conflict and Land in the Kurdistan Region of Iraq


1
Department of Physical Geography and Ecosystem Science, Lund University and Center for Advanced Middle Eastern Studies, Lund University, P.O. Box 117, 221 00 Lund, Sweden
2
Center for Environmental and Climate Science, Lund University, P.O. Box 117, 221 00 Lund, Sweden
3
Independent Researcher, Seattle, WA 98109, USA
4
Center for Advanced Middle Eastern Studies, Lund University, P.O. Box 117, 221 00 Lund, Sweden
*
Author to whom correspondence should be addressed.
Remote Sens. 2021, 13(8), 1575; https://0-doi-org.brum.beds.ac.uk/10.3390/rs13081575
Submission received: 15 December 2020
/
Revised: 6 April 2021
/
Accepted: 13 April 2021
/
Published: 19 April 2021
(This article belongs to the Special Issue Remote Sensing of Geopolitics)
Abstract
:There is limited understanding of the geopolitics of fire, conflict, and land, for example, how conflict and fire are related and how conflict impacts the biophysical environment. Since 2014, the natural environment in the Kurdistan Region of Iraq has been negatively affected by recurrent conflict that coincided with a sharp increase in the number of reported fires. Against this background, this study explores the spatiotemporal aspects of conflict, fire, and land use and land cover in this region. We combine several satellite-derived products, including land use and land cover, active fire, and precipitation. We apply a partial correlation analysis to understand the relationship between fire, conflict, climate, and land use and land cover. Conflict events and fires have increased since 2014 and have followed a similar temporal pattern, and we show that certain conflicts were particular to certain land use and land cover contexts. For example, the conflict involving the Islamic State was concentrated in southern areas with bare soil/sparse vegetation, and the conflict involving Turkey largely took place in northern mountainous areas characterized by natural vegetation and rugged topography. This dichotomy indicates divergent effects of conflict on the land system. A surprising finding was that fire hotspots had a low positive correlation with the amplitude of distance to conflict while accounting for other variables such as land cover and climate. The high statistical significance of this relationship indicates nonlinearity and implies that a larger range of distances to conflict creates more space for the fires to spread in the surrounding landscape. At the same time, fire hotspots had a weaker but negative correlation to distance from conflict events, which is somewhat expected as areas farther away from conflict locations have lower exposure risk to fires. We discuss the implications of these findings within the geopolitical context of the region and acknowledge the limitations of the study. We conclude with a summary of the main findings and recommendations for future research.
1. Introduction
The environmental effects of armed conflicts are many and do not follow a uniform pattern [1,2]. Peace and security are partly dependent on environmental security, and thus also upon understanding the interactions between conflict and the environment [3]. Armed conflicts include some of the most far-reaching shocks that can affect a land system. They can, for example, lead to land abandonment [4,5], changes in land-use intensity [6] and affect rates of deforestation [7,8]. On the one hand, studies showed that conflict zones have experienced reforestation and increased protection of biodiversity [9,10], for example, as a side-effect of land abandonment [11]. On the other hand, studies also found that peace agreements may lead to negative outcomes for the environment as they incentivize economic development, as evident in Colombia where deforestation has increased since the ratification of the peace agreement between the government and the Fuerzas Armadas Revolucionarias de Colombia [12,13]. Furthermore, armed conflicts can affect non-adjacent areas through the movement of refugees [14], indicating, among other things, a telecoupling effect [15]. Although the environmental dimensions of conflict as a topic of research have received more attention in recent years, it remains a complex issue with many uncertainties. These uncertainties stem primarily from the fact that conflict zones are often inaccessible to researchers due to security risks, which necessitates the gathering of data from these regions remotely.
Satellite remote sensing and geospatial analysis allow us to study and quantify changes in land use and land cover (LULC) and their geopolitical contexts. There is an increasing amount of freely available Earth observation data of reasonably high spatial and/or temporal resolution to allow for near-continuous monitoring of land systems in conflict. Furthermore, with long satellite data records, such as optical data from the Landsat archive, we can study armed conflicts dating back to the 1980s (cf. Eklund, Persson and Pilesjö [5]). In addition to optical data, synthetic aperture radar is also increasingly being used to map structural damage in conflict zones [16,17]. Earth observation can also be used to derive information beyond the amount of surface reflectance at different wavelengths. The availability of satellite-based data products on, for example, precipitation [18], night-time lights [19] and active fires [20,21] are especially important in areas where ground measurements are scarce, such as in geopolitically turbulent regions.
Fires are a common natural feature in land systems across the world. They can start through a variety of ways (e.g., lightning) and are generally more likely during certain climatic conditions such as during droughts and at higher temperatures, but always in combination with the availability of burnable biomass [22,23,24]. In many areas of the world, often in indigenous communities, fire is used as a land or ecosystem management tool [25,26] to, for example, increase turnover of nutrients or redistribute them within the soil. While environmental factors are important for fire risk, studies have found that humans are the source of most fires [22,27] as they can cause unintended (e.g., negligence) or intended (e.g., arson, land management) ignitions of fires.
Fires are also distinctive features of conflict zones as they are used offensively or occur as collateral damage. In the Kurdish region of Turkey, for example, intentional burning of land was used as a counterinsurgency strategy by the Turkish army in the early 1990s [28,29]. There was also an increase in fires after the failure of the peace process between the Turkish State and the Kurdistan Workers’ Party in 2015 [30]. In neighbouring Iraq, Rasul et al. [31] reported an increase in burned land area between 2001 and 2019, especially in the northern parts, including the Kurdistan Region of Iraq (KR-I). One of the reasons for this sharp increase in burned area was attributed to the intentional burning of cropland as well as the overall geopolitical instability in the country.
Although fire has a direct and visible impact on LULC, the overall geopolitical environment of conflict zones, such as the lack of security, also has a strong, albeit slower, impact on LULC. These factors are, of course, intertwined as agricultural land abandonment during conflict increases the amount of biomass on fields that could then be ignited during the conflict. In Iraq, several studies investigated the effect of conflict on agricultural land cover [5,6,32]. For example, Eklund, Persson and Pilesjö [5] showed how in the 1980s a series of attacks carried out by the Iraqi Government in the Kurdish Regions of Iraq, called the Anfal Campaign, was followed by a reduction of active cropland area around 1990.
It is reasonable to assume that areas where conflict had subsided would show a reduction in fire activity. However, that is not necessarily the case as, depending on the region, peace brings with it opportunities for the development of land that was abandoned due to conflict. This could involve using fire to clear the land and prepare it for agriculture. In Colombia, Armenteras, Schneider and Dávalos [12] found a 6-fold increase in fires in protected areas after the peace accord in 2016 due to both legal and illegal deforestation. This indicates that peace processes have varying impacts on the prevalence of fire, and more empirical research on the topic is needed.
Study Rationale and Objectives
The geopolitical aspects of fire and the land system have received limited attention with a relatively few number of cases where fire was associated with conflict and violence [23,33]. Our aim in this article is to initiate a dialogue about the geopolitics of fire, conflict and land through a case study in the Kurdistan Region of Iraq. As such, this study should be viewed as an initial step in deciphering the interdisciplinary complexities of fire, conflict and land on a larger scale using satellite remote sensing as the key tool. We quantitatively assess claims of conflict-related increases in fire events in the region as well as the role of climate. This will aid our understanding of the relationship between violent conflict, fire events and their interaction with the land system. We use satellite data products and geospatial analysis to study the dynamics of conflict, fire and land, focusing on the most recent 20 years (2000–2019). Specifically, we ask the following questions:
- How has LULC in KR-I changed between 2000 and 2019, and in particular during the latest conflict periods that took place from 2014 onwards?
- How do the dynamics of fires and conflicts correspond across time and space?
- In what LULC contexts do conflicts and fires co-occur?
- What is the role of climate in the prevalence of fires?
As the objective of this study is to better understand the interplay between fire, conflict and land in this volatile region, we focus specifically on changes in vegetative cover for two reasons. First, croplands, forests and pastures are consistently under the influence of anthropogenic activity and at the receiving end of social and political decisions [34], inter-group conflict and terrorism [35,36] due to their importance for food security and livelihoods. Second, croplands in Iraq are regularly burned as part of the agricultural cycle, and the trend in their burned area has increased considerably in recent years [31], while 15% of the country’s forests, which are mostly located in the KR-I, are at high risk of forest fires [37]. We are also interested in areas with sparse vegetation cover as such regions were found to be linked to anthropogenic activity in a biophysically similar area in Syria [38].
2. Background on the Geopolitics of the Region
2.1. The Conflict Context in Iraq: 2000–2019
In the aftermath of the 9/11 attacks in 2001, the United States (U.S.)-led coalition forces invaded Iraq in March 2003 based on false information about the presence of weapons of mass destruction [39]. Although the coalition forces declared victory as early as May 2003, conflict in Iraq continued in subsequent years between militias and remaining U.S. forces, and among rivalling militias. Violence and conflict began to decrease from 2007 onwards and the U.S. forces withdrew from Iraq in 2011. Following the U.S. withdrawal, tensions and clashes between the Federal Government of Iraq and the Kurdistan Regional Government (KRG) continued. In January 2014, the so-called Islamic State (hereafter IS) captured the cities of Raqqa in Syria and Falluja and Ramadi in Iraq, starting a new war in the region. By June 2014, IS had captured the cities of Mosul and Tikrit and announced its leader, Abu Bakr al Baghdadi, as caliph. Global powers (U.S. and Russia), regional actors (Turkey, Iran, Saudi Arabia, Jordan) and quasi-states (the KRG and the Democratic Federation of Northern Syria) were all involved in the war between the Federal Government of Iraq and IS that continued until 2017. The U.S.-led coalition army called the “Combined Joint Task Force–Operation Inherent Resolve” (including states such as the United Kingdom, Australia, Canada, France, the Netherlands) began fighting IS in August 2014 following what is now referred to as the Yezidi Genocide by IS in the Sinjar Mountains. From 2015 onwards, the areas that were captured by IS in Iraq had been recaptured. Over 26,000 soldiers and military personnel and nearly 70,000 civilians reportedly died between 2014 and 2017 [40,41]. Even after the announcement of IS’s territorial defeat in March 2019, IS continues to carry out sporadic but significant attacks on civilians and military targets in Iraq and Syria. Between 2014 and 2016, 87% percent of the conflict events in the KR-I that had at least one fatality were related to the conflict with IS, according to the Uppsala Conflict Data Program (UCDP) [42].
2.2. The Turkey–PKK Conflict
The Kurdistan Workers’ Party (Partiya Karkerên Kurdistan, PKK) was established in 1978 and in 1984 began its war against Turkey to establish an independent Kurdish state. The armed conflict between Turkey and the PKK escalated in the 1990s. The leader of the PKK, Abdullah Öcalan, was captured in Kenya in 1999 and was returned to Turkey, where he was sentenced to lifetime imprisonment. The PKK had declared unilateral ceasefires, both before and after Öcalan’s capture, and also shifted its paradigm from nationalism to democratic confederalism [43]. In 2005, a dialogue between the governing Justice and Development Party (Adalet ve Kalkinma Partisi, AKP) in Turkey and the PKK was initiated by international actors, but the talks were frequently interrupted. The most stable peace process took place between 2013 and 2015, which eventually collapsed in July 2015, resulting in remilitarisation of the conflict. In the aftermath of the peace process, Turkey not only conducted military operations against the PKK within its own borders, but also launched ground and air offensives in northern Iraq and northern Syria based on its claims that the PKK operated in these areas. According to the International Crisis Group, fatalities within the vicinity of the Qandil Mountains in northern Iraq, where the PKK has a military base, have progressively increased over the years, from 64 fatalities in 2016, to 68 in 2017, to 92 in 2018, and to 208 in 2019 [44]. Altogether, the International Crisis Group reports 627 fatalities in the area since 2015. The UCDP reports that 106 of the 124 conflict events (with at least one fatality) recorded in the KR-I during 2017–2019 were linked to the Turkey-PKK conflict [42].
2.3. Media Reports on Environmental Impacts
Fires and deforestation have reportedly increased in the KR-I, especially since 2014, which was due to the combination of armed conflicts, poor governance and climate stress. Although the main group behind forest and cropland fires in Iraq was likely IS, fires were also caused by accident (e.g., electrical short-circuits, sparks from farming machinery, cigarettes) and by farmers who intentionally burned their crops to receive compensation from the government [45]. Tensions in the disputed areas of Iraq, including Makhmour, Kirkuk and the north of Mosul, have led residents to suspect one another for starting fires in those localities [46]. Furthermore, Turkish and Iranian military forces have reportedly deliberately bombarded and burned forests [47] through airstrikes from 2015 onwards, particularly in the Kurdish regions of Iraq, with a claim to target areas with PKK activity.
Crops belonging to Kurdish farmers have reportedly been exposed to “systematic burning” caused by “fire of hatred and detestation” [48]. Although both the Iraqi federal government and the KRG pointed to IS as the main perpetrator behind these fires, KRG officials also alluded to “fire of hatred” in Kurdish farmers’ croplands under a new wave of “Arabization” under the federal government. The Kurdistan Region’s Ministry of Agriculture and Water Resources stated that the crop fires take place almost annually in a large area including Sinjar, Makhmour, and Kirkuk, causing damage to Kurdish farmers’ livelihoods [48]. Forests in distant mountain villages have also been consumed by fires.
One key reason for deforestation and increasing environmental destruction in Iraq, according to media reports, is poor governance. Due to the reduction of fuel subsidies by the local authorities following the 2014 crash in oil prices, people in the region were in need of more fuel during wintertime. Consequently, those living in distant mountain villages “stripped entire forests of trees, and sometimes torched the stumps” [49]. The combination of conflict and political neglect (e.g., prevalence of minefields, lack of vehicles and tools for firefighting, inaccessibility of the rugged mountains and the lack of protection of natural areas) has led to the increase in deforestation and damage to wildlife in Iraq [50], thereby endangering several species of animals and plants [51,52]. In addition to these reported socio-political causes, there are natural causes of deforestation and forest fires such as extreme climate events (e.g., floods or heat waves) which are expected with the variability associated with anthropogenic climate change [53].
3. Materials and Methods
3.1. Study Area
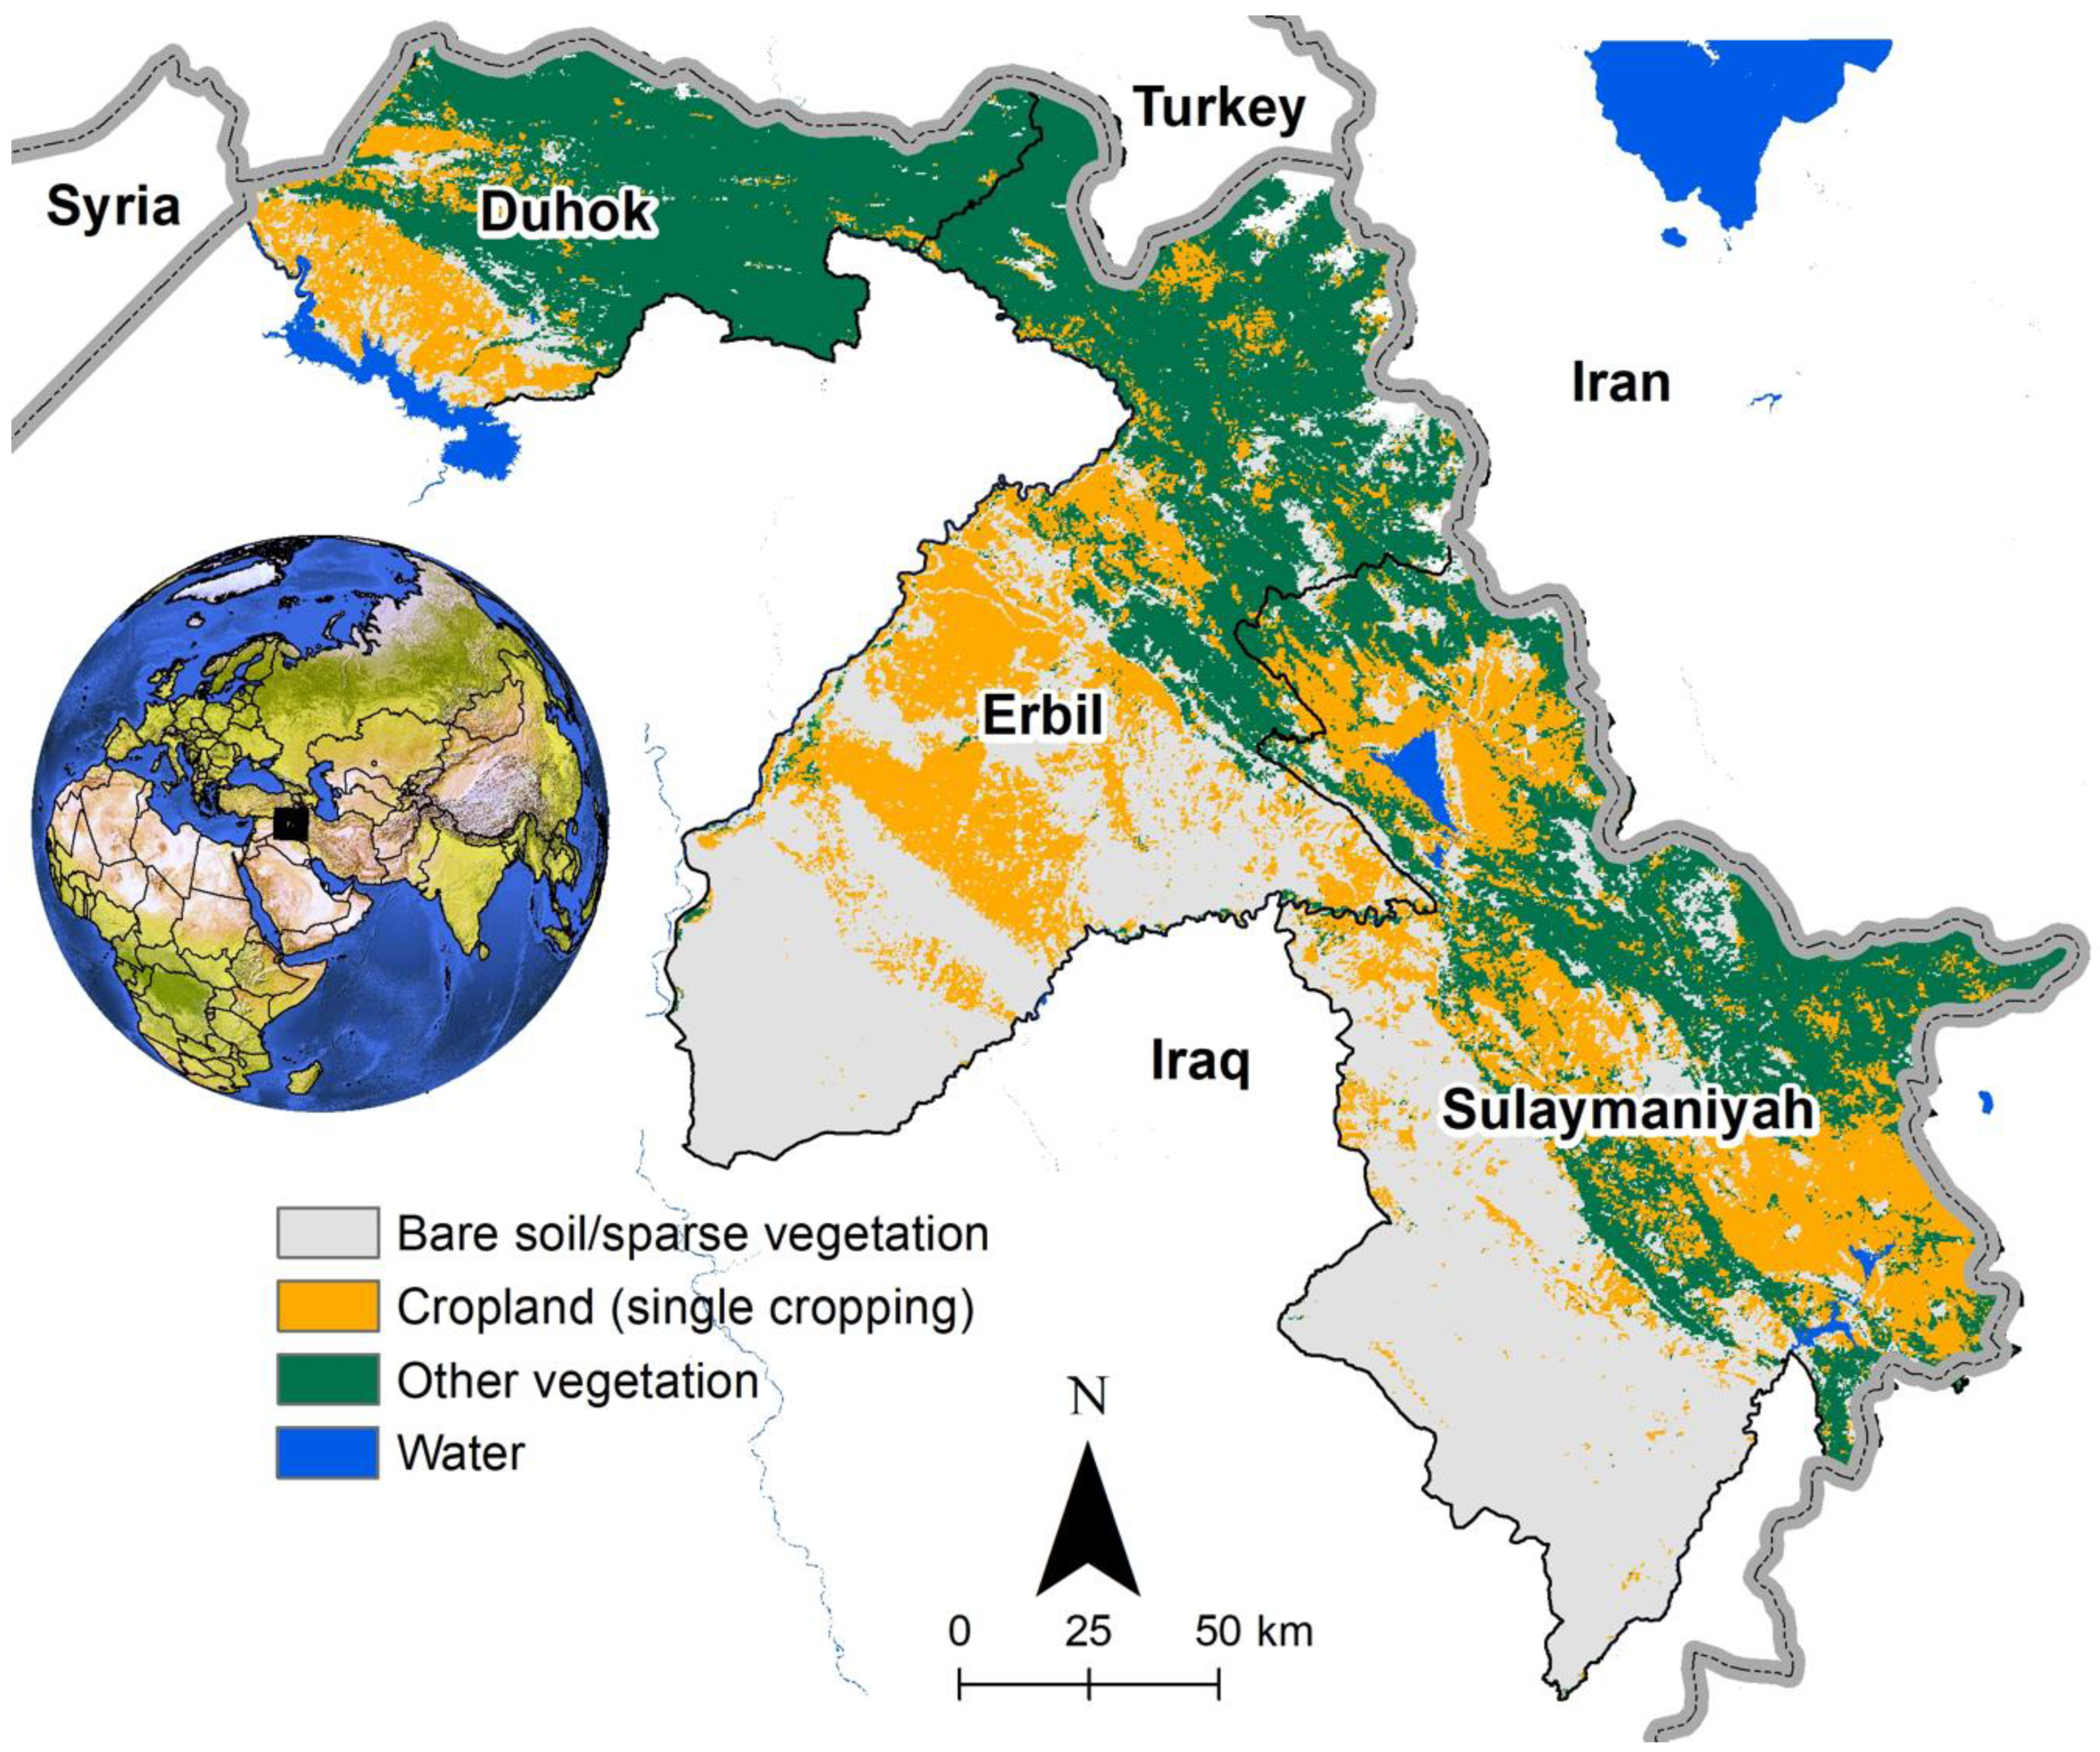
The Kurdistan Region of Iraq (KR-I) is a mountainous region located in northern Iraq, consisting of three governorates: Duhok, Erbil and Sulaymaniyah (Figure 1). The KR-I is a federal state within Iraq and has its own government, the Kurdistan Regional Government (KRG), with its capital located in Erbil city. The KR-I covers an area of about 40,000 km2 and had an estimated total population of 5.1 million people in 2014, of which over 75% are estimated to be living in urban areas. The biophysical environment in the KR-I is characterized by mountains in the north with more natural vegetation (e.g. open woodland and forests) and croplands in the south (Figure 1). Agriculture is mainly focused on cereal crops [5,34], but vegetable cultivation and orchards are also prevalent in the area. The mountains, where agriculture is less common, consist of areas with trees and shrubs as well as pastures.
A survey of forests carried out in the sub-district of Zawita in the Duhok Governorate in the KR-I found that fires were the most important reasons for forest degradation [54]. Tree cutting, forest land conversion and to some extent soil erosion also had an influence but were less obvious. The lack of proper fire control is a major issue in the region, especially in mountainous and inaccessible areas. And fires are used by people for agricultural management or to clear land for housing. Furthermore, fires were found to be a consequence of political conflict, for example between Kurdish parties and the Turkish armed forces.
3.2. Data Description
To study the distribution of, and changes in, LULC we updated a dataset developed by Eklund, Degerald, Brandt, Prishchepov and Pilesjö [6] covering the period from 2000 to 2016. By replicating the same methods used in the original LULC dataset, we expanded the classification to include the years 2017–2019, so that the extended dataset covers the period 2000–2019. The core dataset used for the classification was the Normalized Difference Vegetation Index (NDVI) from the MODerate resolution Imaging Spectroradiometer (MODIS) at a spatial resolution of 250 meters and a temporal resolution of 8 days (Collection 6, MOD13Q1 and MYD13Q1) [55]. The NDVI time series was processed to extract 15 phenological variables that were shown to be significant for mapping the vegetation of this region and to account for seasonal variability in NDVI between the LULC classes [6]. These variables included, for example, median and maximum NDVI and their ratio, amplitude of the NDVI during the year, NDVI during the first and second cropping seasons, and annual slope of the NDVI. For a full list of variables, please see Eklund, Degerald, Brandt, Prishchepov and Pilesjö [6].
To understand the spatial and temporal properties of conflict events in the study area, we used data from the Uppsala Conflict Data Program (UCDP), which provides a global georeferenced dataset of conflict events as point locations. The dataset gathers conflict events from news sources, governmental and non-governmental organization reports, case studies, historical archives and other sources, and defines a conflict event as an instance of organized violence with at least one fatality [42].
The Visible Infrared Imaging Radiometer Suite (VIIRS) Active Fire product provides daily global fire data at a resolution of up to 375 m from 2012 until the present. This type of fire sensing relies on the middle infrared (MIR) portion of the electromagnetic spectrum centred at 3.74 μm to detect thermal anomalies or hotspots, which can indicate the presence of fires. The product derives instantaneous fire energy using radiances from the 375 m MIR band, which is supplemented in case of saturation by the collocated 750 m fire pixel and surrounding background non-fire pixels at the 3.98–4.14 μm range. The strength of each fire is given by the fire radiative power, which is an estimate of the radiative energy emitted by a fire during the observation period. The VIIRS algorithm uses a combination of fixed and contextual tests to detect active fires and other thermal anomalies in the day and night. Only fires classified as type 0, i.e., “presumed vegetation fires” [56], were included in the analysis. Excluded were events of type 2 (“other static land source”) and type 3 (“offshore detection”, e.g., oil flares).
Finally, to understand the role of climate in fire and land dynamics, we used land surface and air temperature (both at 0.1o spatial resolution) from the ERA5-Land dataset [57] and precipitation data from the Climate Hazards Group InfraRed Precipitation with Station (0.05o spatial resolution) [18]. LST is an important biophysical parameter linked to land–atmosphere energy exchange and has been shown to be spatially and temporally altered by fire [58]. The temporal extent of all the climate data was between 2000 and 2019.
3.3. Methods
We used the random forest algorithm [59] to classify the study area into four LULC classes: (1) bare soil/sparse vegetation/artificial surfaces, (2) cropland (single cropped), (3) cropland (double cropped) and (4) other vegetation (which includes forests, pastures, shrublands and to some extent tree plantations). A small number of pixels (<1.5%) were not classified due to quality issues that prevented using all classification metrics. The training data (n = 1573) were collected manually over a period of 5 years (2003, 2007, 2008, 2013 and 2015) on a pixel-by-pixel basis using a combination of medium resolution (30 m) Landsat data and NDVI seasonality over the study area. A model was then created by relating the training data with the corresponding years’ MODIS variables and applied to the entire time series (2000–2019). To assess the validity of this approach, we collected independent validation data (n = 772) from 2014 for each LULC class. The validation process yielded an area-adjusted accuracy of 79.4% based on the guidelines outlined in Olofsson, et al. [60]. For more detailed information about how the LULC dataset was produced, please see Eklund, Degerald, Brandt, Prishchepov and Pilesjö [6].
Year-to-year extents of the different LULC classes over the period 2000–2019 in the Kurdistan Region of Iraq were then extracted from the LULC dataset. We calculated average LULC extents for the different study periods (defined in Table 1) to compare changes in time. Furthermore, we calculated the percent change of the two conflict periods relative to the long baseline period. The conflict periods were determined according to the dominant conflict in the UCDP dataset, i.e., the period with the most conflict events for each year in the KR-I. We used one longer and one shorter baseline period to enable comparing the conflict periods with the dominating long term LULC as well as the LULC just before the two conflict periods. We acknowledge that there are overlaps between these periods, which is why we also show yearly data in our analysis. The periods are thus used to frame the results and put them into context. The two baseline periods represent relative stability in the KR-I, while the two conflict periods represent increased conflict-related violence.
To study the collocation of LULC, fires and conflict, we extracted the LULC class of the corresponding year for all conflict and fire points between 2012 and 2019 (as limited by the temporal coverage of the VIIRS fire dataset). We separated the conflict data by conflict ID to visualize the spatiotemporal change in the number of conflict events relative to their involved parties.
Precipitation and land surface temperature data were averaged over the study area (KR-I) and summarized on a yearly basis to get an indication of which years were drier and warmer, as this might affect both LULC and fire risk [24]. Yearly standardized anomalies (temporal z-scores) for precipitation and temperature were calculated based on the 20-year period using the formula in Equation (1) [61]:
where:
z = (χ − μ)/σ
- z = anomaly of precipitation/temperature
- χ = precipitation/temperature for year in question
- μ = mean precipitation/temperature for 2000–2019
- σ = standard deviation of precipitation/temperature for 2000–2019.
The z-score is a dimensionless value that represents the number of standard deviations above or below the long-term mean of precipitation/temperature for each year. A z-score value is statistically significant at the 90% level if it is above +1.645 or below −1.645.
Finally, we explored the relative contribution of conflict and climate to the prevalence of fires using a partial correlation analysis [62]. The purpose of this type of analysis is to find the correlation between two variables while removing the influence of other variables. The input variables for this analysis were created as follows: first, we mapped a fishnet over the study area whereby each cell has a dimension of 10 km by 10 km as the spatial scale for computing variable statistics; second, we derived a gridded surface whereby each pixel represents the distance to a conflict point (in km); third, we calculated the variability of land cover classes with each fishnet cell; fourth, we performed a hotspot analysis using Getis-Ord Gi* [63,64] to identify the spatial clustering of fire points. This method uses spatial z-scores to identify anomalously high (or low) fires, based on their fire radiative power, within the context of surrounding points. Thus, a single location with high fire radiative power may not be a statistically significant hotspot if it is not surrounded by other fire locations that also have high fire radiative power. Getis-Ord Gi* is given as:
where i and j represent individual fire points; xj is the fire radiative power of point j, wi,j is the spatial weight between point i and j; n is the total number of fire points; X is the mean of all the fire points and S is the standard deviation of all the fire points. We used an inverse distance weighting to assign the spatial weights, which means that closer features have relatively larger weights than points that are farther away.
4. Results
4.1. Changes in LULC 2000–2019
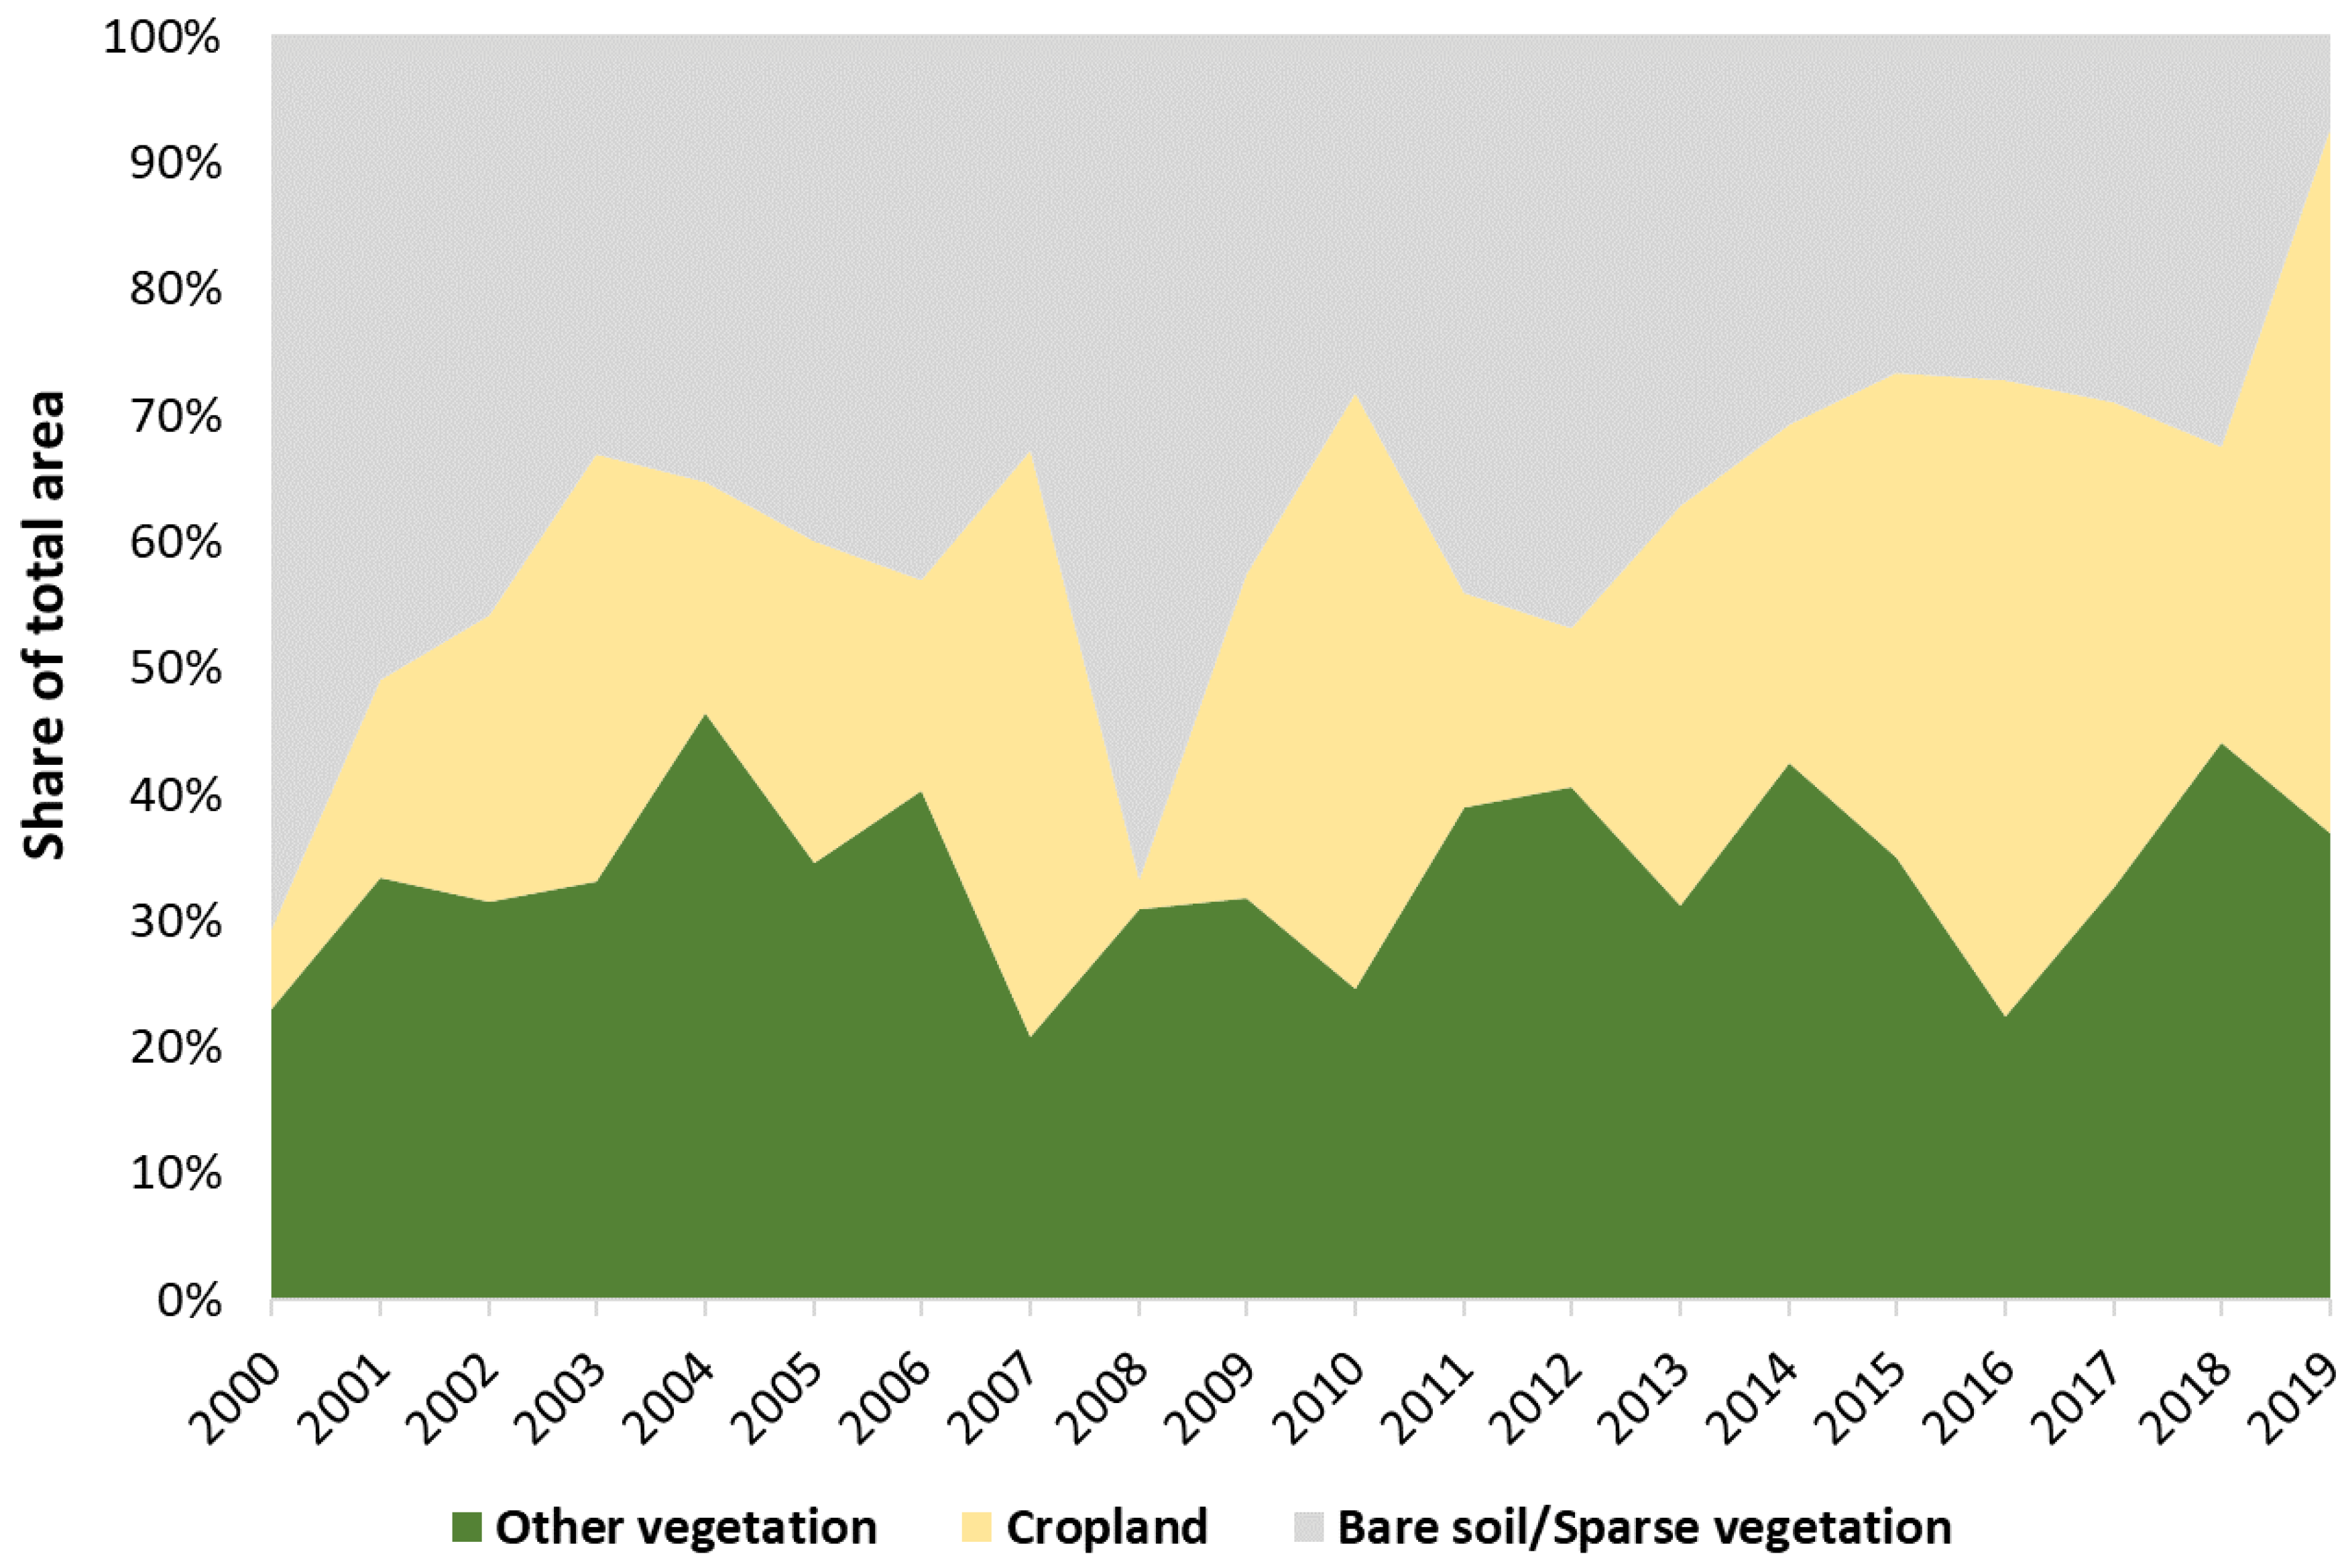
The LULC of the KR-I during the full period (2000–2019) consisted mainly of bare soil/sparse vegetation with an average extent of 39% of total area, other vegetation (32%), and cropland with one harvest period (28%) (Figure 1). Pixels representing double-cropped croplands were merged with the single-cropped class because they were too few in number (98 pixels or 0.03% of the study area). Cropland area had markedly low extents in 2000 (6% of total area) and 2008 (2%). In 2010 and 2016, cropland extent increased to 47% and 50%, respectively. For other vegetation, year-to-year variation was less pronounced, with the lowest extents in 2007 (20% of total area), 2000 (21%) and 2016 (22%), and the largest extents in 2004 (45%), 2018 (43%) and 2014 (41%) (Figure 2).
4.2. LULC Changes during the Conflict Period 2014–Onwards
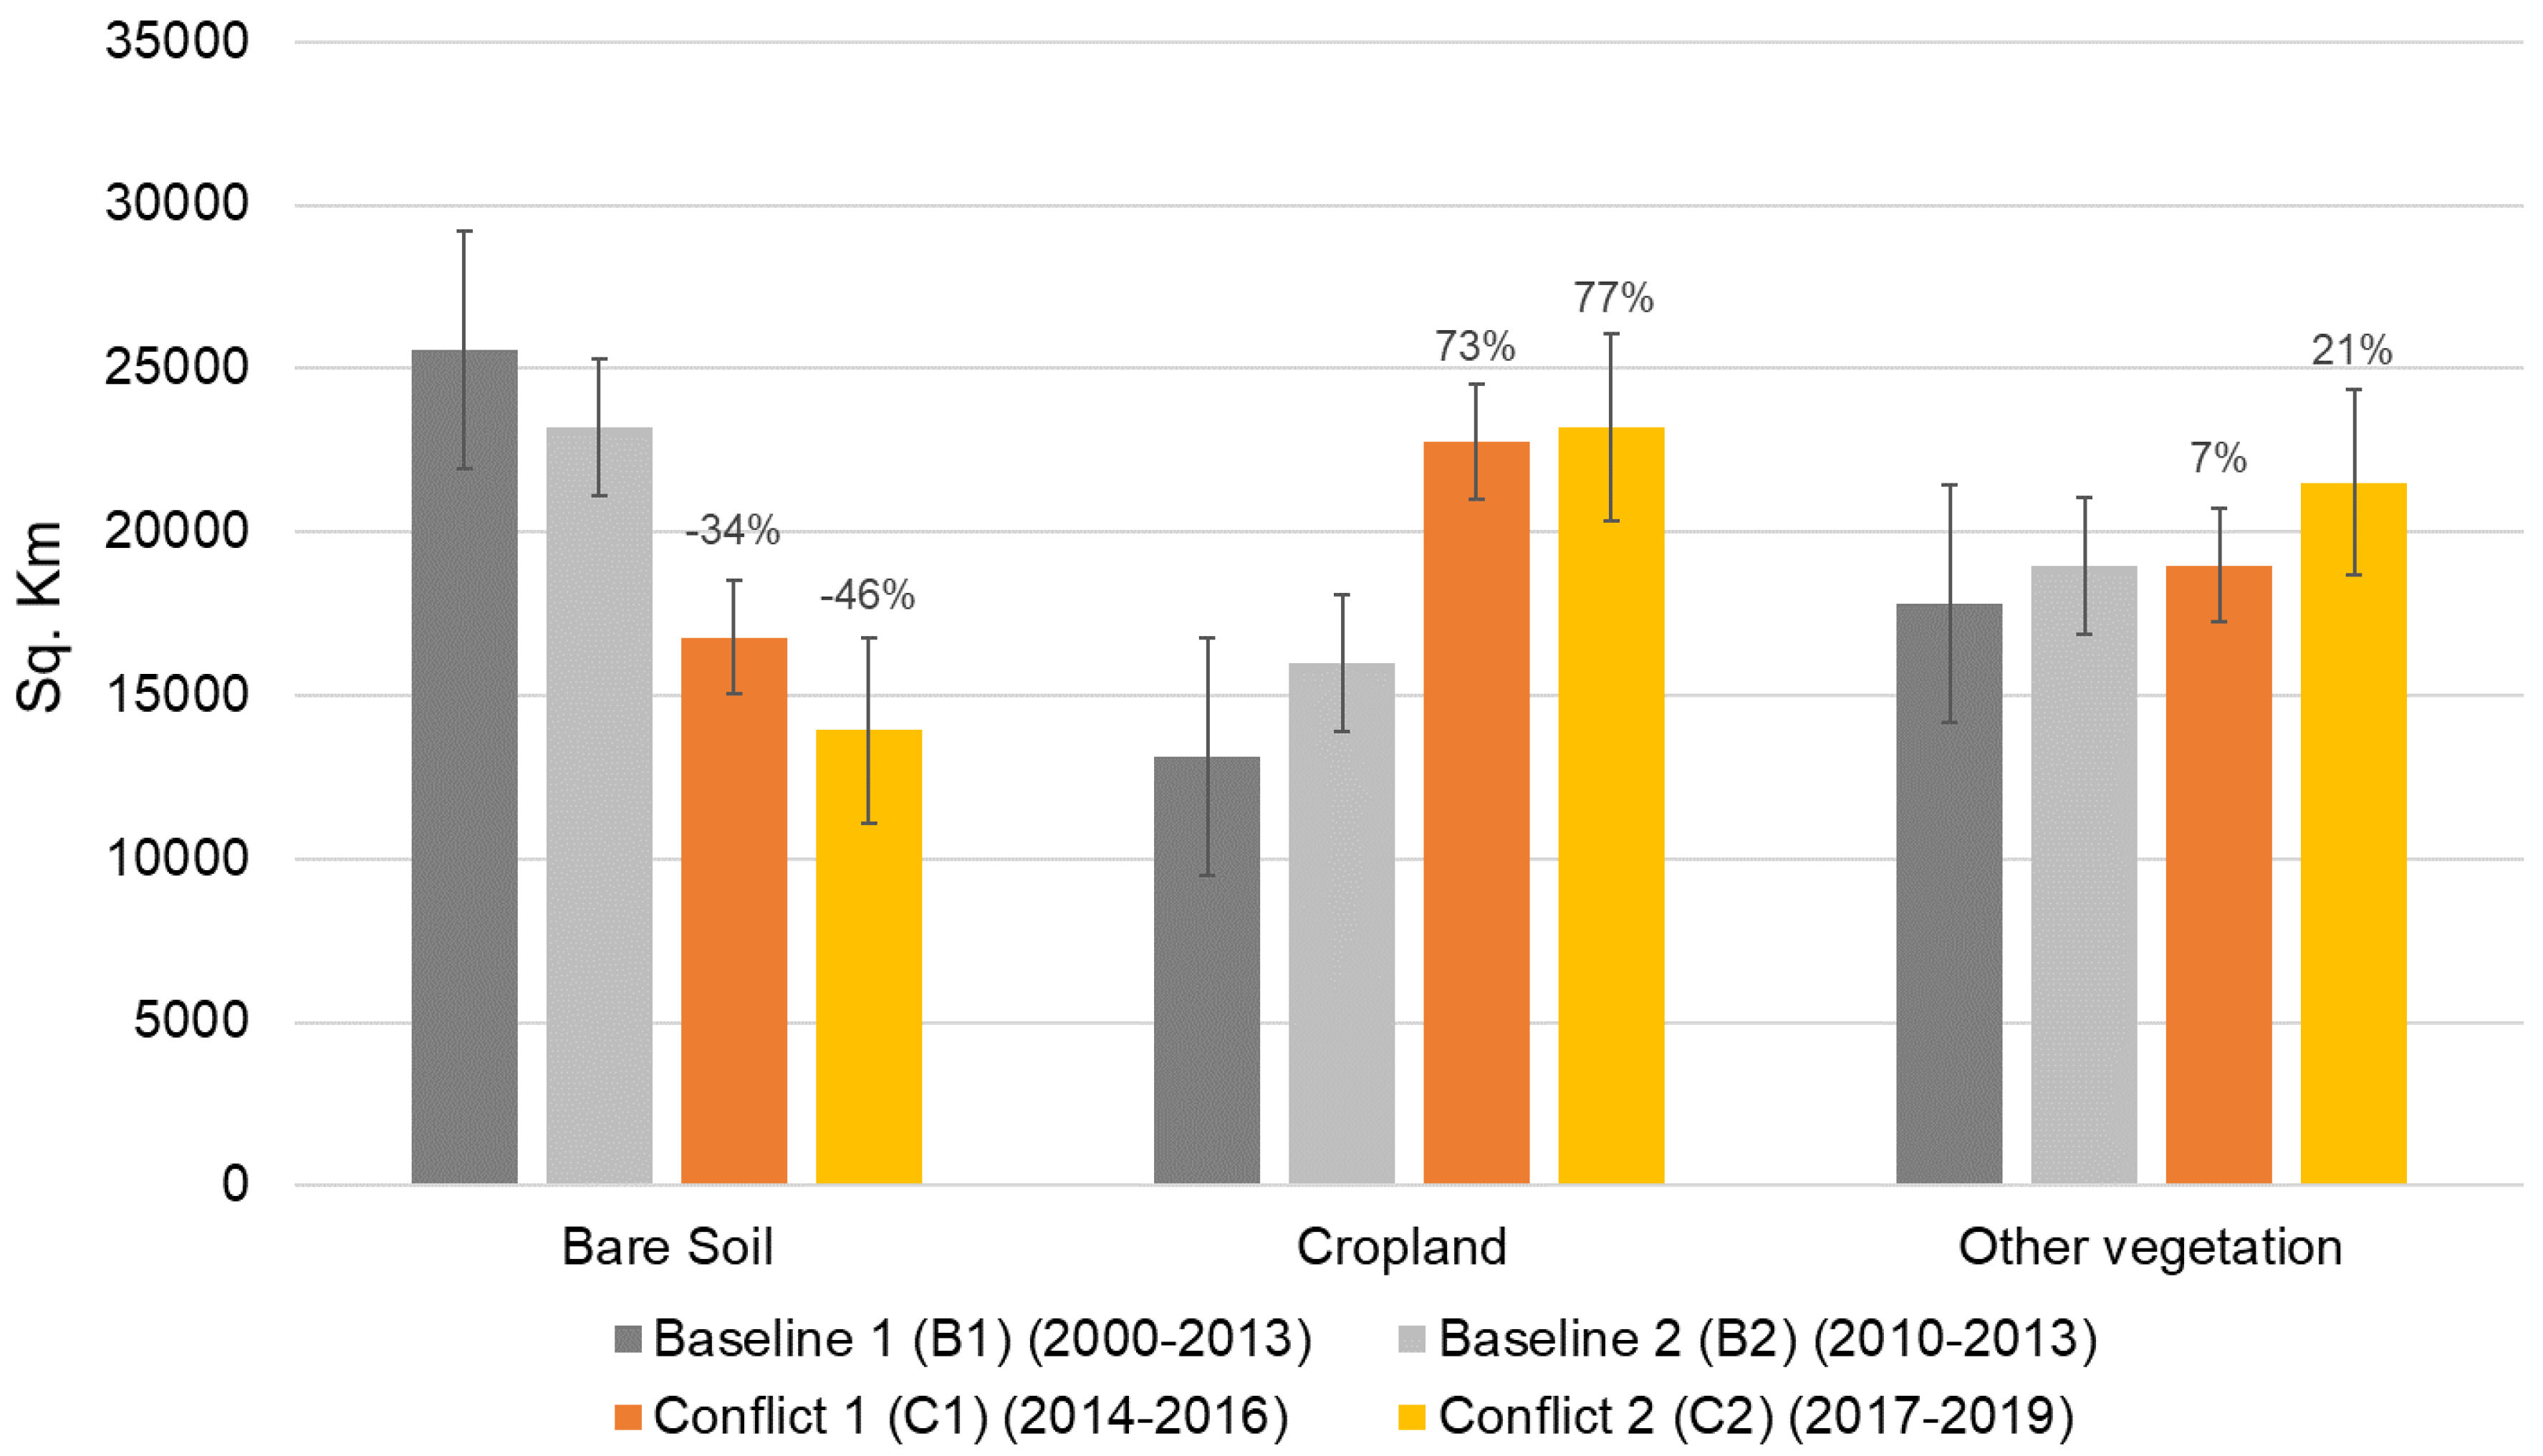
Comparing average areal coverage of LULC classes during the conflict periods (C1: 2014–2016 and C2: 2017–2019) with the long (B1: 2000–2013) and short (B2: 2010–2013) baseline periods showed a decrease in bare soil/sparse vegetation during the conflicts (Figure 3). A third of the B1 bare soil/sparse vegetation area in C1 and 46% in C2 changed to other classes. Another relevant change was the increase in cropland from B1 to C1 and B1 to C2, representing 73% and 77%, respectively. Finally, the other vegetation classes showed small changes between B1 and C1 (7% increase) but a slightly larger change between B1 and C2 (21% increase). Compared with B2, the changes during C1 and C2 were generally smaller yet still notable within the short-term differences. With respect to a decrease in other vegetation, there was a notable decline during C1 (Figure 2). For example, the year 2016 had the third-lowest extent for other vegetation and coincided with the largest cropland extent over the entire study period.
4.3. Spatiotemporal Patterns of Fire and Conflict
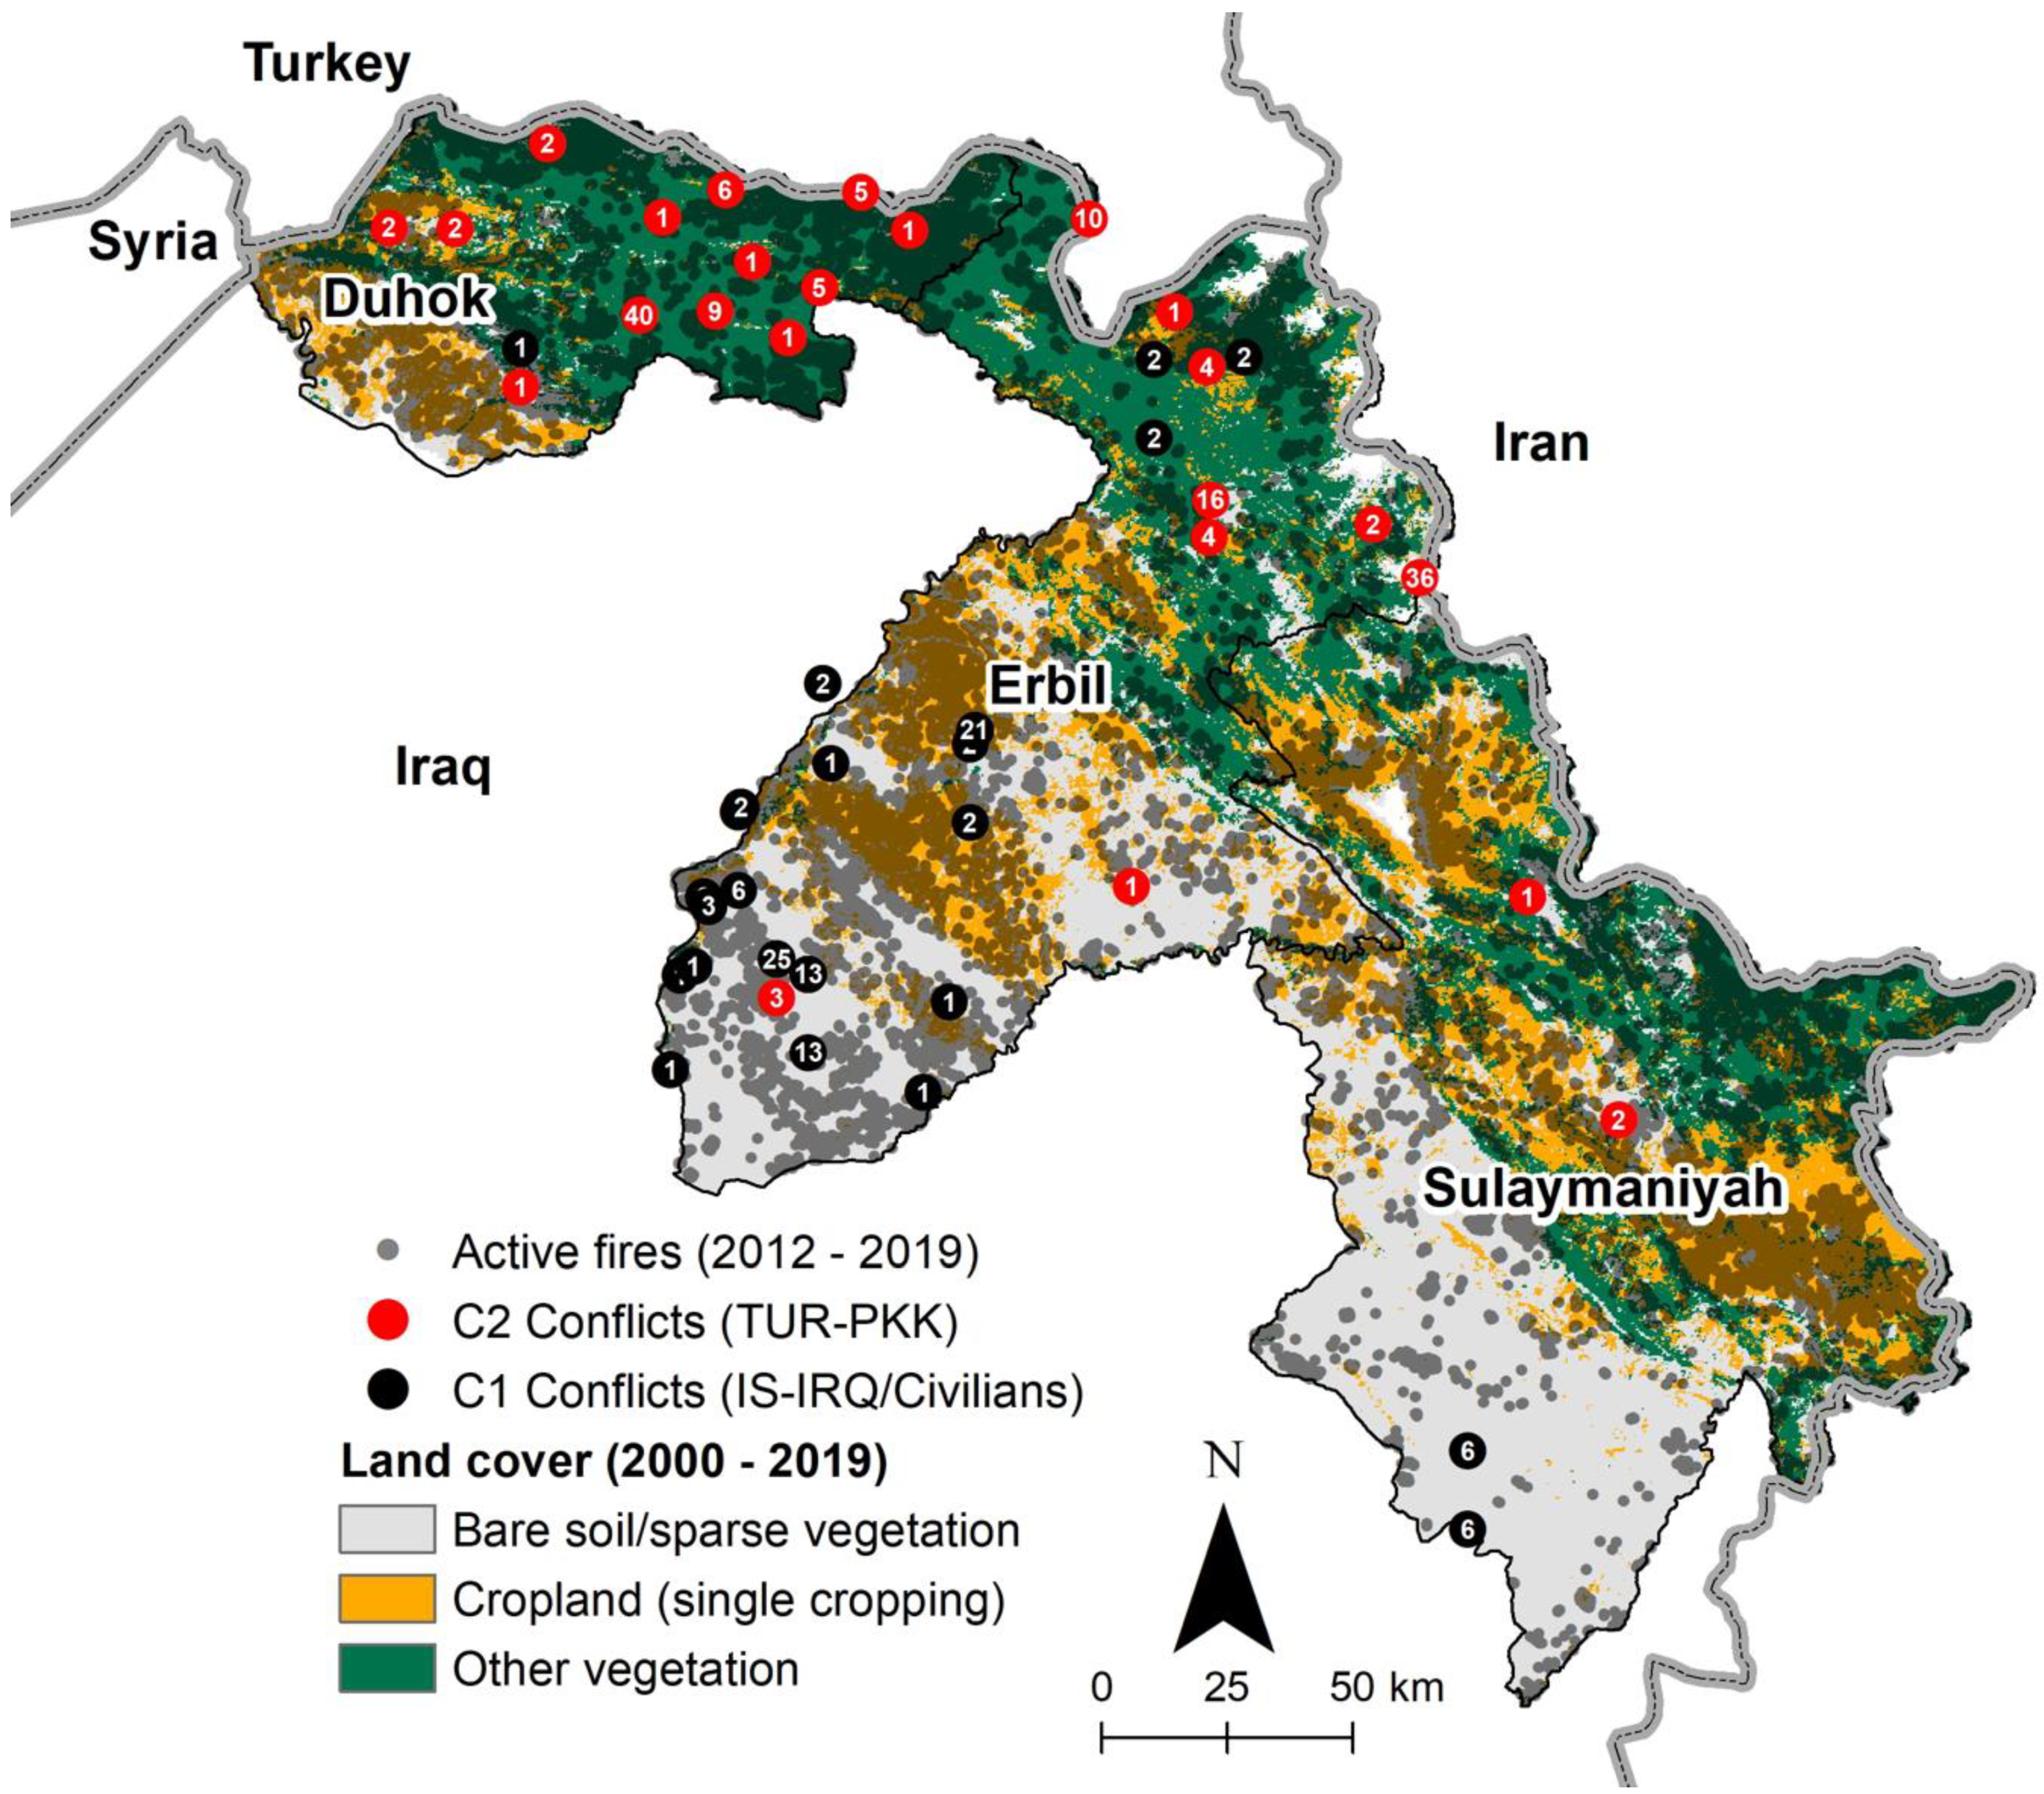
Fire events occurred across the KR-I during the entire 2012–2019 period; however, two areas stood out as particularly exposed to fires: the south-western part of Duhok governorate, and the south-western part of Erbil governorate (Figure 4 and Supplementary Figure S1). These hotspots were located at lower elevations with drier conditions, and the LULC types were either cropland or areas with bare soil/sparse vegetation. Conflict events were also more concentrated in the Duhok and Erbil governorates across different types of LULC. Figure 4 shows a pattern where C1-related conflict events occurred mainly in the southern part of the Erbil governorate, whereas C2-related conflict events were more prevalent in the Duhok governorate.
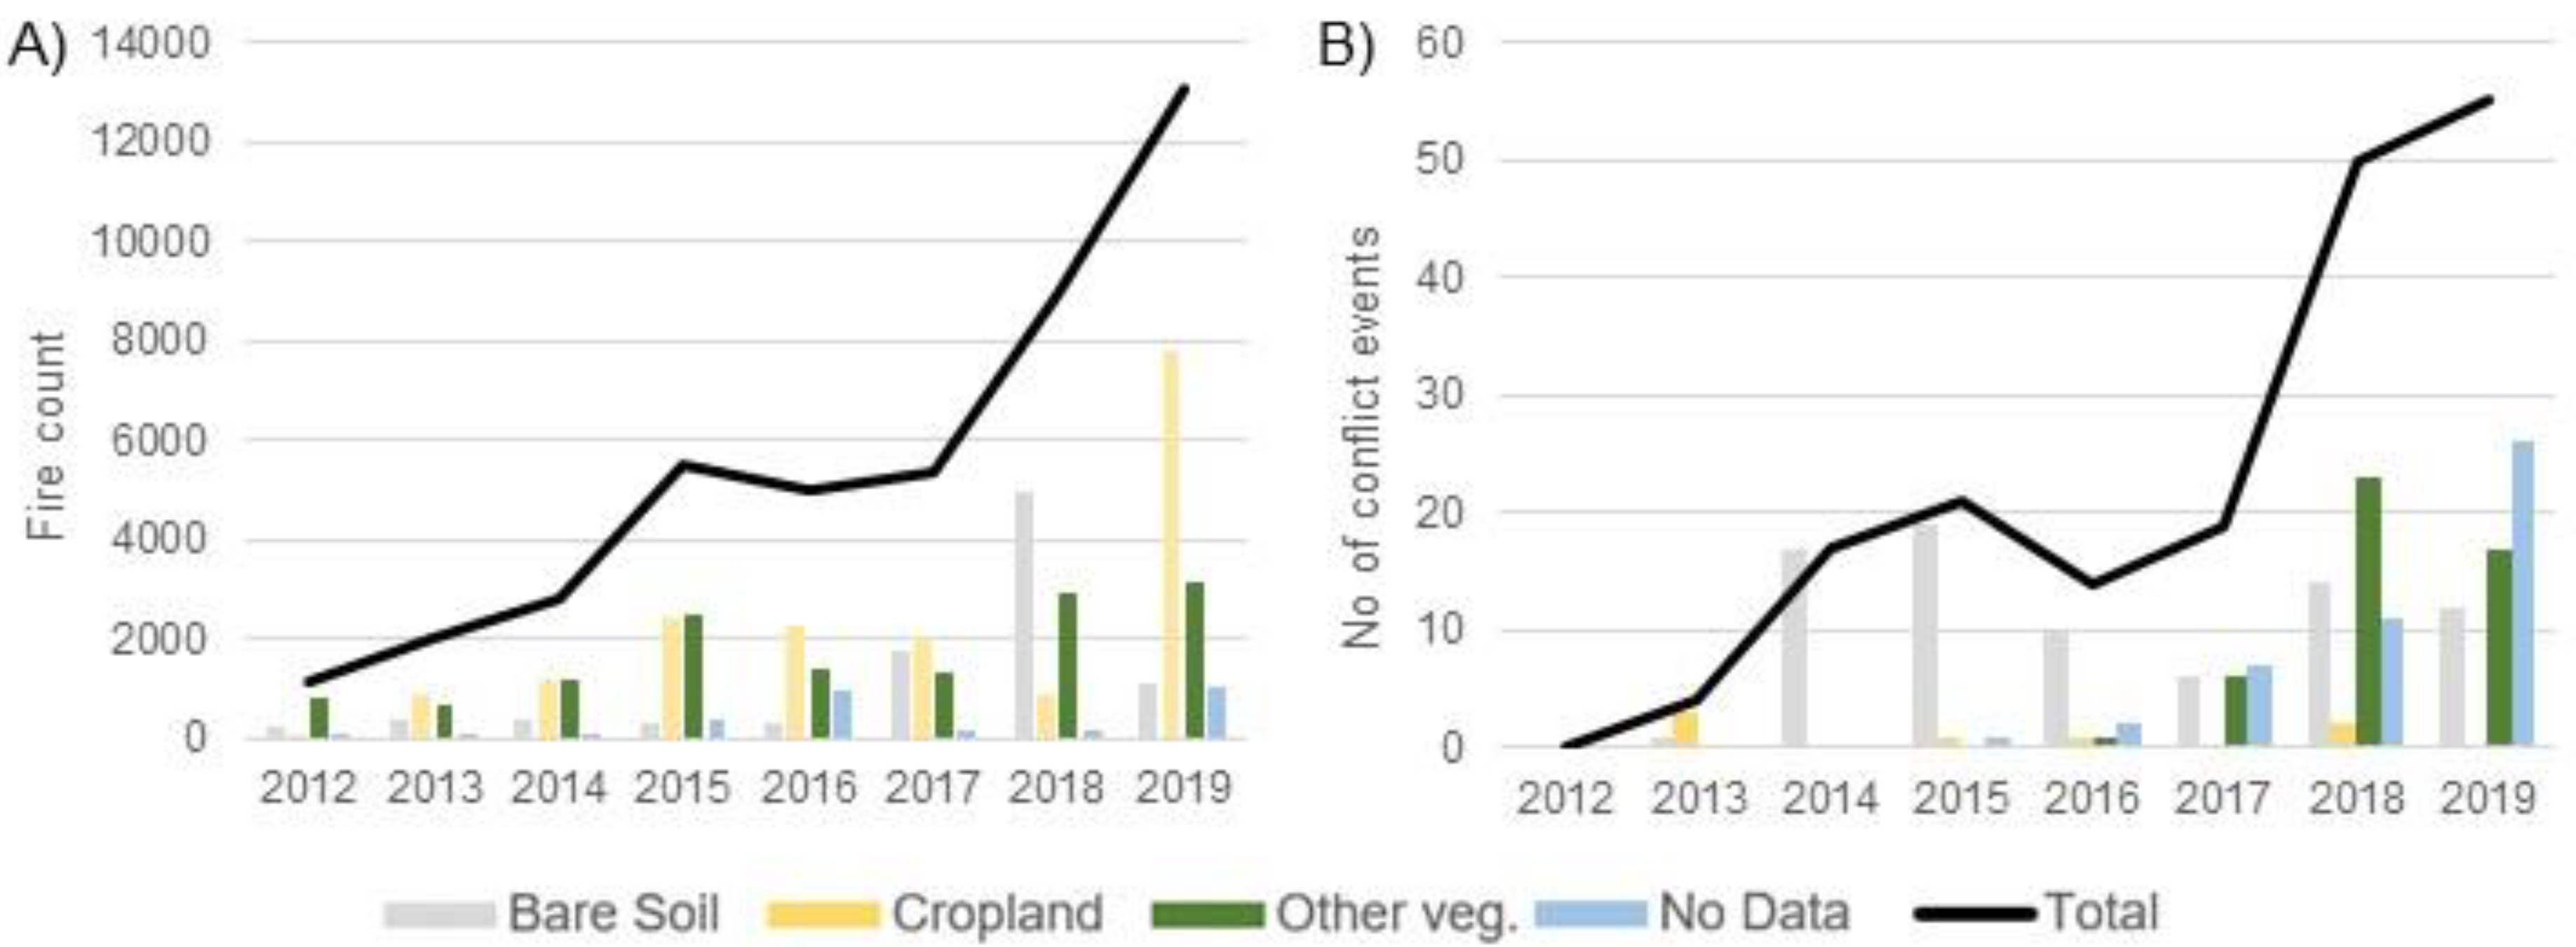
Between 2012 and 2019, there were 43,792 fires recorded in the KR-I by the VIIRS instrument. From 2014 onwards, fires had generally increased, particularly in areas with other vegetation, for example, forests, woodlands and pastures (Figure 5A). From 2017, there was also an increasing fire trend in bare soil/sparse vegetation areas, and in 2018, most fires occurred in bare soil/sparse vegetation areas. Cropland fires generally followed the temporal pattern of other vegetation fires, although they varied between years. However, the majority of fires in 2019 were located in croplands. A small share of fires occurred in areas with no LULC classification (<1.5% of the area).
The number of conflicts identified by the UCDP in KR-I between 2012 and 2019 was 180 events, of which the majority occurred in the latter years (2018 and 2019, see Figure 5B and Figure 6A and Supplementary Figure S2) and none occurred in 2012. In the first conflict period (2014–2016, C1), conflict events occurred mainly in bare soil/sparse vegetation areas. In the second conflict period (2017–2019, C2), however, the majority of conflict events occurred in other vegetation areas or areas with no defined LULC class, which generally corresponded to areas with rugged topography and steep slopes.
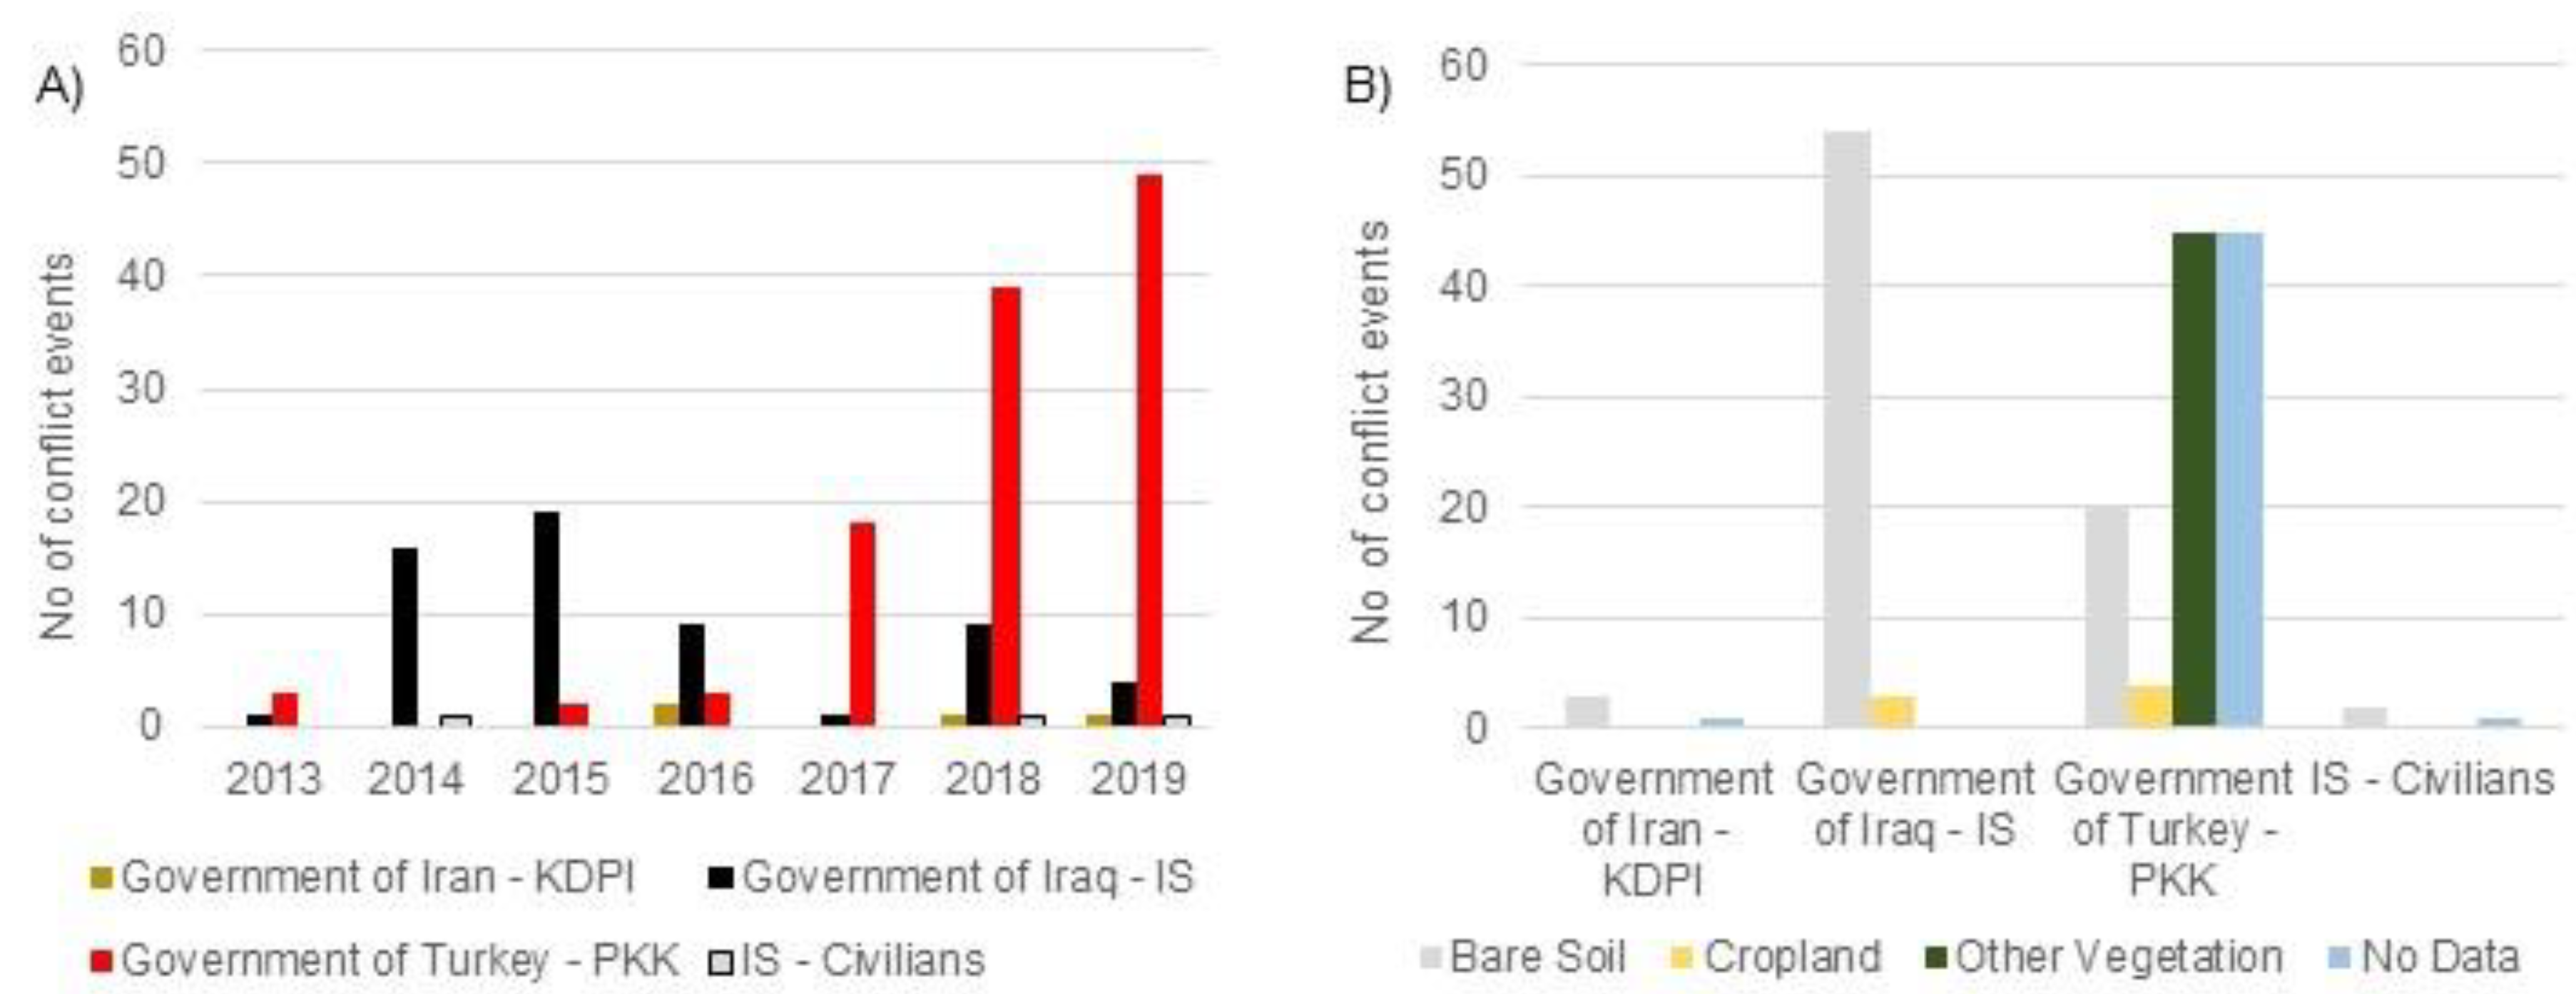
Overall, we found sharp increases in both conflict and fire events in the KR-I from 2017 onwards. We also noted that both conflict and fire events were increasingly occurring in areas with other vegetation. This corresponded with the shift from C1 to C2, where conflict events between IS and the Iraqi government dominated the C1 period, and conflict between the Turkish Government and the PKK dominated the C2 period (Figure 6A). It is important to note that very few conflicts were related to other events during this time. The majority of conflicts related to the war with IS occurred in areas with bare soil/sparse vegetation (Figure 6B). Conversely, conflicts between the Turkish Government and the PKK were located mainly in areas with other vegetation and areas with rugged topography.
4.4. Yearly Precipitation and Land Surface Temperature
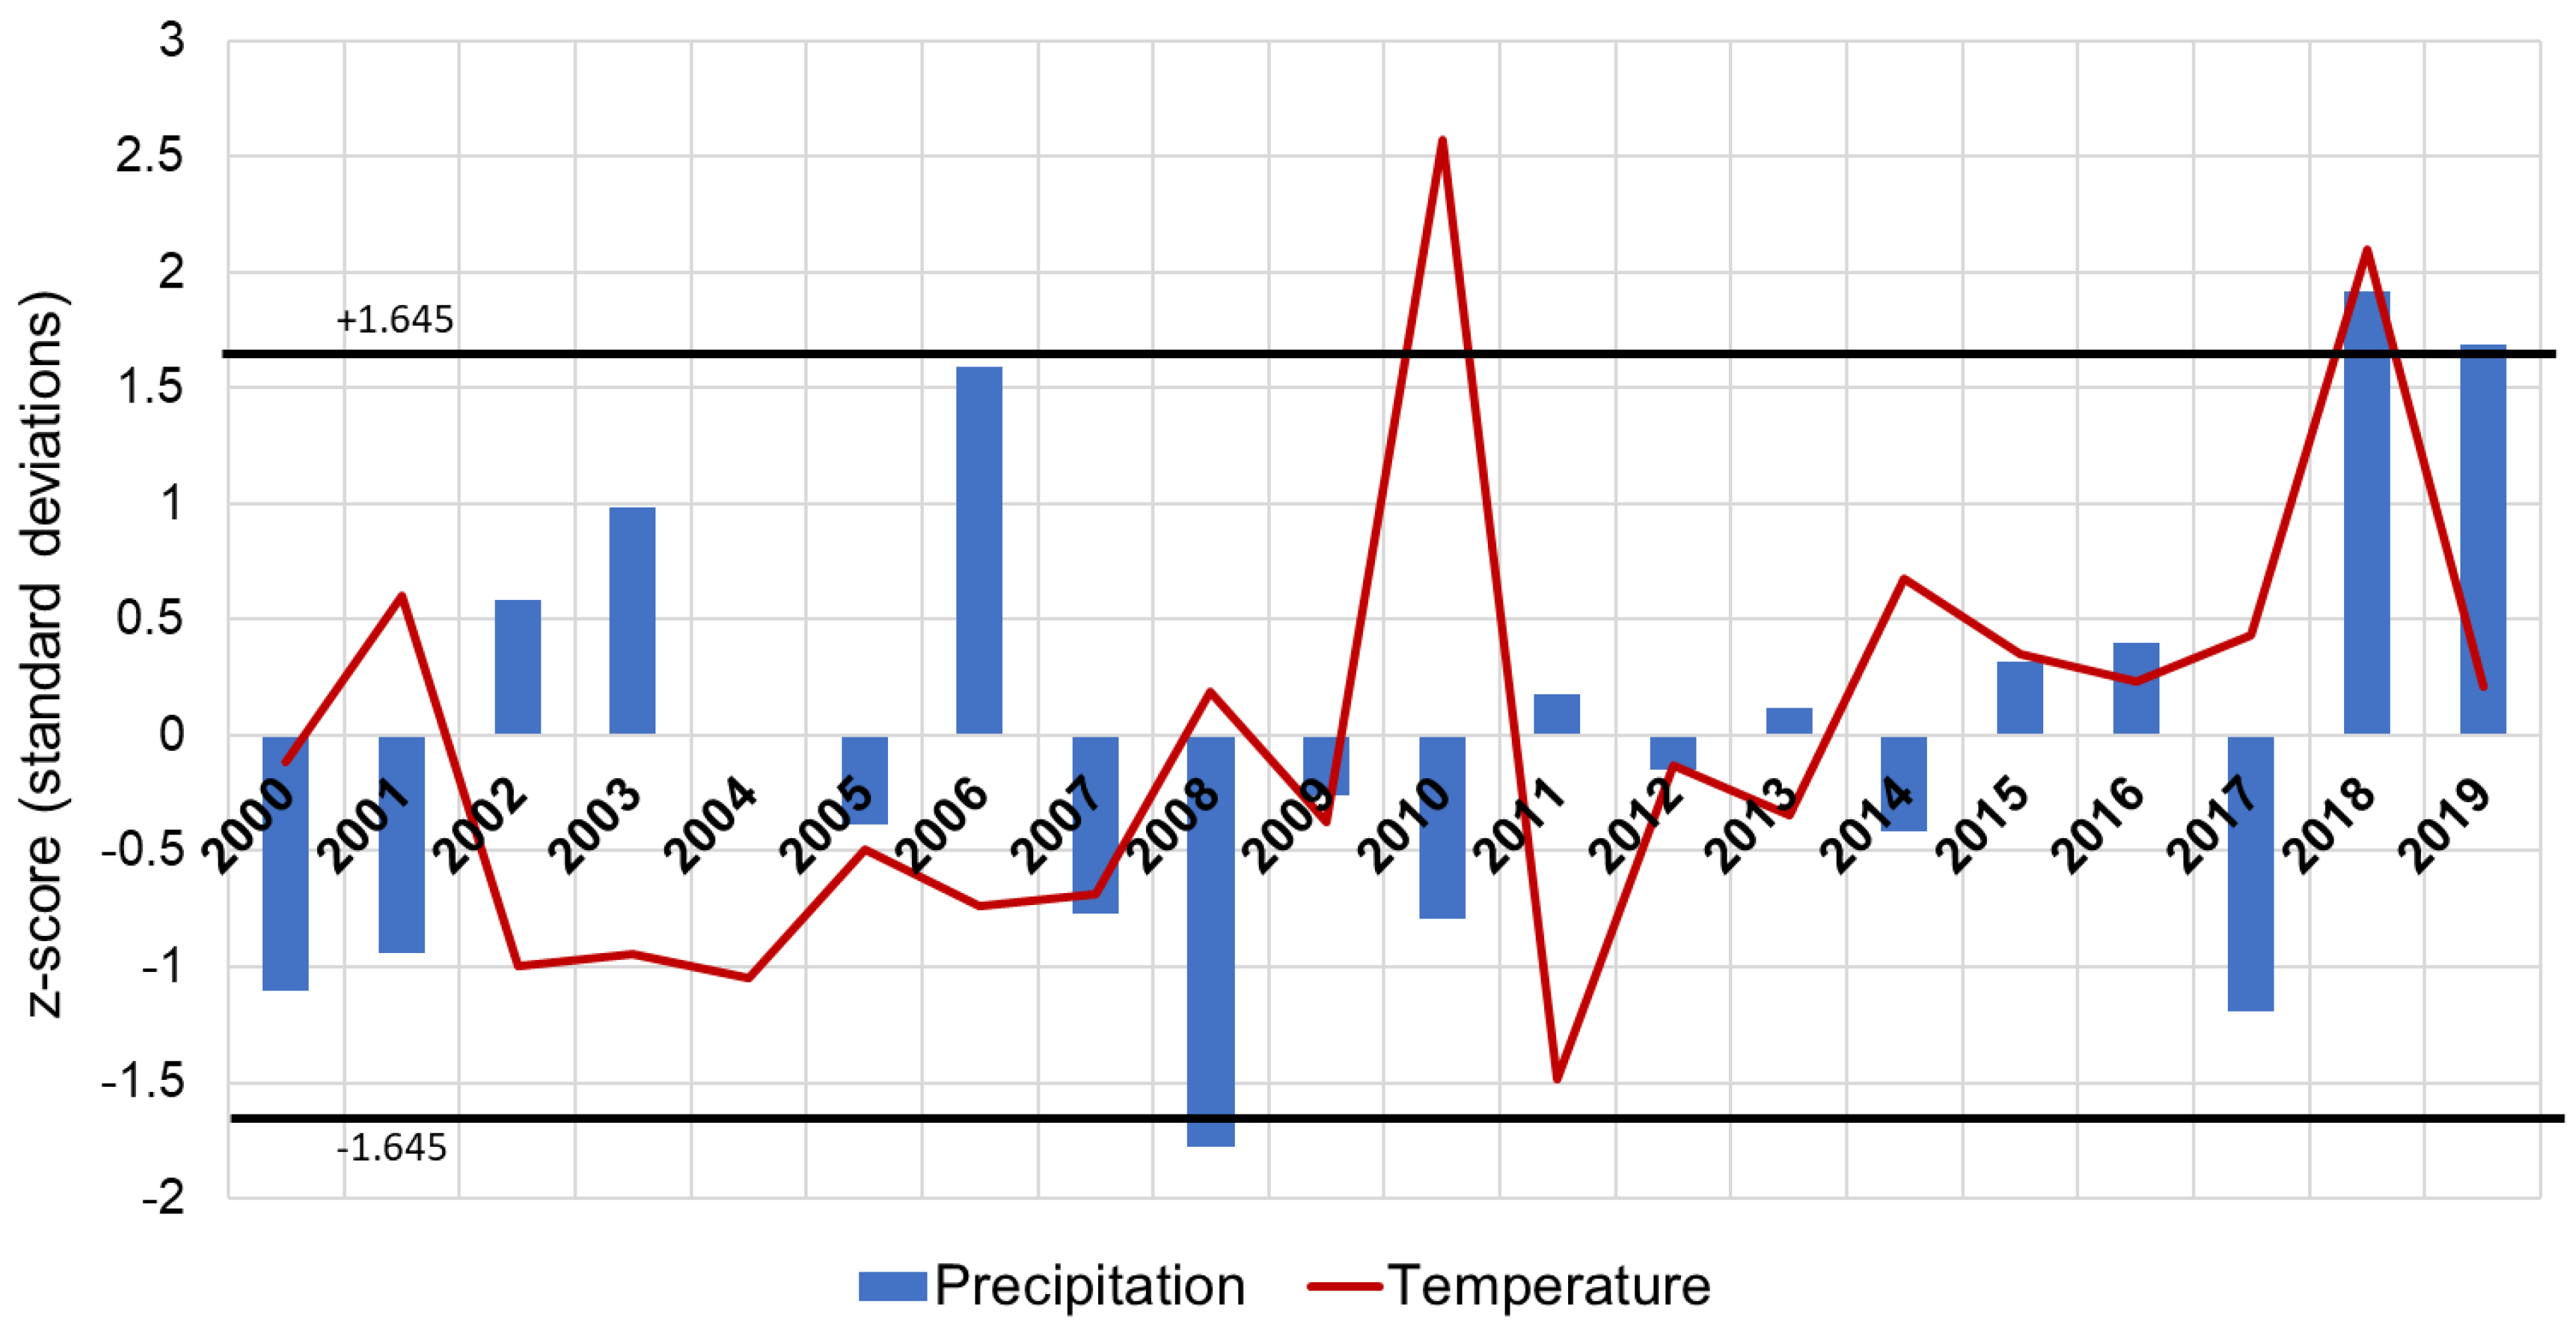
The precipitation z-scores in the KR-I show that most years were within 1 standard deviation of the mean precipitation value for the whole period (Figure 7). Three years with negative anomalies of more than 1 standard deviation below the mean could be identified: 2000, 2008 and 2017, with a statistically significant (p = 0.10) trough in 2008. Positive anomalies of more than 1 standard deviation were found in the years 2006, 2018 and 2019, with the latter 2 years crossing the 90% threshold of statistical significance. For temperature, only 3 years showed anomalies deviating more than 1 standard deviation from the mean. Both 2010 and 2018 showed statistically significant (p = 0.10) temperatures above normal conditions, and 2011 was the only year with temperatures below normal conditions. The C1 period (2014–2016) exhibited precipitation and temperature values that were within the normal range with no anomalies crossing ± 1 standard deviation. The C2 period (2017–2019), however, included years with both below and above normal precipitation, and 1 year with temperatures much higher than average.
4.5. Partial Correlation Analysis
The results from the partial correlation analysis are presented in Table 2. In experiments 1 and 2, neither mean annual temperature (r = 0.098) nor the mean annual rainfall (r = −0.004) had a strong correlation on the fire hotspots when accounting for the distance to conflict and land cover variability. Including the effect of conflict and land cover did not increase the correlation with climatic variables by much (r = 0.11). However, experiment 1 exhibited strong statistical significance (p < 0.000) despite practically nonexistent linear correlation, which could imply that the relationship between mean annual temperature and the fire hotspots when accounting for conflict, rainfall and land cover is strongly nonlinear [65]. The correlation was still poor when the climate variables were combined in interaction terms (experiments 5 and 6). The highest positive correlation was found for the amplitude of distance to conflict within each 10 km fishnet cell while accounting for climate and land cover variability (r = 0.37). The amplitude of distance to conflict is the minimum distance to conflict subtracted from maximum distance to conflict within each 10 km fishnet cell. In contrast, the highest negative correlation was for the mean distance to conflict events while accounting for climate and land cover variability (r = −0.17).
5. Discussion
5.1. LULC Change in KR-I from 2000–2019 and During the Conflict Periods
The main changes in LULC shown by the data were between cropland and bare soil/sparse vegetation classes. The severe drought of 2008 [66] resulted in a sharp increase in bare soil/sparse vegetation at the expense of cropland, but cropland returned in subsequent years (Figure 2), suggesting that these years were either crop failures or years with increased fallow areas. The conflict periods were linked to a general increase in cropland compared to the baseline period (2000–2013, B1), which may be explained by several factors. Firstly, precipitation and temperature have been found to influence the active vs. fallow cropland dynamics in Syria [67], and our data show that from 2014 onwards, all years but one are either normal precipitation years or wetter than usual (Figure 7). Secondly, temperatures from 2014 onwards are generally normal but much higher than usual in 2018. The C1 period thus shows normal climatic conditions that correspond to an increase in cropland. The C2 period shows more anomalous weather conditions but overall increased rainfall, with a decrease in cropland in 2018 (when temperatures and precipitation were higher than normal) and an increase in 2019 (when temperatures were normal and precipitation levels were above normal).
Investigating areas occupied by the Islamic State in 2015, Eklund, Degerald, Brandt, Prishchepov and Pilesjö [6] found that most croplands had been maintained during the conflict, and some areas had seen increases in cropland extent. While the KR-I territory was never occupied by the Islamic State, the proximity to conflict and its effects may have had indirect effects on how the land was used. Indeed, there were more than 800,000 internally displaced persons (IDPs) in the KR-I [68]. Out of these IDPs only 0.3% were from within the region; the rest arrived fleeing conflict from neighbouring regions. An influx of refugees may increase the demand for food as well as the availability of labour, and this demand may (partly) be met by local production. Economic decline and unemployment linked to conflict and political instability may have led urban residents, who largely have a rural background, to move back to rural areas and engage in agriculture [34]. In general, the effect of conflict on the agricultural system was found to vary between different cases, and may show either increased or decreased cropland activity or a combination of both [1,4,5,6,11].
The other vegetation class, which includes forests, pastures, shrublands and other vegetated areas, showed relatively smaller changes. This was not surprising as areas cleared of forests were more likely to be replaced by grass and shrubs than croplands or bare soil/sparse vegetation due to the topography and relatively high soil fertility [69] in the forested areas of the KR-I. However, the dataset we used was not ideal to identify changes in tree cover, since most such changes are likely to happen within the other vegetation class. We observed an increase in other vegetation during period C2 that corresponded with conflict and fires occurring largely in areas with natural vegetation. This was unexpected in the context of conflict zones and may mean that favourable climate conditions have transformed areas of bare soil/sparse vegetation to be covered by herbaceous vegetation. These findings call for more detailed investigation, using finer resolution satellite data and preferably field verification if the security situation allows.
5.2. Spatiotemporal Patterns of Conflict and Fire Events
Two main hotspots of fire activity were observed between 2012 and 2019: in the western Duhok governorate near the Turkish border and in the south-western Erbil governorate (Figure 4, Supplementary Figure S1). While the fire hotspots were in areas dominated by cropland or sparse vegetation, other fires were scattered in areas with other vegetation, including forests, pastures and shrublands, but with no specific concentration across space. Fires were generally more common in areas with other vegetation in the KR-I (Figure 5A). This can be explained by the ready availability of burnable biomass in these areas. However, there was an increase in fires in both cropland areas and bare soil/sparse vegetation areas from 2017. One explanation is an increased use of fire in management of agricultural land as a method to improve soils [31]. Fires in bare soil/sparse vegetation areas are less expected, which necessitates field verification. The absence of vegetation does not suggest that there is nothing that can burn. For example, in built-up areas several things can be set on fire such as urban trees and shrubs, cars, garbage, etc.
We recorded a general increase in both fire and conflict events from 2014 onwards and a strong increase in 2017–2019 (C2 period). Although the C1 period (Government of Iraq vs. IS) experienced both increases in fire and deadly conflict events, the C2 period (Turkey–PKK conflict) was worse in the KR-I in terms of both fires and violence (Supplementary Figure S2). While not all fires were associated with conflict, the results indicate that there was a temporal relationship where fires were less related to where deadly conflict events occurred and more related to the overall tensions in the region (e.g., skirmishes that involve arson). Of particular note is the fact that fires increased during the C1 period despite normal weather conditions. Fires increased substantially in C2, which may be partly explained by the three concurrent phenomena over that period. First, there was an increase in the amount of rainfall from 2018 onwards. However, the negative anomalies in 2017 were not at a noteworthy level of significance (i.e., they did not reach −1.645 standard deviations), so the rainfall that year was not particularly low. Second, there was an increase in cropland in the KR-I as shown in Figure 2, indicating increased availability of combustible biomass, particularly post-harvest. Third, we observed an increase in conflict events from 2017 until 2019 (Figure 5B), which suggests that there is an increased probability for burning to occur.
The latter conflict (C2) exhibited a different spatial pattern compared to C1 and was focused in areas with more natural vegetation at higher altitudes (Figure 5B and Figure 6B). This was expected as the Turkish airstrikes against the PKK are known to take place in places such as the Qandil Mountains, where the PKK guerillas and top-level administrators were based [70]. Similarly, it is reasonable to assume that conflict events during C1 took place to a larger extent in bare soil/sparse vegetation areas, which were located closer to the southern parts of the KR-I that were adjacent to IS territory.
Overall, our results indicate that as conflicts increase, so also do the number of fires. At a more detailed level, however, we do not find a very strong spatial relationship between fire and conflict events reported in the UCDP dataset. Here, it is important to remember that the UCDP measures conflict incidents with at least one fatality, and thus omits other conflict events with no reported fatalities, which may very well influence fire occurrence. This finding should be further investigated to better understand the conflict–fire nexus.
5.3. Relationship between Fire, Conflict and Climate
The partial correlation analysis (Table 2) revealed an intricate relationship between the clusters of fire hotspots, mean annual temperature, mean annual rainfall, landscape variability and distance to conflict. What can be inferred is that fire hotspots clustered according to their magnitude (i.e., fire radiative power) are moderately correlated with the amplitude of distance to conflict at a scale of 100 km2 while accounting for other variables. The amplitude is the difference between the shortest and longest distance to conflict. The fact that this relationship is positive means that for a given area there will be more fire events where there is a larger range of distances to conflict, provided, of course, that there is burnable biomass. This suggests that variability in distances to conflict within each cell is beneficial for the accumulation of fire, perhaps because there is more space for fire events ignited by one conflict to spread in the surrounding landscape and be intensified by another conflict (Supplementary Figure S3). This relationship is interesting because it is somewhat counterintuitive and requires further investigation. Evidently, the partial correlation controls for changes in land cover and climate, which can reduce this relationship. However, there does seem to be a saturation threshold (Supplementary Figure S4) regarding the relationship between these two variables, which is invariably linked to the scale of observation as there is a limit to the extent that fires can spread within a given fishnet cell. Thus, it remains an open question whether this relationship holds in other conflict settings or at other scales. Furthermore, there is a statistically significant, albeit comparatively weaker and negative, correlation between the mean distance to conflict within each fishnet cell and the fire clusters. This is somewhat expected as areas farther away from conflict locations have lower exposure risk to fire clusters.
5.4. Limitations and Future Research
A major limitation lies in the level of detail in the LULC dataset, where the other vegetation class includes different LULC types that would be interesting to investigate. Here, we have prioritized using a dataset with high temporal resolution that has been evaluated for this particular region, as opposed to using a ready-made global product with a lower accuracy (Supplementary Figure S5) that likely has not been substantially validated in this area. Nonetheless, diversifying the number of classes for this region by, for example, including a “forest” class will invariably aid the understanding of the relationship between fire and conflict. Several of the UCDP conflict events were recorded in areas with no data on the LULC classification, especially in 2019. This limitation is due to quality issues in those pixels as they correspond with areas that have rugged topography. It is therefore safe to assume that most of the conflict events targeting the unknown LULC class are happening in mountainous areas, which are either bare rock (at the highest altitudes) or other vegetation. Nonetheless, using other vegetation indices, such as those that have been tested in semi-arid environments [71], or including topographic variables [72] in the classification process can further improve the accuracy of the LULC data.
Another limitation relates to the VIIRS fire dataset that limits the study period to 2012–2019 and has a spatial resolution of 375 m, which might exclude smaller fires. Using only type 0 fires (i.e., presumed vegetation fires) should exclude oil flares, but we cannot be certain that only vegetation fires are included in the data, especially for the fires in bare soil/sparse vegetation areas. Nevertheless, VIIRS provides a good overview of the fire dynamics in the region and can help identify focus areas and periods for more detailed assessments. Incorporating change in the population of the region may provide further insight into the link between population dynamics, cropland expansion and active fire detections. However, there are presently no reliable and spatially disaggregated estimates of the KR-I population. Both bottom-up population mapping (linking of census data with geospatial covariates) and top-down population mapping (linking detailed geolocated micro-census counts with geospatial covariates) [73] are not viable in conflict zones due to outdated/inaccurate census data in the case of the former and safety concerns in the case of the latter. The effect of the scale of observation on the prevalence of fire clusters in conflict zones is an interesting one because it means there might be a constraint on the ability of fires to spread across a landscape. Indeed, a study in Israel [74] found that there was a scale-dependent risk level underlined by topography, vegetation cover and climatic conditions that influences the spread of fire. Similar dynamics might be at play here, which necessitates further investigation of the relationship between amplitude of distance to conflict and the clusters of fire hotspots at different scales.
6. Conclusions
Our aim in this paper was to provide an exploratory case study on the geopolitics of fire, conflict and land in the Kurdistan Region of Iraq. By using satellite remote sensing products and spatiotemporal data on armed conflict, we were able to confirm media reports stating that fires and conflicts increased in the region in the second half of the 2010s despite normal or even wetter weather conditions. The results indicate that the increase in fires may be partly related to increased political tensions in the KR-I and its vicinity from 2014 onwards. Corroboration of this was provided by the partial correlation analysis that produced a statistically significant relationship between the clusters of fire hotspots and distance to conflict but with a low correlation coefficient. This combination indicates that the relationship might be nonlinear. An unexpected finding was the relationship between amplitude of distance to conflict and the clusters of fire hotspots, which produced a fairly high correlation and statistical significance. This relationship is possibly linked to scale-dependent risk factors for the spread of fire and necessitates further research.
The two main armed conflicts after 2014 showed clear differences in the localities where they occurred, which suggests that they have been impacting different aspects of the land system. While the conflict with IS was concentrated in bare soil/sparse vegetation areas, the Turkey-PKK conflict largely took place in mountainous areas characterized by natural vegetation. It is therefore likely that the Turkey–PKK conflict had a stronger effect on forested areas than the IS conflict. The LULC data generally show small increases in the extent of the other vegetation class during the conflict periods, but tree-cover maps would be necessary to confirm media reports about deforestation. However, we can conclude at a minimum that the natural areas have not decreased and turned to bare soil/sparse vegetation during the conflict periods. Thus, an improvement of our LULC dataset would include a quantification of tree cover as a separate class. The development of such a dataset would be a natural next step in this research, together with a more detailed analysis of changes in tree cover and its relation to conflict and fire events.
All things considered, this study presents an initial look into the geopolitical aspects of fire, conflict and land. It provides examples of what types of data can be used to gain an overview and points to how we can move forward to investigate these interactions in detail. Therefore, we wish to inspire more research in exploring and investigating these dynamics for a better understanding of the complex interlinkages between fire, conflict and land.
Supplementary Materials
The following are available online at https://0-www-mdpi-com.brum.beds.ac.uk/article/10.3390/rs13081575/s1.
Author Contributions
Conceptualization, L.E. and P.D.; methodology, L.E. and A.M.A.; validation, L.E. and A.M.A.; formal analysis, L.E. and A.M.A.; investigation, L.E. and A.M.A.; data curation, L.E., A.M.A., and A.S.; writing—original draft preparation, L.E. and P.D.; writing—review and editing, L.E., A.M.A., A.S. and P.D.; visualization, A.M.A. and L.E.; project administration, L.E.; funding acquisition, P.D. All authors have read and agreed to the published version of the manuscript; please turn to the CRediT taxonomy for the term explanation. Authorship must be limited to those who have contributed substantially to the work reported.
Funding
This research was funded by the Swedish Research Council (Vetenskapsrådet) through the project “The Middle East in the Contemporary World” (MECW; grant number 2009-1056) and the project “What happens during drought?” (grant number 2018-00430). Funding was also provided by the European Union’s Horizon 2020 Research and Innovation Programme under the Marie Sklodowska-Curie Grant Agreement no 796086.
Conflicts of Interest
The authors declare no conflict of interest. The funders had no role in the design of the study; in the collection, analyses, or interpretation of data; in the writing of the manuscript, or in the decision to publish the results.
References
- Baumann, M.; Kuemmerle, T. The impacts of warfare and armed conflict on land systems. J. Land Use Sci. 2016, 11, 672–688. [Google Scholar] [CrossRef]
- Hanson, T.; Brooks, T.M.; Da Fonseca, G.A.B.; Hoffmann, M.; Lamoreux, J.F.; Machlis, G.; Mittermeier, C.G.; Mittermeier, R.A.; Pilgrim, J.D. Warfare in biodiversity hotspots. Conserv. Biol. 2009, 23, 578–587. [Google Scholar] [CrossRef] [PubMed]
- Machlis, G.E.; Hanson, T. Warfare ecology. In Warfare Ecology—A New Synthesis for Peace and Security; Springer: Dordrecht, The Netherlands, 2011; pp. 33–40. [Google Scholar]
- Baumann, M.; Radeloff, V.C.; Avedian, V.; Kuemmerle, T. Land-use change in the Caucasus during and after the Nagorno-Karabakh conflict. Reg. Environ. Chang. 2015, 15, 1703–1716. [Google Scholar] [CrossRef]
- Eklund, L.; Persson, A.; Pilesjö, P. Cropland changes in times of conflict, reconstruction, and economic development in Iraqi Kurdistan. Ambio 2016, 45, 78–88. [Google Scholar] [CrossRef] [PubMed] [Green Version]
- Eklund, L.; Degerald, M.; Brandt, M.; Prishchepov, A.V.; Pilesjö, P. How conflict affects land use: Agricultural activity in areas seized by the Islamic State. Environ. Res. Lett. 2017, 12, 054004. [Google Scholar] [CrossRef] [Green Version]
- Butsic, V.; Baumann, M.; Shortland, A.; Walker, S.; Kuemmerle, T. Conservation and conflict in the Democratic Republic of Congo: The impacts of warfare, mining, and protected areas on deforestation. Biol. Conserv. 2015, 191, 266–273. [Google Scholar] [CrossRef]
- Stevens, K.; Campbell, L.; Urquhart, G.; Kramer, D.; Qi, J. Examining complexities of forest cover change during armed conflict on Nicaragua’s Atlantic Coast. Biodivers. Conserv. 2011, 20, 2597–2613. [Google Scholar] [CrossRef]
- Burgess, R.; Miguel, E.; Stanton, C. War and deforestation in Sierra Leone. Environ. Res. Lett. 2015, 10, 095014. [Google Scholar] [CrossRef] [Green Version]
- Gorsevski, V.; Kasischke, E.; Dempewolf, J.; Loboda, T.; Grossmann, F. Analysis of the Impacts of armed conflict on the Eastern Afromontane forest region on the South Sudan—Uganda border using multitemporal Landsat imagery. Remote Sens. Environ. 2012, 118, 10–20. [Google Scholar] [CrossRef]
- Sánchez-Cuervo, A.M.; Aide, T.M. Consequences of the armed conflict, forced human displacement, and land abandonment on forest cover change in Colombia: A multi-scaled analysis. Ecosystems 2013, 16, 1052–1070. [Google Scholar] [CrossRef]
- Armenteras, D.; Schneider, L.; Dávalos, L.M. Fires in protected areas reveal unforeseen costs of Colombian peace. Nat. Ecol. Evol. 2019, 3, 20–23. [Google Scholar] [CrossRef] [PubMed]
- Murillo-Sandoval, P.J.; Van Dexter, K.; Van Den Hoek, J.; Wrathall, D.; Kennedy, R. The end of gunpoint conservation: Forest disturbance after the Colombian peace agreement. Environ. Res. Lett. 2020, 15, 034033. [Google Scholar] [CrossRef]
- Maystadt, J.-F.; Mueller, V.; Van Den Hoek, J.; van Weezel, S. Vegetation changes attributable to refugees in Africa coincide with agricultural deforestation. Environ. Res. Lett. 2020, 15, 044008. [Google Scholar] [CrossRef] [PubMed]
- Tonini, F.; Liu, J. Telecoupling toolbox: Spatially explicit tools for studying telecoupled human and natural systems. Ecol. Soc. 2017, 22. [Google Scholar] [CrossRef]
- Tapete, D.; Cigna, F.; Donoghue, D.N.; Philip, G. Mapping changes and damages in areas of conflict: From archive C-band SAR data to new HR X-band imagery, towards the Sentinels. In Proceedings of the 9th International Workshop on Advances in the Science and Applications of SAR Interferometry and Sentinel-1 InSAR, Frascati, Italy, 23–27 March 2015. [Google Scholar]
- Milillo, P.; Tapete, D.; Cigna, F.; Perissin, D.; Salzer, J.; Lundgren, P.; Fielding, E.; Burgmann, R.; Biondi, F.; Milillo, G.; et al. Structural health monitoring of engineered structures using a space-borne synthetic aperture radar multi-temporal approach: From cultural heritage sites to war zones. In Proceedings of the SPIE Remote Sensing: InSAR Image Analysis, Modeling, and Techniques XVI, Edinburgh, UK, 26–29 September 2016. [Google Scholar]
- Funk, C.; Peterson, P.; Landsfeld, M.; Pedreros, D.; Verdin, J.; Shukla, S.; Husak, G.; Rowland, J.; Harrison, L.; Hoell, A.; et al. The climate hazards infrared precipitation with stations—A new environmental record for monitoring extremes. Sci. Data 2015, 2, 150066. [Google Scholar] [CrossRef] [Green Version]
- Li, X.; Elvidge, C.; Zhou, Y.; Cao, C.; Warner, T. Remote sensing of night-time light. Int. J. Remote Sens. 2017, 38, 5855–5859. [Google Scholar] [CrossRef] [Green Version]
- Giglio, L.; Schroeder, W.; Justice, C.O. The collection 6 MODIS active fire detection algorithm and fire products. Remote Sens. Environ. 2016, 178, 31–41. [Google Scholar] [CrossRef] [Green Version]
- Schroeder, W.; Oliva, P.; Giglio, L.; Csiszar, I.A. The New VIIRS 375 m active fire detection data product: Algorithm description and initial assessment. Remote Sens. Environ. 2014, 143, 85–96. [Google Scholar] [CrossRef]
- Ganteaume, A.; Camia, A.; Jappiot, M.; San-Miguel-Ayanz, J.; Long-Fournel, M.; Lampin, C. A Review of the Main Driving Factors of Forest Fire Ignition Over Europe. Environ. Manag. 2013, 51, 651–662. [Google Scholar] [CrossRef] [Green Version]
- Levin, N.; Tessler, N.; Smith, A.; McAlpine, C. The Human and Physical Determinants of Wildfires and Burnt Areas in Israel. Environ. Manag. 2016, 58, 549–562. [Google Scholar] [CrossRef]
- Vázquez, A.; Moreno, J. Sensitivity of fire occurrence to meteorological variables in Mediterranean and Atlantic areas of Spain. Landsc. Urban Plan. 1993, 24, 129–142. [Google Scholar] [CrossRef]
- Kleinman, P. The ecological sustainability of slash-and-burn agriculture. Agric. Ecosyst. Environ. 1995, 52, 235–249. [Google Scholar] [CrossRef]
- Yibarbuk, D.; Whitehead, P.J.; Russell-Smith, J.; Jackson, D.; Godjuwa, C.; Fisher, A.; Cooke, P.; Choquenot, D. Fire ecology and Aboriginal land management in central Arnhem Land, northern Australia: A tradition of ecosystem management. J. Biogeogr. 2001, 28, 325–343. [Google Scholar] [CrossRef]
- Levin, N. Human factors explain the majority of MODIS-derived trends in vegetation cover in Israel: A densely populated country in the eastern Mediterranean. Reg. Environ. Chang. 2016, 16, 1197–1211. [Google Scholar] [CrossRef]
- De Vos, H.; Jongerden, J.; Van Etten, J. Images of war: Using satellite images for human rights monitoring in Turkish Kurdistan. Disasters 2008, 32, 449–466. [Google Scholar] [CrossRef] [PubMed]
- van Etten, J.; Jongerden, J.; de Vos, H.J.; Klaasse, A.; van Hoeve, E.C.E. Environmental destruction as a counterinsurgency strategy in the Kurdistan region of Turkey. Geoforum 2008, 39, 1786–1797. [Google Scholar] [CrossRef]
- Dinc, P. Forest fires in Dersim and Şırnak: Conflict and Environmental Destruction. In Ecological Solidarity in the Kurdish Freedom Movement: Thought, Practice, and Challenges; Hunt, S., Ed.; Lexington Books: London, UK, 2021; Forthcoming. [Google Scholar]
- Rasul, A.; Ibrahim, G.R.F.; Hameed, H.M.; Tansey, K. A trend of increasing burned areas in Iraq from 2001 to 2019. Environ. Dev. Sustain. 2020, 23, 5739–5755. [Google Scholar] [CrossRef]
- Gibson, G.R.; Taylor, N.L.; Lamo, N.C.; Lackey, J.K. Effects of Recent Instability on Cultivated Area Along the Euphrates River in Iraq. Prof. Geogr. 2017, 69, 163–176. [Google Scholar] [CrossRef]
- Dennis, R.A.; Mayer, J.; Applegate, G.; Chokkalingam, U.; Colfer, C.J.P.; Kurniawan, I.; Lachowski, H.; Maus, P.; Permana, R.P.; Ruchiat, Y.; et al. Fire, People and Pixels: Linking Social Science and Remote Sensing to Understand Underlying Causes and Impacts of Fires in Indonesia. Hum. Ecol. 2005, 33, 465–504. [Google Scholar] [CrossRef]
- Eklund, L.; Abdi, A.; Islar, M. From Producers to Consumers: The Challenges and Opportunities of Agricultural Development in Iraqi Kurdistan. Land 2017, 6, 44. [Google Scholar] [CrossRef] [Green Version]
- Cordesman, A.H.; Toukan, A. Return of ISIS in Iraq, Syria, and the Middle East; Center for Strategic and International Studies: Washington, DC, USA, 2019. [Google Scholar]
- Oxford Analytica. Arson Campaign Will Raise Food Fears in Iraq and Syria; 2633-304X; Oxford Analytica: Oxford, UK, 2019. [Google Scholar]
- Rahimi, I.; Azeez, S.N.; Ahmed, I.H. Mapping Forest-Fire Potentiality Using Remote Sensing and GIS, Case Study: Kurdistan Region-Iraq. In Environmental Remote Sensing and GIS in Iraq; Al-Quraishi, A.M.F., Negm, A.M., Eds.; Springer Nature: Cham, Switzerland, 2020; pp. 499–513. [Google Scholar]
- Abdo, H.G. Impacts of war in Syria on vegetation dynamics and erosion risks in Safita area, Tartous, Syria. Reg. Environ. Chang. 2018, 18, 1707–1719. [Google Scholar] [CrossRef]
- Lewandowsky, S.; Stritzke, W.G.K.; Freund, A.M.; Oberauer, K.; Krueger, J.I. Misinformation, disinformation, and violent conflict: From Iraq and the “War on Terror” to future threats to peace. Am. Pscychol. 2013, 68, 487–501. [Google Scholar] [CrossRef]
- Aboufadel, L. Over 26,000 Iraqi Soldiers Killed in 4 Year War with ISIS. Al-Masdar News. 13 December 2017. Available online: https://www.almasdarnews.com/article/26000-iraqi-soldiers-killed-4-year-war-isis/ (accessed on 1 February 2021).
- Statista. Number of documented civilian deaths in the Iraq war from 2003 to September 2020. In Statista Research Department; Statista: Hamburg, Germany, 2020. [Google Scholar]
- Sundberg, R.; Melander, E. Introducing the UCDP Georeferenced Event Dataset. J. Peace Res. 2013, 50, 523–532. [Google Scholar] [CrossRef]
- Dinc, P. The Kurdish Movement and the Democratic Federation of Northern Syria: An Alternative to the (Nation-)State Model? J. Balk. Near East. Stud. 2020, 22, 47–67. [Google Scholar] [CrossRef]
- International Crisis Group. Turkey’s PKK Conflict: A Visual Explainer. Available online: https://www.crisisgroup.org/content/turkeys-pkk-conflict-visual-explainer (accessed on 1 February 2021).
- Ali, S. Iraq Reveals Causes of Fires Destroying Thousands of Acres of Land. Kurdistan 24. 9 June 2019. Available online: https://www.kurdistan24.net/en/story/19841-Iraq-reveals-causes-of-fires-destroying-thousands-of-acres-of-land (accessed on 1 February 2021).
- Al-Monitor. Islamic State Believed Behind Crop Fires in Iraq’s Disputed Territories. Al-Monitor. 13 May 2020. Available online: https://www.al-monitor.com/originals/2020/05/farm-fires-resume-iraq-disputed-territories-islamic-state.html (accessed on 1 February 2021).
- Abdullah, R. 2.2 Million Acres of Forest Lost to Fire, Deforestation, Budget Cuts: KRG. Rudaw. 17 October 2018. Available online: https://www.rudaw.net/english/kurdistan/171020182 (accessed on 1 February 2021).
- Shilani, H. KRG Ministry: Burning Of Kurdish Farmers’ Crops in Iraq ‘Systematic2019’. Kurdistan 24. 30 May 2020. Available online: https://www.kurdistan24.net/en/story/22512-KRG-ministry:-Burning-of-Kurdish-farmers%27-crops-in-Iraq-%27systematic%27#:~:text=The%20Kurdistan%20Region’s%20Ministry%20of,the%20%22fire%20of%20hatred.%22 (accessed on 1 February 2021).
- Schwartzstein, P. Iraq races to save last of Middle East’s forests from burning. In National Geographic; National Geographic: Washington, DC, USA, 2019; Available online: https://www.nationalgeographic.co.uk/environment-and-conservation/2019/07/iraq-races-save-last-middle-easts-forests-burning (accessed on 1 February 2021).
- Hawramy, F. Fires and Armed Conflict Take Toll on Kurdish Flora, Fauna. Al-Monitor. 5 July 2018. Available online: https://www.al-monitor.com/originals/2018/07/kurdish-forests-under-threat-of-wildfires.html (accessed on 1 February 2021).
- Crisp, W. Last Chance for the Persian Leopard: The Fight to Save Iraqi Kurdistan’s Forests. The Guardian. 20 June 2020. Available online: https://www.theguardian.com/environment/2020/jun/20/landmines-last-line-of-defence-for-kurdistan-endangered-persian-leopard-aoe (accessed on 1 February 2021).
- UNEP. Salvaging Iraq’s remaining wilderness. In UN Environment Programme; UNEP: Nairobi, Kenya, 2018. [Google Scholar]
- Lelieveld, J.; Hadjinicolaou, P.; Kostopoulou, E.; Chenoweth, J.; El Maayar, M.; Giannakopoulos, C.; Hannides, C.; Lange, M.A.; Tanarhte, M.; Tyrlis, E.; et al. Climate change and impacts in the Eastern Mediterranean and the Middle East. Clim. Chang. 2012, 114, 667–687. [Google Scholar] [CrossRef] [Green Version]
- Mosa, W.L. Forest Cover Change and Migration in Iraqi Kurdistan: A Case Study from Zawita Sub-District; Michigan State University: East Lansing, MI, USA, 2016. [Google Scholar]
- Didan, K.; Munoz, A.B.; Solano, R.; Huete, A. MODIS Vegetation Index User’s Guide; MOD13 Series; Vegetation Index and Phenology Lab, The University of Arizona: Tucson, AZ, USA, 2015; pp. 1–38. [Google Scholar]
- Schroeder, W.; Giglio, L. NASA VIIRS Land Science Investigator Processing System (SIPS) Visible Infrared Imaging Radiometer Suite (VIIRS) 375 m & 750 m Active Fire Products: Product User’s Guide Version 1.4; NASA: Washington, DC, USA, 2018.
- Hersbach, H.; Bell, B.; Berrisford, P.; Hirahara, S.; Horányi, A.; Muñoz-Sabater, J.; Nicolas, J.; Peubey, C.; Radu, R.; Schepers, D. The ERA5 global reanalysis. Q. J. R. Meteorol. Soc. 2020, 146, 1999–2049. [Google Scholar] [CrossRef]
- Vlassova, L.; Pérez-Cabello, F.; Mimbrero, M.R.; Llovería, R.M.; García-Martín, A. Analysis of the relationship between land surface temperature and wildfire severity in a series of landsat images. Remote Sens. 2014, 6, 6136–6162. [Google Scholar] [CrossRef] [Green Version]
- Breiman, L. Random forests. Mach. Learn 2001, 45, 5–32. [Google Scholar] [CrossRef] [Green Version]
- Olofsson, P.; Foody, G.M.; Herold, M.; Stehman, S.V.; Woodcock, C.E.; Wulder, M.A. Good practices for estimating area and assessing accuracy of land change. Remote Sens. Environ. 2014, 148, 42–57. [Google Scholar] [CrossRef]
- Hammond, R.; McCullagh, P.S. Quantitative techniques in geography: An introduction. In OUP Catalogue; Oxford University Press: Oxford, UK, 1978. [Google Scholar]
- Kim, S. ppcor: An R Package for a Fast Calculation to Semi-partial Correlation Coefficients. Commun. Stat. Appl. Methods 2015, 22, 665–674. [Google Scholar] [CrossRef] [Green Version]
- Getis, A.; Ord, J.K. The Analysis of Spatial Association by Use of Distance Statistics. Geogr. Anal. 1992, 24, 189–206. [Google Scholar] [CrossRef]
- Ord, J.K.; Getis, A. Local Spatial Autocorrelation Statistics: Distributional Issues and an Application. Geogr. Anal. 1995, 27, 286–306. [Google Scholar] [CrossRef]
- Noori, Z.; Kazemzadeh, M.; Jamali, S.; Abdi, A.M. Four decades of synoptic air temperature data over Iran reveals linear and nonlinear warming. 2021. Forthcoming. [Google Scholar]
- Eklund, L.; Seaquist, J. Meteorological, agricultural and socioeconomic drought in the Duhok Governorate, Iraqi Kurdistan. Nat. Hazards 2015, 76, 421–441. [Google Scholar] [CrossRef]
- Eklund, L.; Theisen, O.M.; Baumann, M.; Forø Tollefsen, A.; Kuemmerle, T.; Østergaard Nielsen, J. Drought, crop failure and recovery in pre-conflict Syria: Deconstructing the prevailing drought-conflict narrative. 2021. Forthcoming. [Google Scholar]
- IOM. Demographic Survey—Kurdistan Region of Iraq; International Organization for Migration: Baghdad, Iraq, 2018. [Google Scholar]
- Rate, A.W.; Sheikh-Abdullah, S.M. The geochemistry of calcareous forest soils in Sulaimani Governorate, Kurdistan Region, Iraq. Geoderma 2017, 289, 54–65. [Google Scholar] [CrossRef]
- Farrell, S.; Fukada, S.; Myers, S.L. With the P.K.K. in Iraq’s Qandil Mountains. In The New York Times. At War: Notes From the Front Lines; 5 January 2011; Available online: https://atwar.blogs.nytimes.com/2011/01/05/with-the-p-k-k-in-iraqs-qandil-mountains/ (accessed on 1 February 2021).
- Abdi, A.M.; Boke-Olén, N.; Jin, H.; Eklundh, L.; Tagesson, T.; Lehsten, V.; Ardö, J. First assessment of the plant phenology index (PPI) for estimating gross primary productivity in African semi-arid ecosystems. Int. J. Appl. Earth Obs. Geoinf. 2019, 78, 249–260. [Google Scholar] [CrossRef] [Green Version]
- Wang, H.; Liu, C.; Zang, F.; Yang, J.; Li, N.; Rong, Z.; Zhao, C. Impacts of Topography on the Land Cover Classification in the Qilian Mountains, Northwest China. Can. J. Remote Sens. 2020, 46, 344–359. [Google Scholar] [CrossRef]
- Wardrop, N.A.; Jochem, W.C.; Bird, T.J.; Chamberlain, H.R.; Clarke, D.; Kerr, D.; Bengtsson, L.; Juran, S.; Seaman, V.; Tatem, A.J. Spatially disaggregated population estimates in the absence of national population and housing census data. Proc. Natl. Acad. Sci. USA 2018, 115, 3529–3537. [Google Scholar] [CrossRef] [Green Version]
- Carmel, Y.; Paz, S.; Jahashan, F.; Shoshany, M. Assessing fire risk using Monte Carlo simulations of fire spread. For. Ecol. Manag. 2009, 257, 370–377. [Google Scholar] [CrossRef]
Figure 1.
Map of the study area showing the three governorates that comprise the Kurdistan Region of Iraq (KR-I) and the most frequent LULC over 2000–2019. The black box at the center of the inset globe indicates the location of the KR-I relative to the Middle East and the world.
Figure 1.
Map of the study area showing the three governorates that comprise the Kurdistan Region of Iraq (KR-I) and the most frequent LULC over 2000–2019. The black box at the center of the inset globe indicates the location of the KR-I relative to the Middle East and the world.

Figure 2.
Time series of the proportion of LULC classes in KR-I between 2000 and 2019. Note that single-cropped and double-cropped cropland were merged into one cropland class, which largely consists of single-cropped cropland (see Section 4.1).
Figure 2.
Time series of the proportion of LULC classes in KR-I between 2000 and 2019. Note that single-cropped and double-cropped cropland were merged into one cropland class, which largely consists of single-cropped cropland (see Section 4.1).

Figure 3.
Changes in average LULC extent between the baseline periods and the conflict periods. Labels with percentages indicate the areal change from the long baseline period (B1) to the corresponding conflict period (C1 or C2). The error bars denote the standard error of each change.
Figure 3.
Changes in average LULC extent between the baseline periods and the conflict periods. Labels with percentages indicate the areal change from the long baseline period (B1) to the corresponding conflict period (C1 or C2). The error bars denote the standard error of each change.

Figure 4.
Geolocations of 43,792 active fires and color-coded conflict regions (1.5 km point clusters, numbers within the red and black colors refer to the sum of all events at each cluster) for 2012–2019 overlaid on the most frequent LULC during 2000–2019.
Figure 4.
Geolocations of 43,792 active fires and color-coded conflict regions (1.5 km point clusters, numbers within the red and black colors refer to the sum of all events at each cluster) for 2012–2019 overlaid on the most frequent LULC during 2000–2019.

Figure 5.
(A) Active fires recorded in the KR-I by the VIIRS instrument between 2012 and 2019, and (B) Conflict events recorded in the KR-I in the UCDP dataset between 2012 and 2019, and their corresponding LULC classes for the year in question. No Data refers to pixels with no LULC class assigned that occur predominantly in regions with rugged topography.

Figure 6.
Conflict events recorded in the KR-I in the UCDP dataset between 2013 and 2019, divided by (A) the parties in conflict and year, and (B) the parties in conflict and corresponding LULC class.
Figure 6.
Conflict events recorded in the KR-I in the UCDP dataset between 2013 and 2019, divided by (A) the parties in conflict and year, and (B) the parties in conflict and corresponding LULC class.

Figure 7.
Standardized anomalies of annually summed precipitation and mean annual land surface temperature (z-scores) over the KR-I area, 2000–2019. The precipitation data are based on Climate Hazards Group InfraRed Precipitation with Station dataset, and the land surface temperature data are based on the ERA5-Land dataset. The horizontal lines (±1.645) indicate the critical values that indicate the significance of the z-score at the 90% level.


Table 1.
Definition of the study periods based on data about the number of conflict-related deaths in Iraq and the KR-I from the Uppsala Conflict Data Program (UCDP) dataset. The study periods are split according to which conflict was dominant in the UCDP dataset.
Table 1.
Definition of the study periods based on data about the number of conflict-related deaths in Iraq and the KR-I from the Uppsala Conflict Data Program (UCDP) dataset. The study periods are split according to which conflict was dominant in the UCDP dataset.
| Baseline Period 1: Long (2000–2013) | Baseline Period 2: Short (2010–2013) | Conflict Period 1: IS-Iraq Conflict (2014–2016) | Conflict Period 2: Turkey-PKK Conflict (2017–2019) |
|---|---|---|---|
| B1 | B2 | C1 | C2 |
| This period is characterized by increased stability in the KR-I, but decreased stability in Iraq as a whole, starting with the U.S.-led invasion in 2003. | A period of decreased violence in Iraq in general, and particularly in the KR-I. | War between IS and the Government of Iraq in locations close to the KR-I. As violence related to this conflict was substantially reduced in 2017, this period ends in 2016. | In 2017, there was an increase in violence related to the Turkey-PKK conflict in the KR-I. The year 2019 marks the end of the study period, not the conflict. |
Table 2.
Results of six partial correlation experiments. The response is the focus variable whose variation is being studied. The response variable in this analysis is the sum of hotspot anomalies within each 10 km fishnet cell across the study area. The explanatory variables are also captured within each 10 km fishnet cell and are those that could have an impact on the variability of the response. Amplitude of distance to conflict is the range of distance values from a conflict location; land cover variability is the diversity of land cover pixels. The control variables are those whose effects are masked in each experiment. Note that the value of n varies with the number of interaction terms included.
| Response Variable: Sum of Fire Hotspot (Getis-Ord Gi*) | |||||
|---|---|---|---|---|---|
| Exp # | Explanatory Variable | rpearson | tpearson | p-Value | Control Variables |
| 1 | Mean annual temperature (n = 1371) | 0.098 | 3.652 | 0.000 | Land cover variability Amplitude of distance to conflict Mean annual rainfall |
| 2 | Mean annual rainfall (n = 1371) | −0.004 | −0.181 | 0.856 | Land cover variability Amplitude of distance to conflict Mean annual rainfall |
| 3 | Amplitude of distance to conflict (n = 1371) | 0.371 | 14.77 | 0.000 | Land cover variability Mean annual temperature Mean annual rainfall |
| 4 | Mean distance to conflict (n = 1371) | −0.17 | −6.385 | 0.000 | Land cover variability Mean annual temperature Mean annual rainfall |
| 5 | Mean annual temperature + rainfall (n = 914) | −0.018 | −0.567 | 0.571 | Land cover variability Amplitude of distance to conflict |
| 6 | Mean annual temperature * rainfall (n = 914) | 0.108 | 3.298 | 0.001 | Land cover variability Amplitude of distance to conflict |
Publisher’s Note: MDPI stays neutral with regard to jurisdictional claims in published maps and institutional affiliations. |
© 2021 by the authors. Licensee MDPI, Basel, Switzerland. This article is an open access article distributed under the terms and conditions of the Creative Commons Attribution (CC BY) license (https://creativecommons.org/licenses/by/4.0/).
Share and Cite
MDPI and ACS Style
Eklund, L.; Abdi, A.M.; Shahpurwala, A.; Dinc, P. On the Geopolitics of Fire, Conflict and Land in the Kurdistan Region of Iraq. Remote Sens. 2021, 13, 1575. https://0-doi-org.brum.beds.ac.uk/10.3390/rs13081575
AMA Style
Eklund L, Abdi AM, Shahpurwala A, Dinc P. On the Geopolitics of Fire, Conflict and Land in the Kurdistan Region of Iraq. Remote Sensing. 2021; 13(8):1575. https://0-doi-org.brum.beds.ac.uk/10.3390/rs13081575
Chicago/Turabian StyleEklund, Lina, Abdulhakim M. Abdi, Aiman Shahpurwala, and Pinar Dinc. 2021. "On the Geopolitics of Fire, Conflict and Land in the Kurdistan Region of Iraq" Remote Sensing 13, no. 8: 1575. https://0-doi-org.brum.beds.ac.uk/10.3390/rs13081575
Note that from the first issue of 2016, this journal uses article numbers instead of page numbers. See further details here.