
Morphodynamic Controls for Growth and Evolution of a Rubble Coral Island

 , , ,
, , ,  , , and
Abstract
:1. Introduction
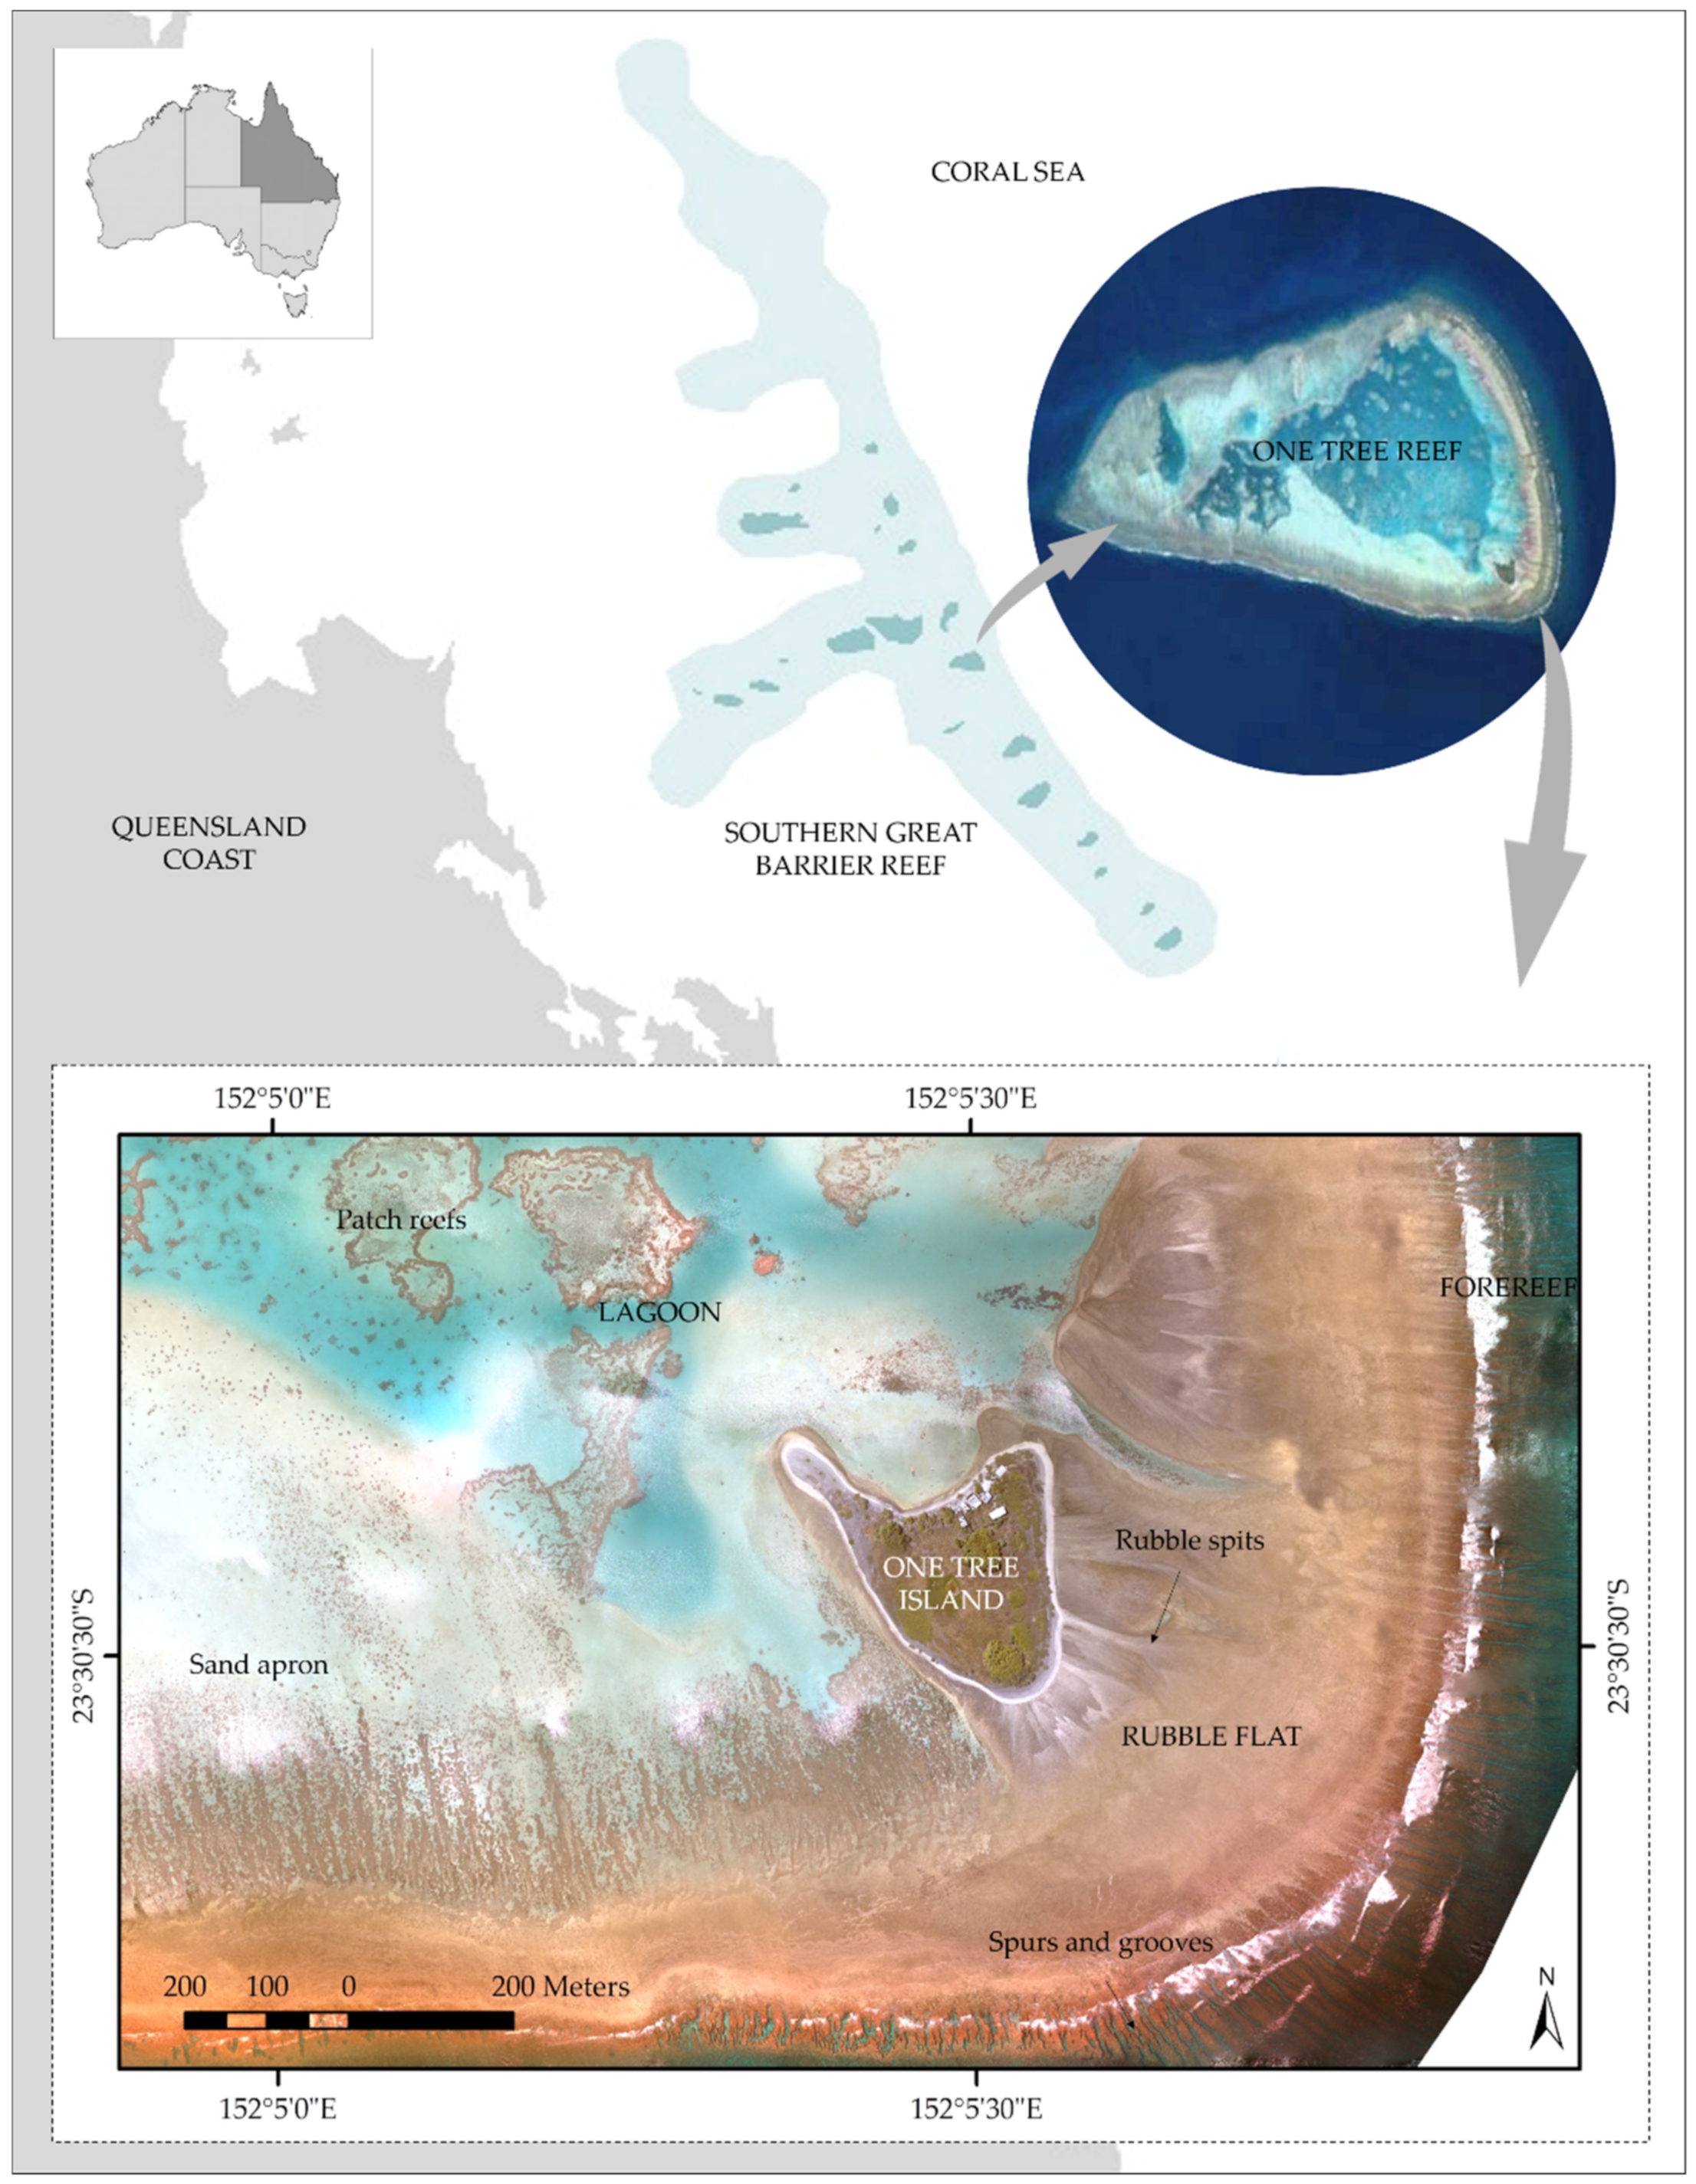
2. Study Site
3. Materials and Methods
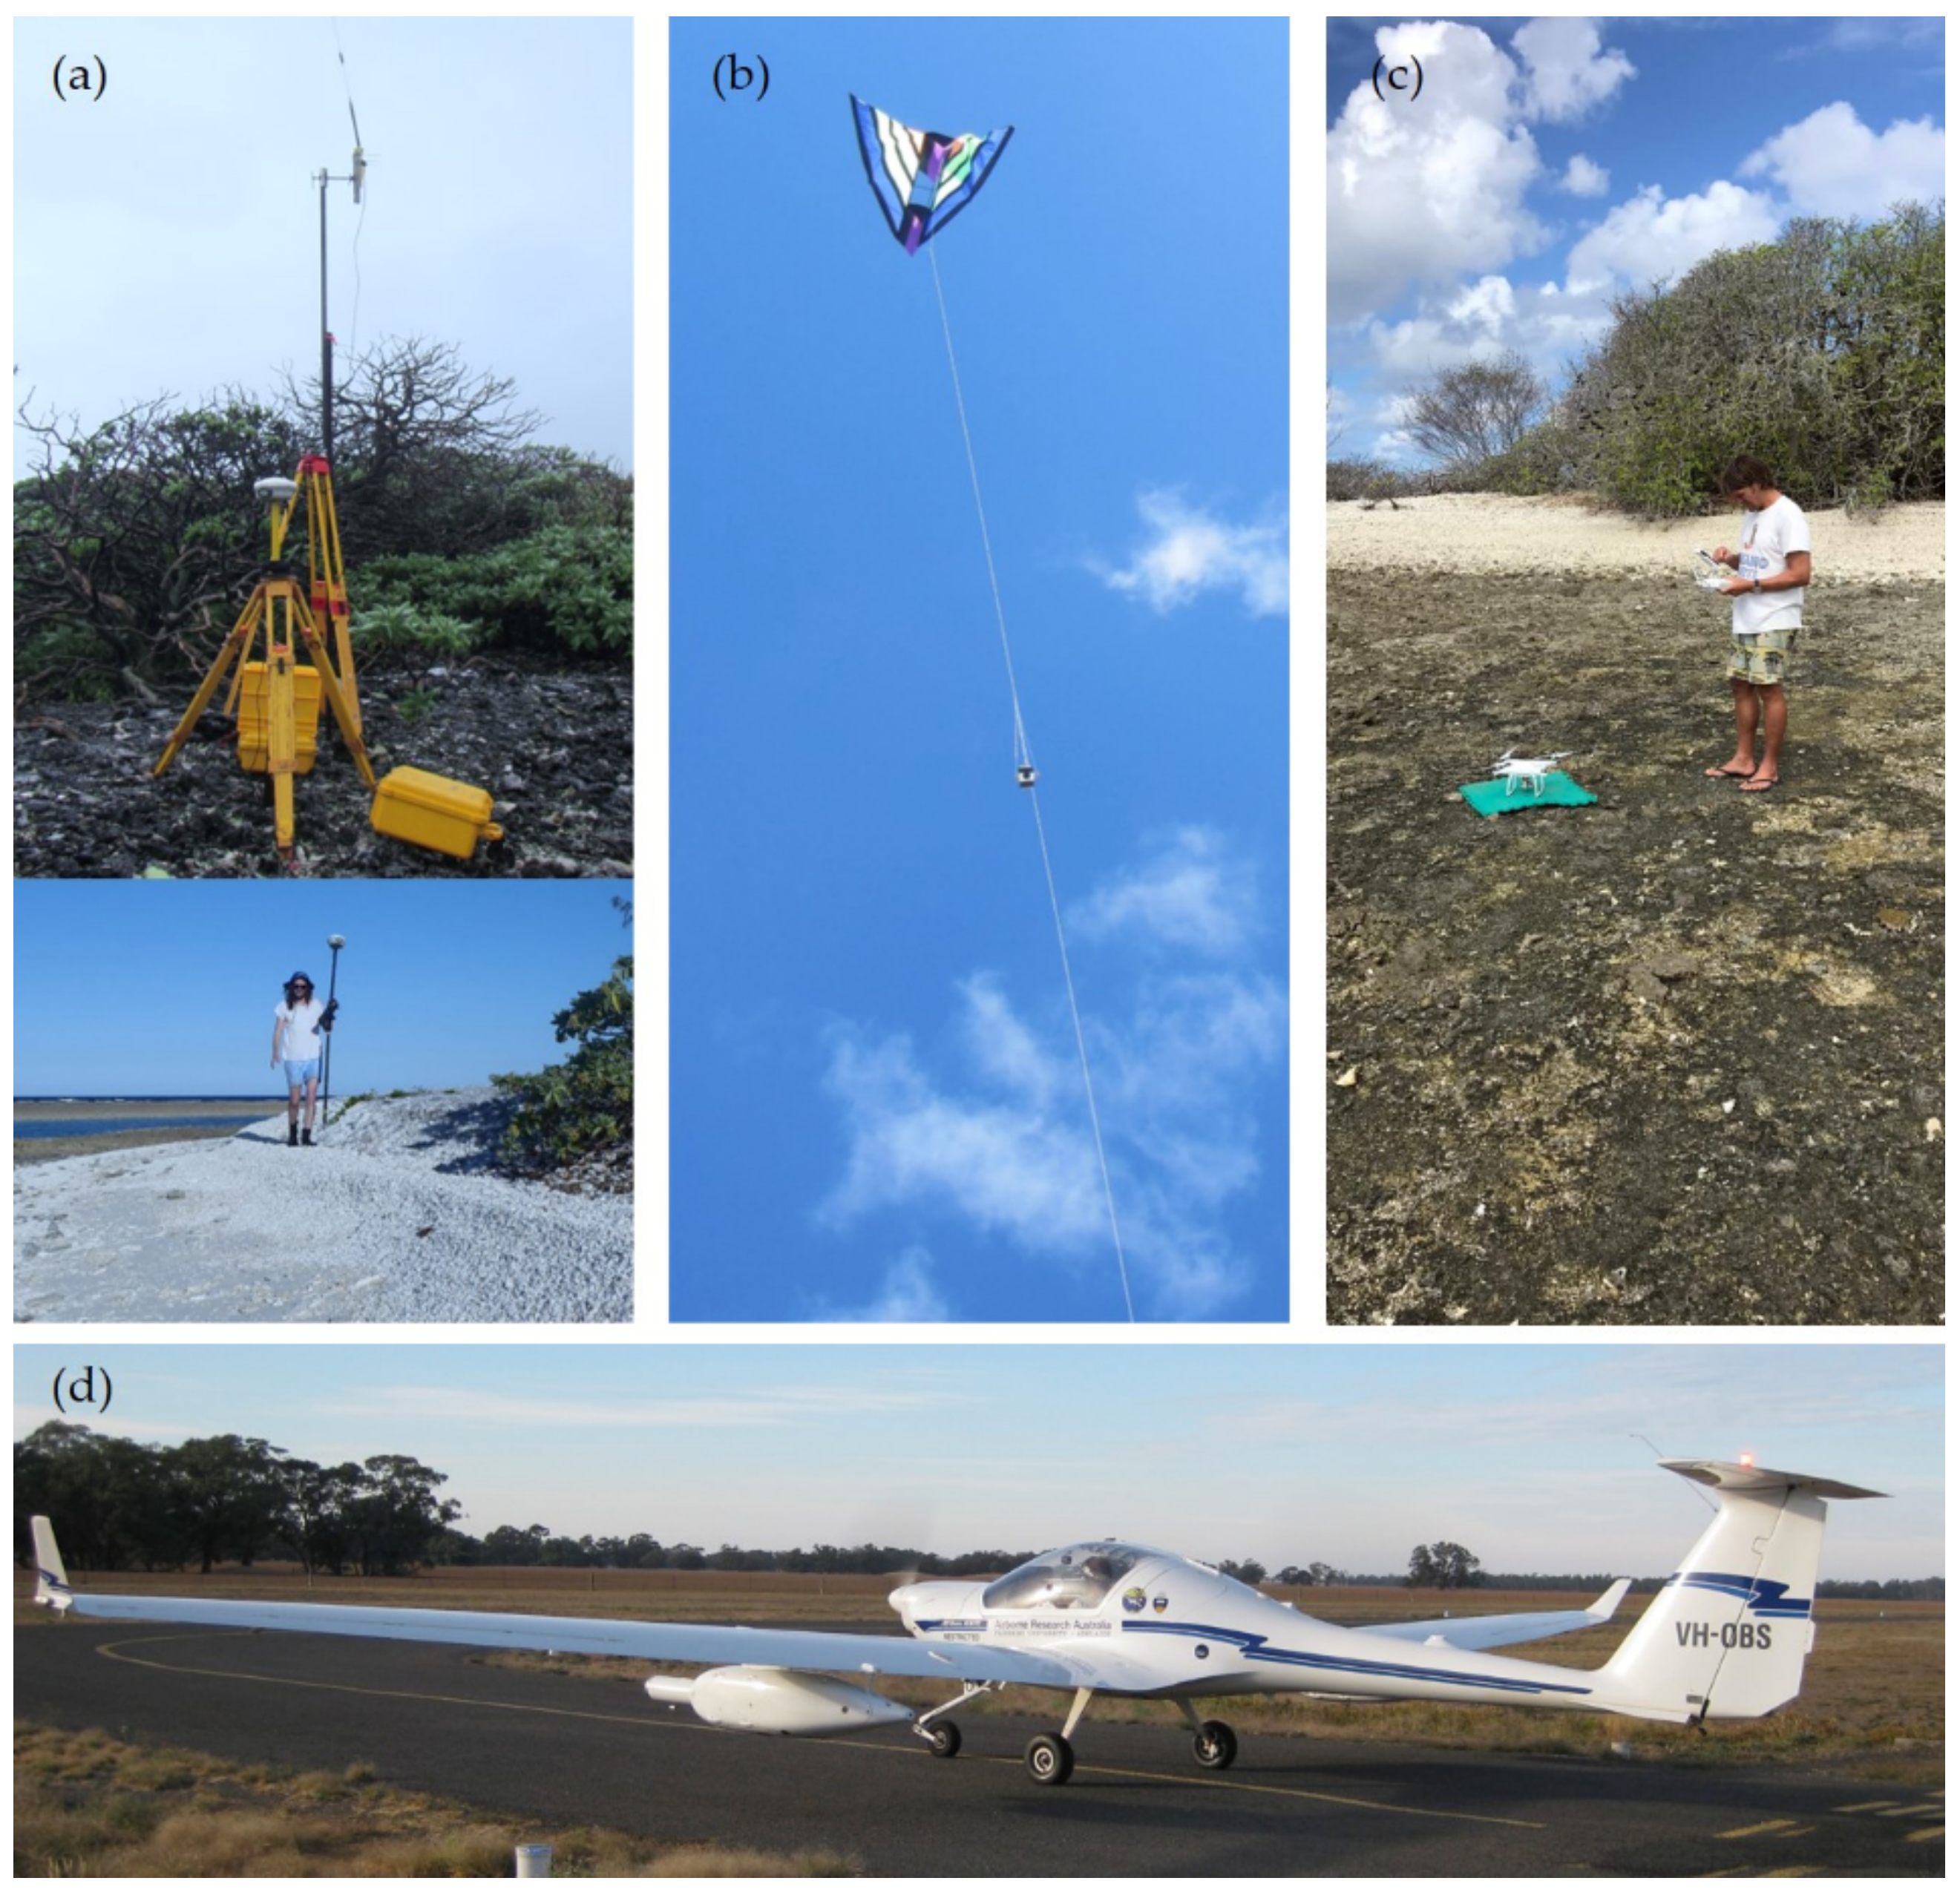
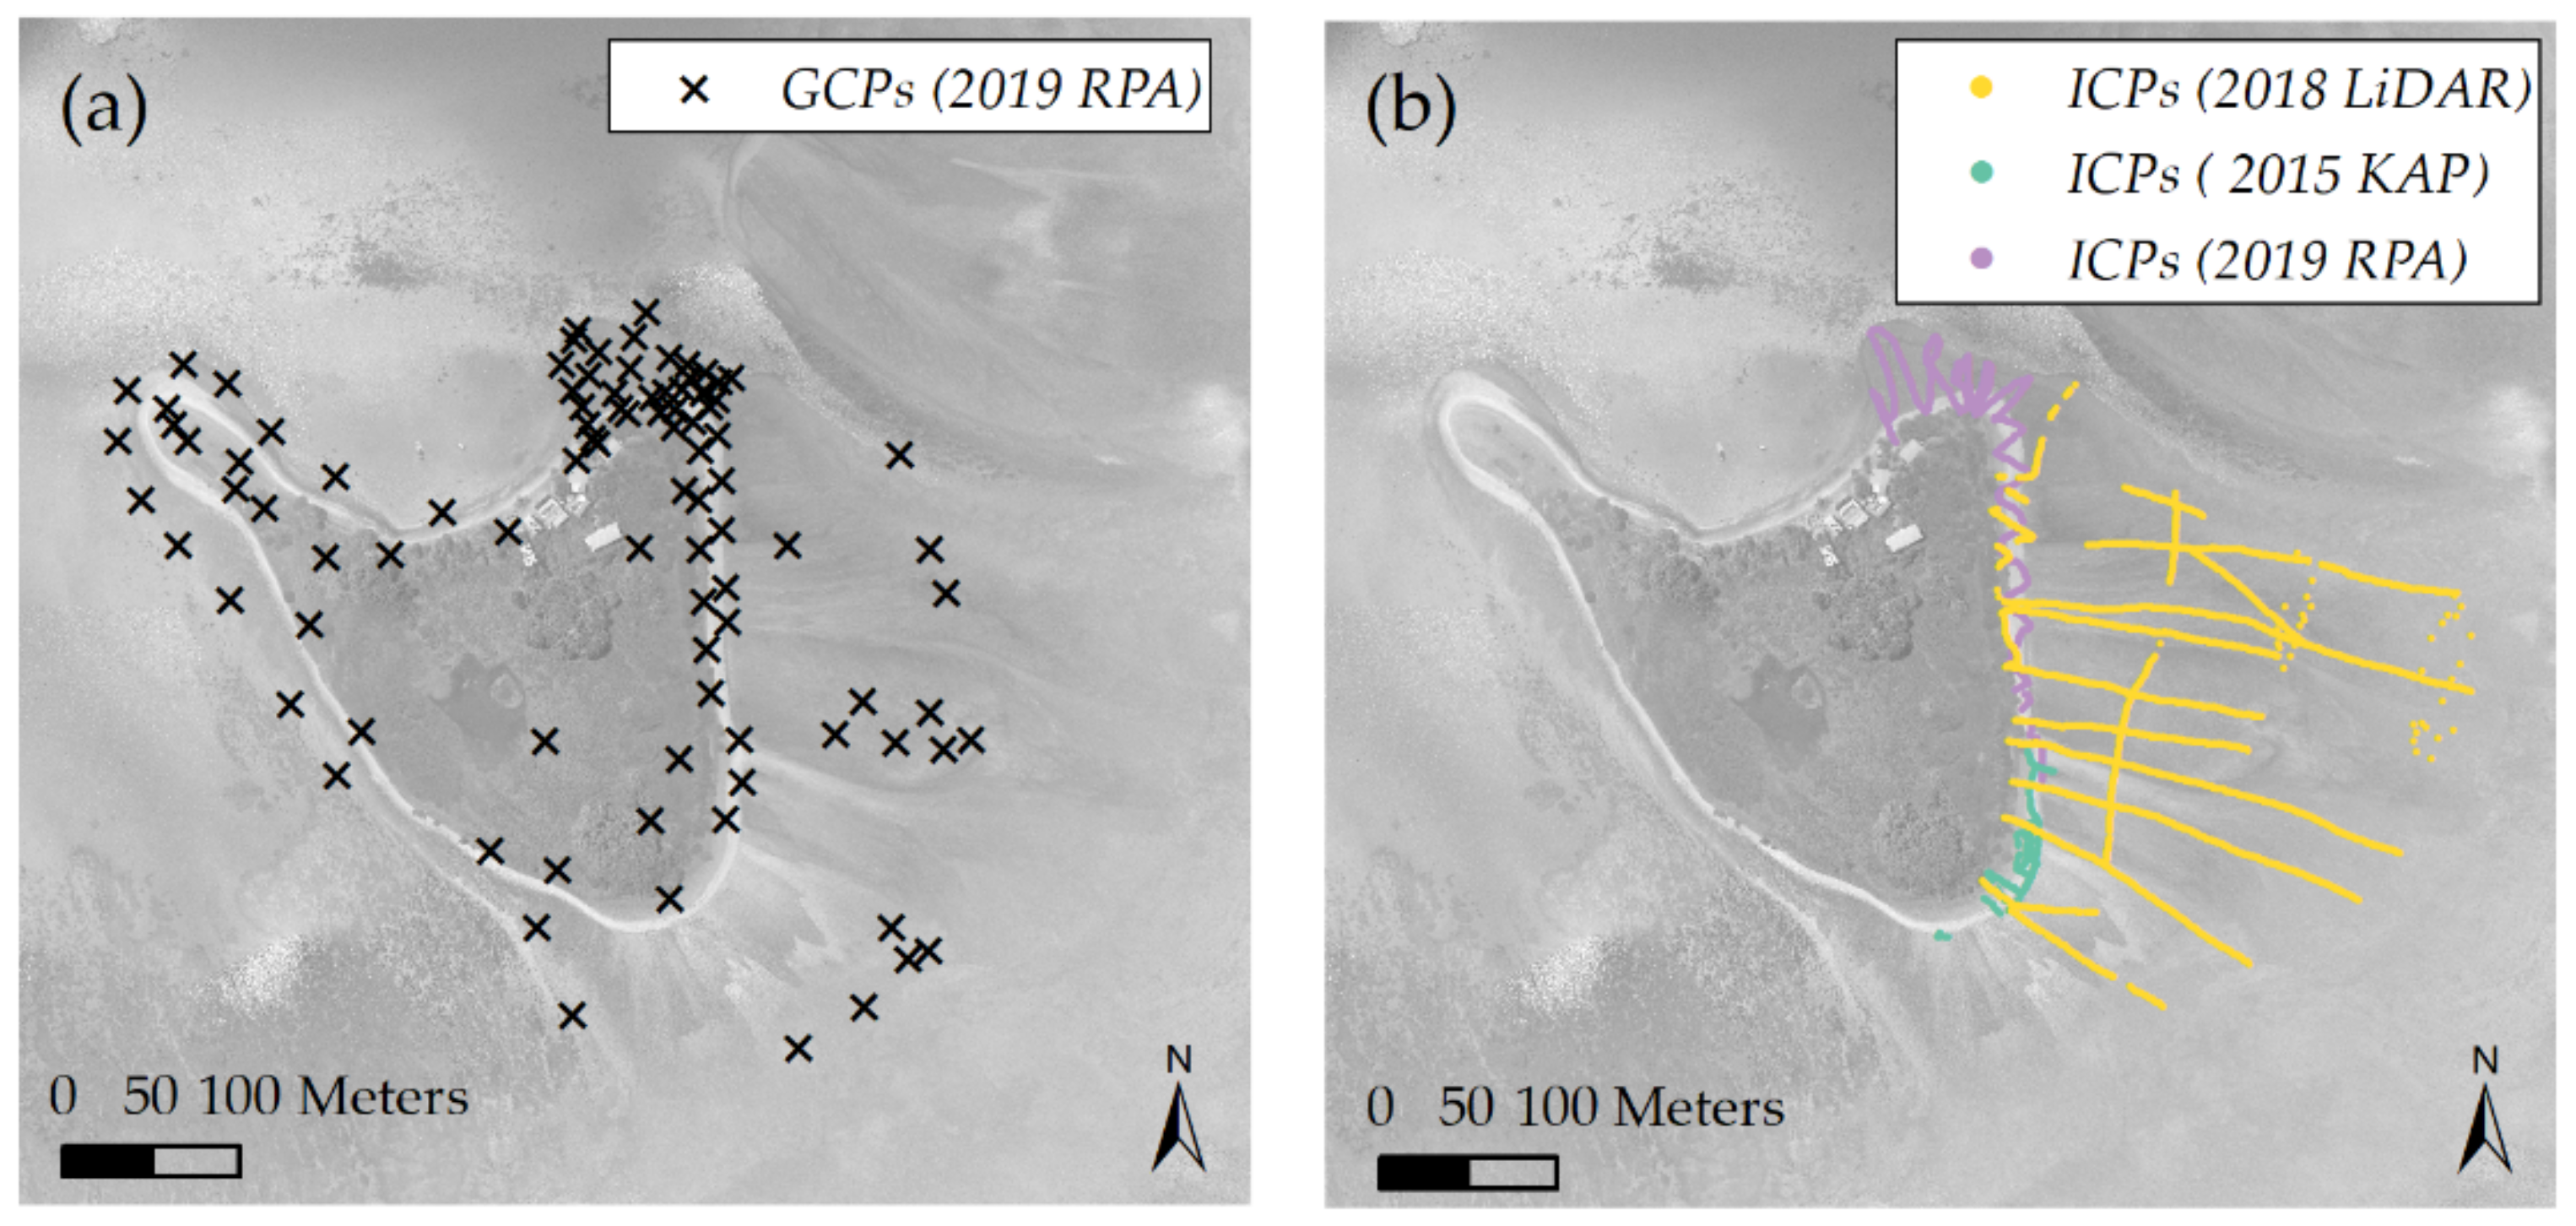
3.1. Topographic Data
3.2. Detection of Geomorphic Changes
3.2.1. Decadal Analyses
3.2.2. High-Resolution and Short-Term Analyses
3.3. Hydrodynamic Data and Cyclones
4. Results
4.1. Decadal Geomorphic Changes
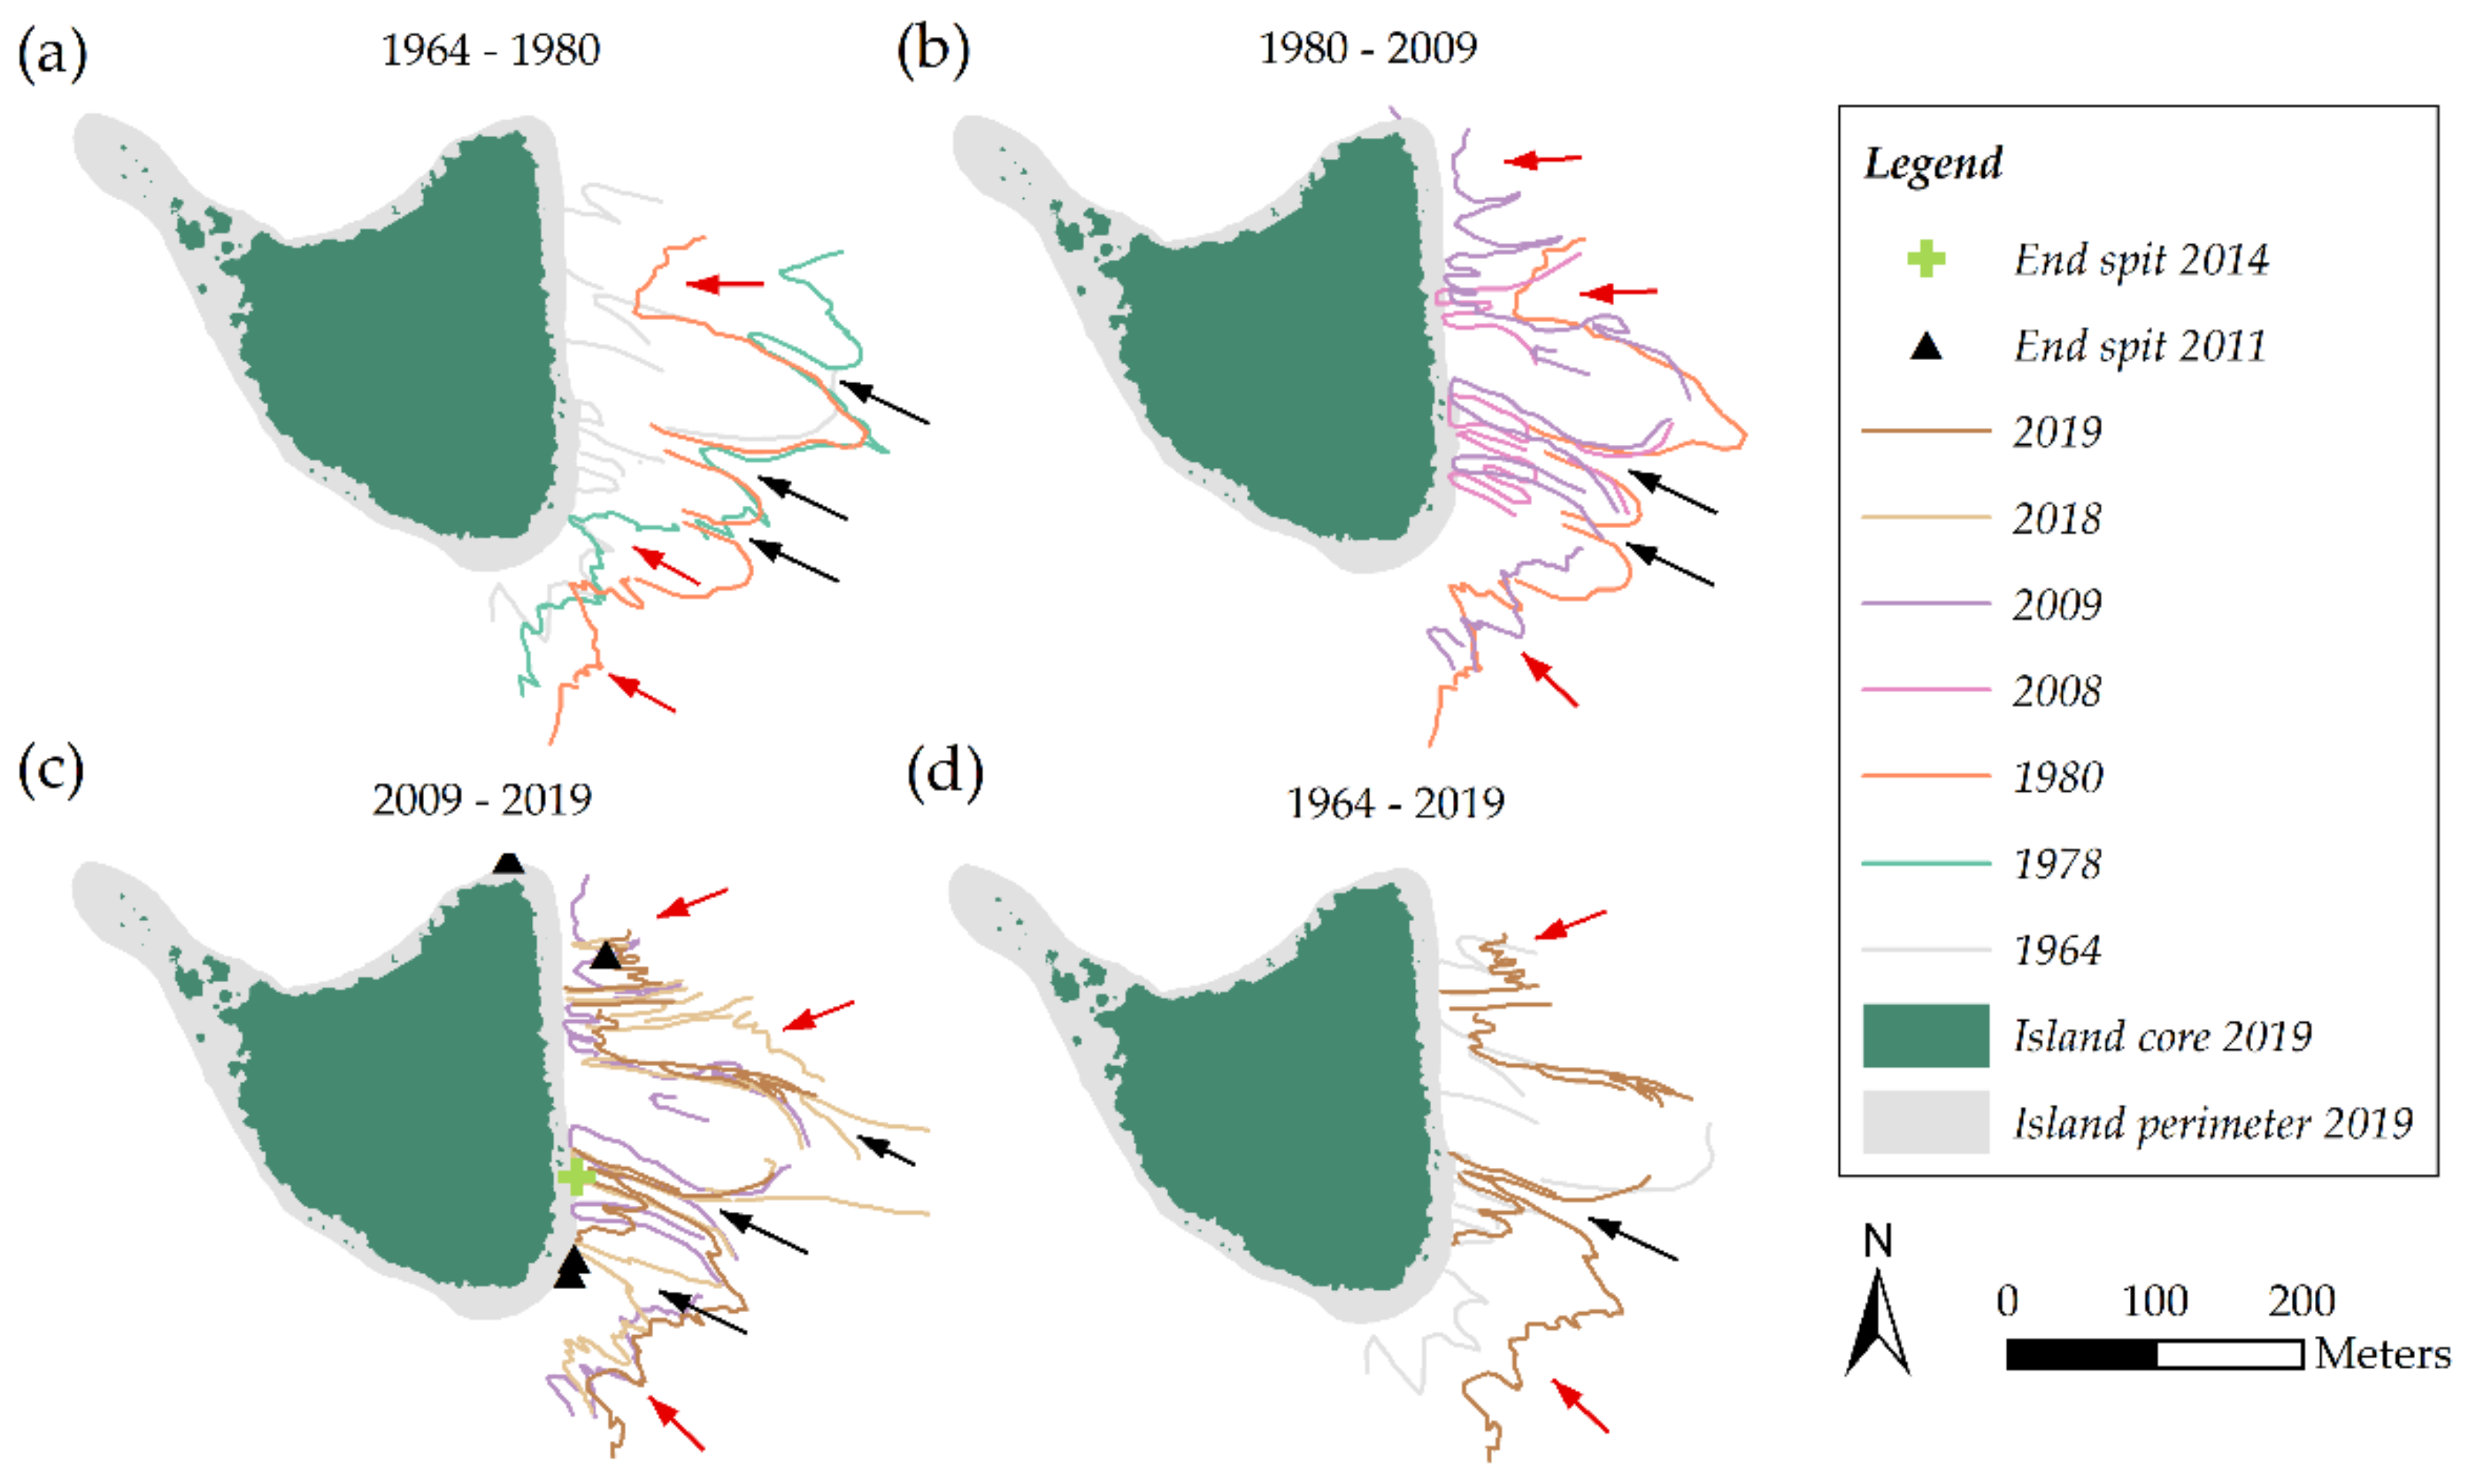
4.1.1. Island Planform Changes
4.1.2. Vegetated Island Core Changes
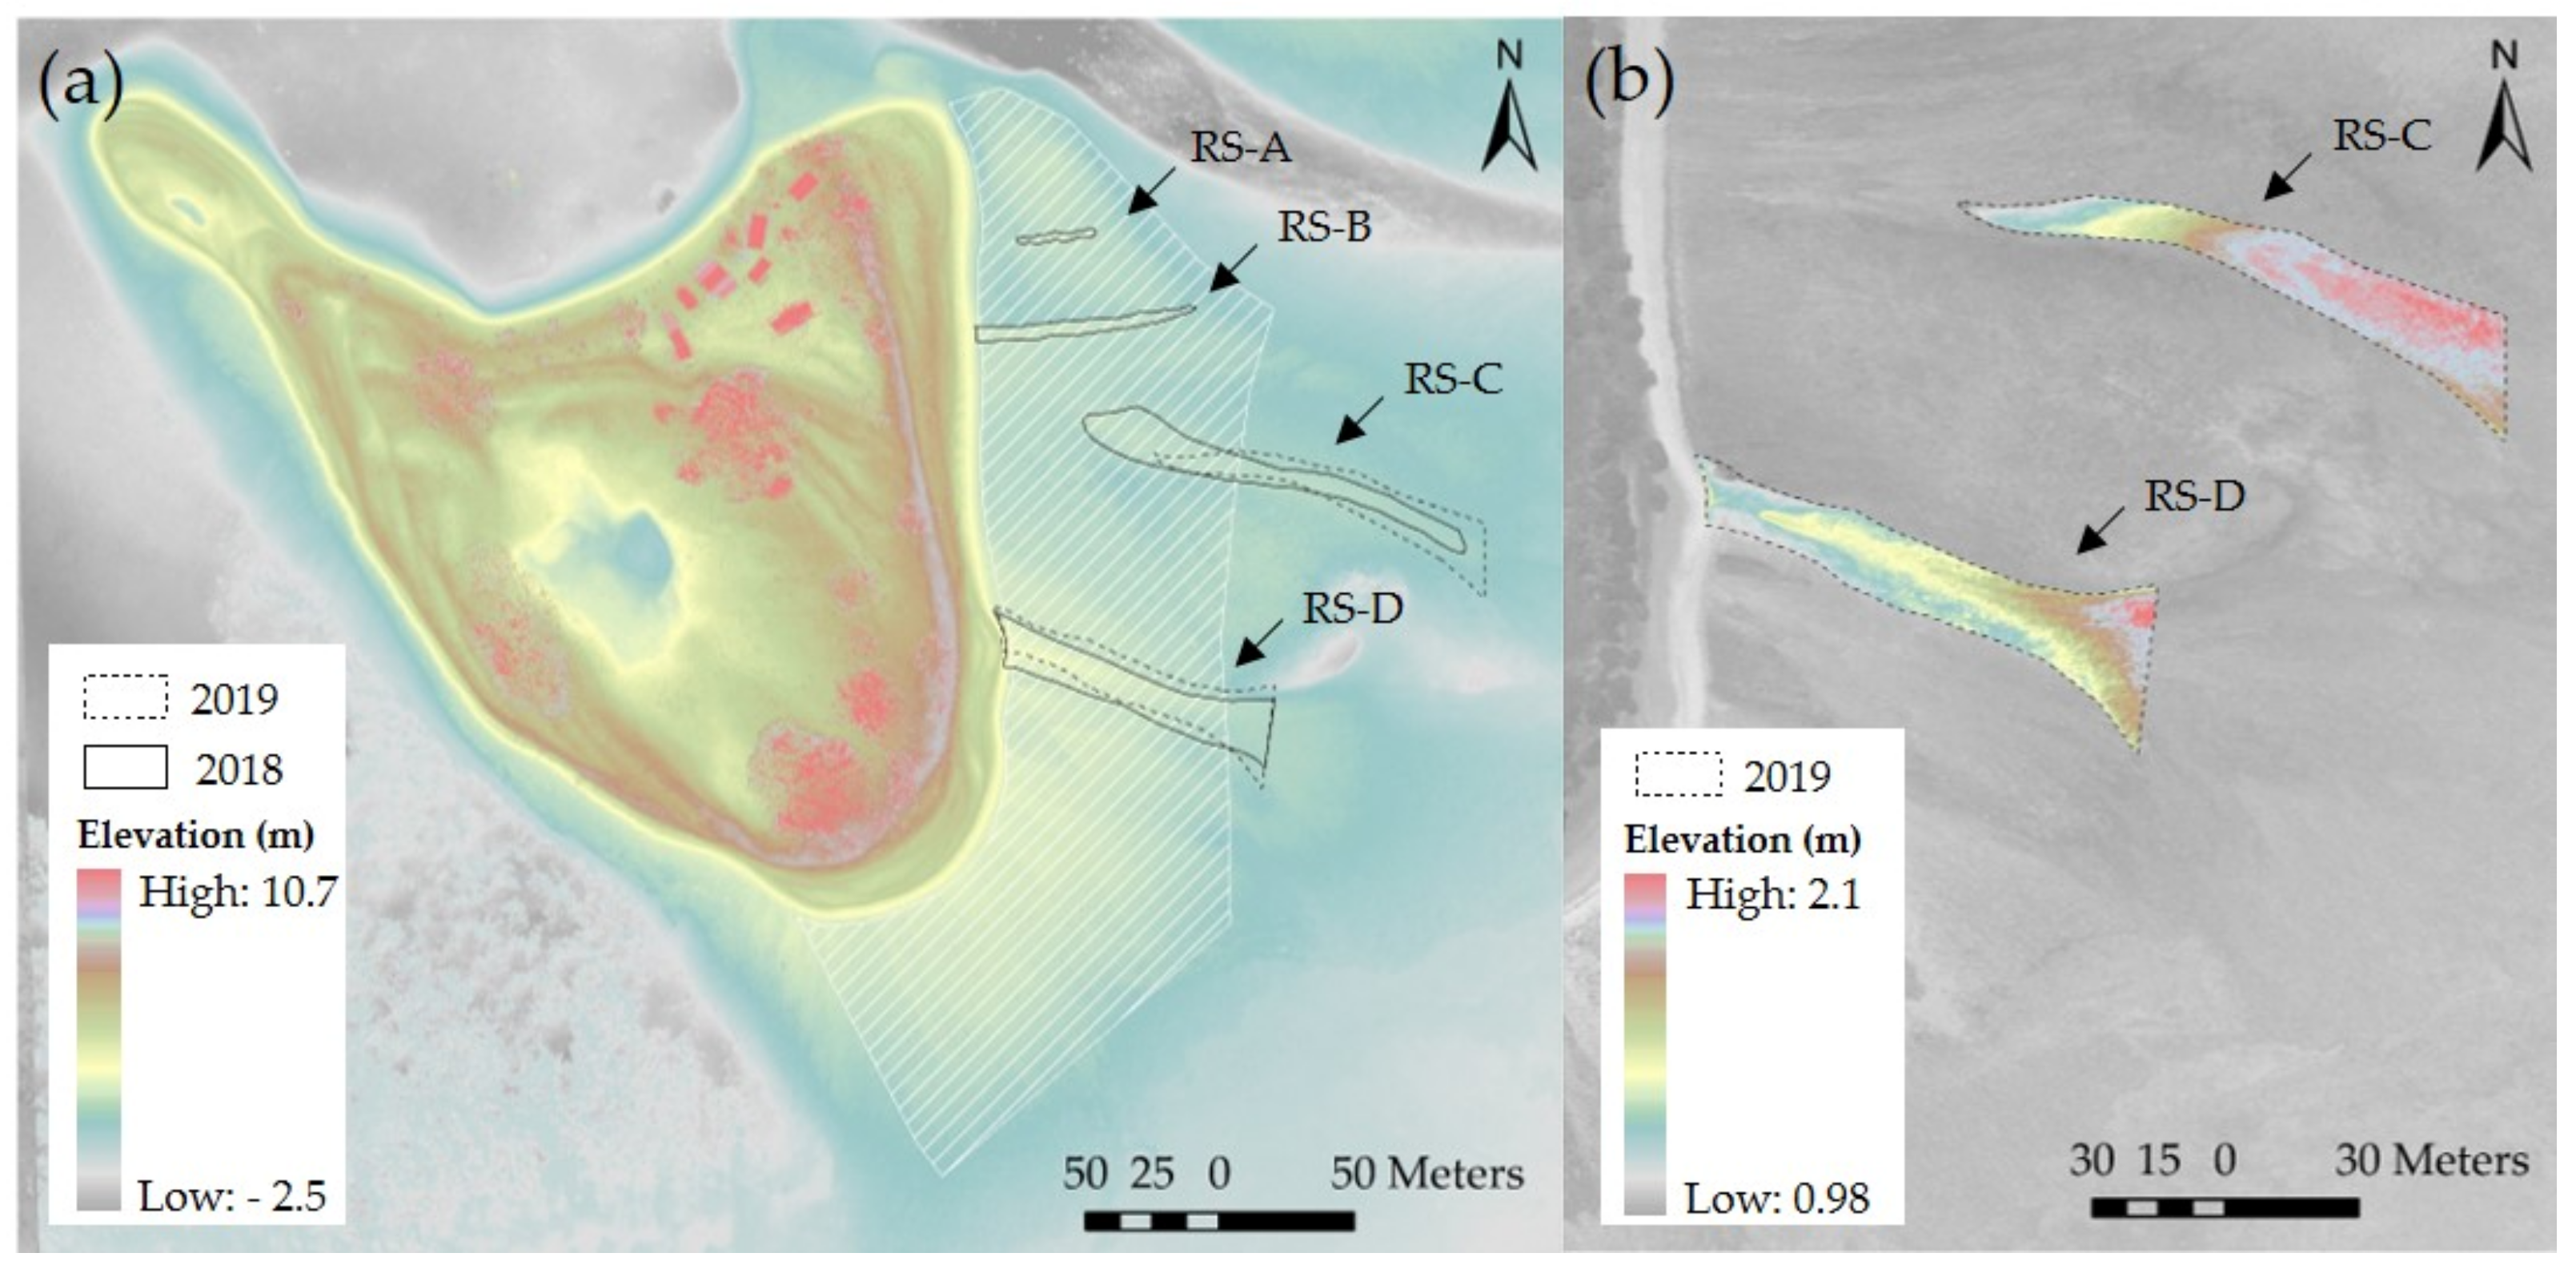
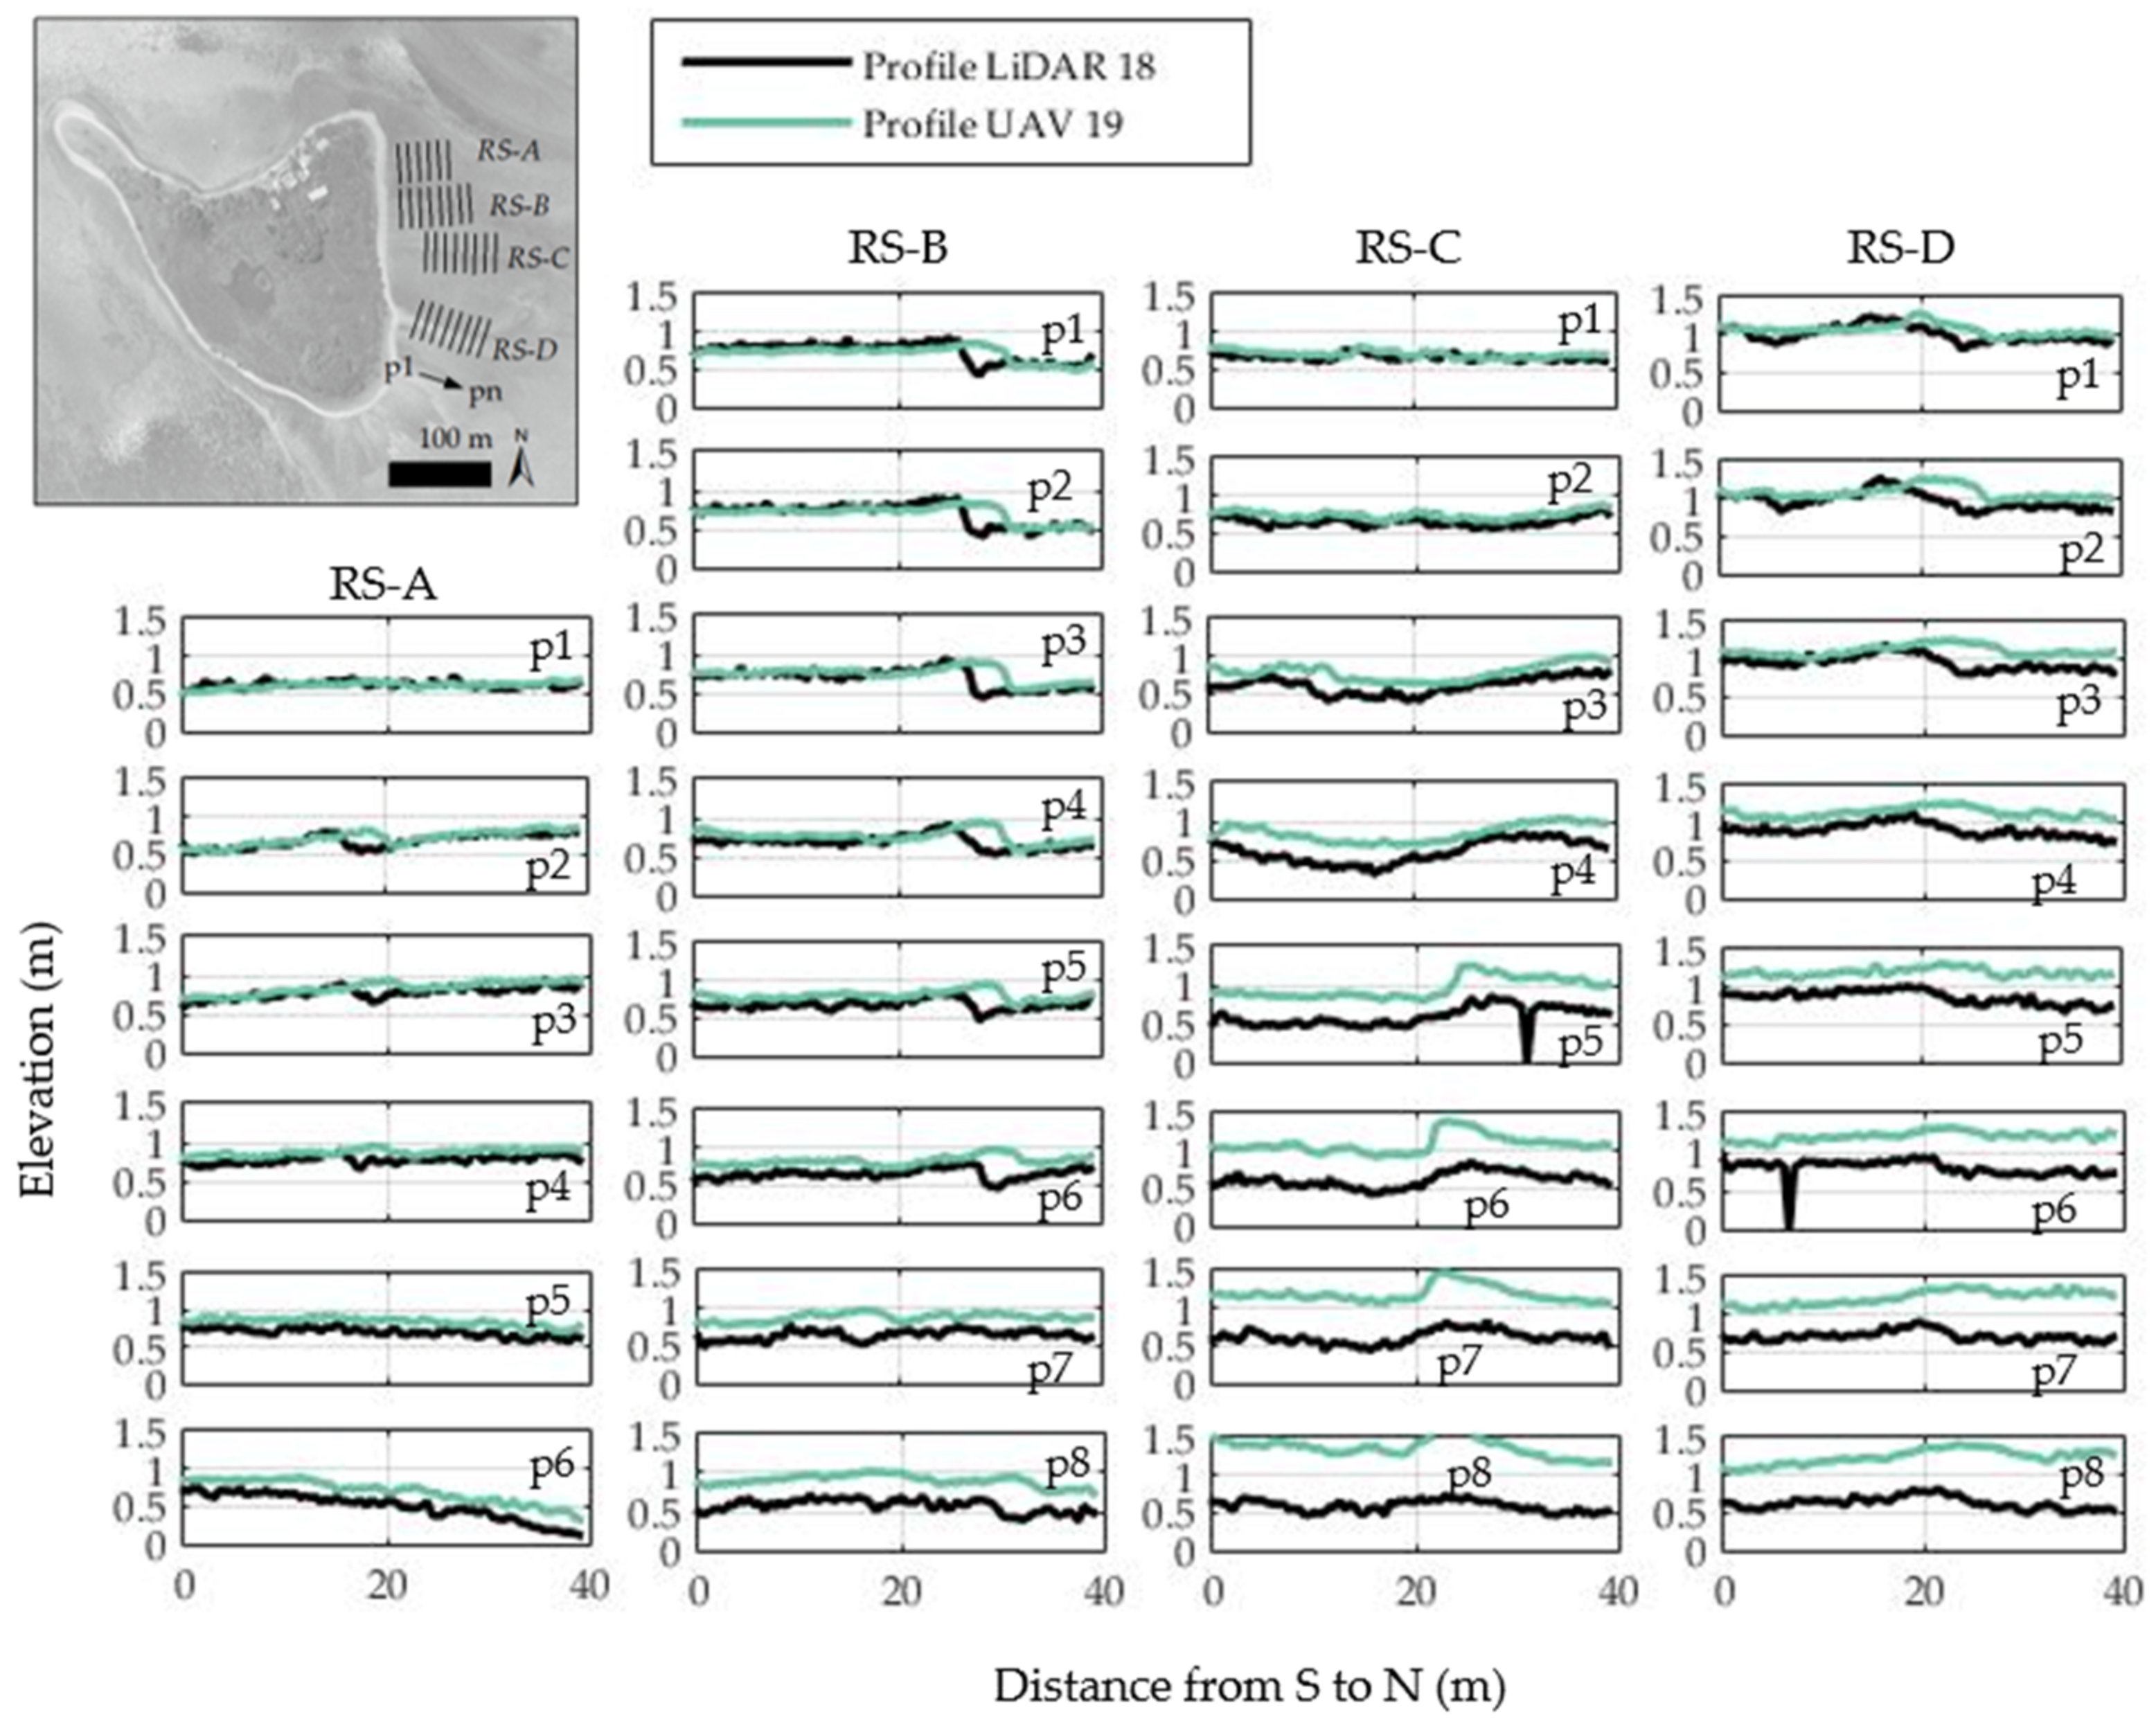
4.1.3. Featureless Rubble Sheets and Rubble Spits
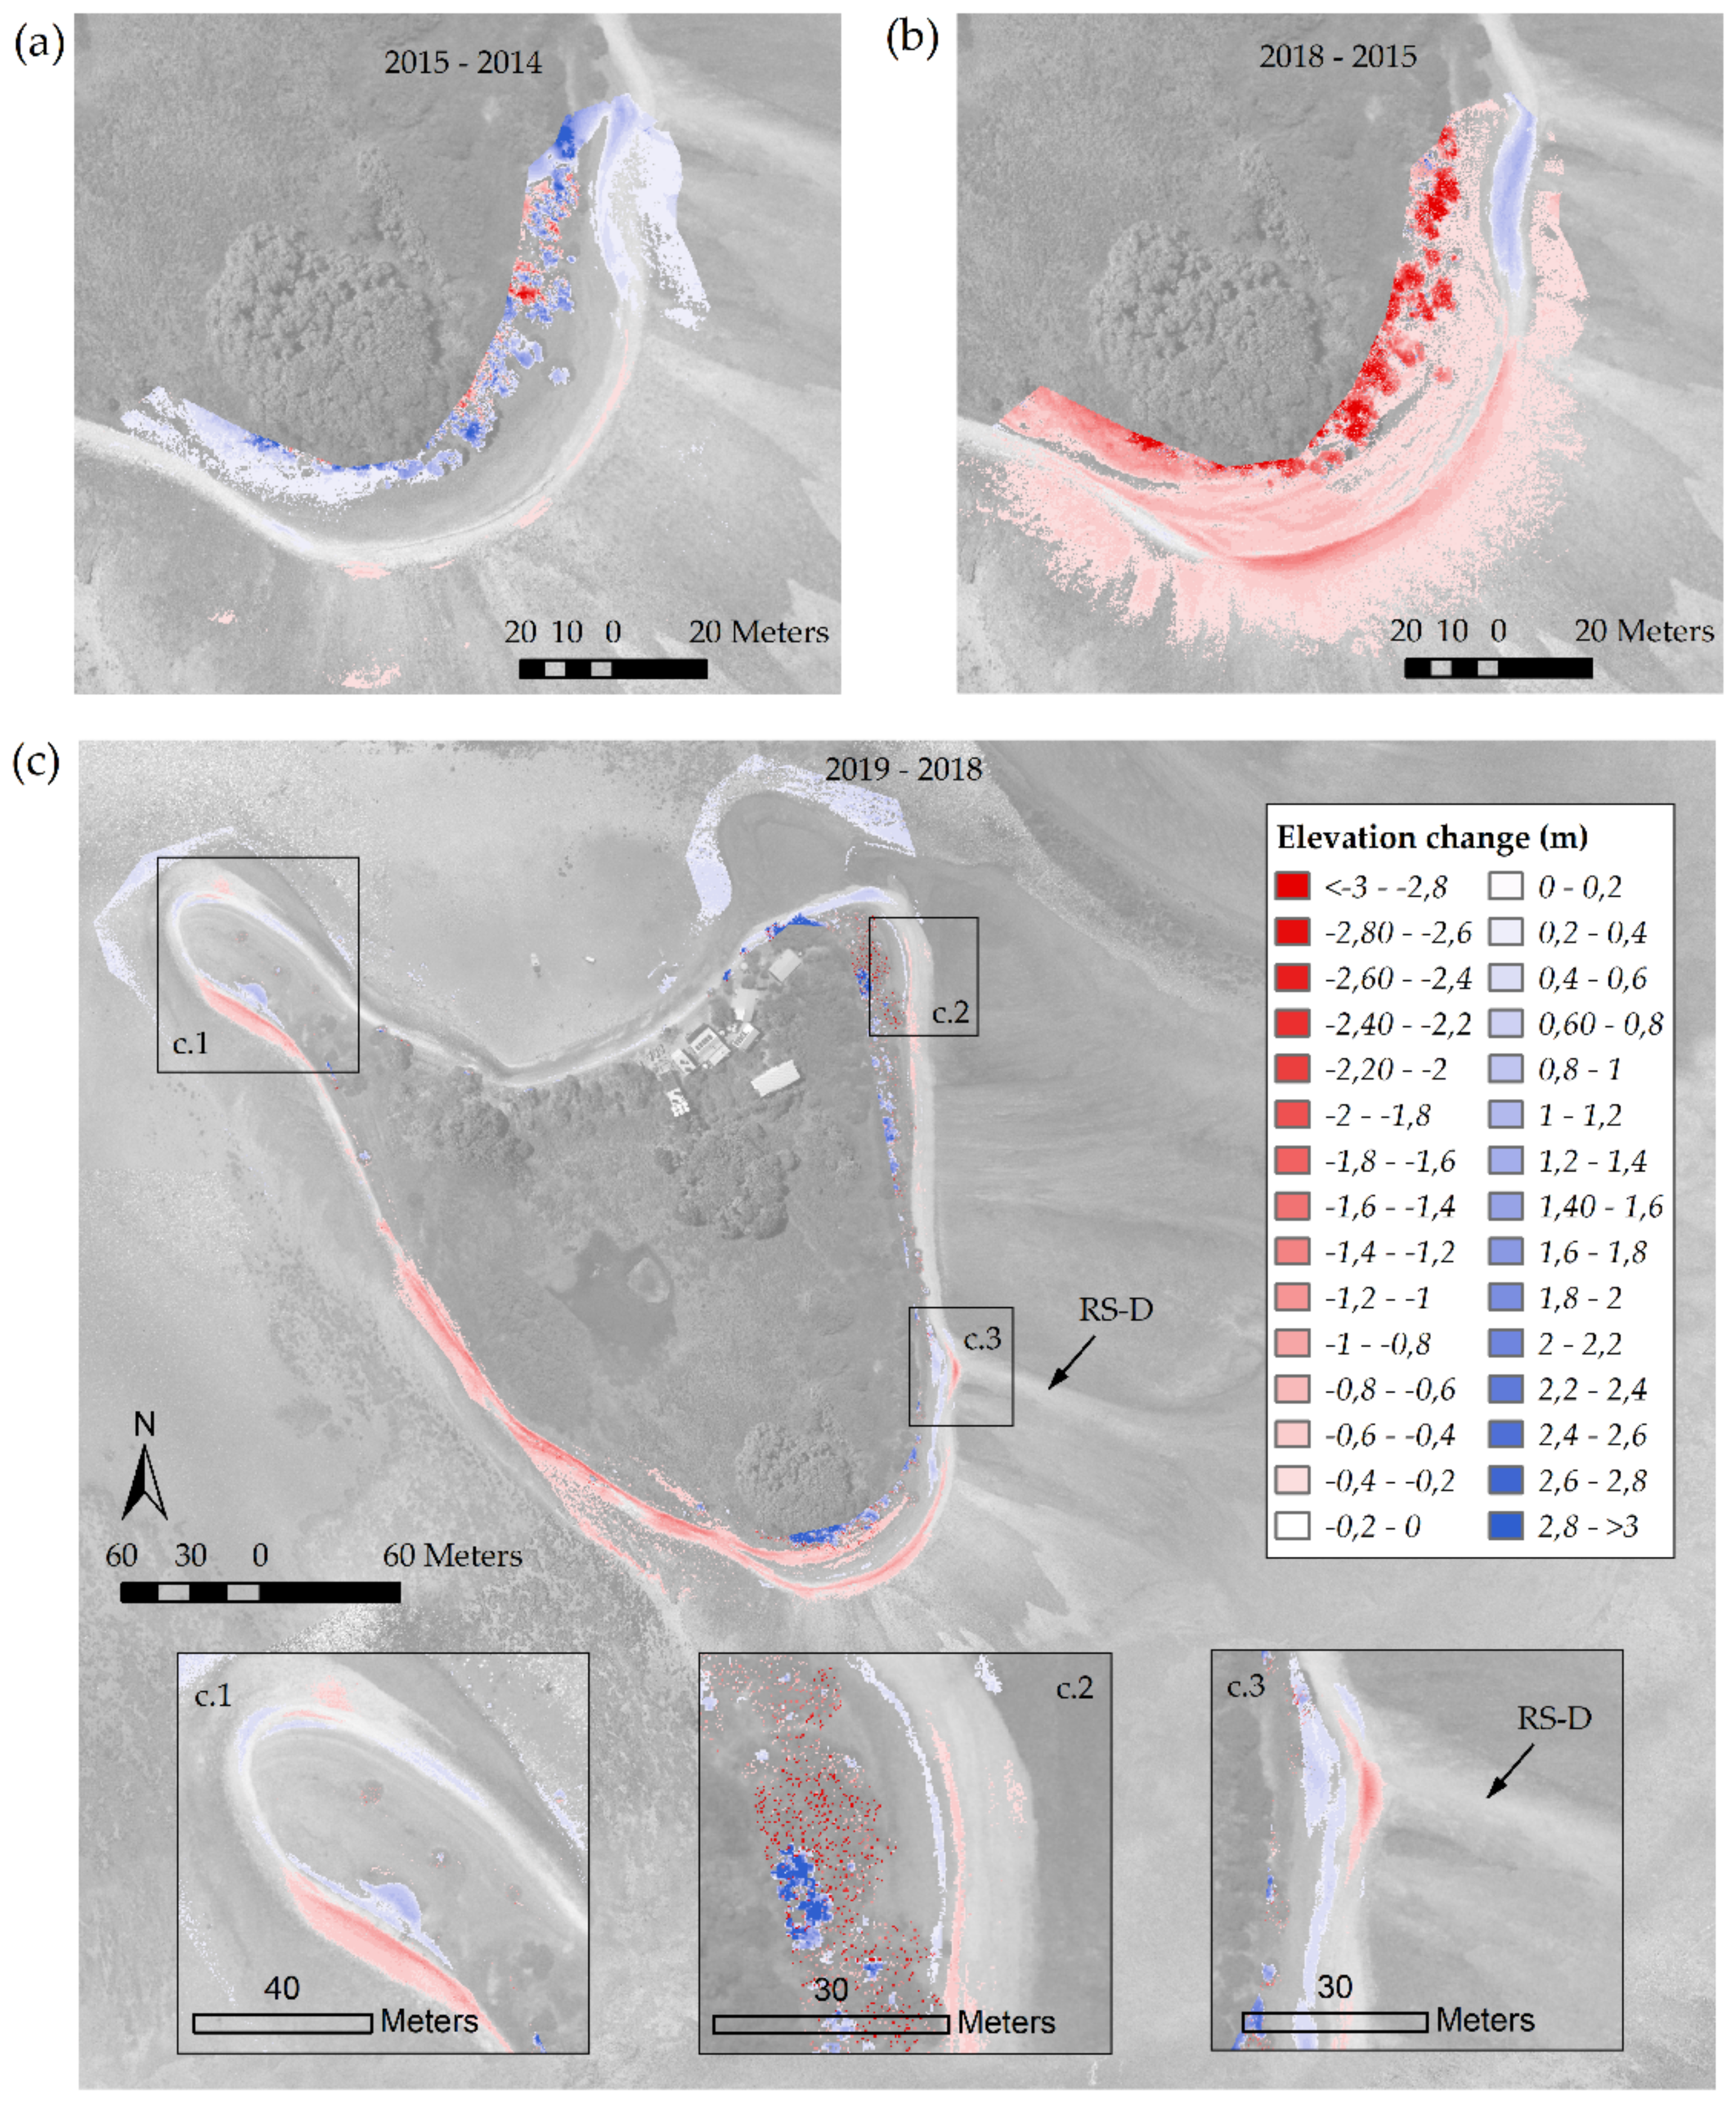
4.2. Short-Term Patterns of Rubble Erosion and Accretion
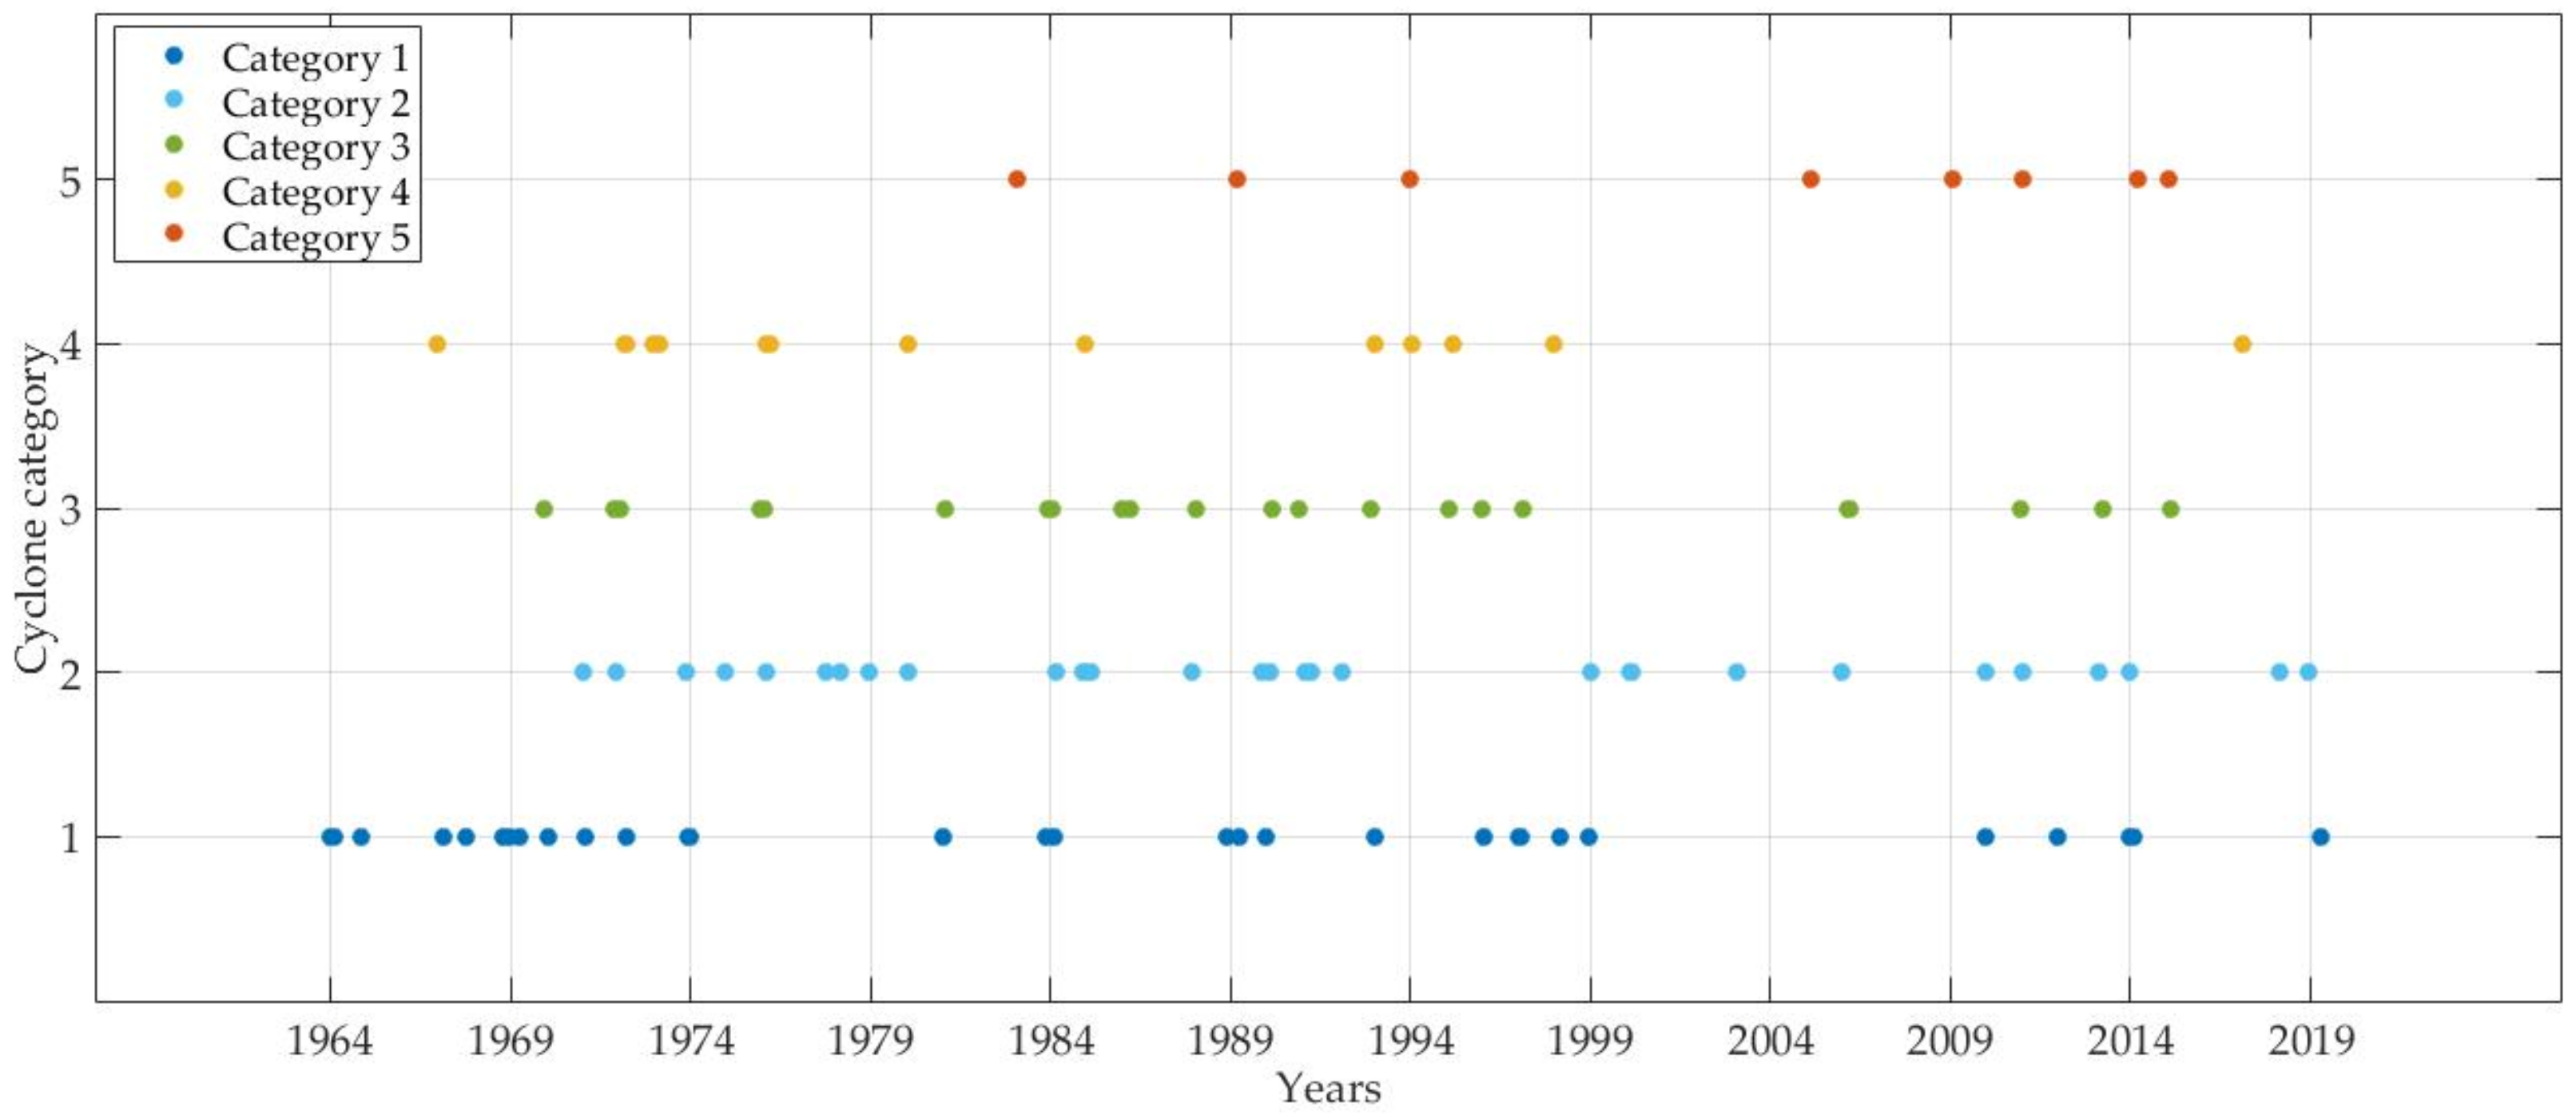
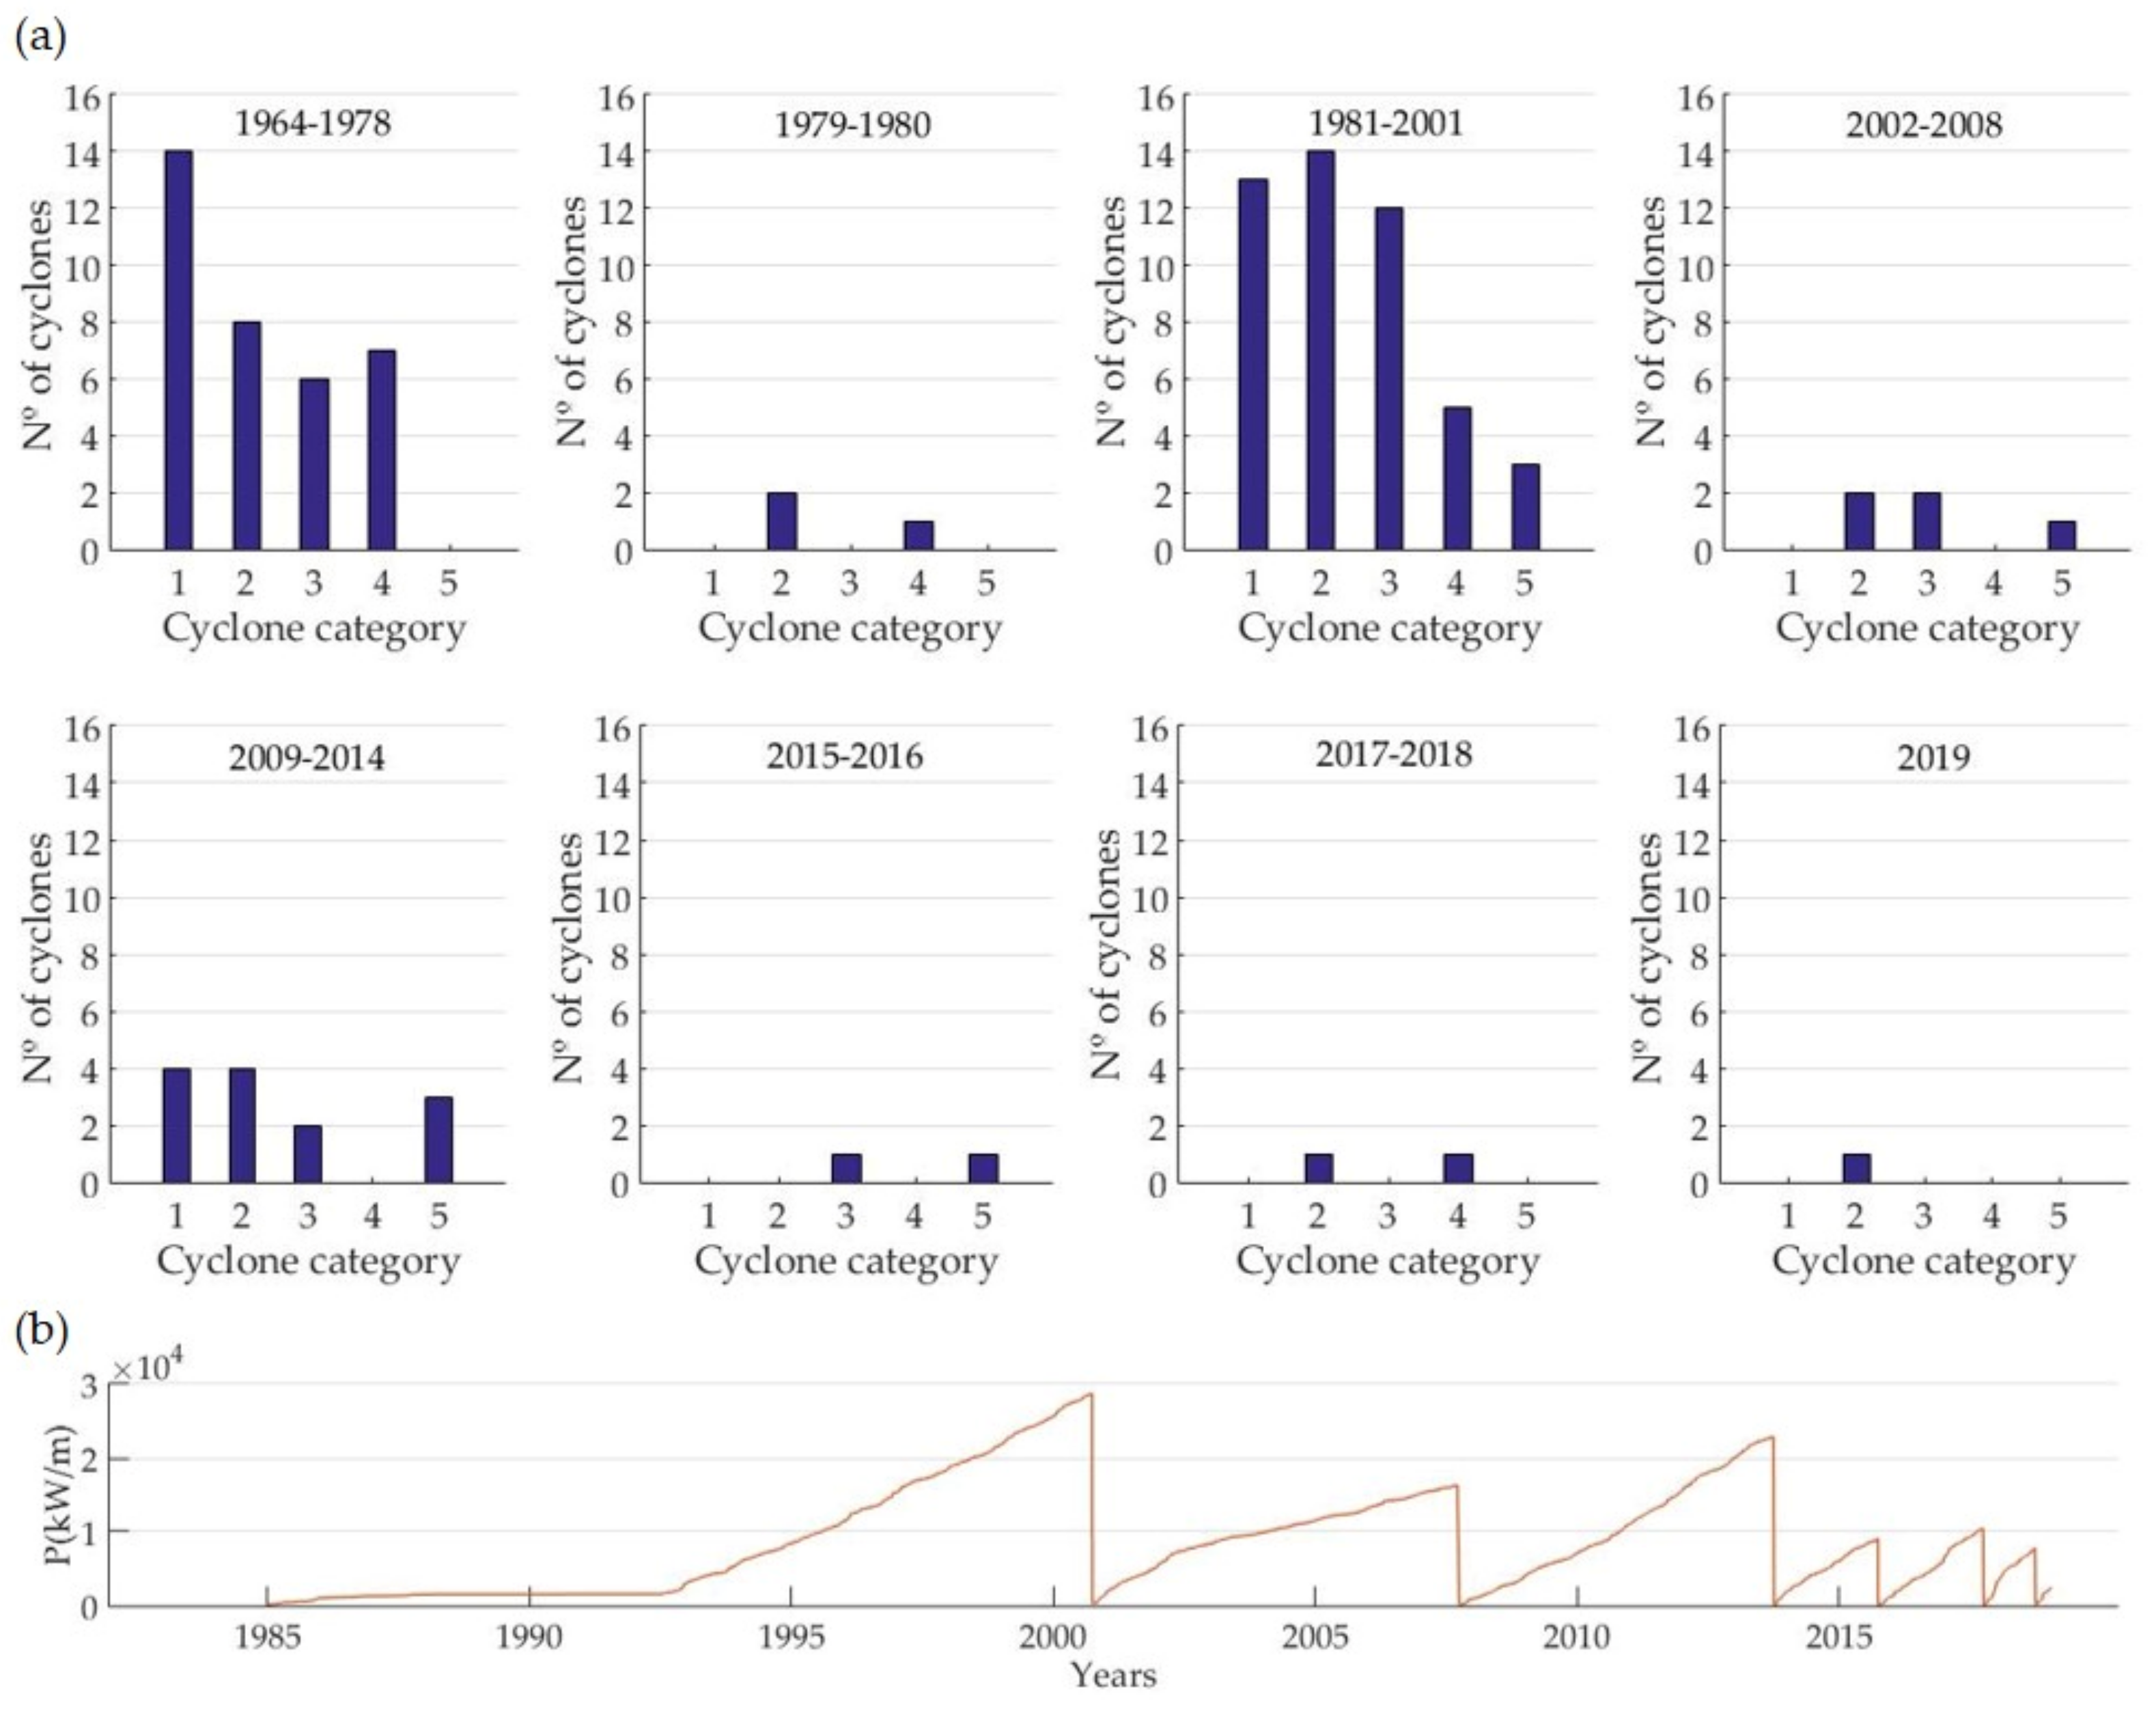
4.3. Cyclones and Wave Power in the CBG
5. Discussion
5.1. OTI Has Increased Its Size during the Past 41 Years
5.2. Oceanographic Controls of Rubble Island Evolution
5.3. The Role of Rubble Spits and Overtopping on the Short-Term Evolution of Rubble Islands
5.4. Effects of Climate Change on Rubble Island Evolution
6. Conclusions
- One Tree Island is a morphologically dynamic island that has been growing since its initial formation. It grew by 7% in a 41-year period (from 1978 to 2019) while experiencing substantial net planform changes. The styles of net planform change included ocean progradation of the southern shoreline, as well as both the NE and NW spits, although we identified even greater gross directional shifts and adjustments happening in different stages.
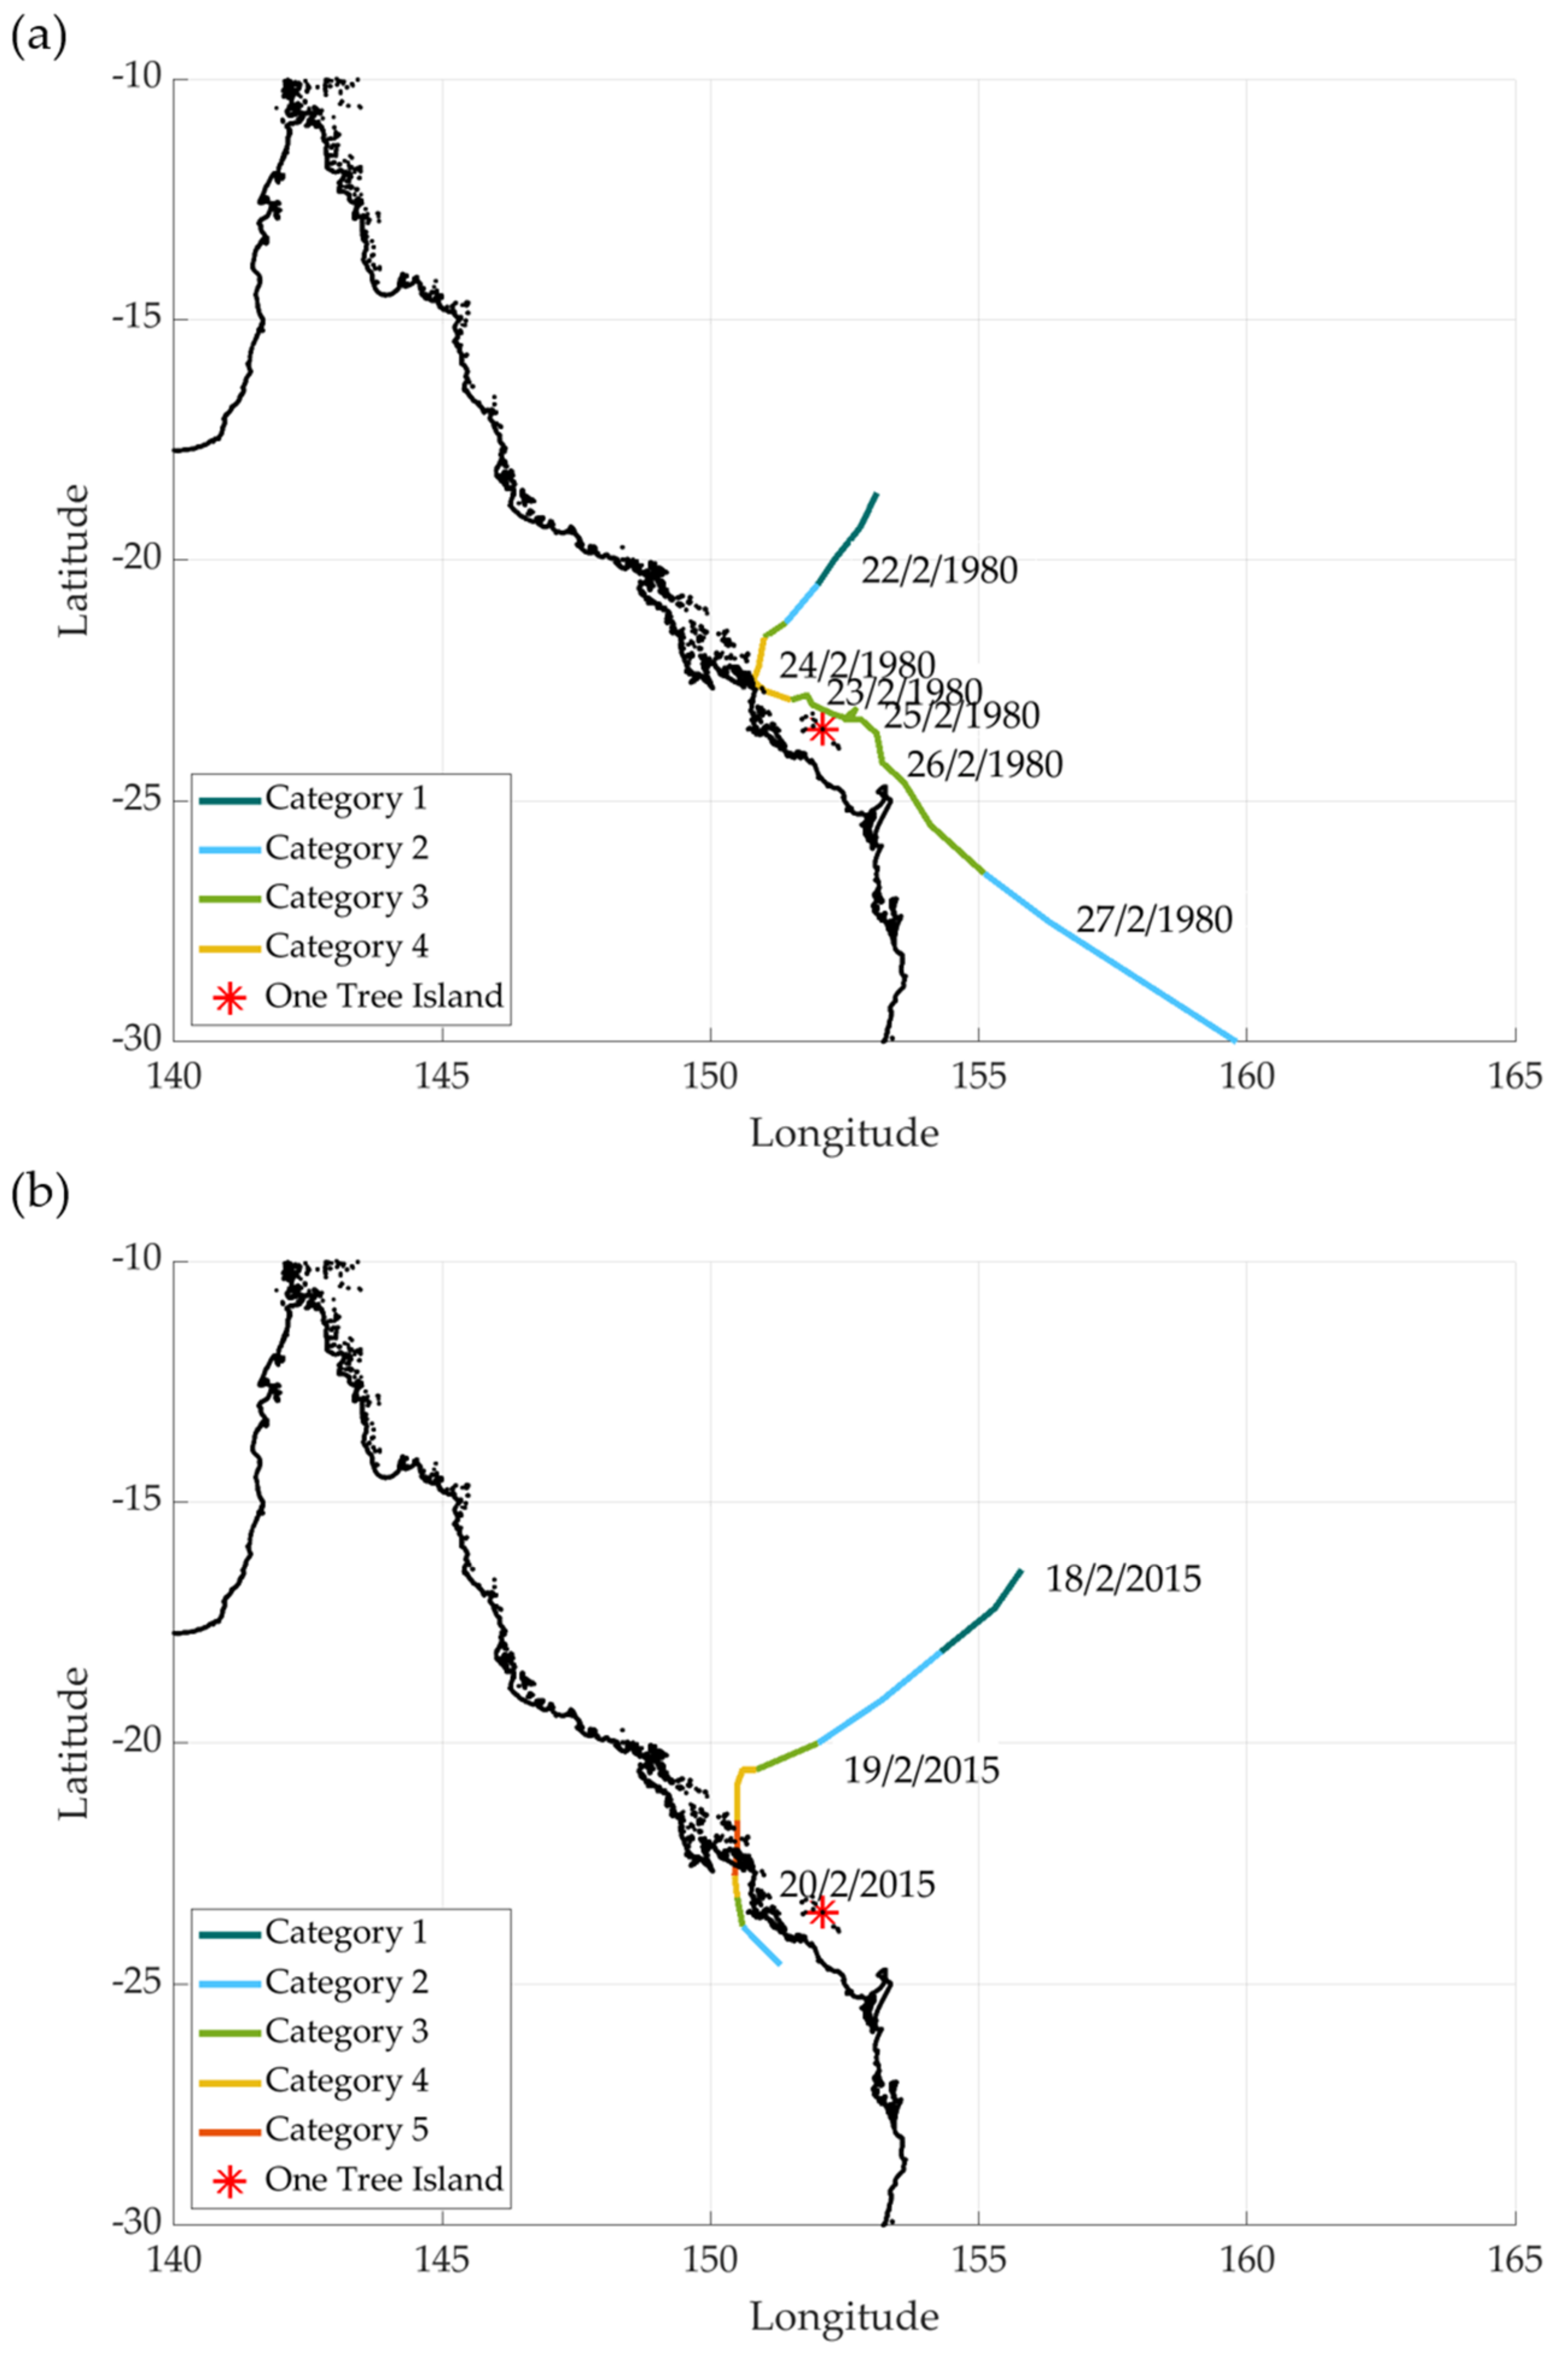
- Gross planform adjustments in rubble islands like One Tree are partly governed by the number and intensity of cyclones which in turn are influenced by the positive and negative ENSO phases as well as by their proximity and relative position to the island.
- Rubble spits play important roles in island growth. Our study identified two mechanisms: (1) rubble spit welding to the island followed by wave-driven longshore transport to feed other parts of the island; (2) in cases where one end of the rubble spit was connected to the island, there was some evidence of overtopping processes contributing to island growth in elevation. The contribution of overtopping to the evolution of rubble islands requires further research.
- Deciphering the future trajectory of rubble islands under a climate change scenario becomes a challenging task unless efforts are joined towards a complete understanding of the individual impacts of the controls involved on island change and evolution, which in turn will require more frequent quantitative island observations and monitoring. It is only building on that basis that we could better comprehend the impacts of those island controls combined, and the responses, in turn, may vary from island to island according to their own geological and ecological characteristics.
Supplementary Materials
Author Contributions
Funding
Institutional Review Board Statement
Informed Consent Statement
Data Availability Statement
Acknowledgments
Conflicts of Interest
References
- Yates, M.L.; Cozannet, G.L.; Garcin, M.; Salaï, E.; Walker, P. Multidecadal Atoll Shoreline Change on Manihi and Manuae, French Polynesia. J. Coast. Res. 2013, 29, 870–882. [Google Scholar] [CrossRef]
- Kayanne, H.; Aoki, K.; Suzuki, T.; Hongo, C.; Yamano, H.; Ide, Y.; Iwatsuka, Y.; Takahashi, K.; Katayama, H.; Sekimoto, T.; et al. Eco-geomorphic processes that maintain a small coral reef island: Ballast Island in the Ryukyu Islands, Japan. Geomorphology 2016, 271, 84–93. [Google Scholar] [CrossRef]
- Duvat, V.K.E. A global assessment of atoll island planform changes over the past decades. Wiley Interdiscip. Rev. Clim. Chang. 2019, 10, e557. [Google Scholar] [CrossRef] [Green Version]
- Ford, M. Shoreline changes interpreted from multi-temporal aerial photographs and high resolution satellite images: Wotje Atoll, Marshall Islands. Remote Sens. Environ. 2013, 135, 130–140. [Google Scholar] [CrossRef]
- Ford, M.R.; Kench, P.S. Multi-decadal shoreline changes in response to sea level rise in the Marshall Islands. Anthropocene 2015, 11, 14–24. [Google Scholar] [CrossRef] [Green Version]
- Albert, S.; Leon, J.X.; Grinham, A.R.; Church, J.A.; Gibbes, B.R.; Woodroffe, C.D. Interactions between sea-level rise and wave exposure on reef island dynamics in the Solomon Islands. Environ. Res. Lett. 2016, 11. [Google Scholar] [CrossRef]
- Vila-Concejo, A.; Harris, D.L.; Shannon, A.M.; Webster, J.M.; Power, H.E. Coral reef sediment dynamics: Evidence of sand-apron evolution on a daily and decadal scale. J. Coast. Res. 2013, 65, 606–611. [Google Scholar] [CrossRef]
- Isaack, A.; Gischler, E. The significance of sand aprons in Holocene atolls and carbonate platforms. Carbonates Evaporites 2017, 32, 13–25. [Google Scholar] [CrossRef]
- Shannon, A.M.; Power, H.E.; Webster, J.M.; Vila-Concejo, A. Evolution of coral rubble deposits on a reef platform as detected by remote sensing. Remote Sens. 2013, 5, 1–18. [Google Scholar] [CrossRef] [Green Version]
- Dawson, J.L.; Smithers, S.G. Shoreline and beach volume change between 1967 and 2007 at Raine Island, Great Barrier Reef, Australia. Glob. Planet. Chang. 2010, 72, 141–154. [Google Scholar] [CrossRef]
- Kench, P.S.; Brander, R.W. Response of reef island shorelines to seasonal climate oscillations: South Maalhosmadulu atoll, Maldives. J. Geophys. Res. Earth Surf. 2006, 111. [Google Scholar] [CrossRef]
- Hamylton, S. Will coral islands maintain their growth over the next century? A deterministic model of sediment availability at Lady Elliot Island, Great Barrier Reef. PLoS ONE 2014, 9, e94067. [Google Scholar] [CrossRef] [Green Version]
- Scoffin, T.P. Reef aerial photography from a kite. Coral Reefs 1982, 1, 67–69. [Google Scholar] [CrossRef]
- Bryson, M.; Duce, S.; Harris, D.; Webster, J.M.; Thompson, A.; Vila-Concejo, A.; Williams, S.B. Geomorphic changes of a coral shingle cay measured using Kite Aerial Photography. Geomorphology 2016, 270, 1–8. [Google Scholar] [CrossRef]
- Hamylton, S.M. Mapping coral reef environments: A review of historical methods, recent advances and future opportunities. Prog. Phys. Geogr. 2017, 41, 803–833. [Google Scholar] [CrossRef]
- Joyce, K.E.; Duce, S.; Leahy, S.M.; Leon, J.; Maier, S.W. Principles and practice of acquiring drone-based image data in marine environments. Mar. Freshw. Res. 2019, 70, 952–963. [Google Scholar] [CrossRef]
- Hamylton, S.M.; McLean, R.; Lowe, M.; Adnan, F.A.F. Ninety years of change on a low wooded island, Great Barrier Reef. R. Soc. Open Sci. 2019, 6, 181314. [Google Scholar] [CrossRef] [Green Version]
- Murfitt, S.L.; Allan, B.M.; Bellgrove, A.; Rattray, A.; Young, M.A.; Ierodiaconou, D. Applications of unmanned aerial vehicles in intertidal reef monitoring. Sci. Rep. 2017, 7, 1–11. [Google Scholar] [CrossRef] [Green Version]
- Fallati, L.; Saponari, L.; Savini, A.; Marchese, F.; Corselli, C.; Galli, P. Multi-Temporal UAV Data and object-based image analysis (OBIA) for estimation of substrate changes in a post-bleaching scenario on a maldivian reef. Remote Sens. 2020, 12, 2093. [Google Scholar] [CrossRef]
- Casella, E.; Collin, A.; Harris, D.; Ferse, S.; Bejarano, S.; Parravicini, V.; Hench, J.L.; Rovere, A. Mapping coral reefs using consumer-grade drones and structure from motion photogrammetry techniques. Coral Reefs 2017, 36, 269–275. [Google Scholar] [CrossRef]
- Vila-Concejo, A.; Kench, P.S. Storms in coral reefs. In Coastal Storms: Processes and Impacts; Ciavola, P., Coco, G., Eds.; John Wiley and Sons: Hoboken, NJ, USA, 2017; pp. 127–144. ISBN 1118937082/9781118937082. [Google Scholar]
- Duce, S.; Vila-Concejo, A.; Hamylton, S.; Bruce, E.; Webster, J.M. Spur and groove distribution, morphology and relationship to relative wave exposure, Southern Great Barrier Reef, Australia. J. Coast. Res. 2014, 70, 115–120. [Google Scholar] [CrossRef]
- Munk, W.H.; Sargent, M.C. Adjustment of Bikini Atoll to Ocean Waves; US Government Printing Office: Washington, DC, USA, 1954.
- Duce, S.; Vila-Concejo, A.; Hamylton, S.M.; Webster, J.M.; Bruce, E.; Beaman, R.J. A morphometric assessment and classification of coral reef spur and groove morphology. Geomorphology 2016, 265, 68–83. [Google Scholar] [CrossRef]
- Harris, D.L.; Vila-Concejo, A.; Webster, J.M. Geomorphology and sediment transport on a submerged back-reef sand apron: One Tree Reef, Great Barrier Reef. Geomorphology 2014, 222, 132–142. [Google Scholar] [CrossRef]
- Harris, D.L.; Power, H.E.; Kinsela, M.A.; Webster, J.M.; Vila-Concejo, A. Variability of depth-limited waves in coral reef surf zones. Estuar. Coast. Shelf Sci. 2018, 211, 36–44. [Google Scholar] [CrossRef] [Green Version]
- Scoffin, T.P. The geological effects of hurricanes on coral reefs and the interpretation of storm deposits. Coral Reefs 1993, 12, 203–221. [Google Scholar] [CrossRef]
- Thornborough, K.J.; Davies, P.J. Reef flats. In Encyclopedia of Modern Coral Reefs; Hopley, D., Ed.; Springer: Dordrecht, The Netherlands, 2011; pp. 869–876. ISBN 978-90-481-2639-2. [Google Scholar]
- Wheaton, J.M.; Brasington, J.; Darby, S.E.; Sear, D.A. Accounting for uncertainty in DEMs from repeat topographic surveys: Improved sediment budgets. Earth Surf. Process. Landf. J. Br. Geomorphol. Res. Gr. 2010, 35, 136–156. [Google Scholar] [CrossRef]
- Smith, C.; Salles, T.; Vila-Concejo, A. RADWave: Python code for ocean surface wave analysis by satellite radar altimeter. J. Open Source Softw. 2020, 5, 2083. [Google Scholar] [CrossRef]
- Webb, A.P.; Kench, P.S. The dynamic response of reef islands to sea-level rise: Evidence from multi-decadal analysis of island change in the Central Pacific. Glob. Planet. Chang. 2010, 72, 234–246. [Google Scholar] [CrossRef]
- Kench, P.S.; Thompson, D.; Ford, M.R.; Ogawa, H.; McLean, R.F. Coral islands defy sea-level rise over the past century: Records from a central Pacific atoll. Geology 2015, 43, 515–518. [Google Scholar] [CrossRef]
- Kench, P.S.; Ford, M.R.; Owen, S.D. Patterns of island change and persistence offer alternate adaptation pathways for atoll nations. Nat. Commun. 2018, 9, 605. [Google Scholar] [CrossRef] [Green Version]
- East, H.K.; Perry, C.T.; Beetham, E.P.; Kench, P.S.; Liang, Y. Modelling reef hydrodynamics and sediment mobility under sea level rise in atoll reef island systems. Glob. Planet. Chang. 2020, 192, 103196. [Google Scholar] [CrossRef]
- Stoddart, D.R.; Fosberg, F.R.; Spellman, D.L. Cays of the Belize barrier reef and lagoon. Atoll Res. Bull. 1982, 256, 1–73. [Google Scholar] [CrossRef] [Green Version]
- Kench, P.S.; Chan, J.; Owen, S.D.; McLean, R.F. The geomorphology, development and temporal dynamics of Tepuka Island, Funafuti atoll, Tuvalu. Geomorphology 2014, 222, 46–58. [Google Scholar] [CrossRef]
- Woolsey, E.; Bainbridge, S.J.; Kingsford, M.J.; Byrne, M. Impacts of cyclone Hamish at One Tree Reef: Integrating environmental and benthic habitat data. Mar. Biol. 2012, 159, 793–803. [Google Scholar] [CrossRef]
- Solomon, S.M.; Forbes, D.L. Coastal hazards and associated management issues on South Pacific Islands. Ocean Coast. Manag. 1999, 42, 523–554. [Google Scholar] [CrossRef]
- Rankey, E.C. Nature and stability of atoll island shorelines: Gilbert Island chain, Kiribati, equatorial Pacific. Sedimentology 2011, 58, 1831–1859. [Google Scholar] [CrossRef]
- Matias, A.; Williams, J.J.; Masselink, G.; Ferreira, Ó. Overwash threshold for gravel barriers. Coast. Eng. 2012, 63, 48–61. [Google Scholar] [CrossRef]
- Masselink, G.; Beetham, E.; Kench, P. Coral reef islands can accrete vertically in response to sea level rise. Sci. Adv. 2020, 6, eaay3656. [Google Scholar] [CrossRef]
- Storlazzi, C.D.; Elias, E.P.L.; Berkowitz, P. Many atolls may be uninhabitable within decades due to climate change. Sci. Rep. 2015, 5, 1–9. [Google Scholar] [CrossRef] [Green Version]
- Kench, P.S.; Mann, T. Reef island evolution and dynamics: Insights from the Indian and Pacific oceans and perspectives for the Spermonde archipelago. Front. Mar. Sci. 2017, 4, 145. [Google Scholar] [CrossRef] [Green Version]
- Knutson, T.R.; McBride, J.L.; Chan, J.; Emanuel, K.; Holland, G.; Landsea, C.; Held, I.; Kossin, J.P.; Srivastava, A.K.; Sugi, M. Tropical cyclones and climate change. Nat. Geosci. 2010, 3, 157–163. [Google Scholar] [CrossRef] [Green Version]
- Perry, C.T.; Kench, P.S.; Smithers, S.G.; Riegl, B.; Yamano, H.; O’Leary, M.J. Implications of reef ecosystem change for the stability and maintenance of coral reef islands. Glob. Chang. Biol. 2011, 17, 3679–3696. [Google Scholar] [CrossRef]
- Liu, J.; Huang, R.; Yu, K.; Zou, B. How lime-sand islands in the South China Sea have responded to global warming over the last 30 years: Evidence from satellite remote sensing images. Geomorphology 2020, 371, 107423. [Google Scholar] [CrossRef]
- Hughes, T.P.; Kerry, J.T.; Álvarez-Noriega, M.; Álvarez-Romero, J.G.; Anderson, K.D.; Baird, A.H.; Babcock, R.C.; Beger, M.; Bellwood, D.R.; Berkelmans, R.; et al. Global warming and recurrent mass bleaching of corals. Nature 2017, 543, 373–377. [Google Scholar] [CrossRef] [PubMed]


| Year | Month | Method (Sensor) | Resolution (m) |
|---|---|---|---|
| 1964 | June | AP | 1.4 |
| 1978 | June | AP | 0.15 |
| 1980 | September | AP | 0.5 |
| 2001 | April | SI (IKONOS 2) | 4 |
| 2009 | December | SI (WorldView 2) | 0.5 |
| 2014 | February | KAP (16 Mpx Sony NEX-5N) | 0.005 |
| 2015 | April | KAP (16 Mpx Sony NEX-5N) | 0.20 |
| 2018 | October | Li (Canon EOS 5Dmk4 DSLR, Riegl VQ-820-G, and Riegl Q680-iS) | 0.12 |
| 2019 | April | RPA (DJI Phantom 4 Pro onboard 20 Mpx camera)/RTK | 0.02 |
| Dataset | Area (km2) | RMSE (m) | Nº ICPs |
|---|---|---|---|
| 2014 KAP | 0.04 | 0.20 | 332 |
| 2015 KAP | 0.03 | 0.10 | 221 |
| 2018 LiDAR | 0.35 | 0.25 | 2035 |
| 2019 RPA | 16.67 | 0.20 | 671 |
| Year | Decadal Analyses | High-Resolution and Short-Term Analyses | |||||
|---|---|---|---|---|---|---|---|
| Island | Rubble Spits | Rubble Spits | Rubble Erosion/Accretion | ||||
| Shoreline Dynamics | Vegetated Core Areal Changes | Presence/Absence and Location | Dimensions | Dynamics | Southern Shoreline | Complete Shoreline | |
| 1964 | o | o | |||||
| 1978 | o | o | o | ||||
| 1980 | o | o | o | ||||
| 2001 | o | o | |||||
| 2008 | o | ||||||
| 2009 | o | o | |||||
| 2011 | o | ||||||
| 2014 | o | o | o | ||||
| 2015 | o | ||||||
| 2016 | o | ||||||
| 2018 | o | o | o | o | o | o | o |
| 2019 | o | o | o | o | o | o | o |
| Year | Area (m2) |
|---|---|
| 1978 | 38,218 |
| 1980 | 37,207 |
| 2009 | 40,068 |
| 2018 | 43,035 |
| 2019 | 40,974 |
| 2018 | 2019 | |||||||
|---|---|---|---|---|---|---|---|---|
| RS | A | B | C | D | A | B | C | D |
| Volume (m3) | 12.9 | 58.5 | 81.1 | 383.6 | 6.2 | 22.1 | 102.0 * | 509.8 * |
| Area 2D (m2) | 67.6 | 336.6 | 1035.6 | 1336.0 | 63.3 | 232.9 | 1538.8 | 1758.8 |
| Area 3D (m2) | 68.7 | 343.6 | 1056.1 | 1360.6 | 63.4 | 233.5 | 196.4 * | 1283.5 * |
Publisher’s Note: MDPI stays neutral with regard to jurisdictional claims in published maps and institutional affiliations. |
© 2021 by the authors. Licensee MDPI, Basel, Switzerland. This article is an open access article distributed under the terms and conditions of the Creative Commons Attribution (CC BY) license (https://creativecommons.org/licenses/by/4.0/).
Share and Cite
Talavera, L.; Vila-Concejo, A.; Webster, J.M.; Smith, C.; Duce, S.; Fellowes, T.E.; Salles, T.; Harris, D.; Hill, J.; Figueira, W.; et al. Morphodynamic Controls for Growth and Evolution of a Rubble Coral Island. Remote Sens. 2021, 13, 1582. https://0-doi-org.brum.beds.ac.uk/10.3390/rs13081582
Talavera L, Vila-Concejo A, Webster JM, Smith C, Duce S, Fellowes TE, Salles T, Harris D, Hill J, Figueira W, et al. Morphodynamic Controls for Growth and Evolution of a Rubble Coral Island. Remote Sensing. 2021; 13(8):1582. https://0-doi-org.brum.beds.ac.uk/10.3390/rs13081582
Chicago/Turabian StyleTalavera, Lara, Ana Vila-Concejo, Jody M. Webster, Courtney Smith, Stephanie Duce, Thomas E. Fellowes, Tristan Salles, Daniel Harris, Jon Hill, Will Figueira, and et al. 2021. "Morphodynamic Controls for Growth and Evolution of a Rubble Coral Island" Remote Sensing 13, no. 8: 1582. https://0-doi-org.brum.beds.ac.uk/10.3390/rs13081582