
The Response of Cloud-Precipitation Recycling in China to Global Warming


1
Key Laboratory of Semi-Arid Climate Changes with the Ministry of Education, College of Atmospheric Sciences, Lanzhou University, Lanzhou 730000, China
2
Collaborative Innovation Center for Western Ecological Safety, Lanzhou University, Lanzhou 730000, China
*
Author to whom correspondence should be addressed.
Remote Sens. 2021, 13(8), 1601; https://0-doi-org.brum.beds.ac.uk/10.3390/rs13081601
Submission received: 27 February 2021
/
Revised: 16 April 2021
/
Accepted: 17 April 2021
/
Published: 20 April 2021
(This article belongs to the Section Atmospheric Remote Sensing)
Abstract
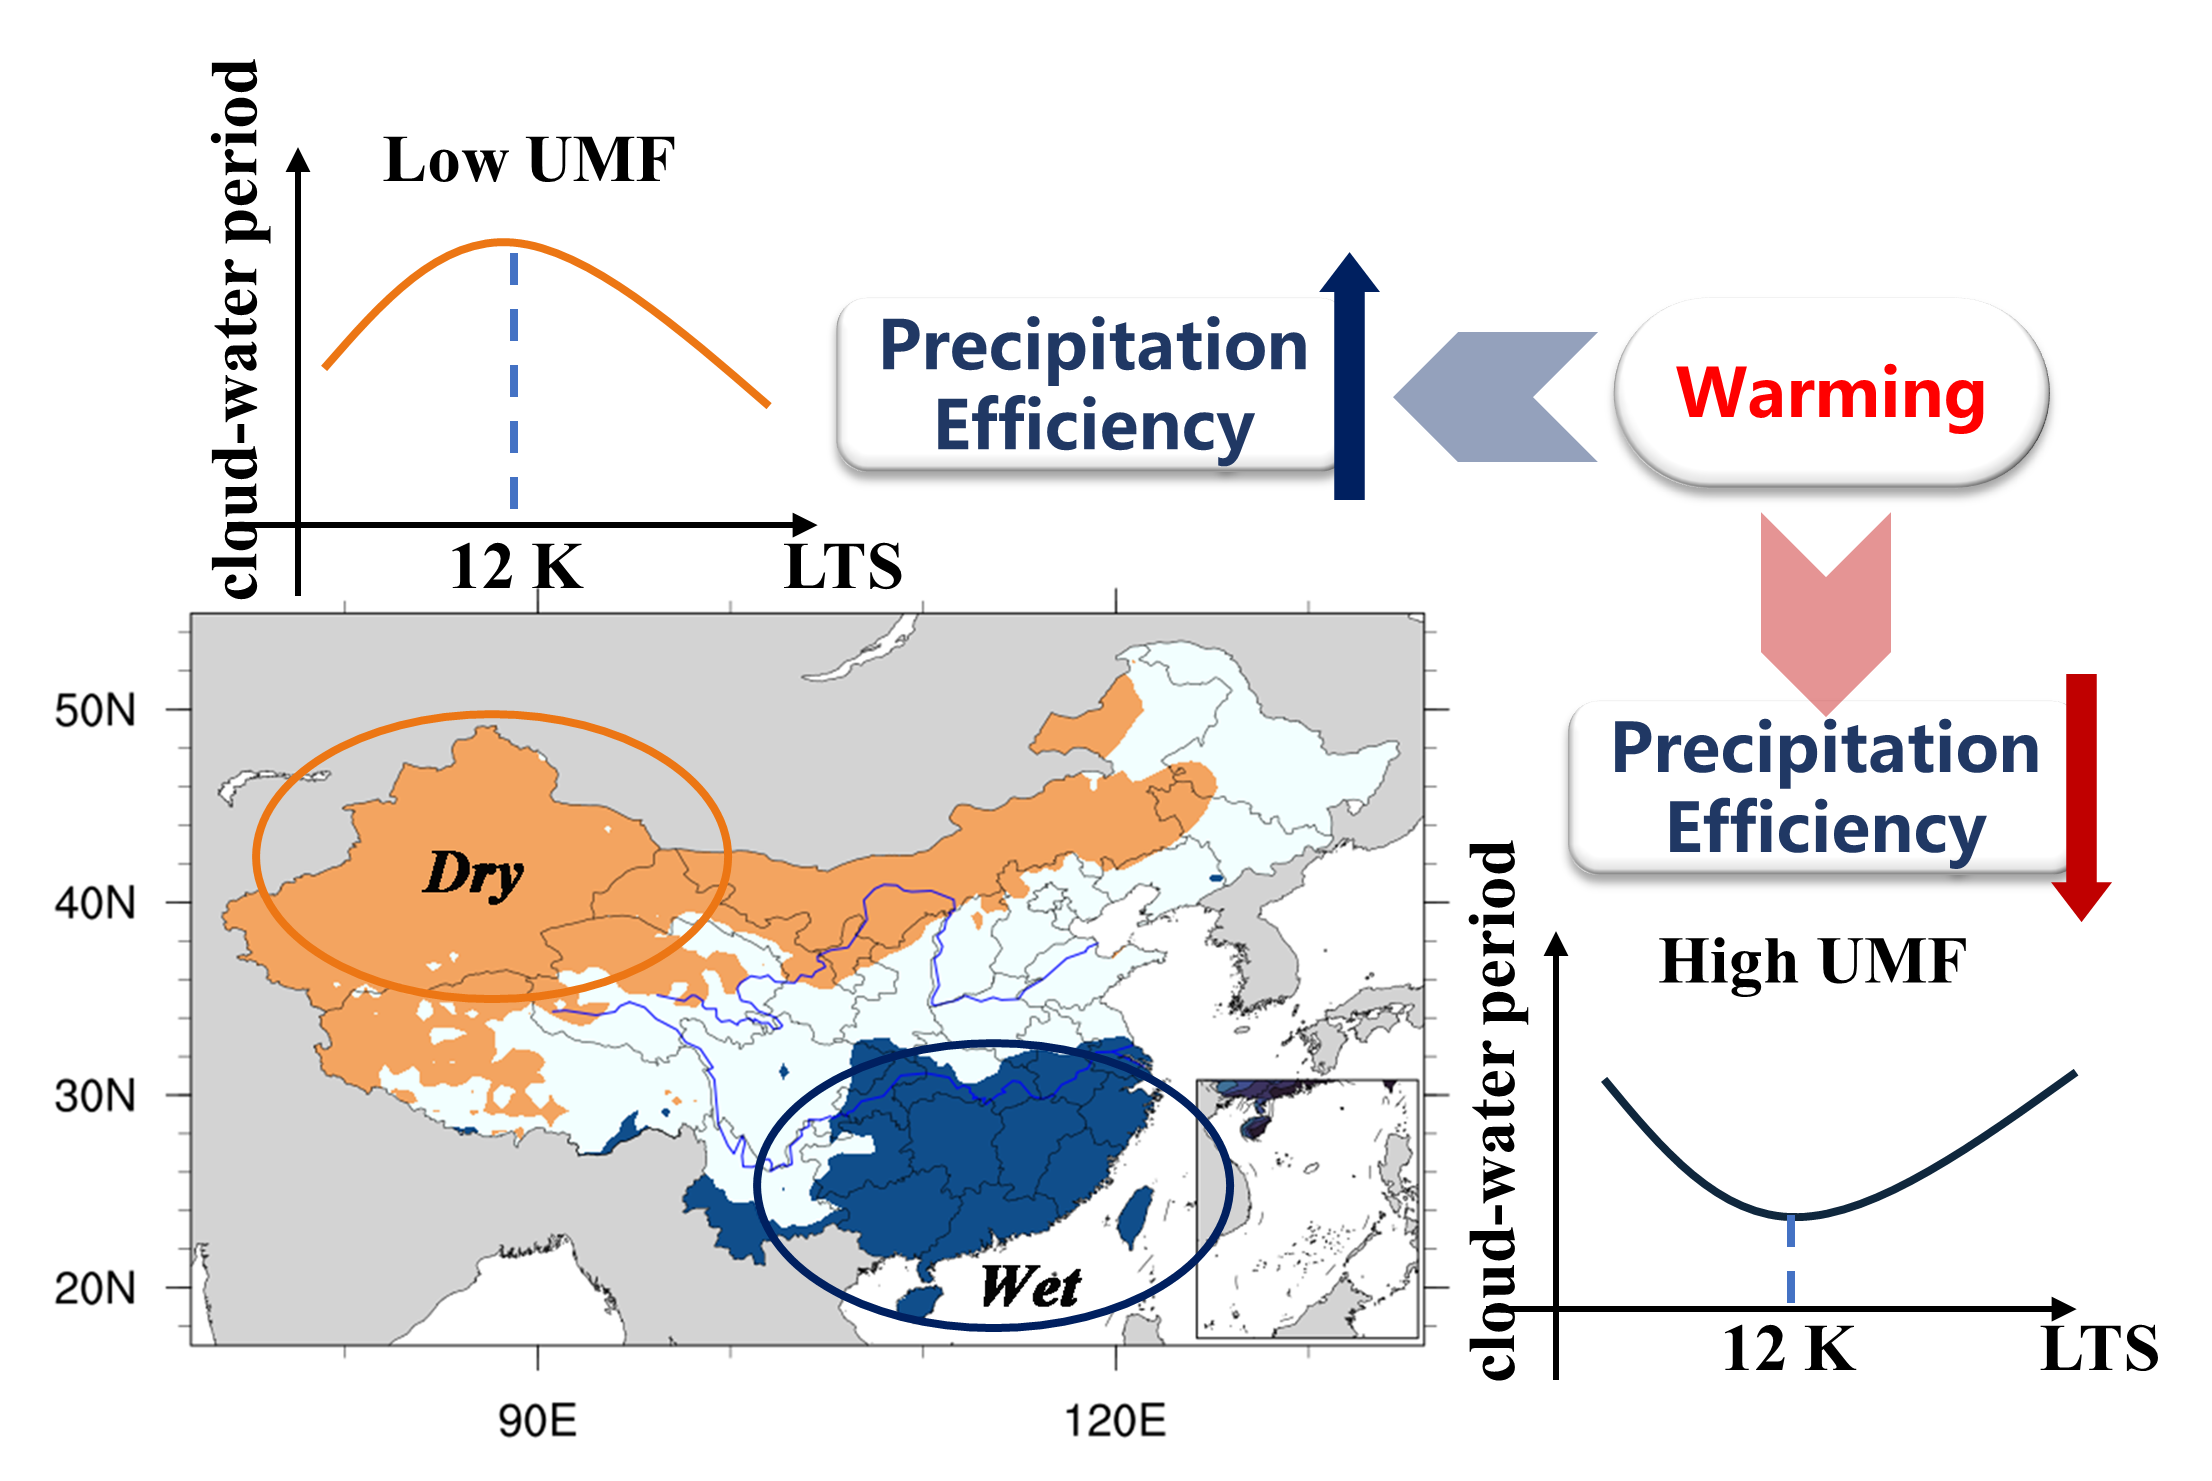
:Cloud water is an important geophysical quantity that connects the hydrological and radiation characteristics of climate systems and plays an essential role in the global circulation of the atmosphere, water, and energy. However, compared to the contribution of water vapor to precipitation, the understanding of cloud-precipitation transformation and its climate feedback mechanism remains limited. Based on precipitation and temperature datasets of the National Meteorological Observatory and MODIS (Moderate Resolution Imaging Spectroradiometer) satellite remote sensing products, the evolution characteristics of cloud water resources in China over the last twenty years of the 21st century were evaluated. Significant decreasing trends of −3.3 and −4.89 g/m2 decade−1 were found for both the liquid and ice water path. In humid areas with high precipitation, the cloud water path decreased fast. In semiarid areas with an annual precipitation ranging from 500–800 mm, the decreasing trend of the cloud water path was the lowest. The cloud-water period was calculated to represent the relative changes in clouds and precipitation. The national average cloud-water period in China is approximately 12.4 h, with obvious seasonal changes. Over the last 20 years, the cloud water path in dry regions decreased more slowly than that in wet regions, and the cloud-precipitation efficiency significantly increased, which narrowed the climate difference between the dry and wet regions. Finally, the mechanism of the cloud-water period evolution in the different regions were examined from the perspectives of the dynamic and thermal contributions, respectively. Due to the overall low upward moisture flux (UMF) in the dry region, the response of the cloud-water period to the lower tropospheric stability (LTS) mainly first increased and then decreased, which was the opposite in the wet region. The increase in cloud-precipitation efficiency in the dry region of Northwest China is accompanied by a continuous decrease in LTS. The different configurations of regional UMF and LTS play a crucial role in the evolution of cloud-precipitation, which can be used as a diagnostic basis to predict changes in the precipitation intensity to a certain extent.

1. Introduction
The atmospheric water cycle includes processes such as evapotranspiration, water vapor transportation, uplift and condensation into clouds, and aggregation of cloud particles to form rain and ice/mixed-phase particles that fall to the ground, among which the cloud-precipitation process is the most active segment in the global water cycle [1,2]. The driving mechanism of the water cycle is climate change. Cloud-precipitation processes within the context of global warming bear the brunt of the observed unprecedented changes and are critical to the study of climate feedbacks [3,4,5]. Atmospheric cloud water resource refers to the hydrometeors in the clouds that can be used by human through artificial precipitation enhancement and other means. They represent important geophysical quantities that connect the hydrological and radiation characteristics of the climate system [5,6]. The monitoring and evaluation of cloud water resources and calculation of the cloud-precipitation conversion efficiency are also prerequisites for a reasonable artificial precipitation layout.
Atmospheric water is available only when it returns to the ground in the form of precipitation. The precipitation efficiency or cloud-water period of cloud systems plays an important role in the allocation of water resources and is an important index to study the distribution and transformation of atmospheric cloud water resources [7,8,9]. A series of previous articles has defined the precipitation efficiency as the ratio of precipitation to the amount of condensed or rising condensed water in clouds and the total condensation rate [10,11]. Elliott [12] even regarded the weather system as a machine that converts liquid water into precipitation. Clement and Soden [13] pointed out that the tropical average radiation budget is highly sensitive to the precipitation efficiency. To better estimate this value, a deeper understanding of the relative changes in cloud water and precipitation is needed. For a long time, scholars have focused on the study of water vapor transport and circulation, but evaluation of cloud water resources in the condensation phase remains lacking. Water vapor does not directly form precipitation. The application of hydrometeors may better represent the conversion efficiency of precipitation than the consideration of water vapor. Liu, et al. [14] considered the ratio of precipitation and the cloud water path to represent the cloud precipitation efficiency (the cloud ability to produce precipitation) and found that the cloud water path in the arid and semiarid regions of East Asia has increased year by year, while the cloud-precipitation efficiency has decreased over the past decades.
The IPCC report states that the global average land temperature has increased by 0.74–0.85 °C over the last 100 years [15], which will directly affect the water content in the atmosphere and global precipitation processes [1,16,17]. China exhibits a variety of climate types and abundant water resources, but their spatial distribution is extremely inhomogeneous. Due to the influence of global climate change, economic and social development, population increase, ecological environmental deterioration and other factors, water shortages have become an essential factor restricting the social and economic development of China [18,19,20]. Therefore, to develop, utilize and improve the water resources of China to meet the needs of economic development, it is of great strategic significance to understand the state of its cloud water resources and the precipitation efficiency of cloud systems against the background of climate warming in recent years. Cai [21] proposed the monitoring and diagnosis method of the three-dimensional cloud water field based on comprehensive observation data and systematically evaluated the atmospheric water budget, cloud water resources and precipitation efficiency in China. Langhans, Yeo and Romps [9] calculated the precipitation efficiency of cumulus clouds with a new Lagrange particle framework for large eddy simulation. With the use of this framework, the path of water vapor transformation into precipitation at a specific height was reconstructed, and the precipitation efficiency was expressed as a function of the height. An increasing number of studies has paid attention to the cloud-precipitation conversion capacity, but there remains a lack of a sufficient understanding of the physical mechanism affecting cloud-precipitation and the feedback of climate warming. In the dry region of Northwest China, westerly circulation is blocked by the plateau, the dynamic conditions are poor, and water vapor occurs insufficiently [22]. However, the wet region in Southeast China is located downstream of the plateau and is affected by the East Asian monsoon with suitable dynamic and thermal conditions, which inevitably leads to very large differences in cloud water resources and precipitation between the different climate zones [23,24], and there is an urgent need for further research.
To better assess the relative relationship between cloud water resources and precipitation in the different climatic regions of China and the evolution mechanism under climate change, data products based on national observation stations and satellite remote sensing are adopted here, with the following main focus points: (1) the evolution characteristics of the cloud water resources over China under global warming and their relative change relationship with precipitation; (2) the dynamic-thermal mechanisms affecting cloud precipitation in the different climate zones. This study provides a reference to better understand the response of cloud precipitation under global warming and the rational development, utilization, and improvement of cloud water resources.
2. Data and Methods
2.1. Observation and Reanalysis Datasets
Regarding liquid water path and ice water path data, the MODIS (Moderate Resolution Imaging Spectroradiometer) satellite observation-based level 3 product MOD08_M3 dataset was employed [25]. MODIS is an Earth remote sensing tool developed for the NASA Earth Observing System (EOS) Terra and Aqua satellites. MODIS provides more stable satellite data for the detection of the cloud water path via optical methods to directly obtain the optical thickness of clouds and the effective radius of cloud droplets to derive the liquid water path [26,27]. Comparative studies have shown that on large temporal-spatial scales, the cloud water path obtained with the two current observational methods of satellite detection, i.e., the optical and microwave methods (used by ISCCP, TRMM, etc., but restricted to the ocean), are relatively consistent [28]. The MOD08_M3 product used here is a MODIS level 3 grid point product carried on the Terra satellite, with an average monthly time scale from 2001–2019 and a spatial resolution of 1° × 1° grid points globally. The MOD08_M3 atmospheric product contains approximately 800 sub datasets describing atmospheric features such as the cloud volume, cloud optical thickness, precipitable water, and aerosol optical thickness. Data were obtained from the Earth Observing System Data and Information System (EOSDIS) of the National Aeronautics and Space Administration (NASA) (http://reverb.echo.nasa.gov/reverb/, accessed on 1 December 2020).
Meteorological data on the precipitation from 2001–2019 were retrieved from the site-based monthly ground precipitation 0.5° × 0.5° grid dataset V2.0 of China provided by the China Meteorological Administration (CMA) (http://data.cma.cn, accessed on 1 September 2020). These two 0.5° × 0.5° grid products were obtained via spline interpolation based on the observation of 2472 stations across China. The adopted interpolation method eliminated the effects of terrain as much as possible and contained both a linear covariate sub-model and ordinary spline independent variables algorithm to improve the effect of interpolation. Previous studies have also indicated that these grid datasets of the temperature and precipitation are highly reliable and suitably represent the distribution evolution of the temperature and precipitation, respectively, which may be employed to study extreme precipitation and temperature events [20,29,30,31]. Data on Taiwan and South China Sea islands are temporarily missing, and ERA5 (fifth-generation ECMWF reanalysis) data were used instead to determine the complete distribution. ERA5 is a new generation of global atmospheric reanalysis data to replace ERA-Interim. Owing to the development of physical models, dynamic cores and data assimilation over the past decade, ERA5 exhibits significantly improved spatial and temporal resolutions of the data and updated uncertainty estimates retrieved from various datasets [32]. By combining observations with modeling, reanalysis data provide a great opportunity to study globally consistent water and energy cycles, for example. The upward moisture flux in the ERA5 monthly average whole-layer dataset and temperature at 700 hPa retrieved from the vertical baroclinic dataset were also adopted here (https://cds.climate.copernicus.eu/#!/home, accessed on 1 December 2020). All data were averaged monthly from 2001–2019 and interpolated to a 1° × 1° grid to match the MOD08_M3 dataset. Details of the data and variables used are shown in Table 1.
2.2. Methods
Previously, the cloud precipitation efficiency has been calculated as the ratio of the precipitation rate to the cloud water path, but without considering water vapor, the precipitation efficiency may sometimes be higher than 1. To avoid this situation, we consider the ratio of the cloud water path to the precipitation rate (PR), which is the inverse of the precipitation efficiency, to represent the cloud-water period (CWP_lifetime). LWP (liquid water path) and IWP (ice water path) in Equation (1) are expressed in mm. The cloud water path (CWP) is the sum of LWP and IWP. PR is expressed in mm/day, and CWP_lifetime is expressed in h. The lower tropospheric stability (LTS) is the potential temperature difference between 700 hPa and the surface, expressed in K. The larger the LTS value, the more stable the lower troposphere is. The equations are expressed as follows:
The Mann–Kendall (MK) trend test and Theil–Sen trend estimation are also applied to calculate the trend and significance, respectively, of the long-term series [33,34]. The rank-based nonparametric Mann–Kendall test does not require normality or linearity to test the trend of a given time series [35]. The MK test first calculates an S statistic:
where xj are values in jth years, n is the number of observations, the function sgn(x) gives the sign of the variable x. The statistic S is approximately normally distributed under the null hypothesis. If n is greater than 10, variance of the S statistic is computed by:
where q is the number of tied groups and tp is the number of data values in the pth group. The standardized test statistic Z is computed as follows:
The Theil–Sen trend estimate is a robust estimate of linear trend. It can be significantly more accurate than simple linear regression for skewed and heteroskedastic data, and competes well against non-robust least squares even for normally distributed data in terms of statistical power [36]. The Theil–Sen estimator is calculated by:
where β is the median overall combinations of recorded pairs for all data. A positive β value indicates an upward trend and a negative β value a downward trend. These techniques are the most recent popular methods for trend analysis in meteorological series statistics, and both algorithms have been integrated into NCL (NCAR command language) programming functions for ease of use.
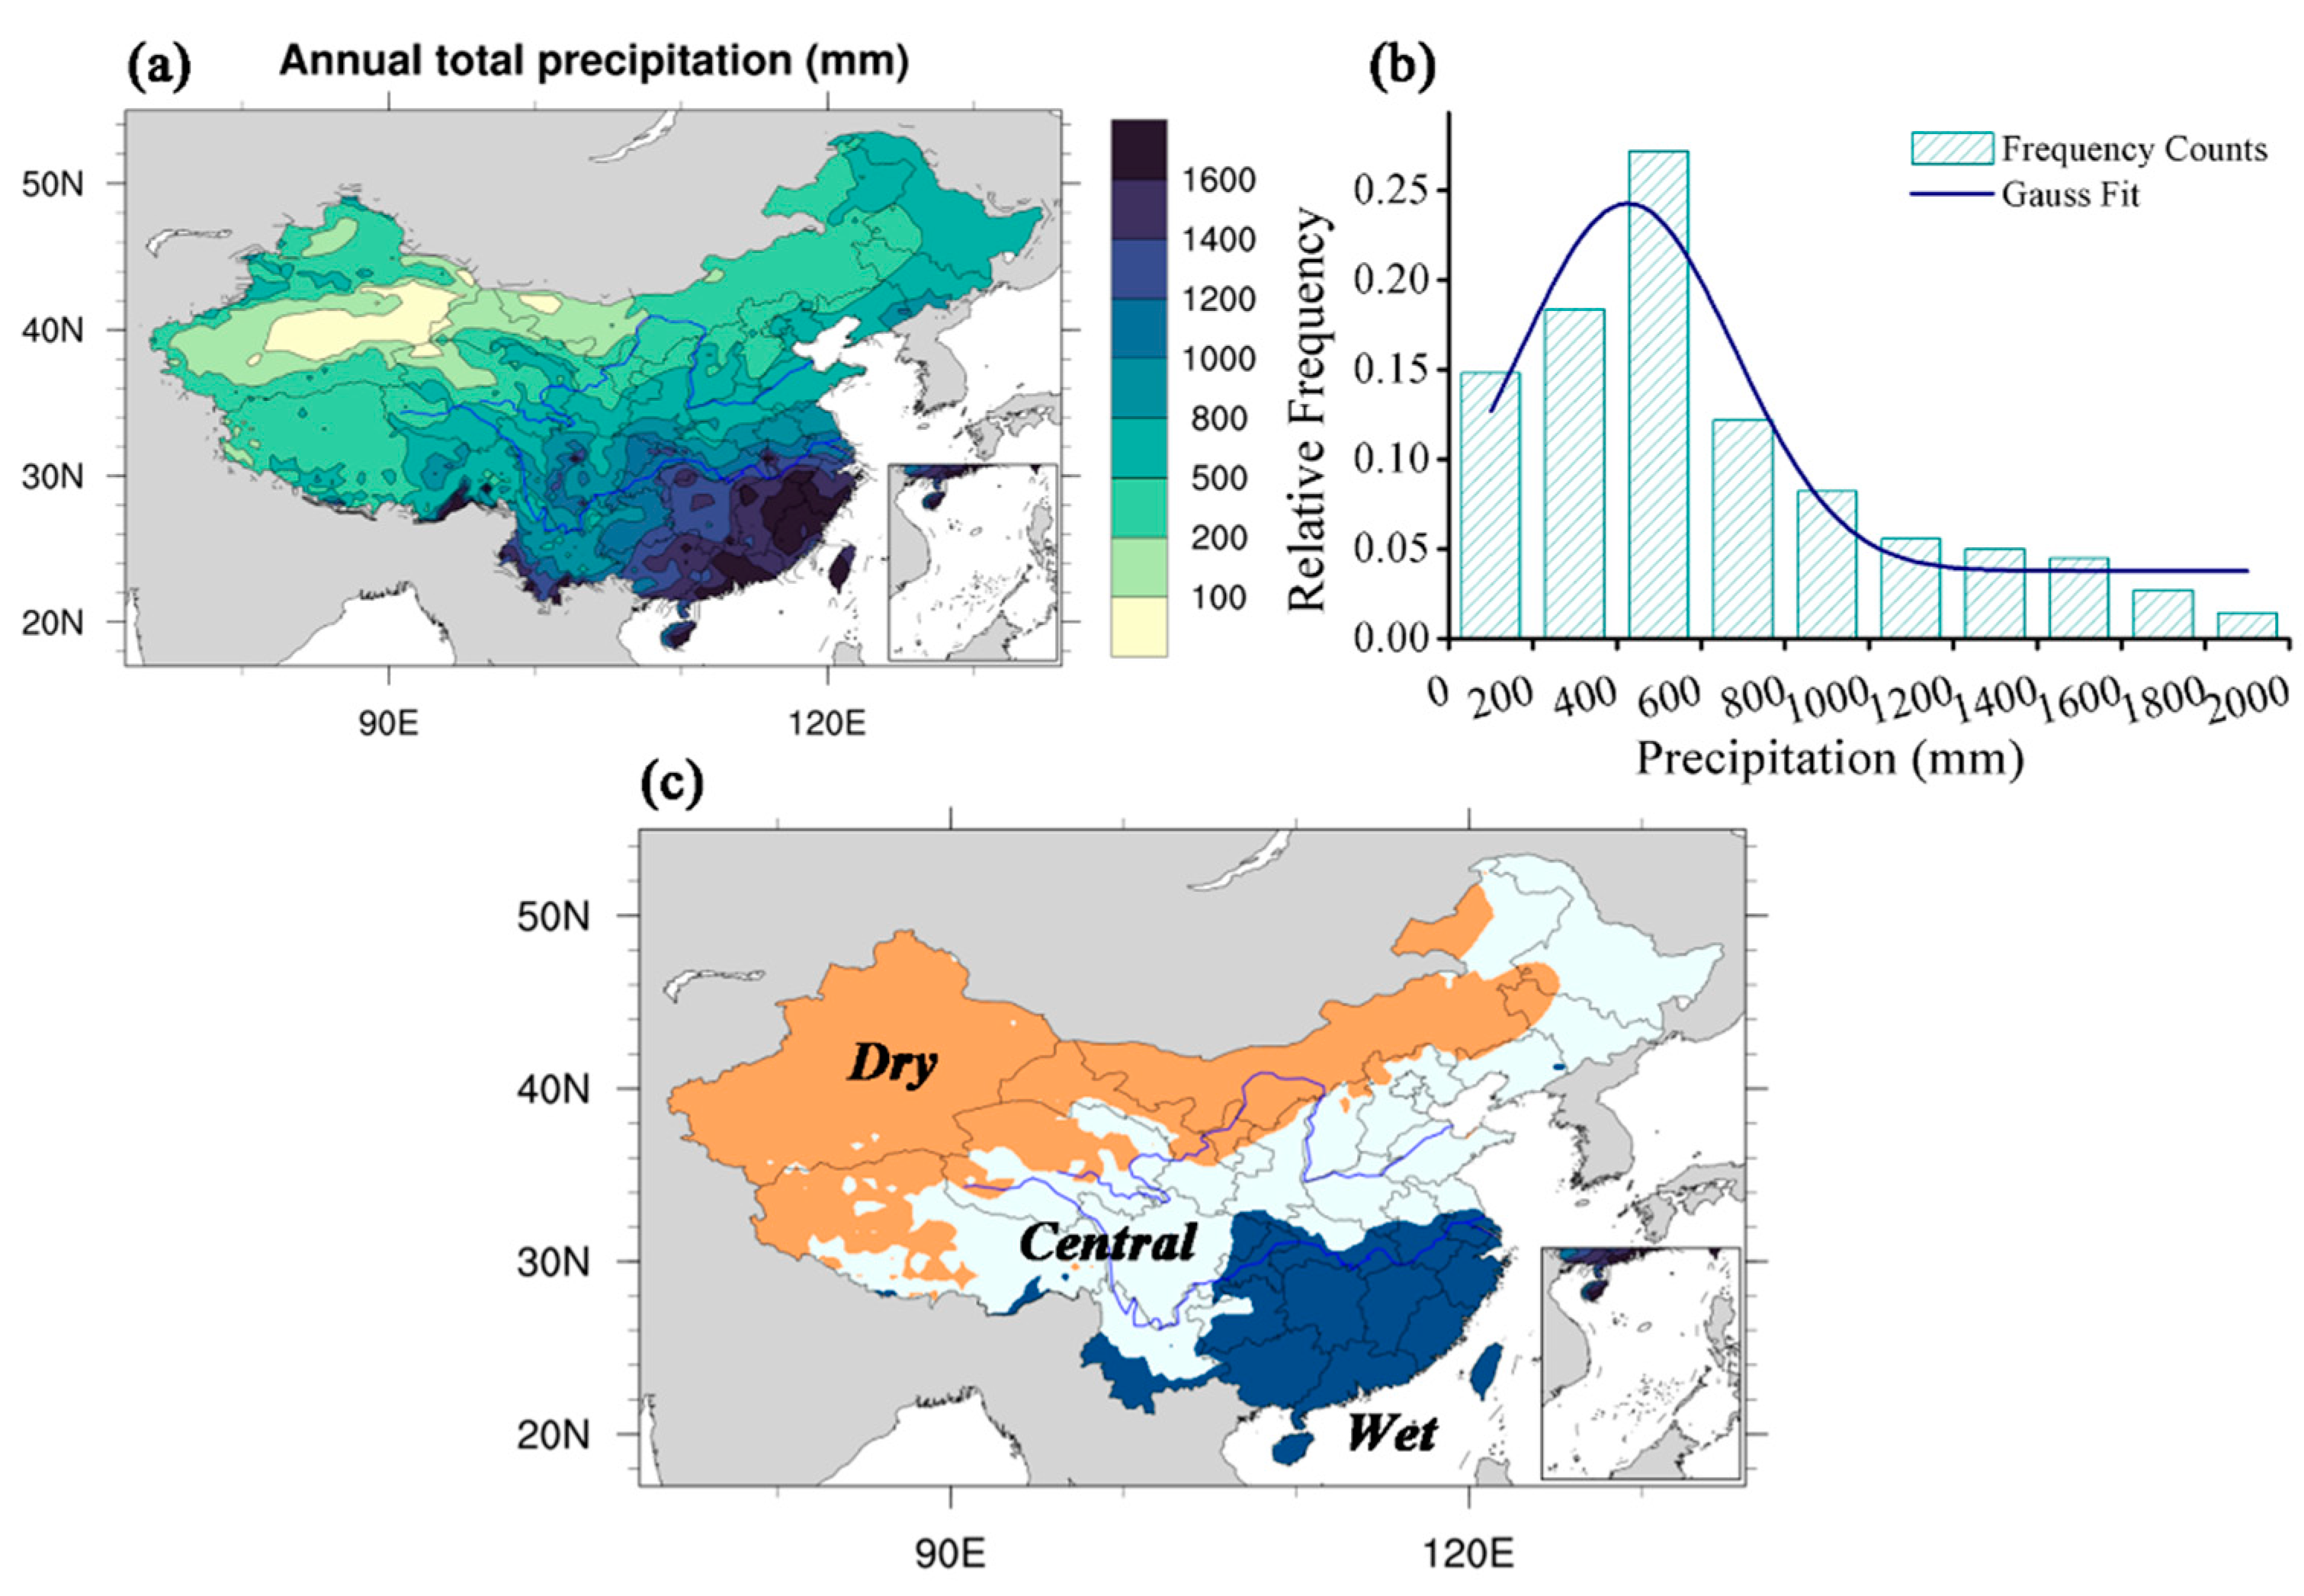
The analysis domain was divided into three climate regions according to the multiyear average annual precipitation. By ranking all grid points according to the annual precipitation in ascending order, the annual precipitation in China was evenly divided into three segments. The first one-third of the grid points attained an annual precipitation lower than 450 mm, and the last one-third attained an annual precipitation higher than 1000 mm. Figure 1a shows the distribution of the annual accumulated precipitation in China from 2001 to 2019. The spatial distribution of the annual precipitation in China is extremely heterogeneous, and the overall gradient decreases from southeast to northwest. The annual precipitation is at least lower than 50 mm in most parts of Xinjiang and higher than 2000 mm in South China and Taiwan. The frequency distribution of the annual precipitation is shown in Figure 1b, which increases with the annual precipitation to a peak corresponding to approximately 500 mm and then rapidly decreases to 1000 mm. Therefore, the annual precipitation division thresholds were set to 450 and 1000 mm, i.e., the grid points with an annual precipitation lower than 450 mm were denoted as arid areas, mainly including Xinjiang, Inner Mongolia and most of Northwest China. The grid points with an annual precipitation higher than 1000 mm were denoted as humid areas, mainly including South China and southeast coastal areas. The grid points with an annual precipitation between 450 and 1000 mm comprised the central region, which is located in the central transition zone between the arid and humid regions. Figure 1c shows the final division. The division method based on the annual precipitation is simple and practical, and the result is consistent with the drought index division method that considers the potential evaporation [37,38,39].
3. Results
3.1. Evolution Characteristics of the Cloud Water Resources in the Different Climate Zones
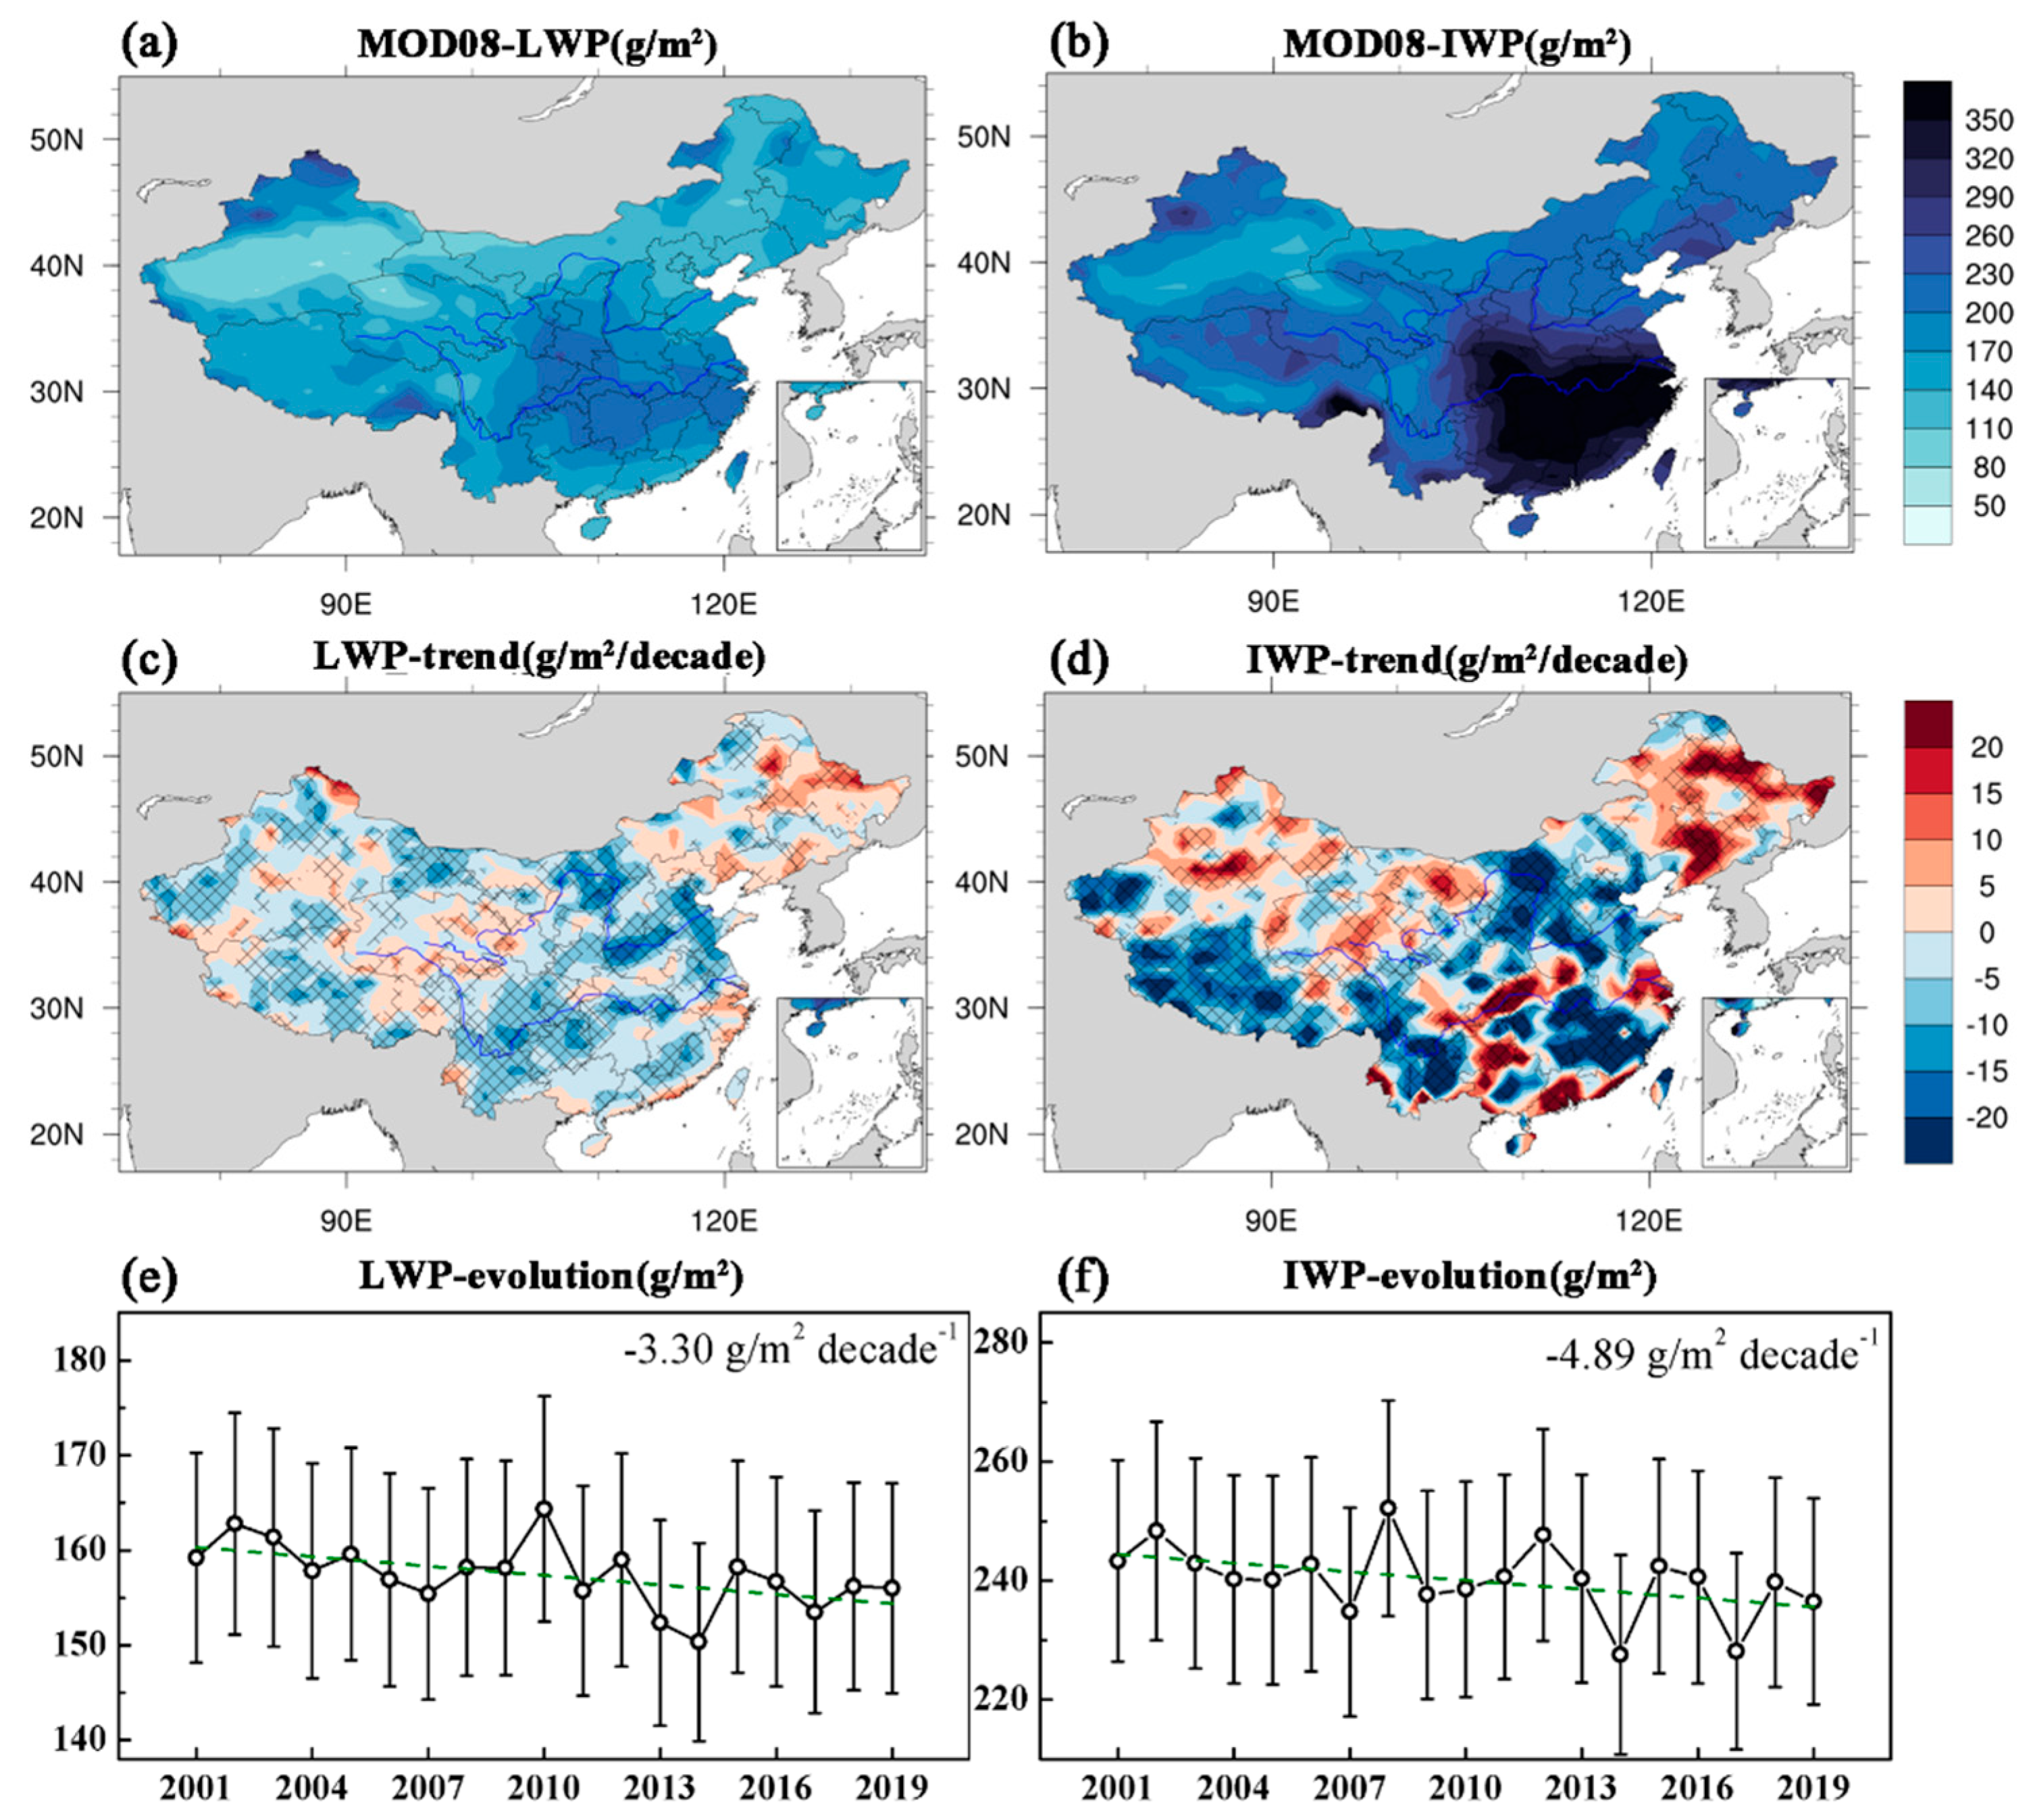
First, the basic distribution and evolution of the cloud water path in China were analyzed. Figure 2 shows the distribution of the average liquid and ice water path in China from 2001 to 2019 based on MODIS observations and their trend evolution over the last two decades. Based on the multiyear average distribution of LWP and IWP, it is observed that both exhibit a clear decreasing trend from southeast to northwest. However, the distribution of the cloud water path is not exactly the same as that of precipitation, with high-value centers concentrated in the Yangtze River basin, and the difference between the north and south extremes is not as large as that between the precipitation extremes. In the northwest, especially in Xinjiang, the minimum cloud water path is lower than 50 g/m2, but further north in the arid and semiarid regions at high latitudes in Asia, there are high values of the liquid and ice water path [14]. The national average liquid water path is 157.47 ± 11.2 g/m2, while the ice water path is approximately 240.24 ± 17.6 g/m2. The ice water path is much higher than the liquid water path overall, and a high ice water path zone occurs throughout the south, reaching over 400 g/m2.
The trend distributions of the annual average liquid water path and ice water path over the last 20 years, as shown in Figure 2c,d, are similar, with an overall decreasing trend in most areas of China. Both liquid and ice water in the Qinghai–Tibet Plateau and North China exhibit significant decreasing trends. The increasing trend is mainly observed in the northeast and parts of Xinjiang. Since the ice water path is higher than the liquid water path, the trend of the ice water path is also higher than that of the liquid water path. Figure 2e,f shows that the national average evolution of the LWP and IWP trends are −3.3 and −4.89 g/m2 decade−1 (95% significance), respectively. Both show a decreasing annual trend from 2001 to 2019, indicating that the cloud water path in China has significantly decreased under global warming. Since the topography of China is complex and diverse, the domain is divided into wet, dry, and central regions based on the multiyear average annual precipitation to further analyze the evolution of the cloud water path and its influencing factors in the different regions.
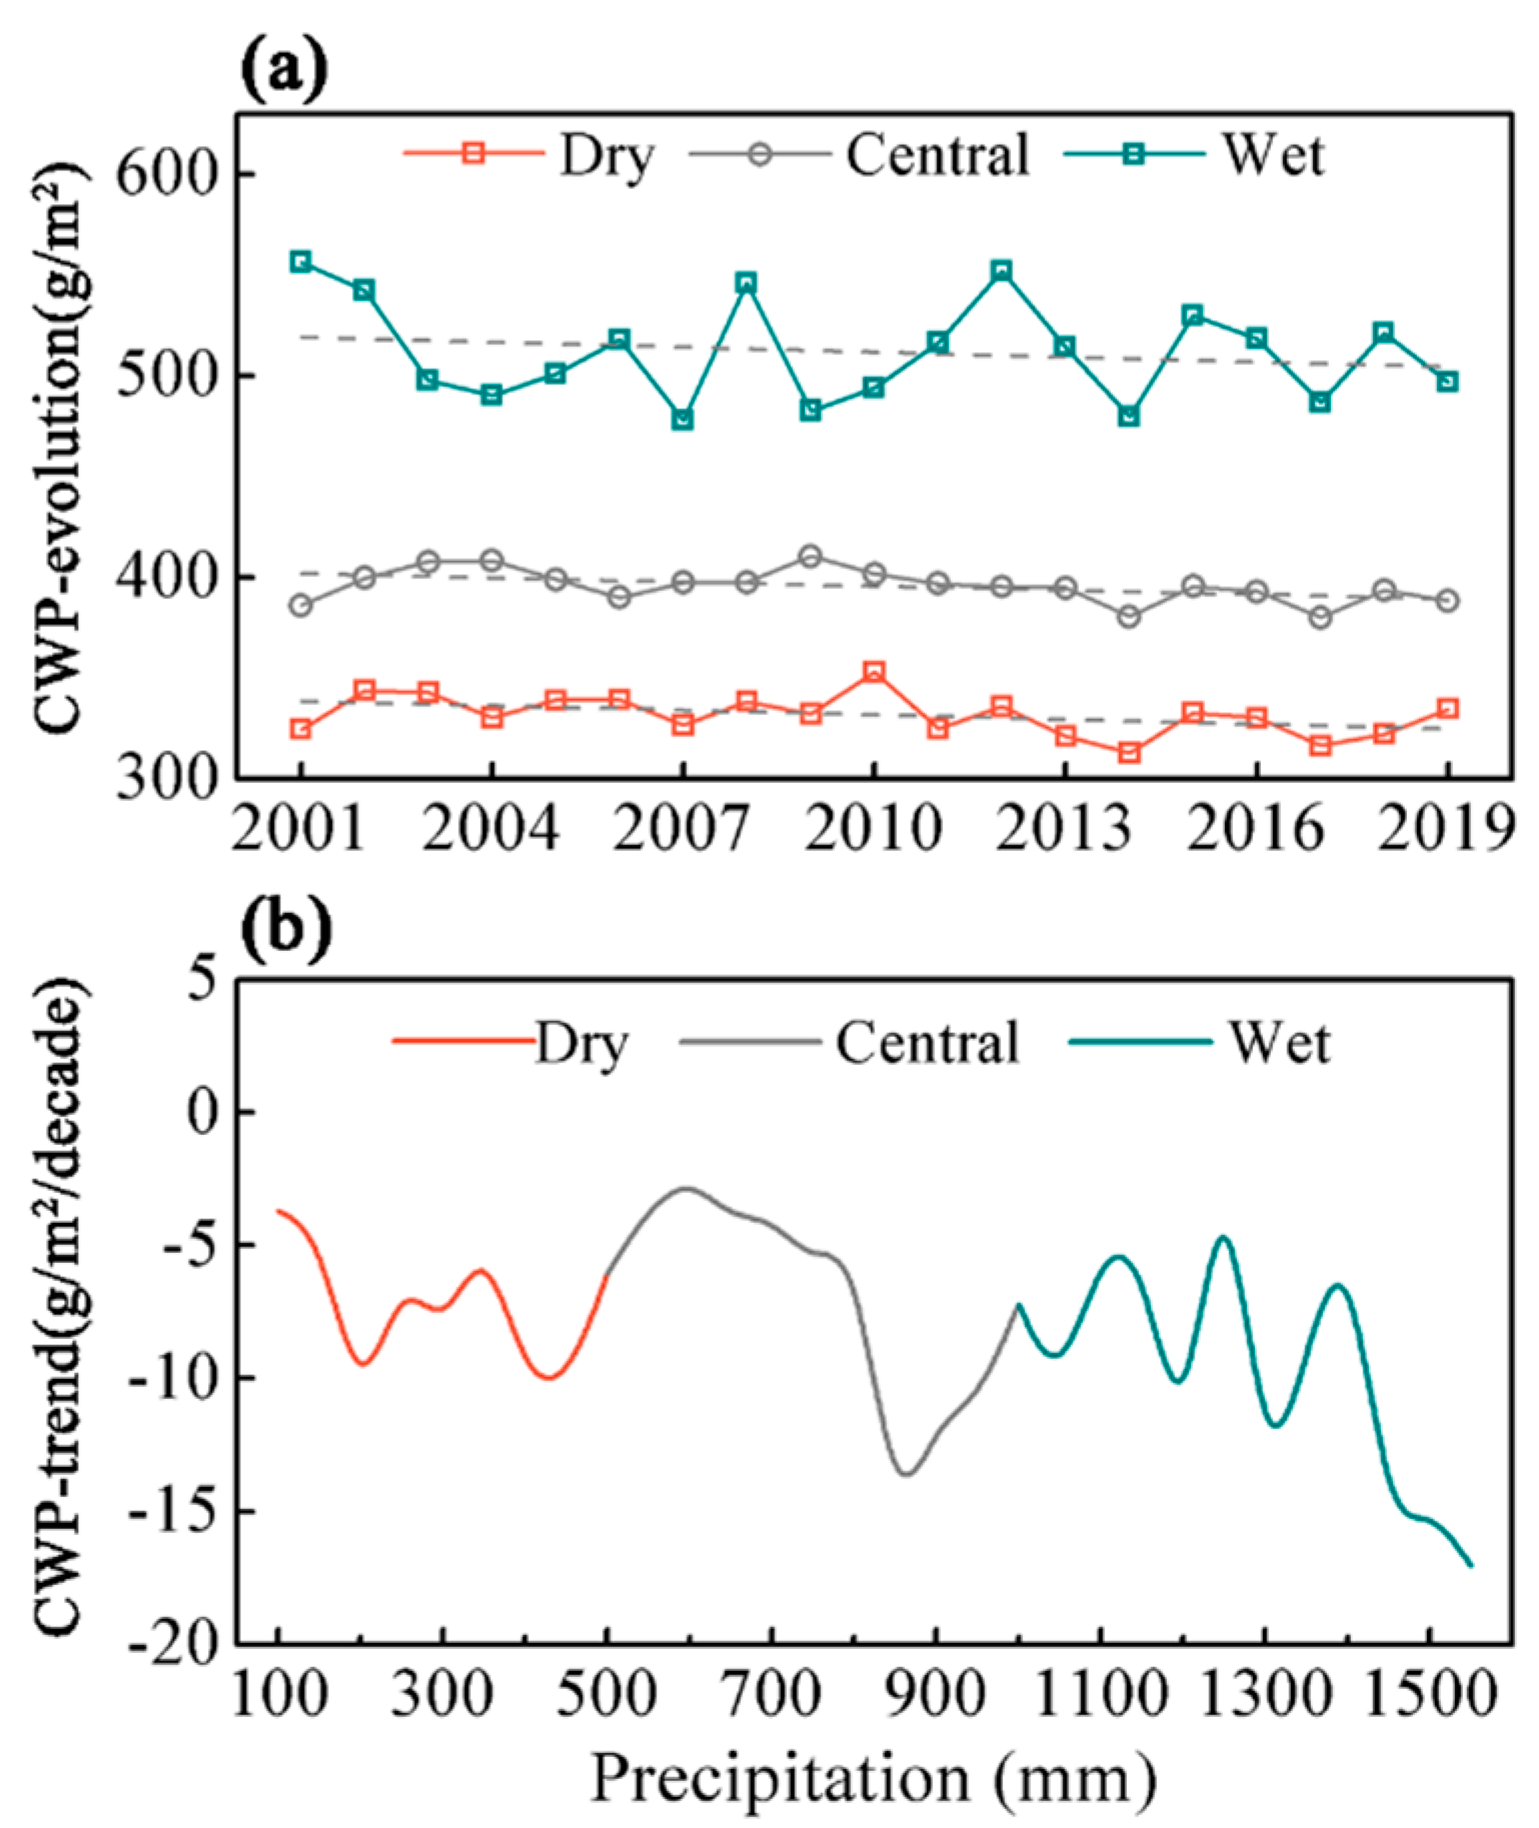
Figure 3a shows the evolution of the cloud water path (sum of liquid water path and ice water path) in the three subregions from 2001–2019. The cloud water path is the highest in the wet region, reaching approximately 500 g/m2. The cloud water path in the central and dry regions decreases in that order, and the cloud water path in the central region exhibits the most stable change trend at approximately 400 g/m2. The cloud water path in all three regions decreases year by year. To compare the specific decreasing trends, Figure 3b shows the variation in the MK trend of the cloud water path with the annual precipitation in China. The trend of the cloud water path decreases in all precipitation intervals, which is consistent with the linear fitting results. The decreasing trend of the cloud water path gradually increases with increasing annual precipitation. The decreasing trend in the arid areas varies between −5 and −10 g/m2/decade, and the decreasing trend is the lowest in the interval with an annual precipitation of 600 mm. The trend of the cloud water path rapidly decreases with increasing precipitation. This indicates that under global warming, the cloud water path in China decreases year by year, and the wetter areas with higher precipitation yield the greatest contribution and the most obvious reduction trend. The slowest decrease in the cloud water path is observed in the semiarid regions with a precipitation ranging from 500–800 mm. The decreasing trend obtained here does not conflict with Liu, et al. [14], since they mainly analyzed the arid and semiarid region in Central and East Asia from 1982 to 2015, while the cloud water high value area is mainly located in south-eastern China. The significant decrease in the cloud water path observed over the past two decades certainly affects the local precipitation conditions, as the cloud water path in the atmosphere is a direct source of precipitation.
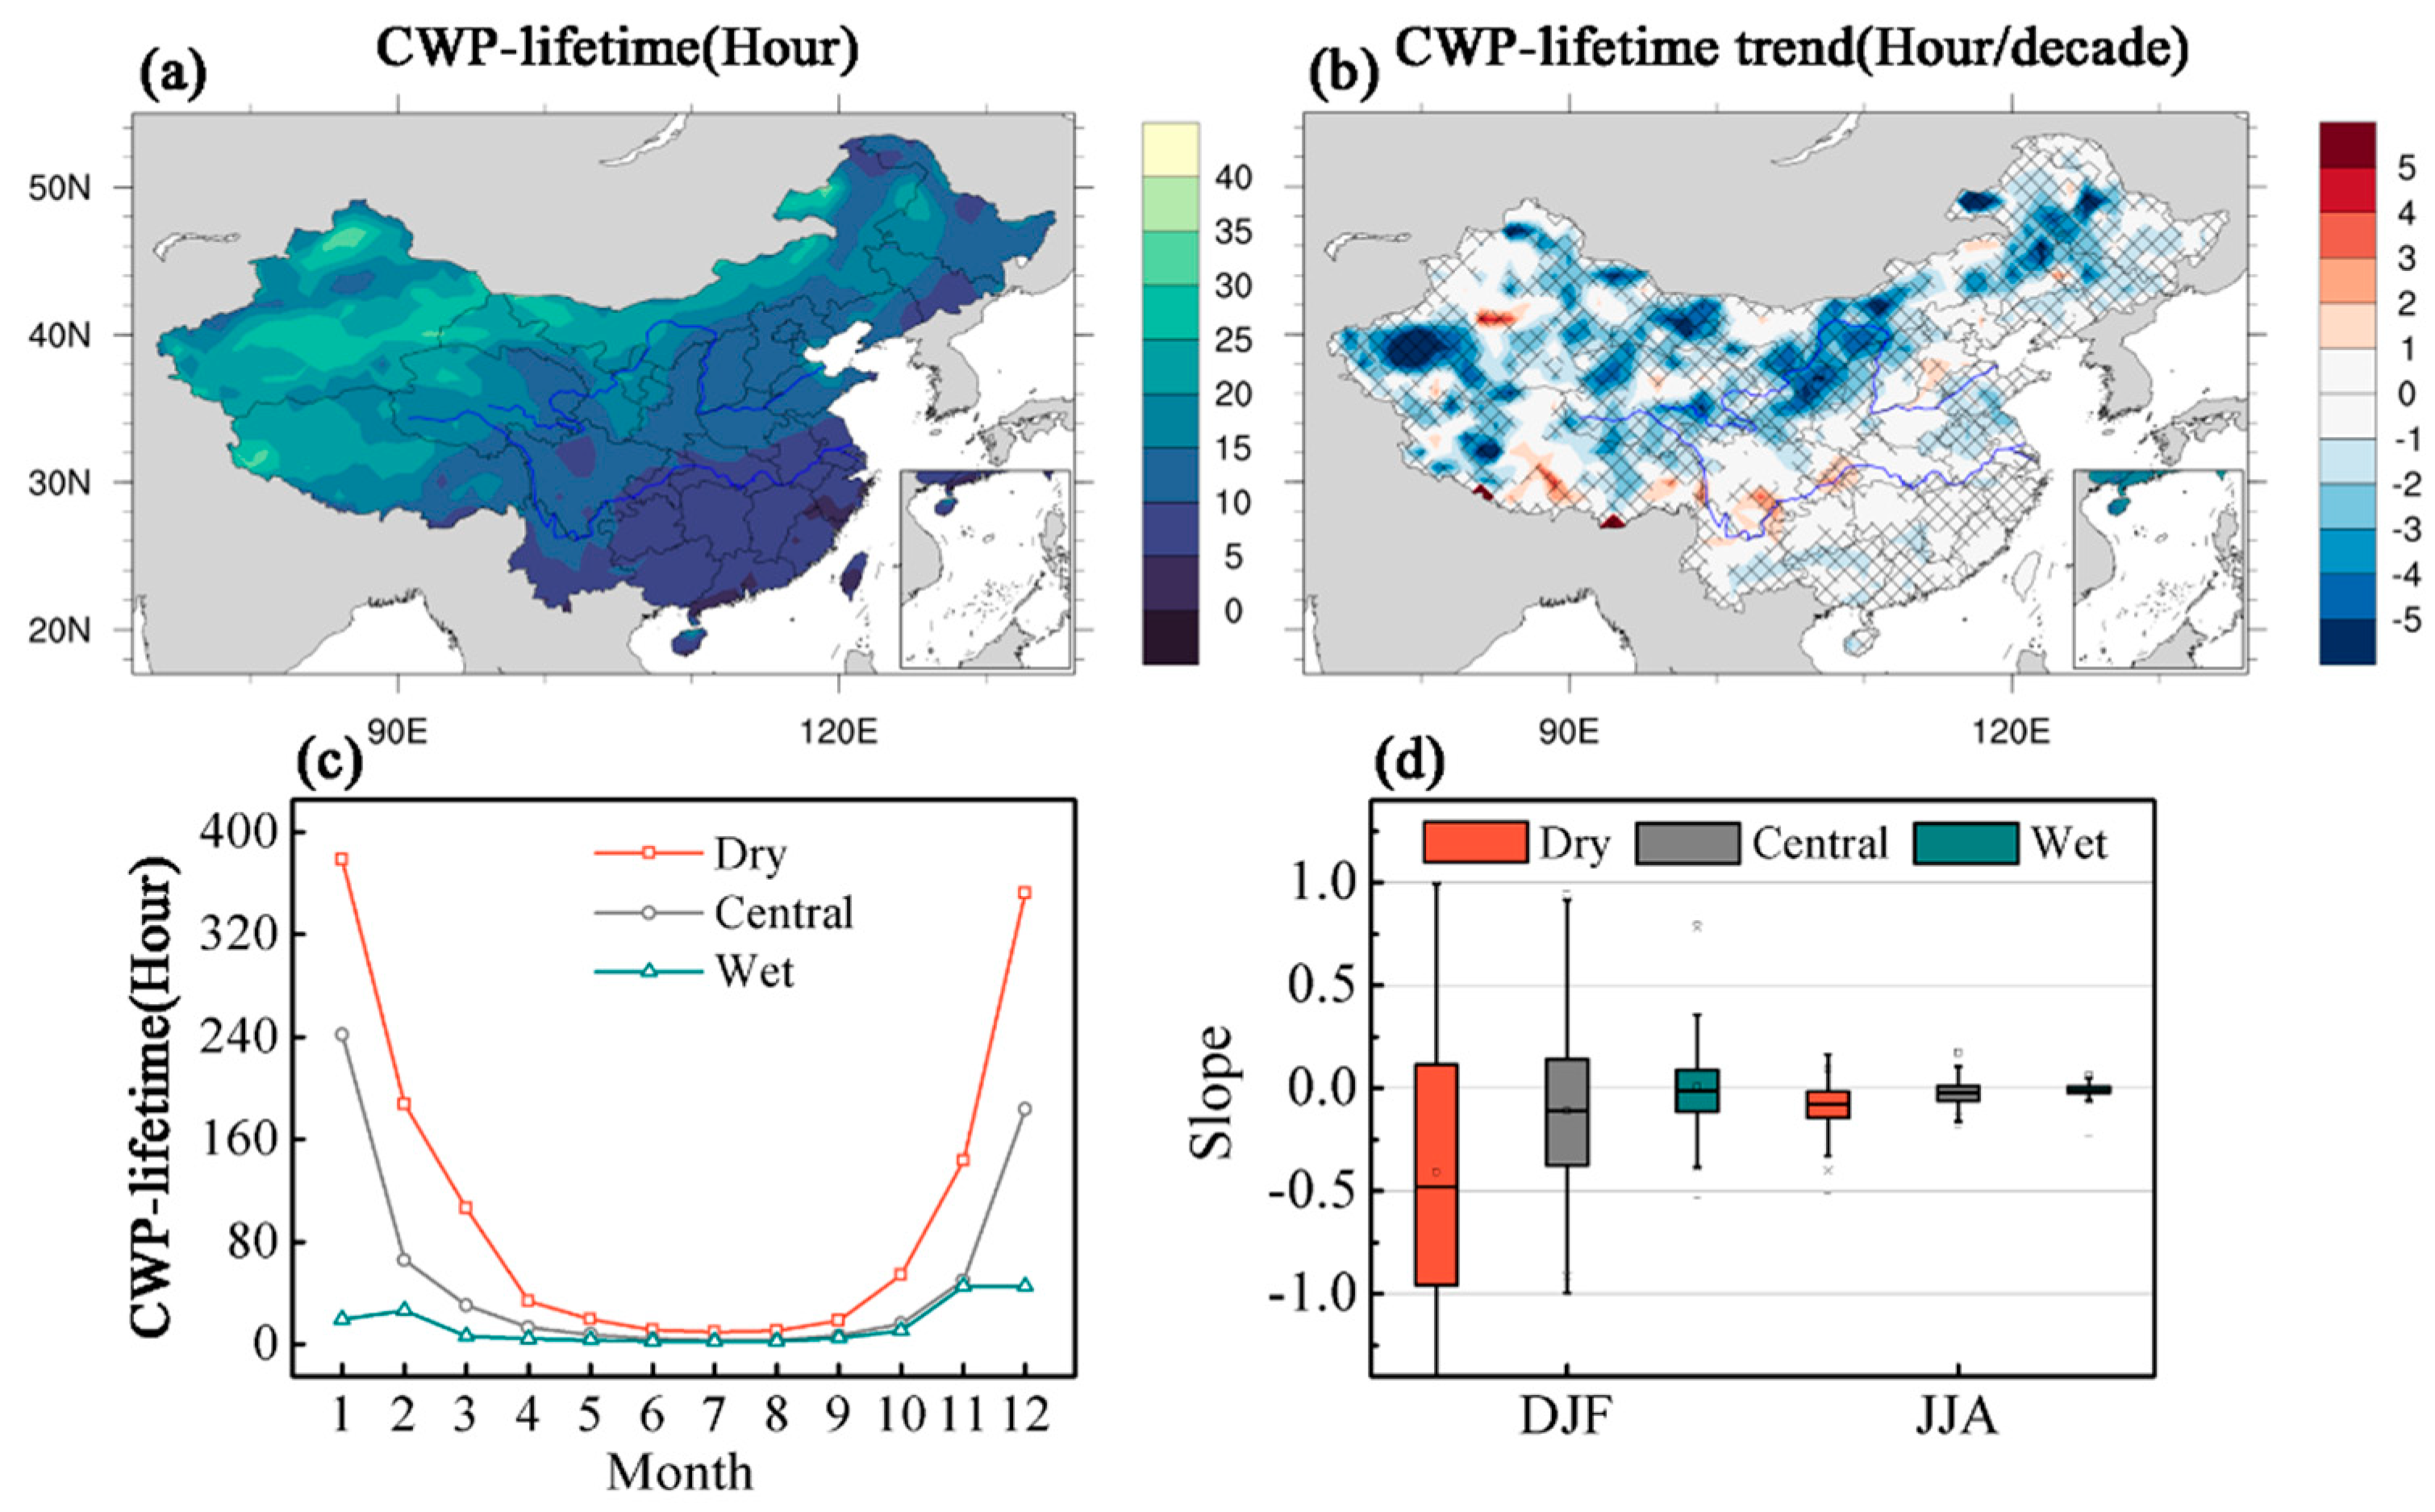
The cloud precipitation efficiency indicates how much cloud water is converted into precipitation and reflects the relative change between the cloud water path and precipitation. The inverse of the precipitation efficiency CWP/PR [40] (i.e., the cloud-water period), is considered here to examine the response of cloud-precipitation to global warming. The evolution and distribution of the multiyear average of the CWP and its MK trend from 2001 to 2019 are shown in Figure 4. The distribution of the cloud-water period is the opposite to that of precipitation, with an increase from southeast to northwest. The annual average cloud-water period in China is approximately 12.4 h, which is consistent with the result of Cai [21], who calculated that the hydrometeor period was 15 h in 2011. Compared to the water vapor period of approximately 11 days, the recycling rate of cloud water is much more rapid. It is also important to note that the seasonal variation in the cloud-water period is obvious. Figure 4c shows the seasonal evolution of the multiyear average cloud-water period in the three regions, and it is found that very large differences occur between winter and summer. Especially in the dry region, the cloud-water period is one order of magnitude larger in the winter months from November–February than that in the summer months from May–September. Only in the wet region is the seasonal variation in the period lower, and the very high variation in the seasonal differences between the different regions is mainly related to the seasonal variation in precipitation.
The trend distribution of the cloud-water period is shown in Figure 4b, and there is a significant decreasing trend in the whole dry region and no obvious change trend in the wet region. The cloud-water period is short in the dry region, averaging approximately 30 h, but the period decreases significantly over the last 20 years, i.e., the water cycle in the dry region is accelerated. Moreover, the cloud water path in the dry region more slowly decreases than that in the wet region, as shown in Figure 3, and the gradual increase in water circulation helps to improve the climate difference between the dry region and the wet region. A box chart of the cloud-water period trend in the three regions in winter and summer is shown in Figure 4d. It is clearly observed that the cloud-water period trend decreases from the dry region to the wet region. Regardless of the season, the trend in the dry region significantly decreases, and the trend in the wet zone is approximately zero. The trend in winter is much higher than that in summer, and the average trend of the cloud-water period in the dry region is −0.49 h/year in winter and only −0.15 h/year in summer, indicating that the increase in water cycle in the dry region is mainly reflected in the contribution of winter, which is related to the warming and humidification of the northwest arid zones and the increase in winter and spring precipitation in China in recent years. In other words, there are certain differences in the cloud water path variation and precipitation efficiency between the arid and wet regions in China under global warming. We need to further analyze the relative relationship and change mechanisms between clouds and precipitation in the different regions.
3.2. Cloud-Precipitation Relationships and Their Climate Feedback Mechanisms
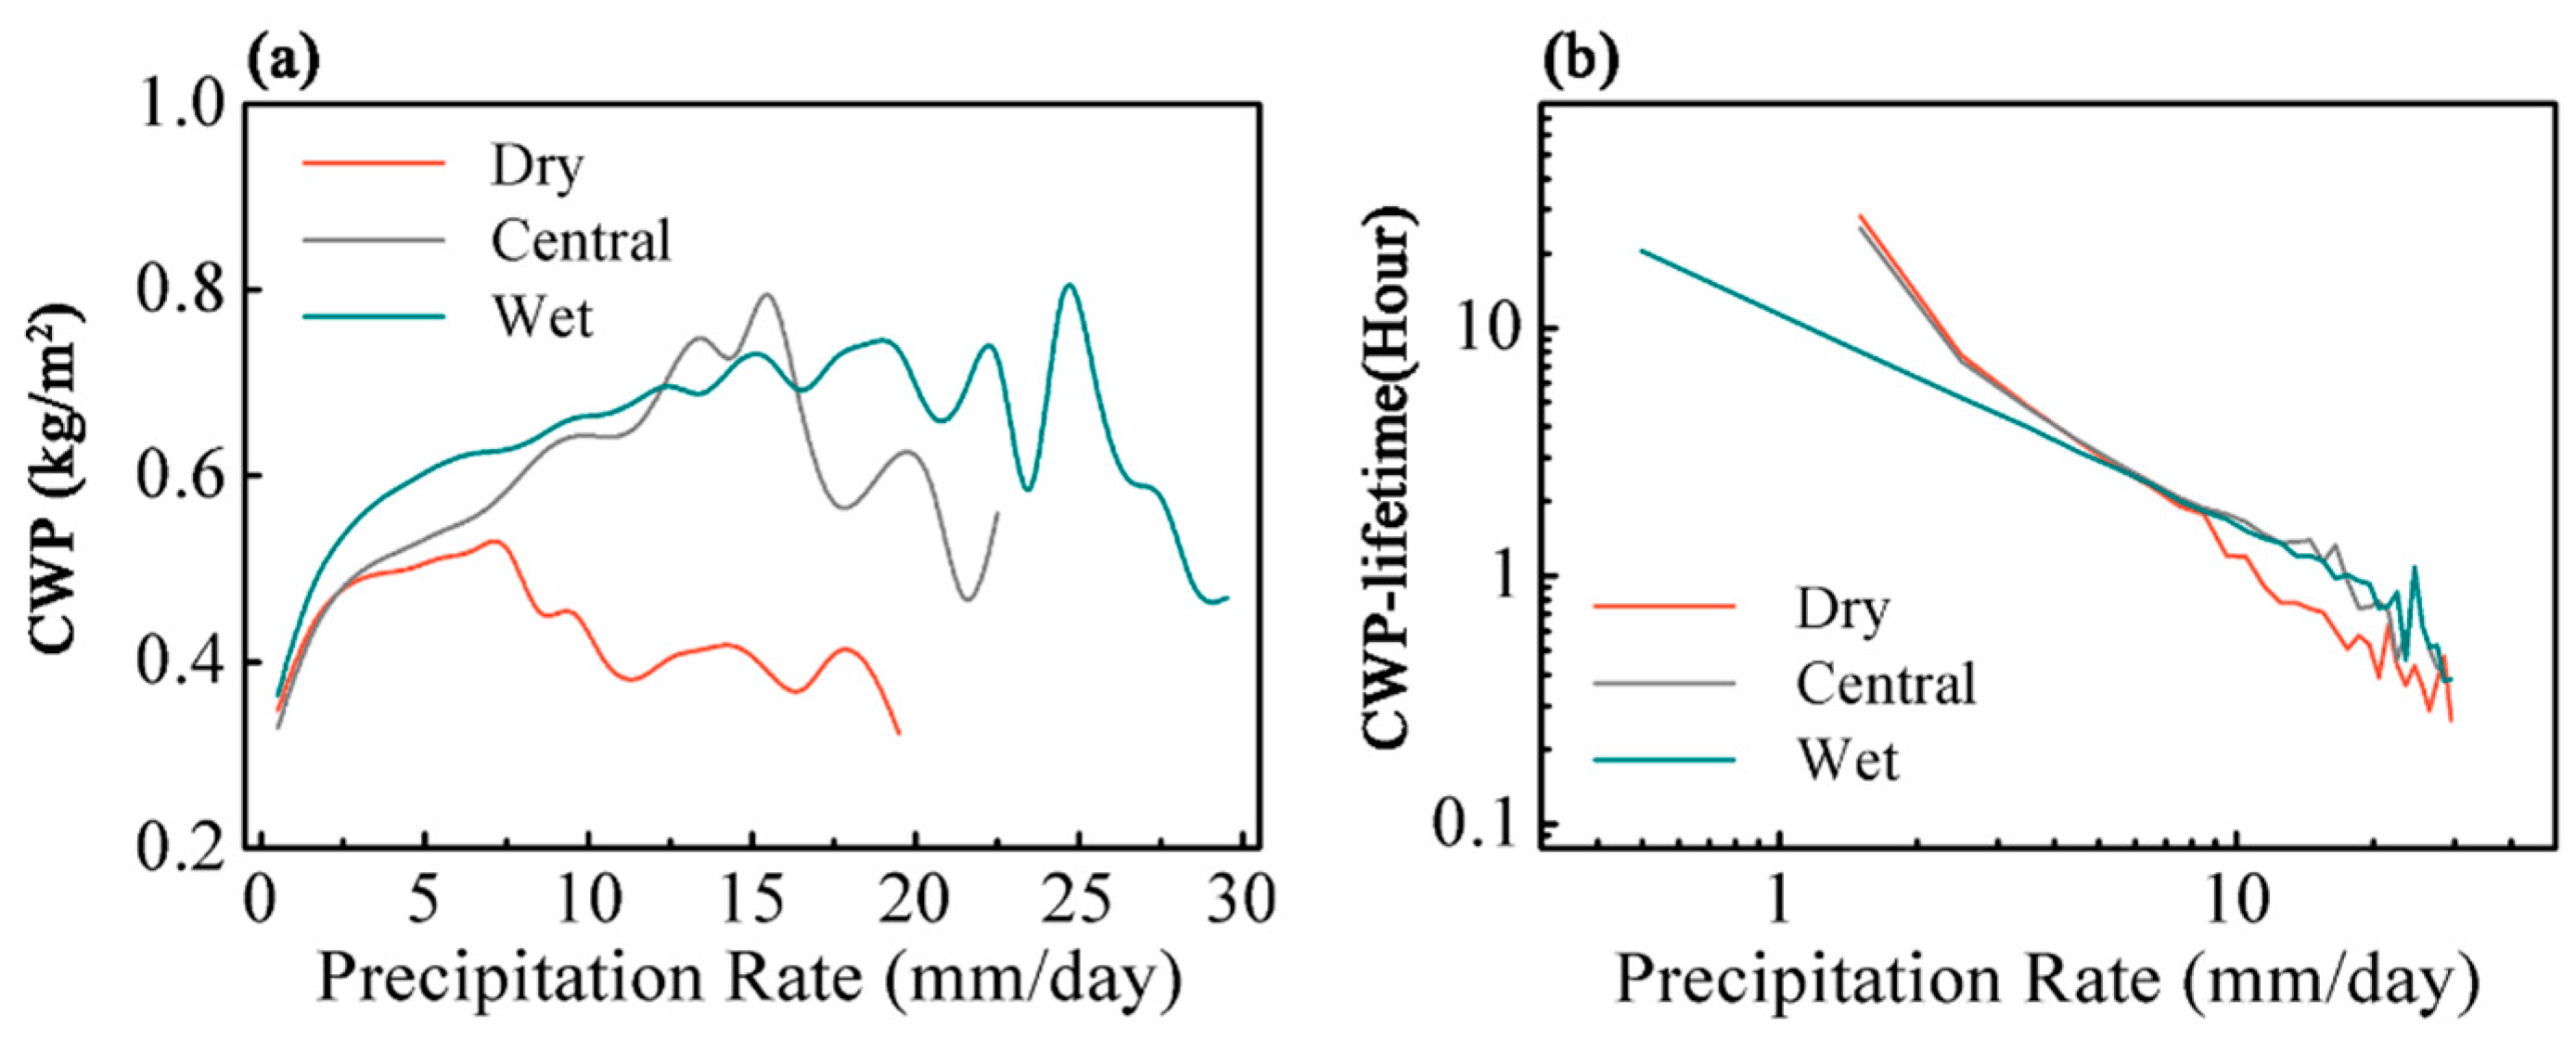
The cloud water path in China has decreased year by year over the last two decades, and the cloud-water period in the dry regions has been significantly reduced. To investigate the influence of cloud-water changes on precipitation under global warming, the correspondence relationship between cloud-water characteristics and precipitation in the different climate zones is further evaluated here. As shown in Figure 5a, the precipitation rate is divided into 30 equal (1 mm/day) intervals to reveal the relative changes in the cloud water path and precipitation intensity. With increasing precipitation intensity, the cloud water path in all three regions exhibits a single-peaked structure that first increases and then decreases. Single-peak structure of corresponding changes in precipitation intensity and cloud water path reflects that the precipitation intensity increases rapidly with the gradual increase in cloud water path and then starts to decrease after reaching a certain extreme value. That is, it does not necessarily follow that more cloud water in the atmosphere will produce more intense precipitation. The cloud water path first peaks in the dry region with increasing precipitation rate, corresponding to a CWP value of only 0.5 kg/m2. In the central region, the cloud water path peaks when the precipitation rate increases to 16 mm/day. When the precipitation rate increases to 25 mm/day, the cloud water path reaches a peak value of 0.8 kg/m2 in the wet region. Although the peak cloud water path and the corresponding precipitation intensity are the lowest in the dry zone, when the cloud water path is small (CWP < 0.5), the corresponding precipitation intensity follows the order of dry region > central region > wet region. When the precipitation intensity is the same (e.g., 5, 10, and 20 mm/day), the cloud water path follows the order of wet region > central region > dry region. This indicates that although the dry zone contains fewer cloud water resources, it more effectively converts its limited cloud water resources into precipitation. The wet region requires a higher cloud water path than that of the dry region for the same precipitation intensity to occur. However, the wet region often contains sufficient guaranteed cloud water resources, and the wet zone produces a higher precipitation than that produced in the central region when the cloud water path is large.
The relationship between the cloud-water period and precipitation intensity is also shown in Figure 5b. The relationship is roughly inverse, with the cloud-water period first rapidly decreasing with increasing precipitation rate and then slowly decreasing. Logarithmic coordinates are used for the horizontal and vertical axes to compare the evolution patterns of the different regions more clearly. The cloud-water period decreases almost linearly with increasing precipitation intensity (a nonlinear variation is indicated in logarithmic coordinates). Although the evolution curves in the three regions are very similar, the cloud-water period varies the most notably with the precipitation rate in the dry region, especially in the high-precipitation (PR > 7 mm/day) zone, where it is the most sensitive to the precipitation rate. In the wet region, the cloud-water period varies the least notably with the precipitation rate, especially in the low-precipitation (PR < 7 mm/day) zone.
There are certain differences in the cloud water path and precipitation efficiency evolution between the arid and wet regions in China under global warming. We further analyzed the factors influencing the cloud-water period and the mechanisms that produce these differences in the relative changes between clouds and precipitation in the various regions. Precipitation is directly determined by cloud microphysical processes, but the occurrence of precipitation is influenced by dynamic and thermal processes in the atmosphere [5,41]. The dynamic effect is mainly caused by the change of vertical velocity, but it does not directly express its contribution by the change of vertical velocity. The increase of the upward velocity does not necessarily mean that precipitation intensity increases [42], and its contribution has to be weighed by the convective mass flux [43]. Regarding the main influencing factors of the cloud-water period, the upward moisture flux (UMF) and lower tropospheric stability (LTS) are selected here to represent the dynamic and thermal contributions, respectively. The UMF is the actual moisture transported vertically upward, which represents the dynamic contribution of vertical transport. The LTS is the difference in potential temperature between two heights, which significantly affects the boundary layer height and radiative cooling at the cloud top and is the main thermal factor determining the cloud water path [44,45].
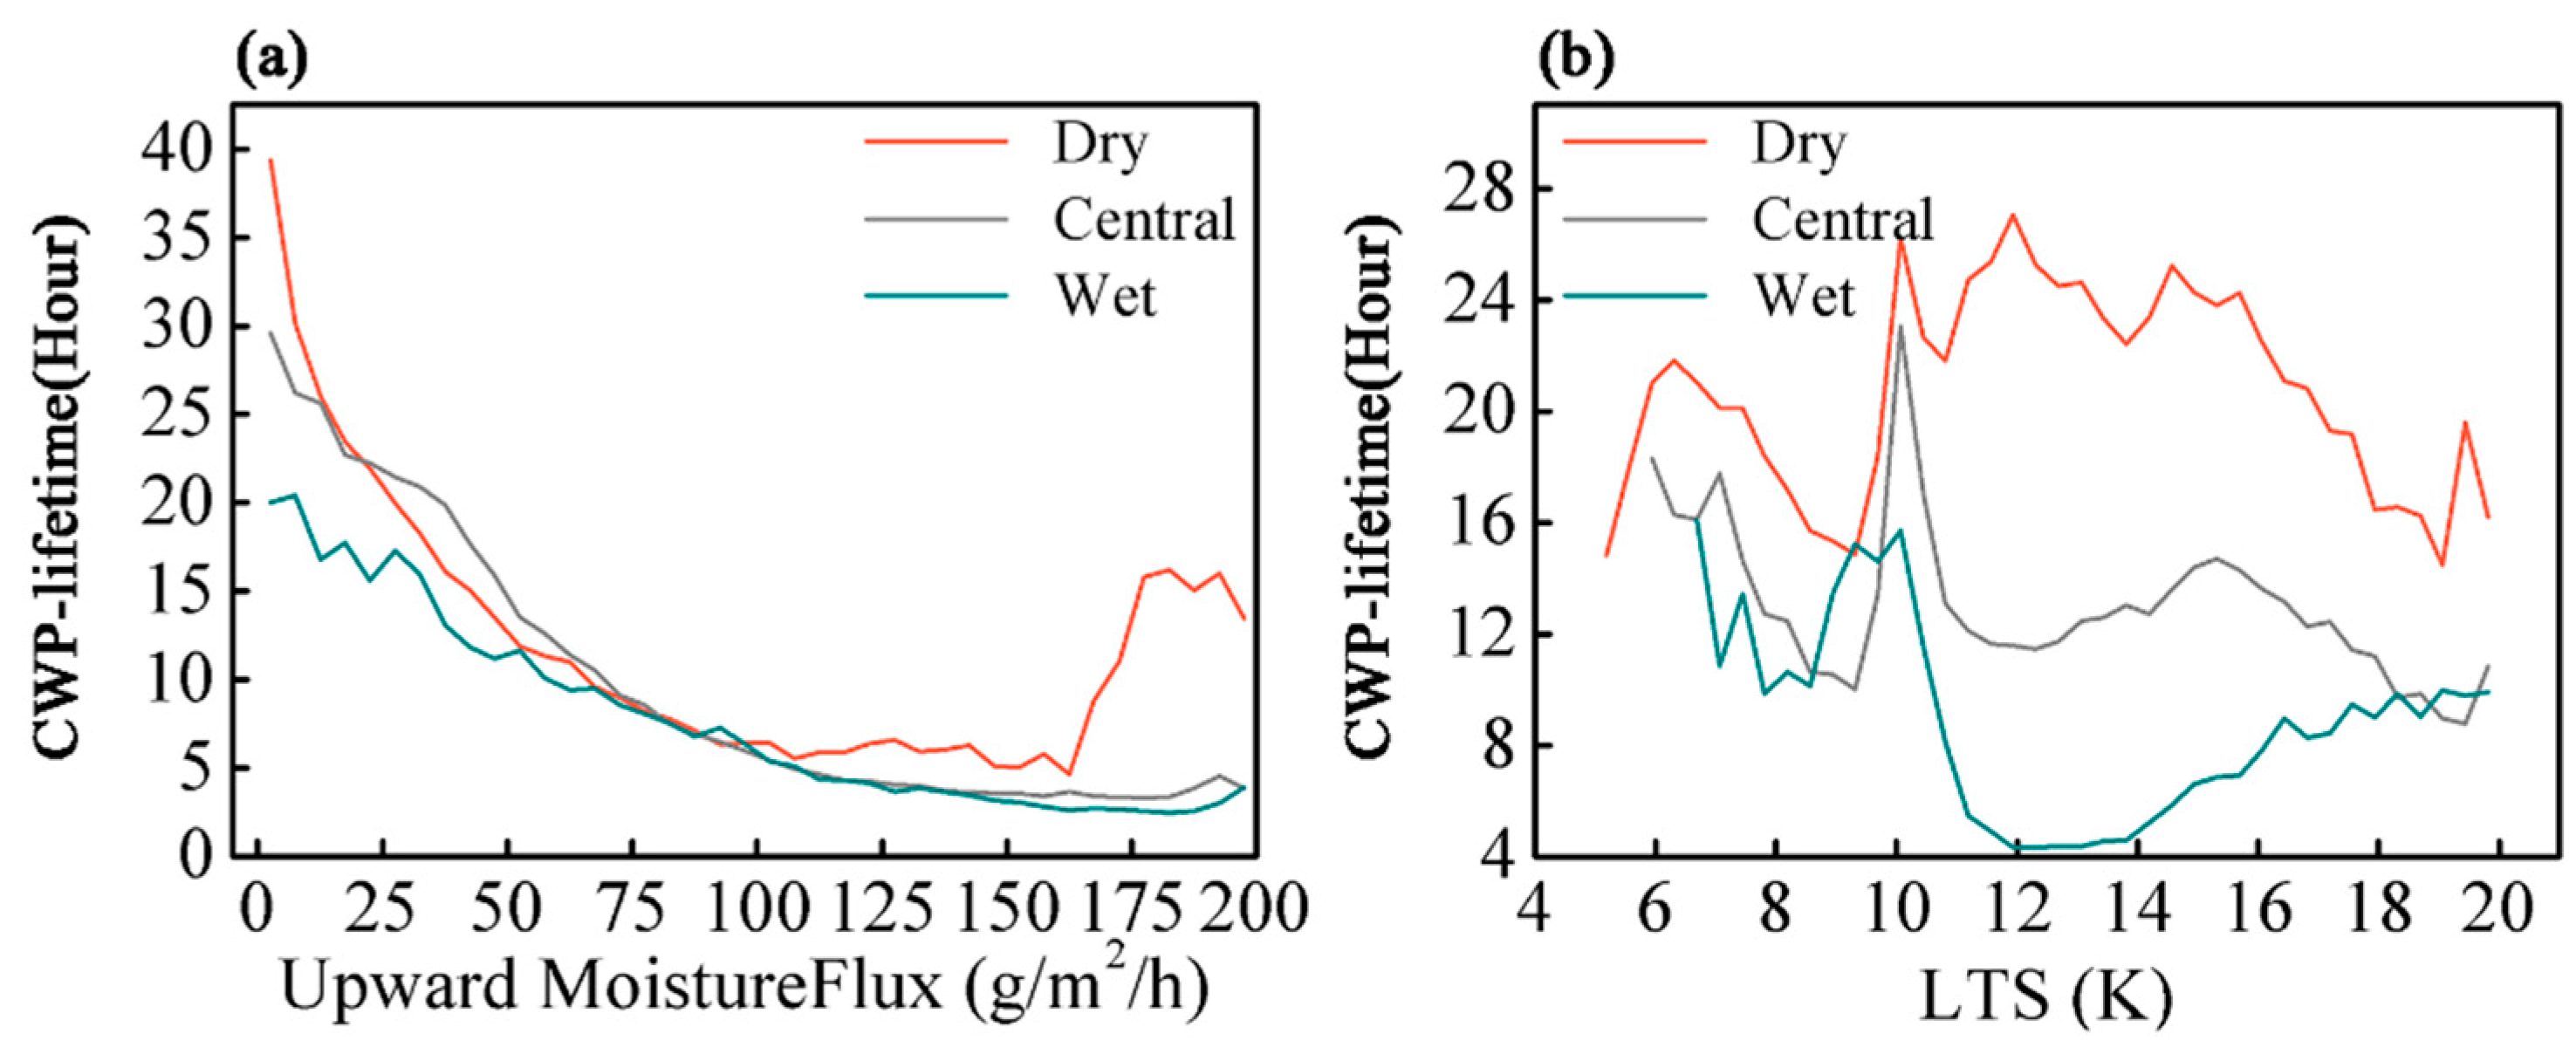
The variation in the cloud-water period with the UMF in the different regions is shown in Figure 6a, with the upward flux uniformly divided into 40 intervals. The overall cloud-water period is negatively correlated with the UMF, and the cloud-water period rapidly decreases in all three regions with increasing upward flux. This occurs because the stronger the upward vertical transport process, the more likely precipitation is formed. However, a high vertical velocity or intense convective activity does not necessarily indicate high precipitation [42,43]. The cloud-water period does not decrease linearly with increasing upward flux, and the cloud-water period hardly further decreases when the UMF increases to a certain level. In the dry region, the cloud-water period stops decreasing when the UMF is higher than 100 g/m2/h and even starts increasing rapidly when the UMF is higher than 150 g/m2/h. In fact, when UMF greater than 200 g/m2/h, the cloud-water period in all regions increased with UMF. The increase of the dry curve is simply earlier than in other regions, corresponding to the minimum peak precipitation intensity in the dry region in Figure 5. This further indicates that the UMF is not the only factor that determines the cloud-water period.
Additionally, as shown in Figure 6b, in regard to the variation in the cloud-water period with the LTS in the different regions, the LTS is uniformly divided into 40 intervals. In contrast to the UMF, the variation in the cloud-water period with the LTS is very different in the three regions. The first peak of the cloud-water period occurs near an LTS value of 6 K, and the cloud-water period first gradually decreases with increasing LTS and then increases rapidly. The second peak is reached near LTS = 10 K, after which the cloud-water period in the three regions exhibits different trends. At high LTS values (>12 K), the response of the cloud-water period to the LTS is completely the opposite between the dry and wet regions. If we ignore the LTS fluctuation between 8 and 10, the cloud-water period increases and then decreases with the LTS in the dry region, while it decreases and then increases in the wet region. This opposite response inevitably causes different evolution patterns of cloud precipitation in the dry and wet regions. However, this does not indicate that the difference in cloud-water evolution between these two regions is entirely a function of the thermal contribution. He [46] suggested a positive relationship with surface moisture flux for low LTS and a negative relationship for high LTS, which is mainly related to near-surface wind speed and evaporation. We conjecture that in dry region with low moisture flux, increased LTS promotes moisture flux exchange, while in wet region with high moisture flux, increased LTS inhibits moisture flux exchange.
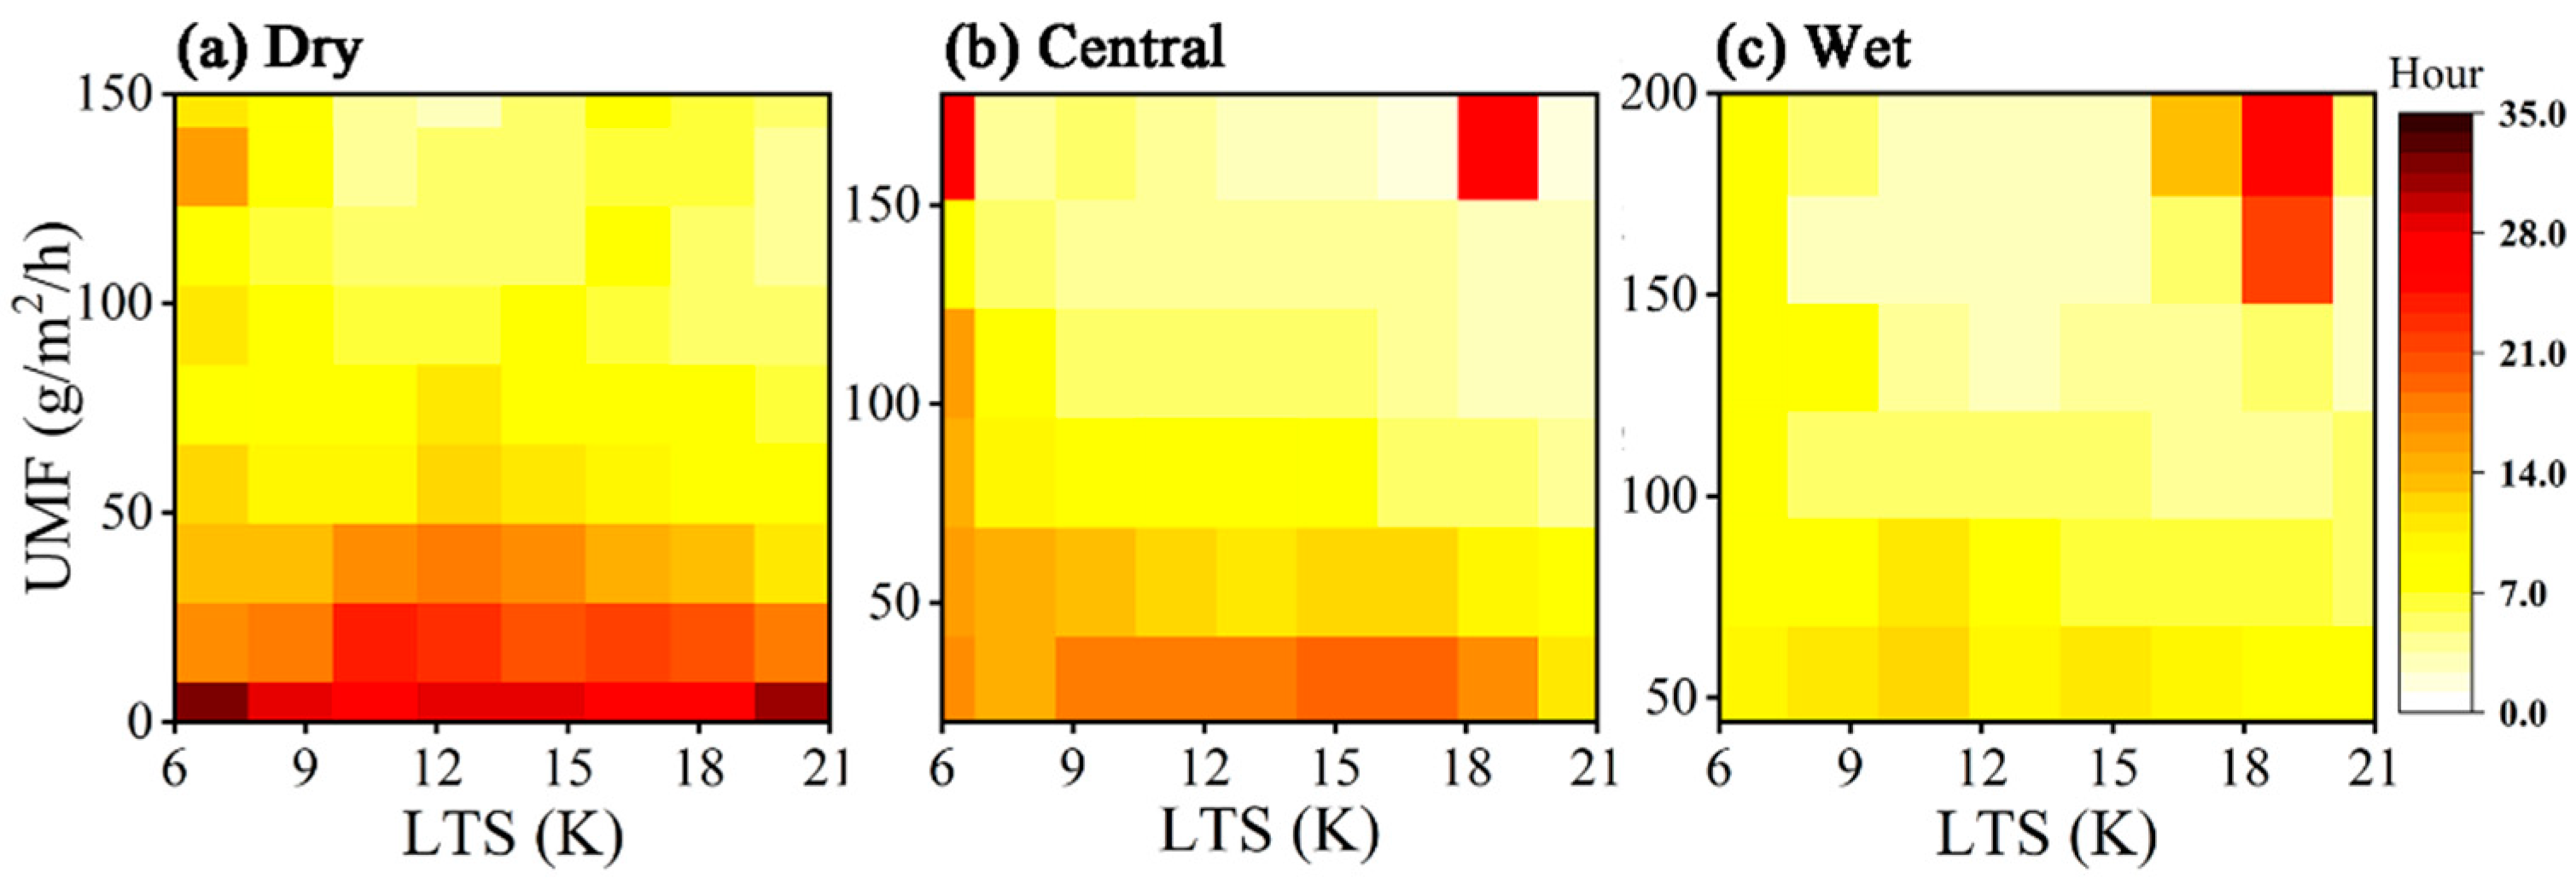
To investigate the combined contribution of the thermal and dynamic effects, the joint probability density distribution of the cloud-water period with the UMF and LTS in the three regions is shown in Figure 7. The cloud-water period decreases with the dry, central to wet region, and the cloud-water period decreases rapidly with increasing UMF in all zones, which is also consistent with the results shown in Figure 6. The variation in the cloud-water period with the LTS must be assessed in segments. At UMF < 100, the cloud-water period first increases and then decreases with the LTS. At UMF > 100, the cloud-water period first decreases and then increases with the LTS. This phenomenon is especially clear in the central and wet regions at UMF > 150. As the overall UMF is low in the dry region, namely, the UMF is mostly below 100, the response of the cloud-water period to the LTS in the dry region mainly occurs in the form of it first increasing and then decreasing. In contrast, the overall UMF in the wet region is mostly above 100 or even 150, so the response of the cloud-water period on the LTS in the wet region is mainly in the form of it first decreasing and then increasing. In other words, the different UMF configurations in the dry and wet regions lead to different response forms of the cloud-water period to the LTS, as shown in Figure 6b. The response of the cloud-water period on the dynamics is consistent, and this opposite response mechanism on the LTS between the dry and wet regions due to thermal differences may also be the main reason for the differences in the cloud water resources and cloud precipitation efficiency between these two regions under global warming.
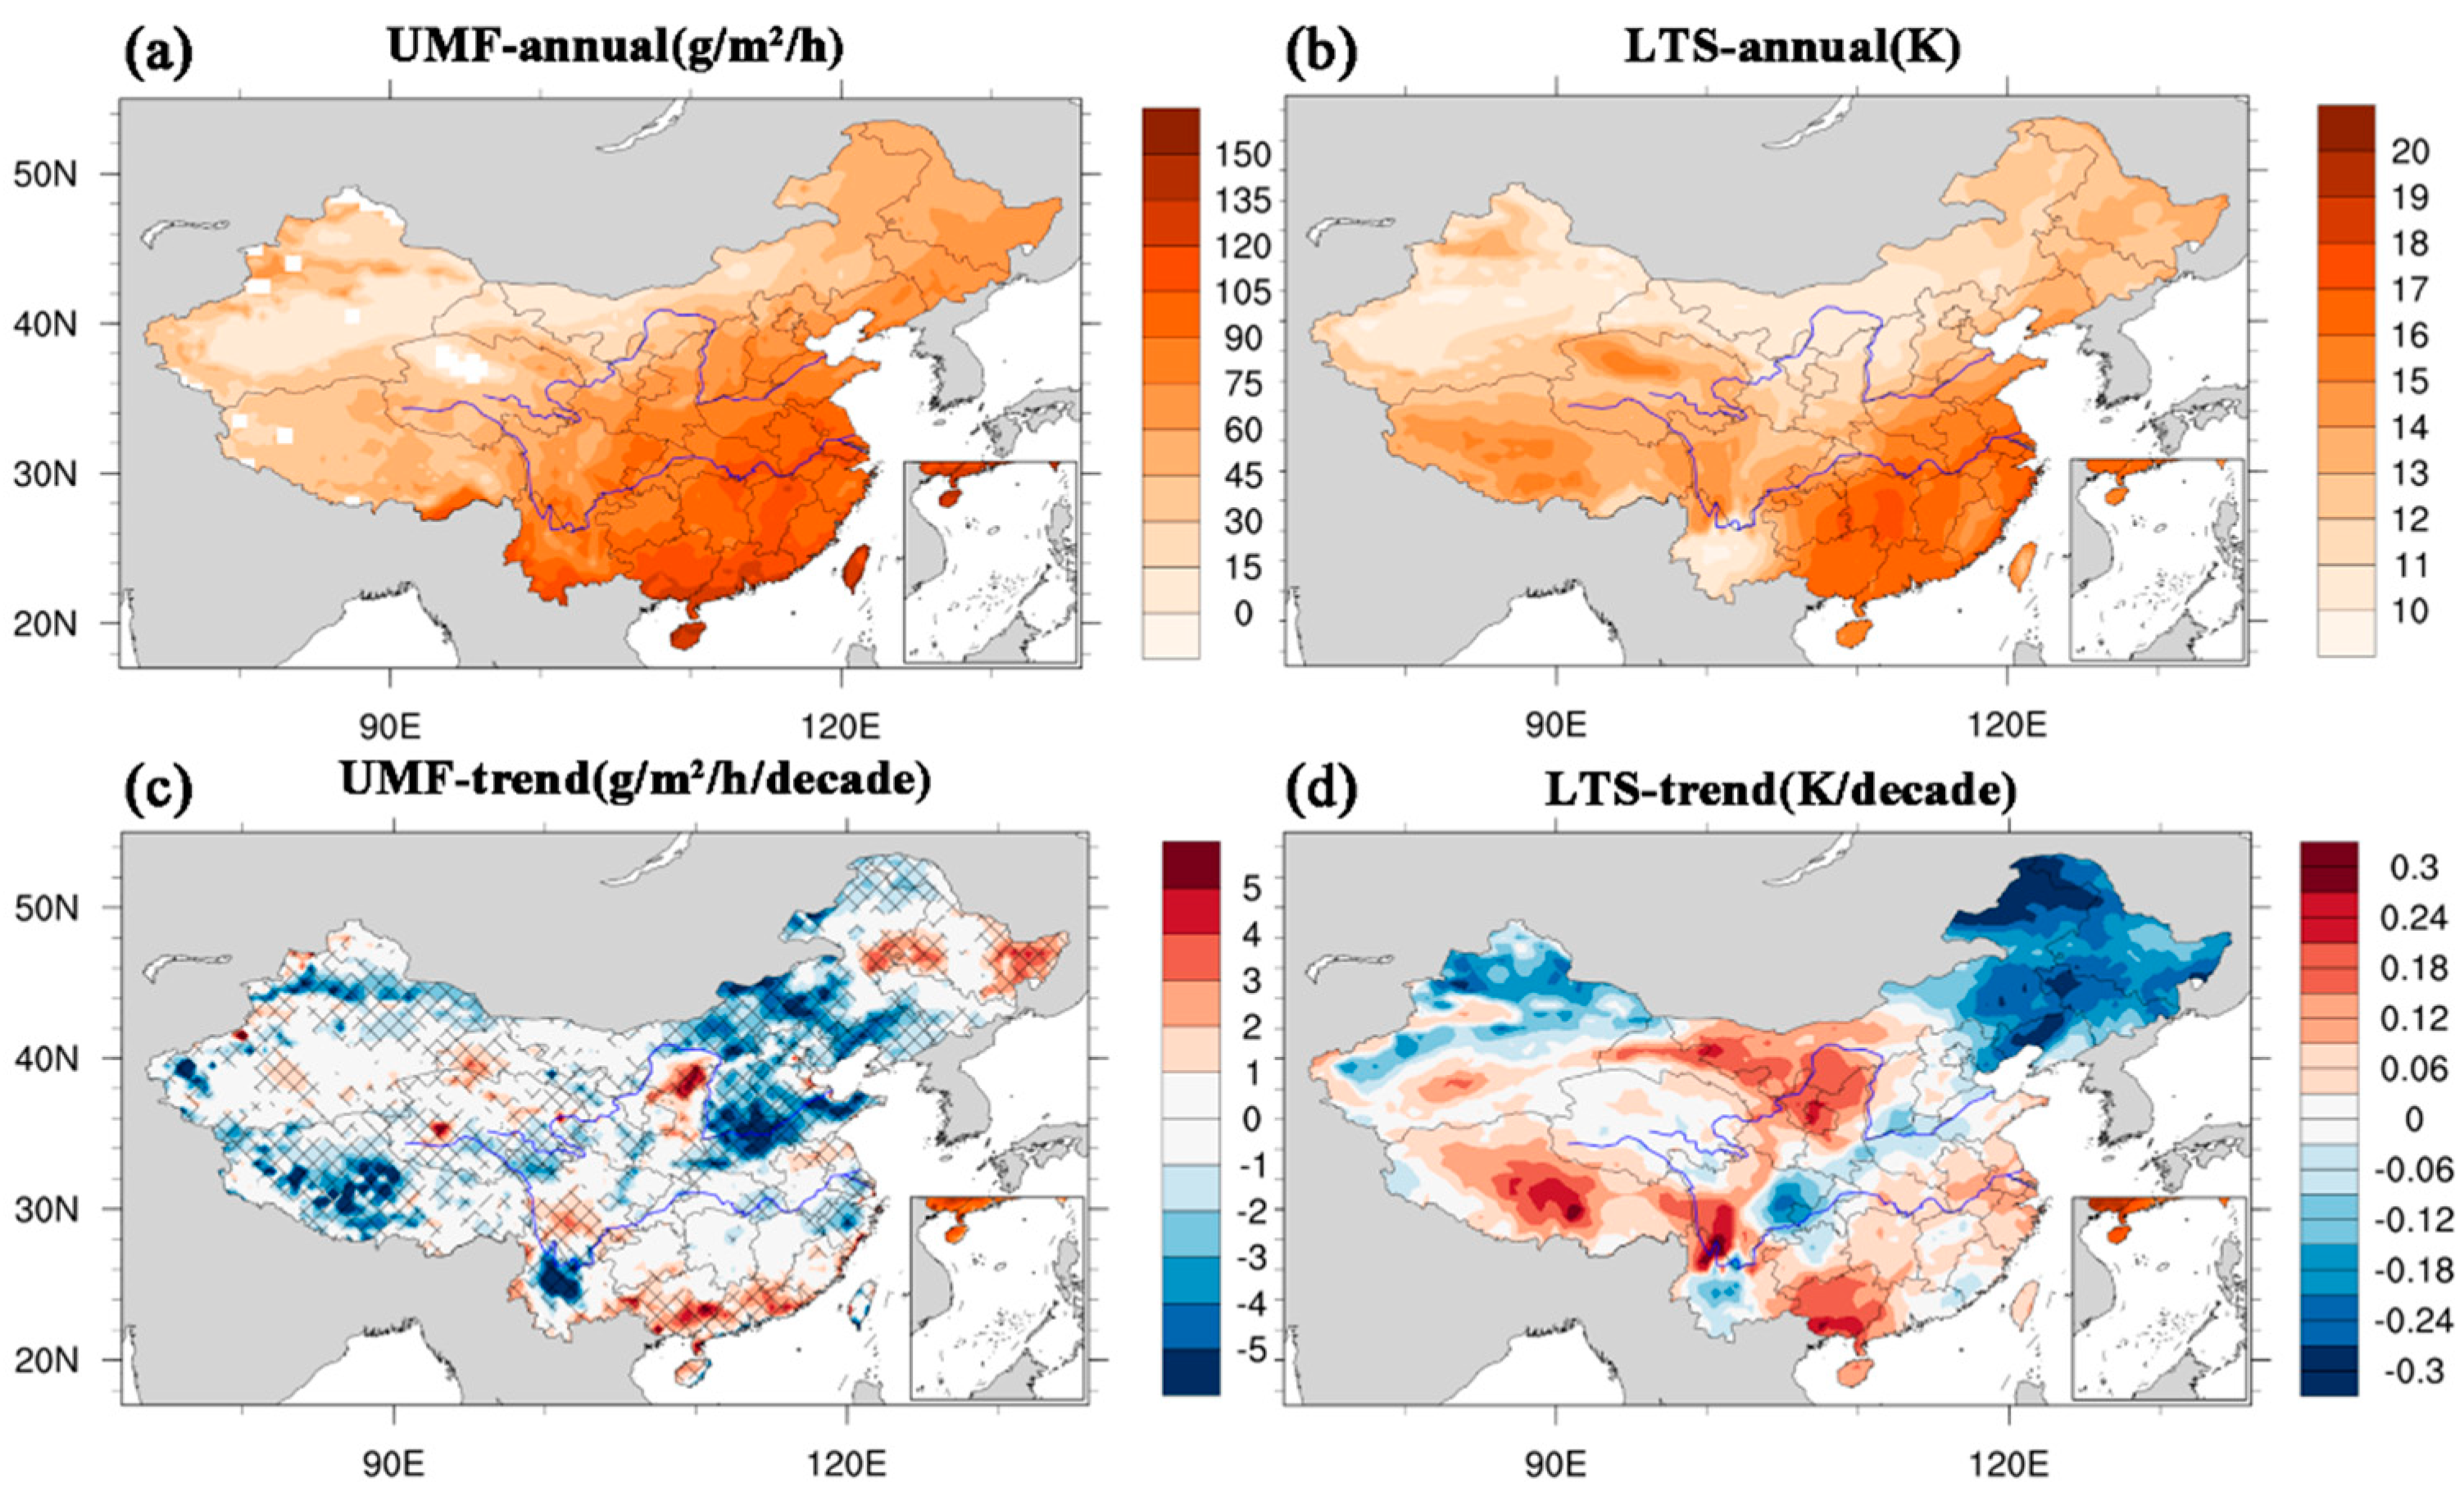
To verify that the joint configuration of the UMF and LTS indeed causes the differences in clouds and precipitation evolution between the different regions, the multiyear average and MK trend distributions of the UMF and LTS in China from 2001 to 2019 are shown in Figure 8. The annual UMF distribution is similar to that of precipitation, with a decreasing gradient from southeast to northwest. The overall UMF in the arid northwest region is below 50 g/m2/day, corresponding to the section of the cloud-water period that first increases and then decreases with the LTS, as shown in Figure 7. In contrast, the overall UMF in the southeast wet region is above 100 g/m2/day, which corresponds to the part of Figure 7 where the cloud-water period first decreases and then increases with the LTS.
The UMF, as shown in Figure 8c, experiences a significant decreasing trend mainly in the northwestern Tibetan Plateau and North China, and there are no significant changes in either the dry or wet region. The multiyear average distribution of the LTS is also high in the southeast and low in the northwest. The LTS in the northwest arid zone is small on average at approximately 11 K, and the LTS in northern Xinjiang and Northeast China continuously decreases, as shown in Figure 8d. Corresponding to the dry region, as shown in Figure 7, when the LTS decreases from 11 K, the cloud-water period accordingly decreases, which is also consistent with the actual trend indicating that the cloud-water period in the dry region continues to decrease (Figure 4b). The average LTS in the southeast wet region is large, at approximately 17 K, and there is a low increasing trend throughout the wet region. Corresponding to the wet region, as shown in Figure 7, when the LTS increases from 17 K, the cloud-water period increases. However, the cloud-water period in the wet region is small in magnitude, and the increasing trend does not pass the significance test. Through the above comparative verification, it is determined that the different configurations of the UMF and LTS play an important role in the evolution difference of cloud precipitation between the arid and wet regions. In a subsequent study, we will also apply the WRF model at small and medium scales to further verify any relevant results and explore the detailed processes of the UMF and LTS affecting cloud precipitation.
4. Discussion
There are obvious differences in cloud water path evolution and precipitation efficiency between the arid and wet regions in China over the last 20 years. Here, with precipitation and temperature datasets based on observations and MODIS satellite cloud water products, we assessed the regional cloud water resources and their response mechanisms of cloud precipitation in China over the last two decades. The trend estimation and testing of cloud water path changes using the Mann–Kendall trend test and Theil–Sen trend estimation. The trends in cloud water path were relatively small over last 20 years, but all passed the significance test. We also compared the trend results in other studies and found a regional average trend of ~5 g/m2 decade−1 [14], which is consistent with our work. The precipitation from 2001–2019 were retrieved from the site-based monthly ground precipitation 0.5° × 0.5° grid dataset V2.0 of China provided by the China Meteorological Administration (CMA) (http://data.cma.cn, accessed on 1 September 2020). The 0.5° × 0.5° grid products were obtained via spline interpolation based on the observation of 2472 stations across China. Previous studies have also indicated that these grid datasets of the precipitation are highly reliable and suitably represent the distribution evolution of the precipitation, respectively, which may be employed to study extreme precipitation events [20,29,30,31].
5. Conclusions
The cloud water path over China was assessed using MOD08_M3 data, and the national average annual liquid water path and ice water path were 157.47 ± 11.2 and 240 ± 17.6 g/m2, respectively, and the overall decreasing trend of the LWP and IWP over the last 20 years reached −3.3 and −4.89 g/m2 decade−1 (95% significance). The cloud water path has decreased year by year, with the greatest contribution originating from the wet region with a high precipitation and the most obvious decreasing trend. The lowest decrease in the cloud water path is observed in the semiarid region with a precipitation ranging from 500–800 mm.
The cloud-water period (the inverse of the cloud precipitation efficiency) is calculated to examine the response of cloud precipitation to global warming. The annual mean cloud-water period in China is approximately 12.4 h. The seasonal variation in the cloud-water period is obvious, with very large differences between winter and summer. Over the last 20 years, there has been a significant decrease in the cloud-water period in the dry region (−0.49 h/year in winter and −0.15 h/year in summer) and no significant change in the wet region. Compared to the wet region, the cloud water path in the dry region decreases more slowly, and water circulation gradually increases.
Finally, the upward moisture flux (UMF) and the lower tropospheric stability (LTS) were selected to examine the response mechanisms of the cloud-water period in terms of the dynamical and thermal contributions, respectively. Due to the overall low UMF in the dry region, the response of the cloud-water period to the LTS is mainly in the form of it first increasing and then decreasing. The response is the opposite in the wet region. The configuration of the UMF in Northwest and Southeast China remains unchanged, and the increase in cloud-precipitation efficiency in the dry region of Northwest China is accompanied by a continuous decrease in LTS. The different configurations of the UMF and LTS play an important role in cloud-precipitation evolution, which can be used as a diagnostic basis to predict changes in the precipitation intensity to a certain extent. The result is conducive to a better understanding of the response of the water cycle under future climate change and the rational development and utilization of cloud water resources.
Author Contributions
Conceptualization, X.C. and L.Z.; data curation, Q.G. and Z.Z.; formal analysis, J.L.; funding acquisition, L.Z. and J.L.; methodology, Q.G. and M.Z.; writing—review and editing, Q.G. All authors have read and agreed to the published version of the manuscript.
Funding
This research was funded by the National Natural Science Foundation of China grant number 41627807, 41605005 and 41521004.
Institutional Review Board Statement
The study did not involve humans or animals.
Informed Consent Statement
The study did not involve humans.
Data Availability Statement
The MODIS (Moderate Resolution Imaging Spectroradiometer) satellite observation-based level 3 product MOD08_M3 dataset was obtained from the National Aeronautics and Space Administration (NASA) (http://reverb.echo.nasa.gov/reverb/, accessed on 1 December 2020); ERA5 monthly average dataset was adopted from ECMWF (https://cds.climate.copernicus.eu/#!/home, accessed on 1 December 2020); Meteorological data from the site-based monthly ground temperature 0.5° × 0.5° grid dataset V2.0 and ground precipitation 0.5° × 0.5° grid dataset V2.0 of China provided by the China Meteorological Administration (CMA) (http://data.cma.cn, accessed on 1 September 2020).
Conflicts of Interest
The authors declare no conflict of interest.
References
- Soden, B.J.; Held, I.M. An assessment of climate feedbacks in coupled ocean-atmosphere models. J. Clim. 2006, 19, 3354–3360. [Google Scholar] [CrossRef]
- Huang, J.; Li, Y.; Fu, C.; Chen, F.; Fu, Q.; Dai, A.; Shinoda, M.; Ma, Z.; Guo, W.; Li, Z.; et al. Dryland climate change: Recent progress and challenges. Rev. Geophys. 2017, 55, 719–778. [Google Scholar] [CrossRef]
- Soden, B.J.; Broccoli, A.J.; Hemler, R.S. On the use of cloud forcing to estimate cloud feedback. J. Clim. 2004, 17, 3661–3665. [Google Scholar] [CrossRef]
- Trenberth, K.E.; Fasullo, J.T.; Mackaro, J. Atmospheric Moisture Transports from Ocean to Land and Global Energy Flows in Reanalyses. J. Clim. 2011, 24, 4907–4924. [Google Scholar] [CrossRef]
- Liu, J.; Shen, X.Y.; Li, X.F. Radiative Effects of Water Clouds on Heat, Cloud Microphysical and Surface Rainfall Budgets Associated with Pre-Summer Torrential Rainfall. Terr. Atmos. Ocean. Sci. 2014, 25, 39–48. [Google Scholar] [CrossRef] [Green Version]
- Manaster, A.; O’Dell, C.W.; Elsaesser, G. Evaluation of Cloud Liquid Water Path Trends Using a Multidecadal Record of Passive Microwave Observations. J. Clim. 2017, 30, 5871–5884. [Google Scholar] [CrossRef] [PubMed]
- Sui, C.H.; Li, X.F.; Yang, M.J.; Huang, H.L. Estimation of oceanic precipitation efficiency in cloud models. J. Atmos. Sci. 2005, 62, 4358–4370. [Google Scholar] [CrossRef]
- Shusse, Y.; Tsuboki, K. Dimension characteristics and precipitation efficiency of cumulonimbus clouds in the region far south from the mei-yu front over the eastern Asian continent. Mon. Weather Rev. 2006, 134, 1942–1953. [Google Scholar] [CrossRef] [Green Version]
- Langhans, W.; Yeo, K.; Romps, D.M. Lagrangian Investigation of the Precipitation Efficiency of Convective Clouds. J. Atmos. Sci. 2015, 72, 1045–1062. [Google Scholar] [CrossRef] [Green Version]
- Hobbs, P.V.; Matejka, T.J.; Herzegh, P.H.; Locatelli, J.D.; Houze Jr, R.A. The mesoscale and microscale structure and organization of clouds and precipitation in midlatitude cyclones. I: A case study of a cold front. J. Atmos. Sci. 1980, 37, 568–596. [Google Scholar] [CrossRef] [Green Version]
- Cohen, C.; McCaul, E.W. Further results on the sensitivity of simulated storm precipitation efficiency to environmental temperature. Mon. Weather Rev. 2007, 135, 1671–1684. [Google Scholar] [CrossRef] [Green Version]
- Elliott, R.D. California storm characteristics and weather modification. J. Atmos. Sci. 1958, 15, 486–493. [Google Scholar] [CrossRef] [Green Version]
- Clement, A.C.; Soden, B. The sensitivity of the tropical-mean radiation budget. J. Clim. 2005, 18, 3189–3203. [Google Scholar] [CrossRef] [Green Version]
- Liu, Y.H.; Luo, R.; Zhu, Q.Z.; Hua, S.; Wang, B. Cloud ability to produce precipitation over arid and semiarid regions of Central and East Asia. Int. J. Climatol. 2020, 40, 1824–1837. [Google Scholar] [CrossRef]
- IPCC. Climate Change 2007: The Physical Science Basis. Contribution of Working Group I to the Fourth Assessment Report of the Intergovernmental Panel on Climate Change; Solomon, S., Qin, D., Manning, M., Chen, Z., Marquis, M., Averyt, K.B., Tignor, M., Miller, H.L., Eds.; Cambridge University Press: Cambridge, UK; New York, NY, USA, 2007.
- Trenberth, K.E.; Fasullo, J.T.; Kiehl, J. Earth’s Global Energy Budget. Bull. Am. Meteorol. Soc. 2009, 90, 311–323. [Google Scholar] [CrossRef]
- Muller, C.J.; O’Gorman, P.A.; Back, L.E. Intensification of Precipitation Extremes with Warming in a Cloud-Resolving Model. J. Clim. 2011, 24, 2784–2800. [Google Scholar] [CrossRef] [Green Version]
- Zhai, P.M.; Zhang, X.B.; Wan, H.; Pan, X.H. Trends in total precipitation and frequency of daily precipitation extremes over China. J. Clim. 2005, 18, 1096–1108. [Google Scholar] [CrossRef]
- Jiang, Z.H.; Shen, Y.C.; Ma, T.T.; Zhai, P.M.; Fang, S.D. Changes of precipitation intensity spectra in different regions of mainland China during 1961–2006. J. Meteorol. Res. 2014, 28, 1085–1098. [Google Scholar] [CrossRef]
- Li, W.K.; Guo, W.D.; Xue, Y.K.; Fu, C.B.; Qiu, B. Sensitivity of a regional climate model to land surface parameterization schemes for East Asian summer monsoon simulation. Clim. Dyn. 2016, 47, 2293–2308. [Google Scholar] [CrossRef] [Green Version]
- Cai, M. Cloud Water Resources and Precipitation Efficiency Evaluation over China; Nanjing University of Information Science & Technology: Beijing, China, 2013. [Google Scholar]
- Wu, G.; Duan, A.; Liu, Y.; Mao, J.; Ren, R.; Bao, Q.; He, B.; Liu, B.; Hu, W. Tibetan Plateau climate dynamics: Recent research progress and outlook. Natl. Sci. Rev. 2015, 2, 100–116. [Google Scholar] [CrossRef] [Green Version]
- Sato, T.; Kimura, F. Impact of diabatic heating over the Tibetan Plateau on subsidence over northeast Asian arid region. Geophys. Res. Lett. 2005, 32. [Google Scholar] [CrossRef]
- Sun, H.; Liu, X. Impacts of dynamic and thermal forcing by the Tibetan Plateau on the precipitation distribution in the Asian arid and monsoon regions. Clim. Dyn. 2021. [Google Scholar] [CrossRef]
- Platnick, S.; King, M.D.; Meyer, K.G.; Wind, G.; Amarasinghe, N.; Marchant, B.; Arnold, G.T.; Zhang, Z.; Hubanks, P.A.; Ridgway, B. MODIS cloud optical properties: User guide for the Collection 6 Level-2 MOD06/MYD06 product and associated Level-3 Datasets. Version 2015, 1, 145. [Google Scholar]
- Gultepe, I.; Rabin, R.; Ware, R.; Pavolonis, M. Light Snow Precipitation and Effects on Weather and Climate. Adv. Geophys. 2016, 57, 147–210. [Google Scholar] [CrossRef]
- Gultepe, I.; Agelin-Chaab, M.; Komar, J.; Elfstrom, G.; Boudala, F.; Zhou, B. A Meteorological Supersite for Aviation and Cold Weather Applications. Pure Appl. Geophys. 2019, 176, 1977–2015. [Google Scholar] [CrossRef]
- Horváth, Á.; Davies, R. Comparison of microwave and optical cloud water path estimates from TMI, MODIS, and MISR. J. Geophys. Res. Atmos. 2007, 112. [Google Scholar] [CrossRef]
- Hong, Y.; Nix, H.A.; Hutchinson, M.F.; Booth, T.H. Spatial interpolation of monthly mean climate data for China. Int. J. Climatol. 2005, 25, 1369–1379. [Google Scholar] [CrossRef]
- Ren, Z.G.; Zhang, M.J.; Wang, S.J.; Qiang, F.; Zhu, X.F.; Dong, L. Changes in daily extreme precipitation events in South China from 1961 to 2011. J. Geogr. Sci. 2015, 25, 58–68. [Google Scholar] [CrossRef]
- Li, Z.X.; He, Y.Q.; Wang, C.F.; Wang, X.F.; Xin, H.J.; Zhang, W.; Cao, W.H. Spatial and temporal trends of temperature and precipitation during 1960–2008 at the Hengduan Mountains, China. Quat. Int. 2011, 236, 127–142. [Google Scholar] [CrossRef]
- Hersbach, H.; Bell, B.; Berrisford, P.; Hirahara, S.; Horányi, A.; Muñoz-Sabater, J.; Nicolas, J.; Peubey, C.; Radu, R.; Schepers, D. The ERA5 global reanalysis. Q. J. R. Meteorol. Soc. 2020, 146, 1999–2049. [Google Scholar] [CrossRef]
- Mann, H.B. Nonparametric tests against trend. Econom. J. Econom. Soc. 1945, 13, 245–259. [Google Scholar] [CrossRef]
- Kendall, M.G. Kendall Rank Correlation Methods; Griffin, C., Ed.; Oxford University Press: London, UK, 1975; ISBN 978-0195208375. [Google Scholar]
- Wang, W.; Chen, X.; Shi, P.; van Gelder, P.H.A.J.M. Detecting changes in extreme precipitation and extreme streamflow in the Dongjiang River Basin in southern China. Hydrol. Earth Syst. Sci. 2008, 12, 207–221. [Google Scholar] [CrossRef] [Green Version]
- Wilcox, R.R. Theil-Sen Estimator, Fundamentals of Modern Statistical Methods: Substantially Improving Power and Accuracy; Springer: New York, NY, USA, 2001. [Google Scholar]
- Guo, Q.; Liang, J.; Cao, X.; Zhang, Z.; Zhang, L. Spatiotemporal Evolution of Evapotranspiration in China after 1998. Water 2020, 12, 3250. [Google Scholar] [CrossRef]
- Han, J.Y.; Du, H.B.; Wu, Z.F.; He, H.S. Changes in Extreme Precipitation Over Dry and Wet Regions of China During 1961–2014. J. Geophys. Res. Atmos. 2019, 124, 5847–5859. [Google Scholar] [CrossRef]
- Donat, M.G.; Lowry, A.L.; Alexander, L.V.; O’Gorman, P.A.; Maher, N. More extreme precipitation in the world’s dry and wet regions. Nat. Clim. Chang. 2016, 6, 508–513. [Google Scholar] [CrossRef]
- Gultepe, I.; Sharman, R.; Williams, P.D.; Zhou, B.B.; Ellrod, G.; Minnis, P.; Trier, S.; Griffin, S.; Yum, S.S.; Gharabaghi, B.; et al. A Review of High Impact Weather for Aviation Meteorology. Pure Appl. Geophys. 2019, 176, 1869–1921. [Google Scholar] [CrossRef]
- Yang, B.; Qian, Y.; Lin, G.; Leung, R.; Zhang, Y. Some issues in uncertainty quantification and parameter tuning: A case study of convective parameterization scheme in the WRF regional climate model. Atmos. Chem. Phys. 2012, 12, 2409–2427. [Google Scholar] [CrossRef] [Green Version]
- Singh, M.S.; O’Gorman, P.A. Increases in moist-convective updraught velocities with warming in radiative-convective equilibrium. Q. J. R. Meteorol. Soc. 2015, 141, 2828–2838. [Google Scholar] [CrossRef] [Green Version]
- Hamada, A.; Takayabu, Y.N.; Liu, C.T.; Zipser, E.J. Weak linkage between the heaviest rainfall and tallest storms. Nat. Commun. 2015, 6, 6213. [Google Scholar] [CrossRef]
- Andersen, H.; Cermak, J.; Fuchs, J.; Knutti, R.; Lohmann, U. Understanding the drivers of marine liquid-water cloud occurrence and properties with global observations using neural networks. Atmos. Chem. Phys. 2017, 17, 9535–9546. [Google Scholar] [CrossRef] [Green Version]
- Klein, S.A.; Hartmann, D.L. The seasonal cycle of low stratiform clouds. J. Clim. 1993, 6, 1587–1606. [Google Scholar] [CrossRef] [Green Version]
- He, Y.P. How surface latent heat flux is related to lower-tropospheric stability in southern subtropical marine stratus and stratocumulus regions. Cent. Eur. J. Geosci. 2009, 1, 368–375. [Google Scholar] [CrossRef]
Figure 1.
Spatial distribution of the annual accumulated precipitation (in mm) from 2001 to 2019 in China (a) and the frequency distribution histogram of the multiyear average annual accumulated precipitation (in mm) (b). Three subregion divisions according to the annual precipitation (c).
Figure 1.
Spatial distribution of the annual accumulated precipitation (in mm) from 2001 to 2019 in China (a) and the frequency distribution histogram of the multiyear average annual accumulated precipitation (in mm) (b). Three subregion divisions according to the annual precipitation (c).

Figure 2.
Spatial distribution of the annual liquid water path (LWP) and ice water path (IWP) (in mm) from 2001 to 2019 in China (a,b) and its Mann–Kendall (MK) trend distribution (c,d). The blue contour color indicates a negative value, and red indicates a positive value. The grid line shading in the figure indicates the area that passed the 95% significance trend test. The national average evolution of LWP and IWP (e,f); the values in the top right corner indicate the linear fitting slopes.

Figure 3.
Annual evolution of the LWP and IWP (in g/m2) from 2001 to 2019 in the three subregions (a) and the variation in the cloud water path MK trend according to the annual precipitation (b). The gray dotted line is the linear fitting line. The brown line indicates the dry region, the gray line indicates the central region, and the green line indicates the wet region.

Figure 4.
Spatial distribution of the annual cloud-water period (in hours) and its MK trend from 2001 to 2019 in China (a) and its MK trend distribution (b). The blue contour color indicates a negative value, and red indicates a positive value. The grid line shading in the figure indicates the area that passed the 95% significance trend test. Seasonal evolution of the cloud-water period in the three subregions (c). Box chart of the cloud-water period trend in the three regions in winter and summer (d).

Figure 5.
Correspondence of the precipitation rate (divided into 30 equal intervals) with the cloud water path (a) and cloud-water period (b) in the three subregions. The brown line indicates the dry region, the gray line indicates the central region, and the green line indicates the wet region.
Figure 5.
Correspondence of the precipitation rate (divided into 30 equal intervals) with the cloud water path (a) and cloud-water period (b) in the three subregions. The brown line indicates the dry region, the gray line indicates the central region, and the green line indicates the wet region.

Figure 6.
Variation in the cloud-water period corresponding to the upward moisture flux (UMF) (a) and lower tropospheric stability (LTS) (b) in the different regions. The brown line indicates the dry region, the gray line indicates the central region, and the green line indicates the wet region.
Figure 6.
Variation in the cloud-water period corresponding to the upward moisture flux (UMF) (a) and lower tropospheric stability (LTS) (b) in the different regions. The brown line indicates the dry region, the gray line indicates the central region, and the green line indicates the wet region.

Figure 7.
Joint probability density distribution of the cloud-water period with the UMF and LTS in the dry (a), central (b), and wet regions (c). The color shaded area denotes the cloud-water period (in hours) averaged over each cell.
Figure 7.
Joint probability density distribution of the cloud-water period with the UMF and LTS in the dry (a), central (b), and wet regions (c). The color shaded area denotes the cloud-water period (in hours) averaged over each cell.

Figure 8.
Spatial distribution of the annual UMF and LTS from 2001 to 2019 in China (a,b) and its MK trend distribution (c,d). The blue contour color indicates a negative value, and red indicates a positive value. The grid line shading in the figure indicates the area that passed the 95% significance trend test.


Table 1.
Description of the datasets and variables used.
| Datasets | Variables | Time Scale | Resolution |
|---|---|---|---|
| CMA | Precipitation | 1961–2019 (monthly) | 0.5° × 0.5° |
| MODIS | Liquid water path Ice water path | 2001–2019 (monthly) | 1° × 1° |
| ERA5 | Upward moisture flux Temperature at 700 hPa | 1979–present (monthly) | 0.25° × 0.25° |
Publisher’s Note: MDPI stays neutral with regard to jurisdictional claims in published maps and institutional affiliations. |
© 2021 by the authors. Licensee MDPI, Basel, Switzerland. This article is an open access article distributed under the terms and conditions of the Creative Commons Attribution (CC BY) license (https://creativecommons.org/licenses/by/4.0/).
Share and Cite
MDPI and ACS Style
Guo, Q.; Cao, X.; Liang, J.; Zhang, Z.; Zhang, M.; Zhang, L. The Response of Cloud-Precipitation Recycling in China to Global Warming. Remote Sens. 2021, 13, 1601. https://0-doi-org.brum.beds.ac.uk/10.3390/rs13081601
AMA Style
Guo Q, Cao X, Liang J, Zhang Z, Zhang M, Zhang L. The Response of Cloud-Precipitation Recycling in China to Global Warming. Remote Sensing. 2021; 13(8):1601. https://0-doi-org.brum.beds.ac.uk/10.3390/rs13081601
Chicago/Turabian StyleGuo, Qi, Xianjie Cao, Jiening Liang, Zhida Zhang, Min Zhang, and Lei Zhang. 2021. "The Response of Cloud-Precipitation Recycling in China to Global Warming" Remote Sensing 13, no. 8: 1601. https://0-doi-org.brum.beds.ac.uk/10.3390/rs13081601
Note that from the first issue of 2016, this journal uses article numbers instead of page numbers. See further details here.