Article

Detection of Biogenic Oil Films near Aquaculture Sites Using Sentinel-1 and Sentinel-2 Satellite Images

by
Andromachi Chatziantoniou
1,*,
Alexandros Karagaitanakis
1,
Vasileios Bakopoulos
1,
Nikos Papandroulakis
2 and
Konstantinos Topouzelis
1
1
Department of Marine Sciences, University of the Aegean, 81100 Mytilene, Lesvos, Greece
2
Institute of Marine Biology, Biotechnology and Aquaculture, Hellenic Center for Marine Research, 19013 Anavyssos, Attiki, Greece
*
Author to whom correspondence should be addressed.
Submission received: 29 March 2021 / Revised: 26 April 2021 / Accepted: 27 April 2021 / Published: 30 April 2021

Abstract

:
Biogenic films are very thin surface oils, frequently observed near aquaculture farms, that affect the roughness and the optical properties of the sea surface, making them visible in SAR and multispectral images. The purpose of this study is to investigate the potential of satellite SAR and multispectral sensors in the detection of biogenic oil films near aquaculture farms. Sentinel-1 SAR and Sentinel-2 multispectral data were exploited to detect the films around three aquaculture sites. The study is divided in three stages: (a) preprocessing, (b) main process and (c) accuracy assessment. The preprocessing stage includes subset, filtering, land masking and image corrections. The main process was similar for both datasets, using an adaptive thresholding method to identify dark formations, extract and classify them. Finally, the performance of the algorithm was evaluated based on the estimation of standard classification error statistics. The evaluation of the results was based on empirical photointerpretation and in situ photos. The results are successful and promising, with overall accuracy over 70%, while both sensors are proved to be effective in the detection, with Sentinel-1 SAR presenting slightly better accuracy (81%) than Sentinel-2 MSI (70%). There is no evidence of these films causing stress to the aquaculture farms or the surrounding environment; however, our knowledge on their presence, amount and dissolution is limited and further knowledge could contribute to efficient feeding management and fish welfare.

1. Introduction

Satellite remote sensing (RS) offers a great advantage in continuous monitoring in terms of spatial and temporal coverage for large, inaccessible areas. The properties of different sensors provide a wide range of useful information on sea status and oceanographic phenomena (low wind areas, sea fronts, currents, oil spills, ocean color, surface temperature etc.). Aquaculture processes both affect and are affected by the marine environment in many ways.
Aquaculture, one of the most important economic activities related to the sea, is rapidly growing over the last few decades [1]. Along with rapid growth, aquaculture industry is dealing with constant challenges in terms of sustainability and viability, if it is in a harmonious coexistence with other activities in the coastal zone. Proper management is one of the challenges that is vital for both aquaculture industry and the environment.
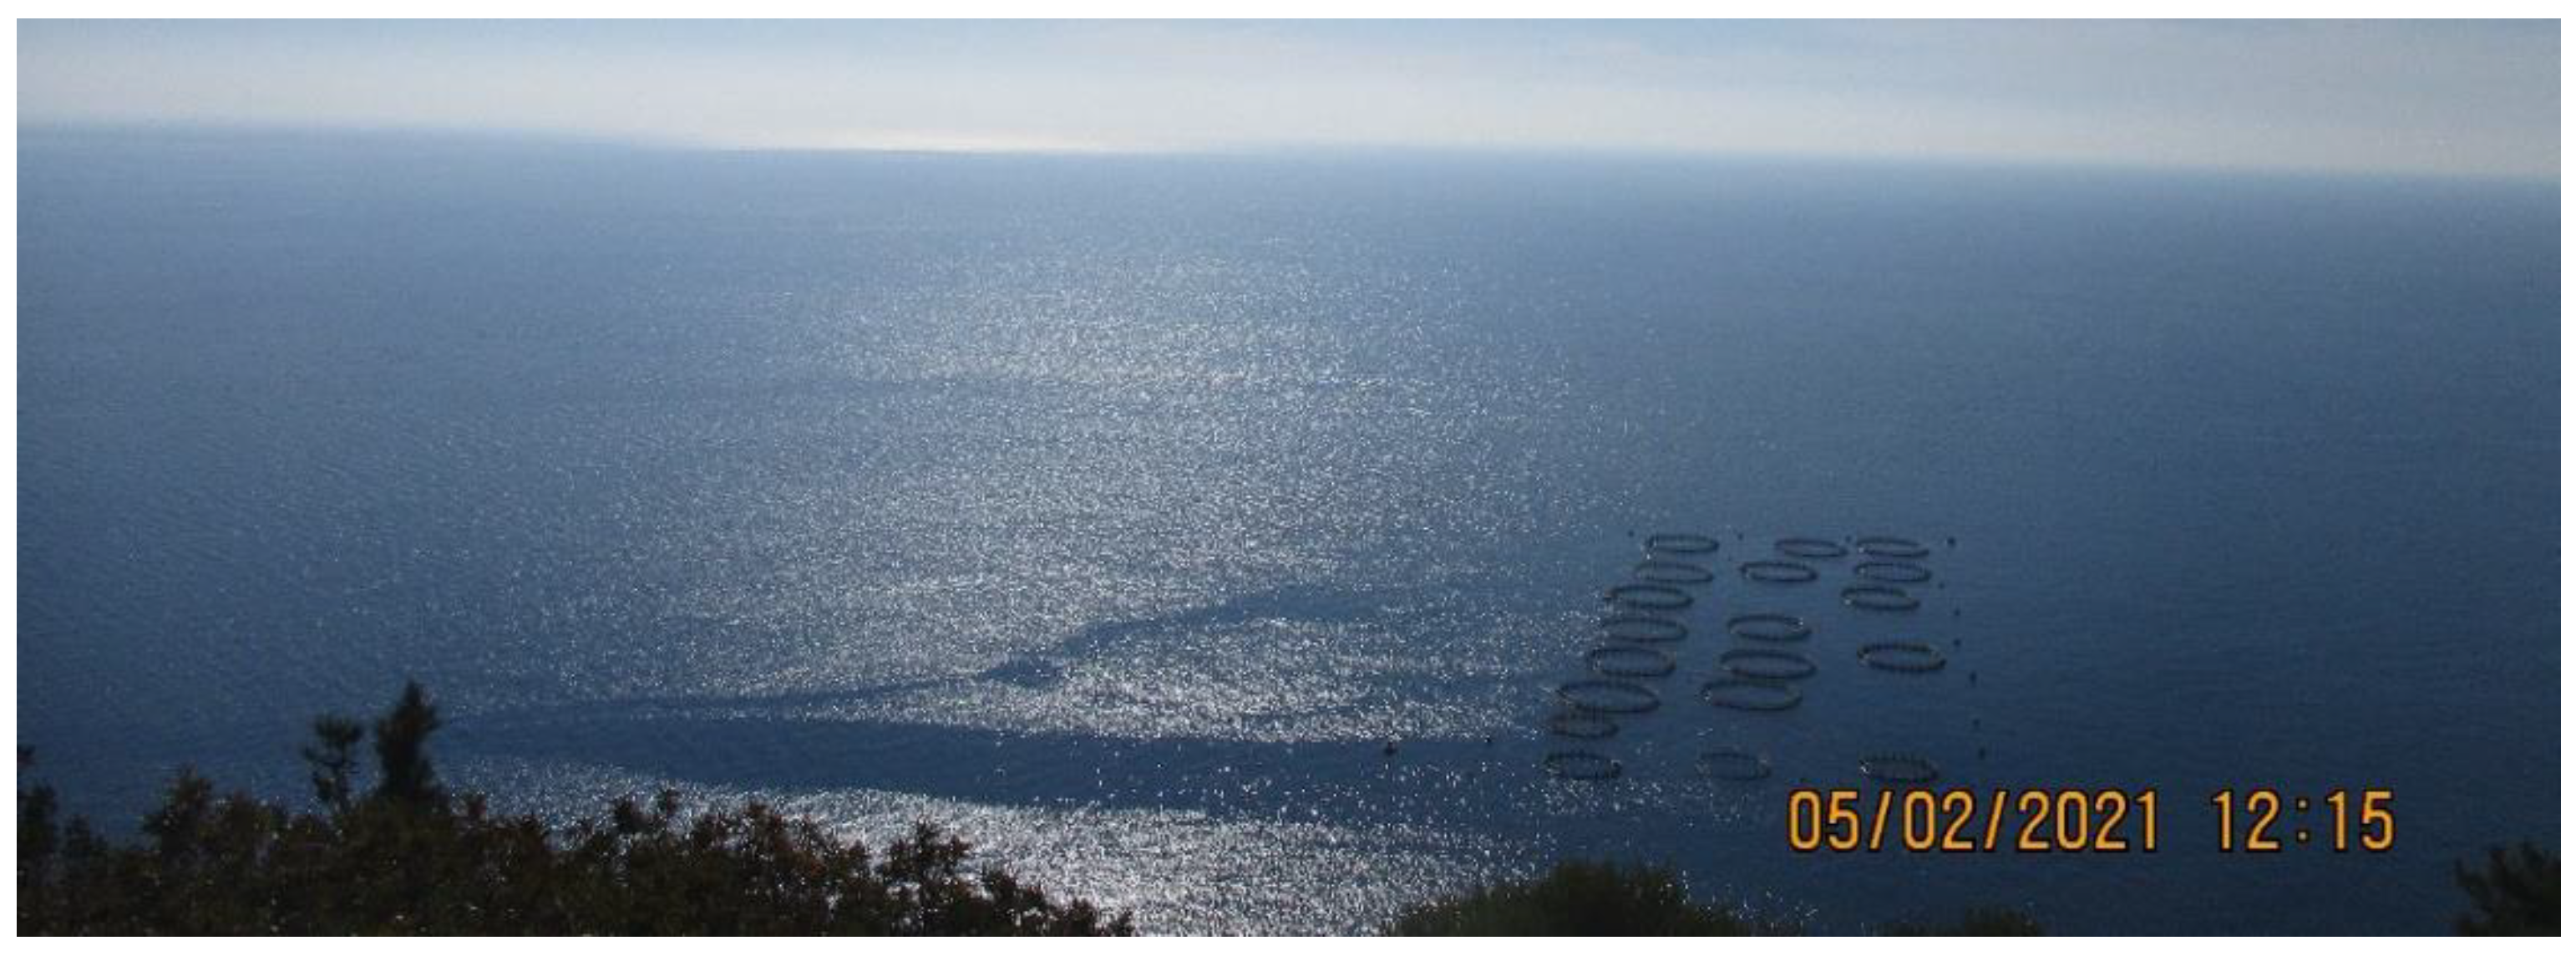
Several observations above aquaculture cages indicate, under certain environmental conditions, the existence of a surface film of biogenic origin attached to the cages (Figure 1), possessing hydrophobic properties and usually containing substances such as proteins, lipids, organic acids, saccharides and metals associated with the organic matter [2]. The films’ behavior (i.e., spreading, dispersion, moving direction etc.) is a result of the local conditions and their frequent observation near aquaculture sites is probably associated with anthropogenic activities in the area, such as feeding or liquid waste. Biogenic oil films are easily transferred through surface currents and have a short lifespan, while there is no evidence of causing any kind of stress to the aquaculture operation or the surrounding environment. However, our knowledge about its presence, amount and dissolution may provide important evidence for efficient feeding and fish health management. In this context, further research on the film origin and distribution is crucial in order to achieve major improvements in aquaculture management.
The type, quantity and thickness of any surface film affect its lifespan. Thicker oils such as mineral oils are more resistant to the wind speed, while biogenic oil films are overly sensitive to wind speed and waves, and are drifted away through surface currents. Their thickness (approximately 3 nm, according to [2]) allows only a few liters to cover large areas, but they are easily dissolved soon after their formation, making it extremely difficult to capture it in satellite images.
Oil films, in general, can be visible in synthetic aperture radar (SAR) images as they affect the sea surface roughness, causing the elimination of short gravity capillary waves and, consequently, the retractable radar signal [3,4,5,6]. Any oil film appears in the surface as a dark formation in SAR imagery. The Sentinel-1 SAR sensor provides high quality and continuous data for almost all Earth’s surface, high resolution data (30 m) in all weather and light conditions and is not affected by cloud coverage, while Sentinel-1A and Sentinel-1B are able to provide data with good temporal resolution, covering the same area almost daily or even twice a day for some areas.
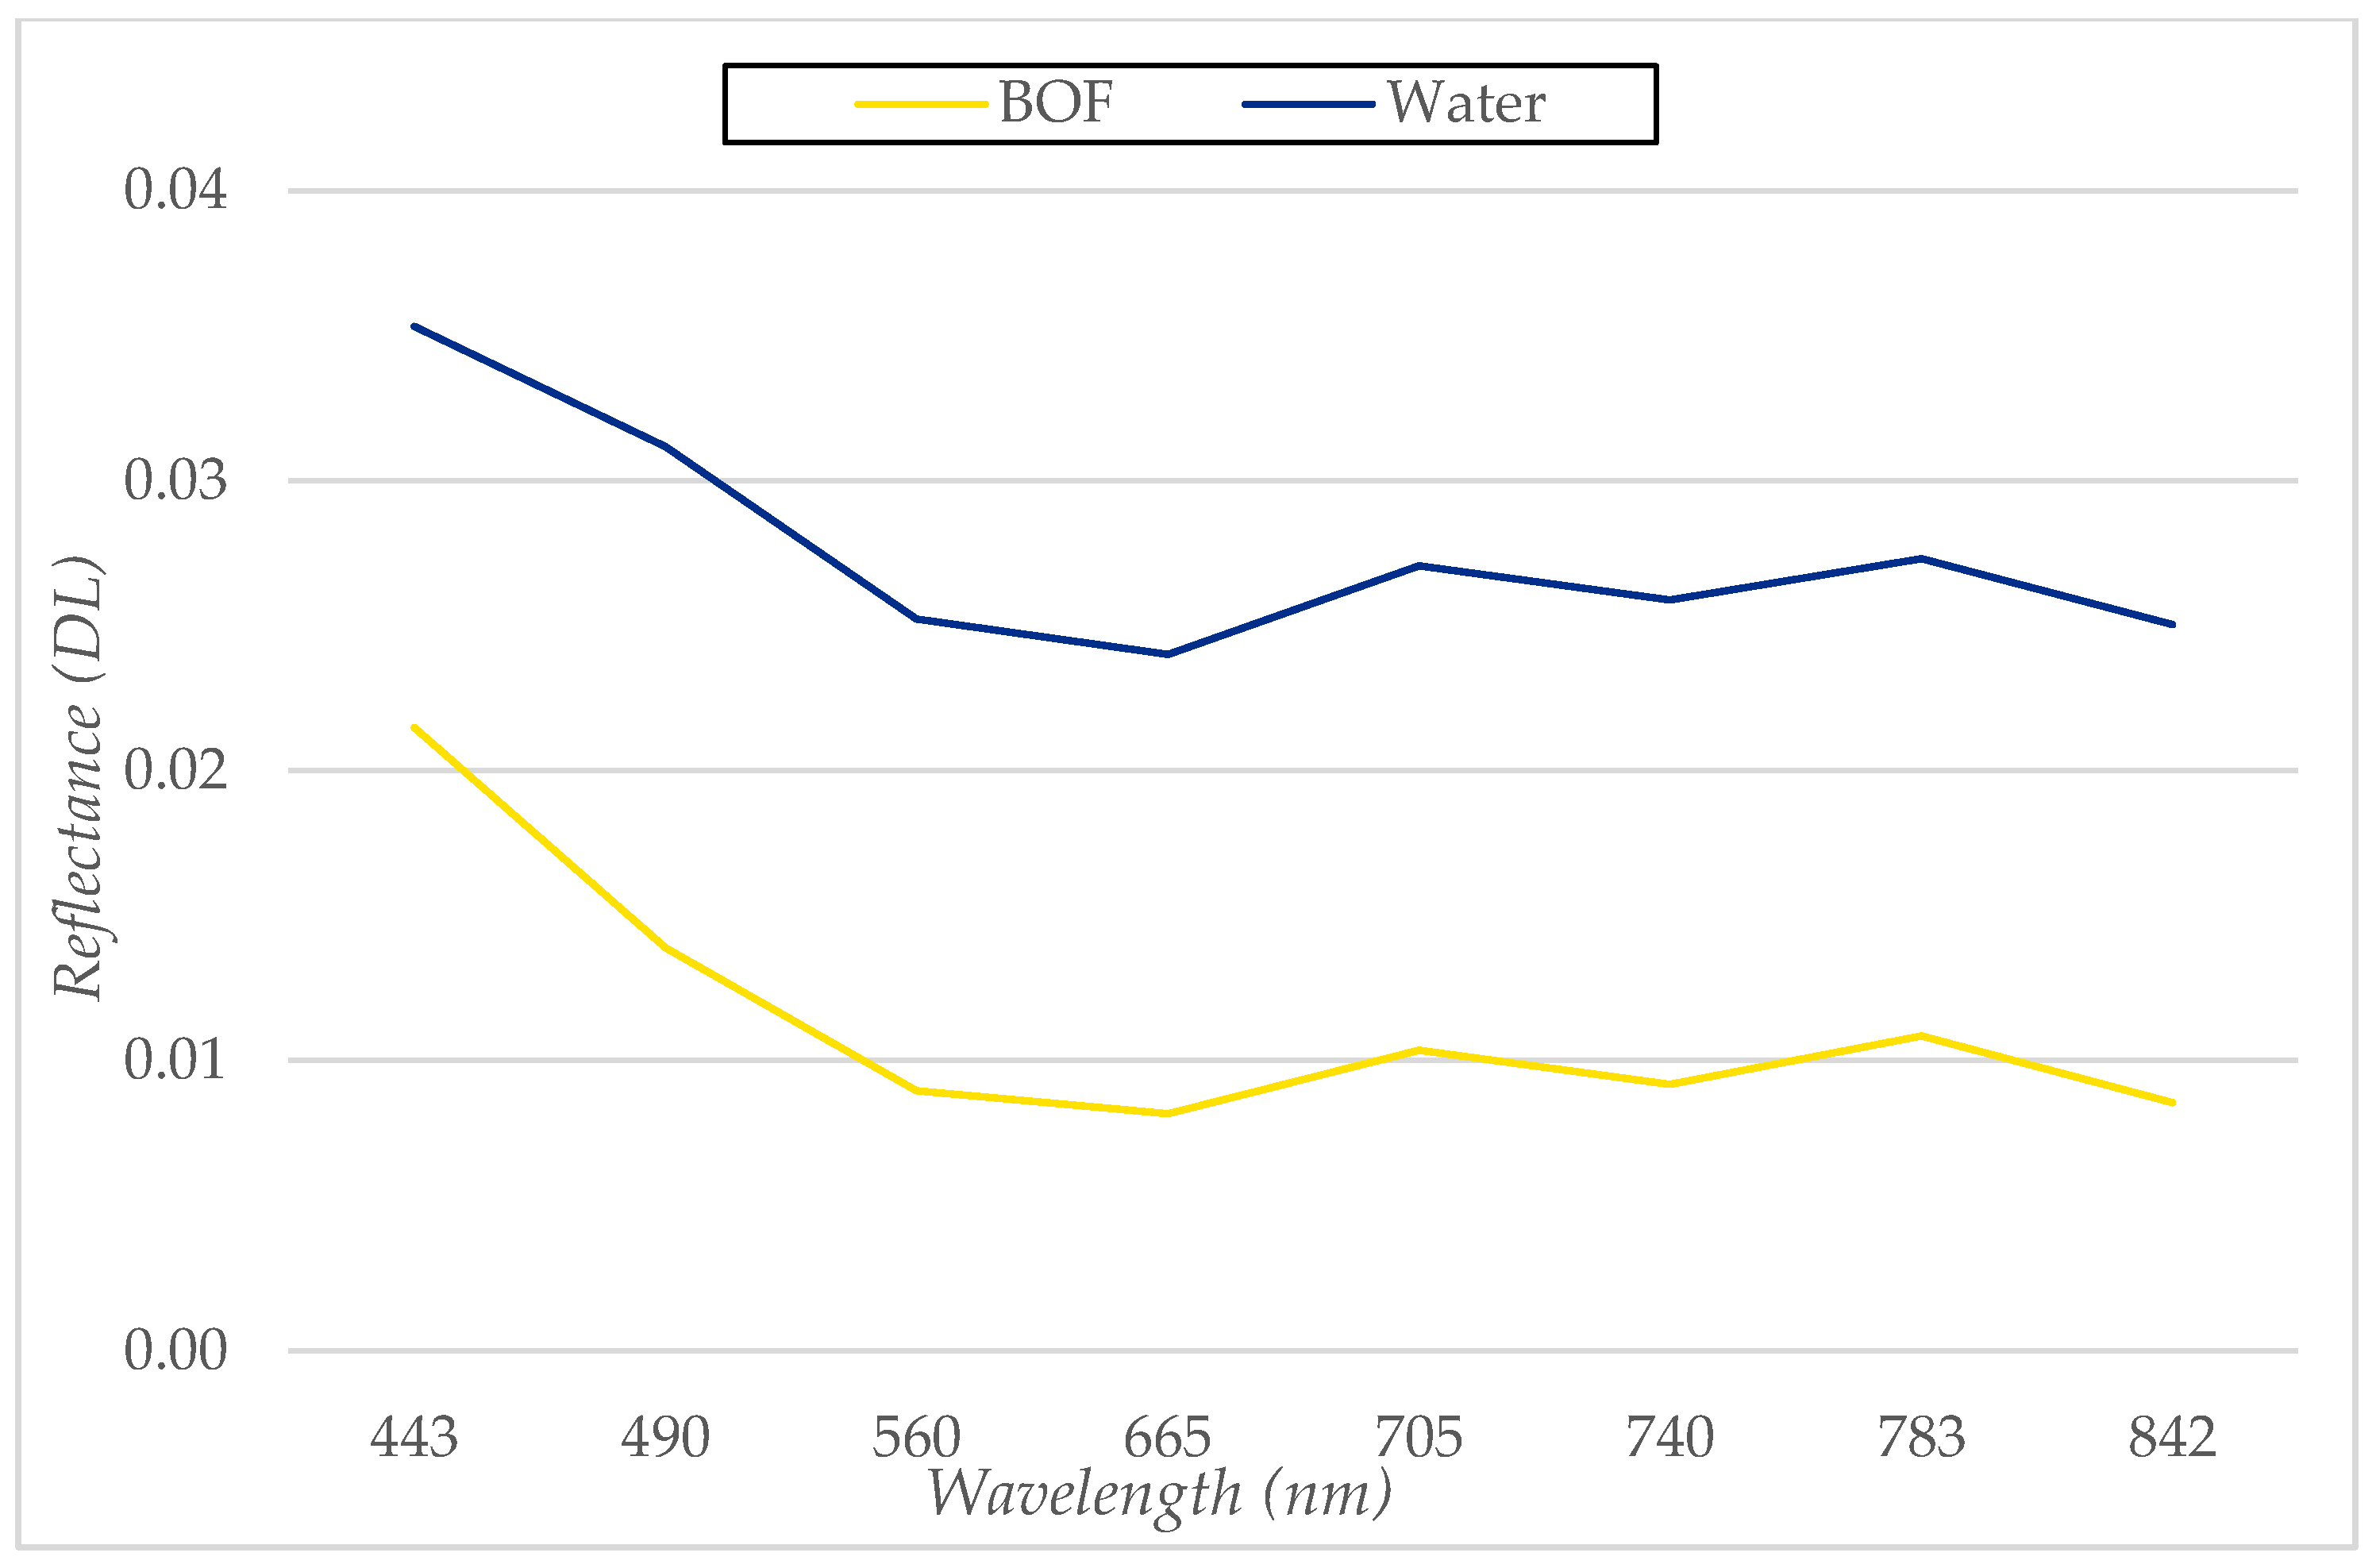
Optical images may also detect biogenic oil films, as they affect the optical properties of the sea surface. Surface oils absorb most of the visible light, resulting in lower reflectance values and, thus, they appear to be darker than the surrounding area. The thickness and optical properties of the film affect the spectral characteristics of the surface, resulting in different spectral signatures. Counter to SAR data, which already have a proven efficiency in detecting surface oils, optical data have not yet been widely exploited for the same purpose. Gade et al. [7,8] suggest that the influence of surface films in the emissivity at near-infrared (NIR) bands could make them visible in infrared bands, and a multisensor approach can have a significant contribution in oil spill detection. In addition, Kolokoussis and Karathanassi [9] developed an object-based methodology for detecting oil spills applied on optical Sentinel-2 images with promising results for both natural and mineral oils. Although there are a few studies that indicate the capability of optical sensors on detecting oil films [10,11,12], their efficiency has not yet been sufficiently explored. Sentinel-2 Multispectral Imager (MSI) provides high resolution imagery in visible and near-infrared bands (10 m) and global coverage every 5 days. Despite the limitation due to cloud coverage, Sentinel-2’s specifications provide a wide range of information that could contribute in oil spill detection.
While SAR sensors have proven their efficiency in the field [3,4,5,6,13,14,15,16] and the capabilities of multispectral sensors have been explored [9,10,11,12,17,18,19,20], the synergistic use of multispectral and SAR data has not yet been widely explored. To benefit from the capabilities of each different sensor, combined use of multispectral and SAR data has been suggested in recent studies [7,16,21].
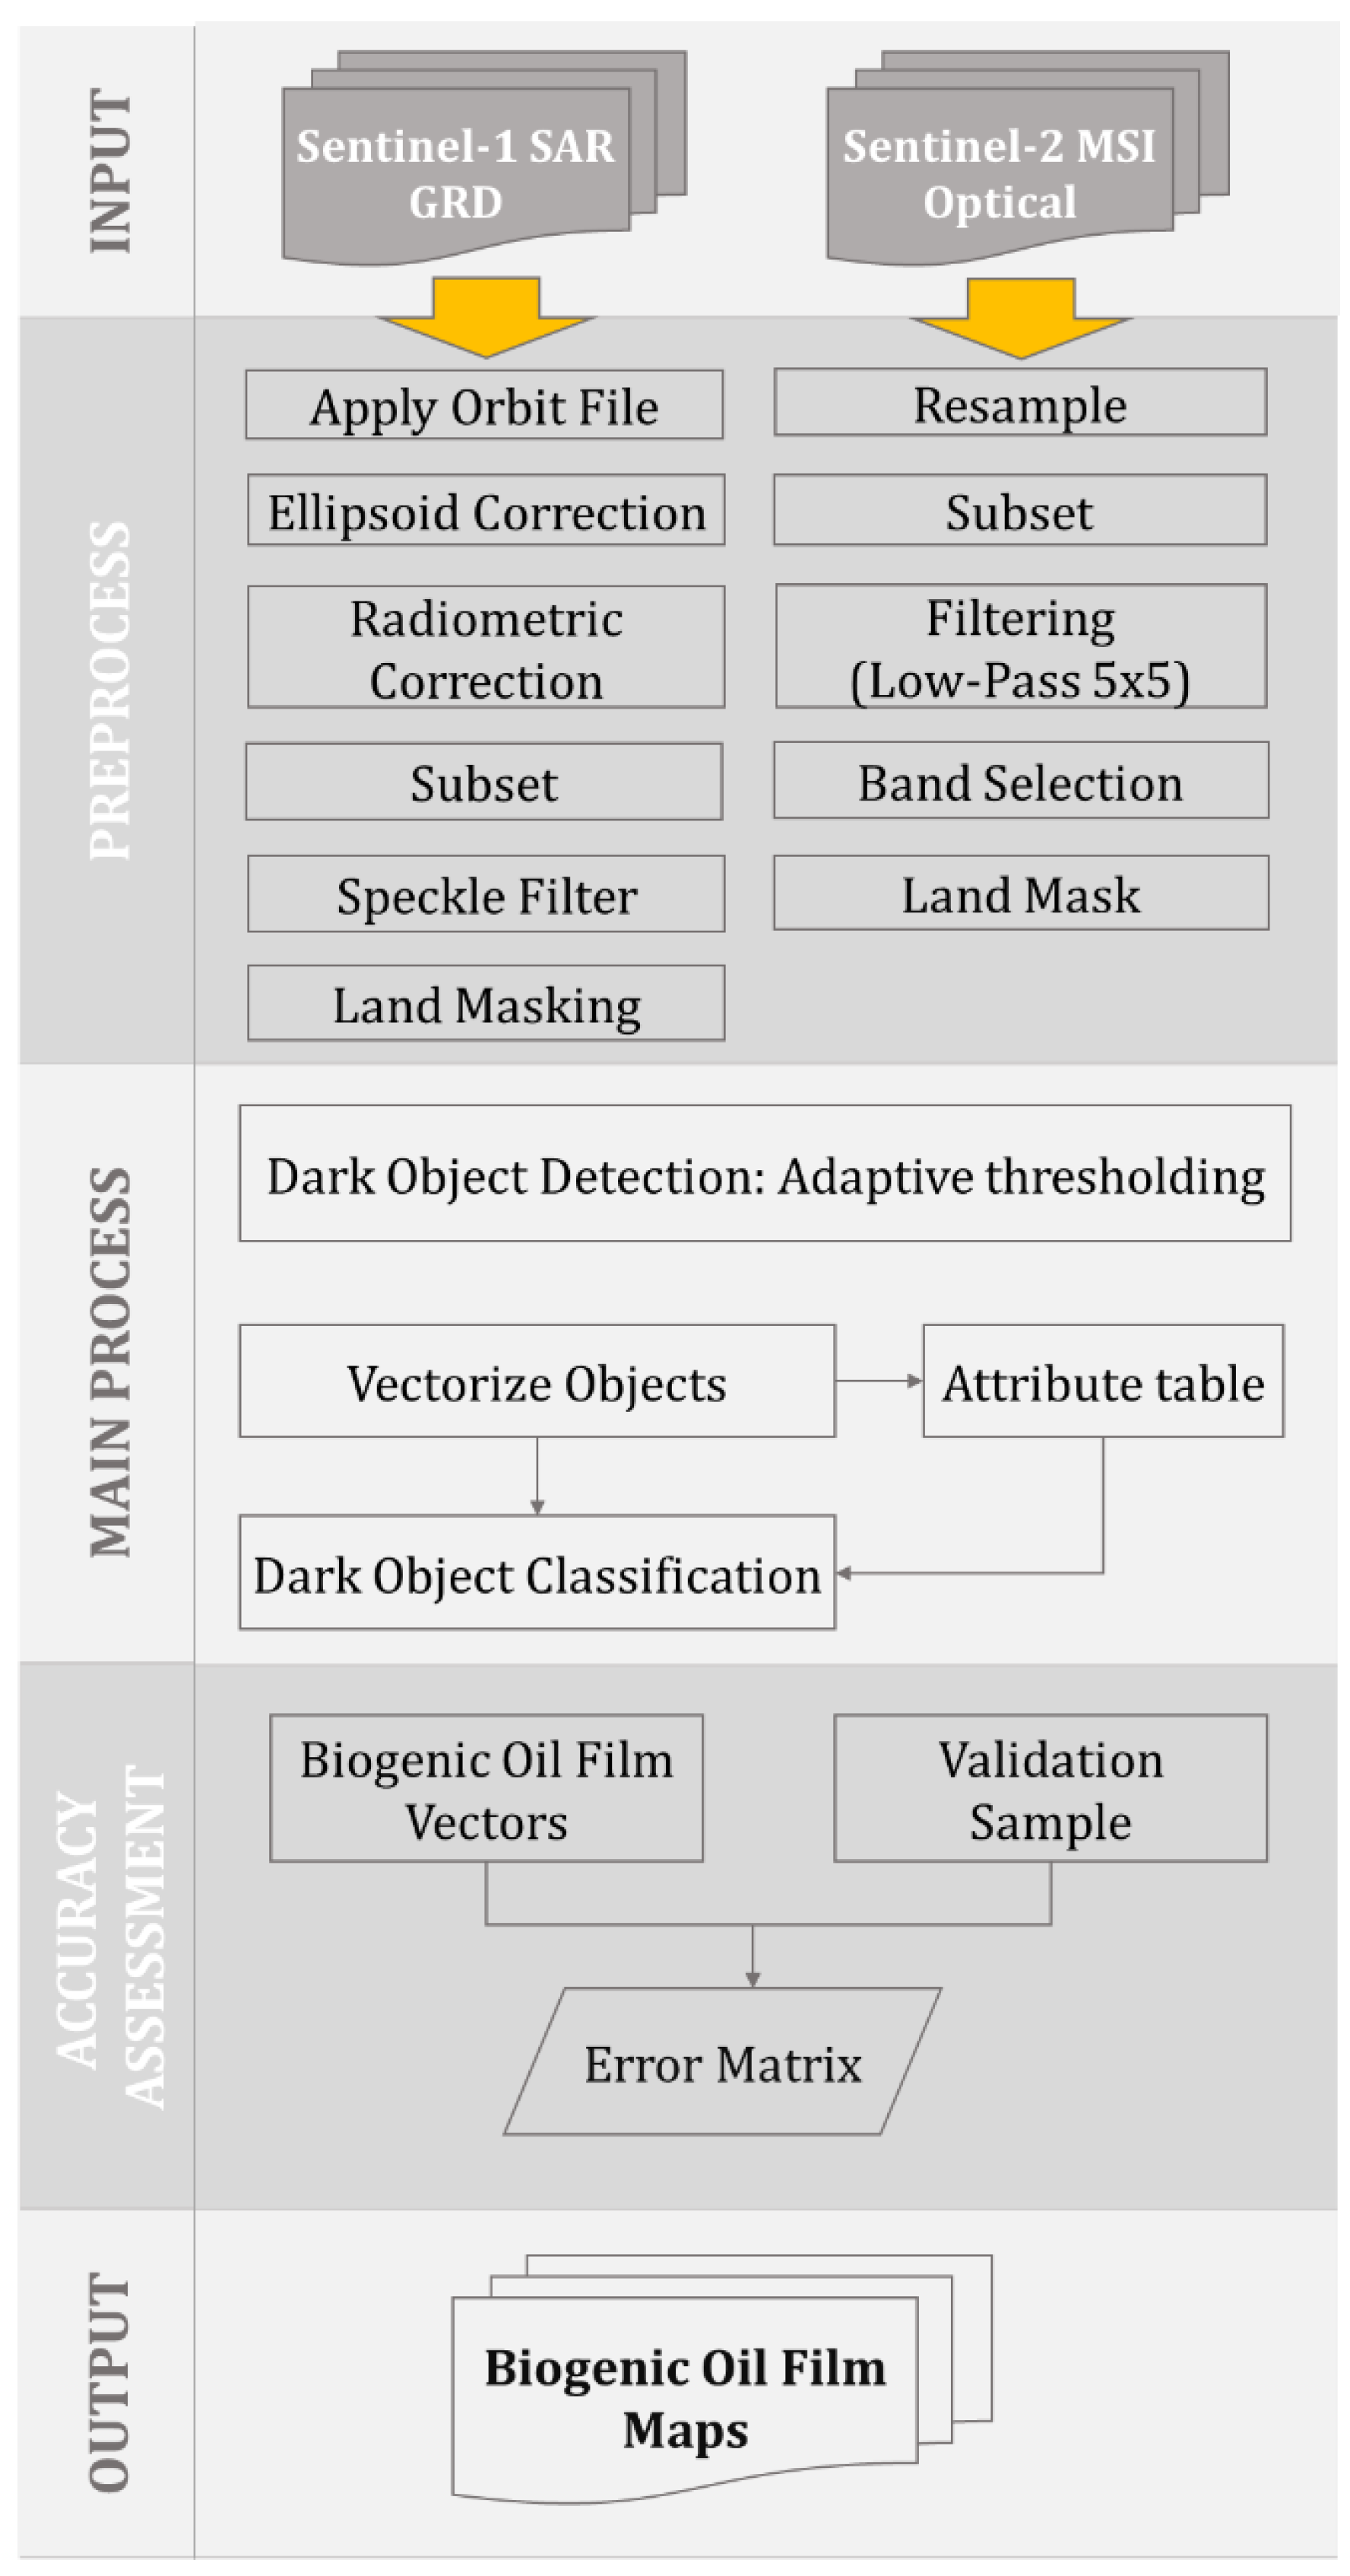
The purpose of this study is to investigate the potential use of satellite data for the detection of biogenic oil films near aquaculture farms by using Sentinel-1 SAR and Sentinel-2 multispectral data. The study includes three stages: (a) preprocessing, (b) main process and (c) accuracy assessment. During the first stage, satellite data are corrected and calibrated. The main process includes the identification of the dark formations and their classification in biogenic oil film or similar features. Lastly, in order to verify our results, the performance of the methodology is evaluated using an error matrix; complementary in situ photos are used for the dates of coincidence with satellite images.

2. Materials and Methods

2.1. Study Site

For the purposes of the study, the developed methodology is implemented in three different areas of interest: (a) Kratigos, (b) Karaburun Peninsula and (c) Ildir Bay (Figure 2). All areas are located in North Aegean Sea, close to the Greek and Turkish coastline. More specifically, the aquaculture farm in Site 1 (Kratigos) is in the southeast part of Lesvos Island in Greece, very close to the coastline and covered only on the north side from the main island (Figure 2). It is a small farm with a maximum 27 cages covering about 0.1 km2. The farms located in Site 2 (near Karaburun Peninsula) and in Site 3 (inside the Ildir Bay), are far from the coastline. The two farms in Site 2 have 28 cages (14 each) covering about 0.2 km2 and are operating with automatic feeders (Figure 2). Site 3 consists of five farms with 150 cages in total, covering an area of 0.4 km2. Farms in Sites 2 and 3 are considerably larger and not as close to the coast as the farm in Site 1.

2.2. Datasets

Data from Sentinel-1 (S1) and Sentinel-2 (S2) satellite missions were exploited to detect biogenic oil films near the aquaculture sites. Both missions are part of European Union’s Earth observation program “Copernicus” (https://www.copernicus.eu/en/about-copernicus, accessed on 28 April 2021) and the data were automatically downloaded from European Space Agency’s (ESA) Scientific Data Hub (https://scihub.copernicus.eu/, accessed on 28 April 2021).
Sentinel-1 is a synthetic aperture radar (SAR) mission providing data regardless of weather and light conditions and cloud coverage. Our input data were Level-1 ground range detected (GRD) products, multilooked and projected to ground range using an Earth ellipsoid model. Research has shown that VV polarization gives a better clutter to noise ratio (CNR) and is preferred for oil spill detection [3,4,5,6]. Surface oil films are indirectly detected in radar images due to the elimination of short gravity capillary waves, which are reflected as differences in the sea surface roughness.
The Sentinel-2 mission is mainly designed to be part of the land monitoring mission of the Copernicus program, but is widely used for coastal and inland waters as well. Sentinel-2 carries the optical sensor Multispectral Imager (MSI) providing high resolution optical imagery with spatial resolution of 10, 20 and 60 m and global coverage every 5 days. For our study, we used Level 2A bottom-of-atmosphere (BOA) products georeferenced in WGS84/UTM automatic zone (Zone 35) projection.
Sentinel-1 and Sentinel-2 datasets for the three areas of interest were acquired between 1 January 2019 and 30 July 2020. The dataset consisted of 740 S1 images and 150 S2 images. All tiles containing the areas of interest were saved locally and the images were further analyzed using Python open-source programming language. Additionally, information about the meteorological conditions (wind speed, wind direction, cloud coverage, temperature, precipitation) were obtained for the same dates to be used for further analysis (Global Forecast System (GFS) 13 km, https://old.windguru.cz/int/help_index.php?sec=models, accessed on 28 April 2021).

2.3. Methodology

Processing of satellite data was completed in three stages: (a) preprocessing, (b) main process and (c) accuracy assessment (Figure 3). The basic preprocessing steps were similar for both Sentinel-1 and Sentinel-2 data and include subsetting, filtering and image corrections. The main process was similar for both datasets, using an adaptive thresholding method to identify dark formations, extract and classify them. Accuracy assessment was conducted in the same way for both datasets, based on the estimation of standard classification error statistics. The evaluation of the results was based on empirical photointerpretation and in situ photos. The data acquired were processed using Python open-source programming language.

2.3.1. Sentinel-1 SAR Images

The first preprocessing step for Sentinel-1 data involved the update of the orbit state by applying the orbit file containing the accurate satellite position and velocity information, and then reproject our data. To perform this step, the ellipsoid correction was applied in order to reproject the data into the WGS84 coordinate system and UTM projection. In the next step, radiometric calibration was applied. The objective of SAR calibration is to provide imagery in which the pixel values can be directly related to the radar backscatter of the scene of the reflecting surface and therefore for comparison of SAR images acquired at different times. To reduce the processing time of the algorithm, the image was subset to the areas of interest using geographic coordinates. Additionally, a Lee Sigma 5 × 5 filter was applied to the images to reduce the usual “salt-and-pepper” effect [21]. Finally, the land pixels were removed using a land mask generated from an SRTM (Shuttle Radar Topography Mission) digital elevation model (DEM) [22].
Dark spot detection was conducted via an adaptive thresholding algorithm [4]. The algorithm estimates the local mean backscatter value of the pixels within a moving background window with predefined size. A threshold is set k decibel below the estimated local mean backscatter level. All pixels below the defined threshold are identified as dark spots. The moving window is shifted to the next position and the procedure is repeated until the whole scene is covered. The threshold shift was set at 2.0 decibel below the estimated local mean backscatter level. The background window size was selected after the examination of several different combinations. Our investigation indicated that the algorithm performance was adequate in terms of processing time and dark spot detection when the size of the background window is 0.1% ± 0.05% of the total pixels (Figure 4). Finally, the pixels detected as dark spots were clustered, forming objects and those with appropriate size preserved. The appropriate size of the objects was estimated by defining an upper and lower threshold that is different depending on the size of the scene and the purpose of the study.

2.3.2. Sentinel-2 Optical Images

Sentinel-2 Level 2 data are already georeferenced in the WGS84 coordinate system and projected in UTM projection. The first and essential step of Sentinel-2 preprocessing was the resampling of the images at 10 m resolution using the nearest neighbor method. The images were subset to the areas of interest using the same coordinates that we used for Sentinel-1. The analysis of the spectral signature of the biogenic oil film (Figure 5) illustrated that the film had lower reflectance values than water, which explains why it appears to be darker. Band 8 was selected for the dark spot detection as the film was easily detectable because it absorbs most of the near-infrared light and it also maintains the spatial resolution of 10 m [7,19]. The selected band was filtered using a low pass 5 × 5 filter and a land mask using the abovementioned SRTM DEM was applied.
The identification of the dark formations in Sentinel-2 was conducted using the local mean (m) and standard deviation (std) of the selected band (Band 8). The threshold for each scene was estimated using the difference between them (th = m − std). The adaptive threshold was used to exclude all the pixels with values higher than the defined value, which means that they were not considered as dark spots. The most appropriate thresholds were defined after taking into consideration the processing time, the size of the image and the size of the detected dark spots.
The application of the adaptive threshold led to binary images (dark spot masks) with a value of 1 for the dark spots detected and 0 for the other pixels (Figure 6). The masks were afterward converted from raster to polygons using a raster-to-vector algorithm, and the polygons were smoothed to avoid complicated shapes. The attribute table of the objects was enriched with information about their size and shape.
Several features are considered to contribute to the discrimination between oil slicks and similar features, referring to the geometrical, physical and textural characteristics of the objects [23]. In our classification scheme, the features with the greatest contribution were the size of the objects and their connection to the cages. Biogenic oil film is a thin surface oil that can cover large surfaces but dissolves soon after its development due to its vulnerability to the sea surface conditions, caused by strong winds and waves. In this context, biogenic oil film cannot be driven far from its source or cover a very large area. For this reason, after empirical testing the threshold for the objects’ size was 0.05–0.3 km2 and 0.05–0.7 km2 for farms at Site 1 and Sites 2 and 3, respectively. These thresholds correspond to the specific aquaculture features in the terms of size and feeding needs. Application to other aquaculture sites should take into consideration the adaptation of the thresholds according to their characteristics. Finally, the vectors produced were exported in a single shapefile for further analysis.

2.3.3. Accuracy Assessment

The efficiency of the algorithm was tested against manual classification after photointerpretation in 25% of the input images (338 images) and the detailed error matrix was computed as it allowed for evaluating the user’s and producer’s accuracy. Each scene was considered as individual, and the photointerpretation was conducted for each farm. In this context, the AOI in Site 1 contains one farm, Site 2 contains two farms and Site 3 contains five farms, so we examined a total of eight farms, one by one. The results were classified in two classes, “Biogenic Oil Film” and “Lookalike”.

3. Results

The methodology developed was applied in 430 images for each area of interest and the algorithm detected dark formations in 123 (28.6%) of them. The algorithm detected 80 dark formations in Sentinel-1 images (18.6%), although not all of them were truly biogenic oil films, while in Sentinel-2 images the positive cases were only 43 (10%). Most of the positive cases were detected from May to September (Figure 7) and in dates with low winds and cloud coverage.
For the results, presentation of our results omission report and commissions errors are selected, which are complementary to user’s and producer’s accuracy (PA = 100% − OE, UA = 100% − CE) since they are focused on the errors of the classification.
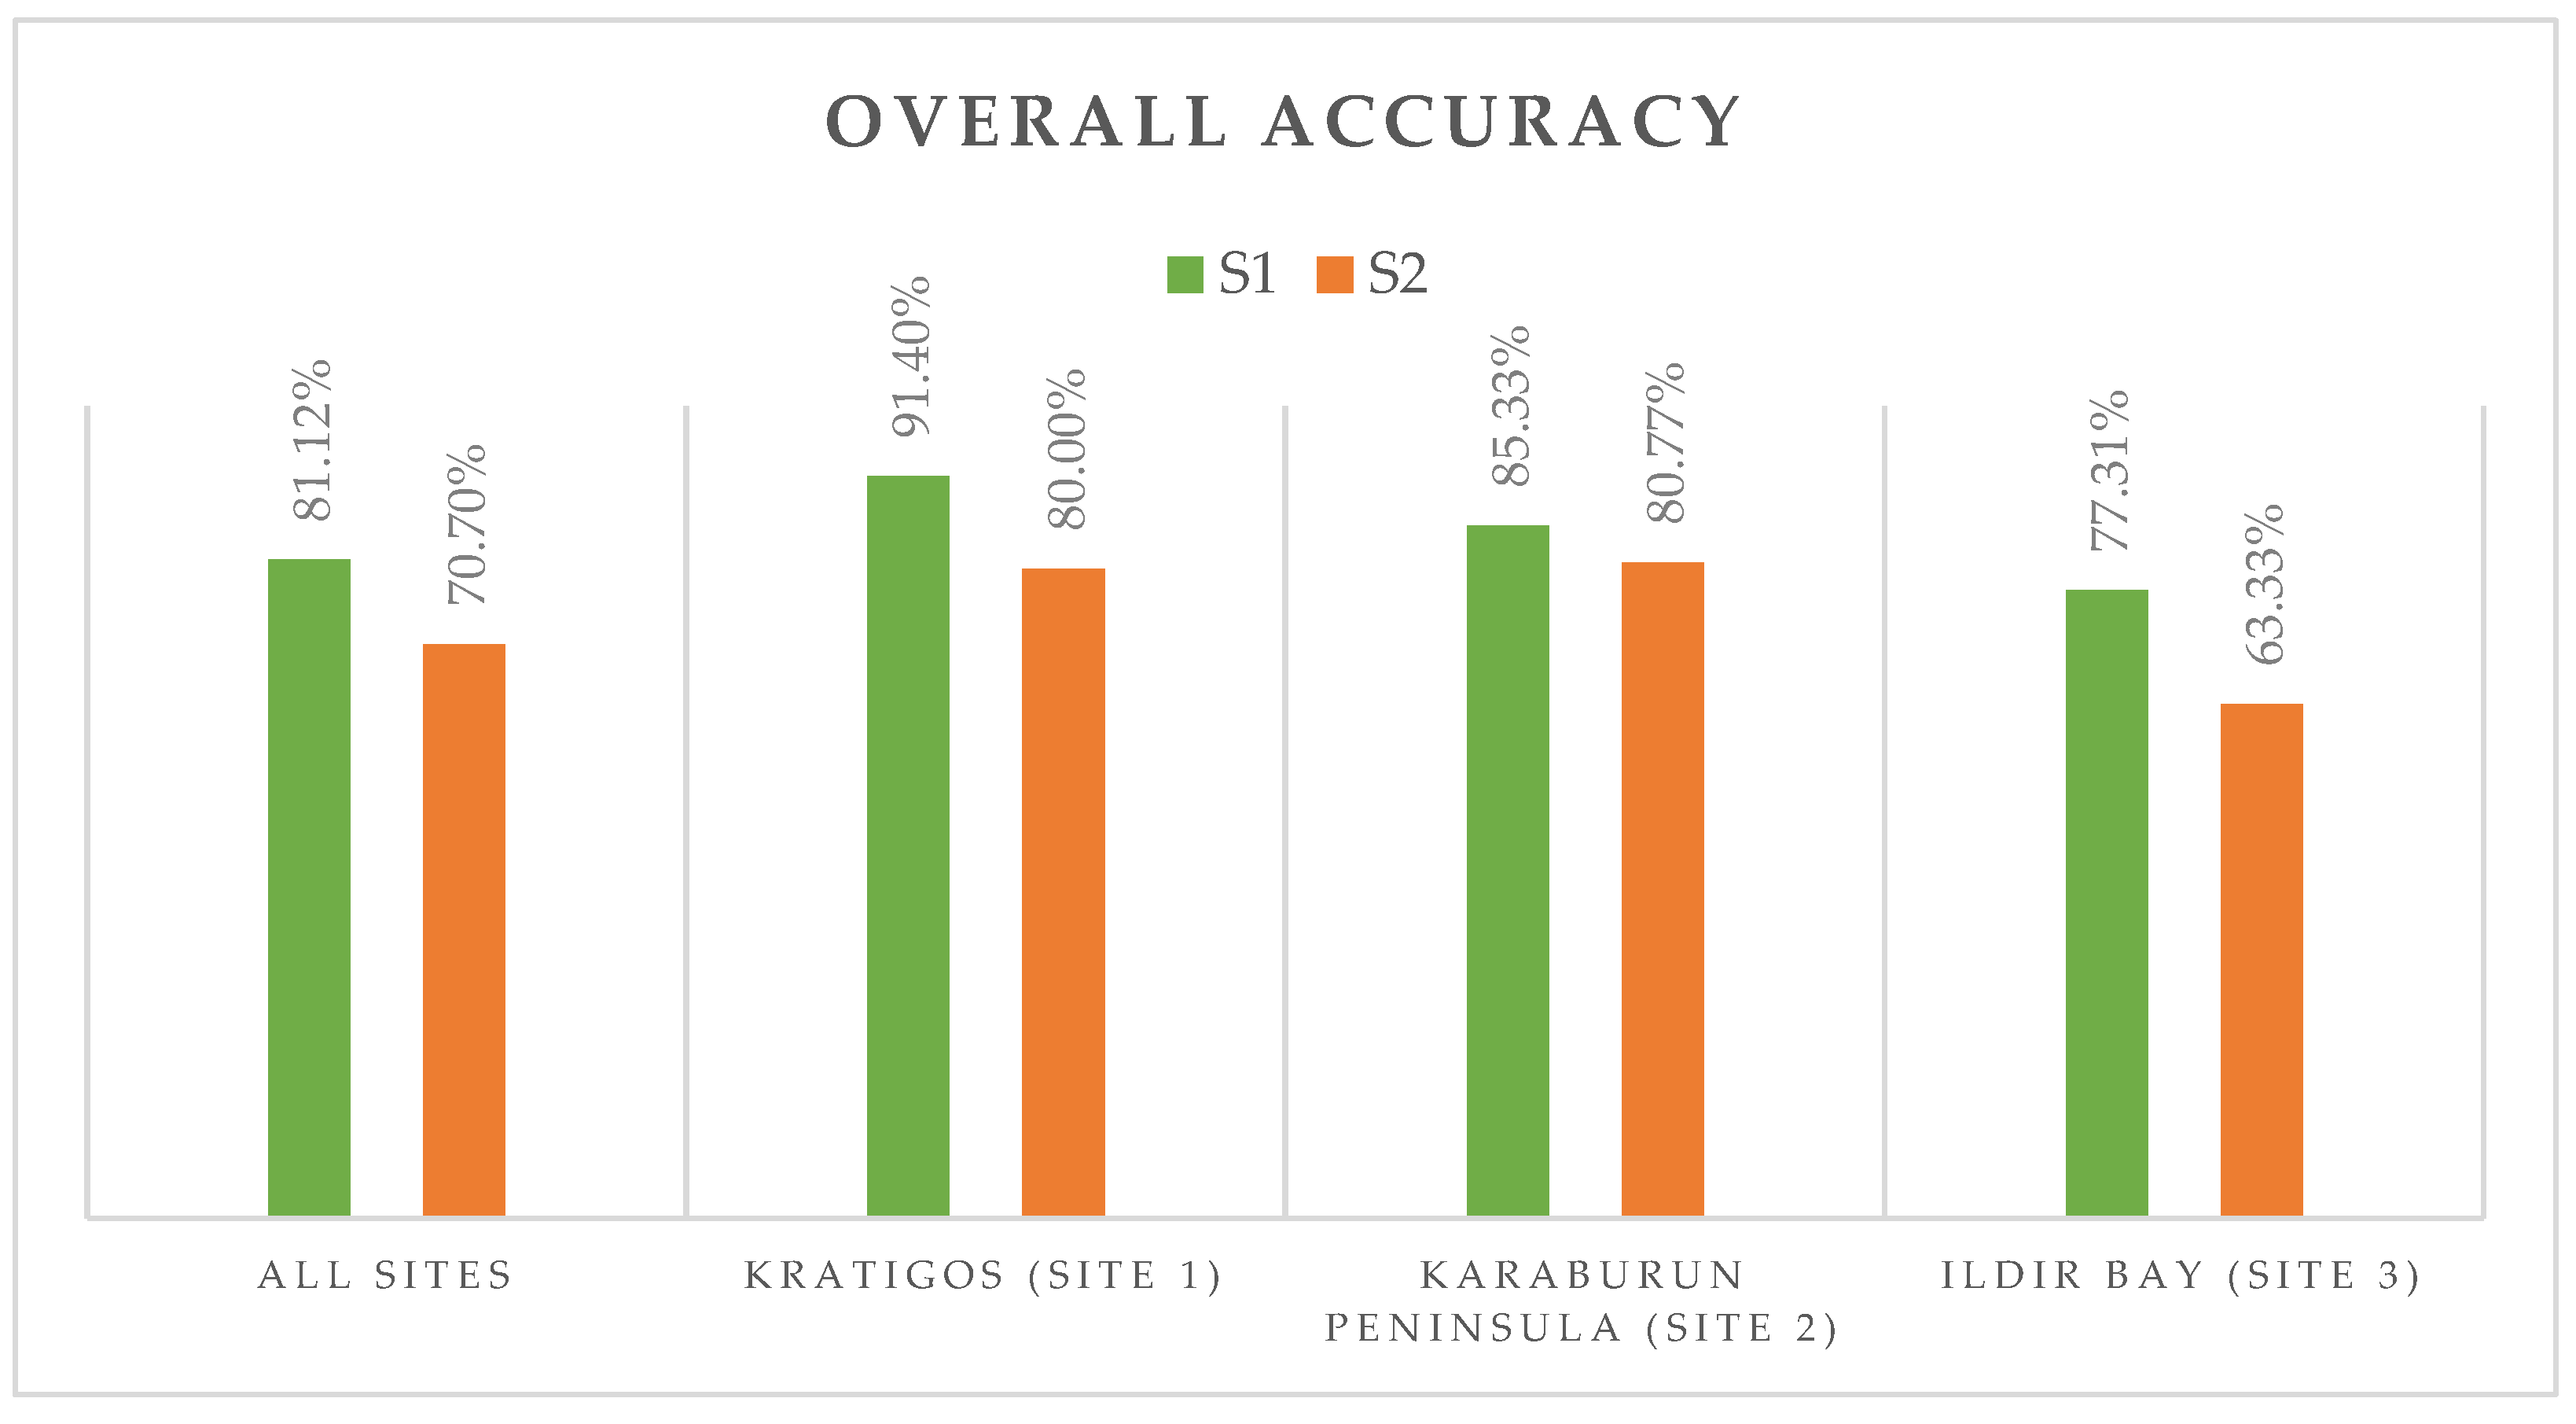
For Sentinel-1 SAR data, overall accuracy reached 81% in total (kappa = 0.33), 91.4% in Site 1, 85.3% in Site 2 and 77.3% in Site 3 (Figure 8). Overall accuracy in the three different areas indicates that the algorithm performs better when the area is less complicated with less farms (Site 1: 1 farm, Site 2: 2 farms, Site 3: 5 farms). However, the omission error was high in all areas for Sentinel-1 data (69%) and many cases were characterized as false negative (Figure 9). This observation shows that in Sentinel-1 data the algorithm underestimates the detection. On the contrary, commission error was very low (less than 35% in all cases, 15% in total) pointing out that there were no major misclassifications.
Overall accuracy for Sentinel-2 data is 70.7% (kappa = 0.40), ranging between 60% and 80% in the three areas (Figure 8). Similar to Sentinel-1, accuracy is higher for areas with fewer units, i.e., 80%, 80.8% and 63.3% for Site 1, 2 and 3, respectively. Omission errors in the case of Sentinel-2 data are fewer than Sentinel-1 (44%), and commission error is not significantly higher (19% in total) (Figure 9). Especially for Ildir Bay, commission error is only 5% and omission is 10% (Figure 9). The algorithm performed well in terms of underestimation; however, more misclassifications were observed.
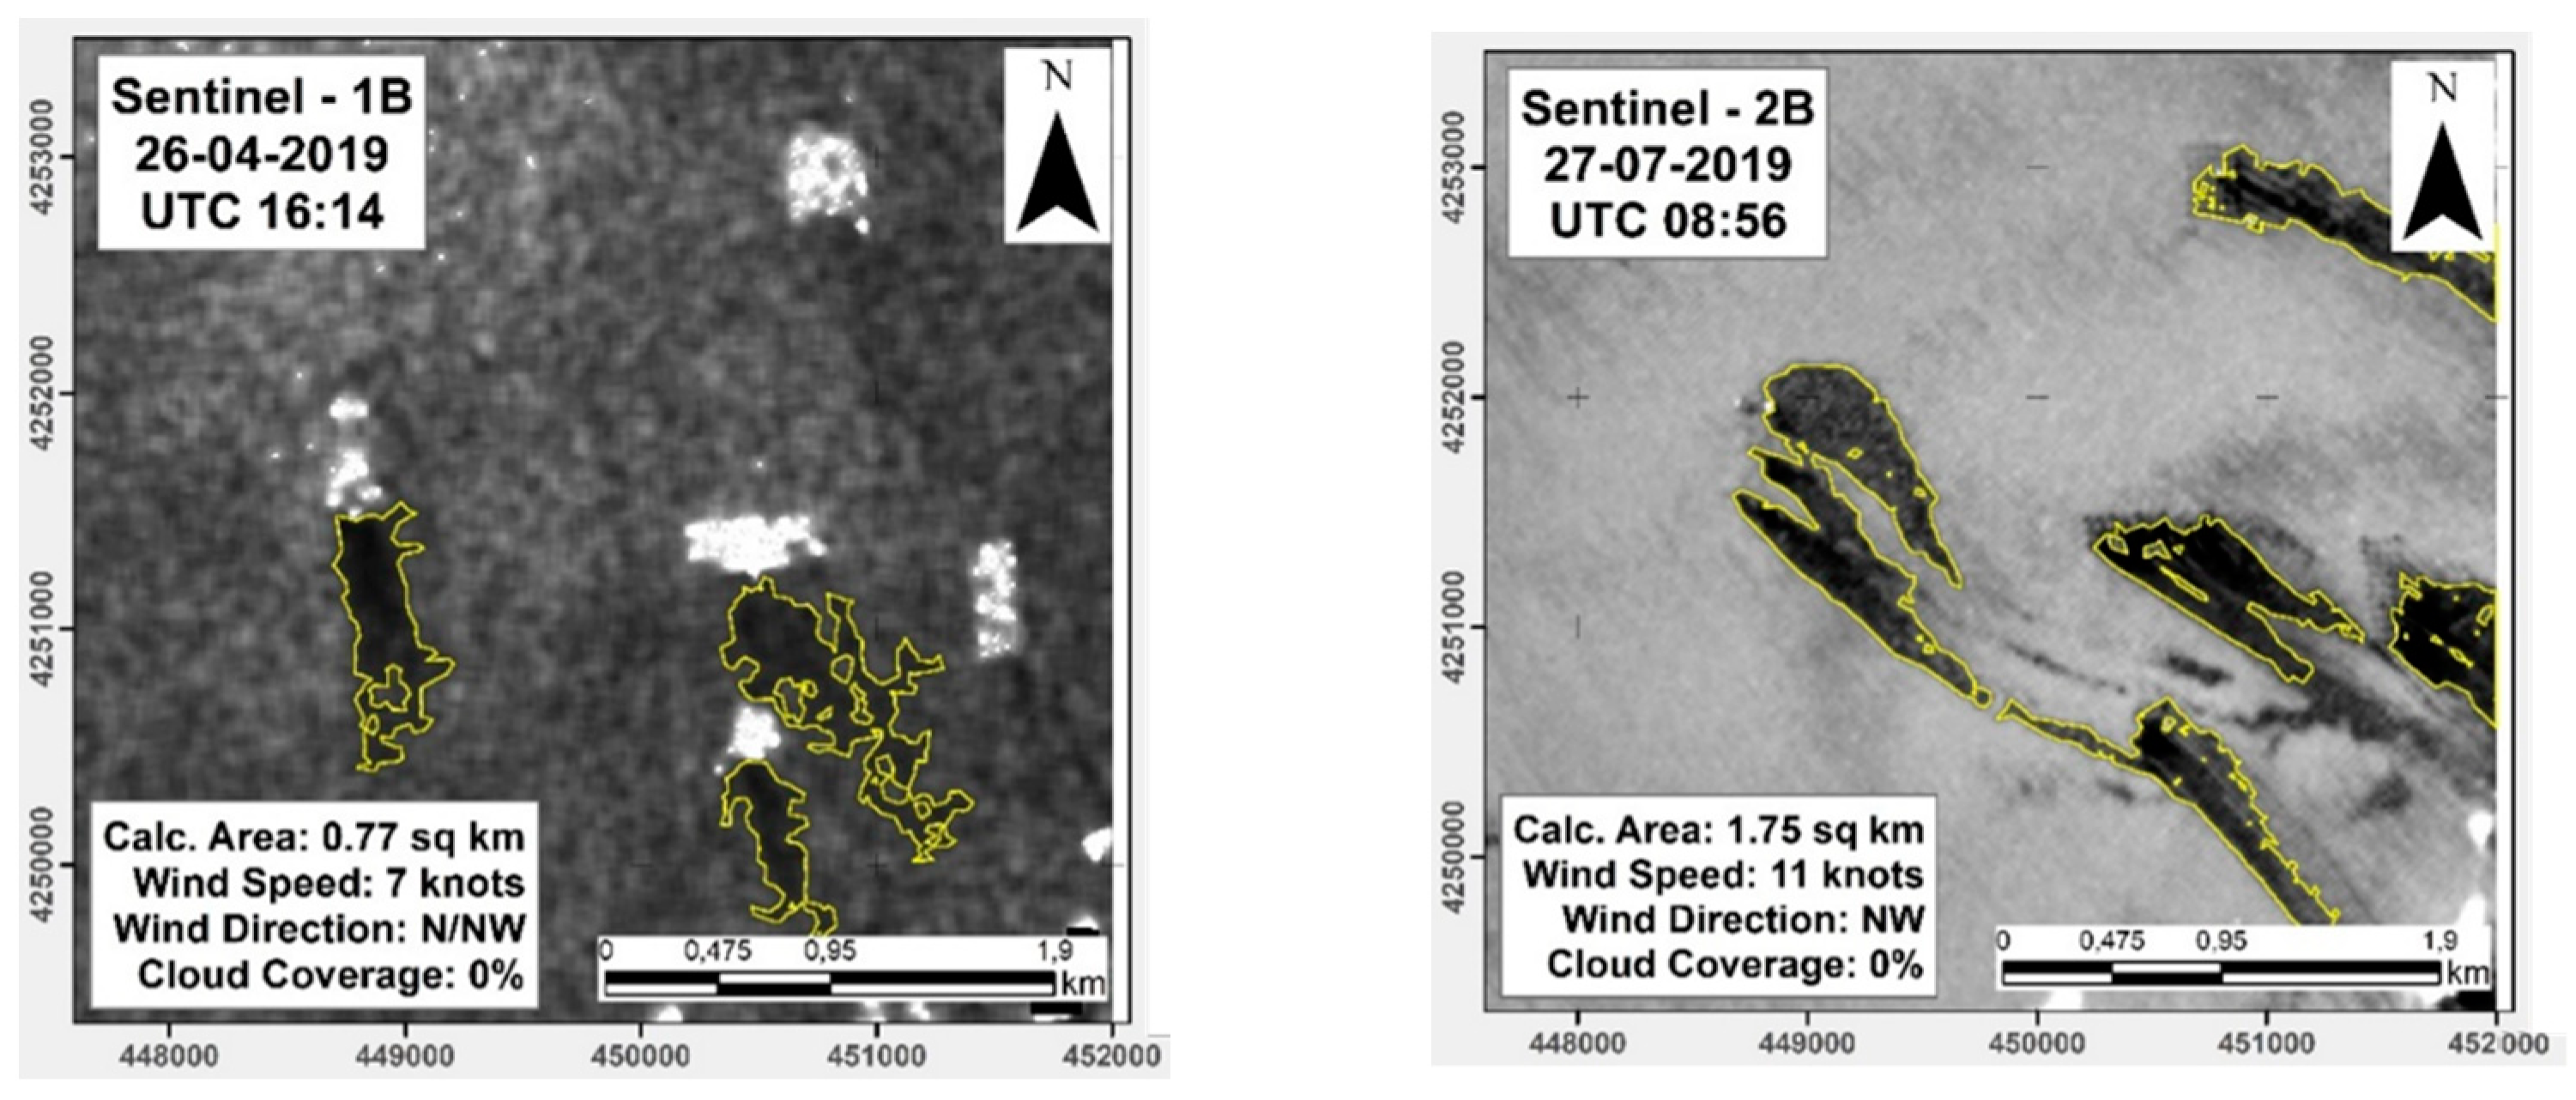
Figure 10 presents two true positive examples of Sentinel-1 and Sentinel-2, respectively. The cases presented are captured in Site 3. In both cases the images are captured during low-wind periods (26 April 2019 and 27 July 2019) (7–11 knots) and calm sea. The film, sensitive to the surface currents, is drifted away from the cages most of the time, forming an elongated shape. The elongation is formed from the cages to the southeast, which is explained by the wind direction, which was N/NW in both cases. Sentinel-1 in Site 3 identified three dark spots as biogenic oil film with a total area 0.77 km2. Sentinel-2 identified five formations as biogenic oil films with a total size 1.75 km2.
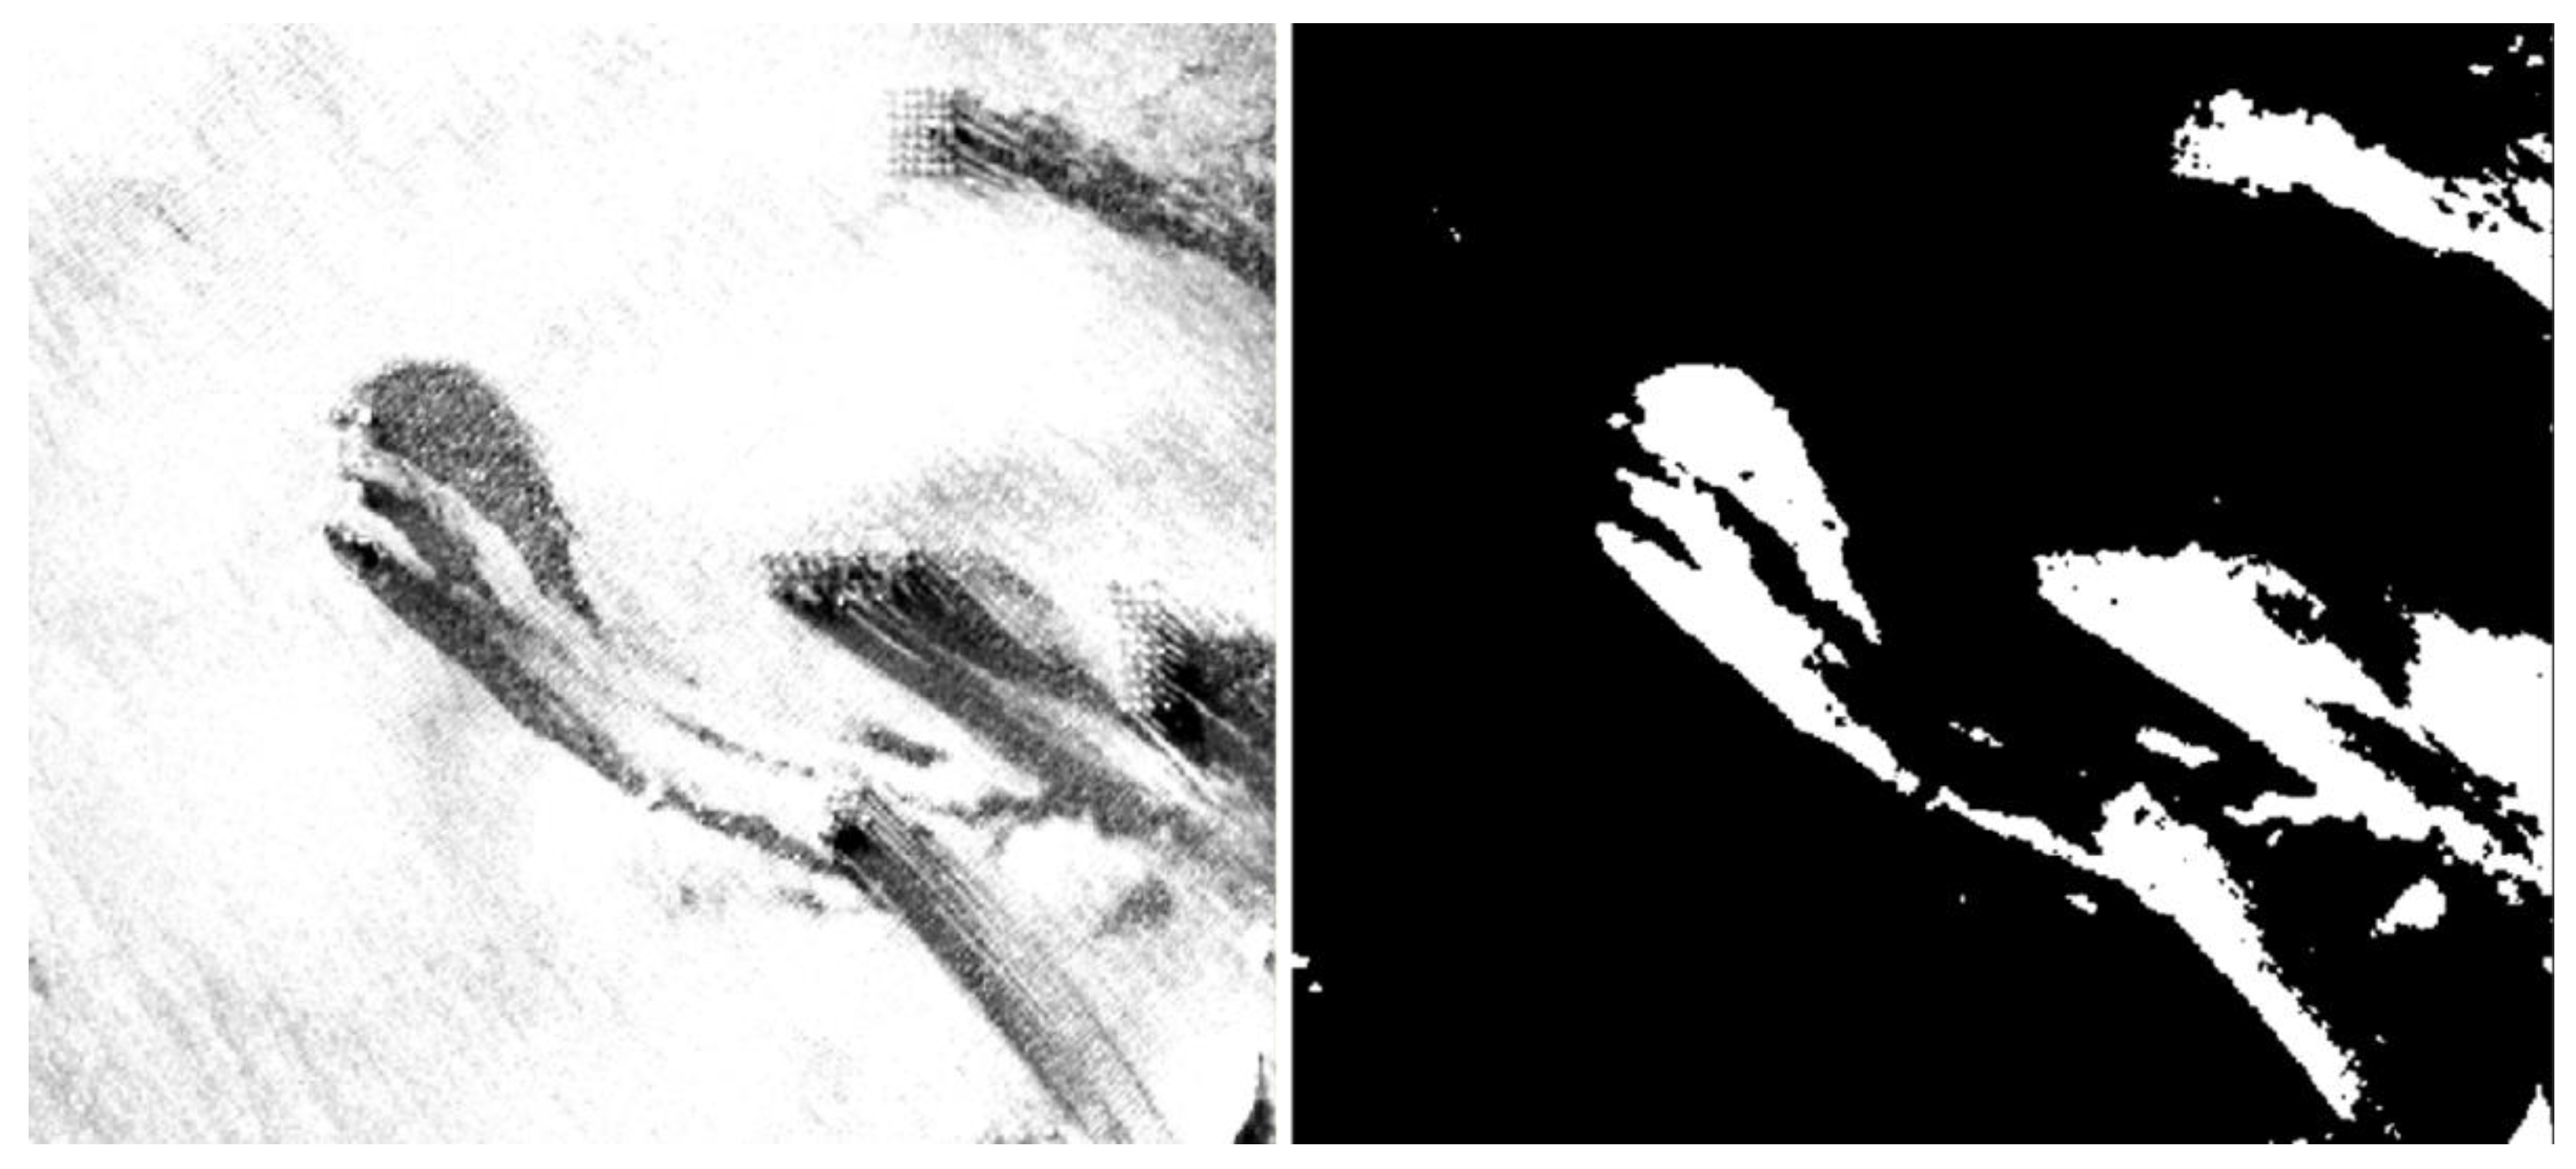
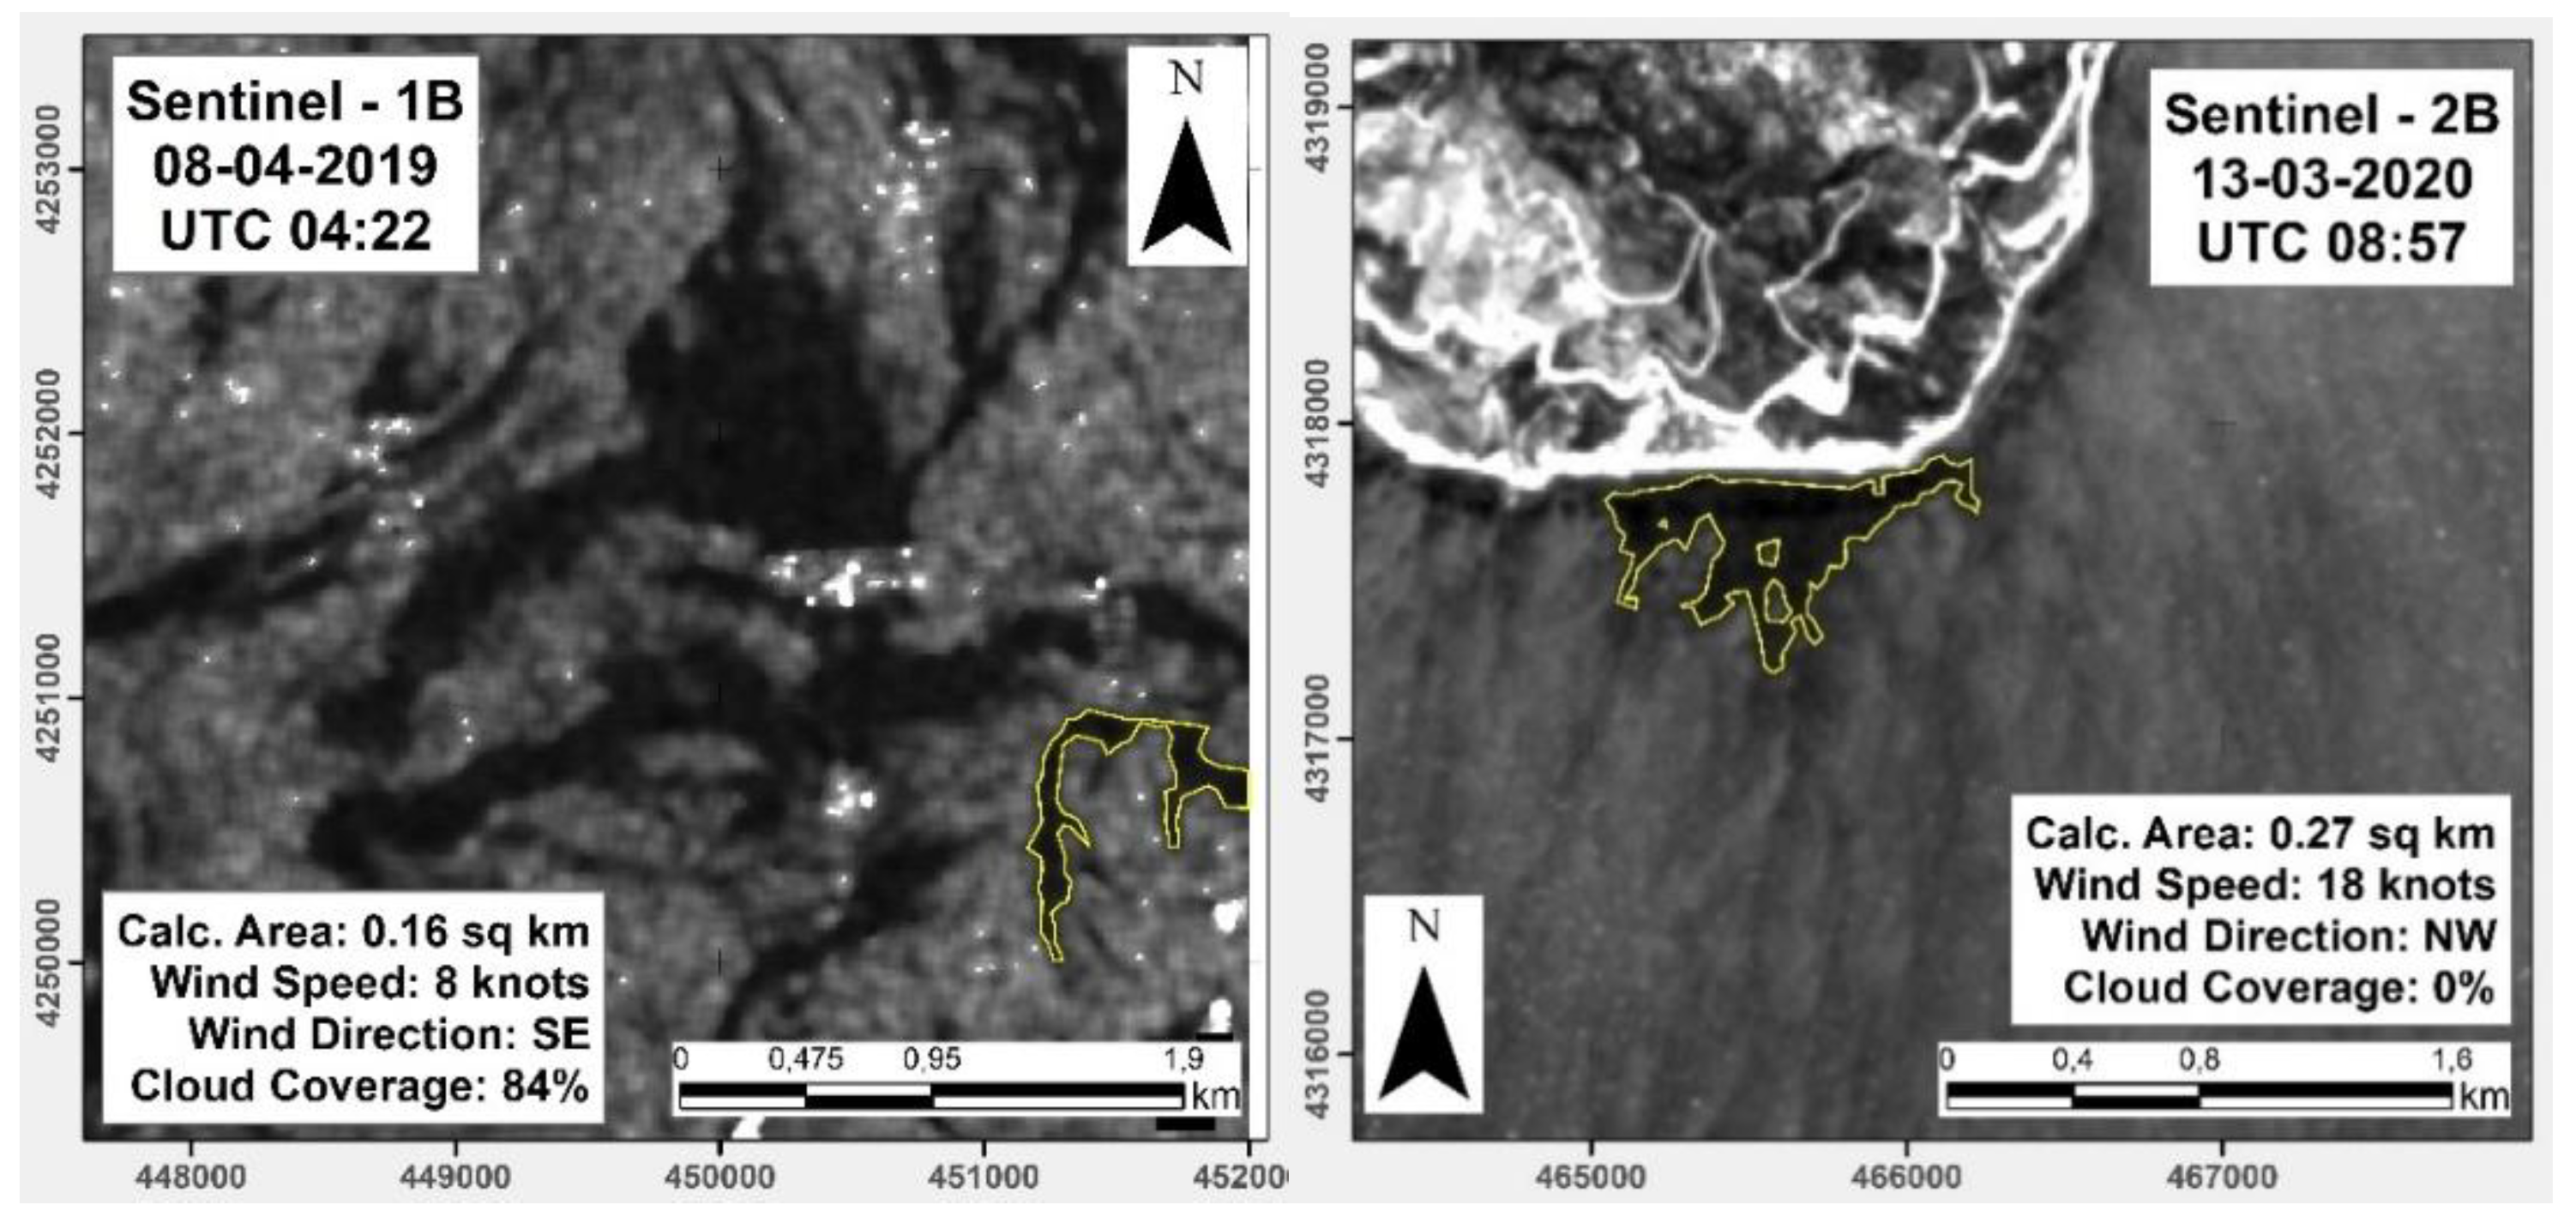
Two examples of false positive cases are presented in Figure 11. The images were captured on 8 April 2019 and 13 March 2020. In these cases, there is no clear evidence for the existence of the film, although the algorithm detected a dark spot. The dark spots detected are the actual result of low wind in the area (Figure 11, left) or wind shadow resulting from the north wind coming from inland (Figure 11, right) that affects the backscatter values and is misclassified as biogenic oil film. One way to deal with this misclassification problem is to apply more classification factors, such as shape or complexity of the formation, and change the size thresholds.
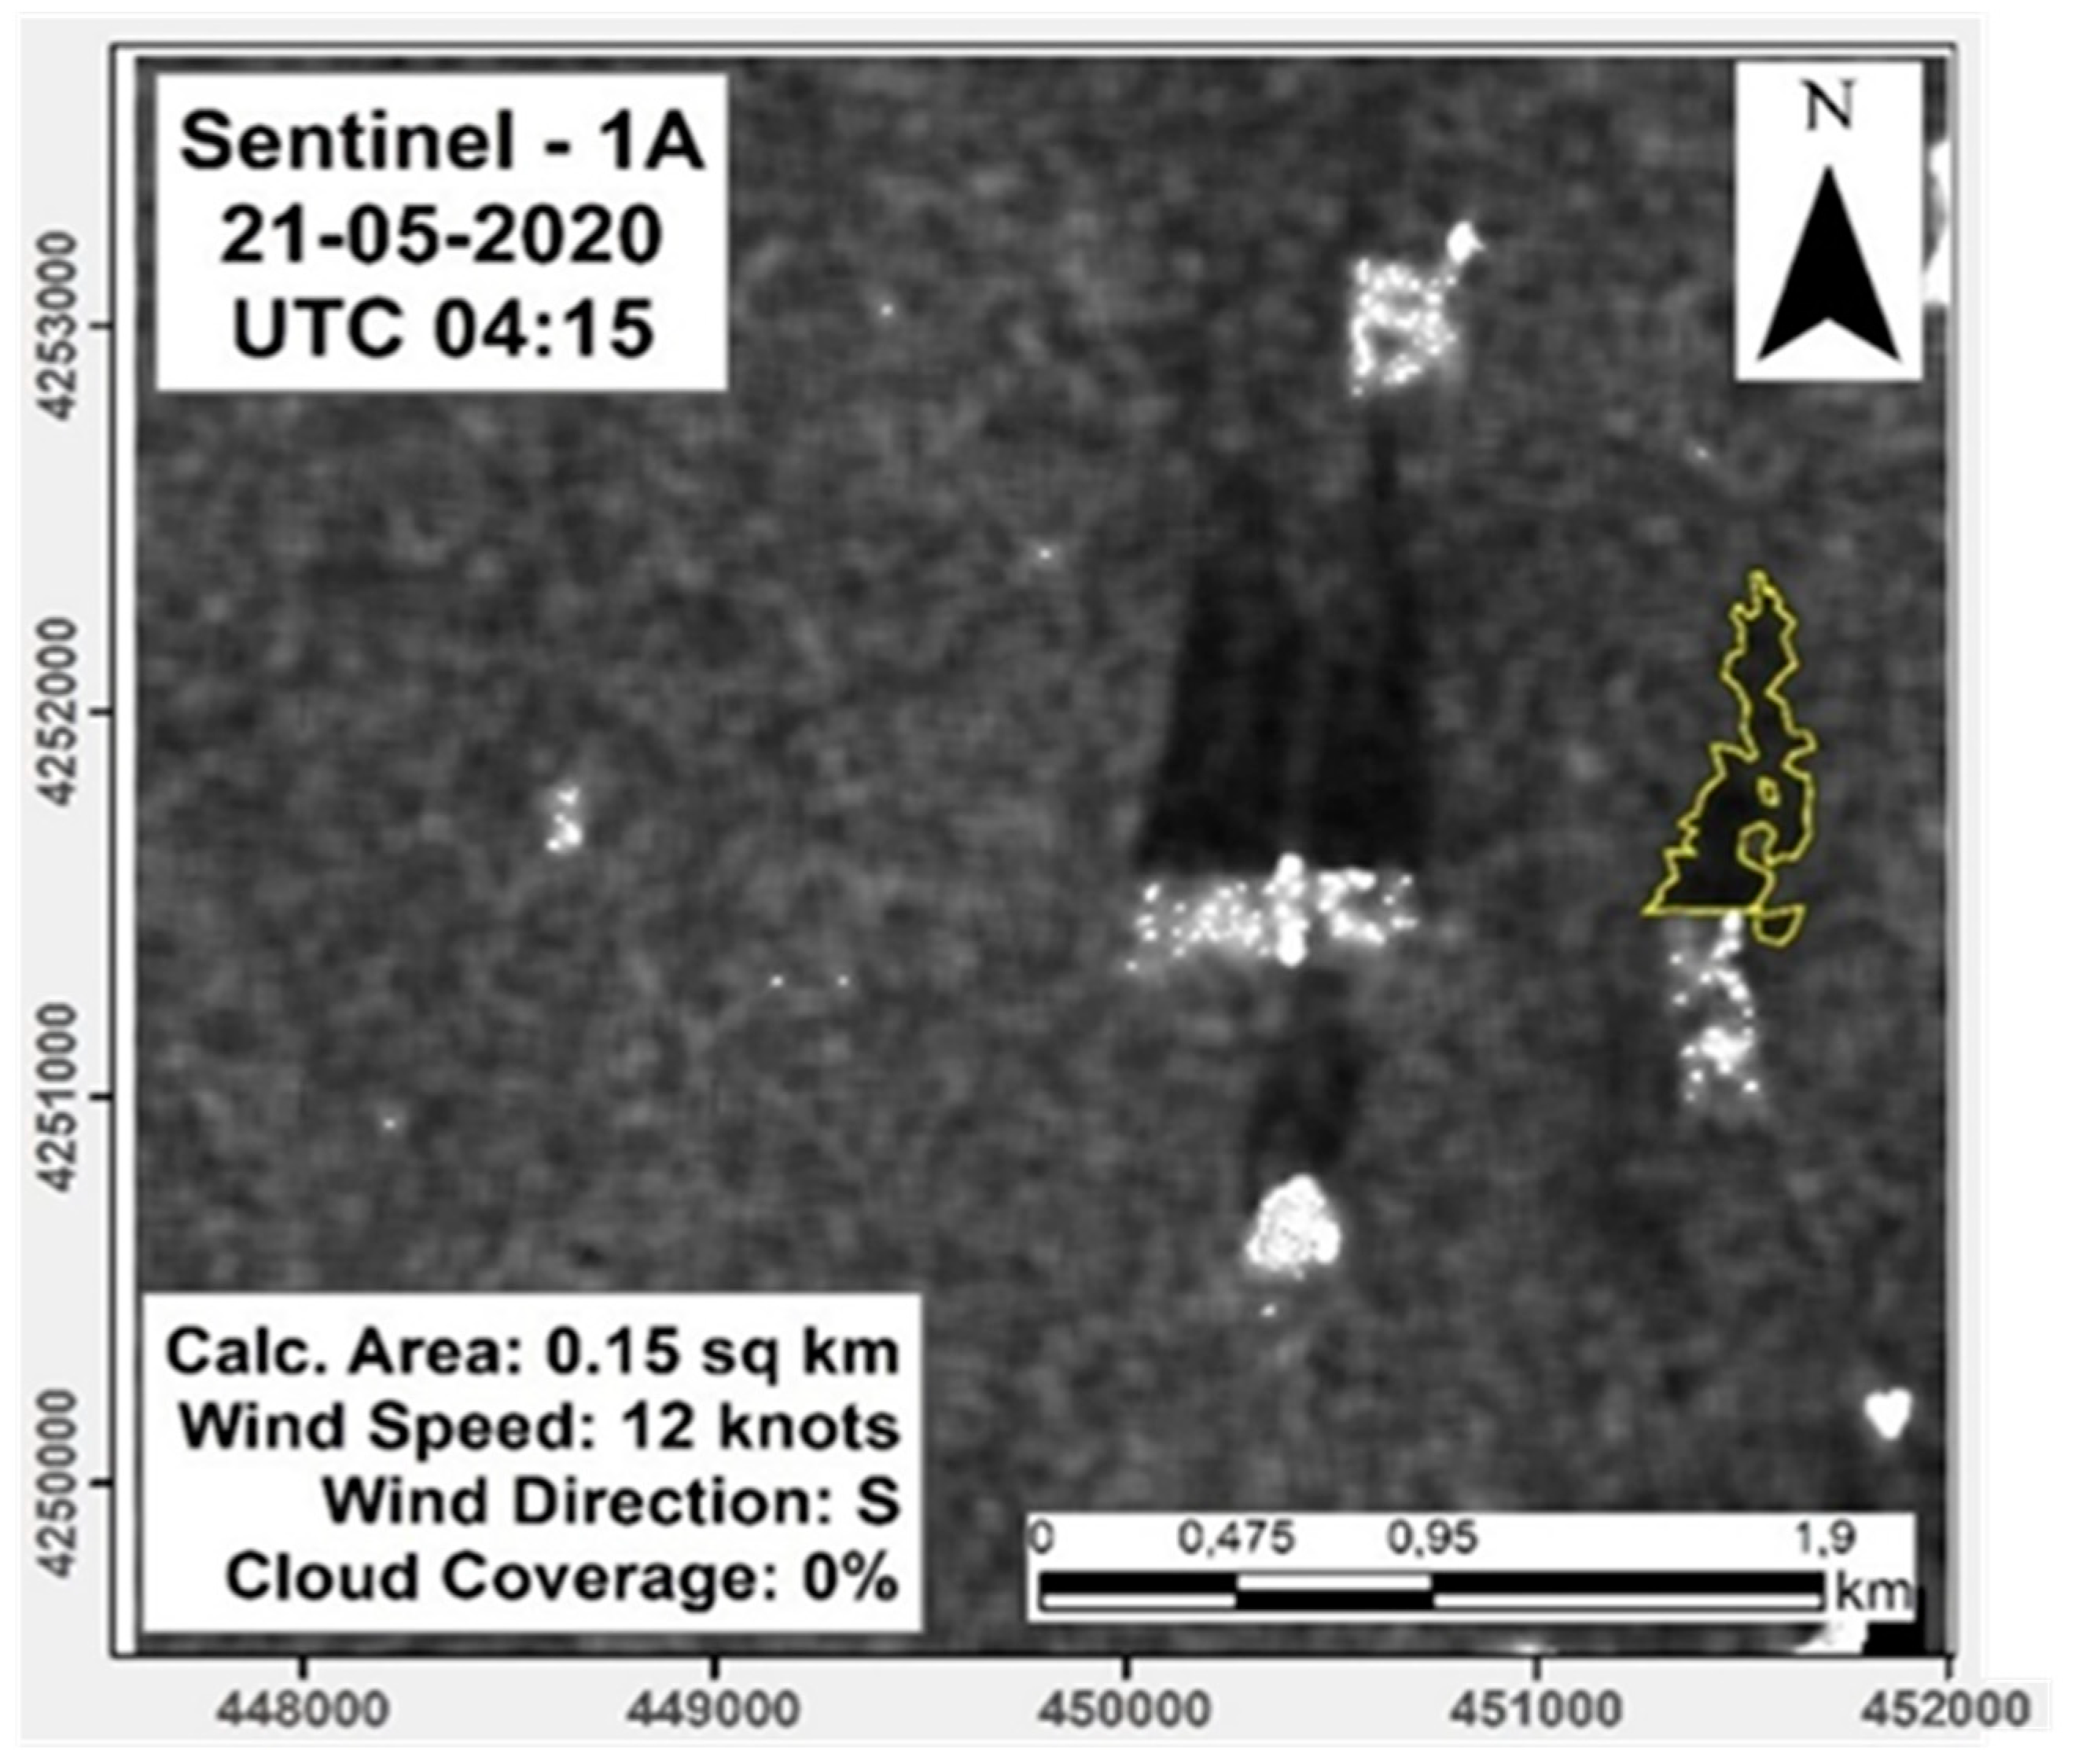
Finally, in some cases, the algorithm correctly detected some of the biogenic oil films that existed in the scene. This case was mostly observed in Site 3, where the existence of five independent farms confuses the algorithm. In Figure 12 (captured on 21 May 2020), the film is observed clearly in three farms, while the algorithm correctly detected only one. This could be a result of the thresholds selected.
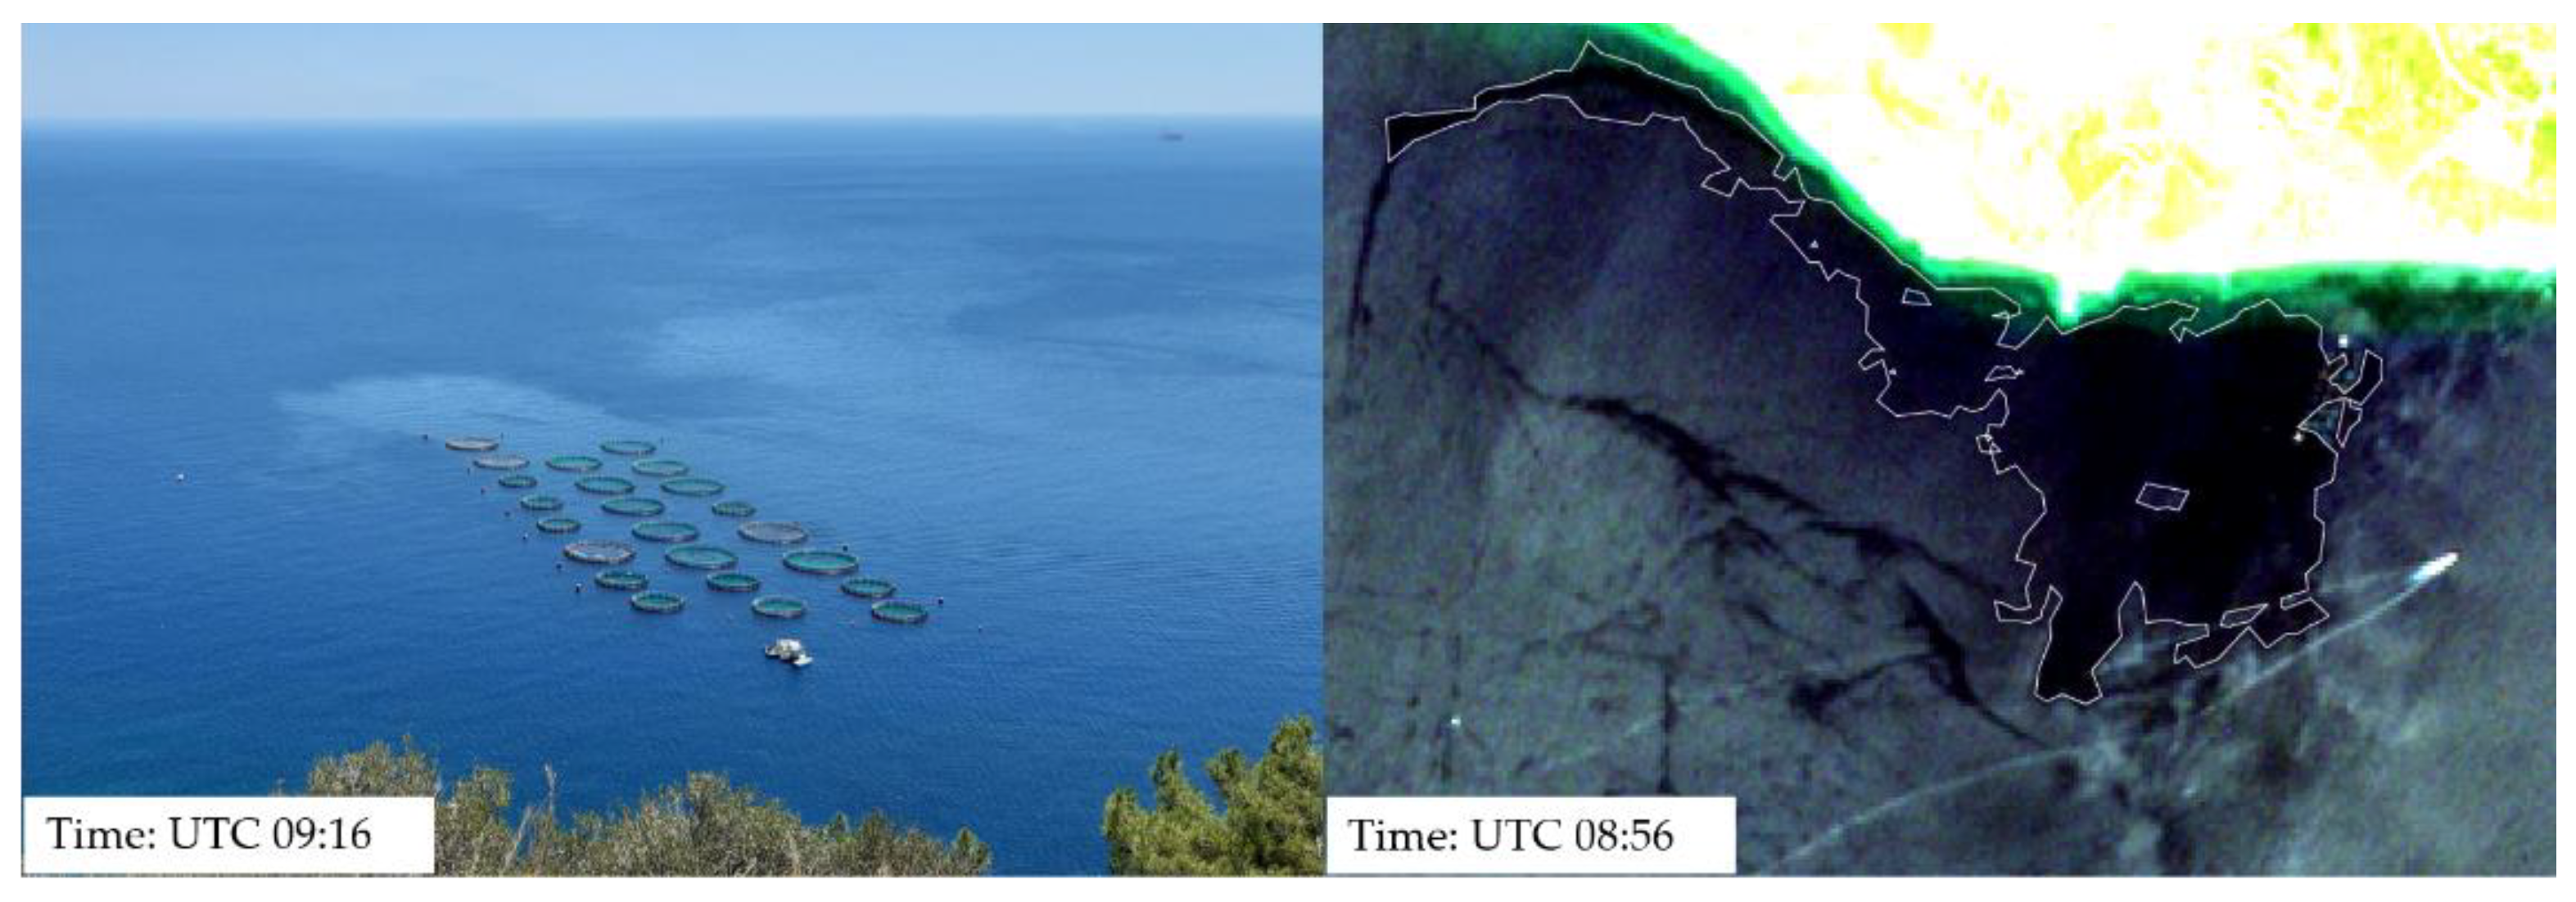
In situ photos from the Site 1 aquaculture farm were acquired to further examine the validity of our results (Figure 13). Figure 13 shows an example of a photo captured on 26 July 2020 (left) and the corresponding Sentinel-2 image (right). The dark formation detected from the satellite image is most likely in a low wind area. The dark spot detected was classified as a similar feature based on its size, and was excluded.
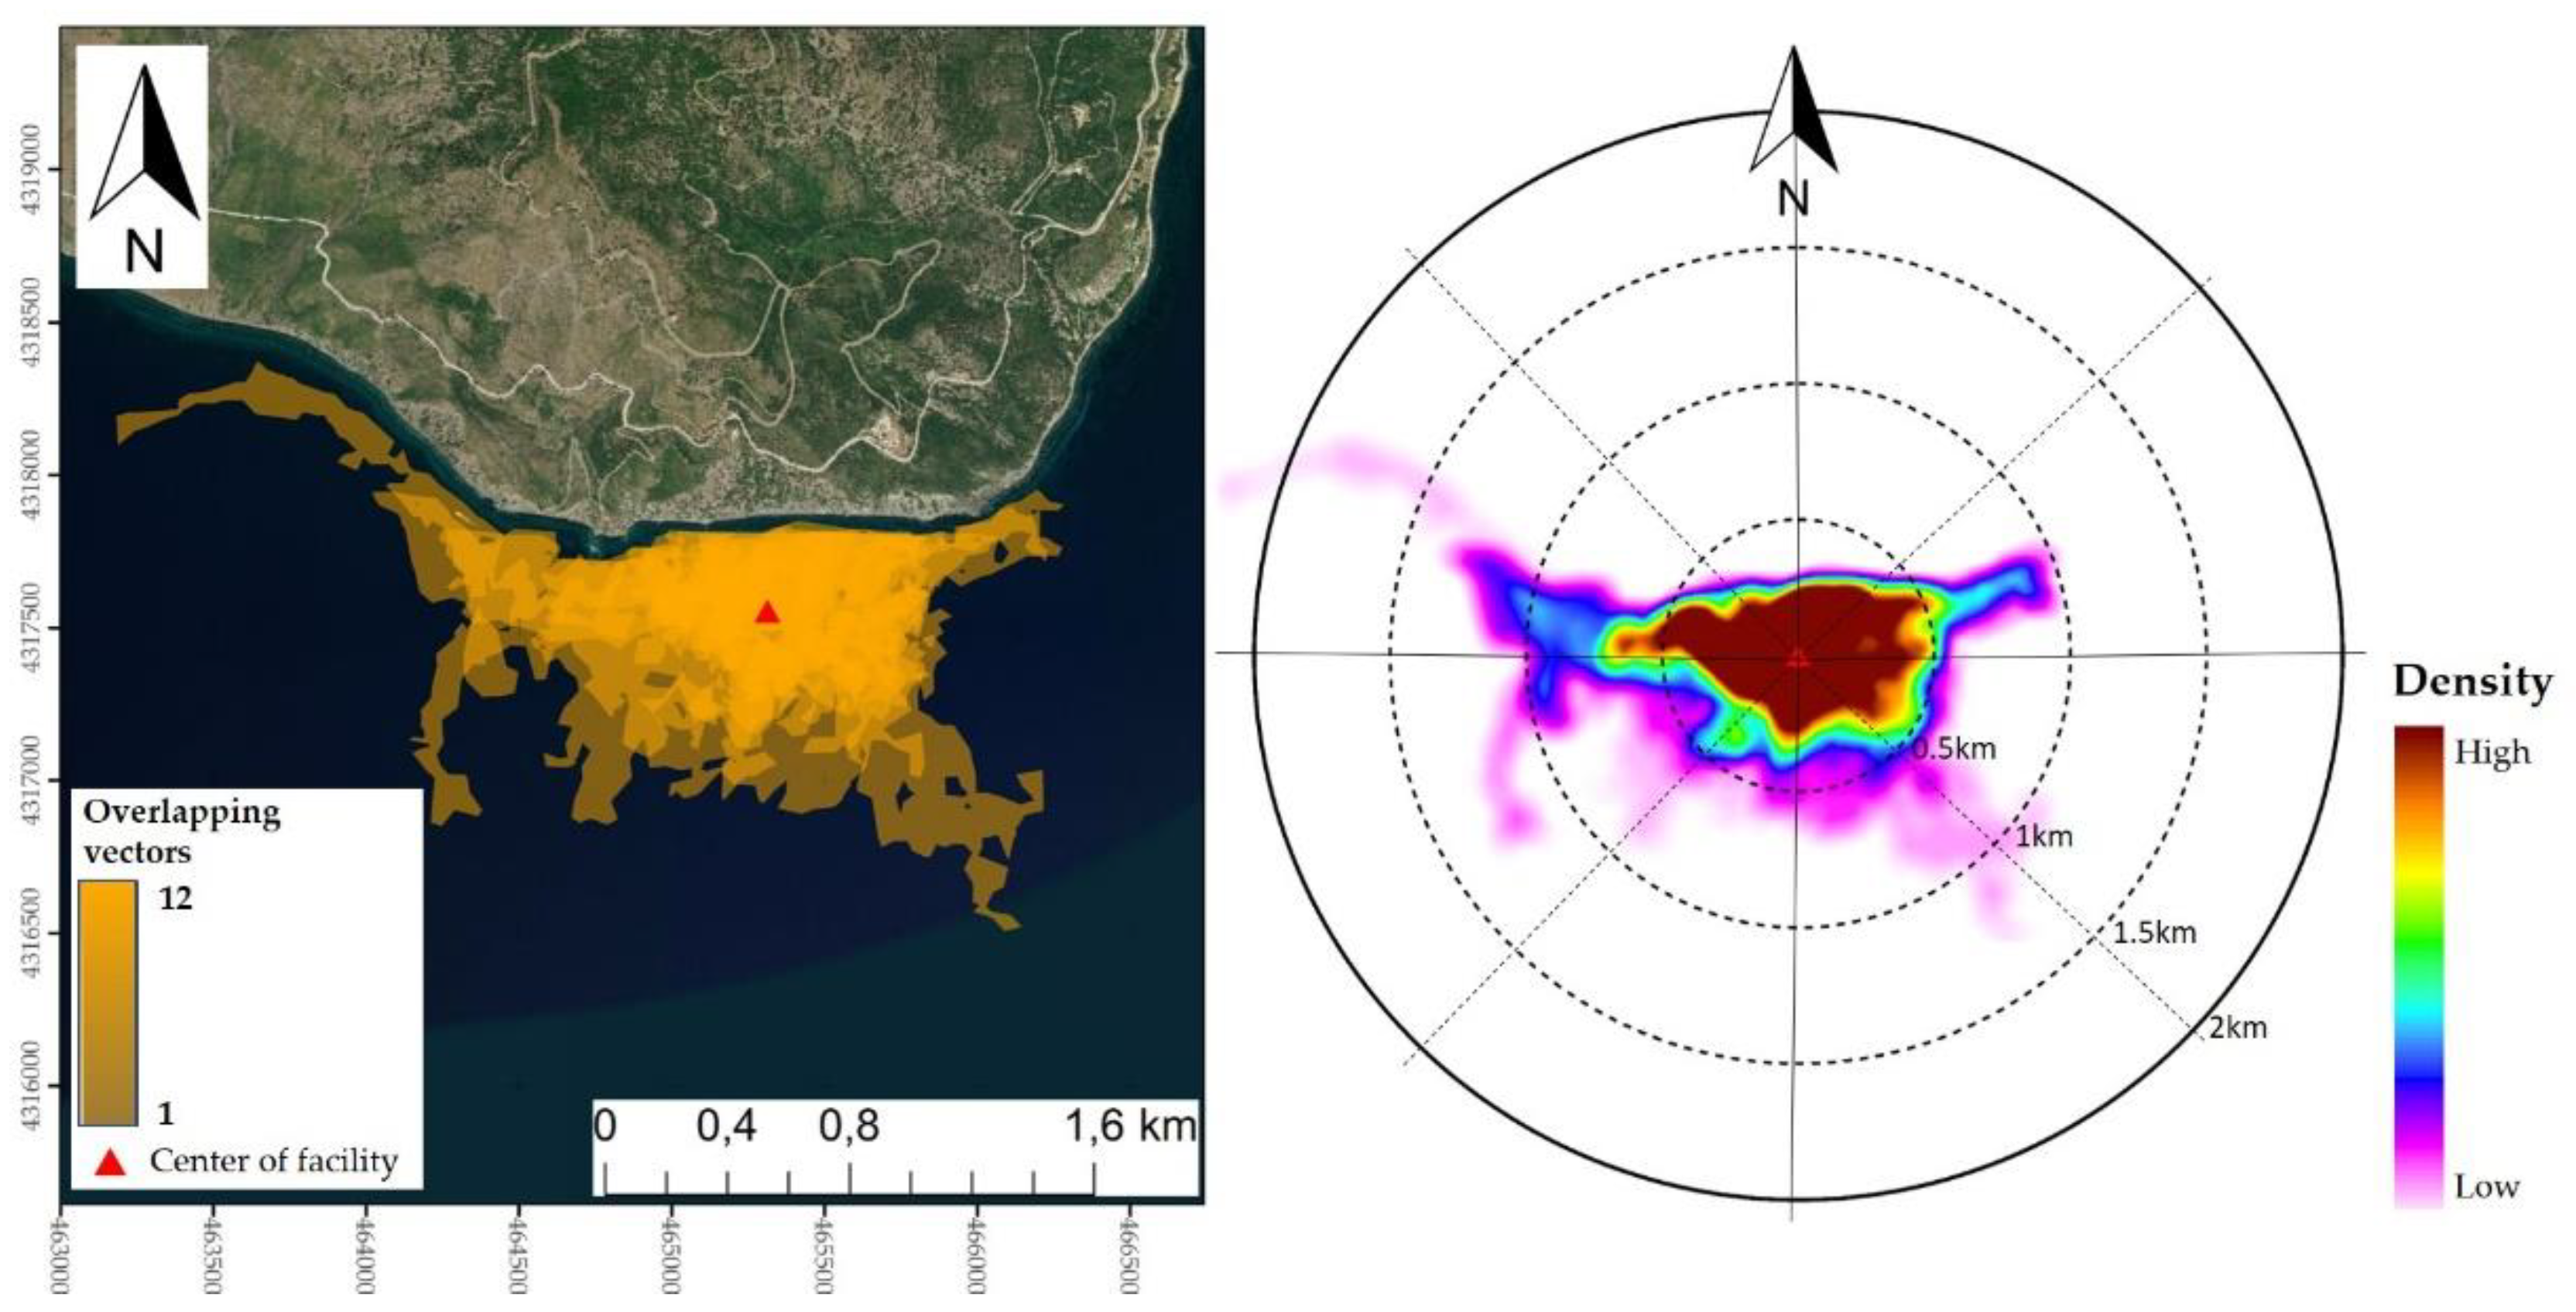
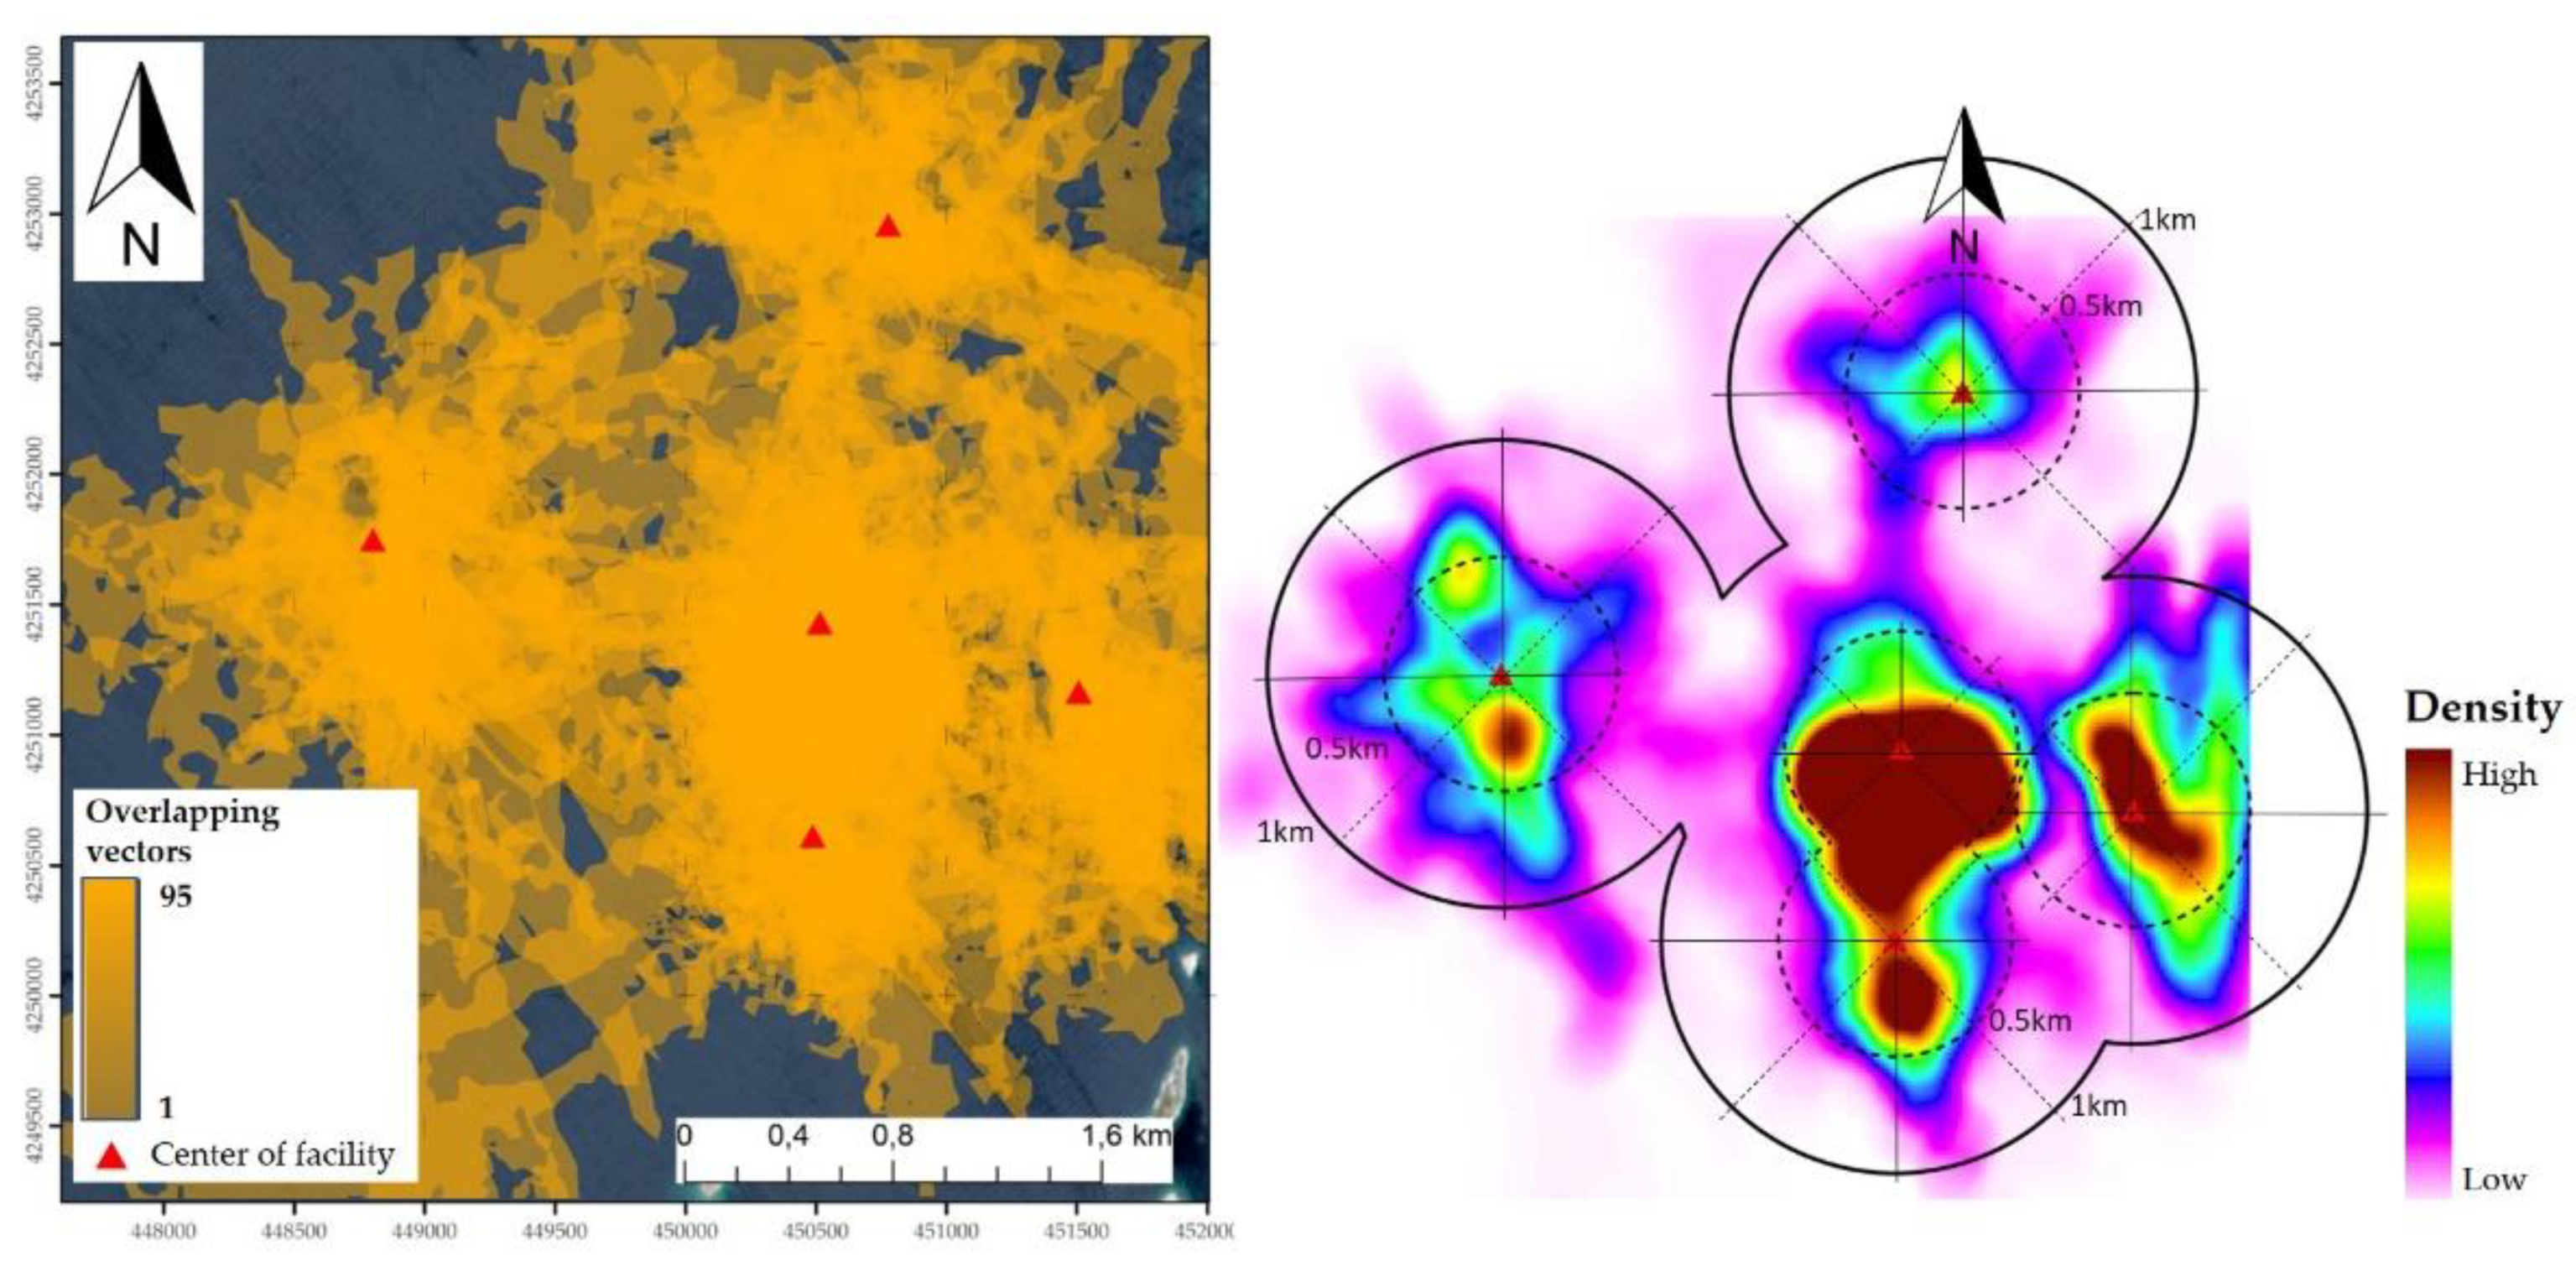
Figure 14, Figure 15 and Figure 16 present the spatial extend of the films detected in the surrounding area for the three study sites. The overlapping vectors detected were used to create a density map for each area. The area that is mostly affected does not exceed 500 m in all cases, while the maximum distance observed is 2 km.

4. Discussion and Conclusions

The present study aimed at the investigation of the capabilities of different satellite sensors in detecting biogenic oil films near aquaculture sites. The use of multiple data for improving the detection accuracy has already been suggested in recent years [6,23]. In our research, we explored the capabilities of the different sensors to identify and classify thin surface oils. Overall accuracy of the results was over 70% while, in some cases, reached 90%. Both sensors proved to be effective in the detection, with Sentinel-1 SAR presenting slightly better accuracy (81%) than Sentinel-2 MSI (70%).
Regarding the satellite sensors, optical images provide better resolution, which is fundamental for small areas (such as Site 1) but depends highly on the weather and light conditions. Sentinel-2 MSI captures images only during daylight and many data are not useful due to cloud coverage. However, acquisition time is more convenient (09:00 UTC) as it is closer to morning feeding. On the other hand, Sentinel-1 SAR data have coarser resolution but still adequate for large, offshore areas and have the advantage of capturing images in all weather conditions and regardless of the light. Thus, Sentinel-1 captures two images per day (4:20 UTC and 16:20 UTC), which leads to a significantly larger dataset and higher possibility of capturing the film. However, although we have two Sentinel-1 images per day, the first is very early in the morning (4:20 UTC) and second one late in the afternoon (16:20 UTC), and they are both separated from the feeding times. Especially during winter, when the visual light is limited in the satellite acquisition time, we were unable to validate our results with in situ observations. Moreover, SAR data presents many false alarms due to low wind areas and wind shadows. Results from the two sensors cannot be directly compared because images are captured in different times and dates, but using both satellites complementary to each other might be promising.
Overall, our findings agree with the results reported by several other studies using different sensors (multispectral or SAR) to detect and discriminate surface oil films [3,5,9,10,11,12,16,17,18,19]. The comparison between the two sensors is not feasible as the acquisition time is different and the film is visible for a short time. Sentinel-1 SAR provides data at all weather conditions and can capture even during night, resulting in a large dataset and, thus, higher possibility in capturing the film. However, the resolution of the data (30 m) is only suitable for farms with medium to large size, and several false alarms, e.g., low wind areas and wind shadows, may confuse the classification. In order to address the false alarms, several studies suggest the use of multiple features in the classification scheme [23,24,25]. In our study, we adopted only two of the suggested features, the size of the dark spot and the location, which seemed to work adequately for our purpose.
The high resolution of Sentinel-2 images (10 m) is suitable for smaller farms, although the acquisition of data depends highly on the weather. High cloud coverage and no sunlight makes it impossible to acquire optical data; thus, there is a major loss of data in comparison Sentinel-1. As the film absorbs most of the near-infrared light, we chose to use the NIR band (Band 8). This is confirmed by the analysis of the spectral signature of the film and is also indicated by Gade et al. [7,8]. Additionally, the use of band ratios and indices, and spectral band combinations, may enhance the optical properties of different oils and should be further investigated [17].
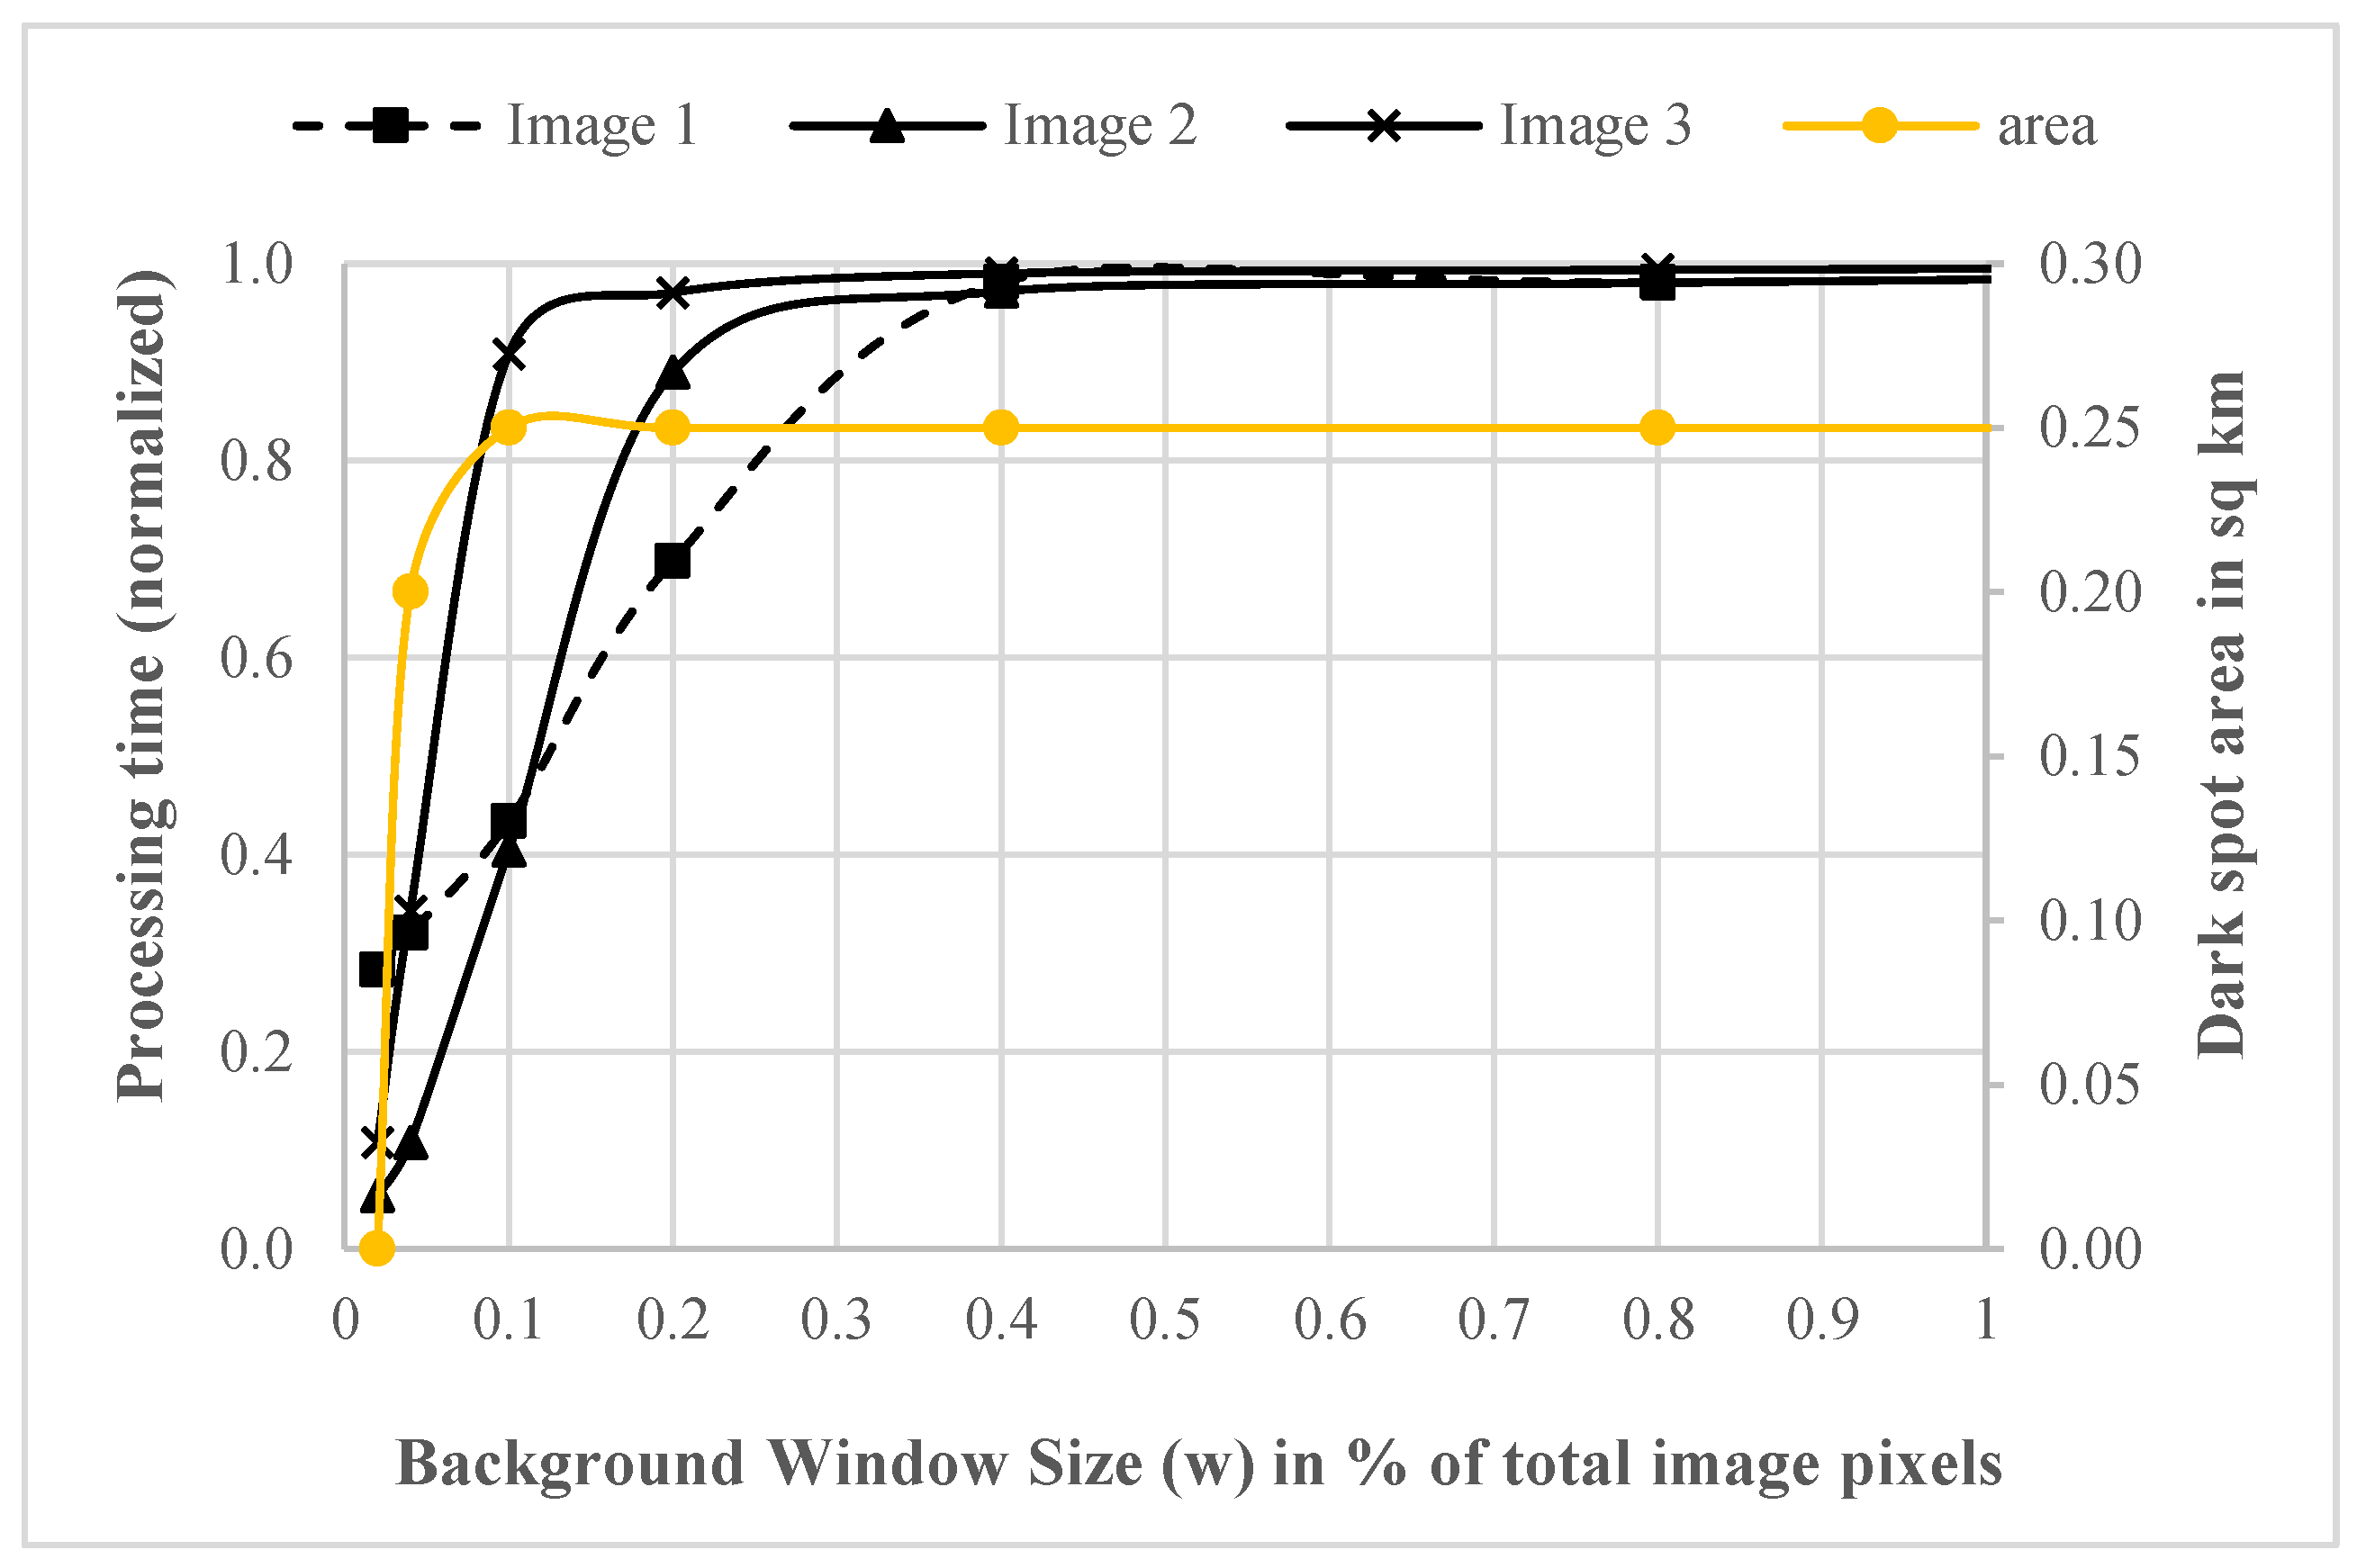
Proper parametrization is crucial for the performance of the dark spot detection algorithm. Background window size and threshold shift (k) have an important role in the outcome of the algorithm. Any alteration to the thresholds leads to differentiation in the detected dark spots. According to our analysis, in terms of accuracy and processing time, the algorithm performs better when the size of the background window is 0.1% ± 0.05% of the total pixels in the image. A larger window may overestimate the dark spots, while a smaller window may lead to poor results, even though less demanding in time. A right balance between overestimation and underestimation is within the discretion of the analyst. Excluding wrong detections from the dataset may be easier than searching for missed ones by applying more classification rules and use of more features (such as shape, complexity etc.). In this context, overestimation is preferred to underestimation as in our case the actual size of the film is less important than the evidence of its existence. Choosing the appropriate values depends on the several factors, such as the purpose of the study, the available resources and the size of the image.
Biogenic oil film differs from oil spills due to its thickness and composition. Counter to mineral oils, biogenic oils are very thin and consists mainly of organic matter. These characteristics make the film more prone to dissolution by waves and vulnerable to the wind, thus harder to detect. According to our study, the wind speed is the most important factor as thin films are easily dissolved by waves. In extremely low winds (below 4–5 knots), the sea surface becomes very smooth, causing specular reflectance in the radar signal. Additionally, the thickness of the film makes it vulnerable to waves caused by high winds. The wind speed window suggested as ideal for the detection of such thin films is between 4–5 and 15 knots [2,7,8,16,26]. Our results support this finding since the maximum number of detected oil films was found during low-wind periods. There is no evidence to assume that other parameters such as the dissolved oxygen or sea surface temperature are also responsible for this, but it would be interesting for further investigation.
As mentioned, the majority of oil film detections occurred during warm months and dates with lower winds and less clouds. The methodology was applied in three different areas to evaluate the performance of the algorithm. The different characteristics of each area led to different accuracies. Although all sites are located in North Aegean Sea, thus characterized by similar weather and water conditions, the farm in Site 1 is small, near the coast and the feeding is performed manually, while the farms in Sites 2 and 3 are considerably larger and far from the coast. Site 1 was the area with less positive cases and Site 2 was the area with the most, which is suspected to be related to the feeding process.
Our findings indicate that such films are visible in both SAR and multispectral images for different reasons. Regarding SAR images, a surface oil affects the roughness of the sea surface, and thus the retractable radar signal. Similarly, it also affects the optical properties of the sea surface and the signal reflection, mainly on NIR bands. In both cases, the film appears darker than the surrounding areas, forming a dark spot. The correct detection and classification of the dark spots is affected by the parametrization of the algorithms and the classification rules. As shown by this study, choosing the most appropriate parameters is a complicated matter, depending on several factors, i.e., the available time, study site, resources, purpose etc. Our results align with other studies that focus on the detection and classification of surface oils through satellite sensors.
Detecting the film in the satellite images and distinguishing it from similar features were the main challenges of this study. Our approach, similar to oil spill detection, presents limitations regarding the acquisition of data and weather conditions. Especially for biogenic films, which are more vulnerable, the detection is even more challenging. Using a multisensor approach offers different sensor capabilities and a significantly larger dataset. Films of biogenic origins have not yet been widely investigated, thus the implementation of similar methodologies could improve our ability to understand the formation and dispersion of such films near aquaculture facilities, and their possible impact on the facilities.
Further work is required in order to verify the results obtained. More in situ data are essential to compare and validate our findings. Additionally, testing the methodology at other sites is also very important to evaluate the algorithm’s performance. Information on the environmental conditions on the areas of interest, both meteorological (wind speed and direction, air temperature etc.) and oceanographic (water temperature, sea surface currents etc.), could also contribute to the general knowledge on the development and behavior of such films. The investigation of the relation to feeding by obtaining a detailed feeding schedule would be interesting, as this could potentially provide a tool to assist in managing the feeding process.

Author Contributions

Investigation, A.C.; validation, A.C. and A.K.; resources, K.T. and V.B.; writing—original draft preparation, A.C.; writing—review and editing, K.T., V.B. and N.P.; supervision, K.T., V.B. and N.P.; funding acquisition, K.T. All authors have read and agreed to the published version of the manuscript.

Acknowledgments

The research work of Chatziantoniou Andromachi was supported by the Hellenic Foundation for Research and Innovation (HFRI) under the HFRI PhD Fellowship grant (Fellowship Number: 1072).

Conflicts of Interest

The authors declare no conflict of interest. The funders had no role in the design of the study; in the collection, analyses, or interpretation of data; in the writing of the manuscript, or in the decision to publish the results.

References

  1. FAO. The State of World Fisheries and Aquaculture 2020; FAO: Rome, Italy, 2020. [Google Scholar]
  2. Alpers, W.; Espedal, H.A. Oils and Surfactants. In Synthetic Aperture Radar Marine User’s Manual; Jackson, C.R., Apel, J.R., Eds.; U.S. Department of Commerce: Washington, DC, USA, 2004; pp. 263–275. [Google Scholar]
  3. Chaturvedi, S.K.; Banerjee, S.; Lele, S. An Assessment of Oil Spill Detection Using Sentinel 1 SAR-C Images. J. Ocean Eng. Sci. 2020, 5, 116–135. [Google Scholar] [CrossRef]
  4. Solberg, A.S.; Brekke, C.; Solberg, R.; Husøy, P.O. Algorithms for Oil Spill Detection in Radarsat and Envisat SAR Images. In Proceedings of the International Geoscience and Remote Sensing Symposium (IGARSS), Anchorage, AK, USA, 20–24 September 2004; pp. 4909–4912. [Google Scholar]
  5. Topouzelis, K.; Karathanassi, V.; Pavlakis, P.; Rokos, D. Detection and Discrimination between Oil Spills and Look-alike Phenomena through Neural Networks. ISPRS J. Photogramm. Remote. Sens. 2007, 62, 264–270. [Google Scholar] [CrossRef]
  6. Topouzelis, K. Oil Spill Detection by SAR Images: Approaches and Algorithms. Sensors 2008, 8, 6642–6659. [Google Scholar] [CrossRef] [PubMed] [Green Version]
  7. Gade, M.; Ermakov, S.A.; Lavrova, O.Y.; Mitnik, L.M.; Da Silva, J.B.C.; Woolf, D.K. Using Marine Surface Films as Indicators for Marine Processes in the Coastal Zone. In Proceedings of the 7th International Conference on the Mediterranean Coastal Environment, MEDCOAST 2005, Kusadasi, Turkey, 25–29 October 2005; pp. 1405–1416. [Google Scholar]
  8. Gade, M.; Byfield, V.; Ermakov, S.; Lavrova, O.; Mitnik, L. Slicks as Indicators for Marine Processes. Oceanography 2013, 26, 138–149. [Google Scholar] [CrossRef] [Green Version]
  9. Kolokoussis, P.; Karathanassi, V. Oil Spill Detection and Mapping Using Sentinel 2 Imagery. J. Mar. Sci. Eng. 2018, 6, 4. [Google Scholar] [CrossRef] [Green Version]
  10. Zhao, J.; Temimi, M.; Ghedira, H.; Hu, C. Exploring the Potential of Optical Remote Sensing for Oil Spill Detection in Shallow Coastal Waters–A Case Study in the Arabian Gulf. Opt. Express 2014, 22, 13755–13772. [Google Scholar] [CrossRef] [PubMed]
  11. Taravat, A.; Del Frate, F. Development of Band Ratioing Algorithms and Neural Networks to Detection of Oil Spills Using Landsat ETM + Data. EURASIP J. Adv. Signal Process. 2012, 2012, 1. [Google Scholar] [CrossRef]
  12. Bradford, B.N.; Sanchez-Reyes, P.J. Automated Oil Spill Detection with Multispectral Imagery. SPIE Def. Secur. Sens. 2011, 8030, 80300. [Google Scholar] [CrossRef]
  13. Topouzelis, K.; Singha, S. Oil Spill Detection Using Space-Borne Sentinel-1 SAR Imagery; Elsevier: Amsterdam, The Netherlands, 2017; ISBN 9781856179430. [Google Scholar]
  14. Topouzelis, K.; Karathanassi, V.; Pavlakis, P.; Rokos, D. Dark Formation Detection Using Neural Networks. Int. J. Remote. Sens. 2008, 29, 4705–4720. [Google Scholar] [CrossRef]
  15. Brekke, C.; Solberg, A.H. Oil Spill Detection by Satellite Remote Sensing. Remote. Sens. Environ. 2005, 95, 1–13. [Google Scholar] [CrossRef]
  16. Chatziantoniou, A.; Topouzelis, K. Impact of Intense Aquaculture on Coastal Environments Seen by SAR. In Proceedings of the IGARSS 2020—2020 IEEE International Geoscience and Remote Sensing Symposium, Waikoloa, HI, USA, 26 September–2 October 2020; pp. 4023–4026. [Google Scholar]
  17. Kolokoussis, P.; Karathanassi, V. Detection of Oil Spills and Underwater Natural Oil Outflow Using Multispectral Satellite Imagery. Int. J. Remote Sens. Appl. 2013, 3, 145–154. [Google Scholar]
  18. Chatziantoniou, A.; Bakopoulos, V.; Papandroulakis, N.; Topouzelis, K. Detection of Biogenic Oil Film near Aquaculture Sites Seen by Sentinel-2 Multispectral Images. In Proceedings of the Remote Sensing of the Ocean, Sea Ice, Coastal Waters, and Large Water Regions 2020, 21–25 September 2020; SPIE–International Society for Optics and Photonics: Bellingham, WA, USA, 2020; Volume 11529, p. 1152906. Available online: https://www.spiedigitallibrary.org/conference-proceedings-of-spie/11529/1152906/Detection-of-biogenic-oil-film-near-aquaculture-sites-seen-by/10.1117/12.2573455.short?SSO=1 (accessed on 28 April 2021).
  19. Carnesecchi, F.; Byfield, V.; Cipollini, P.; Corsini, G.; Diani, M. An Optical Model for the Interpretation of Remotely Sensed Multispectral Images of Oil Spill. In Proceedings of the Remote Sensing of the Ocean, Sea Ice, and Large Water Regions 2008, Cardiff, UK, 15–18 September 2008; SPIE-International Society for Optics and Photonics: Bellingham, WA, USA, 2008; Volume 7105, p. 710504. [Google Scholar]
  20. Zisimopoulos, M.; Kyriou, A.; Nikolakopoulos, K.G. Synergy of Copernicus Optical and Radar Data for Oil Spill Detection. In Proceedings of the Earth Resources and Environmental Remote Sensing/GIS Applications X, Strasbourg, France, 9–12 September 2019; SPIE-International Society for Optics and Photonics: Bellingham, WA, USA, 2019; Volume 11156, p. 1115611. [Google Scholar]
  21. Chan, R.H.; Chung-Wa, H.; Nikolova, M. Salt-and-pepper Noise Removal by Median-type Noise Detectors and Detail-preserving Regularization. IEEE Trans. Image Process. 2005, 14, 1479–1485. [Google Scholar] [CrossRef] [PubMed]
  22. Farr, T.G.; Rosen, P.A.; Caro, E.; Crippen, R.; Duren, R.; Hensley, S.; Kobrick, M.; Paller, M.; Rodriguez, E.; Roth, L.; et al. The Shuttle Radar Topography Mission. Rev. Geophys. 2007, 45. [Google Scholar] [CrossRef] [Green Version]
  23. Topouzelis, K.; Psyllos, A. Oil Spill Feature Selection and Classification Using Decision Tree Forest on SAR Image Data. ISPRS J. Photogramm. Remote. Sens. 2012, 68, 135–143. [Google Scholar] [CrossRef]
  24. Stathakis, D.; Topouzelis, K.; Karathanassi, V. Large-scale Feature Selection Using Evolved Neural Networks. Remote Sens. 2006, 6365, 636513. [Google Scholar] [CrossRef]
  25. Karathanassi, V.; Topouzelis, K.; Pavlakis, P.; Rokos, D. An Object-oriented Methodology to Detect Oil Spills. Int. J. Remote. Sens. 2006, 27, 5235–5251. [Google Scholar] [CrossRef]
  26. Alpers, W.; Holt, B.; Zeng, K. Oil Spill Detection by Imaging Radars: Challenges and Pitfalls. In Proceedings of the 2017 IEEE International Geoscience and Remote Sensing Symposium (IGARSS), Fort Worth, TX, USA, 23–28 July 2017; pp. 1522–1525. [Google Scholar]
Figure 1. Biogenic oil film detected in photograph captured from land on 05.02.2021, 12:15 (EET).
Remotesensing 13 01737 g001
Figure 2. The study sites are located in north Aegean Sea, near the coastline of the Greek Lesvos Island (up) in Kratigos (1) and the Turkish İzmir Province (down) near Karaburun Peninsula (2) and Ildir Bay (3). Satellite images from Google Earth show the farms in more detail. In photo 2, the feeding system used in the farms is seen.
Remotesensing 13 01737 g002
Figure 3. Flowchart of the development methodology.
Remotesensing 13 01737 g003
Figure 4. Processing time and dark spot area against window size for k = 0.2.
Remotesensing 13 01737 g004
Figure 5. Spectral signatures of Biogenic Oil Film (BOF) and water. The reflectance is dimensionless (DL) and the wavelength is measured in nanometers (nm).
Remotesensing 13 01737 g005
Figure 6. A Sentinel-2 image captured on 27 July 2019 showing Ildir Bay (Site 3). Band 8 (left) and biogenic oil film mask after applying the threshold (right).
Remotesensing 13 01737 g006
Figure 7. Temporal variation of the biogenic oil films detected.
Remotesensing 13 01737 g007
Figure 8. Overall accuracy of the two datasets.
Remotesensing 13 01737 g008
Figure 9. Omission and commission errors in all sites for the two datasets.
Remotesensing 13 01737 g009
Figure 10. Two examples of true positive classifications with Sentinel-1 (left) and Sentinel-2 (right).
Remotesensing 13 01737 g010
Figure 11. Two examples of false positive classifications with Sentinel-1 (left) and Sentinel-2 (right).
Remotesensing 13 01737 g011
Figure 12. An example of partial detection; the algorithm correctly detected some of the biogenic oil films that existed in the scene, but not all of them.
Remotesensing 13 01737 g012
Figure 13. Both images were captured on 26.07.2020. The in situ photo (left) was captured at 09:16 (UTC) and the Sentinel-2 image (right) was captured at 08:56 (UTC).
Remotesensing 13 01737 g013
Figure 14. Biogenic oil films detected during the study period (2019–2020) in Kratigos (Site 1). The overlapping vectors (left) were used to create the density map (right). Both images show the spatial extend of the film in the surrounding area.
Remotesensing 13 01737 g014
Figure 15. Biogenic oil films detected during the study period (2019–2020) in Karaburun Peninsula (Site 2). The overlapping vectors (left) were used to create the density map (right). Both images show the spatial extend of the film in the surrounding area.
Remotesensing 13 01737 g015
Figure 16. Biogenic oil films detected during the study period (2019–2020) in Ildir Bay (Site 3). The overlapping vectors (left) were used to create the density map (right). Both images show the spatial extend of the film in the surrounding area.
Remotesensing 13 01737 g016
Publisher’s Note: MDPI stays neutral with regard to jurisdictional claims in published maps and institutional affiliations.

