Article

Multi-Dimensional Drought Assessment in Abbay/Upper Blue Nile Basin: The Importance of Shared Management and Regional Coordination Efforts for Mitigation

1
Department of Ecology and Conservation Biology, Texas A&M University, College Station, TX 77843, USA
2
Department of Earth and Environment, Florida International University, Miami, FL 33199, USA
3
Department of Civil and Environmental Engineering, University of Connecticut, Storrs, CT 06269, USA
4
National Drought Mitigation Center, University of Nebraska-Lincoln, Lincoln, CA 68583, USA
5
Blackland Research and Extension Center, Texas A&M Agrilife Research, Temple, TX 76502, USA
*
Author to whom correspondence should be addressed.
Submission received: 8 March 2021 / Revised: 26 April 2021 / Accepted: 1 May 2021 / Published: 8 May 2021

Abstract

:
Drought is one of the least understood and complex natural hazards often characterized by a significant decrease in water availability for a prolonged period. It can be manifested in one or more forms as meteorological, agricultural, hydrological, and/or socio-economic drought. The overarching objective of this study is to demonstrate and characterize the different forms of droughts and to assess the multidimensional nature of drought in the Abbay/ Upper Blue Nile River (UBN) basin and its national and regional scale implications. In this study, multiple drought indices derived from in situ and earth observation-based hydro-climatic variables were used. The meteorological drought was characterized using the Standardized Precipitation Index (SPI) computed from the earth observation-based gridded CHIRPS (Climate Hazards Group InfraRed Precipitation with Station) rainfall data. Agricultural and hydrological droughts were characterized by using the Soil Moisture Deficit Index (SMDI) and Standardized Runoff-discharge Index (SRI), respectively. The monthly time series of SMDI was derived from model-based gridded soil moisture and SRI from observed streamflow data from 1982 to 2019. The preliminary result illustrates the good performance of the drought indices in capturing the historic severe drought events (e.g., 1984 and 2002) and the spatial extents across the basin. The results further indicated that all forms of droughts (i.e., meteorological, agricultural, and hydrological) occurred concurrently in Abbay/Upper Blue Nile basin with a Pearson correlation coefficient ranges from 0.5 to 0.85 both Kiremt and annual aggregate periods. The concurrent nature of drought is leading to a multi-dimensional socio-economic crisis as indicated by rainfall, and soil moisture deficits, and drying of small streams. Multi-dimensional drought mitigation necessitates regional cooperation and watershed management to protect both the common water sources of the Abbay/Upper Blue Nile basin and the socio-economic activities of the society in the basin. This study also underlines the need for multi-scale drought monitoring and management practices in the basin.

Graphical Abstract

1. Introduction

Drought is an abnormal weather event resulting primarily from the shortfall of precipitation for a prolonged period [1]. Shortage of soil moisture, depletion of surface and subsurface water, and crop failure are the various forms of drought manifestations that are exacerbated by the reduction in the readily available water for different use, mainly agriculture. Although agriculture is the backbone for the economy of many developing countries including Ethiopia, it is often referred to as the first and the most drought vulnerable and less resilient sector [1]. According to the USAID report (2018), the overall Gross Domestic Product (GDP) of Ethiopia depends heavily on rainfed agriculture which is sensitive to the seasonal variability of rainfall. Unfortunately, drought is a frequently recurring phenomenon in Ethiopia followed by a rigorous impact on human lives and the socioeconomic sector. The country has experienced the most severe and prominent drought events that covered the majority of its parts. The 1983–1984 drought was one of the worst droughts in the history of the country that affected more than one million people and left many people into further destitution [2]. Among the recent drought events, the 2015 drought was noted as the worst and widely spread in the eastern, central, and northwestern parts of the country. According to the United Nations International Children’s Emergency Fund [3], many people needed emergency humanitarian food assistance during this drought event. The major crop-producing and livestock farming regions in Ethiopia (i.e., Oromia, Amhara, Afar, and Somali) were rigorously struck by this drought event. Thus, the severity of the drought disaster in Ethiopia reflects its multi-dimensional nature since it manifested in different forms as meteorological, agricultural, hydrological, and/or socio-economic droughts.
The proactive drought monitoring approach is the essential step towards developing a drought management, early warning, and prediction models and strategies to minimize drought-induced impacts in the socioeconomic sector. Drought indices are used to monitor drought and measure its severity across space and time. Based on application and data requirement, drought is broadly classified into four types that include meteorological, agricultural, hydrological, and socioeconomic droughts [4,5,6]. Meteorological drought is mainly attributed to prolonged deficits of rainfall events from the long-term average. Often, meteorological drought is a precursor for the occurrence of other drought types. Some of the widely and commonly used meteorological drought indices include the Standardized Precipitation Index (SPI, [7]), Palmer Drought Severity Index (PDSI, [8]), Palmer Z-Index, Standardized Precipitation and Evapotranspiration Index (SPEI, [9]), Effective Drought Index (EDI, [10]), etc. Agricultural drought, on the other hand, is manifested and characterized by the deficit of the readily available soil moisture for plant water use. The shortage of soil moisture adversely affects crop yield and triggers vegetation loss and impairment [6]. The amount of soil moisture is highly connected to several drivers’ mainly climatic variables and other biophysical parameters (e.g., land use/land cover change, soil type, topography). There are several agricultural drought indices, however, the Soil Moisture Deficit Index (SMDI, [11]) and Evapotranspiration Deficit Index (ETDI, [11]) are some of the widely used indices in recent times. Soil moisture deficit could trigger the reduction in surface and subsurface flows, which instigates the occurrence of hydrological drought. Hydrological drought indices include the Streamflow Drought Index (SDI, [12]), Standardized Runoff Index (SRI, [13]), Surface Water Supply Index (SWSI), etc. Drought indices utilize various observed data and models to quantify drought situations.
There are several challenges in drought monitoring; however, the inaccessibility of accurate and uniformly distributed meteorological observation data is the most deterrent factor in many developing countries [13]. For large-scale drought monitoring, remote sensing technology has become an alternative source of information [14,15] that provides information relatively at high spatial and temporal resolutions in the near real-time. Therefore, blending ground-based climate data with satellite images is quite essential for a compressive drought assessment across space and time. Even some of the satellite-based rainfall products merge the ground observation data to augment the accuracy. As compared to station data, satellite data often provide continuous and public domain datasets that are widely applied to detect the onset, duration, and magnitude of drought [16]. Remote sensing-based drought monitoring approaches often use to monitor the vegetation condition, greenness, and health in response to drought. Naturally, drought has a strong association with vegetation condition and cover, and therefore, vegetation indices are also widely considered for capturing the extent and severity of drought impacts [17,18].
Given the complex nature of drought and its different forms, drought-monitoring using a single drought index derived from a single variable sometimes lacks the ability to provide comprehensive information to successfully characterize the different drought types that occur concurrently [19]. Although the decision-makers need concise and timely facts to trigger informative decisions, considering the multidimensional aspects of drought through employing several drought indices facilitates a pragmatic decision. In a transboundary river basin, integrated effort on drought monitoring and management is vital to mitigating its adverse impact on surface and subsurface flow components. However, hydrological drought indices are often derived from point-based single variables (e.g., streamflow) that are constrained to capture the detailed spatial distribution and drought disaster picture of the entire basin. Therefore, any drought-related negotiation and talks among the riparian countries for shared water resources should incorporate the multidimensional aspects of drought and its characteristics across time and space in the upstream reaches of the basin to reflect the shared responsibility of drought disasters among the parties.
The Nile river basin in Eastern Africa is home to millions of people and the main source of water supply. However, climate change/extreme variabilities coupled with rapid population growth led to pronounced pressure on the sustainability of water resources in the region. For instance, there are storage facilities (e.g., dams) being constructed downstream riparian countries (e.g., Egypt and Sudan) in the Nile river basin. These storage dams prompted the downstream countries to become more resilient to meteorological drought as compared to the upstream countries where there is a limited number of such storage dams to delink meteorological drought from other forms of drought. There are limited research efforts conducted thus far on drought monitoring using several drought indices in the basin. Therefore, drought-monitoring using several drought indices that represent the different components of the water cycle is vital and a crucial step forward for a better understanding of the different forms of drought and making informative drought-related decisions to secure water resource sustainability and management in the basin.
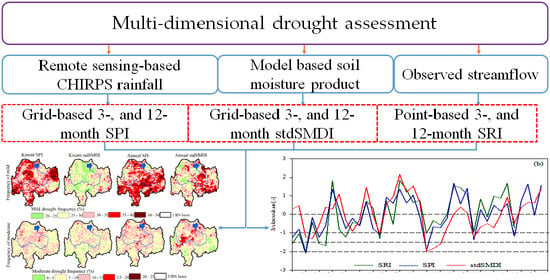
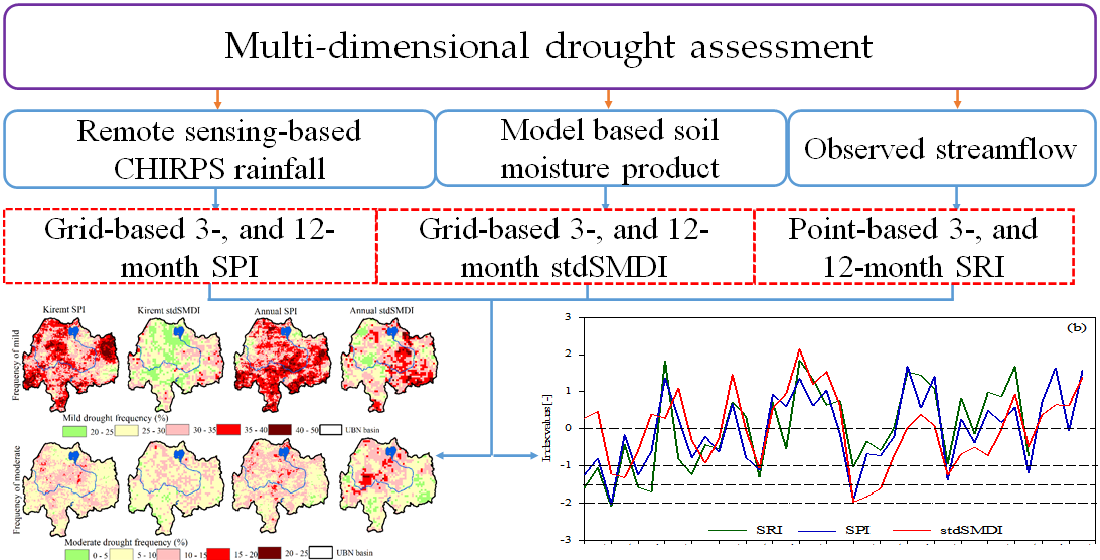
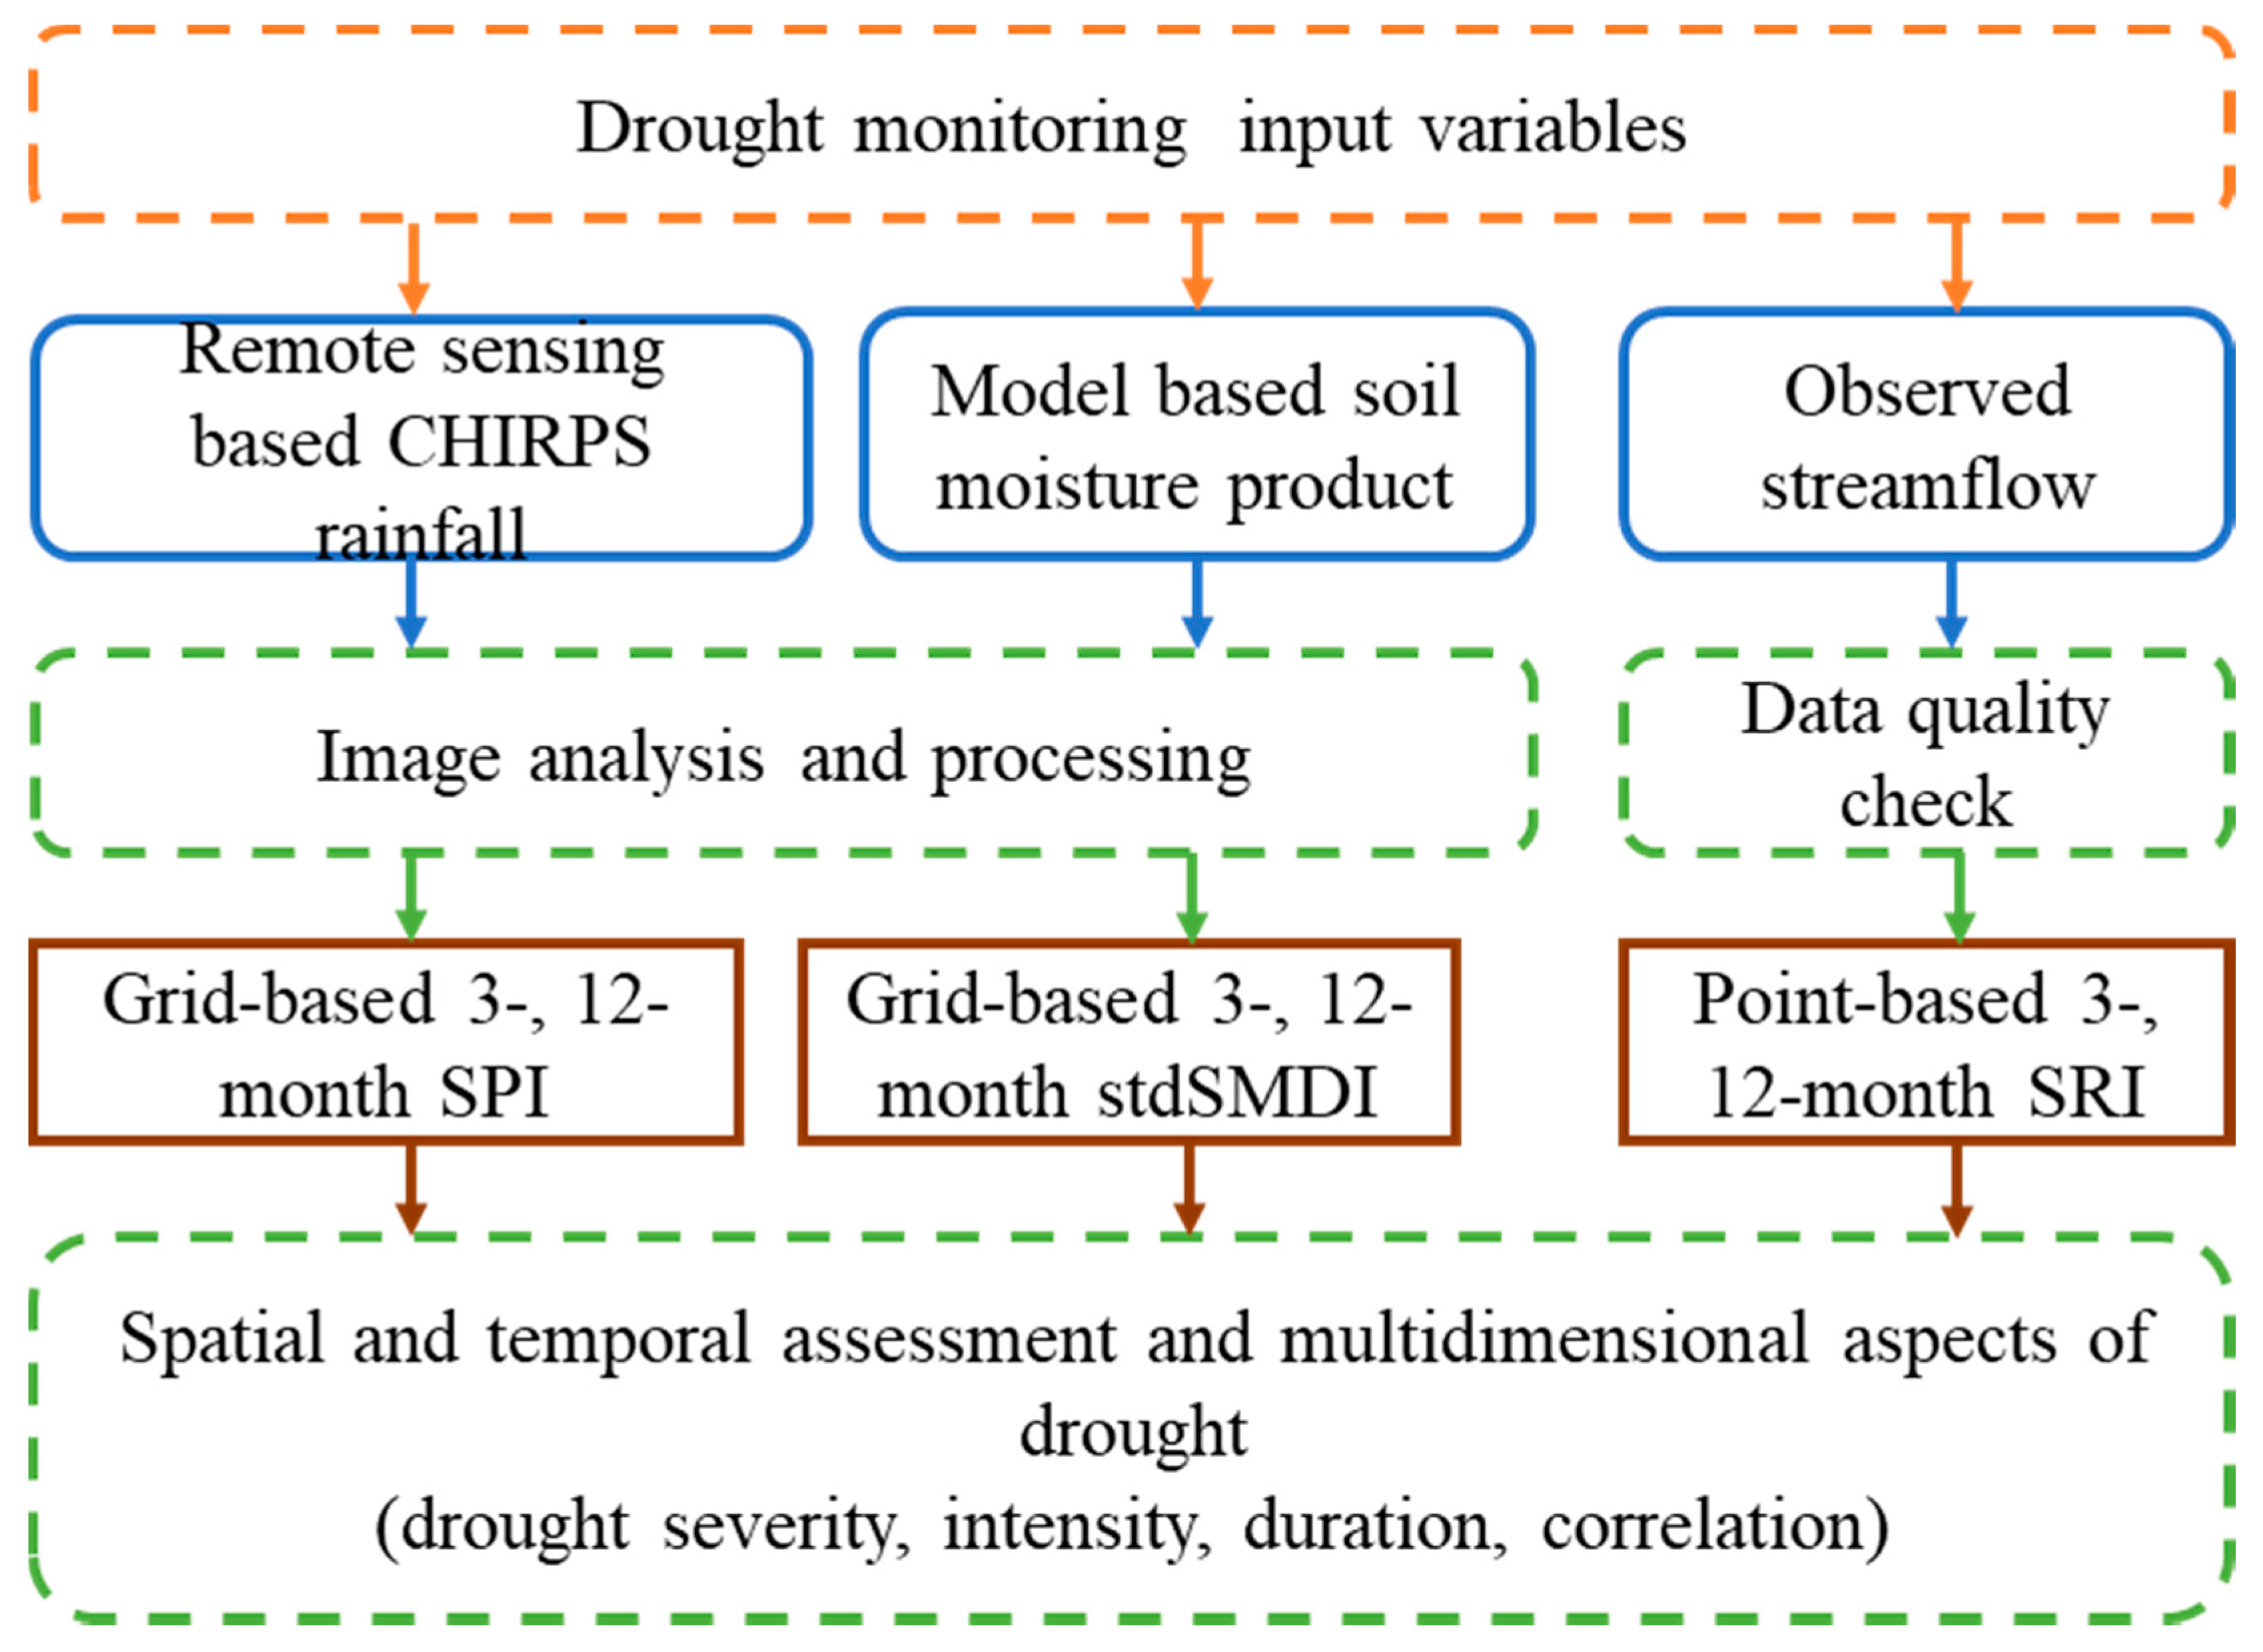
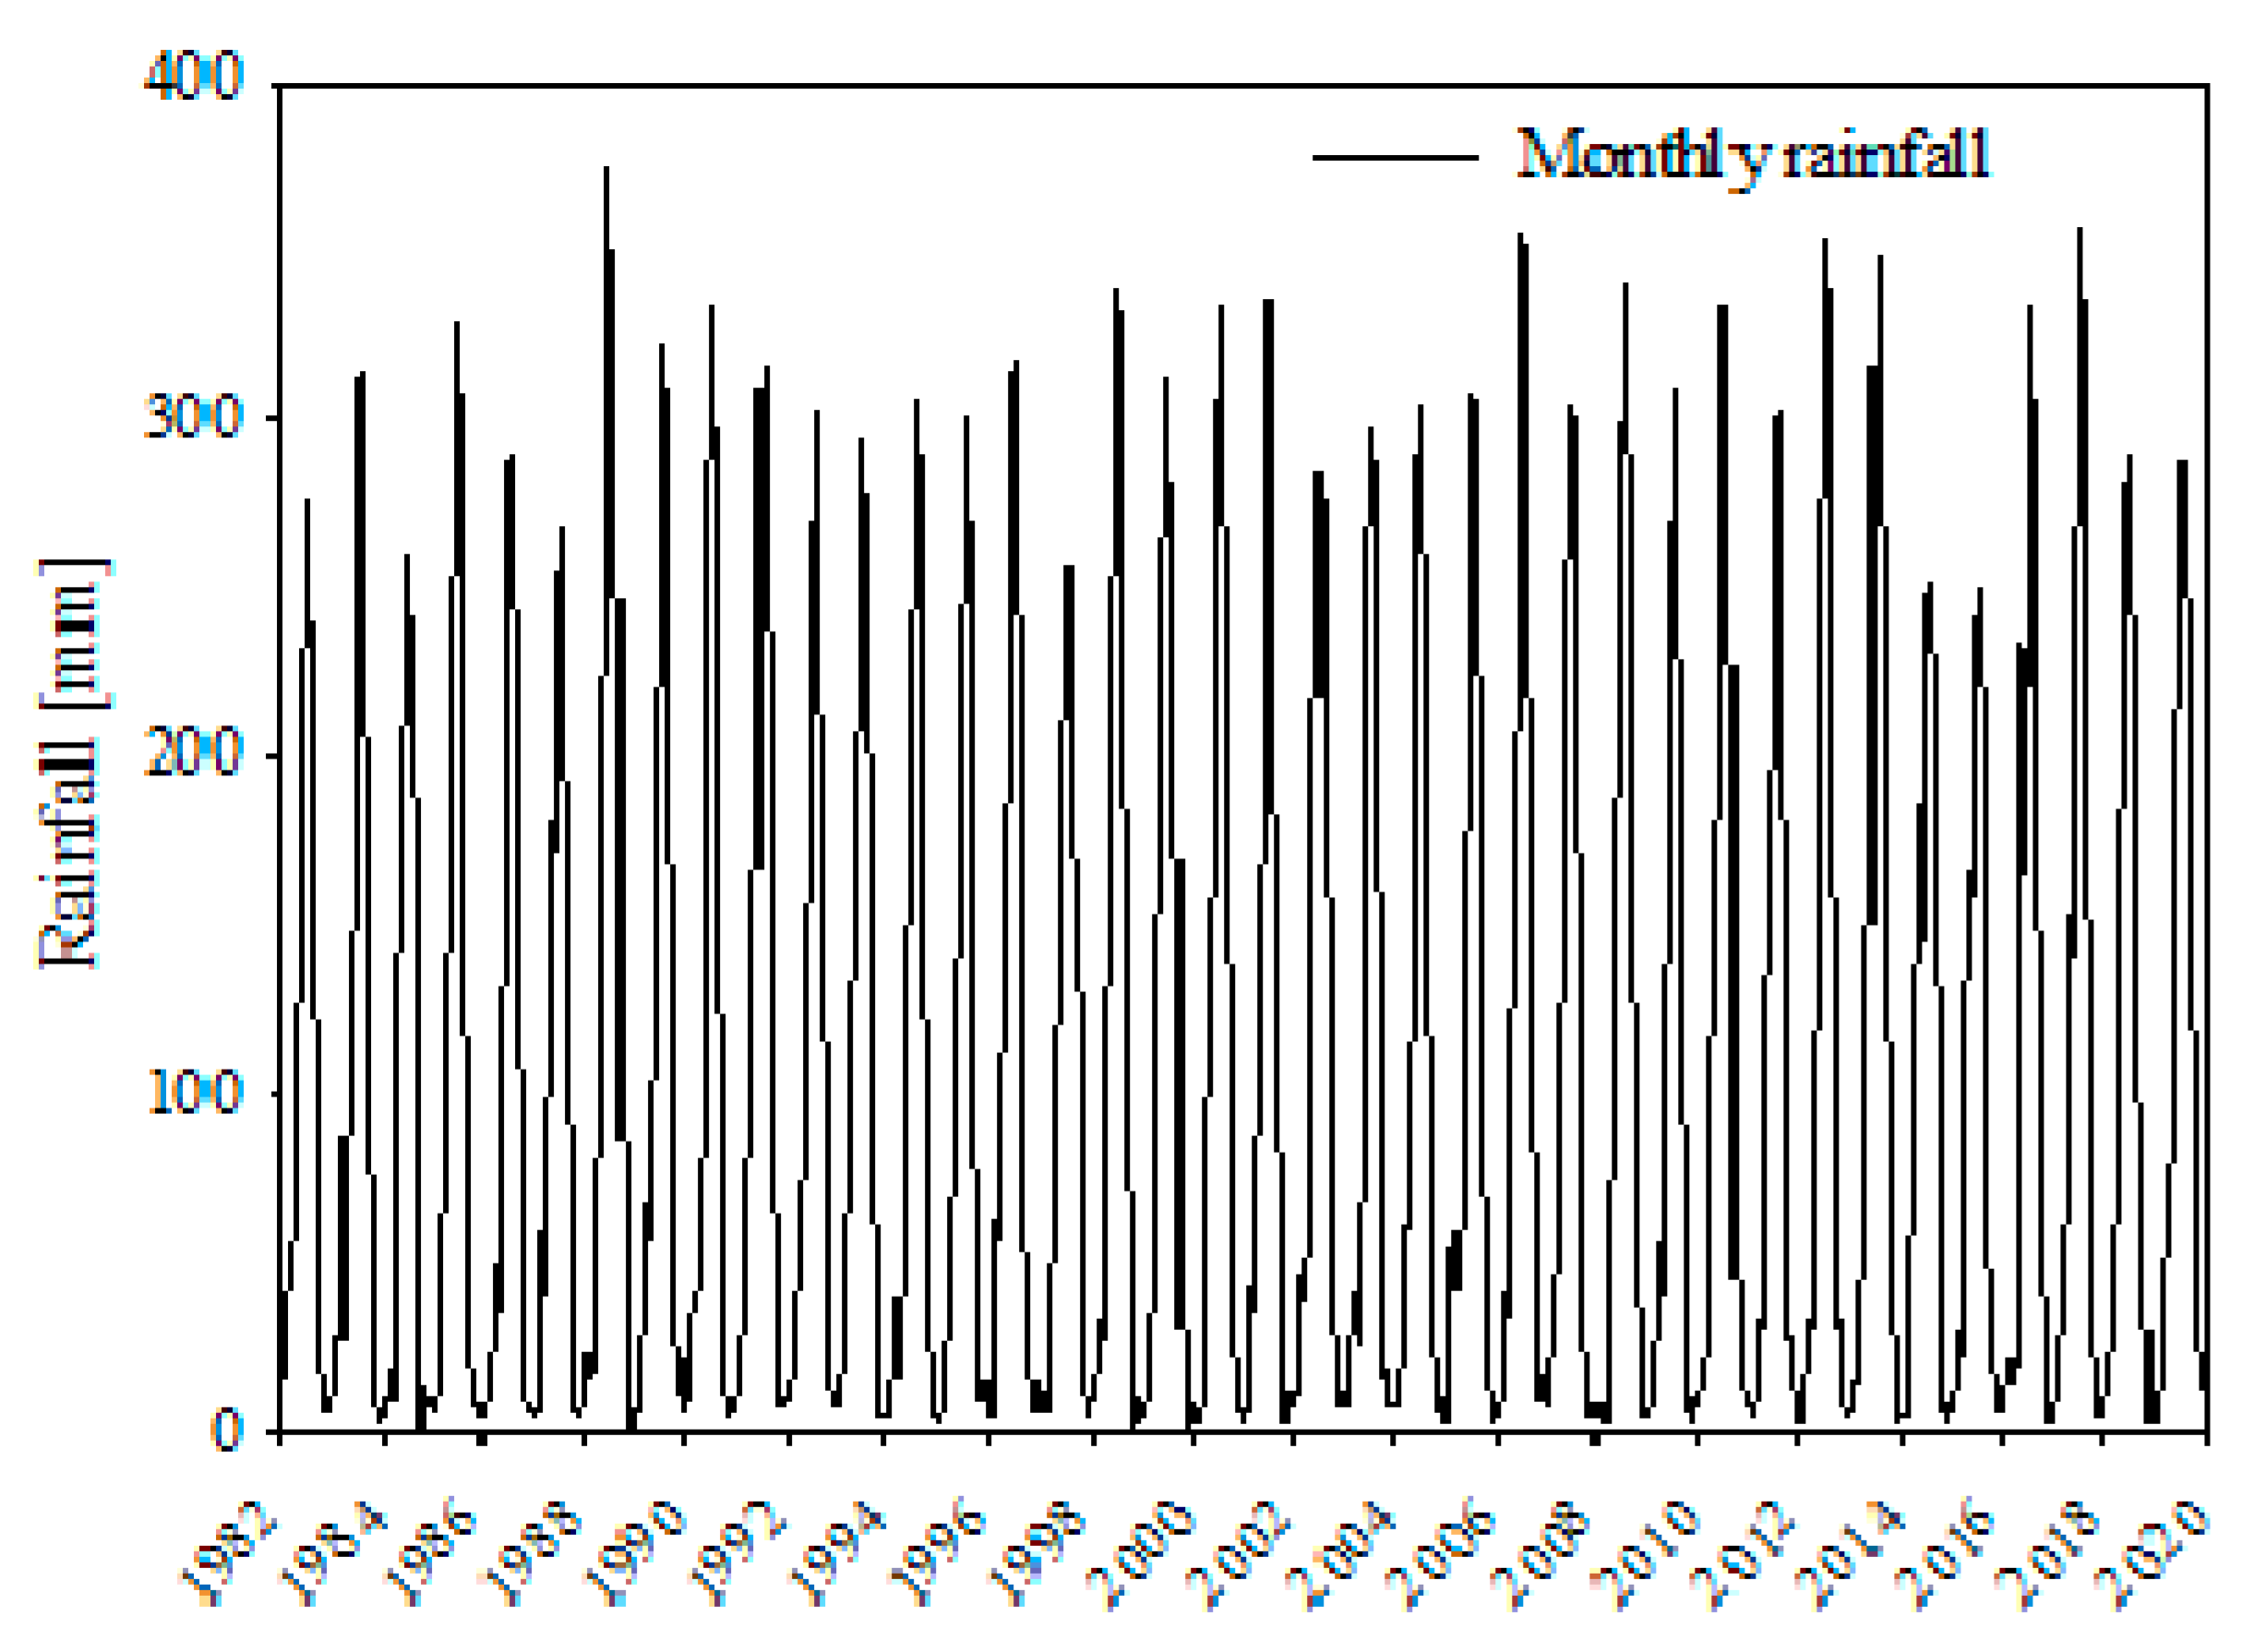
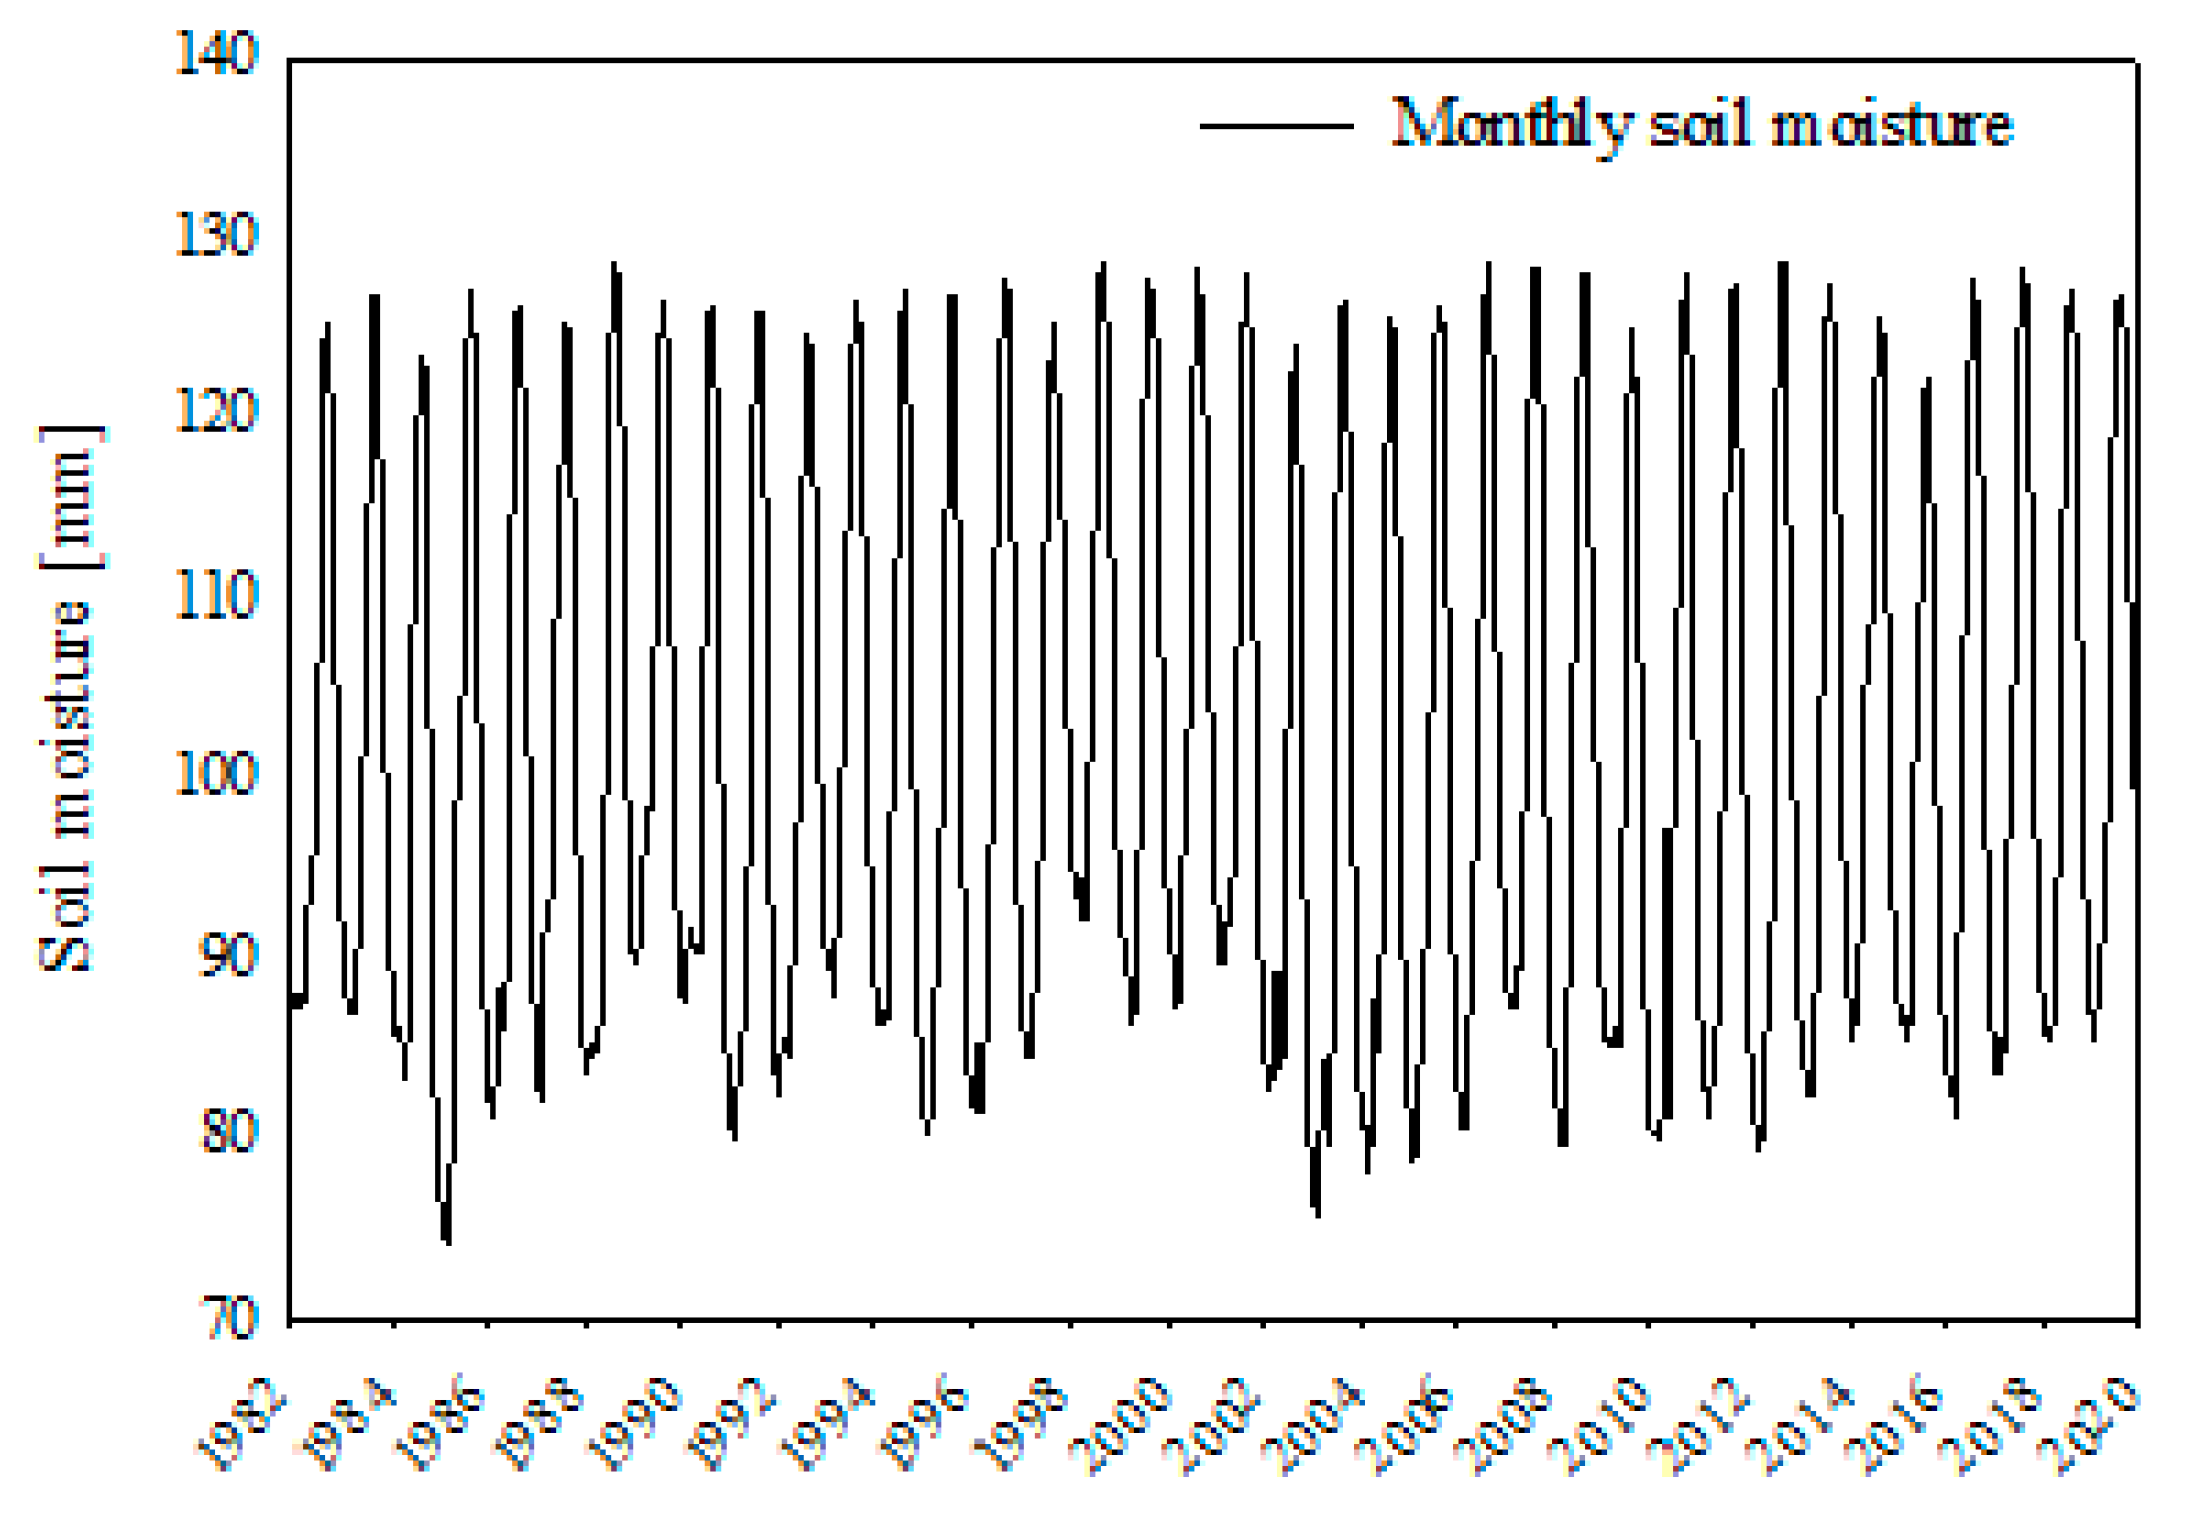
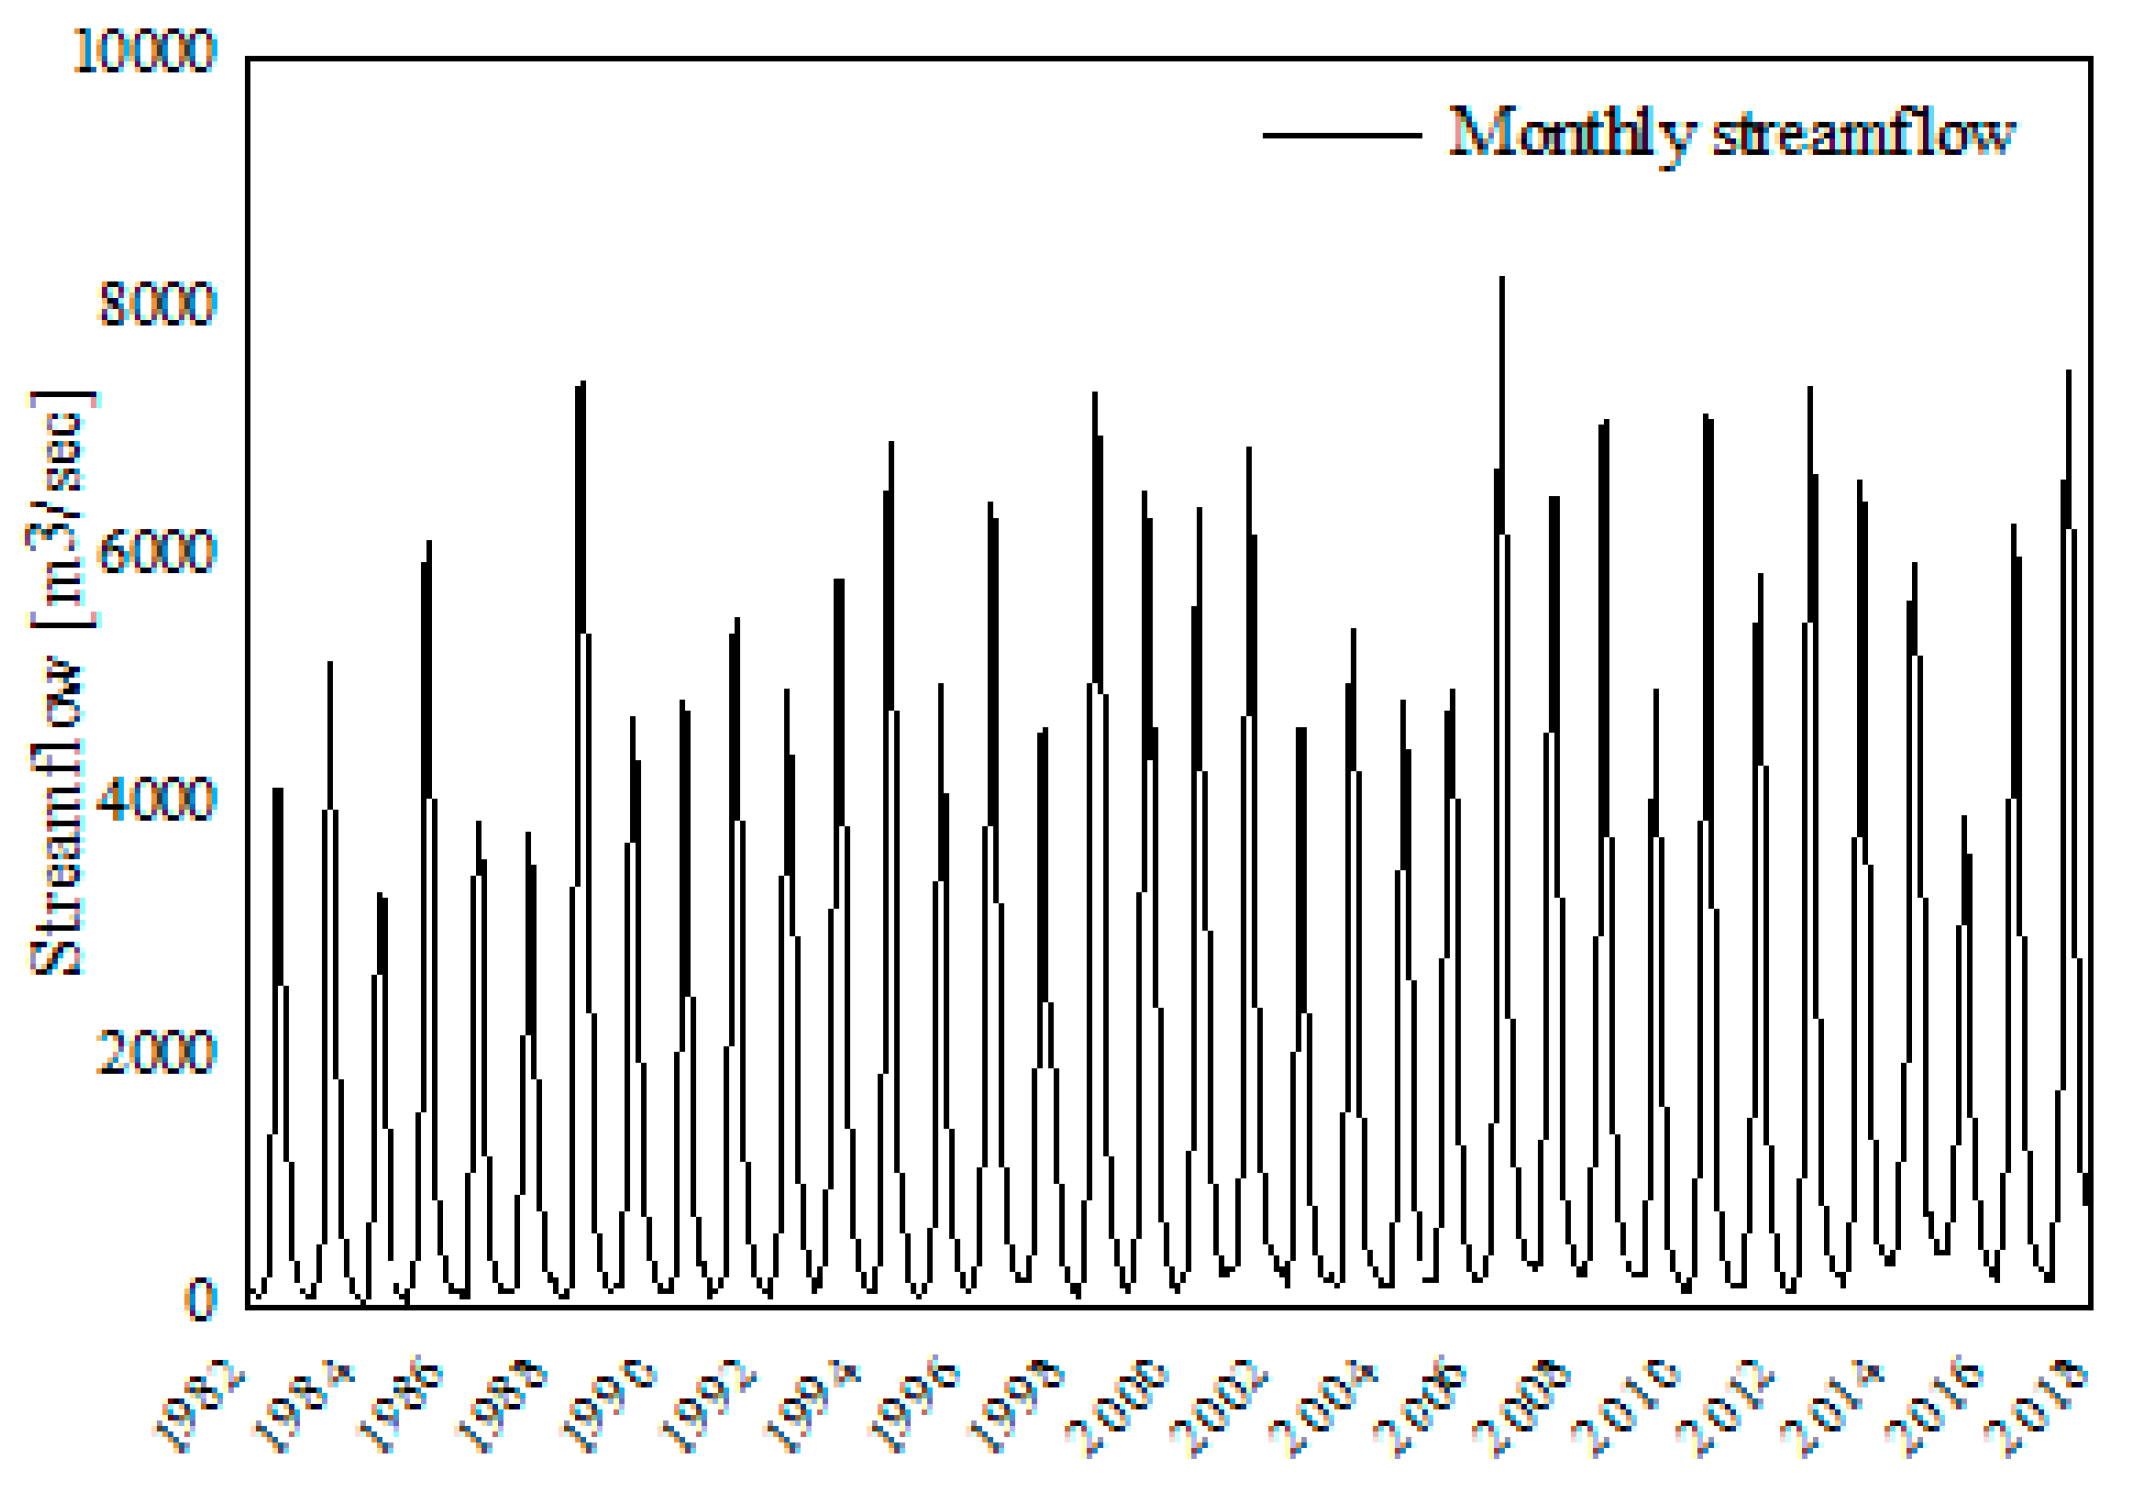
The objective of this paper is to demonstrate the different forms of droughts that occurred in the Abbay/Upper Blue Nile River basin and their national and regional scale implications. Multiple drought indices derived from in situ and earth observation-based hydro-climatic variables were used to characterize meteorological, agricultural, and hydrological droughts in the basin. The temporal pattern of each drought was assessed from 1982 to 2019 and the spatial patterns of meteorological and agricultural droughts were shown for the selected drought and wet years to explore the drought extents across the basin. The findings of this study argue for the efforts to develop a robust drought monitoring system for the basin and for drought impact assessment of the socioeconomic sector.

2. Study Area and Drought History

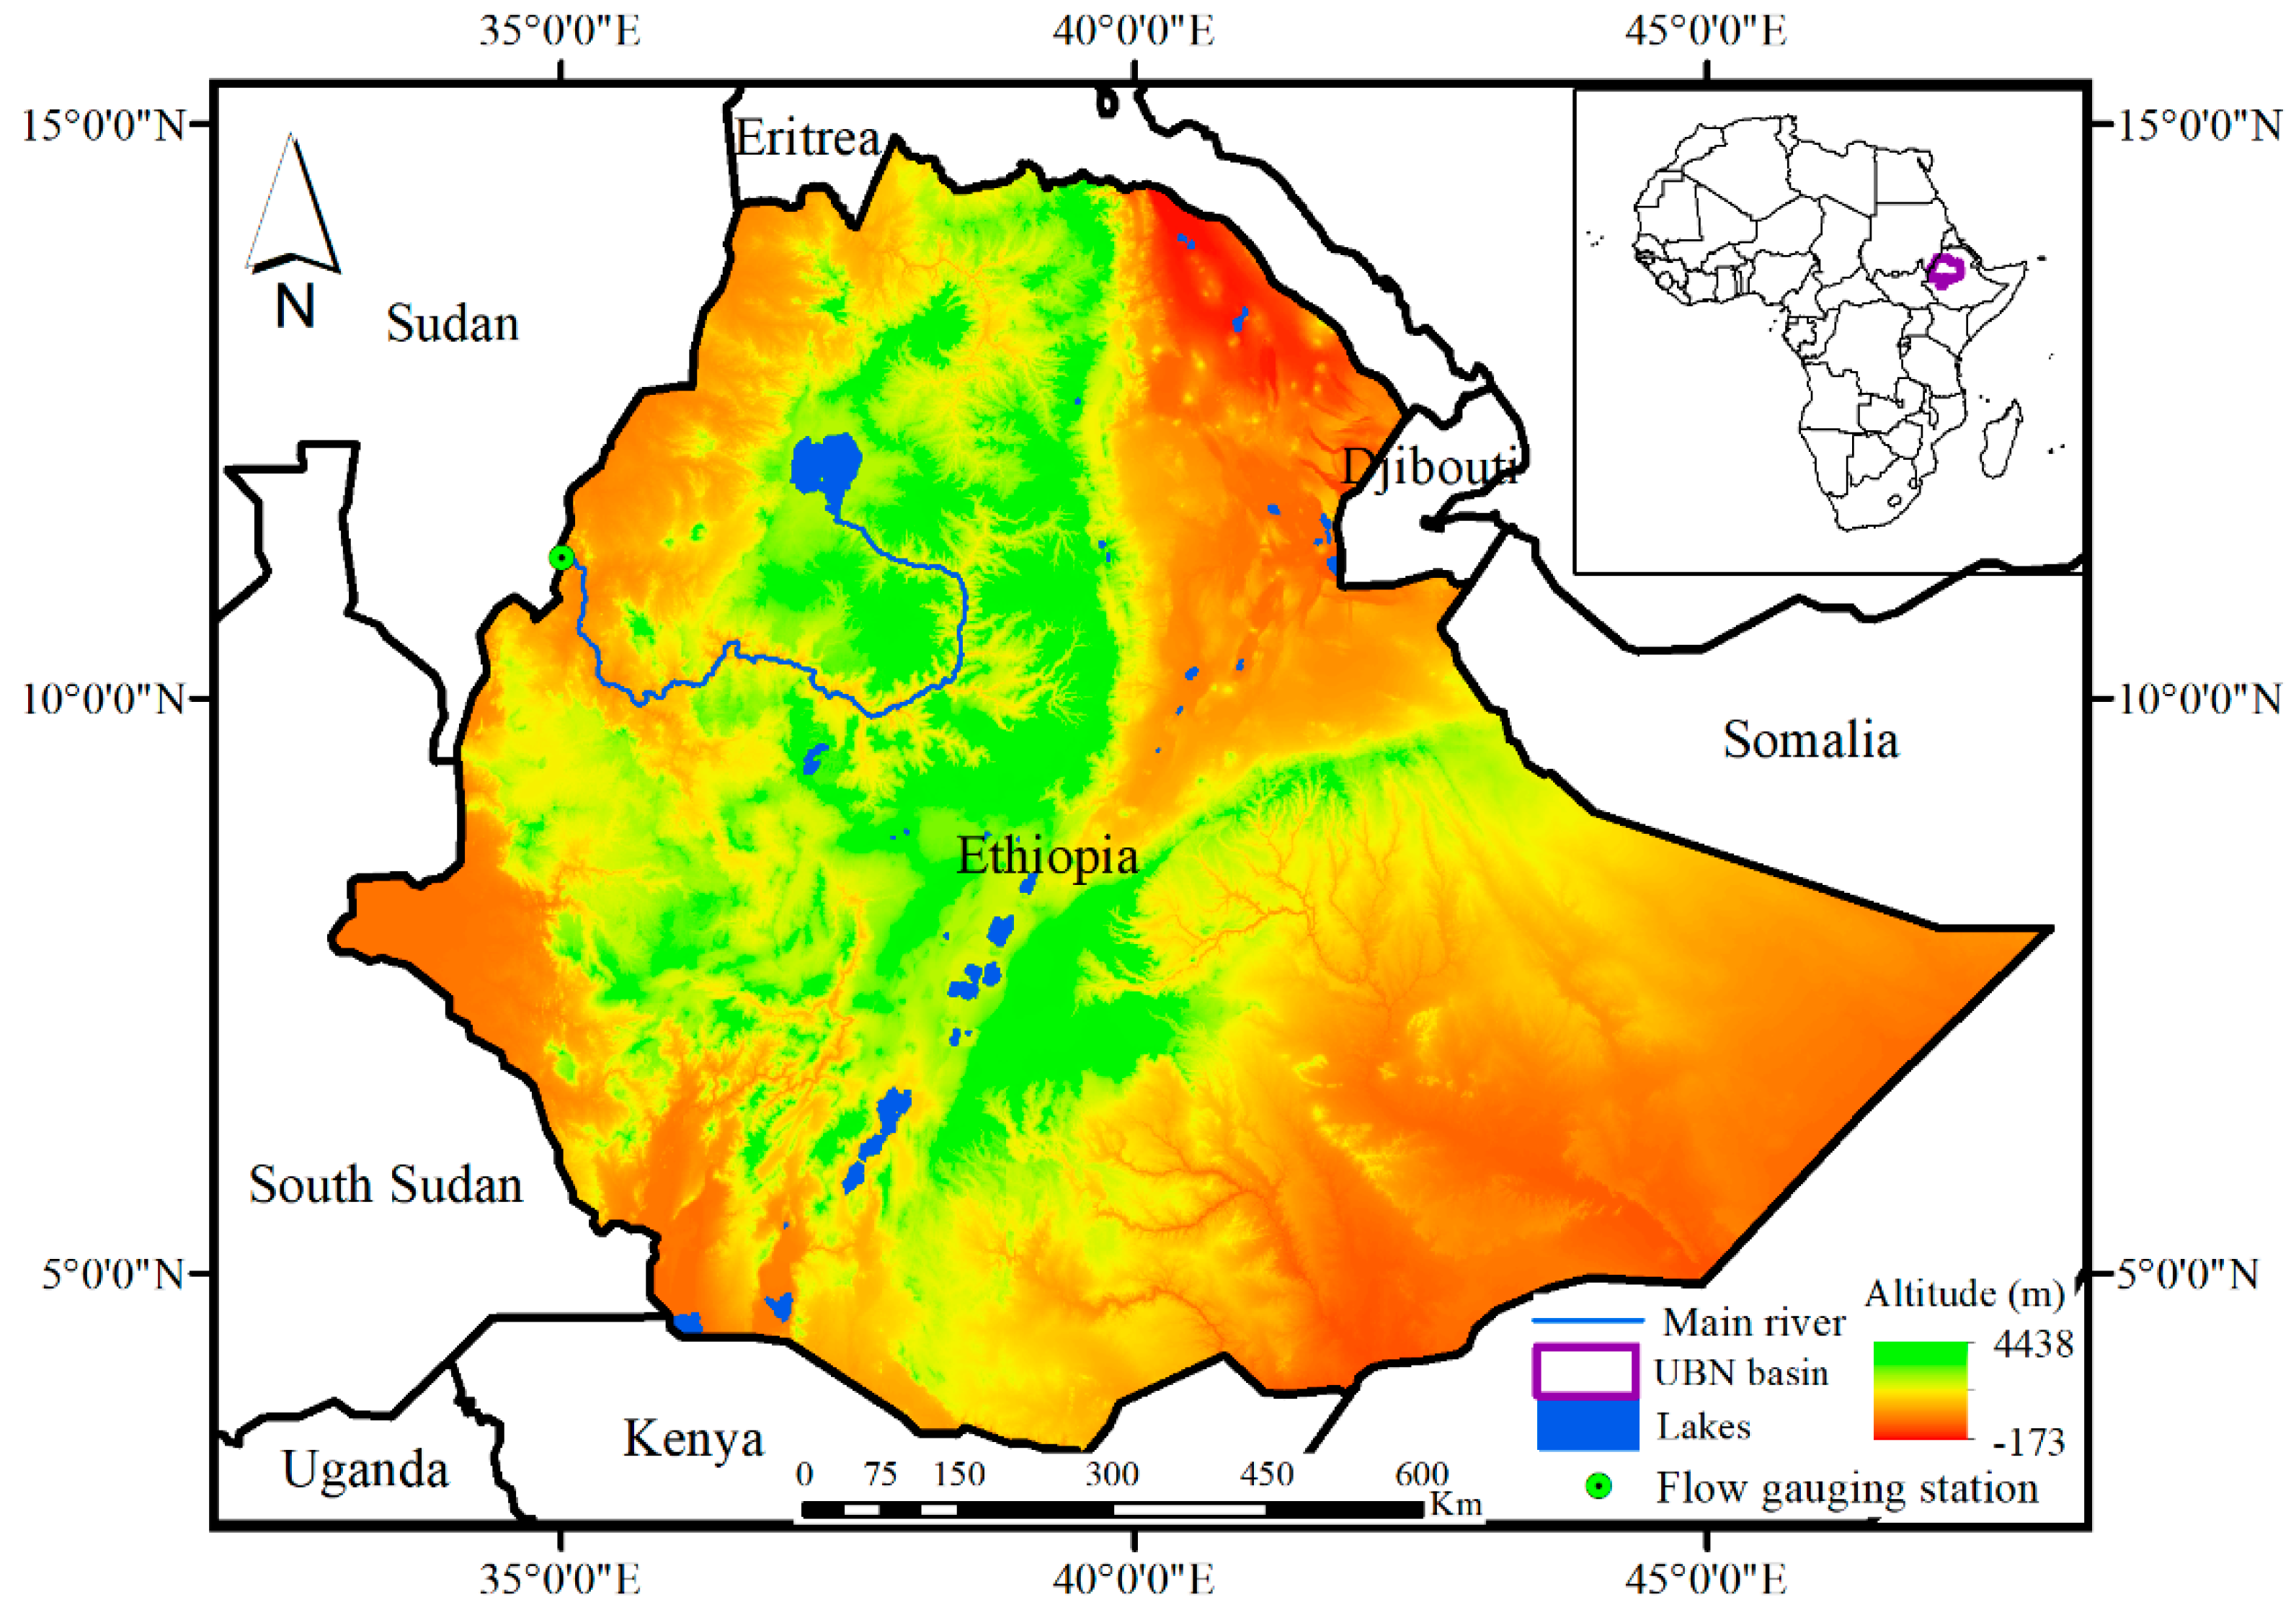
The Upper Blue Nile (UBN) Basin is located at the geographic coordinates of 7°40′ and 12°51′ N latitudes, and 34°06′ and 40°00′ E longitudes in the northwestern part of Ethiopia (Figure 1). The basin covers a total area of ~176,000 km2 upstream from the Ethiopia-Sudan border [20]. The annual rainfall ranges from 780 mm to 2200 mm, with the highlands having the highest rainfall (ranging from 1500 to 2200 mm) and the lowlands receiving the lowest rainfall ranging from 1500 to 780 mm [20,21,22]. The main rainfall season (locally called ‘Kiremt’) spans from June to September, and 82% of the annual streamflow generates during this season [23]. The long-term average annual volume of flow at the outlet of the basin is ~48 billion m3 and represents about 40% of the total surface flow of the country [20]. More than 85% of the annual crop is produced during Kiremt season [24]. The mean annual temperature ranges from 13°C in southeastern parts to 26°C in the southwestern part near the Ethiopia-Sudan border [25].
Drought is becoming a critical issue in the UBN basin and previous studies indicated the frequent occurrences of historic drought events in the past few decades. Frequent droughts have affected the socioeconomic sector, which largely relies on rainfed agriculture and less resilient to drought. For example, Bayissa et al., [26] demonstrated the drought vulnerable parts of the basin and the historic drought events in the basin. The 1984 and 2015 droughts were some of the severe drought years in the basin that affected the socioeconomic sectors and annual water budget. UBN is the major tributary for the Nile River and contributes more than 60–-69% of the total annual flow [20,21,27]. In addition, population growth, poor land use and water management are becoming the recurring challenges that aggravated water resource insecurity in the basin. Thus, integrated drought management and planning at the regional scale is crucial to mitigating its adverse impact on the water resources.

3. Materials and Methods

3.1. Data Used

3.1.1. Satellite-Derived Rainfall Data

The conventional rainfall gauging stations in the Upper Blue Nile basin are sparsely located (often lack the ability to capture the spatial variability of rainfall) and subjected to missing records. Remote sensing rainfall products on the other hand are becoming a complementary source of information particularly in data-scarce regions. Moreover, it is a widely applied product for large-scale studies such as drought and land-use changes [28]. The main advantage of some of the remote sensing products is their capability of providing uniformly distributed, consistent, and long-term data, and blend the station data. In this study, Climate Hazards Group InfraRed Precipitation with Stations (CHIRPS) rainfall product is used to assess the spatial and temporal patterns of meteorological drought in the study region. Our previous study showed the best performance of CHIRPS rainfall data as compared to the other four satellite rainfall products in the basin [29]. Other studies also supported the best performance of CHIRPS in the study region [30,31]. CHIRPS was developed by the U.S. Geological Survey (USGS) and the Climate Hazards Group at the University of California, Santa Barbara (UCSB). CHIRPS is a blended product combining a pentadal precipitation climatology, quasi-global geostationary TIR satellite observations from the CPC and the National Climate Forecast System version 2 (CFSv2) [32] and in situ precipitation observations [33]. In this study, historical (1982-2019) monthly CHIRPS rainfall data at 5 km spatial resolution were used (Figure A1).

3.1.2. Soil Moisture Data

The monthly soil moisture time series data were acquired from Famine Early Warning Systems Network (FEWS NET) Land Data Assimilation System (FLDAS) from 1982 to 2019 (Figure A2) at a spatial resolution of ~10 × 10 km. The soil moisture was derived from the FLDAS Noah Land Surface Model forced by a combination of the Modern Era Retrospective-analysis for Research and Applications Version 2 (MERRA-2) and daily CHIRPS data. In this study, the soil moisture at a depth of 0–100 cm was considered to represent the average soil moisture across the different soil horizons [34]. The lack of measured in situ soil moisture observation constrained the quality and accuracy assessment, however, the available literature substantiate the application of this data for hydrological extreme studies in the UBN basin and east Africa region at large [35,36]. The soil moisture data were used to characterize the agricultural drought.

3.1.3. Streamflow Data

The streamflow is a major element of the hydrologic cycle that represents the water generation of the given catchment or basin because of the hydrological process. The flow data were acquired from the Ministry of Water, Irrigation, and Energy of Ethiopia, and the Ministry of Water Resources, Irrigation, and Electricity of Sudan measured at the outlet of the UBN basin from 1982 to 2017 (Figure A3). The point-based flow data lacks to capture detailed spatial hydrological process across the study region. The inaccessibility of the streamflow data beyond 2017 (5% of the analysis period) limits the hydrological drought assessment of the very recent years.

3.2. Drought Indices

3.2.1. Standardized Precipitation Index (SPI)

SPI measures the standardized deviation of the observed anomaly from the long-term mean [37,38]. The SPI calculation involves fitting the raw precipitation data to gamma or other probability density functions and then transformed into a normal distribution [39,40]. Based on our previous study, gamma distribution fitted in most of the stations in the UBN basin [41] and used in this study. The SPI can be compared across the heterogeneous agro-climatic regions. The details about the calculation procedure of the SPI can be referred from Bayissa et al [41]. Based on SPI classification scales, meteorological drought can be categorized with different degrees of severity as shown in Table 1.

3.2.2. Soil Moisture Deficit Index (SMDI)

The SMDI is calculated based on the available soil water content in the soil profile [11]. First, the median, maximum, and minimum values for each month were extracted using soil moisture time series. The median was chosen because of its less sensitivity to outliers as compared to the mean. The SMDI values (deficit or excess) for the 38 years (1982–2019) were calculated using Equations (1)–(3).
SD i , j = SW i , j MSW j MSW j min SW j × 100   if   SW i , j MSW j ,
SD i , j = SW i , j MSW j max SW j MSW j × 100   if   SW i , j > MSW j ,
where SDi,j is the soil water deficit (%) ranging from −100 (very dry condition) to +100 (very wet condition); SWi,j is monthly soil water available in the soil profile (mm); and MSWj, maxSWj, and minSWj are long-term median, maximum, and minimum available soil water in the soil profile (mm), respectively. (i = years from 1982 to 2019, j = months).
Thus, the SMDI in any given month is determined by:
SMDI j = 0.5 SMDI j 1 + SD j 100
SMDI ranges from −2 to +2, with negative values indicating drought.

3.2.3. Standardized Runoff-Discharge Index (SRI)

The SRI is designated to assess hydrological drought using streamflow or other surface or subsurface flow components [13]. Its computation procedure is similar to that of SPI, which involves fitting the streamflow data to a suitable distribution function to calculate the Probability Density Function (PDF) and Cumulative Distribution Function (CDF) that eventually transforms to standardized Gaussian distribution. The SRI uses the gamma distribution to fit the river discharge data. A similar drought category was adapted as that of SPI. River discharge data at the outlets of the UBN basin were used to characterize hydrological drought.
Figure 2 shows the flowchart of the method followed in this study. The historical time series of each drought index was generated at the monthly time step from 1982 to 2019. The SPI and SMDI are computed at the pixel level using the grid-based rainfall and soil moisture data, respectively. There is spatial resolution inconsistency between these two datasets; therefore, the soil moisture was resampled to 5 km using the Nearest Neighbor technique. Both data are at monthly temporal resolution and aggregated to seasonal and annual periods to generate 3-, and 12-month SPI and SMDI. The SPI and SMDI were used to assess the meteorological and agricultural drought, respectively. For better spatial and temporal comparison among the drought indices, the SMDI was standardized (stdSMDI) and its drought severity was classified using Table 1 [42]. The hydrological drought assessment is carried out using streamflow data measured at the outlet of the UBN basin. The data were at monthly temporal resolution and representing the cumulative response of the basin. The monthly data were aggregated to seasonal and annual periods to generate 3-, and 12-month SRI for hydrological drought assessment.
The Pearson correlation coefficient values were generated for each pixel using the gridded time series of SPI and SMDI both at annual and seasonal time scales. In addition, the point-based SRI is correlated with the areal average SPI and SMDI to assess any concurrent events among each drought index. Equation (4) is used to calculate the Pearson correlation coefficient value, which measures the goodness of fit and linear association between the drought indices. It measures how well the drought indices correspond to each other. In this study, the simple linear association between the drought indices was explored at grid and point based using Equation (4).
r = ( O - O ¯ ) ( S - S ¯ ) ( O - O ¯ ) 2 ( S - S ¯ ) 2
where O is SPI, O ¯ = average SPI, S = SMDI, S ¯ = average SMDI, and n = number of data pairs.
Drought characteristics including the percentage of drought months, drought duration, intensity, and severity were computed using the areal average time series data to characterize the severity of the historic drought events. Drought severity quantified by the drought indices refers to the strength of a drought that is directly related to the impacts of drought on different sectors. The percentage of drought months is calculated by taking the ratio between the total number of months that show drought conditions (including mild, moderate, severe, and extreme drought) with the total events in the study period [26]. The maximum drought intensity represents the smallest value of the drought index within the study period (1982–2019). The average value of the maximum intensity of the different aggregate periods (3-, and 12-month) was considered for each index. The drought duration is defined as the consecutive months that show the drought condition (below normal conditions).

4. Results

4.1. Spatial Pattern of Droughts

The main advantage of using remote sensing data for drought assessment is their capability of showing the spatial extents of drought and foster to identify drought-prone regions. The meteorological and agricultural droughts were assessed using gridded rainfall and soil moisture data acquired from the remote sensing and model based products. In this study, the analysis period covers 1982 to 2019 at a monthly temporal scale. Accordingly, 901 SPI and 901 SMDI maps were produced and extracted to demonstrate the spatial and temporal patterns of the historical drought for Kiremt and annual aggregate periods. However, the output maps for the selected historic drought years (i.e., 1984, 1995, 2002, 2009, and 2015) were illustrated in this section for seasonal (Kiremt season) and annual aggregate periods. Kiremt is the main rainfall season in the basin and its failure often causes a shortage of water in the region.
Figure 3 depicts the spatial patterns of drought during Kiremt and annual aggregate periods for the selected historic drought years. Generally, moderate to extreme drought conditions were experienced across different parts of the study region. Similar spatial patterns of drought were observed during Kiremt and annual aggregate periods in most of the drought episodes. Central and eastern parts of the basin were stricken heavily by drought in 2015 in comparison to other historic drought episodes in both aggregate periods. Severe to extreme drought conditions covering a relatively larger area were observed mainly in the eastern and northwestern parts of the basin in 1984 for Kiremt and annual aggregate periods. The 1984 drought led to famine mainly in the eastern part (south and north Wello region) of the basin and it was the news headlines [2]. This drought turned to famine as a result of dry episodes during the previous consecutive driest years [43]. The severity of this drought episode was extensively demonstrated by Segele and Lamb [44] and they directed the rigorous and widespread impacts of this drought event over Ethiopia. The central part of the basin was less stricken by the 1984 drought as compared to other parts of the basin during Kiremt and annual aggregate periods. The 1995 drought severely affected the southern and central parts and some pocket area in Western and Northern parts. According to Bayissa et al [26], the extreme drought hit mainly the southern part in 1995. Mild to extreme drought prevalent in 2002 as compared to other drought years. Overall, there is some similarity of the spatial patterns between agricultural and meteorological droughts except less intensification of the agricultural drought, particularly during the annual aggregate period. Severe to extreme droughts covering the majority of the basin were observed in 2002 and 2009 during the Kiremt season as compared to the other historic drought years. The year 2002 was found to be one of the driest years that affected severely the southwestern and eastern parts of the basin. According to the US Agency for International Development (USAID) report, the failure of the rainfall in 2002 led to below-average crop production and inaccessibility to potable water and malnutrition in the basin and other parts of the country. The severity of the 2015 drought was also manifested in the agricultural drought during Kiremt as compared to the meteorological drought in the eastern part. Strong El Niño associated with the warming of equatorial waters in the Pacific Ocean, affected Kiremt rainfall and prompted drier conditions mainly in the eastern and southeastern parts of the basin. Kiremt rainfall was delayed and the rains were erratic and below average that triggered substantial impacts on livelihood activities, mainly on agriculture and pastoralism. Singh et al. [45] indicated the failure of Kiremt rainfall in which the majority of the country received only 50 to 75% of the average annual rainfall amount.
Table 2 and Table 3 show the percentage of the area affected by different categories of drought for the selected historic drought years for Kiremt and annual aggregate periods. Table 2 depicts the percentage of areas affected by meteorological and agricultural droughts for each historic drought year. Mild to moderate drought categories affected a large part of the basin (27–83%) in most of the drought years except 2002 and 2015 where 59% and 42% of the area were struck by severe to extreme agricultural and meteorological droughts, respectively during Kiremt season. Furthermore, 46 to 84% of the basin was affected by meteorological drought (mild to extreme) and 38 to 100% of the basin was struck by agricultural drought in the selected drought years. Table 3 shows the percentage of the area affected by meteorological and agricultural droughts at annual time scale. In 1984, 40% of the area was struck by severe to extreme meteorological drought and followed by 2015 where 36% of the area was affected by the same drought categories. However, large parts of the basin (54%) were affected by agricultural drought in 2002. Mild to moderate meteorological and agricultural droughts were dominated in 1995 as compared to the other drought years.
Figure 4 shows Pearson correlation coefficient value for each pixel generated using the gridded time series of meteorological (SPI) and agricultural (SMDI) drought indices for Kiremt and annual time scales. These figures depict the good correlation (>0.6) between meteorological and agricultural droughts mainly in the eastern part of the basin. The high correlation in the drought-prone part of the basin indicates the concurrent nature of the agricultural and meteorological drought. The soil erosion led to land degradation and impacted the water holding capacity of the soil as a result of the loss of the fertile topsoil attributed to the expansion of the cultivated land and land-use change [46]. The central and southern parts of the basin showed low correlation for Kiremt season. These parts are mainly dominated by forest land cover [47] which is less responsive to agricultural drought at lower aggregate periods. Further study needs to be conducted to address the different landuse/ landcovers and their response to drought since different landuse respond differently to drought at lower aggregate periods.

4.2. Spatial Patterns of the Frequency of Occurrence of Droughts

The spatial patterns of the frequency of occurrence of mild, moderate, severe, and extreme categories of meteorological (SPI) and agricultural droughts (SMDI) are illustrated in Figure 5 for Kiremt and annual aggregate periods. The time series of each pixel was extracted, and the total number of each drought category (mild, moderate, severe, and extreme) was counted and divided by the total number of events to compute the frequency of occurrence of each of the drought categories. In general, the result reveals that mild drought frequently occurrence (>35%) in the majority of the basin as compared to other drought categories for meteorological drought. Moderate drought frequently occurs next to mild drought. There are also certain chances of the occurrence of severe drought in some pocket areas (>6%), however, there is a 4–6% of chance in the majority of the study region. Relatively more frequent extreme (3–7%) drought occurred in the eastern and some pocket areas in the south and western parts of the basin. The spatial patterns of the annual frequency of occurrence indicated the relatively high chance of severe to extreme drought occurrence in the drought-prone part of the basin (eastern part) and some pocket areas across the basin. In comparison to the meteorological drought, the frequency of occurrence of extreme drought covered large areas for Kiremt and annual time scales were observed in agricultural drought. Mild drought is relatively less frequent in agricultural drought as compared to meteorological drought. The memory of the soil in retaining moisture might augment the resilience to mild drought in agriculture at shorted aggregate periods as compared to the meteorological drought.

4.3. Temporal Patterns of Drought

Figure 6 depicts the resulting time series plots of meteorological, agricultural, and hydrological droughts for Kiremt (Figure 6a) and annual (Figure 6b) aggregate periods. The time series plots of the meteorological and agricultural drought indices (SPI and SMDI) were derived from the areal average values of rainfall and soil moisture, respectively. Measured streamflow data at the outlet of the basin were used to generate the time series of SRI. In general, the three drought indices concurrently show the drier and wetter conditions in most of the years both for Kiremt and annual aggregate periods except events in 1987 (SMDI showed wetter condition while the other showed dryer condition) and 1990 (SRI showed wetter while other drought indices showed dryer condition) for Kiremt season. The historic drought events were captured by all indices at different severity levels.
Table 4 shows the Pearson correlation coefficient between the drought indices both for Kiremt and annual time scales. The time series values in Figure 6 were used to generate the correlation coefficient matrix. In general, there is a good agreement between the SPI and SRI that may indicate the dominance of overland flow as compared to the subsurface flow since the soil moisture has too short a memory to retain excess water for a long time.
The characteristics of the historic drought events as identified by the three drought indices are shown in Table 5. The resulting table depicts the persistency of the 1984 drought as compared to other events. SRI indicated persistent drought conditions and relatively higher mean intensity and severity during Kiremt and annual aggregate periods as compared to SPI and stdSMDI during the 1984 drought event. The 2002 drought was the next persistent drought event that lasted up to five years as shown by Kiremt and annual stdSMDI. The other drought events lasted for on average of one year as indicated by the three drought indices except for stdSMDI, which showed an extended drought period of four and half years during the annual aggregate period in 2009. The basin average values of the rainfall and soil moisture somehow underestimated the severity of the 2015 drought events mainly in the eastern part of the basin. Table 5 also demonstrates that the intensity, duration, and severity of droughts varies for the different drought types. This variation affects countries differently. Generally, precipitation and soil moisture indices tend to be severe and intense for Kiremt season, while the runoff index is more severe and intense on the annual scale indicating that different drought scales have different impacts on countries. The Kiremt precipitation and soil moisture severe drought indices represent the impacts of drought on largely rainfed agricultural communities in Ethiopia while the annual runoff index is a meaningful representation of an index for downstream countries such as Sudan and Egypt with storage facilities. Drought has more of a multi-dimensional impact on some communities than others that is why the issue of drought in a transboundary river system must be addressed at the basin scale to minimize computation only on surface water availability alone. Overall, the drought severity is directly proportional to the drought duration and mean intensity and thus the 1984 drought was found to be the most severe drought event as compared to the other events. The atmospheric circulation during spring and summer played a significant role in the development of the 1984 drought across the country [44]. The pressure anomalies obstructed the interaction between tropical lows and middle latitude low pressure systems that eventually turned down the wave activity during the spring season over the Sahara and the Arabian Peninsula [2].
Table 6 shows the frequency of occurrence of different drought categories of the three drought types. The areal average time series data of SPI and SMDI together with the station-based SRI were used to derive the frequency of occurrence of mild, moderate, severe, and extreme droughts. This table gives concise information that might help to get generic information on how frequently the different drought categories were occurring in the UBN basin. The resulting table presents the frequent occurrence of mild drought more compared to other drought categories. Severe to extreme droughts were experienced in the basin with frequencies of occurrence from 3 to 13%.

5. Discussion

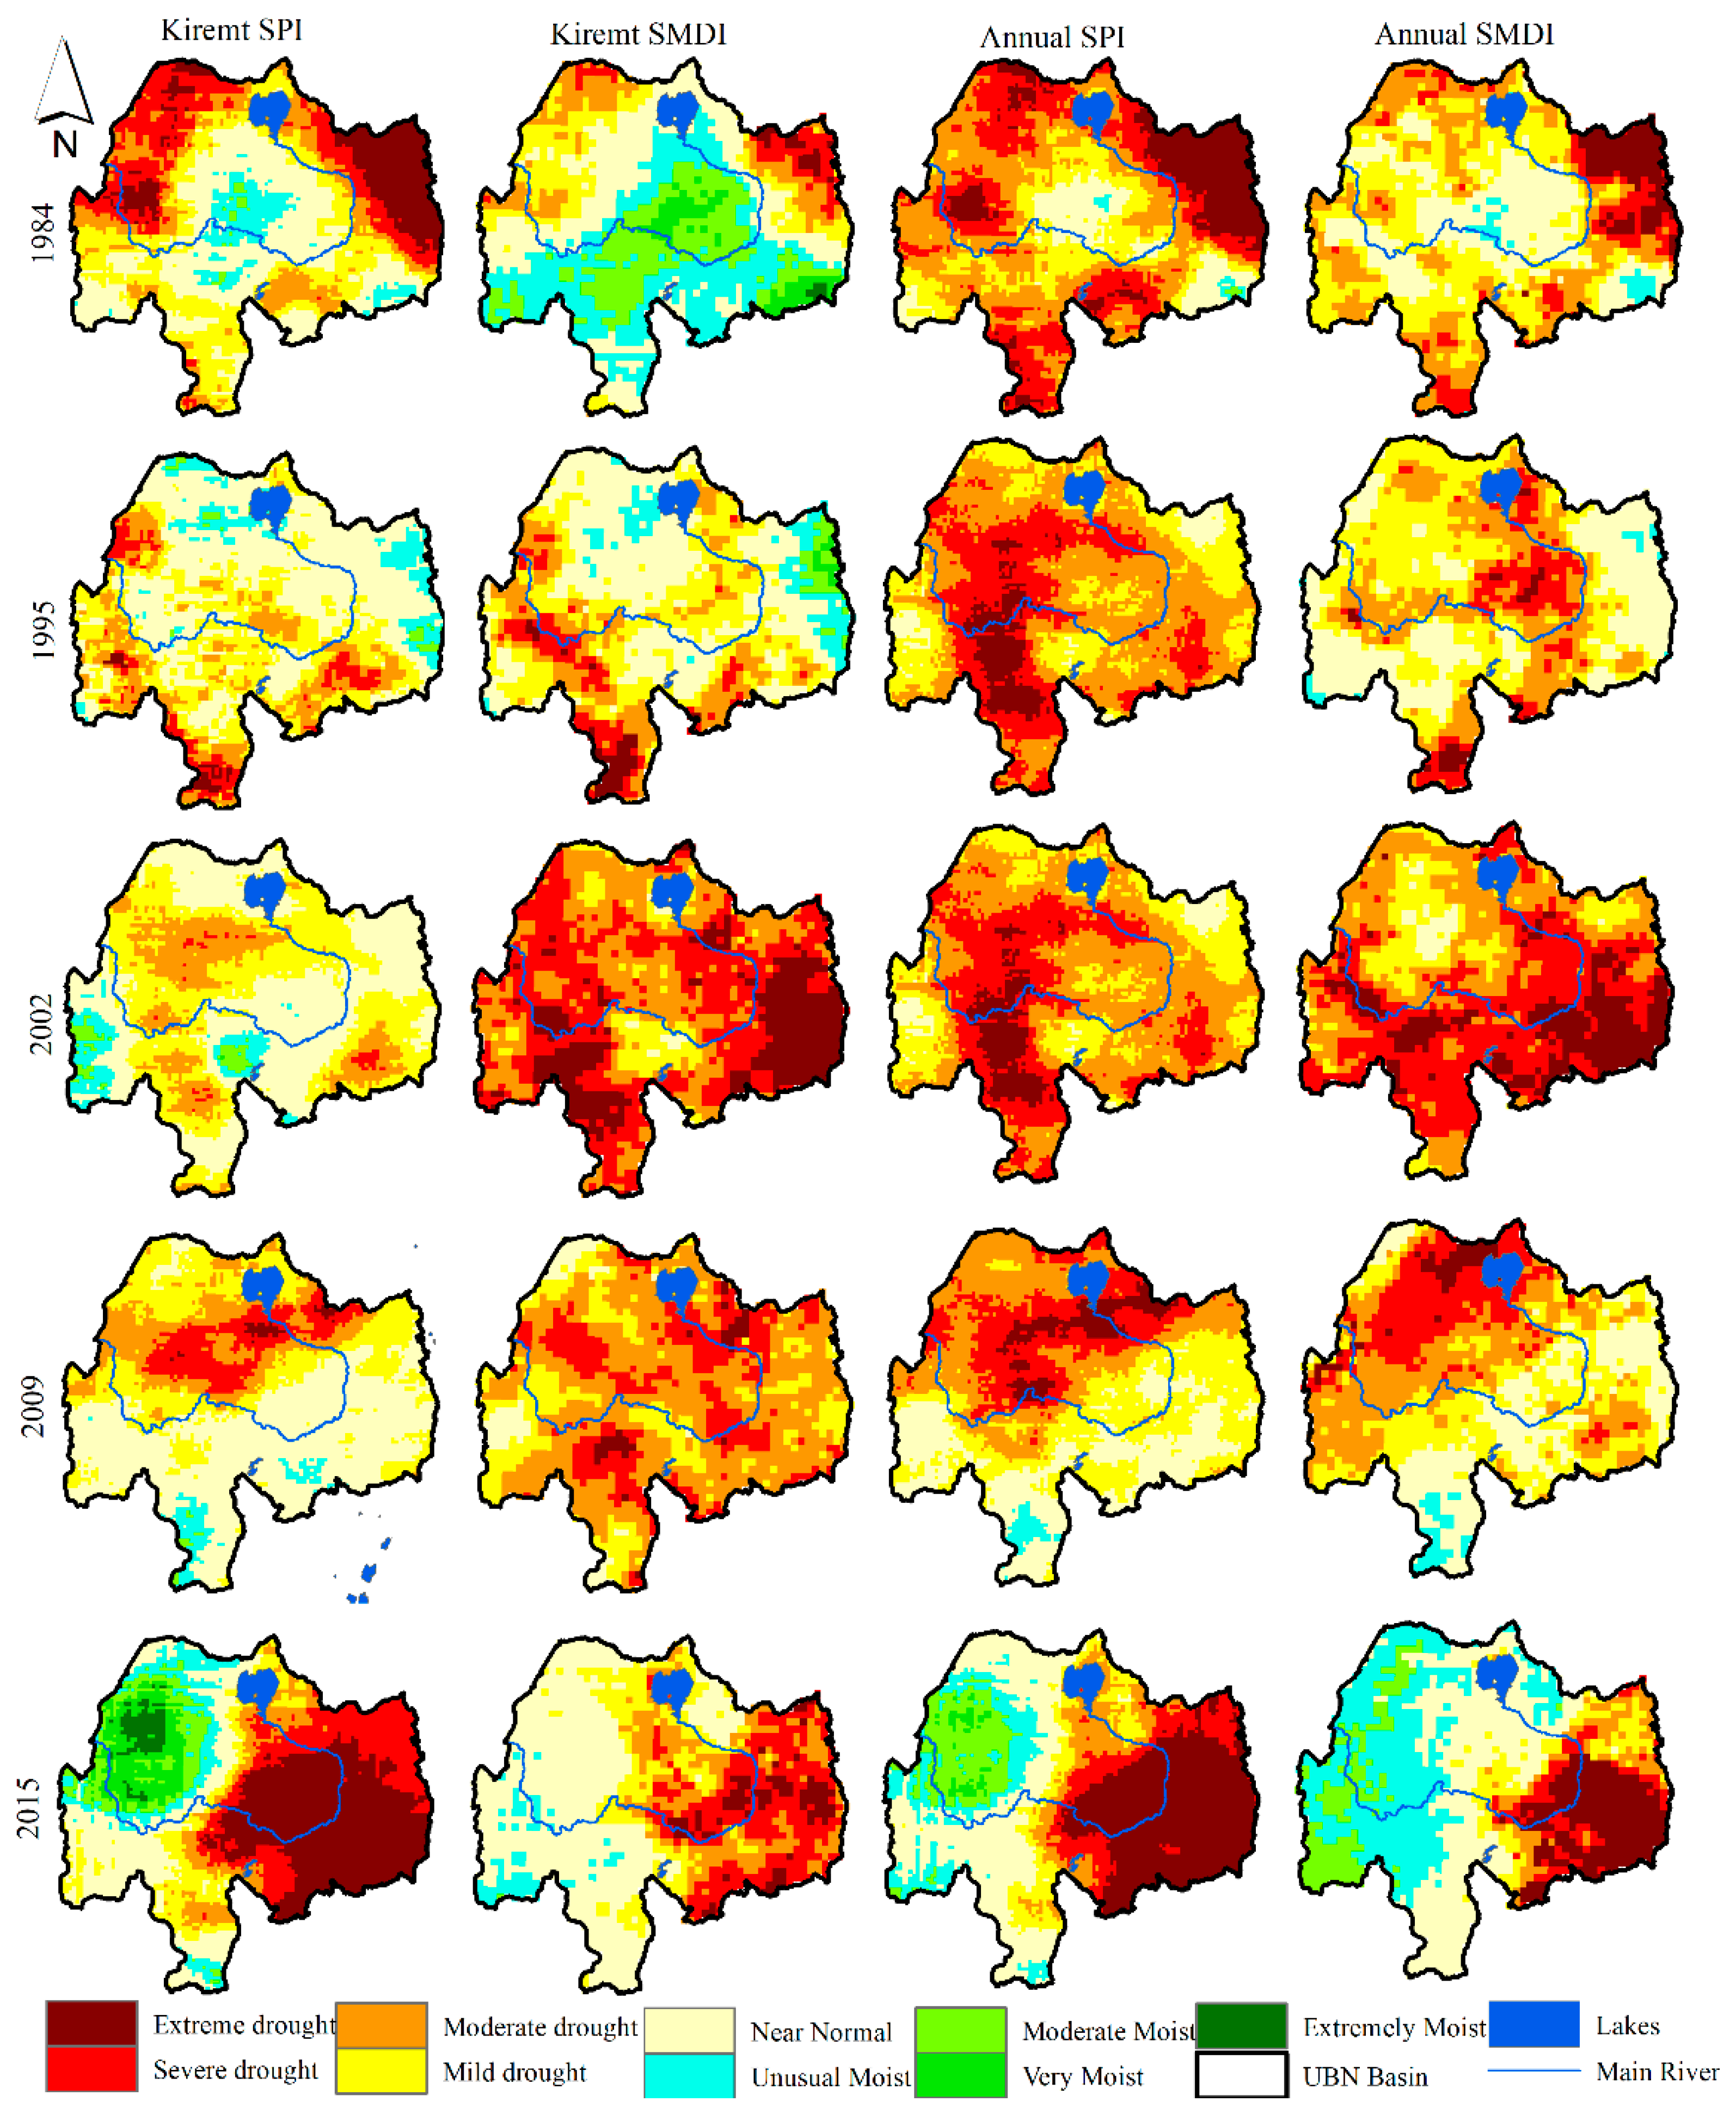
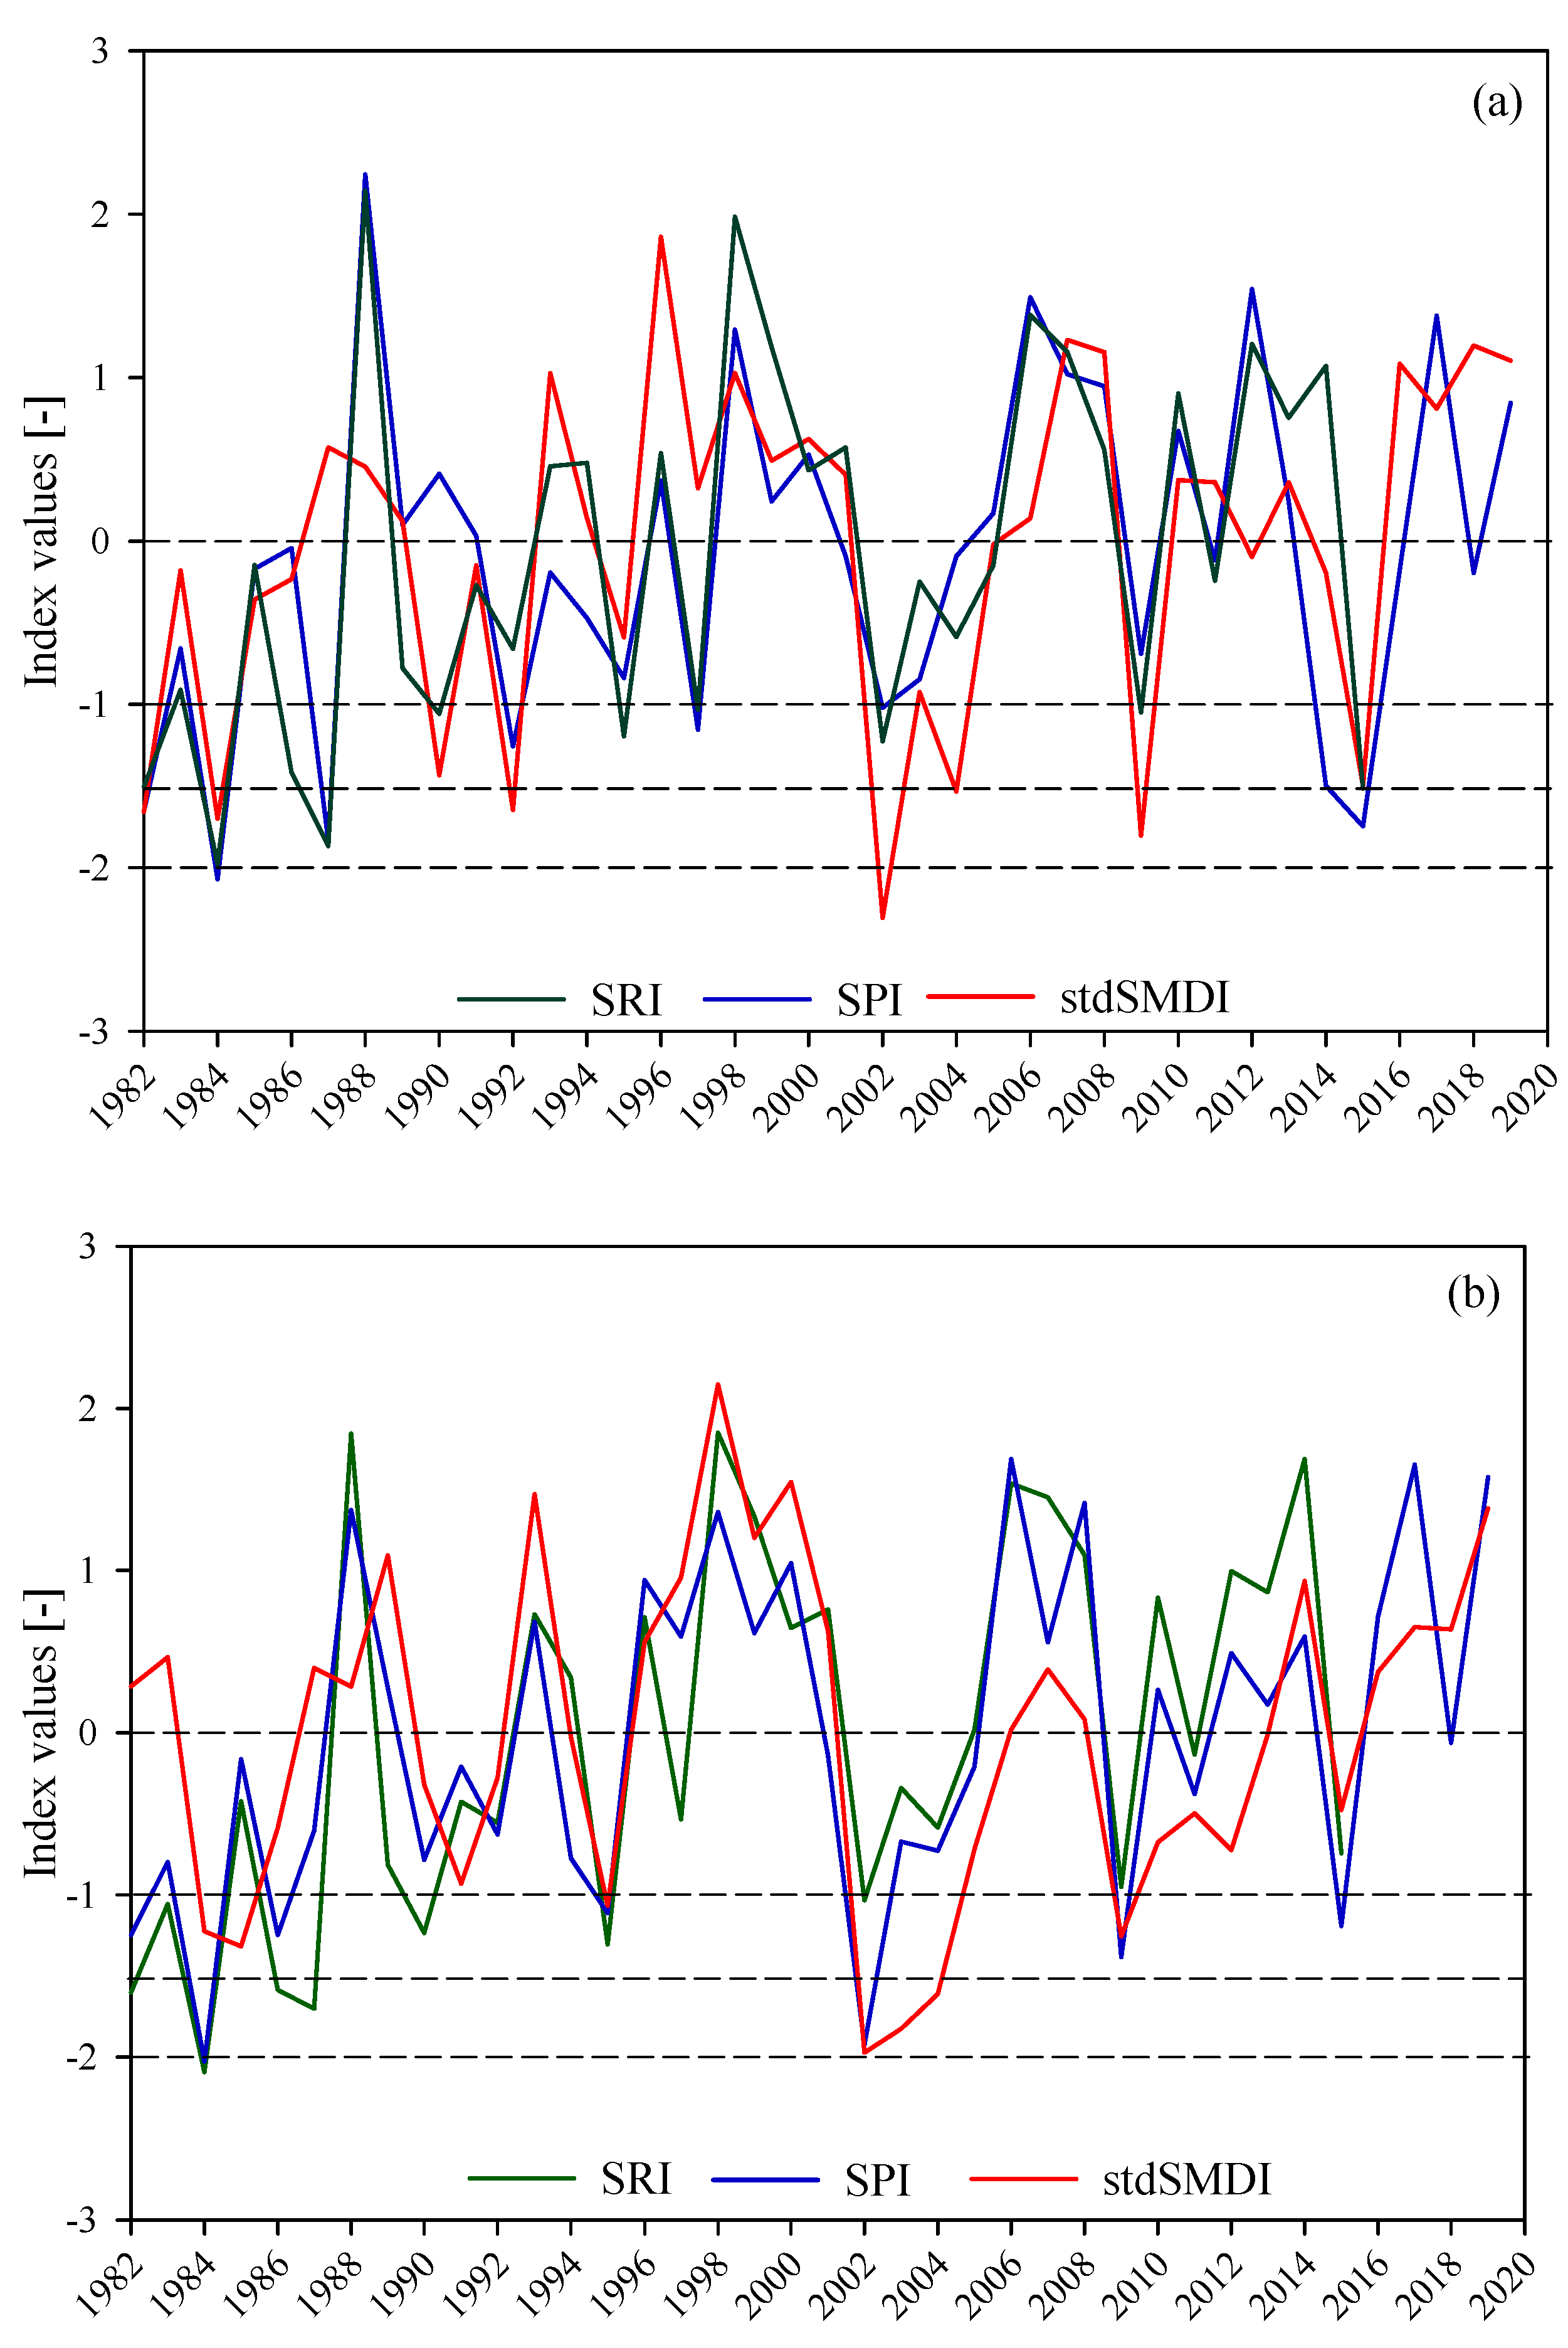
Further observation of the temporal drought analysis confirms that different forms of droughts can occur concurrently (multiple events) or as single events, complicating monitoring, and management of drought in the Upper Blue Nile. For instance, in 1984, 2002, 2008, and 2015 concurrent (multi-dimensional) drought episodes occurred, and the scale of the disaster was significant. Especially in 1984, where the drought coping capacity of the country was low, hundreds of thousands of lives were lost in Ethiopia, while the impact of stream level (hydrological drought) impact on downstream countries, for example, Egypt and Sudan, was minimal under all measures. In the rest of the multi-dimensional years of 2002, 2008, and 2015, Ethiopia managed to offset the impact of multi-dimensional drought on life, but the economic toll was still significant. A single event agricultural drought occurred in 1990 despite relatively higher rainfall and runoff (Figure 6). This is likely related to the high-intensity rains occurring for short periods affecting rainfed agriculture but not continuously enough to supplement more runoff. In contrast, there were meteorological and hydrological droughts (Figure 6) that did not affect agriculture (low or no agricultural drought). This is likely related to the low-intensity continuous availability of rainfall that supplemented soil moisture enough to support crop cultivation but was less available as runoff.
The spatial study indicates that the nexus between catchment level drought manifestation and stream level hydrological drought is complex and is not evident at different scales of the basin. While all dimensions of drought affect catchment-related socio-economic activities in the Upper Blue Nile (Ethiopia), only hydrological drought affects stream-related socio-economic activities in the downstream riparian countries (e.g., Sudan and Egypt). Thus, drought disasters affecting catchment-related socio-economic activities are multi-dimensional, regular, and more intense as observed in the recurring droughts in the Ethiopian Blue Nile catchment than those in Sudan and Egypt, which depend on the stream-related activities of the Blue Nile basin. This triggers countries to compete for the less drought-affected and storable water system in the hydrologic cycle, which is the surface runoff.
This complex and multi-dimensional drought manifestation in the UBN basin (especially in Ethiopia) needs to be seen from a basin perspective rather than a country perspective. This necessitates regional cooperation for a shared understanding of the multidimensional droughts focusing on entire basin communities at different spatial scales and responding jointly. In this way, the shared water resources like the Blue Nile River and the communities that depend on the rainfall part of the hydrological cycle can be addressed to avoid a repeat of the 1984 disaster in the communities living in the UBN subbasins. This study underlines the need for shared multi-scale drought monitoring and management practices to mitigate drought impacts across the basin.
Due to relatively short record length and inaccessibility and missing records of the streamflow data, we were unable to scale down the analysis at the subbasin/catchment level. The subbasin analysis would have captured the variability of the hydrological drought across the basin.
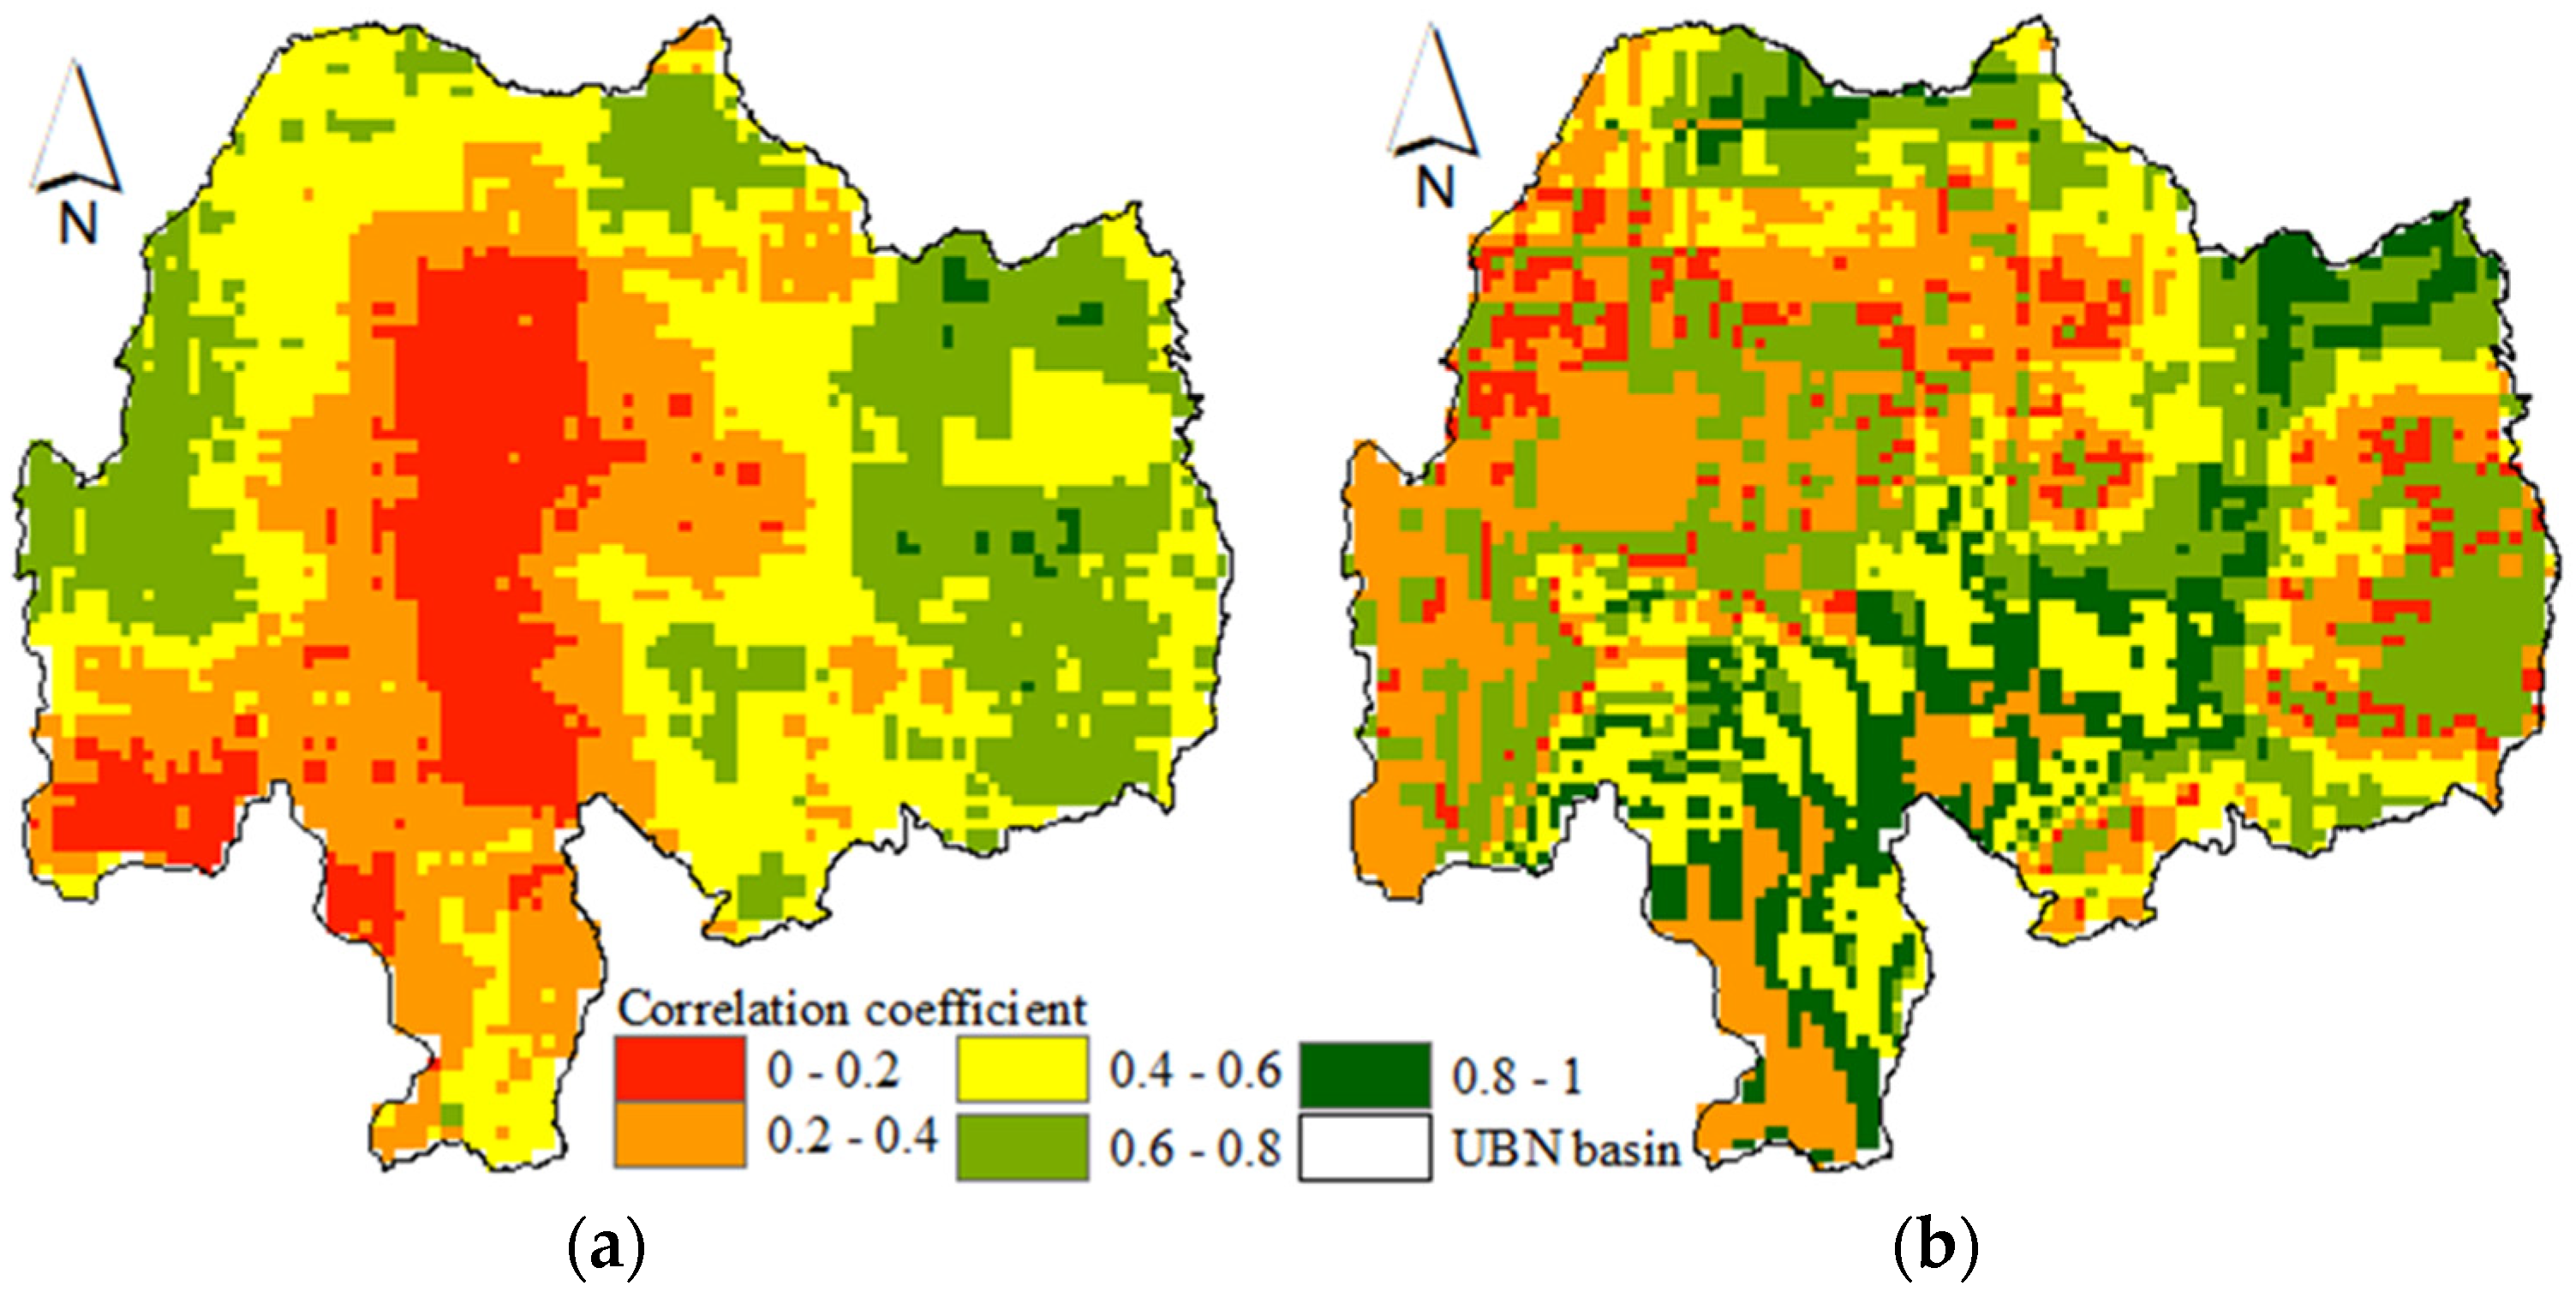
The study attempts to convey a scientific understanding of the linkages of different drought types at the basin scale and how the drought interplays affect different parts of the basin communities differently. In addition, there are several factors that largely affect the accuracy of the results of this study. The coarser spatial resolution of the input variables certainly lacks to represent and capture the high variability of the rainfall and soil moisture especially in a rugged topography like the UBN basin. The result may improve depending on the availability of the fine spatiotemporal resolution and good quality data of the input variables. In addition, the UBN basin is characterized by different land-use and soil types, which are certainly contributing to the accuracy of the results. The spatial correlation coefficient analysis between the SPI and stdSMDI showed a low correlation in areas where mixed, deciduous, and evergreen forests are dominant (e.g., central, southern, and southwest parts of the basin) [47]. This indicates the need for a detailed drought analysis for each land-use type for future study. The water holding capacity of the soil that varies with the type of soil also plays a significant role in terms of retaining the readily available soil moisture for a long period of time to enhance drought resilience.

6. Conclusions and Recommendations

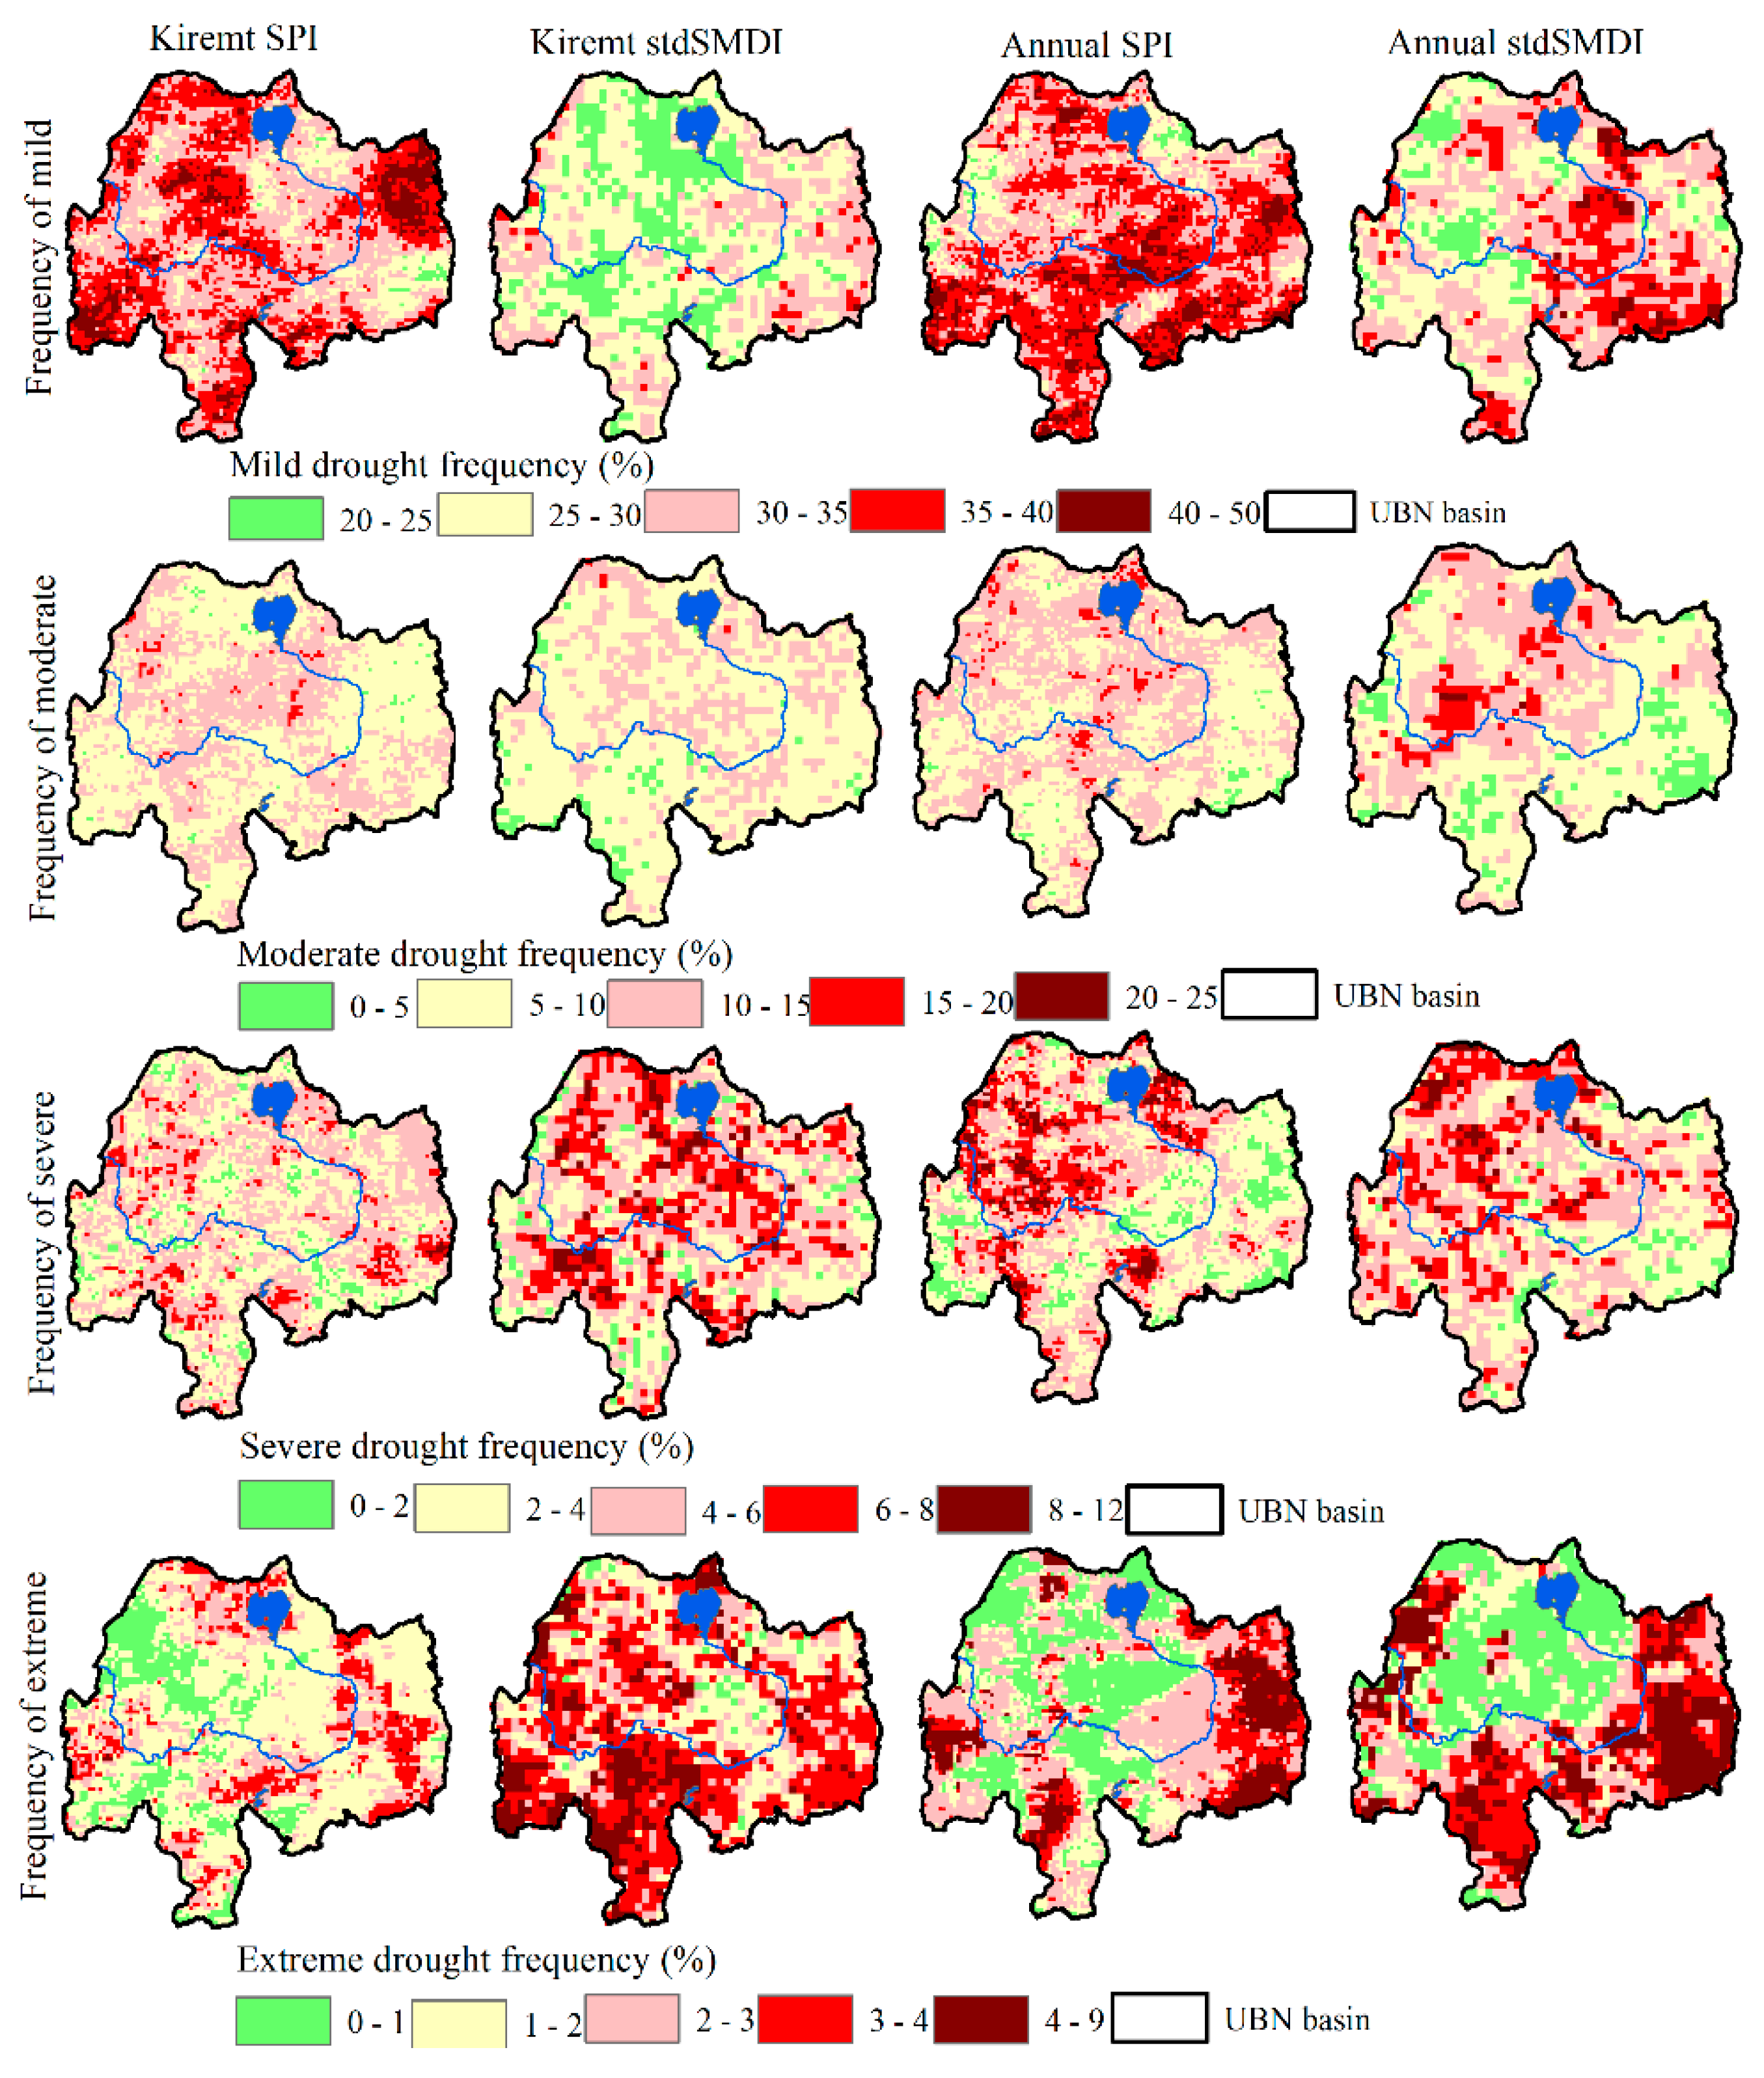
This study demonstrates the implication of the different forms of droughts at national and regional scales through drought monitoring approach using multiple drought indices in characterizing the different forms of droughts (i.e., meteorological, agricultural, and hydrological) in the Upper Blue Nile Basin. Remote sensing and station based observed input data were used to derive the time series of the drought indices that were eventually used to characterize the severity, extents, and frequency of the historic drought episodes across the basin from 1982 to 2019. SPI, stdSMDI, and SRI drought indices were used in this study to monitor meteorological, agricultural, and hydrological droughts, respectively. The UBN basin is the main source of water for millions of lives in the region and integrated drought management and planning at the regional scale is crucial to mitigate drought-related impacts to sustain the water resources in the basin.
The UBN basin is experiencing severe historic drought episodes that affect the livelihood of many populations in the basin. Based on the result obtained in this study, the amount and timing of the rainfall events significantly affected the agricultural sector in the basin and led to food insecurity and economic losses. The meteorological, agricultural, and hydrological droughts concurrently occurred in the basin, which implies the intensified and multi-dimensional aspects of drought. Multi-dimensional drought mitigation necessitates regional cooperation and watershed management to protect both the common water sources of the Abbay/Upper Blue Nile basin and the socio-economic activities of the people in the basin. This study also underlines the need for multi-scale drought monitoring and management practices to mitigate the multi-dimensional socio-economic crisis and other drought impacts across the basin.

Author Contributions

Y.B. and S.M. framed the research, analyzed the result, and prepared the draft version of the manuscript. A.M., T.T., A.Z.A., and A.W. were involved in reviewing the literature, collecting data, and pre-processing. All the authors contributed to reviewing the manuscript. All authors have read and agreed to the published version of the manuscript.

Funding

This research received no external funding.

Acknowledgments

We are indebted to the National Meteorological Agency (NMA), Ministry of Water, Irrigation and Energy of Ethiopia, and Ministry of Irrigation and Water Resources, Sudan for providing the long-term climate, and streamflow data.

Conflicts of Interest

The authors declare no conflict of interest.

Appendix A

The monthly time series of the raw data used in this study.
Figure A1. Rainfall.
Remotesensing 13 01835 g0a1
Figure A2. Soil moisture.
Remotesensing 13 01835 g0a2
Figure A3. Streamflow.
Remotesensing 13 01835 g0a3

References

  1. Wu, D.; Qu, J.; Hao, X. Agricultural drought monitoring using MODIS-based drought indices over the USA Corn Belt. Int. J. Remote Sens. 2015, 36, 5403–5425. [Google Scholar] [CrossRef]
  2. Viste, E.; Korecha, D.; Sorteberg, A. Recent drought and precipitation tendencies in Ethiopia. Theor. Appl. Climatol. 2013, 112, 535–551. [Google Scholar] [CrossRef] [Green Version]
  3. UNICEF. Ethiopia: Drought Crisis. Immediate Needs Overview. 2015. Available online: https://www.unicef.org/ethiopia/Drought_Crisis_Pitch.pdf (accessed on 6 January 2020).
  4. Wilhite, D.A. Drought as a natural hazard: Concepts and definitions. In Drought: A Global Assessment; Wilhite, D.A., Ed.; Routledge: London, UK, 2000; Volume 1, pp. 3–18. [Google Scholar]
  5. Wilhite, D.; Buchanan-Smith, M. Drought as hazard: Understanding the natural and social context. In Drought and Water Crises: Science, Technology, and Management Issues; Wilhite, D.A., Ed.; CRC Press: Boca Raton, FL, USA, 2005; pp. 3–29. [Google Scholar]
  6. Mishra, A.K.; Singh, V.P. A review of drought concepts. J. Hydrol. 2010, 391, 202–216. [Google Scholar] [CrossRef]
  7. McKee, T.B.; Doesken, N.J.; Kleist, J. Drought monitoring with multiple time scales. In Proceedings of the 9th Conference on Applied Climatology, Dallas, TX, USA, 15–20 January 1995; American Meteorological Society: Boston, MA, USA, 1995; pp. 233–236. [Google Scholar]
  8. Palmer, W.C. Meteorological Drought Vol. 30; US Department of Commerce, Weather Bureau: Washington, DC, USA, 1965.
  9. Vicente-Serrano, S.M.; Beguería, S.; López-Moreno, J.I. A multiscalar drought index sensitive to global warming: The standardized precipitation evapotranspiration index. J. Clim. 2010, 23, 1696–1718. [Google Scholar] [CrossRef] [Green Version]
  10. Byun, H.R.; Wilhite, D.A. Daily quantification of drought severity and duration. J. Clim. 1996, 5, 1181–1201. [Google Scholar]
  11. Narasimhan, B.; Srinivasan, R. Development and evaluation of Soil Moisture Deficit Index (SMDI) and Evapotranspiration Deficit Index (ETDI) for agricultural drought monitoring. Agric. For. Meteorol. 2005, 133, 69–88. [Google Scholar] [CrossRef]
  12. Nalbantis, I.; Tsakiris, G. Assessment of hydrological drought revisited. Water Resour. Manag. 2009, 23, 881–897. [Google Scholar] [CrossRef]
  13. Shukla, S.; Wood, A.W. Use of a standardized runoff index for characterizing hydrologic drought. Geophys. Res. Lett. 2008, 35. [Google Scholar] [CrossRef] [Green Version]
  14. Hughes, D.A. Comparison of satellite rainfall data with observations from gauging station networks. J. Hydrol. 2006, 327, 399–410. [Google Scholar] [CrossRef]
  15. Liu, W.T.; Kogan, F.N. Monitoring regional drought using the vegetation condition index. Int. J. Remote Sens. 1996, 17, 2761–2782. [Google Scholar] [CrossRef]
  16. Berhan, G.; Hill, S.; Tadesse, T.; Atnafu, S. Using satellite images for drought monitoring: A knowledge discovery approach. J. Strateg. Innov. Sustain. 2011, 7, 135. [Google Scholar]
  17. Quiring, S.M.; Papakryiakou, T.N. An evaluation of agricultural drought indices for the Canadian prairies. Agric. For. Meteorol. 2003, 118, 49–62. [Google Scholar] [CrossRef]
  18. Cai, G.; Du, M.; Liu, Y. Regional drought monitoring and analyzing using MODIS data—A case study in Yunnan Province. In Proceedings of the International Conference on Computer and Computing Technologies in Agriculture, Nanchang, China, 22–25 October 2010; Springer: Berlin/Heidelberg, Germany, 2010; pp. 243–251. [Google Scholar]
  19. Bayissa, Y.A.; Tadesse, T.; Svoboda, M.; Wardlow, B.; Poulsen, C.; Swigart, J.; Van Andel, S.J. Developing a satellite-based combined drought indicator to monitor agricultural drought: A case study for Ethiopia. Giscience Remote Sens. 2019, 56, 718–748. [Google Scholar] [CrossRef]
  20. Conway, D. The climate and hydrology of the Upper Blue Nile River. Geogr. J. 2000, 166, 49–62. [Google Scholar] [CrossRef] [Green Version]
  21. Yilma, A.D.; Awulachew, S.B. Characterization and atlas of the Blue Nile Basin and its sub basins. In Proceedings of the International Water Management Institute (IWMI), Colombo, Sri Lanka, 5–6 February 2009. [Google Scholar]
  22. Kebede, S.; Travi, Y.; Alemayehu, T.; Marc, V. Water balance of Lake Tana and its sensitivity to fluctuations in rainfall, Blue Nile basin, Ethiopia. J. Hydrol. 2006, 316, 233–247. [Google Scholar] [CrossRef]
  23. Mellander, P.E.; Gebrehiwot, S.G.; Gärdenäs, A.I.; Bewket, W.; Bishop, K. Summer rains and dry seasons in the Upper Blue Nile Basin: The predictability of half a century of past and future spatiotemporal patterns. PLoS ONE 2013, 8, e68461. [Google Scholar] [CrossRef] [PubMed] [Green Version]
  24. Degefu, M.A.; Rowell, D.P.; Bewket, W. Teleconnections between Ethiopian rainfall variability and global SSTs: Observations and methods for model evaluation. Meteorol. Atmos. Phys. 2017, 129, 173–186. [Google Scholar] [CrossRef] [Green Version]
  25. Tekleab, S.; Mohamed, Y.; Uhlenbrook, S. Hydro-climatic trends in the Abay/Upper Blue Nile basin, Ethiopia. Phys. Chem. Earth Parts A/B/C 2013, 61, 32–42. [Google Scholar] [CrossRef]
  26. Bayissa, Y.; Maskey, S.; Tadesse, T.; Van Andel, S.J.; Moges, S.; Van Griensven, A.; Solomatine, D. Comparison of the performance of six drought indices in characterizing historical drought for the upper Blue Nile basin, Ethiopia. Geosciences 2018, 8, 81. [Google Scholar] [CrossRef] [Green Version]
  27. Conway, D. From headwater tributaries to international river: Observing and adapting to climate variability and change in the Nile basin. Glob. Environ. Chang. 2005, 15, 99–114. [Google Scholar] [CrossRef]
  28. Stisen, S.; Sandholt, I. Evaluation of remote-sensing-based rainfall products through predictive capability in hydrological runoff modelling. Hydrol. Process. Int. J. 2010, 24, 879–891. [Google Scholar] [CrossRef]
  29. Bayissa, Y.; Tadesse, T.; Demisse, G.; Shiferaw, A. Evaluation of satellite-based rainfall estimates and application to monitor meteorological drought for the Upper Blue Nile Basin, Ethiopia. Remote Sens. 2017, 9, 669. [Google Scholar] [CrossRef] [Green Version]
  30. Fenta, A.A.; Yasuda, H.; Shimizu, K.; Ibaraki, Y.; Haregeweyn, N.; Kawai, T.; Belay, A.S.; Sultan, D.; Ebabu, K. Evaluation of satellite rainfall estimates over the Lake Tana basin at the source region of the Blue Nile River. Atmos. Res. 2018, 212, 43–53. [Google Scholar] [CrossRef]
  31. Basheer, M.; Elagib, N.A. Performance of satellite-based and GPCC 7.0 rainfall products in an extremely data-scarce country in the Nile Basin. Atmos. Res. 2019, 215, 128–140. [Google Scholar] [CrossRef]
  32. Saha, S.; Moorthi, S.; Pan, H.; Wu, X.; Wang, J.; Nadiga, S.; Tripp, P.; Kistler, R.; Woollen, J.; Behringer, D. The NCEP climate forecast system reanalysis. Bull. Am. Meteorol. Soc. 2010, 91, 1015–1058. [Google Scholar] [CrossRef]
  33. Funk, C.; Peterson, P.; Landsfeld, M.; Pedreros, D.; Verdin, J.; Rowland, J.; Romero, B.; Husak, G.; Michaelsen, J.; Verdin, A.; et al. A Quasi-Global Precipitation Time Series for Drought Monitoring. 2017. Available online: https://pubs.usgs.gov/ds/832/ (accessed on 20 January 2021).
  34. McNally, A.; Arsenault, K.; Kumar, S.; Shukla, S.; Peterson, P.; Wang, S.; Funk, C.; Peters-Lidard, C.D.; Verdin, J.P. A land data assimilation system for sub-Saharan Africa food and water security applications. Sci. Data 2017, 4, 1–19. [Google Scholar] [CrossRef] [PubMed] [Green Version]
  35. Anderson, W.; Zaitchik, B.; Hain, C.; Anderson, M.; Yilmaz, M.; Mecikalski, J.; Schultz, L. Towards an integrated soil moisture drought monitor for East Africa. Hydrol. Earth Syst. Sci. 2012, 16, 2893–2913. [Google Scholar] [CrossRef] [Green Version]
  36. Zaitchik, B.F.; Habib, S.; Anderson, M.; Ozdogan, M.; Alo, C. A Land Data Assimilation System for hydrologic studies in countries of the Nile basin. In Proceedings of the 8th International Conference of the African Association of Remote Sensing for the Environment, Addis Ababa, Ethiopia, 25–29 October 2010. [Google Scholar]
  37. Ntale, H.K.; Gan, T. Drought indices and their application to East Africa. Int. J. Clim. 2003, 23, 1335–1357. [Google Scholar] [CrossRef]
  38. McKee, T.B.; Doesken, N.J.; Kleist, J. The relationship of drought frequency and duration to time scales. In Proceedings of the 8th Conference on Applied Climatology, Anaheim, CA, USA, 17–22 January 1993; pp. 179–184. [Google Scholar]
  39. Khan, S.; Gabriel, H.; Rana, T. Standard Precipitation Index to track drought and assess impact of rainfall on water tables in irrigation areas. Irrig. Drain. Syst. 2008, 22, 159–177. [Google Scholar] [CrossRef]
  40. Moreira, E.E.; Coelho, C.A.; Paulo, A.A.; Pereira, L.S.; Mexia, J.T. SPI-based drought category prediction using loglinear models. J. Hydrol. 2008, 354, 116–130. [Google Scholar] [CrossRef] [Green Version]
  41. Bayissa, Y.; Semu, A.; Yunqing, X.; Schalk, A.; Shreedhar, M.; Dimitri, S.; Griensven, A.; Tadesse, T. Spatio-temporal assessment of meteorological drought under the influence of varying record length: The case of Upper Blue Nile Basin, Ethiopia. Hydrol. Sci. J. 2015, 60, 1927–1942. [Google Scholar] [CrossRef]
  42. Keyantash, J.A.; Dracup, J.A. An aggregate drought index: Assessing drought severity based on fluctuations in the hydrologic cycle and surface water storage. Water Resour. Res. 2004, 40. [Google Scholar] [CrossRef] [Green Version]
  43. Webb, P.; Braun, J.; Yohannes, Y. Famine in Ethiopia: Policy Implications of Coping Failure at National and Household Levels; Research Reports; International Food Policy Research Institute: Washington, DC, USA, 1992; Volume 92. [Google Scholar]
  44. Segele, Z.T.; Lamb, P.J. Characterization and variability of Kiremt rainy season over Ethiopia. Meteorol. Atmos. Phys. 2005, 89, 153–180. [Google Scholar] [CrossRef]
  45. Singh, R.; Worku, M.; Bogale, S.; Cullis, A.; Adem, A.; Irwin, B.; Lim, S.; Bosi, L.; Venton, C. Reality of resilience: Perspectives of the 2015-16 drought in Ethiopia. BRACED Resil. Intel 2016, 6, 1–28. [Google Scholar]
  46. Meseret, D. Land degradation in Amhara Region of Ethiopia: Review on extent, impacts and rehabilitation practices. J. Environ. Earth Sci. 2016, 6, 120–130. [Google Scholar]
  47. Lemann, T.; Roth, V.; Zeleke, G.; Subhatu, A.; Kassawmar, T.; Hurni, H. Spatial and temporal variability in hydrological responses of the Upper Blue Nile basin, Ethiopia. Water 2019, 11, 21. [Google Scholar] [CrossRef] [Green Version]
Figure 1. The location, elevation, and boundary of the Upper Blue Nile Basin (bold dark violet color).
Remotesensing 13 01835 g001
Figure 2. The flow chart that shows the steps followed in this study.
Remotesensing 13 01835 g002
Figure 3. Spatial patterns of meteorological and agricultural droughts for 3-months Kiremt (first and second panels from left) and 12-month annual (third and fourth panels from left) aggregate periods for selected historic drought years (1984, 1995, 2002, 2009, and 2015).
Remotesensing 13 01835 g003
Figure 4. The spatial Pearson correlation coefficient values generated using the time series meteorological (SPI) and agricultural (SMDI) drought indices for Kiremt season (a) and annual (b) time scales.
Remotesensing 13 01835 g004
Figure 5. Spatial pattern of frequency of occurrence of mild (top panel), moderate (second panel), severe (third panel) and extreme (bottom panel) meteorological (first and third columns) and agricultural (second and fourth columns) droughts during Kiremt and annual aggregate periods.
Remotesensing 13 01835 g005
Figure 6. The temporal patterns of meteorological (SPI), agricultural (stdSMDI), and hydrological (SRI) droughts for Kiremt (a) and annual (b) aggregate periods from 1982–2019. The time span for hydrological drought is from 1982–2017 due to the inaccessibility of the recent flow data. The broken lines show the different drought severity categories as explained in Table 1.
Remotesensing 13 01835 g006
Table 1. SPI values and the corresponding categories of drought severity (McKee et al [38]).
SPI ValueDrought Category
−2.00 and lessExtreme
−1.50 to −1.99Severe
−1.00 to −1.49Moderate
0 to −0.99Near normal or mild
0 to 0.99Unusual moist
1.00 to 1.49Moderate moist
1.50 to 1.99Very moist
2.00 and aboveExtremely moist
Table 2. Percentages of area under drought condition during the selected historic drought episodes for Kiremt season.
Mild & Moderate DroughtsSevere & Extreme DroughtsMild to Extreme Droughts (%)
Kiremt SPIKiremt SMDIKiremt SPIKiremt SMDIKiremt SPIKiremt SMDI
198454332658038
199569646107574
2002834115984100
2009467602446100
2015275142246974
Table 3. Percentages of areas under drought condition during the selected historic drought episodes for an annual aggregate period.
Mild & Moderate DroughtsSevere & Extreme DroughtsMild to Extreme Droughts (%)
Annual SPIAnnual SMDIAnnual SPIAnnual SMDIAnnual SPIAnnual SMDI
1984577640159791
199580769128989
200268463254100100
2009717223209492
2015282836206448
Table 4. Pearson correlation coefficient between drought indices for Kiremt and annual time scales.
Drought IndicesPearson Correlation Coefficient
KiremtAnnual
SPI vs. SRI0.790.85
SPI vs. SMDI0.550.67
SRI vs. SMDI0.640.5
Table 5. Characteristics of the historic drought events as identified by the three drought indices computed using basin-wide average rainfall and soil moisture input data and flow data measured at the outlet of the basin.
KiremtAnnual
Drought IndexSPIstdSMDISRISPIstdSMDISRI
1983–1984 drought
Mean Intensity, M−0.83−0.83−1.08−1.05−0.76−1.30
Maximum intensity, Mmax−2.26−2.48−2.01−2.07−2.07−2.14
Duration, D (years)263576535368
Severity, S−22−29−82−56−40−88
2002–2003 drought
Mean Intensity, M−0.69−1.05−0.50−0.85−1.28−0.58
Maximum intensity, Mmax−1.75−2.34−1.25−2.03−2.59−1.05
Duration, D (years)215634505640
Severity, S−14−59−17−42−72−23
2009 drought
Mean Intensity, M−0.44−1.15−0.76−1.00−0.62−0.82
Maximum intensity, Mmax−1.41−1.80−1.08−1.48−1.66−0.96
Duration, D (years)161512145512
Severity, S−7−17−9−14−34−10
2015 drought
Mean Intensity, M−0.82−0.87−0.76−0.86−0.49−0.70
Maximum intensity, Mmax−2.35−2.25−1.08−1.41−0.78−0.80
Duration, D (years)101012151010
Severity, S−8−9−9−13−5−7
Table 6. Frequency of occurrence (%) of each drought category during seasonal and annual aggregate periods of the three drought indices.
SeasonalAnnual
Drought CategorySPIstdSMDISRISPIstdSMDISRI
Mild drought342929342424
Moderate drought1311128518
Severe drought38981312
Extreme drought303330
Publisher’s Note: MDPI stays neutral with regard to jurisdictional claims in published maps and institutional affiliations.

