Communication

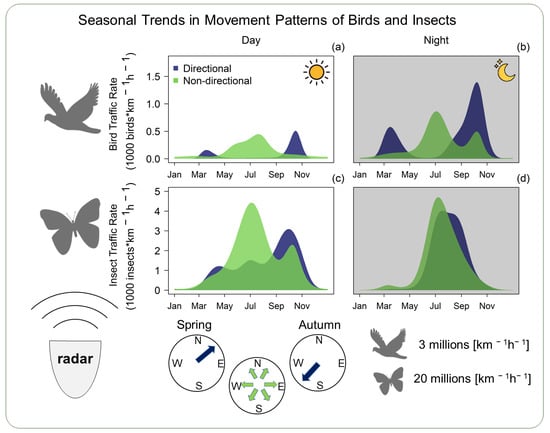
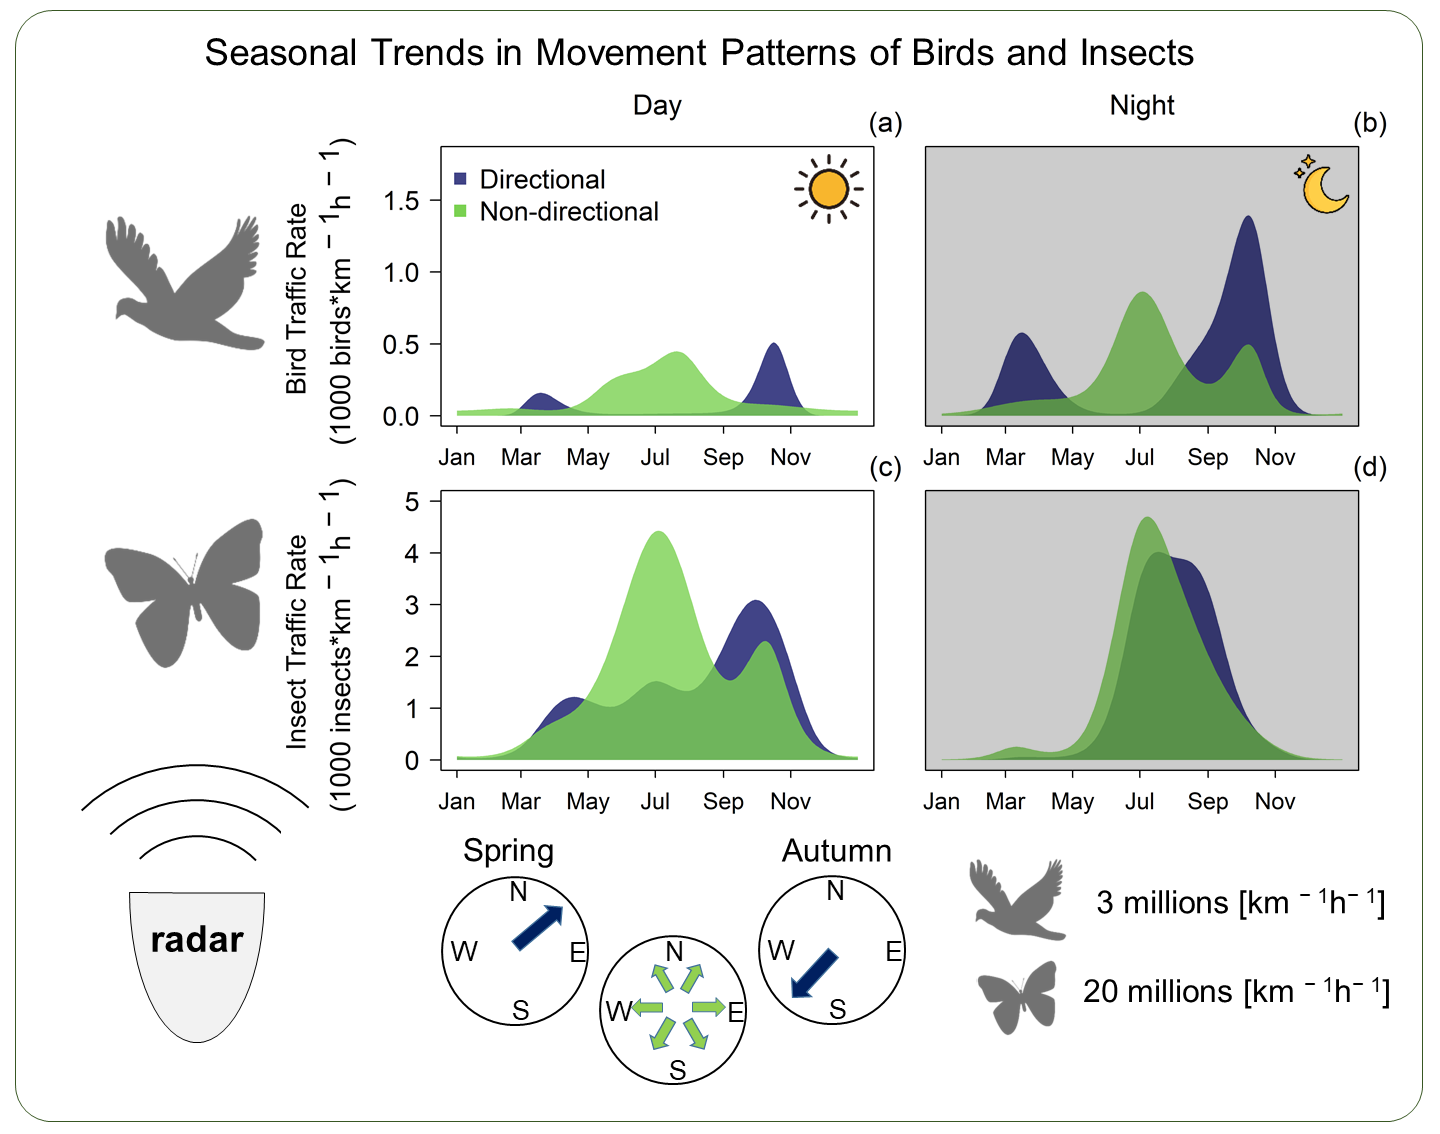
Seasonal Trends in Movement Patterns of Birds and Insects Aloft Simultaneously Recorded by Radar

1
Swiss Ornithological Institute, 6204 Sempach, Switzerland
2
School of Biological Sciences, The University of Queensland, Brisbane, QLD 4072, Australia
3
Centre for Ecology and Conservation, University of Exeter, Penryn, Cornwall TR10 9FE, UK
4
Department of Environmental Systems Science, ETH Zurich, 8092 Zurich, Switzerland
5
Agroecology and Environment, Agroscope, 8046 Zurich, Switzerland
6
Chair of Wildlife Ecology and Management, University of Freiburg, D-79106 Freiburg, Germany
*
Author to whom correspondence should be addressed.
Submission received: 4 April 2021 / Revised: 26 April 2021 / Accepted: 3 May 2021 / Published: 9 May 2021
(This article belongs to the Section Ecological Remote Sensing)

Abstract

:
Airspace is a key but not well-understood habitat for many animal species. Enormous amounts of insects and birds use the airspace to forage, disperse, and migrate. Despite numerous studies on migration, the year-round flight activities of both birds and insects are still poorly studied. We used a 2 year dataset from a vertical-looking radar in Central Europe and developed an iterative hypothesis-testing algorithm to investigate the general temporal pattern of migratory and local movements. We estimated at least 3 million bird and 20 million insect passages over a 1 km transect annually. Most surprisingly, peak non-directional bird movement intensities during summer were of the same magnitude as seasonal directional movement peaks. Birds showed clear peaks in seasonally directional movements during day and night, coinciding well with the main migration period documented in this region. Directional insect movements occurred throughout the year, paralleling non-directional movements. In spring and summer, insect movements were non-directional; in autumn, their movements concentrated toward the southwest, similar to birds. Notably, the nocturnal movements of insects did not appear until April, while directional movements mainly occurred in autumn. This simple monitoring reveals how little we still know about the movement of biomass through airspace.

Graphical Abstract

1. Introduction

Ecosystems in temperate regions of the world are characterized by seasonal variation in precipitation and temperature. Animals exploit the profusion of resources in summer and avoid the inhospitable winter in order to survive and maximize reproductive output, resulting in seasonal shifts in species distribution and assembly [1]. Such seasonality is achieved by animals moving from one place to another, ranging from local-scale daily movement to cross-continental migration [2].
For insects and birds, the predominant method of movement is by flight [3]. Every year, enormous amounts of insects and birds rise into the air to forage, mate, disperse, and migrate. It is estimated that billions of birds and trillions of insects from wide arrays of species travel above Western Europe, transporting huge amounts of biomass and linking ecosystems worldwide [4,5,6,7]. Yet the airspace has only recently been considered a habitat for flying animals [8], while the number of flying animals are already in severe decline in Europe [9,10]. The sheer amount and the fundamental influence of insects and birds on ecosystems and human welfare highlight the importance of understanding how animals use the aerial habitat [11].
Despite numerous studies on peak migration periods, the year-round pattern of bird and insect movements is still poorly documented. Birds and insects take to the air to complete various phases of their life cycle throughout almost the whole year. The term migration is used differently by ornithologists and entomologists [2]. Bird migration involves an individual moving back and forth between breeding and non-breeding ranges; for insect migration, the return of an individual is not expected, but eventually includes return movements of subsequent generations [12]. The collective airborne movements of birds and insects can be broadly categorized as long-distance, mainly migratory movements (with a seasonal directional preference), and short-distance movements linked to other objectives like foraging, homing, or mating. Documenting the distinct patterns in migratory and local movement has significant implications for conservation. Birds and insects usually concentrate in different temporal and spatial ranges with non-identical flight behavior, requiring different management plans to reduce human–wildlife conflict, such as collision with wind turbines or vehicles [13,14,15], or pest control [16]. Recent studies have provided insights into the non-migratory movements of certain groups of species, such as the lengthy aerial life of swifts [17,18,19], the mating flight of ants [20], and the dispersal flight of aquatic insects [21]. However, such studies are limited by their number of individuals and species covered, or require a huge sampling effort. Radar has been widely adopted for automatic and continuous monitoring of a wide spectrum of flying animals [22], but separating migratory and local movements from radar data has yet to be achieved. The fundamental questions for ecology and conservation, where the animals are and how they move in the air, remain to be investigated for many taxa and parts of the world [23,24,25].
This study aimed to disentangle the migratory and local movements of birds and insects across the annual cycle, and discuss similarities and discrepancies in their annual patterns.

2. Materials and Methods

2.1. Radar Data Collection and Processing

From 19 February 2016 to 31 December 2017, 24 h per day, a vertical-looking X-band radar (BirdScan MR1, manufacturer: Swiss Birdradar Solution AG, www.swiss-birdradar.com, accessed on 4 April 2021) continuously monitored animal aerial movement over Sempach, Switzerland (47°7′ N, 8°11′ E). The technical details are provided in Schmid et al. [26]. Echoes were registered within heights ranging from 50 to 1500 m above ground level (a.g.l.), whereas maximum detection height strongly depended on the size of the object. Each echo contained information on the target’s flight altitude (m a.g.l.) and flight direction when the radar antenna was rotating on the nutated vertical axis [26]. Every fifteen minutes, the operation mode switched between rotation and static measurements. We assigned echoes to either day or night using civil twilight from each date at the experimental site. Echoes were automatically classified by an improved algorithm developed by Zaugg et al. [27]. The probabilities to which of the six classes (passerine type, wader type, large single bird, unknown bird, insect, or non-biological scatter) an echo belonged to were calculated for each echo. At night, an unknown proportion of echoes classified as bird originated from bats’ flight activity above 50 m a.g.l. The probabilities for the six classes sum up to 1. Finally, the echo was assigned to the class with the highest probability. To exclude questionable allocations, only echoes with a classification probability > 0.2 were included for further analyses. In addition, data were checked visually and some remaining rain clutter was excluded manually.
We calculated the traffic rates (animals km −1 h −1) following the definition by Liechti and Bruderer [28]. For birds, we accounted for bird-size detection probability and radar surveyed volume as described by Schmid et al. [26] and Schmaljohann et al. [29]. Because we lack a proper estimation of insect size with this radar, we used a single detection probability for all insect echoes. We calculated beam width at 150 m above the radar antenna (median detection range for insects) assuming an RCS of 3.1 cm2, which corresponds to a relatively large insect, although larger insects such as hawkmoths Sphingidae likely transited through the radar beam (hawkmoths are comparable to the size of a small bird, e.g., the firecrest Regulus sp.). From this calculation, we estimated that each echo counted for 14.1 insect km 1. We consider the insect counts as a reasonable relative measure of the variation in insect abundance, but we are aware that not correcting for variations in detection probability implies that a shift to larger insects within the season, or insects flying higher in one day than the other, will affect the estimated phenology. Consequently, the huge mass of small insects (e.g., hoverflies Syrphidae) are most likely not included in our analysis, unless they move in dense flocks. We have no idea to what extent this was the case. As a consequence, the insect phenologies should be interpreted with care, with a focus on the main trends only.
During sustained precipitation events, the radar was automatically set to blind. When blind times due to precipitation events exceeded 80% of the duration of a day or night, mean traffic rates were excessively high due to short operation time and were therefore unrepresentative of the whole period. We manually inspected days/nights with high traffic rate values and excluded from the analyses the days and nights with very few echoes due to precipitation or technical problems.

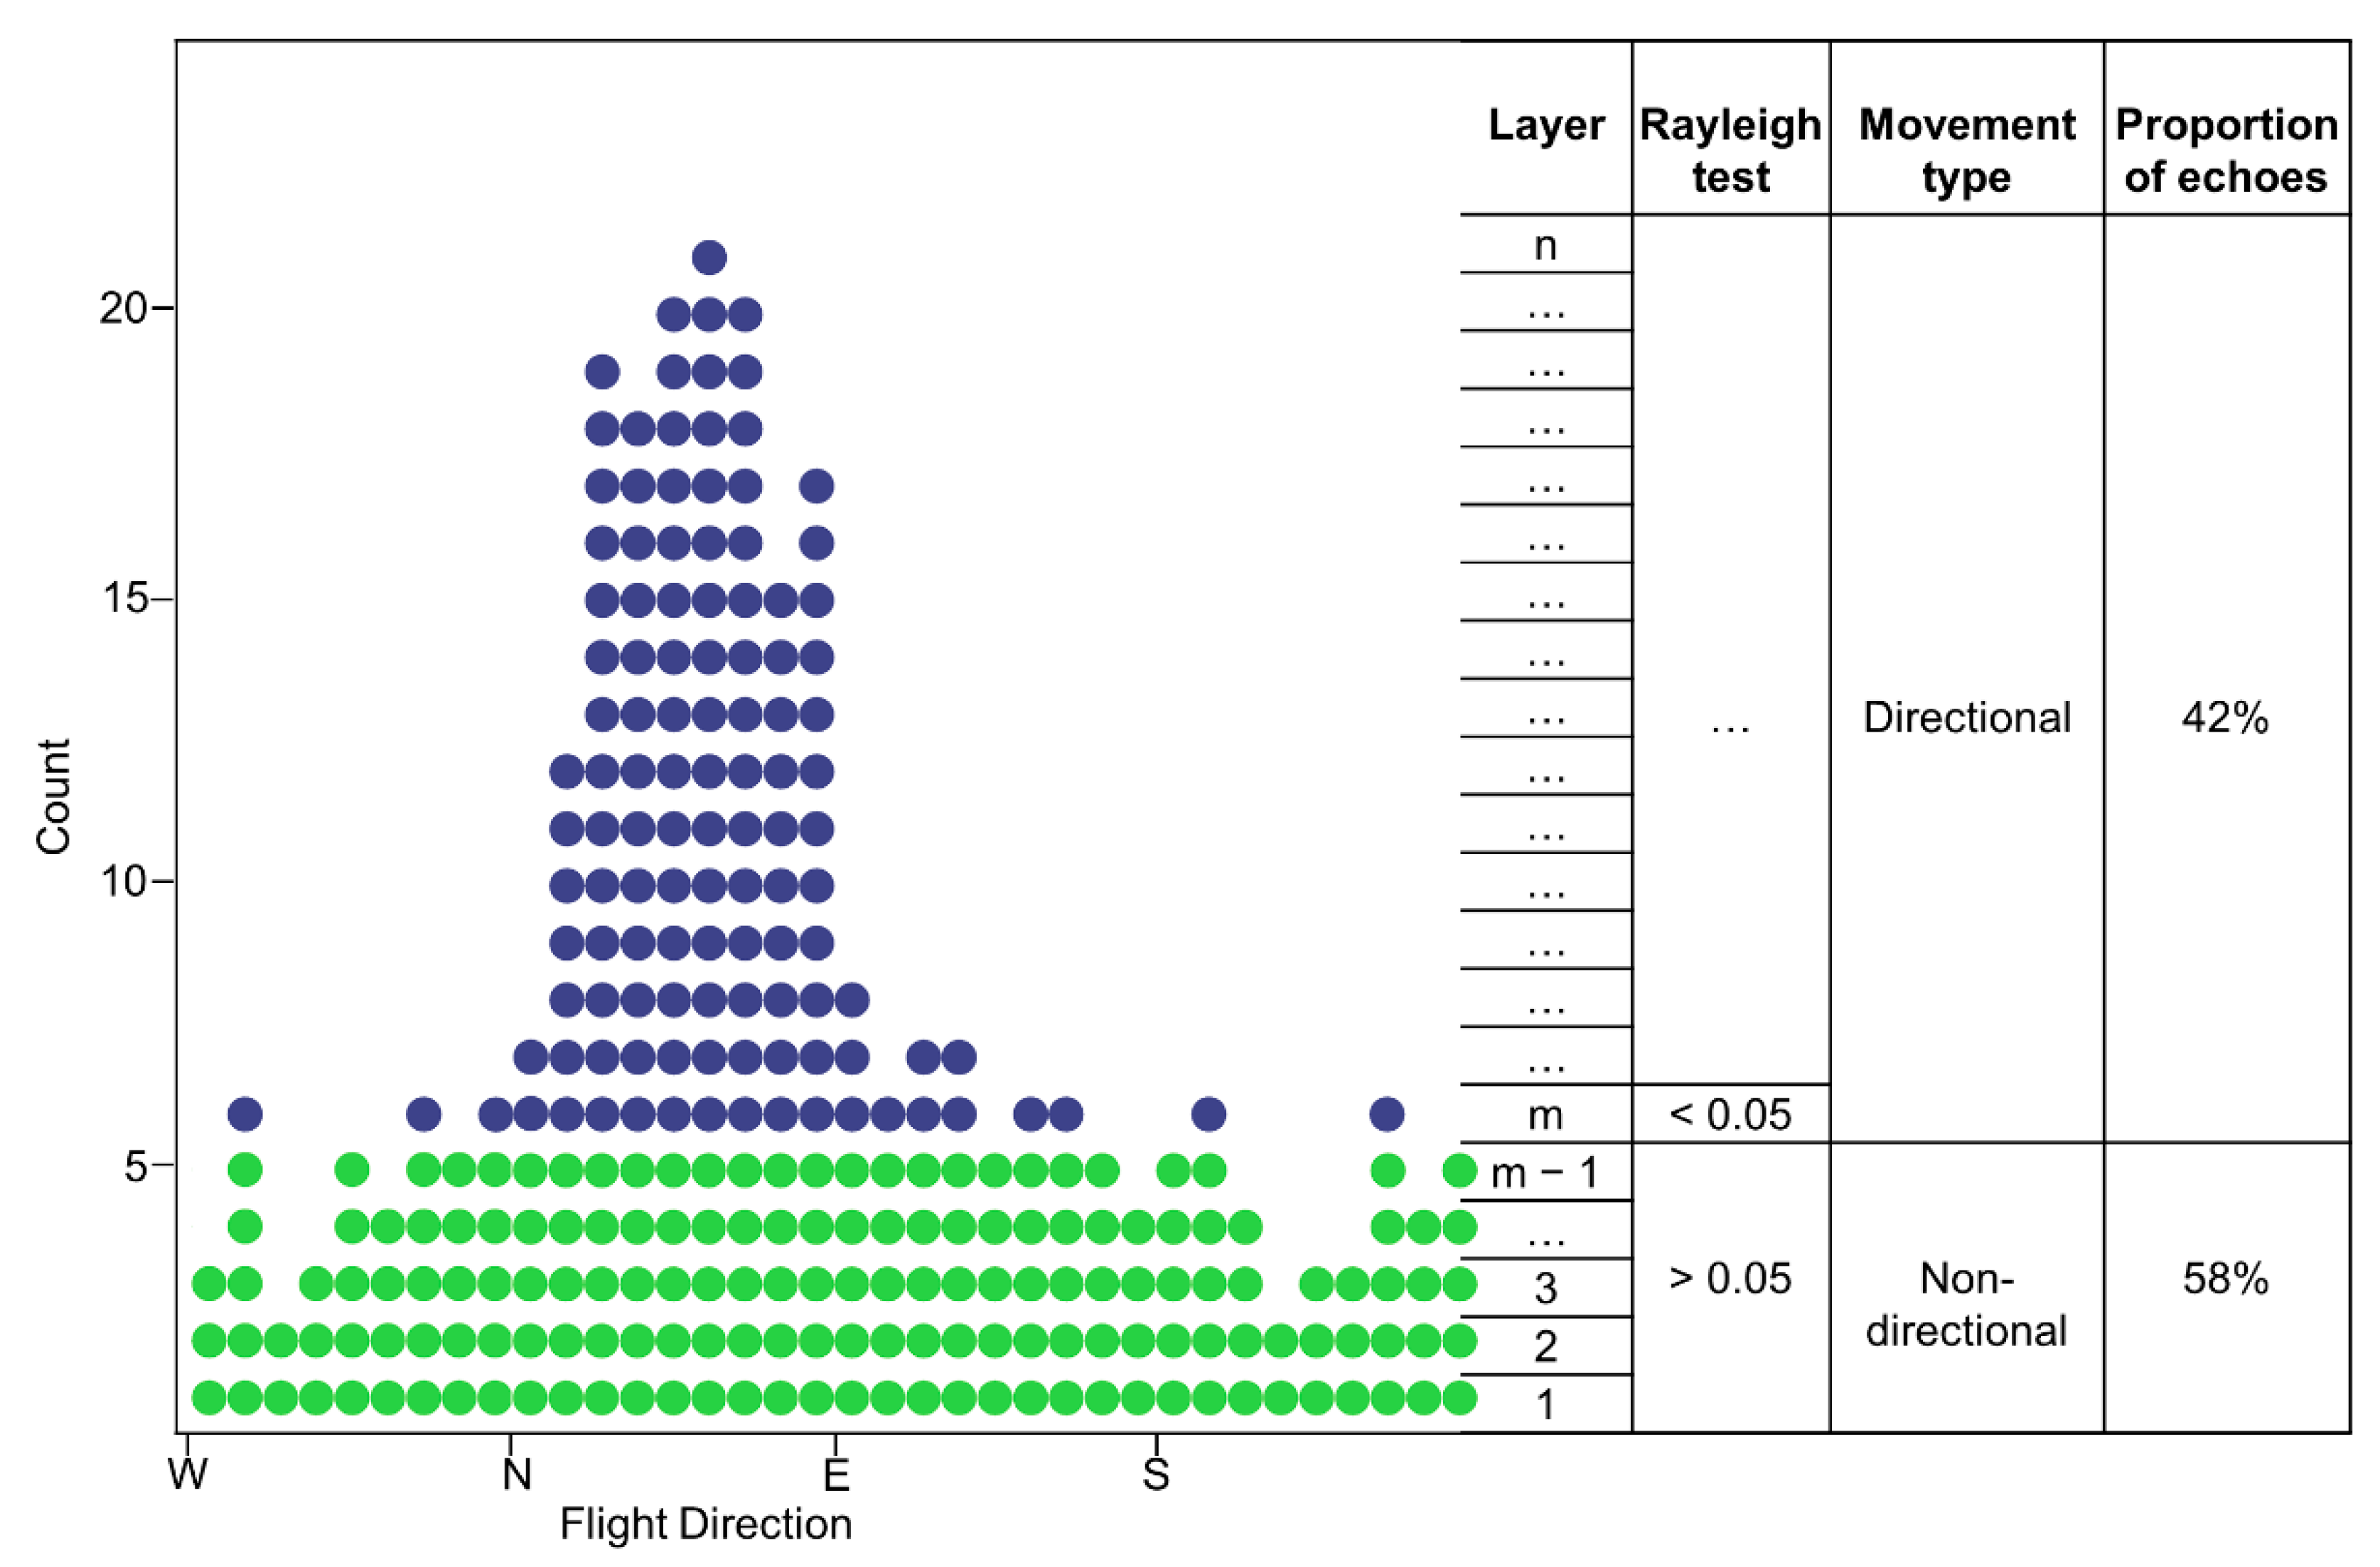
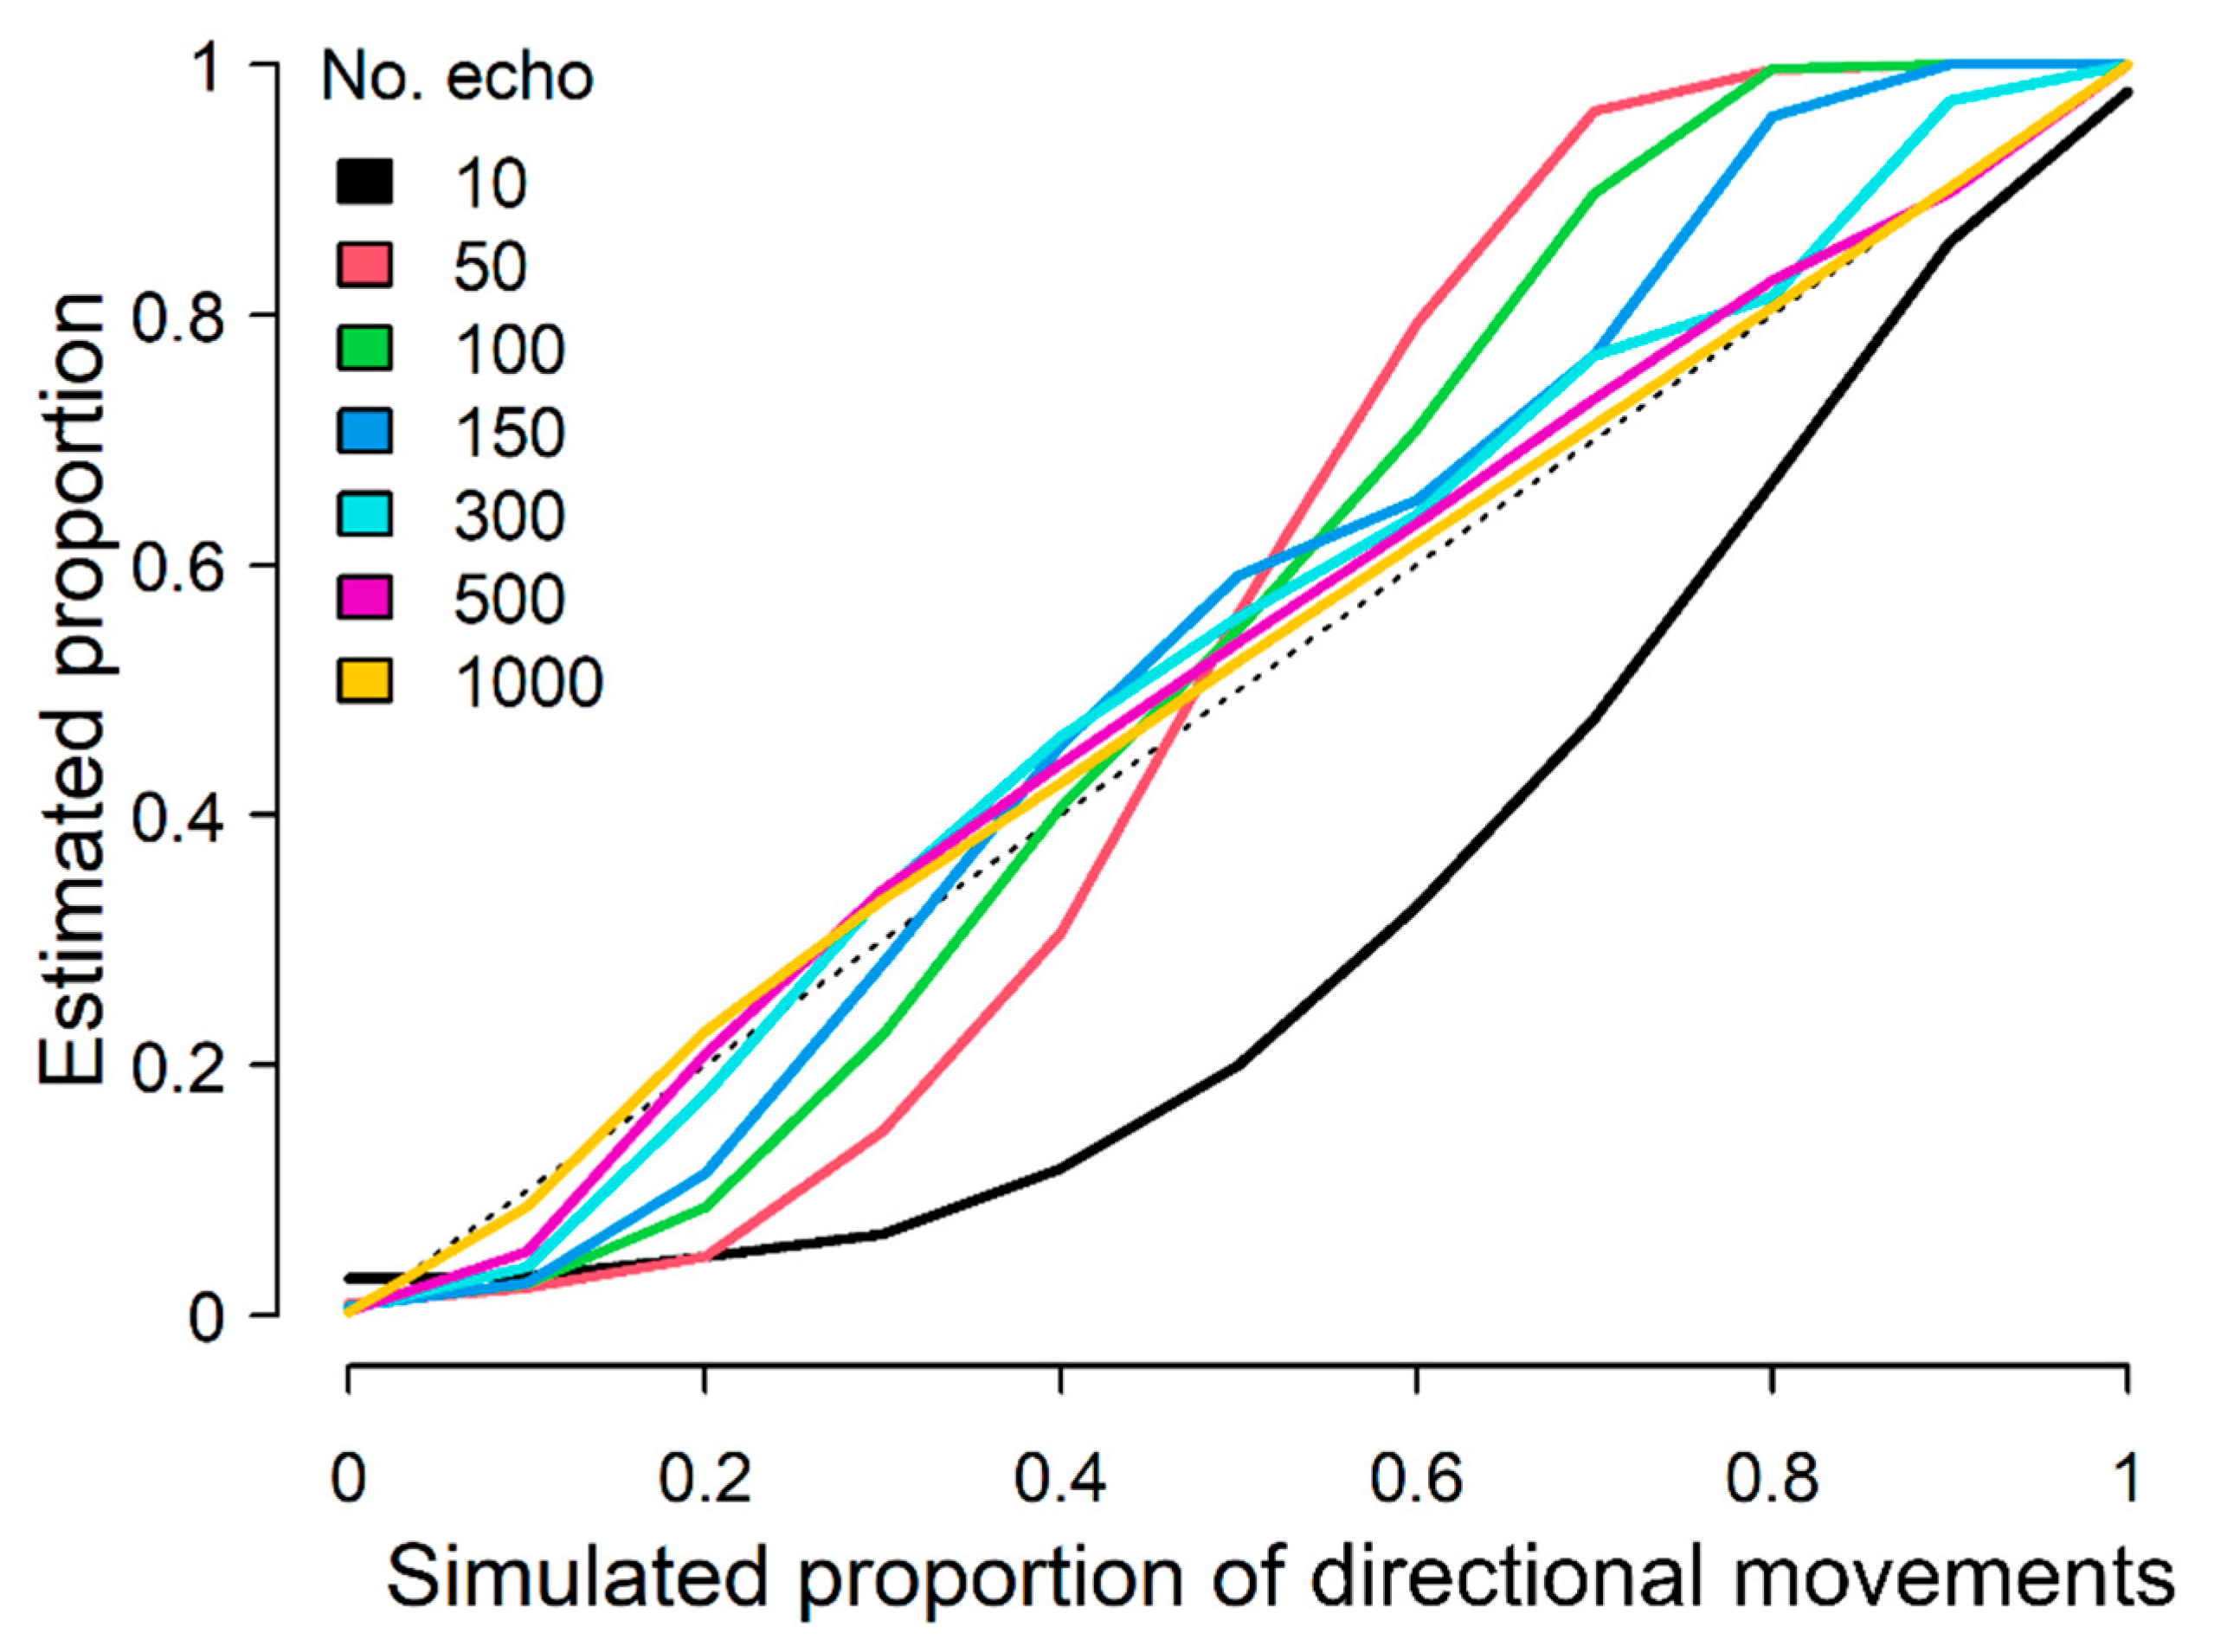
2.2. Separating Directional and Non-Directional Movements

The movements recorded by the radar include both migratory and local movements. To distinguish between these two types of movements, we assumed that days or nights with migratory movements are represented by circular distributions with a single directional preference, while local movements are characterized by distributions without a single directional preference. We are aware that this approach has some shortcomings, as local flights may be dominated by a single species flying into a given direction for other reasons than migration (see above), or that wind might blow all insects into a single direction. Therefore, throughout the results, we use the terms directional and non-directional movements instead of migratory and local movements. However, we return to the interpretation of these movements in the discussion. In order to decompose total traffic rate (TTR) into directional traffic rate (DTR) and non-directional traffic rate (NTR), we used an iterative hypothesis-testing algorithm to calculate the proportion of directional movements within the flight direction distributions of each day and night (Figure 1). For each day and night, the flight directions of birds or insects were aggregated into a fixed number of bins and layered in incrementing layers of echoes (maximum one echo per bin and layer). We then applied Rayleigh tests [30,31] from the first layer outwards until the first (mth) layer with significant directionality (p < 0.05) was found. The proportion of non-directional movement for the respective day/night was then defined as the proportion of echoes from the 1 st to the (m − 1)th layer, and the proportion of directional movement was defined as the rest of the echoes. This resulted in an estimate for the proportion of migration for each date’s TTR during the whole study period (electronic supplementary material, Figure S1).
The Rayleigh test is sensitive to the chosen bin width and the sample size. Therefore, we simulated circular distributions for a range of sample sizes (10, 50, 100, 150, 300, 500, and 1000; number of echo per class and day/night in Table S1) and different proportions of directional (assuming a normal distribution centered around a mean, e.g., 270°, and 40° standard deviation, as observed for peak migration periods in Tschanz et al. [32]) and non-directional movements (assuming a uniform distribution between 0° and 360°) to test our method for different bin widths. We achieved the best results by applying the iterative Rayleigh test with a bin width of five degrees, whereas with low sample sizes, the proportion of directional movements was underestimated at low migration intensity and overestimated at high migration intensity (Figure 2). A consistent underestimation of directional movements resulted with very low sample sizes (<10 echoes). The 40° spread parameter for directed movements is conservative, since periods of peak migration also included local undirected movements and potentially reverse migratory movements. A more concentrated spread of directed movement, e.g., 20° SD, decreased the biases at low and high sample sizes (Figure S3), and a 5° bin width remained an optimal parameter.
Subsequently, DTR was calculated by multiplying TTR with the proportion of migratory movement; NTR was defined as the difference between TTR and DTR. We further calculated mean flight directions for each day and night throughout a year to visualize the temporal patterns in flight directions. Note that directional and non-directional movements are only defined by the scatter of the individual flight directions, and not by the direction itself.

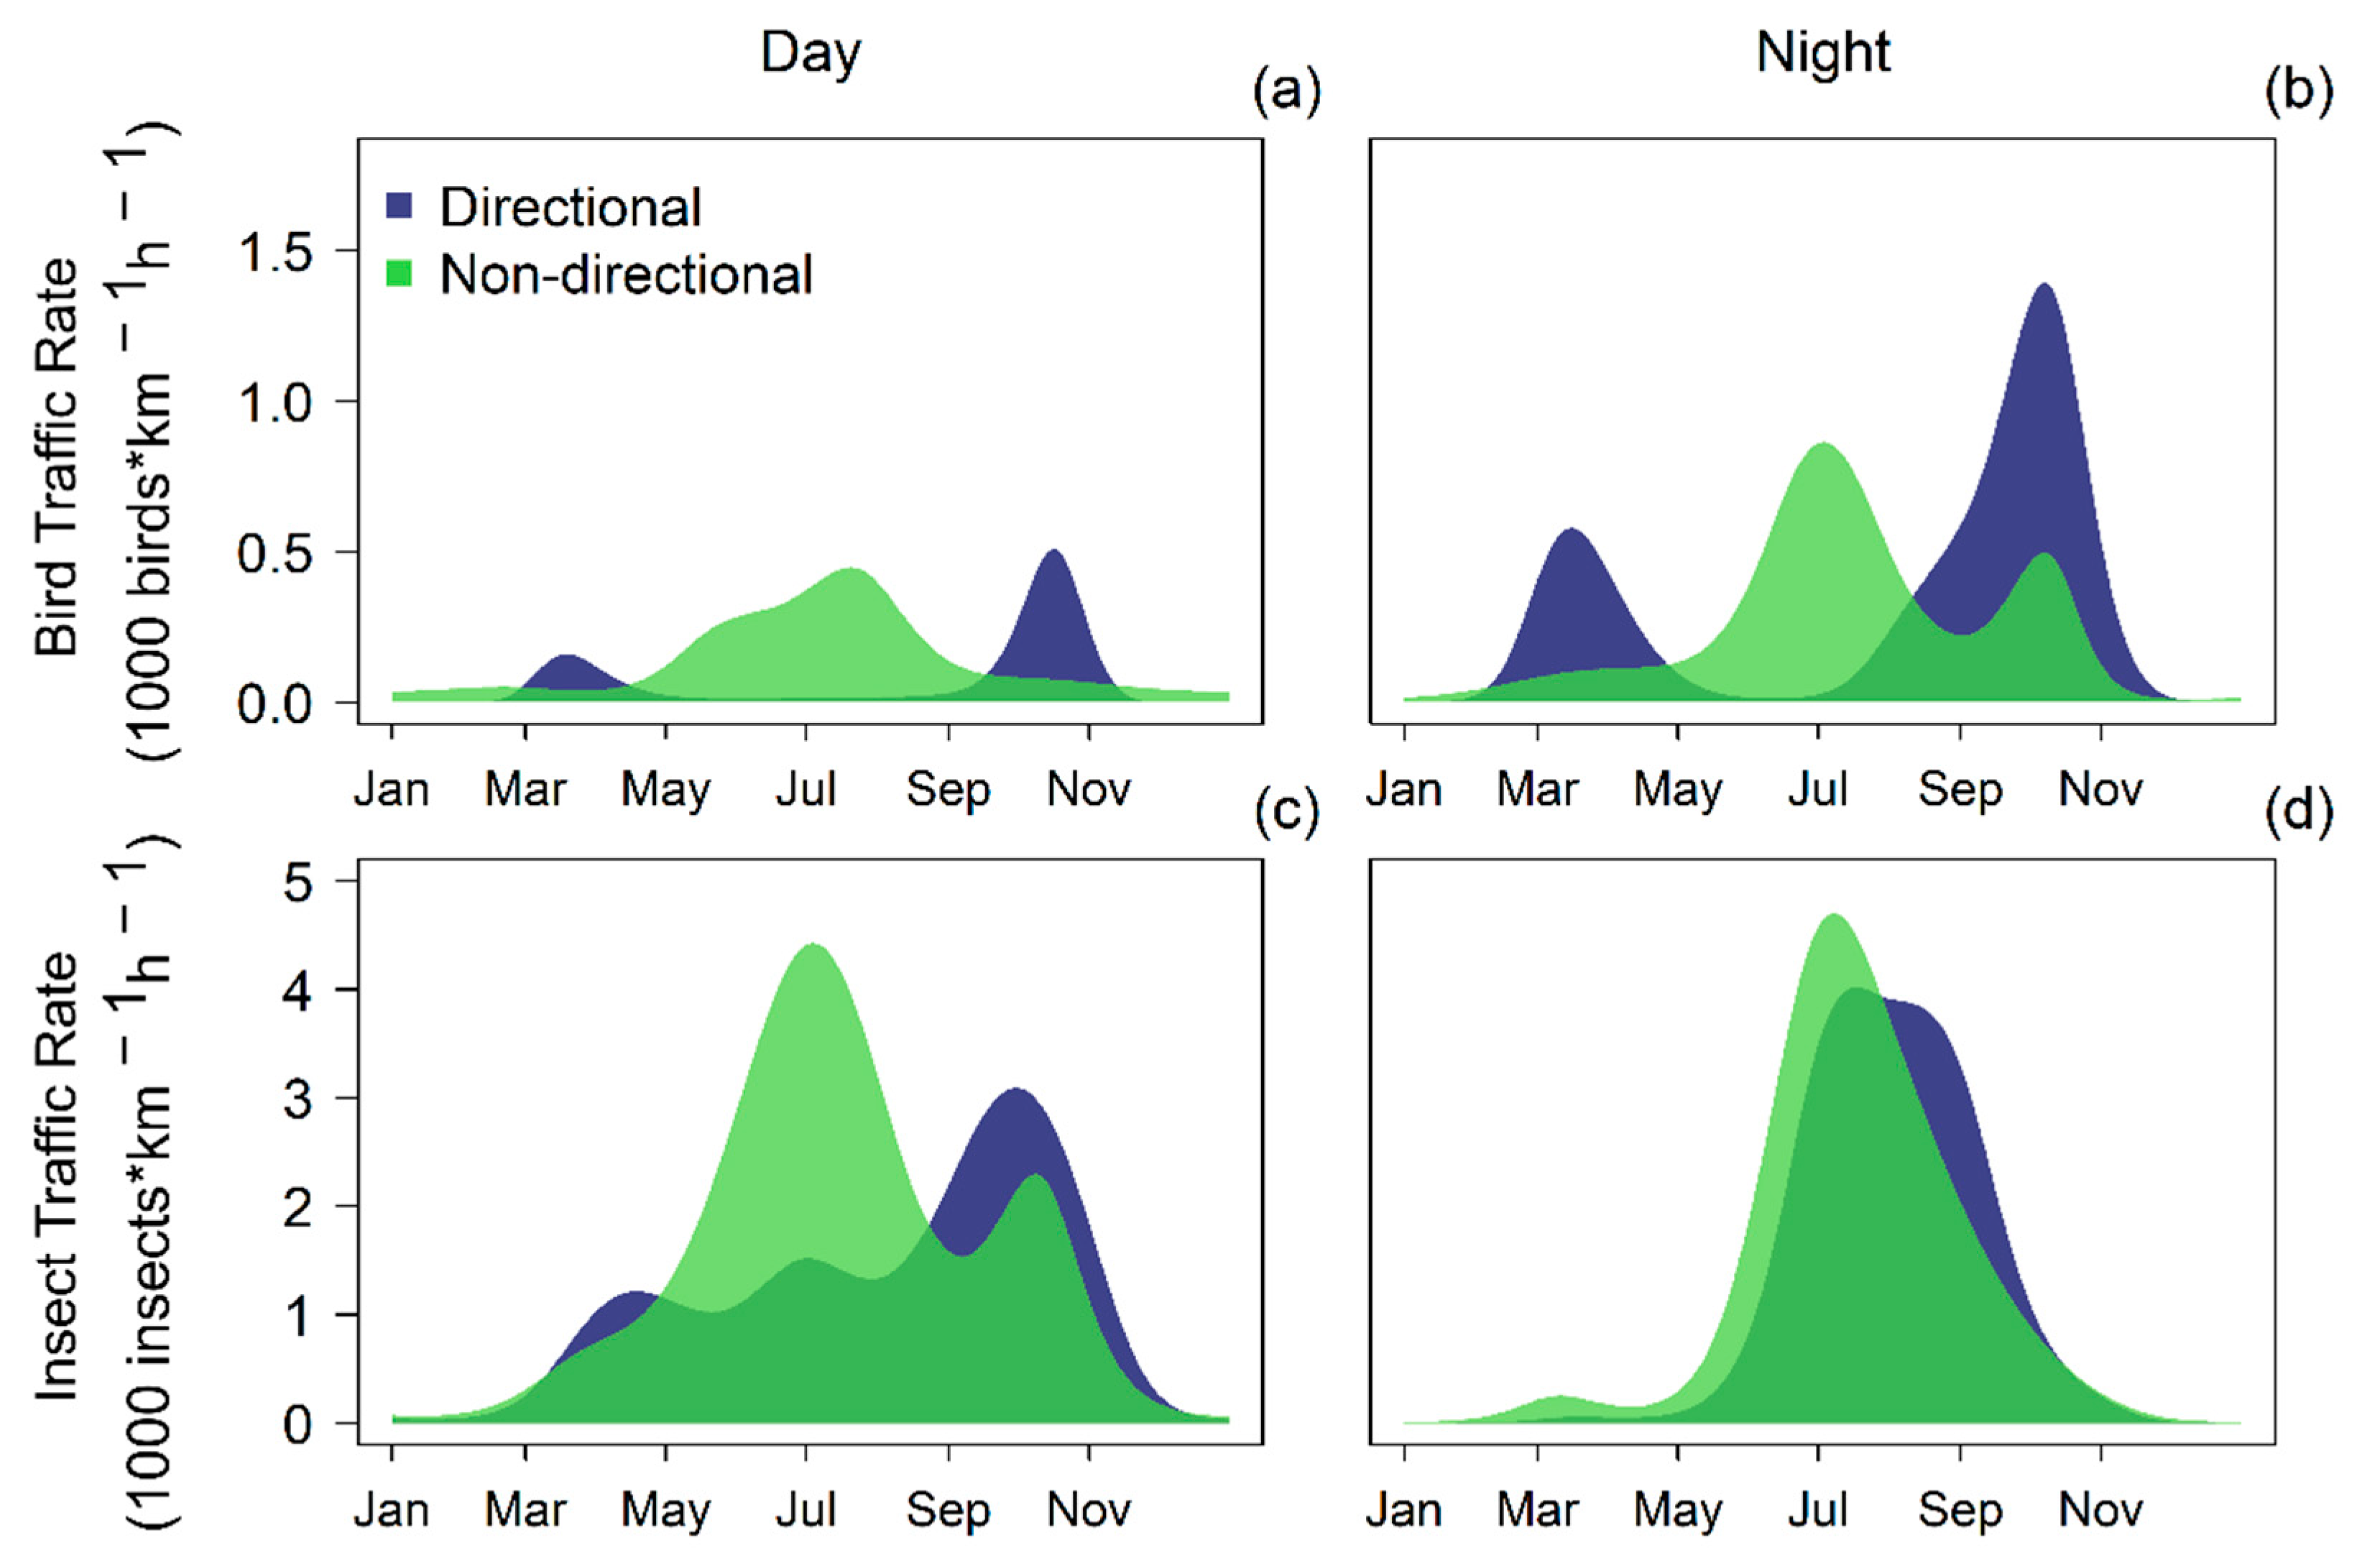
2.3. Seasonal Trends in Directional and Non-Directional Traffic Rates

The year-round (365 days) trends in DTR and NTR were calculated by smoothing two year’s data, separately for birds and insects and days and nights. We estimated the trend in traffic rates for each day of the year (DoY) using generalized additive models with the restricted maximum likelihood method as implemented in the mgcv R-package [33]. We report the adjusted r-squared value as the deviance explained for each model. We selected cyclic cubic splines as the smoothing function to ensure continuity at the beginning and end of a year. We used the fitted parameters to estimate the trends in traffic rate for each DoY (1 to 365). We determined widths of the movement peaks by performing combined mean and variance change point analysis on each trend, between the local maxima and the start, middle, and end of the year (DoY = 1, 183 and 365) using the changepoint R-package [34]. All modeling and statistical analysis were accomplished in R version 3.10 [35].

3. Results

3.1. Overview

During the day, the mean total traffic rate (TTR, animals km −1 h −1) of birds (mean: 228 [0.1–0.9 quantiles: 29–524]) was lower than the TTR during night (608 [21–1430], Mann-Whitney test: p < 0.05). The mean TTR of insects flying during the day (2840 [19–8408]) was higher than those flying during the night (2477 [15–8805], Mann–Whitney test: p < 0.05). These TTRs yielded yearly estimates of 3,662,819 bird and 23,290,168 insect passages of a 1 km transect over the study area. The proportion of directional movements was on average 37% for birds and 35% for insects.

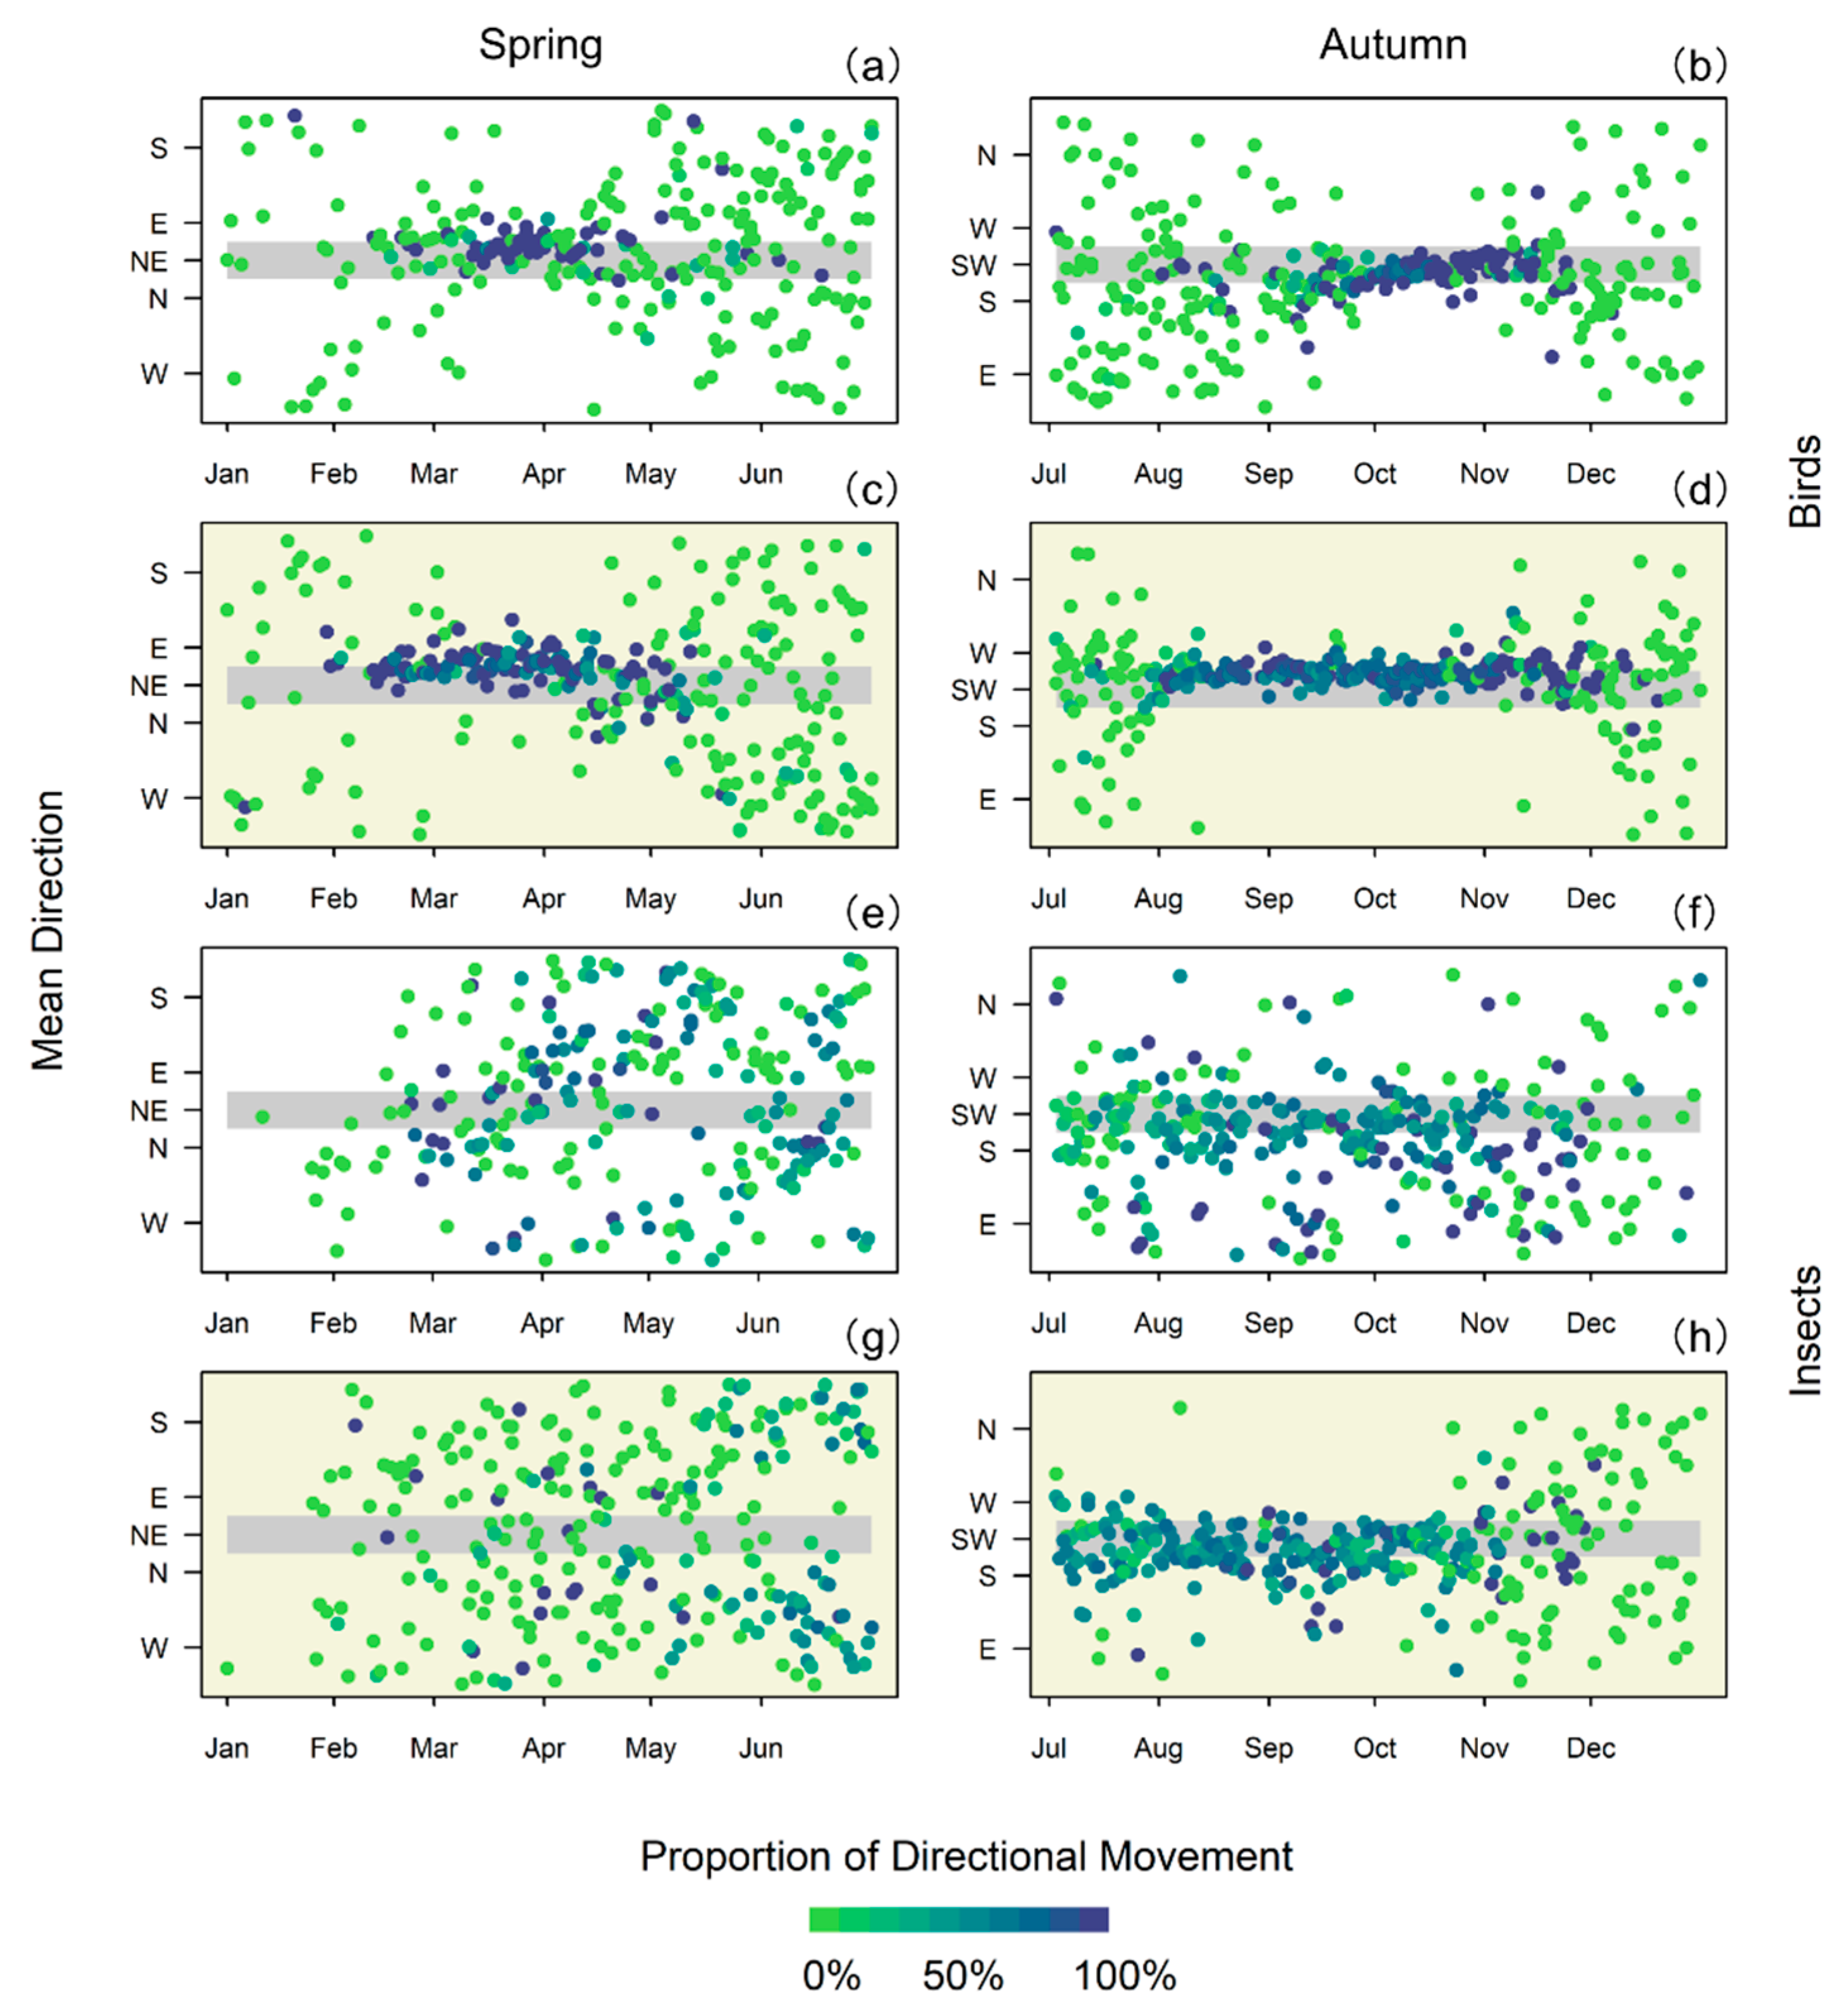
3.2. Seasonal Trend in Flight Direction and Movement Intensity

The seasonal course of the mean flight directions for birds and insects showed a contrasting pattern in spring, but a similar pattern in autumn (Figure 3). For birds during spring, the mean flight directions for days and nights with a high proportion of directional movements were concentrated around the northeast, while the movements with a low proportion of directional movements were more or less scattered in all directions. For insects, movements in spring showed no concentration in mean flight directions, regardless of their proportion of directional movements. Thus, the directional movements of insects during this period were not oriented toward a specific geographic direction. Instead, during autumn, both bird and insect movements with a high proportion of directional movements concentrated toward the southwest, although this trend was less pronounced for diurnal insect movements.
Seasonal trends in birds’ and insects’ flight activity showed contrasting patterns in directional movements, but similarity in non-directional movements (Figure 4). In birds, directional movements showed two seasonal peaks for diurnal (Figure 4a, deviance explained: 57.3%) and nocturnal movements (Figure 4b, deviance explained: 47.3%). For the birds, the diurnal and nocturnal period with directional preferences occurred simultaneously in spring (31 Jan to 11 May and 30 Jan to May 14 (DoY 31 to 131 and 30 to 134), confidence value from the change point analysis: 100%), but in autumn, the diurnal period was narrower (27 Aug to 2 Dec (DoY 239 to 336), c.v. = 100%) than the period for nocturnal movements (19 Jul to 28 Nov (DoY 200 to 332), c.v. = 100%). Diurnal insect movements with directional preferences increased from spring to autumn before ceasing for the winter (Figure 4c, deviance explained: 16.8%, 09 Feb to 26 Nov (DoY 40 to 330), c.v. = 100%). Nocturnal insect movements with directional preferences were almost nonexistent in spring, but had a strong peak in summer and early autumn (Figure 4d, deviance explained: 50.4%, 03 May to 18 Oct (DoY 123 to 291) c.v. = 100%).
Non-directional flights of birds and insects were mainly concentrated in the summer period. The main period of activity started simultaneously but lasted less time in diurnal rather than nocturnal bird movements (Figure 4a, deviance explained: 51.4%, 14 Apr to 07 Sep (DoY 104 to 250), c.v. = 100%; Figure 4b, deviance explained: 51.8%, 12 May to 20 Nov (DoY 132 to 324), c.v. = 100%), while insects’ diurnal movements lasted longer than nocturnal movements (Figure 4c, deviance explained: 28.0%, 26 Apr to 16 Nov (DoY 116 to 320), c.v. = 100%; Figure 4d, deviance explained: 55.3%, 05 May to 23 Oct (DoY 125 to 296), c.v. = 100%). Generally, there was a stronger overlap between directional and non-directional movements in insects than in birds.

4. Discussion

We here provide the first parallel monitoring on year-round biomass flow of birds and insects in the air. Extending the observations of the airspace to a full annual cycle revealed insights into the enormous biomass flow within and outside the known migratory periods. Migratory, dispersal, and local movements affect animals’ motivation and direction to fly, thereby influencing the seasonality and magnitude of mass animal activity from the local to the continental scale. Because migratory and local movements may occur in parallel at some times of the year, we did not define distinct migration periods, as is common in many studies [36,37,38,39]. Inspired by Kemp et al. [31], we applied an iterative Rayleigh’s test approach to quantify the proportions of directional and non-directional movements for each day and night. The proportions of directional and non-directional movements were not independent: with increasing number of echoes, but constant variance, the likelihood that the first iterative rings showed no directionality increased (Figure 1). This resulted in an overestimation of non-directional movements and an underestimation of directional movements. Accordingly, the proportion of non-directional movements slightly increased in parallel with directional movements (Figure 4b–d). The applied Raleigh test [30] is sensitive to any kind of directional preferences, and even distributions with large scatter but a slight preference for any direction are recognized as directional. Thus, the method provides a robust, objective, and repeatable measure to define periods of directional movements, and provides an adequate quantitative estimate of directional movements. Notably, this method cannot determine whether an individual flight is directional (migratory) or non-directional (local), but can only describe the collective pattern for a given period.
Due to the shortcomings mentioned in the Materials and Methods section, we could not properly disentangle migratory from local movements by the proportion of directional and non-directional movements. However, the temporal pattern in the proportions and the mean flight directions, as presented in Figure 3, allowed us to determine periods of migratory movements (season-specific directional preferences). In birds, the migration trends coincide well with the main migratory periods documented for this region [15,32,40,41,42]. In spring, diurnal and nocturnal migration cover the same period, whereas in autumn, diurnal migration is more concentrated and later in the season than nocturnal migration. The sharp increase in local (non-directional) movements during the day coincide with the arrival of aerial foragers (e.g., swallows and martins) at the end of April [43], and about two weeks later the increase in nocturnal movements at night coincide with the arrival of swifts [44]. The flight activities of bats contributed to an unknown proportion of nocturnal non-directional movements of birds. Yet, the sharp decrease in nocturnal local movements coincide with the departure of swifts toward their non-breeding ground in mid-August [17,45], whereas bat activity would last until September [46]. We therefore conclude that swifts, but not bats, contribute to the vast majority of the local nocturnal movements at the study site.
In insects, the high proportion of local movements in summer may coincide with the emergence of insects from a nearby lake [47]. Apart from this midsummer peak, the intensity of local movement seems to parallel the intensity of directional (migration, dispersal) movements, suggesting that there is always a proportion of insects with a directional preference. This is not the case for birds, and could be due to the stronger influence of wind on insect flight. Directional movements during the day ranged from April to mid-November, whereas at night, directional movements were more concentrated and ranged from June to mid-October. Both day and night alike, the orientation of the highly directional movements varied considerably in spring, with some preferences for eastward directions, but were strongly concentrated toward southwest in autumn.
In autumn, the southward concentration in flight direction indicated that birds and insects escaped the deteriorating environment at high latitudes along a similar flyway. In line with Hu et al. [6], our results suggest that autumn exodus flight is a common phenomenon for insects, and these flights are numerous after midsummer. In spring and early summer however, the contrasting patterns in birds’ and insects’ directional movement can be attributed to their different life histories and locomotion strategies. Individual birds undergo two seasonal migration journeys with defined goal areas, resulting in a clear rise and decline in migratory activity. The validity of the distinction between migration and dispersal, however, has long been a debate in entomology [2,48]. Our results are not in line with the consistent northward spring insect flights reported by Hu et al. [6] in England, possibly because the route into Southern England from mainland Europe is generally northward or northwestward, while Switzerland in Central Europe may have an influx from more varied directions. The highly scattered insect flight directions in spring and early summer are probably the result of a mixture of the northward colonization of successive generations of previous south-bound individuals, such as the painted lady Vanessa cardui [49], and continuously emerging insects performing dispersal flights probing for available habitat [21]. Nevertheless, the lack of a dominating northward flight direction in spring suggests a relatively small influx of insect migrants from southern latitudes, and most movements may be related to dispersal from local populations (cf. electronic supplementary material, Figure S1). In a next step, the influence of environmental conditions (wind, temperature, and precipitation) on bird and insect movements must be investigated, considering the aspect of migratory and local movements.

5. Perspectives

Our study represents a point survey of animal flight activity in a Central Europe landscape dominated by agriculture and fresh water bodies. Increasing availability of animal movement data from radar networks opens new avenues for investigating animal migration [25,50]. Under the current climate change scenario, insects’ and birds’ breeding and migration phenology are expected to adapt accordingly [51]. A warmer temperature, shorter winter, and greater primary productivity enable birds and insects to remain active and explore the airspace in Europe for longer periods [52,53]. How these adaptations will be reflected in the composition and magnitude of aerial movement intensity remains to be discovered. By launching a network of radar measurements, the further trend toward loss of insect abundance [10], as well as modification in regional occurrence and movement patterns over time, can be traced and investigated. In combination with atmospheric data, predicting the temporal and spatial movement patterns of many bird species and insect groups will be crucial to understanding the large-scale exchange in biomass across the airspace.

Supplementary Materials

The following are available online at https://0-www-mdpi-com.brum.beds.ac.uk/article/10.3390/rs13091839/s1, Figure S1. Phenology of birds’ and insects’ daily mean total traffic rates (TTR, grey bars) and propor-tion of directional movement on each date (black dots) in year 2016 and 2017. Table S1. Number of echoes with flight direction at the 0.25, 0.5, 0.75, 0.90, 0.95 quantiles for diurnal and nocturnal bird- and insect classes. Figure S2. Estimated proportion of migration (mean of 100 simulations) based on simulated data varying in sample size (colour lines: 10 = black, 50 = red, 100 = green, 150 = blue, 300 = truqoise, 500 = pink, 1000 = yellow), bin width (top left 1°, top right 3°, mid-left 5°, mid-right 8°, bottom left 10°, bottom right 15°) with migration spread 40° SD. Figure S3. Estimated proportion of migration (mean of 100 simulations) based on simulated data varying in sample size (colour lines: 10 = black, 50 = red, 100 = green, 150 = blue, 300 = truqoise, 500 = pink, 1000 = yellow), bin width (top left 1°, top right 3°, mid-left 5°, mid-right 8°, bottom left 10°, bottom right 15°) with migration spread 20° SD. Figure S4. Estimated proportion of migration (mean of 100 simulations) based on simulated data varying in sample size (colour lines: 10 = black, 50 = red, 100 = green, 150 = blue, 300 = truqoise, 500 = pink, 1000 = yellow), bin width (top left 1°, top right 3°, mid-left 5°, mid-right 8°, bottom left 10°, bottom right 15°) with migration spread 60° SD.

Author Contributions

X.S., B.S., G.S., and F.L. conceived the idea and study design; X.S. performed analysis with assistance from P.T., B.S., and F.L.; X.S. wrote the initial draft of the paper, with substantial editorial input from all authors. All authors have read and agreed to the published version of the manuscript.

Funding

We thank all the thousands of donators of the Swiss Ornithological Institute (SOI), who made this research possible.

Institutional Review Board Statement

Not applicable.

Informed Consent Statement

Not applicable.

Data Availability Statement

The traffic rates and directionality dataset used in this study can be accessed at http://0-doi-org.brum.beds.ac.uk/10.5281/zenodo.4741542, accessed on 4 April 2021.

Acknowledgments

We thank Simeon Lisovski and Fränzi Korner-Nievergelt for their advice on methodology and statistical analysis; and all the colleagues from the Swiss Ornithological Institute for the valuable discussions.

Conflicts of Interest

The authors declare no conflict of interest.

References

  1. Alerstam, T.; Hedenstrom, A.; Akesson, S. Long-distance migration: Evolution and determinants. Oikos 2003, 103, 247–260. [Google Scholar] [CrossRef] [Green Version]
  2. Dingle, H.; Drake, V.A. What is migration? Bioscience 2007, 57, 113–121. [Google Scholar] [CrossRef] [Green Version]
  3. Alexander, R.M. Principles of Animal Locomotion; Princeton University Press: Princeton, NJ, USA, 2003; ISBN 978-0-691-12940-2. [Google Scholar]
  4. Hahn, S.; Bauer, S.; Liechti, F. The natural link between Europe and Africa—2.1 billion birds on migration. Oikos 2009, 118, 624–626. [Google Scholar] [CrossRef]
  5. Bauer, S.; Hoye, B.J. Migratory animals couple biodiversity and ecosystem functioning worldwide. Science 2014, 344, 1242552. [Google Scholar] [CrossRef]
  6. Hu, G.; Lim, K.S.; Horvitz, N.; Clark, S.J.; Reynolds, D.R.; Sapir, N.; Chapman, J.W. Mass seasonal bioflows of high-flying insect migrants. Science 2016, 354, 1584–1587. [Google Scholar] [CrossRef] [Green Version]
  7. Wotton, K.R.; Gao, B.; Menz, M.H.M.; Morris, R.K.A.; Ball, S.G.; Lim, K.S.; Reynolds, D.R.; Hu, G.; Chapman, J.W. Mass seasonal migrations of hoverflies provide extensive pollination and crop protection services. Curr. Biol. 2019, 29, 2167–2173.e5. [Google Scholar] [CrossRef]
  8. Diehl, R.H. The airspace is habitat. Trends Ecol. Evol. 2013, 28, 377–379. [Google Scholar] [CrossRef]
  9. Sanderson, F.J.; Donald, P.F.; Pain, D.J.; Burfield, I.J.; van Bommel, F.P.J. Long-term population declines in Afro-Palearctic migrant birds. Biol. Conserv. 2006, 131, 93–105. [Google Scholar] [CrossRef]
  10. Hallmann, C.A.; Sorg, M.; Jongejans, E.; Siepel, H.; Hofland, N.; Schwan, H.; Stenmans, W.; Müller, A.; Sumser, H.; Hörren, T.; et al. More than 75 percent decline over 27 years in total flying insect biomass in protected areas. PLoS ONE 2017, 12, e0185809. [Google Scholar] [CrossRef] [Green Version]
  11. Chilson, P.B.; Frick, W.F.; Kelly, J.F.; Liechti, F. Aeroecology: An integrative view of the atmosphere. In Aeroecology; Springer: Berlin/Heidelberg, Germany, 2018; pp. 3–11. ISBN 9783319685762. [Google Scholar]
  12. Stefanescu, C.; Páramo, F.; Åkesson, S.; Alarcón, M.; Ávila, A.; Brereton, T.; Carnicer, J.; Cassar, L.F.; Fox, R.; Heliölä, J.; et al. Multi-generational long-distance migration of insects: Studying the painted lady butterfly in the Western Palaearctic. Ecography 2013, 36, 474–486. [Google Scholar] [CrossRef] [Green Version]
  13. Muñoz, P.T.; Torres, F.P.; Megías, A.G. Effects of roads on insects: A review. Biodivers. Conserv. 2015, 24, 659–682. [Google Scholar] [CrossRef]
  14. Grilo, C.; Koroleva, E.; Andrášik, R.; Bíl, M.; González-Suárez, M. Roadkill risk and population vulnerability in European birds and mammals. Front. Ecol. Environ. 2020, 18, 323–328. [Google Scholar] [CrossRef]
  15. Aschwanden, J.; Stark, H.; Peter, D.; Steuri, T.; Schmid, B.; Liechti, F. Bird collisions at wind turbines in a mountainous area related to bird movement intensities measured by radar. Biol. Conserv. 2018, 220, 228–236. [Google Scholar] [CrossRef]
  16. Leskinen, M.; Markkula, I.; Koistinen, J.; Pylkkö, P.; Ooperi, S.; Siljamo, P.; Ojanen, H.; Raiskio, S.; Tiilikkala, K. Pest insect immigration warning by an atmospheric dispersion model, weather radars and traps. J. Appl. Entomol. 2011, 135, 55–67. [Google Scholar] [CrossRef] [Green Version]
  17. Weitnauer, E. Mein Vogel—Aus dem Leben des Mauersegler Apus apus; Basellandschaftlicher Natur- und Vogelschutzverband: Liestal, Switzerland, 1980. [Google Scholar]
  18. Liechti, F.; Witvliet, W.; Weber, R.; Bächler, E. First evidence of a 200-day non-stop flight in a bird. Nat. Commun. 2013, 4, 2554. [Google Scholar] [CrossRef] [Green Version]
  19. Hedenström, A.; Norevik, G.; Warfvinge, K.; Andersson, A.; Bäckman, J.; Åkesson, S. Annual 10-month aerial life phase in the common swift Apus apus. Curr. Biol. 2016, 26, 3066–3070. [Google Scholar] [CrossRef] [PubMed] [Green Version]
  20. Hart, A.G.; Hesselberg, T.; Nesbit, R.; Goodenough, A.E. The spatial distribution and environmental triggers of ant mating flights: Using citizen-science data to reveal national patterns. Ecography 2018, 41, 877–888. [Google Scholar] [CrossRef] [Green Version]
  21. Boda, P.; Csabai, Z. When do beetles and bugs fly? A unified scheme for describing seasonal flight behaviour of highly dispersing primary aquatic insects. Hydrobiologia 2013, 703, 133–147. [Google Scholar] [CrossRef] [Green Version]
  22. Bauer, S.; Chapman, J.W.; Reynolds, D.R.; Alves, J.A.; Dokter, A.M.; Menz, M.M.H.; Sapir, N.; Ciach, M.; Pettersson, L.B.; Kelly, J.F.; et al. From agricultural benefits to aviation safety: Realizing the potential of continent-wide radar networks. Bioscience 2017, 67, 912–918. [Google Scholar] [CrossRef] [PubMed]
  23. Chapman, J.W.; Reynolds, D.R.; Wilson, K. Long-range seasonal migration in insects: Mechanisms, evolutionary drivers and ecological consequences. Ecol. Lett. 2015, 18, 287–302. [Google Scholar] [CrossRef] [Green Version]
  24. Bauer, S.; Shamoun-Baranes, J.; Nilsson, C.; Farnsworth, A.; Kelly, J.F.; Reynolds, D.R.; Dokter, A.M.; Krauel, J.F.; Petterson, L.B.; Horton, K.G.; et al. The grand challenges of migration ecology that radar aeroecology can help answer. Ecography 2019, 42, 861–875. [Google Scholar] [CrossRef] [Green Version]
  25. Nilsson, C.; Dokter, A.M.; Verlinden, L.; Shamoun-Baranes, J.; Schmid, B.; Desmet, P.; Bauer, S.; Chapman, J.; Alves, J.A.; Stepanian, P.M.; et al. Revealing patterns of nocturnal migration using the European weather radar network. Ecography 2019, 42, 876–886. [Google Scholar] [CrossRef] [Green Version]
  26. Schmid, B.; Zaugg, S.; Votier, S.C.; Chapman, J.W.; Boos, M.; Liechti, F. Size matters in quantitative radar monitoring of animal migration: Estimating monitored volume from wingbeat frequency. Ecography 2019, 42, 931–941. [Google Scholar] [CrossRef]
  27. Zaugg, S.; Saporta, G.; van Loon, E.; Schmaljohann, H.; Liechti, F. Automatic identification of bird targets with radar via patterns produced by wing flapping. J. R. Soc. Interface 2008, 5, 1041–1053. [Google Scholar] [CrossRef] [PubMed] [Green Version]
  28. Liechti, F.; Bruderer, B. Quantification of nocturnal bird migration by moonwatching: Comparison with radar and infrared observations. J. F. Ornithol. 1995, 66, 457–468. [Google Scholar]
  29. Schmaljohann, H.; Liechti, F.; Bächler, E.; Steuri, T.; Bruderer, B. Quantification of bird migration by radar—A detection probability problem. Ibis 2008, 150, 342–355. [Google Scholar] [CrossRef]
  30. Batschelet, E. Circular Statistics in Biology; Academic Press: Cambridge, MA, USA, 1981. [Google Scholar]
  31. Kemp, M.U.; Shamoun-Baranes, J.; van Gasteren, H.; Bouten, W.; van Loon, E.E. Can wind help explain seasonal differences in avian migration speed? J. Avian Biol. 2010, 41, 672–677. [Google Scholar] [CrossRef]
  32. Tschanz, P.; Pellissier, L.; Shi, X.; Liechti, F.; Schmid, B. Consistency of spatio-temporal patterns of avian migration across the Swiss lowlands. Remote Sens. Ecol. Conserv. 2020, 6, 198–211. [Google Scholar] [CrossRef]
  33. Wood, S.N. Generalized Additive Models: An Introduction with R, 2nd ed.; Chapman and Hall/CRC: New York, NY, USA, 2017; ISBN 9781498728348. [Google Scholar]
  34. Killick, R.; Eckley, I.A. Changepoint: An R package for changepoint analysis. J. Stat. Softw. 2014, 58, 1–19. [Google Scholar] [CrossRef] [Green Version]
  35. R Core Team. R: A Language and Environment for Statistical Computing; R Foundation for Statistical Computing: Vienna, Austria, 2019. [Google Scholar]
  36. Van Belle, J.; Shamoun-Baranes, J.; van Loon, E.; Bouten, W. An operational model predicting autumn bird migration intensities for flight safety. J. Appl. Ecol. 2007, 44, 864–874. [Google Scholar] [CrossRef]
  37. Karlsson, H.; Nilsson, C.; Bäckman, J.; Alerstam, T. Nocturnal passerine migrants fly faster in spring than in autumn: A test of the time minimization hypothesis. Anim. Behav. 2012, 83, 87–93. [Google Scholar] [CrossRef]
  38. Weisshaupt, N.; Dokter, A.M.; Arizaga, J.; Maruri, M. Effects of a sea barrier on large-scale migration patterns studied by a network of weather radars. Bird Study 2018, 65, 232–240. [Google Scholar] [CrossRef]
  39. Nilsson, C.; Dokter, A.M.; Schmid, B.; Scacco, M.; Verlinden, L.; Bäckman, J.; Haase, G.; Dell’Omo, G.; Chapman, J.W.; Leijnse, H.; et al. Field validation of radar systems for monitoring bird migration. J. Appl. Ecol. 2018, 55, 2552–2564. [Google Scholar] [CrossRef]
  40. Fransson, T. Timing and speed of migration in north and west European populations of sylvia warblers. J. Avian Biol. 1995, 26, 39. [Google Scholar] [CrossRef]
  41. Hüppop, O.; Hüppop, K. North Atlantic oscillation and timing of spring migration in birds. Proc. R. Soc. B 2003, 270, 233–240. [Google Scholar] [CrossRef]
  42. Erni, B.; Liechti, F.; Underhill, L.G.; Bruderer, B. Wind and rain govern the intensity of nocturnal bird migration in central Europe—A log-linear regression analysis. Ardea 2002, 90, 155–166. [Google Scholar]
  43. Liechti, F.; Scandolara, C.; Rubolini, D.; Ambrosini, R.; Korner-Nievergelt, F.; Hahn, S.; Lardelli, R.; Romano, M.; Caprioli, M.; Romano, A.; et al. Timing of migration and residence areas during the non-breeding period of barn swallows Hirundo rustica in relation to sex and population. J. Avian Biol. 2015, 46, 254–265. [Google Scholar] [CrossRef]
  44. Robinson, R.A.; Meier, C.M.; Witvliet, W.; Kéry, M.; Schaub, M. Survival varies seasonally in a migratory bird: Linkages between breeding and non-breeding periods. J. Anim. Ecol. 2020, 89, 2111–2121. [Google Scholar] [CrossRef]
  45. Åkesson, S.; Ilieva, M.; Karagicheva, J.; Rakhimberdiev, E.; Tomotani, B.; Helm, B. Timing avian long-distance migration: From internal clock mechanisms to global flights. Philos. Trans. R. Soc. B 2017, 372, 20160252. [Google Scholar] [CrossRef] [PubMed] [Green Version]
  46. Behr, O.; Brinkmann, R.; Hochradel, K.; Mages, J.; Korner-Nievergelt, F.; Niermann, I.; Reich, M.; Simon, R.; Weber, N.; Nagy, M. Mitigating bat mortality with turbine-specific curtailment algorithms: A model based approach. In Wind Energy and Wildlife Interactions; Springer: Berlin/Heidelberg, Germany, 2017; pp. 135–160. [Google Scholar]
  47. Salvarina, I.; Gravier, D.; Rothhaupt, K.O. Seasonal bat activity related to insect emergence at three temperate lakes. Ecol. Evol. 2018, 8, 3738–3750. [Google Scholar] [CrossRef] [PubMed] [Green Version]
  48. Johnson, C.G. Migration and Dispersal of Insects by Flight; Methuen: London, UK, 1969. [Google Scholar]
  49. Stefanescu, C.; Puig-Montserrat, X.; Samraoui, B.; Izquierdo, R.; Ubach, A.; Arrizabalaga, A. Back to Africa: Autumn migration of the painted lady butterfly Vanessa cardui is timed to coincide with an increase in resource availability. Ecol. Entomol. 2017, 42, 737–747. [Google Scholar] [CrossRef]
  50. Kelly, J.F.; Horton, K.G.; Stepanian, P.M.; de Beurs, K.M.; Fagin, T.; Bridge, E.S.; Chilson, P.B. Novel measures of continental-scale avian migration phenology related to proximate environmental cues. Ecosphere 2016, 7, e01434. [Google Scholar] [CrossRef]
  51. Visser, M.E.; Both, C. Shifts in phenology due to global climate change: The need for a yardstick. Proc. R. Soc. B 2005, 272, 2561–2569. [Google Scholar] [CrossRef] [PubMed]
  52. Sparks, T.H.; Dennis, R.L.H.; Croxton, P.J.; Cade, M. Increased migration of Lepidoptera linked to climate change. Eur. J. Entomol. 2007, 104, 139–143. [Google Scholar] [CrossRef] [Green Version]
  53. Bale, J.S.; Hayward, S.A.L. Insect overwintering in a changing climate. J. Exp. Biol. 2010, 213, 980–994. [Google Scholar] [CrossRef] [PubMed] [Green Version]
Figure 1. A graphical description of the iterative Rayleigh’s approach to calculate the proportion of directional (blue dots) and non-directional movement (green dots) for each day and night. Echoes (dots) are binned per flight direction and incrementally stacked (layers 1 to n). The mth layer is the first layer that is directional (Rayleigh test: p < 0.05). Note that if the first layer is already directional (m = 1), then the proportion of directional movements reaches 1 (all movements are migratory), and if none of the layers are directional, the proportion is 0 (all movements are non-migratory).
Remotesensing 13 01839 g001
Figure 2. Results of the simulation tests showing on the x-axis, the input values for the proportion of directional and non-directional movements (0 = 100% non-directional, 1 = 100% directional), and on the y-axis, the estimated proportions based on our method. Colored lines represent different sample sizes. For this graph, the bin width was five degrees and assumed standard deviation for directional movements was 40°. For further graphs (SD = 20° and 60°), see the supplemental material.
Remotesensing 13 01839 g002
Figure 3. Year-round birds’ (ad) and insects’ (eh) daily mean flight directions in 2016 and 2017. The plots with a white background represent diurnal movements and the plots with a light yellow background represent nocturnal movements. Note that in the first half of a year (left column), directions in ±22.5 degrees from NE (45 degrees from N) are shaded in grey, and this is the same for directions in ±22.5 degrees from SW (225 degrees from N) in the second half of a year (right column).
Remotesensing 13 01839 g003
Figure 4. Year-round predicted trend in directional (blue) and non-directional (green) flight activity of birds (above) and insects (below): (a) trends in birds during day and (b) night; (c) trends in insects during day and (d) night. X-axis represents every odd-numbered month. See Figure S1 in the electronic supplementary material for the data of the two years.
Remotesensing 13 01839 g004
Publisher’s Note: MDPI stays neutral with regard to jurisdictional claims in published maps and institutional affiliations.

