
Distribution and Attribution of Terrestrial Snow Cover Phenology Changes over the Northern Hemisphere during 2001–2020


1
State Key Laboratory of Resources and Environmental Information System, Institute of Geographic Sciences and Natural Resources Research, Chinese Academy of Sciences, Beijing 100101, China
2
Jiangsu Center for Collaborative Innovation in Geographical Information Resource Development and Application, Nanjing 210023, China
3
Cooperative Institute for Research in the Atmosphere, Colorado State University, Fort Collins, CO 80523, USA
4
School of Earth and Space Sciences, Peking University, Beijing 100871, China
*
Author to whom correspondence should be addressed.
Remote Sens. 2021, 13(9), 1843; https://0-doi-org.brum.beds.ac.uk/10.3390/rs13091843
Submission received: 25 March 2021
/
Revised: 30 April 2021
/
Accepted: 5 May 2021
/
Published: 9 May 2021
Abstract
:Snow cover phenology has exhibited dramatic changes in the past decades. However, the distribution and attribution of the hemispheric scale snow cover phenology anomalies remain unclear. Using satellite-retrieved snow cover products, ground observations, and reanalysis climate variables, this study explored the distribution and attribution of snow onset date, snow end date, and snow duration days over the Northern Hemisphere from 2001 to 2020. The latitudinal and altitudinal distributions of the 20-year averaged snow onset date, snow end date, and snow duration days are well represented by satellite-retrieved snow cover phenology matrixes. The validation results by using 850 ground snow stations demonstrated that satellite-retrieved snow cover phenology matrixes capture the spatial variability of the snow onset date, snow end date, and snow duration days at the 95% significance level during the overlapping period of 2001–2017. Moreover, a delayed snow onset date and an earlier snow end date (1.12 days decade−1, p < 0.05) are detected over the Northern Hemisphere during 2001–2020 based on the satellite-retrieved snow cover phenology matrixes. In addition, the attribution analysis indicated that snow end date dominates snow cover phenology changes and that an increased melting season temperature is the key driving factor of snow end date anomalies over the NH during 2001–2020. These results are helpful in understanding recent snow cover change and can contribute to climate projection studies.
1. Introduction
Snow cover is an integral component of the cryosphere and represents one of the three Essential Climate Variables related to snow for the Global Observing System for Climate, which plays a crucial role in the Earth’s climate system through the surface energy budget [1,2,3], atmospheric circulation [4], and hydrological cycle [5,6,7], and influences freshwater resources across a large proportion of the Northern Hemisphere (NH) [6]. Snow cover phenology (SCP) variables including snow onset date (Do), snow end date (De), and snow duration days (Dd) are key indicators of seasonal variation of terrestrial snow cover over the NH and becoming increasingly valuable indicators of climate change [6,8], especially in snow-dominated cold regions [6,9]. For example, SCP has considerable impact on climate variabilities, such as alpine vegetation growth dynamics on the Tibetan Plateau [10], green-up date across the NH [11], boreal springtime carbon uptake [12], permafrost degradation in sub-arctic Sweden [9], and SCP indicators are expected to provide feedback to temperature trends [13]. Moreover, abnormal snowmelt timing in spring are creating a serious threat to water resource sustainability, including agricultural production [14] and even cause hydrological extremes such as spring floods [15]. Therefore, accurate estimation and information on SCP are essential not only for evaluating the impacts of climate change but also for disaster prevention.
Changes in SCP are directly related to observed snow cover extent (SCE) anomalies over the NH. Published studies have reported a well-documented SCE reduction driven by surface warming in the past decades [16,17,18,19,20,21]. For example, based on multi-model ensemble results from the latest World Climate Research Programme Coupled Model Intercomparison Project Phase 6 (CMIP6), Mudryk et al. [20] found that trends in the snow cover extent (SCE) during 1981–2018 were negative in all months and exceeded −50 × 103 km2 a−1 during November, December, March, and May. Through multiple satellite observations, Brown et al. [19] estimated that the June SCE decreased by 46% over the pan-Arctic regions during the 1967–2008 period. Moreover, the SCE has shrunk more than expected in the past few decades. For example, Derksen and Brown [17] proved that the June SCE decreased at twice the speed of the widely documented reduction in the September sea-ice extent between 1979 and 2011, especially in the later part of that period. In addition, a comparison of satellite observations and model simulations revealed that SCE reductions in the 2008–2012 period exceeded climate model projections by Derksen and Brown [17].
Driven by the rapid decline of SCE over the NH, SCP has exhibited remarkable changes, including a sharp decrease in Dd [22], an earlier snowmelt onset date [23], an advanced De, and notable changes in Do [22] at local, regional, and hemispherical scales. For example, using a satellite-retrieved SCE dataset at 25-km spatial resolution, Choi et al. [22] concluded that the average Dd in the NH shortened at a rate of 0.8 weeks decade−1 between the winters of 1972/73 and 2007/08. Moreover, based on Passive Microwave (PM) measurements at 25-km spatial resolution, Wang et al. [23] retrieved pan-Arctic snow melt onset dates from 1979 to 2011 and found a significantly earlier date for melt onset (2–3 days decade−1) over the Eurasian land sector of the Arctic. Through an investigation of 636 ground-based snow depth observations over the NH, Peng et al. [13] revealed earlier snow cover termination, and concluded that changes in SCP were related to the annual snowmelt monthly temperature with a sensitivity of −0.077 °C day−1. Based on multiple satellite and reanalysis data, Chen et al. [24] reported that De advanced by 5.11 (±2.20) days in northern high latitudes (52–75° N) and was delayed by 3.28 (±2.59) days in northern mid-latitudes (32–52° N) from 2001 to 2014, with a 90% confidence level. The above studies provide valuable insights into the distribution and attribution of SCP over the NH. However, most of the above studies employed in situ observations, models, or satellite observations with coarse spatial resolution. Therefore, the distribution of SCP at finer spatial resolution, its attributions, and its response to climate change at the hemisphere scale have yet to be determined using the latest observations.
In addition to SCP distribution analysis, attribution of SCP anomalies are also concerned in the past decades. Several studies have shown that changes in SCP are highly sensitive to land surface temperature and precipitation anomalies [13,18,19,22,24]. For example, earlier snow cover termination in the NH proved to be systematically correlated on a year-to-year basis with a positive temperature anomaly during the snowmelt month [13]. Moreover, approximately 50 % of the interannual variance in the extent of NH spring snow cover during 1922–2010 can be attributed to air temperature [18].
Recent studies have revealed significant changes in the land surface temperature induced by the vanishing cryosphere [25,26,27,28], as well as increased winter precipitation induced by changes in atmospheric circulation [29] and human activity [30,31]. According to a World Meteorological Organization statement on the state of the global climate [32], the past five years (2015–2019) were the five warmest years on record. Moreover, the near-surface at high latitudes in the NH is warming at double the rate of lower latitudes due to the rapid loss of both sea ice and snow cover in spring and summer [27]. Despite climate warming on average, a large number of high-impact cold extremes have occurred in the mid-latitudes of the NH over the past decade [33]. It is thus crucial to understand how these climate change events, which exhibit high spatial heterogeneity, influence SCP. Such information can contribute to snow water management, the sustainable development of ecosystems, and predictions of catastrophic climate-related events.
To explore the latest terrestrial snow cover phenology changes and its attribution factors under the rapid climate change background, this study integrates 8-day Level 3 snow cover fraction products derived from the Moderate Resolution Imaging Spectroradiometer Satellite (MOD10C2) from September 2000 to August 2020, at a spatial resolution of 0.05° (approximately 5 km), as well as the binary snow mask from the Interactive Multi-sensor Snow and Ice Mapping System (IMS) during 2005–2019, with a spatial resolution of 4 km. These data are used to produce a 20-year gap-free MOD10C2-based snow cover extent (GF-MOD10C2-SCE) with finer spatial resolution over the NH. Then, using the integrated GF-MOD10C2-SCE, this study retrieves SCP matrices over the NH, including Do, De, and Dd. Moreover, through reanalysis of the land surface temperature and precipitation, this study explores the SCP anomalies over the NH in the past two decades.
2. Materials and Methods
2.1. Study Area
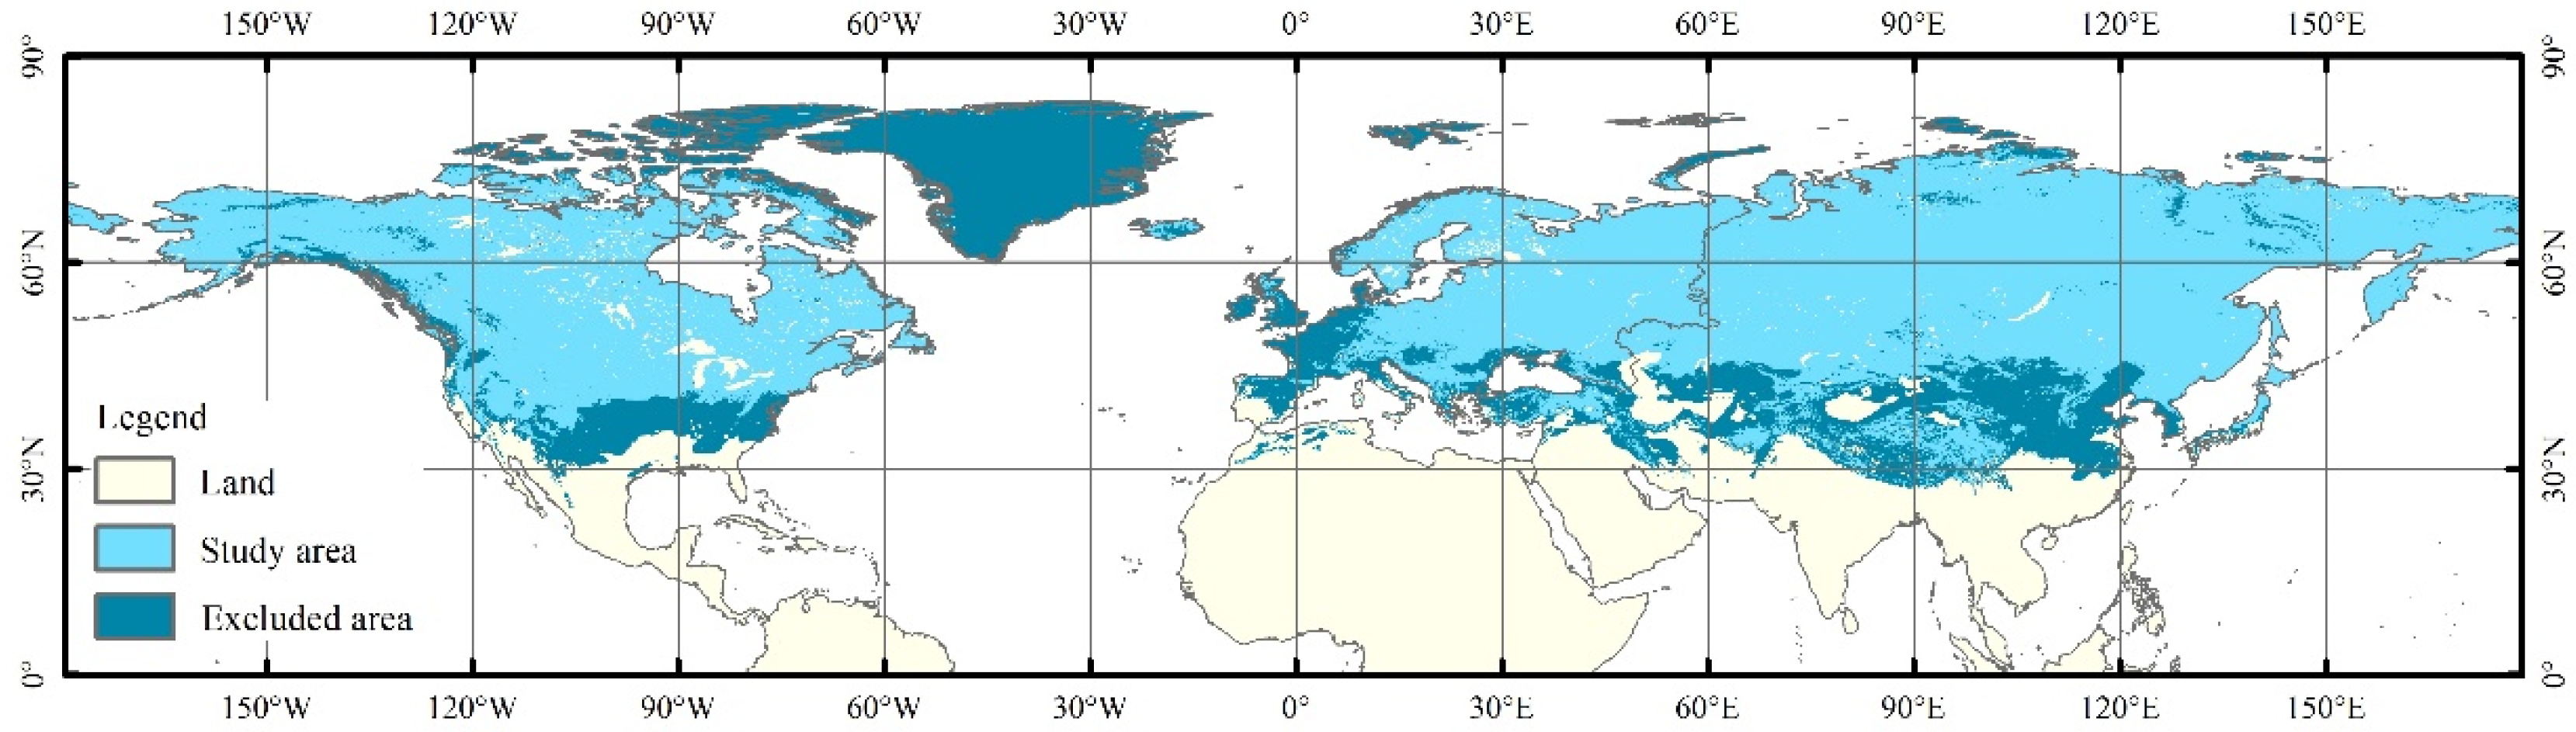
To focus on changes in SCP, the study area was confined to seasonal snow cover gridcells with snow cover greater than 7 frames using 8-day MOD10C2 for 75% of the years between 2001 and 2020, similar with Choi et al. [22]. Permanent snow-covered regions with little change in SCP are beyond the scope of this study. Moreover, areas of thin or patchy snow cover were excluded from the analysis because they may have been missed in the optical satellite images [34]. The distribution of study area and excluded area calculated from GF-MOD10C2-SCE from 2001 to 2020 is shown in Figure 1.
2.2. Datasets
Three satellite-observed snow cover products, 850 ground-based daily snow depth observations, and a reanalysis dataset were employed to explore the distribution and attribution of terrestrial SCP anomalies over the NH.
2.2.1. Satellite-Observed Snow Cover Datasets
Satellite-observed snow cover datasets are preliminary input data for SCP detection over the NH. Three snow cover datasets, including snow charts derived from the Northern Hemisphere Snow Cover Extent Climate Data Record (NH SCE CDR) v01r01 [35], MOD10C2 [36], and IMS [37] were employed in this study.
Snow Cover Charts
MOD10C2 Snow Cover Fraction Dataset
The MOD10C2 provides the 8-day composite global snow cover fraction (SCF) at 0.05° from February 2000 to the present. MOD10C2 is an aggregation of MOD10A2 products with 500-m spatial resolution, which is an 8-day composite of MOD10A1 daily SCE maps [36]. The 8-day composite is considered useful because persistent cloudiness limits the number of days available for surface observations in many regions, particularly at high latitudes [38]. In this study, the MOD10C2 was used as the primary data in SCP retrieval because MOD10C2 is the only consistent, objective snow estimate derived from optical satellite observations over the last two decades with relatively finer spatial resolution.
IMS Datasets
The IMS snow cover product provides daily binary SCE maps for the NH from February 1997 to December 2019 at three different resolutions, i.e., 1 km (since 2015), 4 km (since 2004), and 24 km (since 1997), which are created manually by a snow analyst using data from a combination of geostationary and polar orbiting satellites in visible, infrared, and microwave spectrums [37]. The IMS dataset is widely used for data integration [39,40]. The daily rate of agreement between IMS snow maps and ground-based snow observations between 2006 and 2010 was predominantly between 80% and 90% throughout the winter seasons over the continental United States [41]. To fill the gaps in MOD10C2 at the highest achievable spatial resolution, this study used the IMS at a spatial resolution of 4 km from 2005 to 2019.
2.2.2. Ground-Based Snow Depth Observations
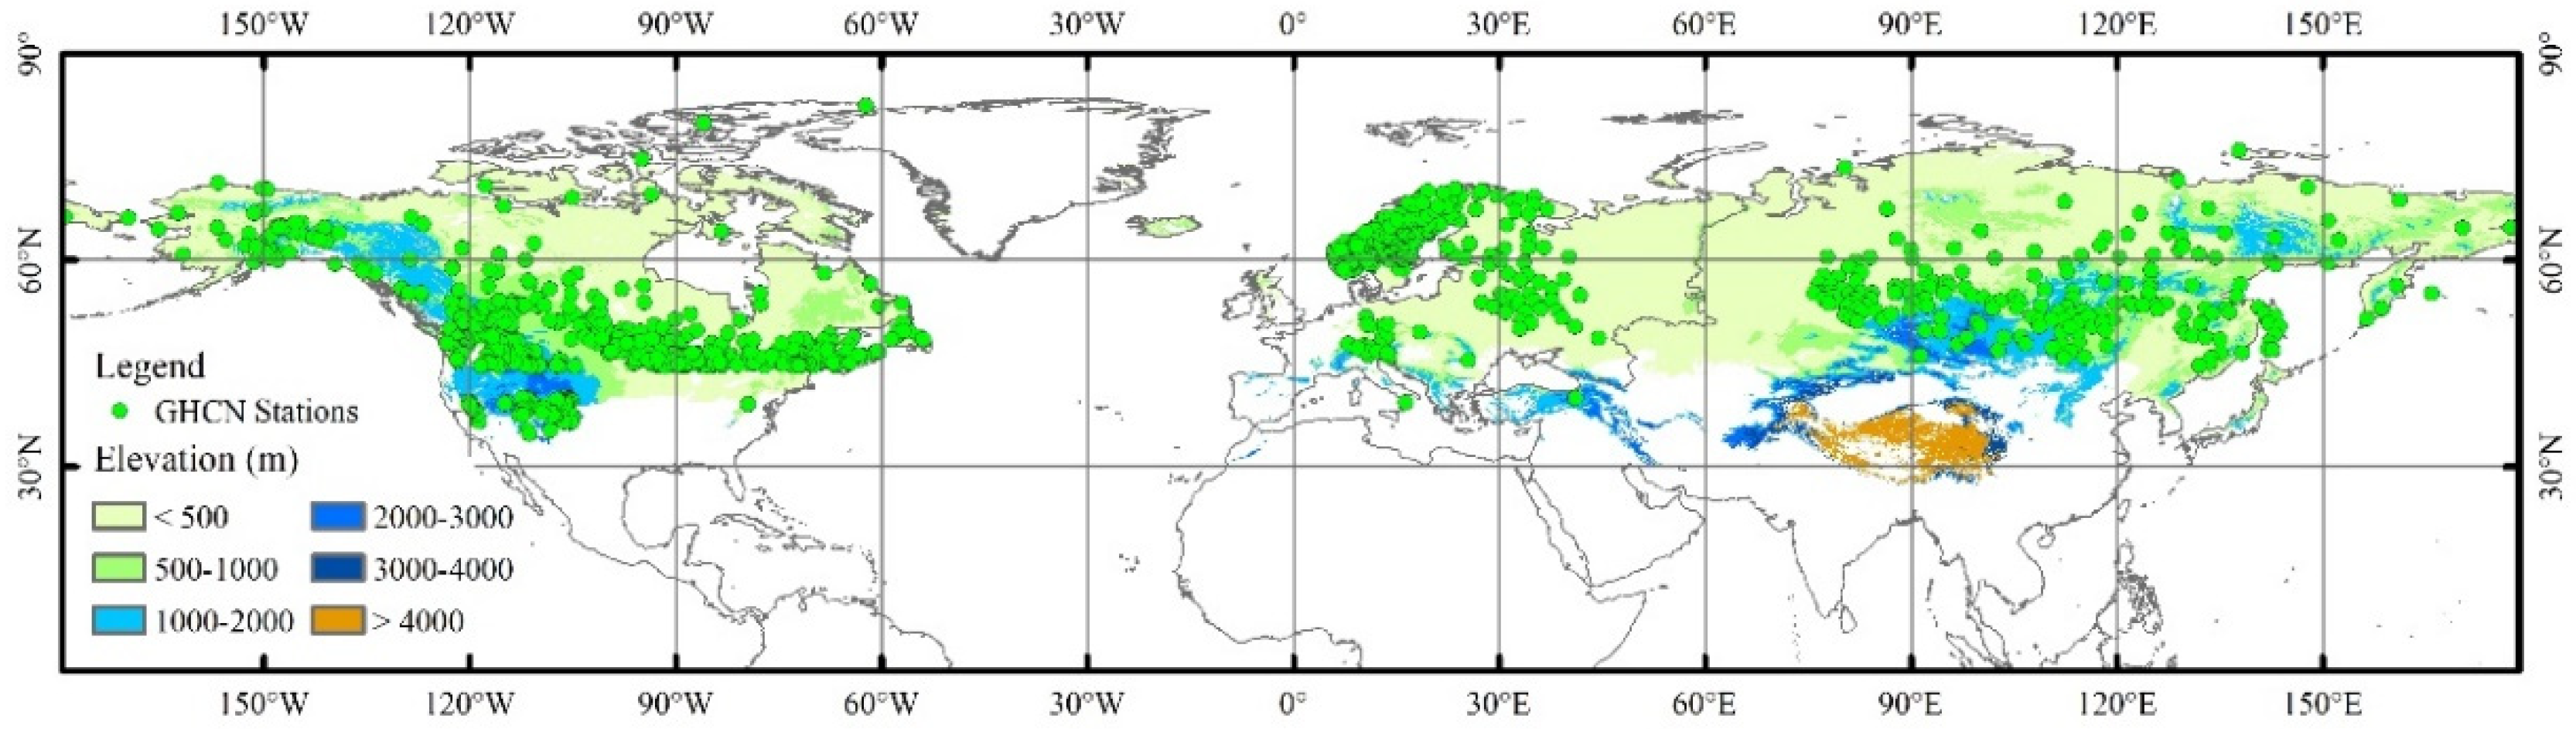
Daily ground-based snow depth measurements generated by the Global Historical Climatology Network (GHCN) [42] were used to detect the ground-observed SCP and were employed as ground truth to verify the performance of the satellite-retrieved SCP in this study. The daily GHCN contains records from over 75,000 stations in 180 countries and territories [42]. By assembling and checking observations made in multiple different nations, the GHCN provides daily snow depth records over the NH, especially at high latitudes. As they are subject to the speed of data updates, GHCN data for the last three years are incomplete. Therefore, only 850 stations covering September 2000 to August 2017 with Dd greater than 60 days were used for validation. The distribution of the selected GHCN snow depth observations are shown in Figure 2.
2.2.3. Reanalysis Temperature and Precipitation Dataset
Model resolution plays an important role in representing the orographic gradient effects on temperature and precipitation simulations [43]. ERA5-Land is a replay of the land component of the ERA5 climate reanalysis with a finer spatial resolution (0.10° grid spacing) than ERA5 monthly averaged data on single levels from 1979 to the present (0.25° spatial resolution) [44] and the Climatic Research Unit (CRU) Time-Series (TS) Version 4.04 (0.50° spatial resolution) [45]. To address the changes of SCP over the NH, the monthly averaged 2-m temperature and total precipitation derived from the European Centre for Medium Range Weather Forecasts (ECMWF) Reanalysis v5–Land (ERA5-Land) [44] are used as surface air temperature and precipitation in the attribution analysis. Moreover, the model used in the production of ERA5-Land is the tiled ECMWF scheme for surface exchanges over land, which incorporates land surface hydrology (H-TESSEL) and has been proven suitable for modeling the ground [46,47].
2.2.4. Data Preparation
Details of datasets used in this study are provided in Table 1. Abbreviations used in this study are listed in Table A1. To match the spatial resolution of the satellite-retrieved SCP matrixes, the monthly averaged 2-m temperature and total precipitation derived from ERA5-Land were regridded at a spatial resolution of 0.05° by using the resampling method of “cubic-spline” with the help of gdalwarp (http://www.gdal.org/gdalwarp.html).
2.3. Methods
2.3.1. Generation of Gap-Free MOD10C2-Based SCE Dataset
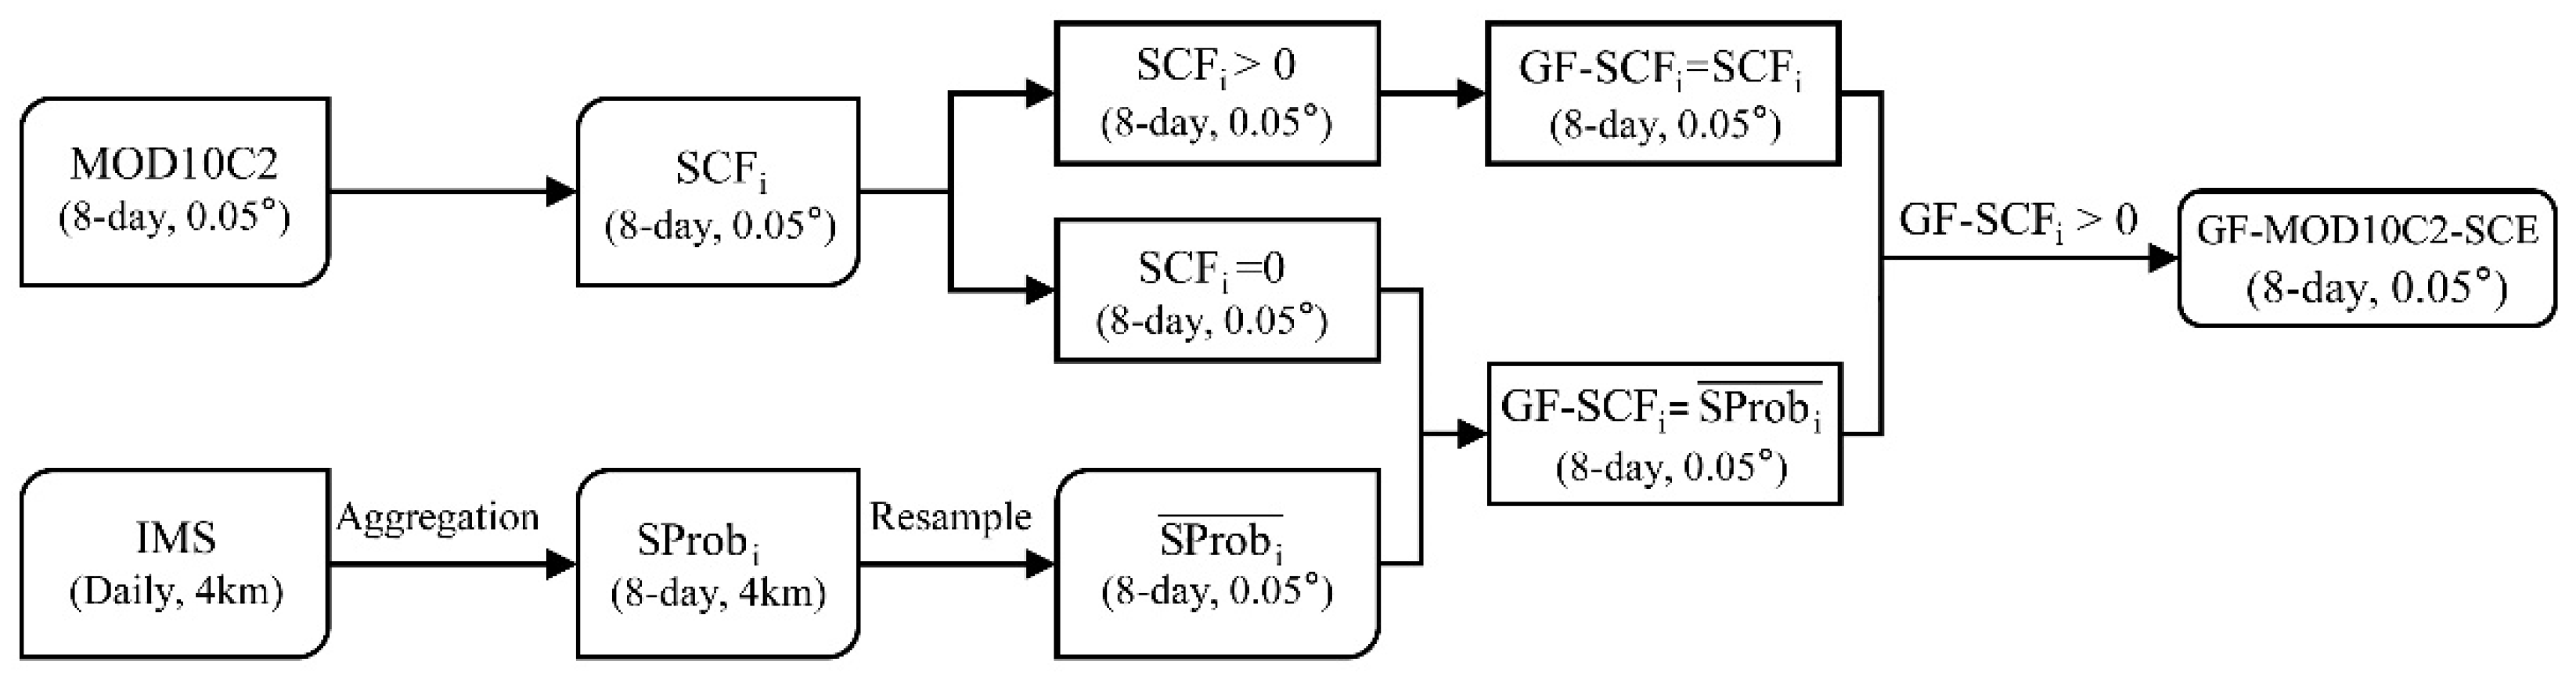
To overcome the shortage of optical MOD10C2 in snow discrimination caused by invalid observations and cloud contamination, we produced GF-MOD10C2-SCE dataset before SCP retrieving. First, using spatial complete IMS from 2005 to 2019, we produced an 8-day snow cover probability (SProb) map in each 8-day period of the year. For gridcell i in a given 8-day period of the year, the SProbi was calculated by averaging non-zero values in this 8-day period from 2005 to 2019. Second, the SProb map was used to fill the gaps in MOD10C2. If SCFi = 0 and SProbi > 50%, the SProbi will replace SCFi in original MOD10C2. Finally, the gridcells with SCF > 0 were used as the GF-MOD10C2-SCE and employed to retrieve the SCP matrixes over the NH. Using homogeneous GF-MOD10C2-SCE in SCP retrieval will reduce the error caused by missing observations in the original MOD10C2. The flowchart of GF-MOD10C2-SCE generation is presented in Figure 3.
2.3.2. Snow Cover Phenology Retrieval
We used the hydrological year in this study to explore interannual anomalies in the SCP. Based on the seasonal cycles of snow cover for northern Eurasia and North America [48], this study defined the hydrological year (t) as the period from September in year (t-1) to August in year (t). To further attribute changes in SCP, we defined the accumulation season of snow cover from September to December and the melting season from March to June in the attribution analysis.
Definition of Satellite-Retrieved Snow Cover Phenology
Published study have used full snow seasons and core snow seasons in SCP identification [22], in which full snow seasons is the interval between the first appearance and the last disappearance of snow cover and core snow seasons is the longest interval of the season with an unbroken string of weeks for which a grid cell is snow covered. In this study, we mainly focus on SCP changes in core snow seasons.
The definition of Do, De, and Dd in a hydrological year using original 8-day MOD10C2 SCF dataset is shown in Figure 4. To avoid the impact of missing observations (D-G) on SCP retrieval, we used GF-MOD10C2-SCE in SCP retrieve. For the 8-day GF-MOD10C2-SCE dataset, we first identified the 8-day interval frames (day index i to i + 7) between the frames when the SCE was superior to zero and when it equaled zero in core snow seasons, then defined Do and De at i+3.5 days of the first frame when the SCE was superior to zero and when it equaled zero in core snow seasons, respectively.
Definition of Ground-Based Snow Cover Phenology
To avoid the impact of ephemeral snow on SCP retrieval and match the temporal resolution of 8-day GF-MOD10C2-SCE, Do was defined as the first four consecutive days in the accumulation season and De was defined as the last four consecutive days of persistent snow cover in the melting season. Dd was defined as the number of days between Do and De.
2.3.3. Validation of Satellite-Retrieved Snow Cover Phenology Using Ground Observations
Although there are large differences in the spatial representation of satellite-retrieved SCP and ground-based SCP, the ground observations still provide the most convincing results when compared with satellite-retrieved SCP. In this study, the root-mean-square error (RMSE), mean relative error (MRE), and bias were used as criteria to evaluate the relative accuracy of the satellite-retrieved SCP (Xsat) relative to ground-based SCP (Xobs) during 2001–2017. The RMSE, MRE, and bias of Xsat relative to Xobs are expressed as follows:
where Xsat,i and Xobs,i are the satellite-retrieved SCP and ground-based SCP in a given gridcell i, respectively.
2.3.4. Attribution Analysis
As anomalies in Dd are directly correlated to variabilities in Do and De, we mainly focus on the attribution analysis of Do and De in this study. To compare the contributions of Do and De from each climate variable consistently, all variables were converted to standardized anomalies (z-score) using the mean and standard deviation in the attribution analysis.
Published studies have shown that changes in SCP are largely determined by surface air temperature and precipitation variability [6,13]. Therefore, we assumed that the interannual variability of Do was driven by the competing effects of surface air temperature (Ta) and precipitation (Pa) in the snow accumulation seasons. To attribute changes in Do, we regressed Do as the dependent variable with Ta and Ps as the independent variables, following Chen et al. [24].
Here, β1 and β2 are regression coefficients for Ta and Pa, and ε1 is the residual. The contributions of Ta and Pa to Do anomalies are reflected by the terms β1 × Ta and β2 × Pa, respectively. The contributions of Ta and Pa to Do were computed by regressing the annual time series of Do z-scores against the time series of z-scores of Ta and Pa. The resulting regression coefficients β1 and β2 were multiplied by Ta and Pa z-scores to derive the contributions of Ta and Pa to the Do z-scores.
Moreover, De mainly depends on the maximum spring snow depth to melt and the surface air temperature in the snow melting season (Tm), in which the maximum snow depth in spring is determined using Ta and Pa. Therefore, we assumed that the interannual variability of De was driven by Ta, Pa, and Tm. We regressed De as the dependent variable, with Ta, Pa, and Tm as the independent variables, as performed in Chen et al. [24].
Here, β3, β4, and β5 are regression coefficients for Ta, Pa, and Tm, respectively, and ε2 is the residual. The contributions of Ta, Pa, and Tm to the De anomalies are reflected by the terms β3 × Ta, β4 × Pa, and β5 × Tm, respectively. Similarly, the contributions of Ta, Pa, and Tm to De were computed by regressing the annual and zonal time series of De z-scores against the time series of z-scores of Ta, Pa, and Tm. The resulting regression coefficients were multiplied by the time series of Ta, Pa, and Tm z-scores to derive the contributions of Ta, Pa, and Tm to the De z-scores. A similar formula was employed by Peng et al. [13] and Chen et al. [24] to identify the sensitivity of SCP to climate variabilities over the NH.
3. Results
To explore changes in SCP over the NH, we first analyzed the monthly SCE changes over the NH from 1966 to 2020. Then, we mapped the latest 20-year averaged SCP over the NH from 2001 to 2020 and explored its changes and attribution during the corresponding period.
3.1. Observed Long-Term Anomalies in Snow Cover Extent over the NH
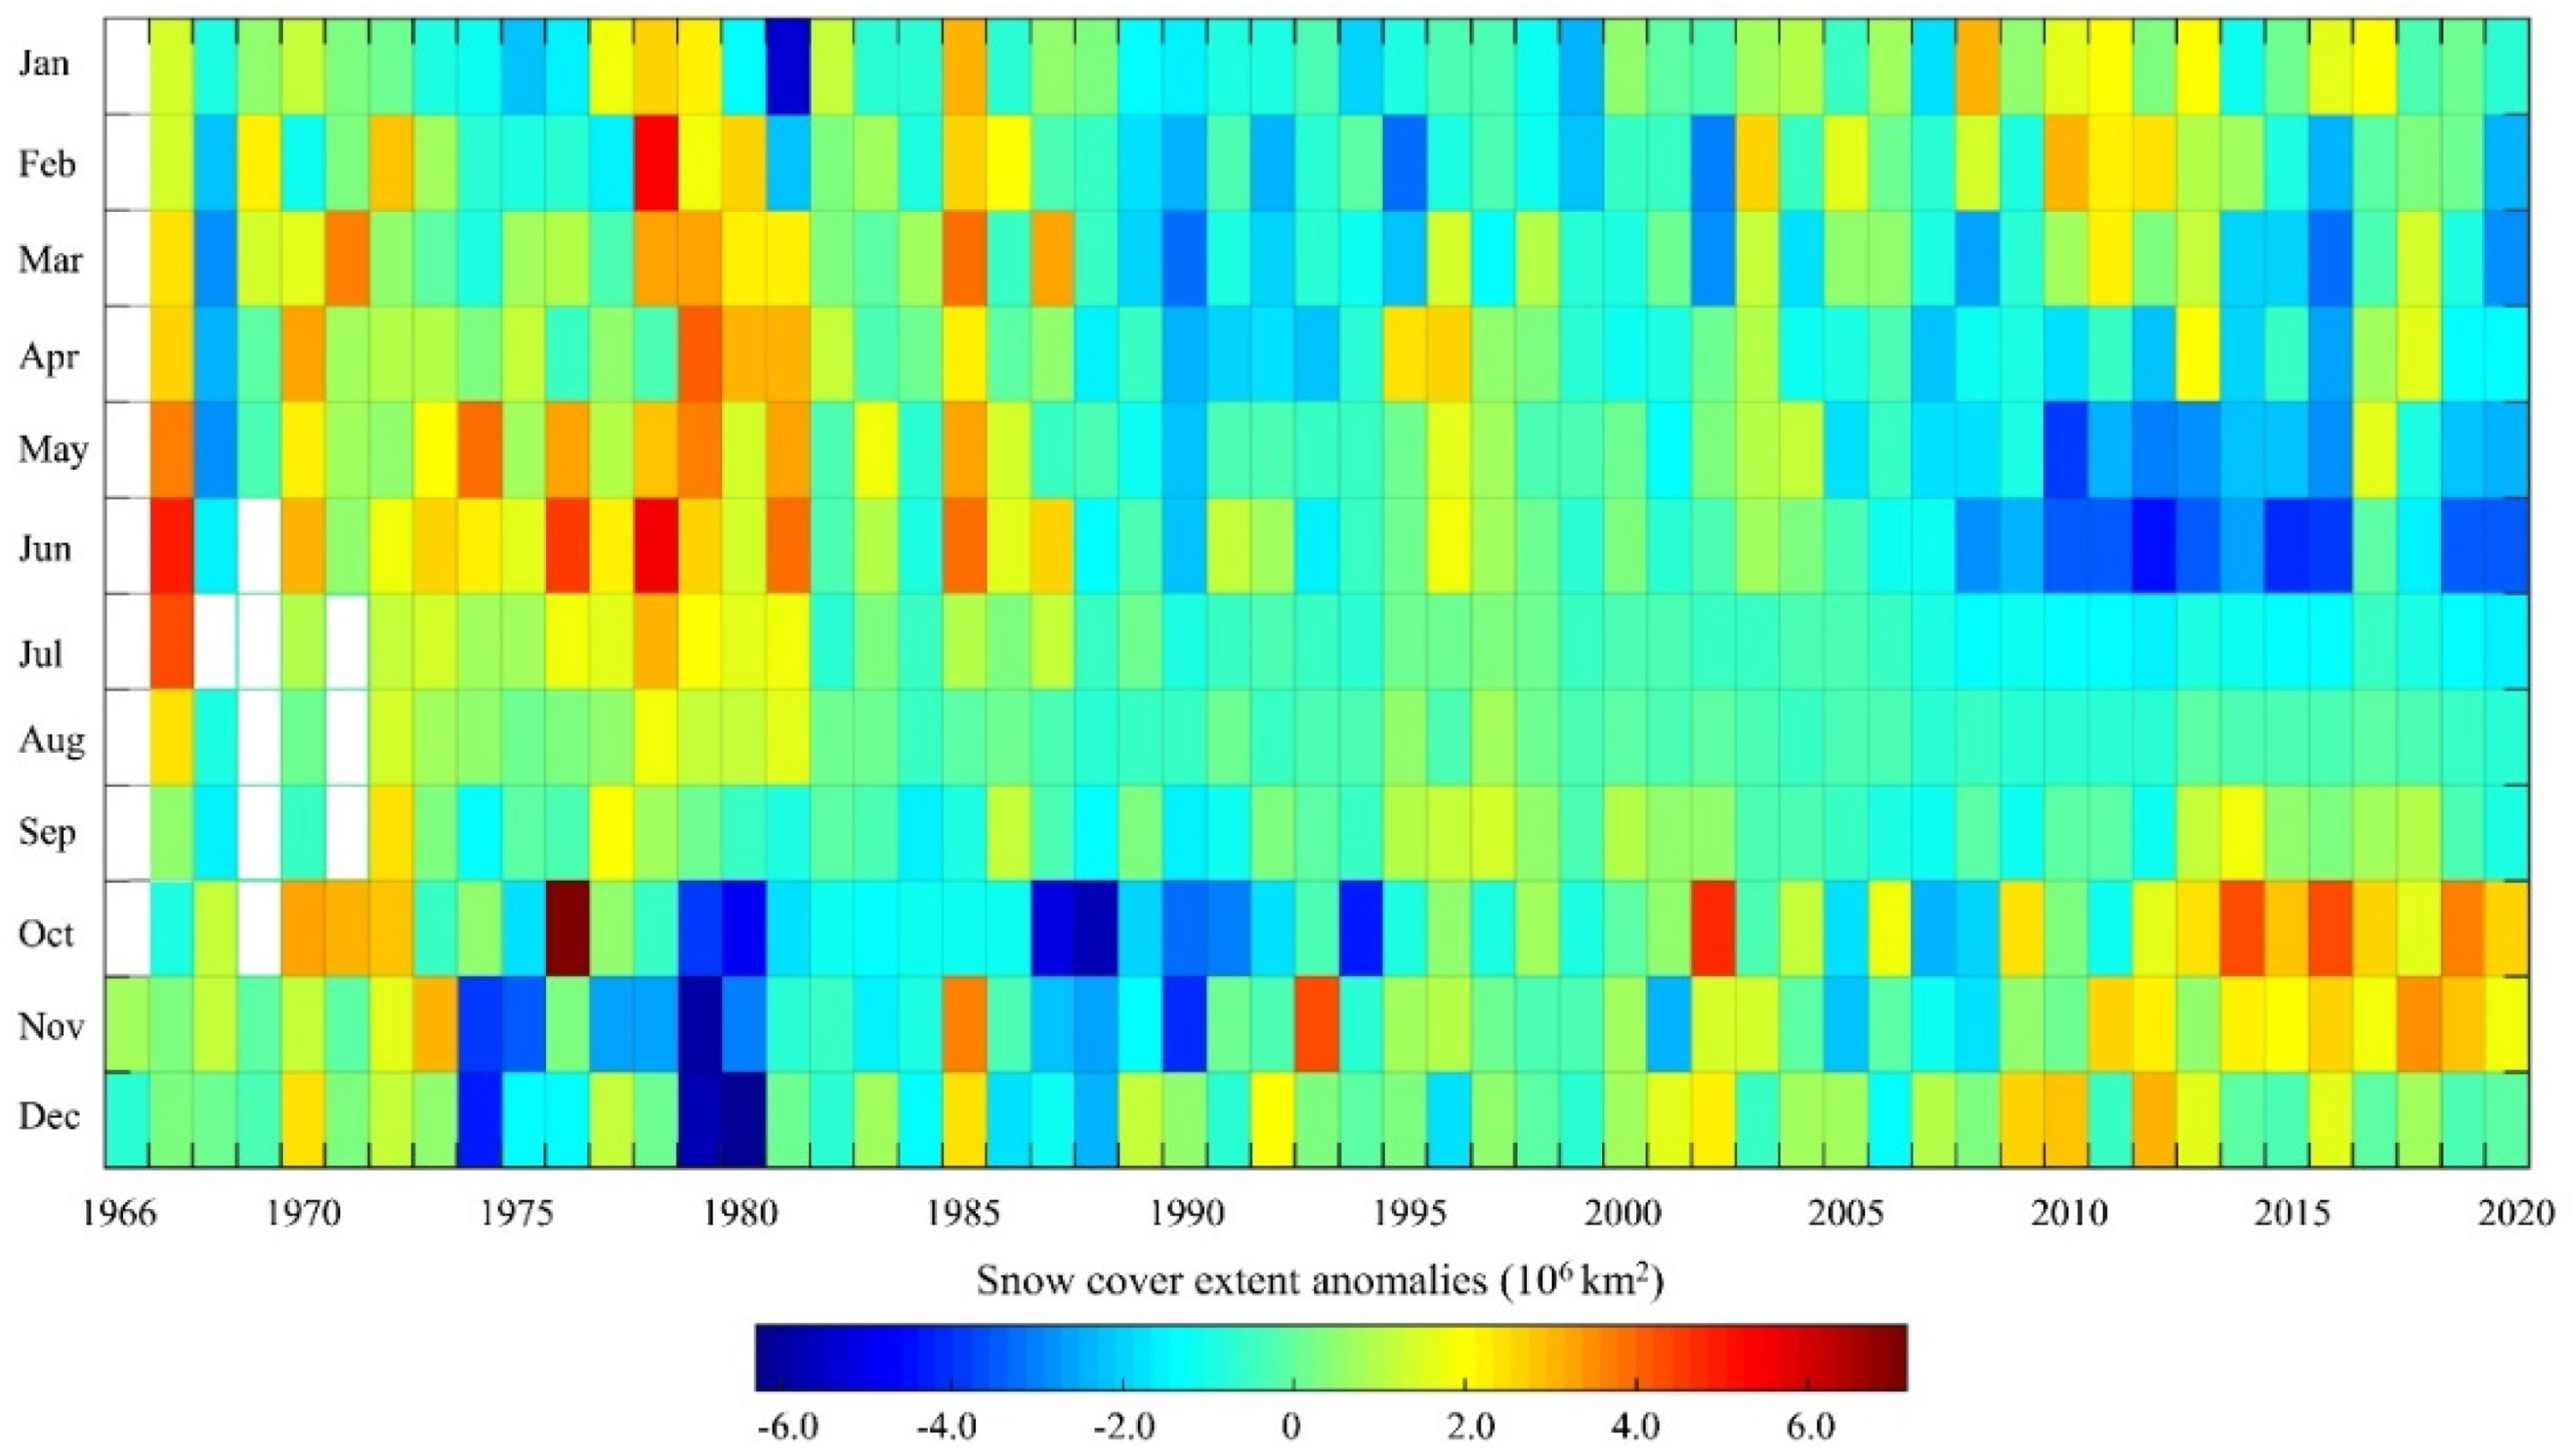
The monthly SCE anomalies from 1966 to 2020 are shown in Figure 5, and detailed changes in the monthly SCE over the NH are presented in Table 2. Compared with the monthly averaged SCE in the earlier period of 1966–2000, the later period of 2001–2020 exhibited large differences; the SCE decreased during the melting season from May to August (Table 2), with a maximum SCE reduction of up to 30% in June (−3.22 106 km2). In contrast to the negative changes of SCE in the melting seasons, SCEs largely increased during the accumulation season from September to November; the maximum SCE increase occurred in October (2.29 106 km2), with an amplitude of up to 12.96% greater than the monthly averaged October SCE in the period of 1966–2000. Increased SCE in the snow accumulation season coincides with increasing snow cover and widespread boreal winter cooling since 1990 [33]. Moreover, the contrasting seasonal anomalies in SCE directly corresponded to SCP anomalies during 2001–2020.
3.2. Climatology of Snow Cover Phenology over the NH from 2001 to 2020
To explore the distribution of SCP over the NH, we first generated 20-year averaged Do, De, and De values over the NH from 2001 to 2020 from the implemented GF-MOD10C2-SCE dataset.
3.2.1. Climatology of Snow Cover Phenology from 2001 to 2020
The spatial distributions of the 20-year averaged Do, De, and Dd over the NH from 2001 to 2020 are shown in Figure 6. The 20-year averaged Do, De, and Dd over the study area were day of year (DOY) 279.69 (±85.37), DOY 109.13 (±48.75), and 166.29 (±75.29) days, respectively, based on satellite-retrieved SCP matrixes.
As shown in Figure 6, satellite-derived SCP clearly describes the spatial patterns of Do, De, and Dd (Figure 6c) from low latitudes to high latitudes over the NH. In addition, the impacts of elevation on SCP attributes were also well represented in the satellite-retrieved SCP maps. As a result of the temperature gradient over the NH, the snow cover appears earlier in high-latitude areas around the Arctic and high-altitude regions including the Rocky Mountains, Tibetan Plateau, Sayan Mountains, and Yablonovy Mountains. Comparably, snow cover appears later in the central United States and low latitudes of Eurasia (Figure 6a). As shown in Figure 6b, the spatial distribution of De is generally the opposite to that of Do, i.e., an earlier Do typically corresponds to a later De. The combined spatial distributions of Do and De result in longer Dd in grid cells located in high latitudes and high-altitude regions (Figure 6c), but shorter Dd in areas including lower-latitude regions of the United States, Eurasia, and China.
3.2.2. Validating Snow Cover Phenology Using In Situ Observations
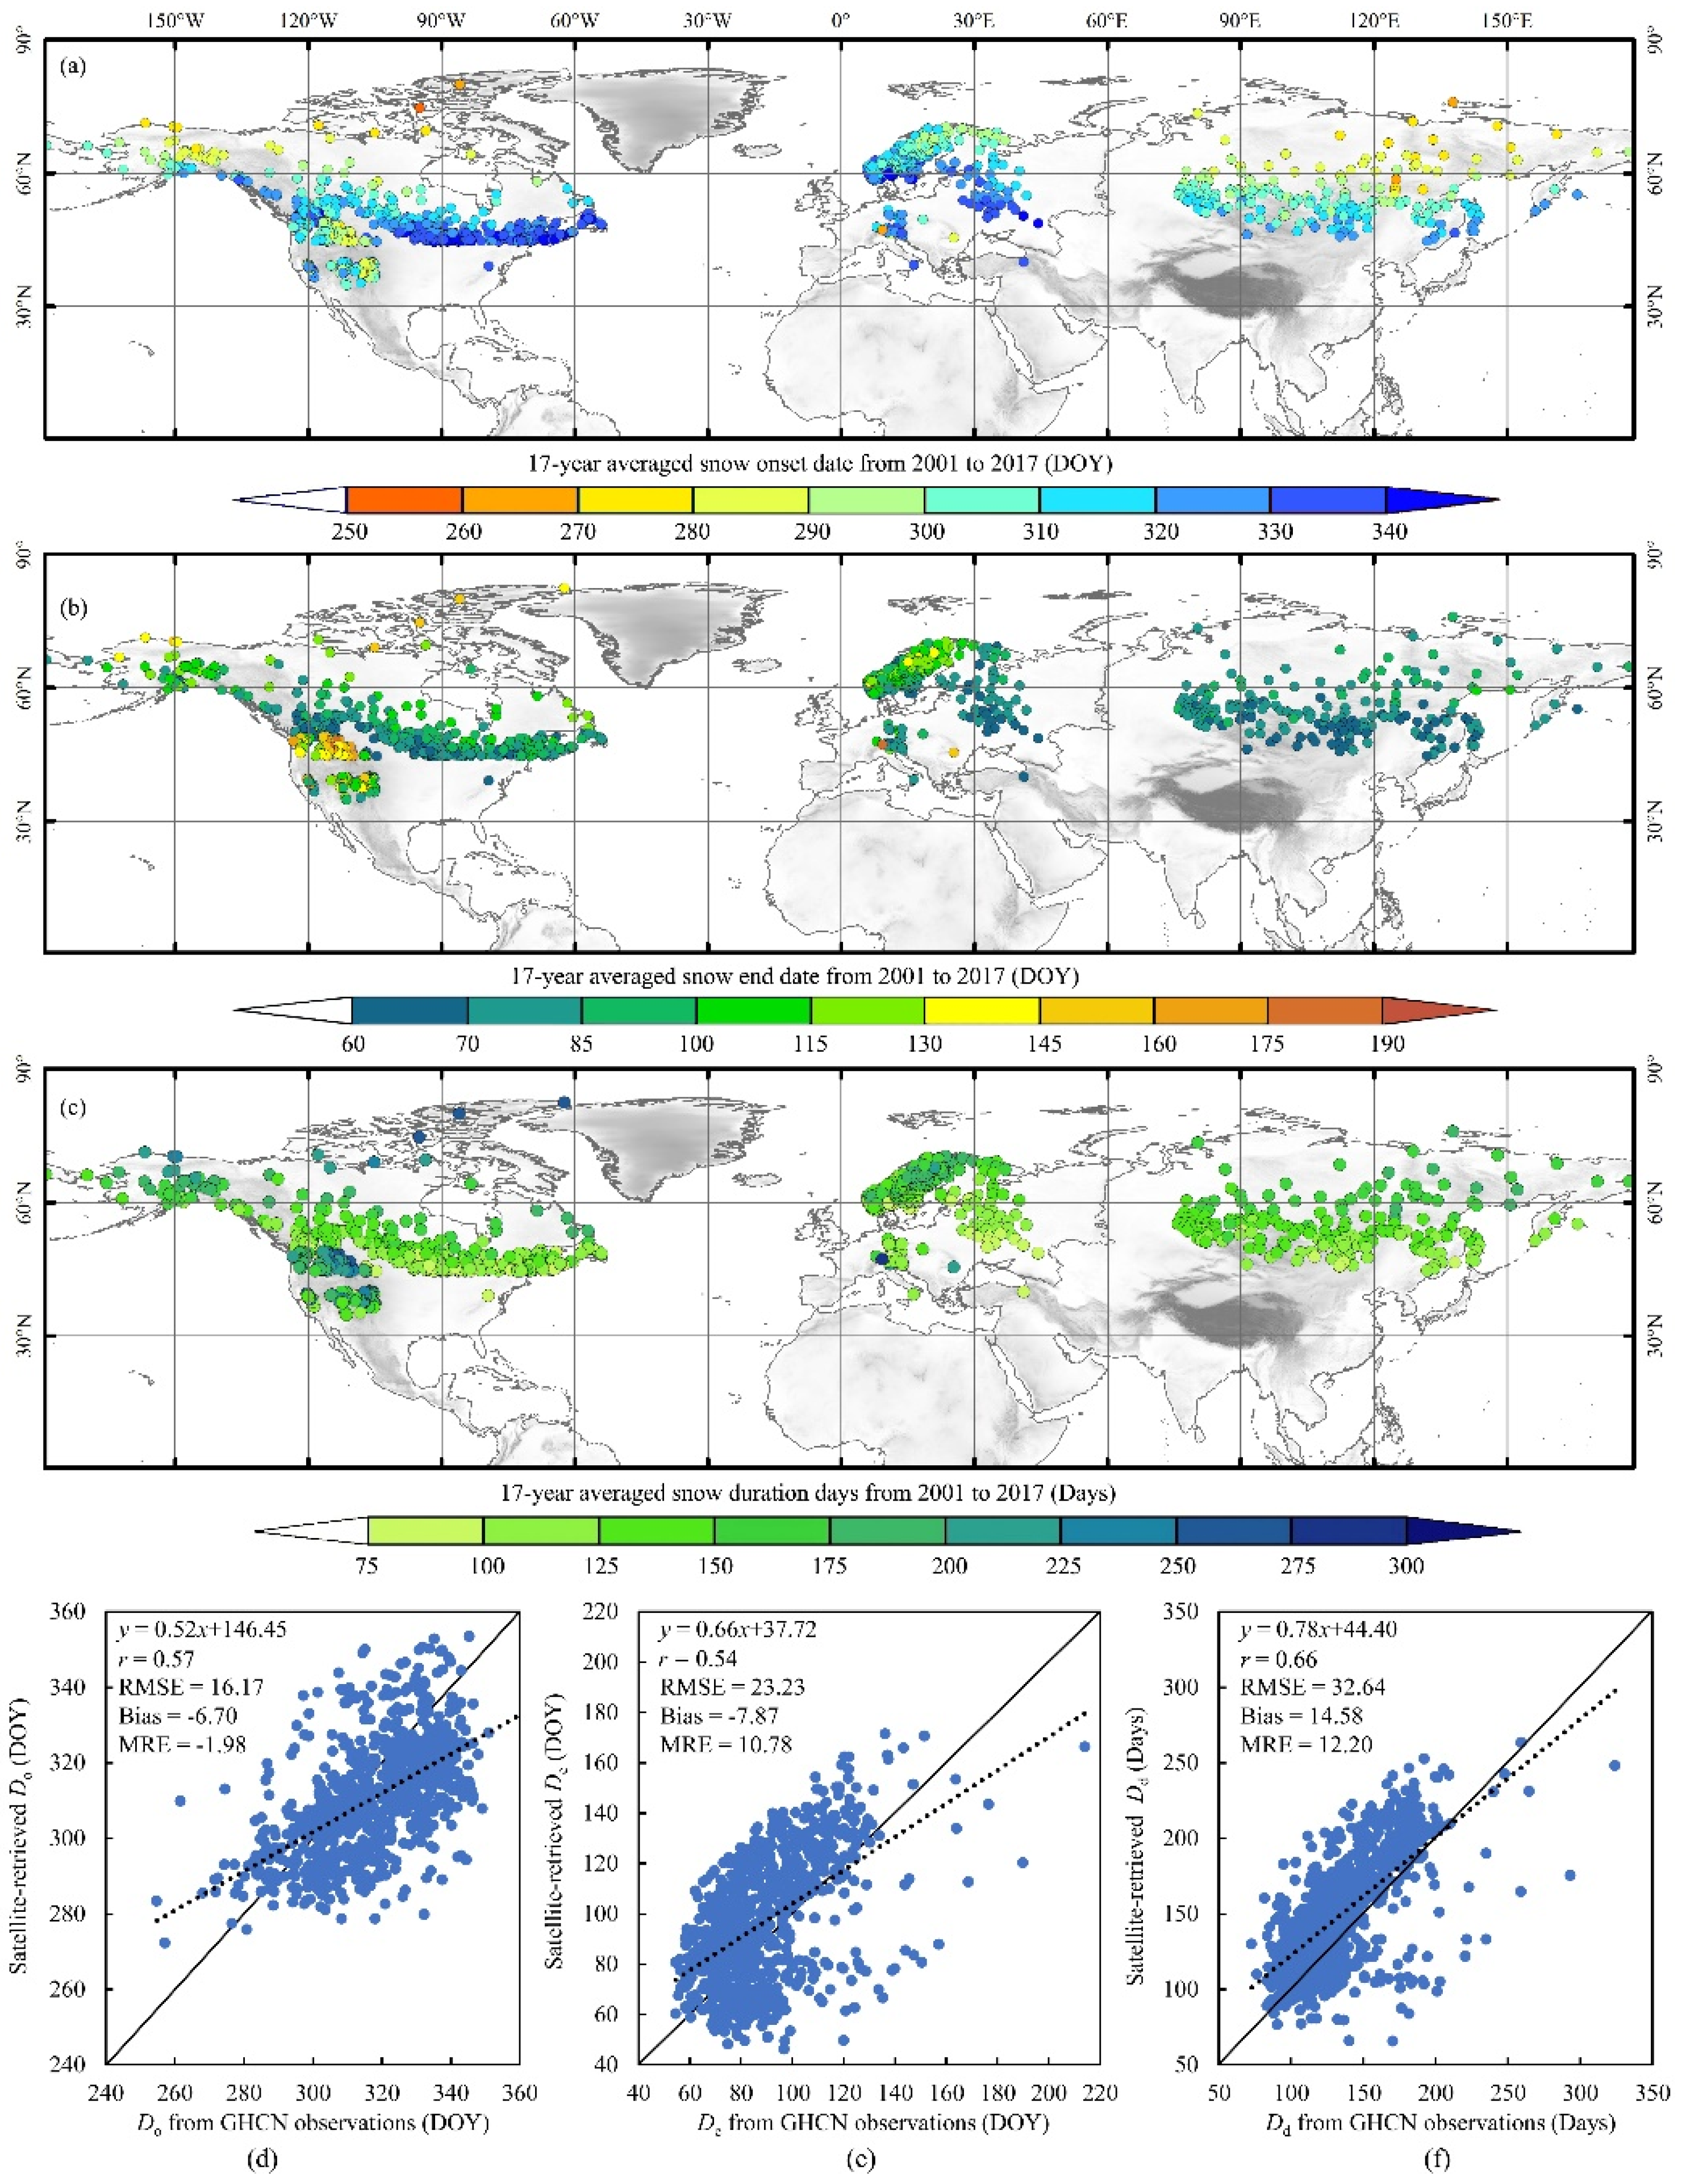
Subject to the data availability of GHCN daily snow depth observations, the accuracy of satellite-retrieved SCP using ground observations was estimated for the period of 2001–2017. The spatial distributions of 17-year averaged Do, De, and Dd values calculated from GHCN observations, as well as a comparison with satellite-retrieved SCP matrixes, are shown in Figure 7.
Similar to the satellite-retrieved SCP, clear latitudinal and altitudinal gradient patterns were observed for Do (Figure 7a), De (Figure 7b), and Dd (Figure 7c) from middle to high latitudes over the NH. At most sites, the observed Do, De, and Dd were consistent with the satellite-retrieved Do, De, and Dd results, with r values of 0.57, 0.54, and 0.66, respectively, at the 95% confidence level. However, compared with the bias in Do (−6.70 d) and De (−7.87 d), the bias in Dd (14.58 d) was much larger. This is mainly because the bias in Dd superimposes the biases in Do and De. Moreover, the value of satellite-retrieved SCP was higher than that of ground-based SCP in low Do, De, and Dd value regions, with the opposite trends in high Do, De, and Dd value regions, as demonstrated in Figure 7d–f. This phenomenon was mainly caused by the coarse spatial resolution of the satellite-retrieved SCP series from 2001 to 2017, in which the satellite-retrieved SCP provides average Do, De, and Dd values at a pixel scale of 0.05°, which cannot completely capture and reflect the “real” value of Do, De, and Dd at a specific location.
Previous research has proved that ground observations yield results that are highly dependent on the specific location (latitude and elevation). Therefore, results from ground observations mostly reflect the local conditions instead of meaningful information about the climate [49]. However, as shown in Figure 7, the satellite-retrieved Do, De, and Dd values generally captured the spatial variability of Do, De, and Dd over the NH, which proves the suitability of satellite-retrieved SCP for current climate change studies, also validated by the latitudinal distributions of Do, De, and Dd in Figure 7d–f.
3.3. Changes in Snow Cover Phenology from 2001 to 2020
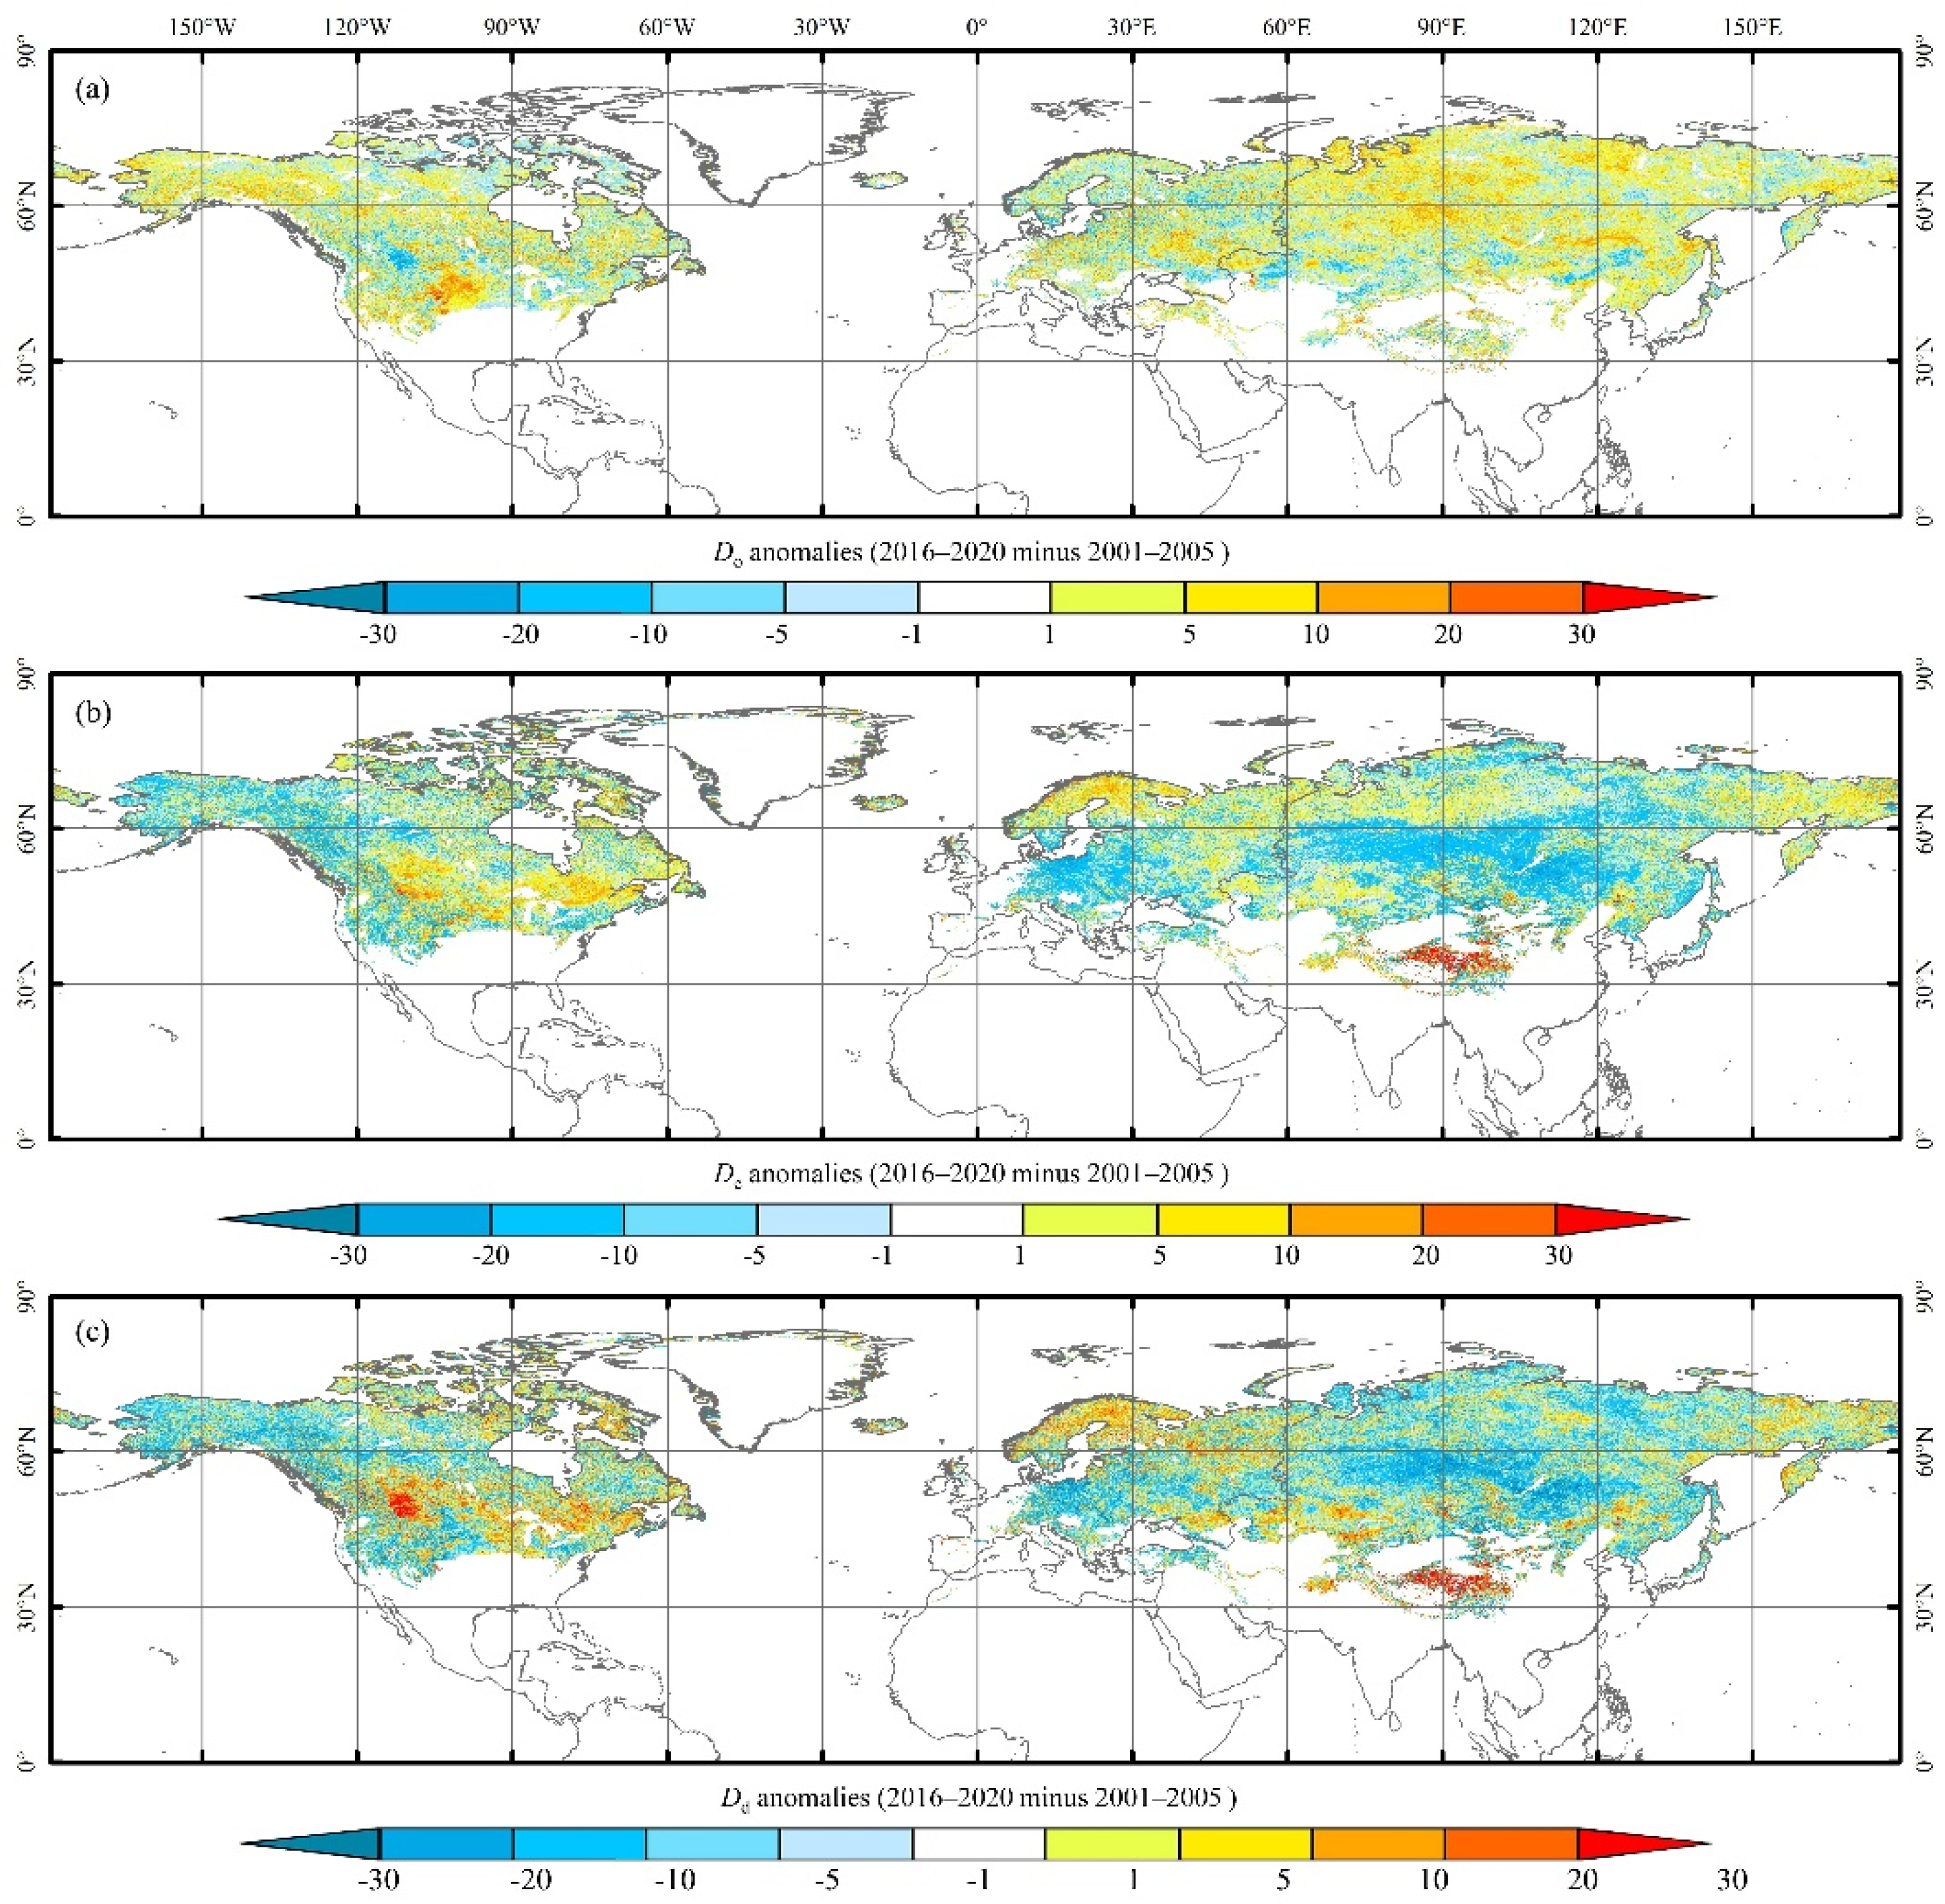
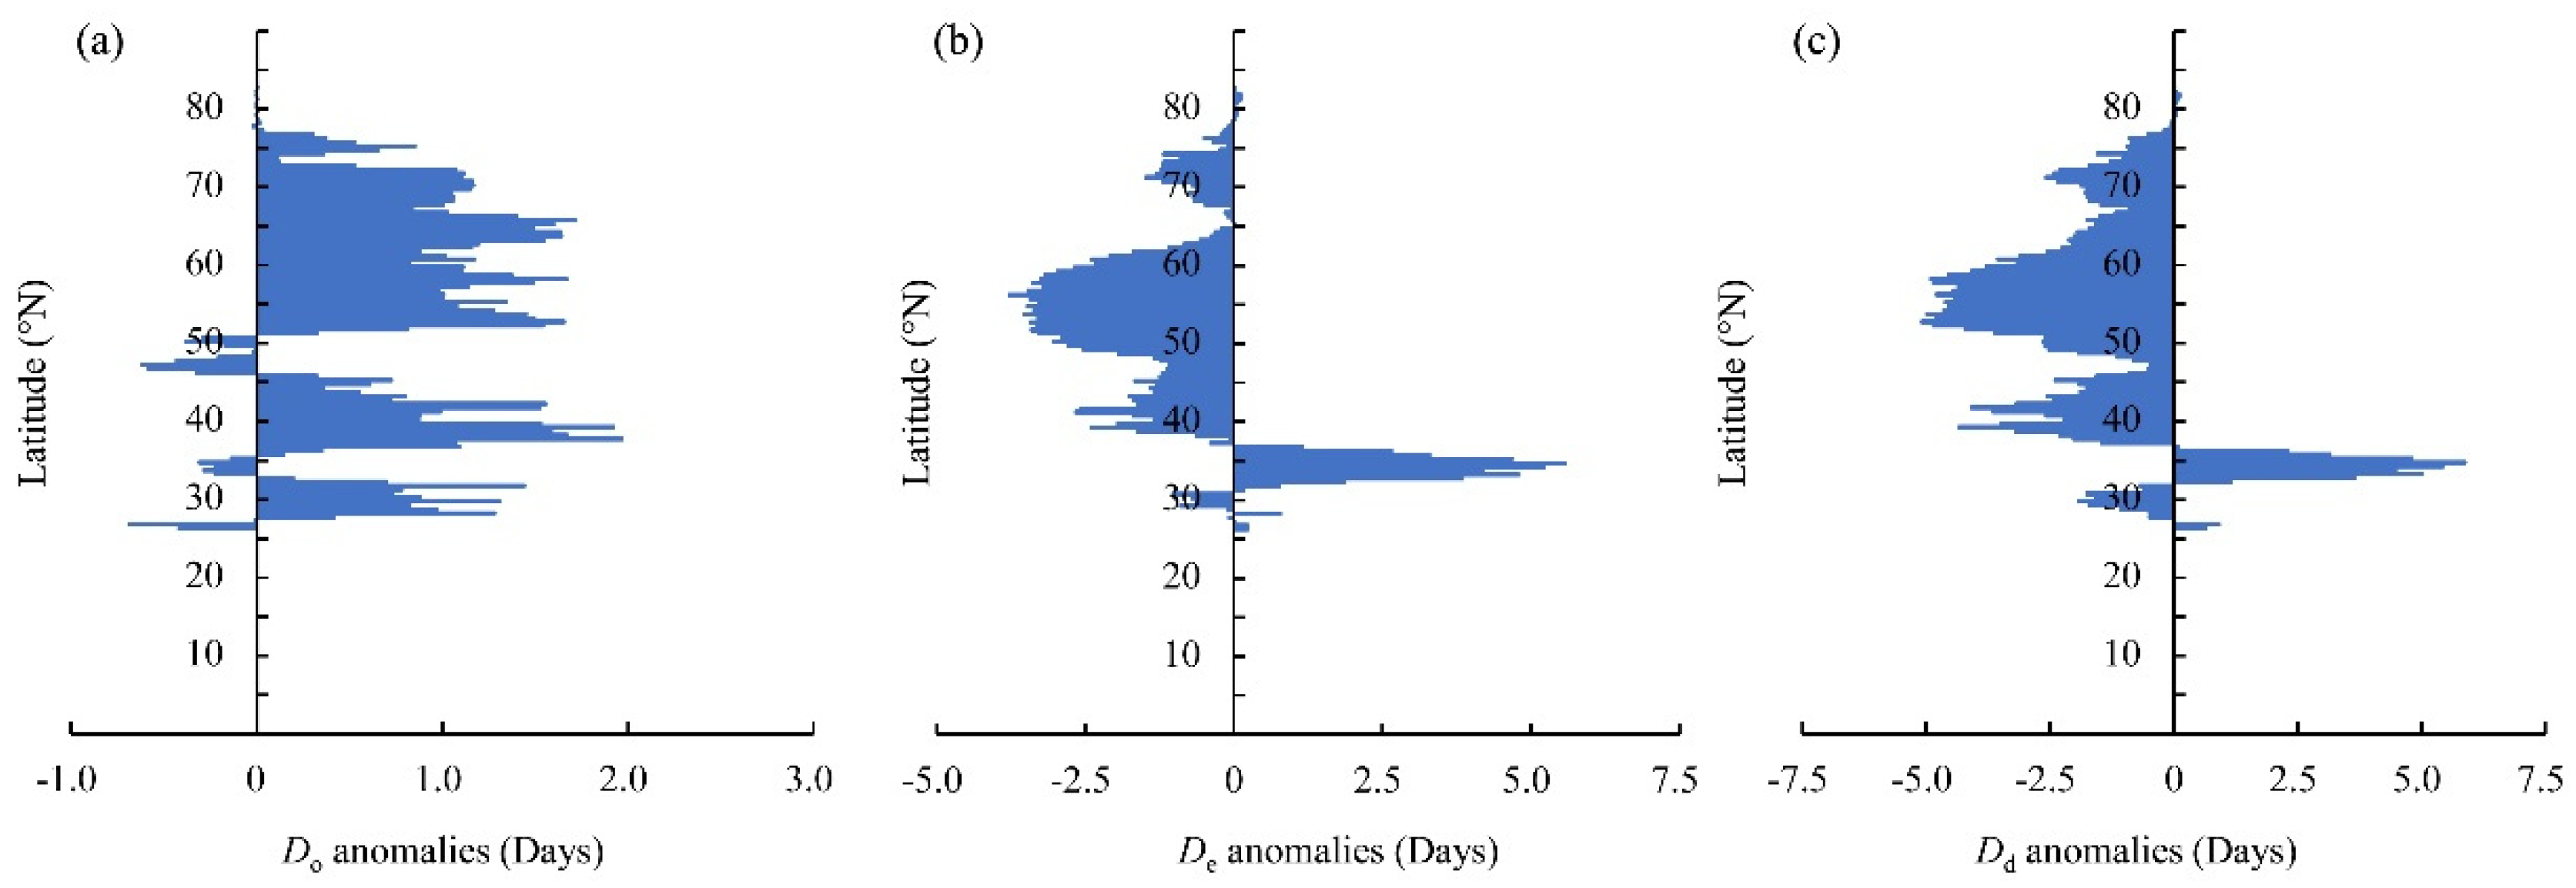
The 20-year changes in Do, De, and Dd during the period of 2001–2020 and their latitudinal distribution are displayed in Figure 8 and Figure 9. Changes are estimated using the five-year averaged SCP during 2016–2020 minus the comparable values during 2001–2005.
Compared with the five-year averaged Do in the period of 2001–2005, a general delay in Do (1.69 ± 5.93 days) was observed over the NH for the period of 2016–2020 (Figure 8a), except in the middle Rocky Mountain region around 50° N and Central Asia near 35° N (Figure 9a). Meanwhile, De exhibited a notable advance over the NH for the period of 2001–2020 (−0.94 ±5.90 days), in which De moved forward significantly at a latitude of approximately 55° N, but was delayed in the Eastern United States and northeast Tibetan Plateau (Figure 8b), which led to contrasting De anomalies over the NH from low to high latitudes (Figure 9b). The contrasting De anomalies for the period of 2001–2020 agrees with the findings of Chen et al. [24], who observed an advance in De at northern high latitudes (52–75° N) but a delay in De at northern mid-latitudes (32–52° N) at the 90% confidence level. The combination of anomalies in Do and De led to a shortened duration of snow cover (−2.63 ± 7.26 days) over the NH from 2001 to 2020 (Figure 8c and Figure 9c). In addition to the central United States, Tibetan Plateau, and Scandinavian Mountains, most grid cells within the study presented negative changes in Dd over the last two decades. Moreover, the observed Dd increase in Central North America is consistent with the increased snow cover days reported by Wang et al. [50] from 2001 to 2015 and Allchin and Déry [51] from 1971 to 2014.
3.4. Attribution of Snow Cover Phenology Changes over the NH
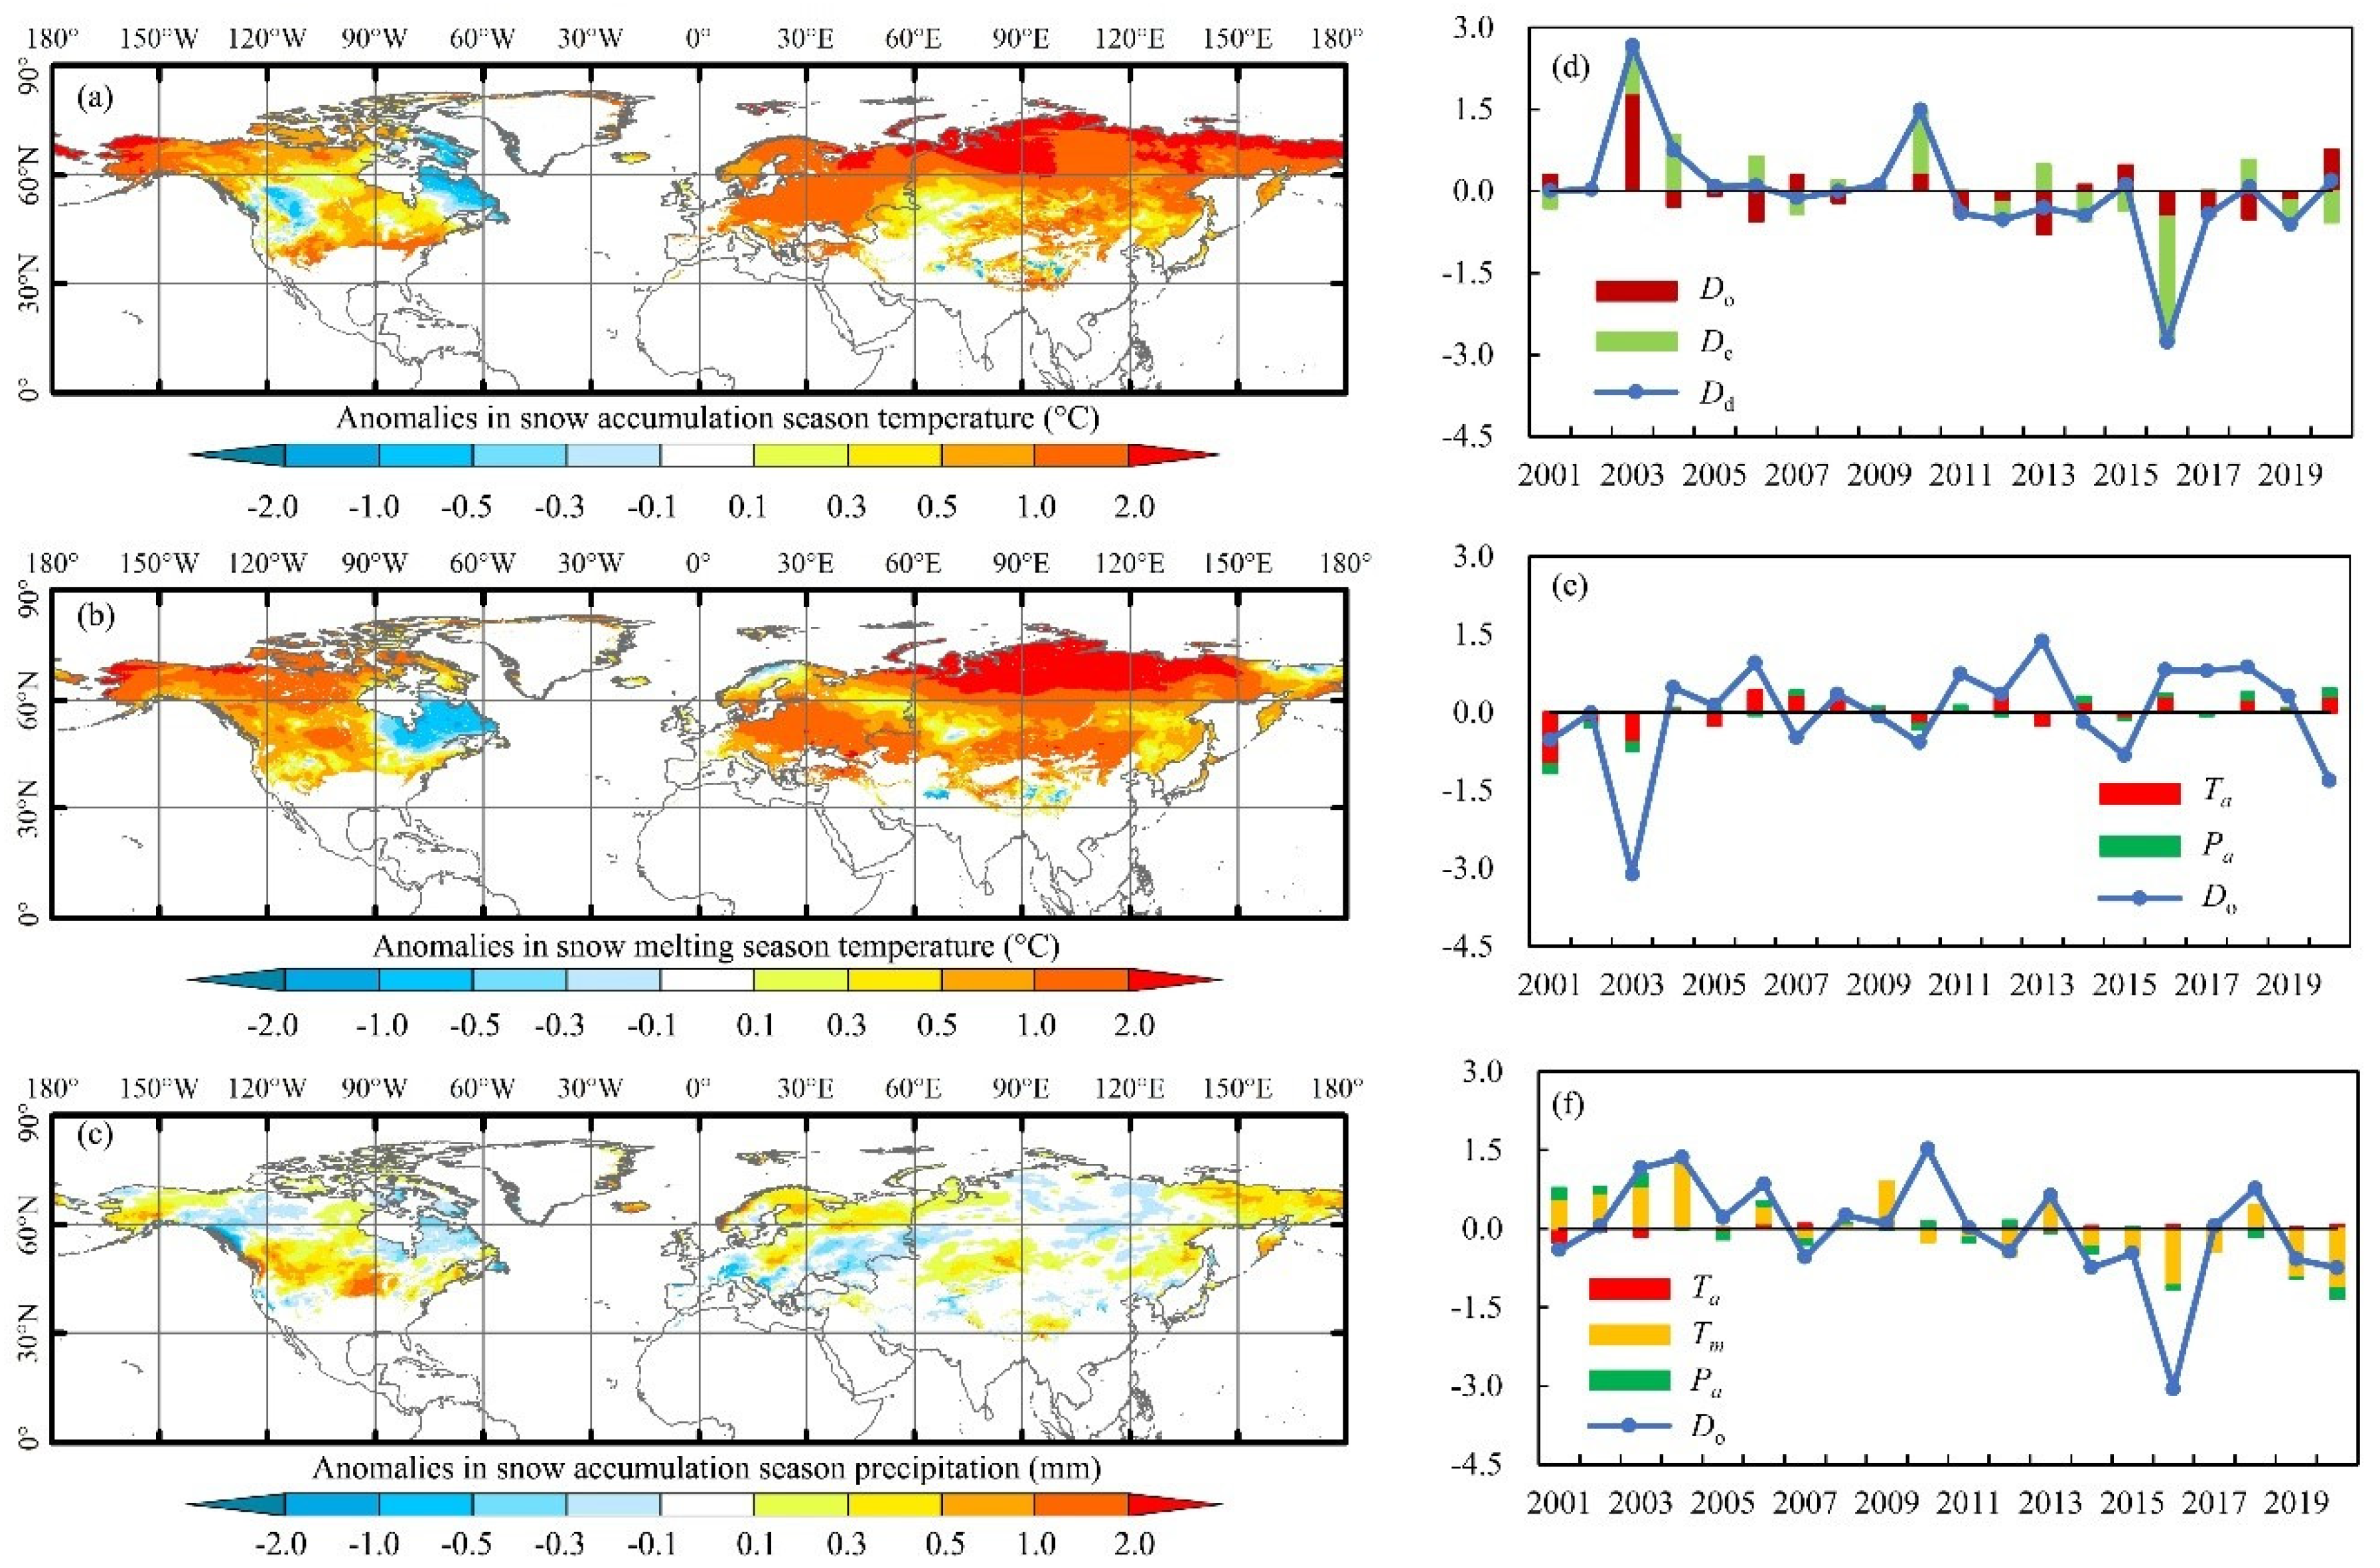
The snow accumulation season temperature, Ta, precipitation, Pa, and snow melting season temperature, Tm, were employed to attribute the anomalies in the SCP over the NH during 2001–2020. The spatial distributions of changes in Ta, Pa, and Tm are shown in Figure 10a–c. The attribution analysis of the SCP is presented in Figure 10d–f. The Ta (Figure 10a) and Tm (Figure 10b) values displayed a general warming trend over the NH from 2001 to 2020. This is reasonable according to the latest WMO Statement on the State of the Global Climate [32], as the past five years (2015–2019) are the five warmest on record. Moreover, both Ta and Tm exhibited significant latitude differences under the influence of decreasing snow cover and sea-ice extent [25,26,27,28], in which the temperature increased at a higher rate in high latitudes and at a much lower rate in middle latitudes. The anomalies in Ta and Tm over the NH during 2001–2020 agree with the land surface temperature anomalies mapped from the Goddard Institute for Space Studies (GISS) (https://data.giss.nasa.gov/gistemp/maps/) based on the latest GHCN Monthly version 4 [52]. In addition, changes in atmospheric circulation [29] and human activity [30,31] resulted in a notable increase in precipitation during the snow accumulation season, Pa (Figure 10c), in the Central United States, Tibetan Plateau, Northern Europe, and Northeastern Russia, but led to a significant decline in Pa in Central Russia, Northeast Canada, and Southern Europe.
The interannual variability analysis revealed a shortening trend in Dd over the NH from 2001 through 2020 at a rate of −1.64 days decade−1 (p < 0.05). Owing to an exceptionally strong El Niño, 2016 was the warmest year on record in all major global surface temperature datasets [53], which resulted in the shortest Dd in the past two decades. The attribution analysis of Dd anomalies over the NH during 2001–2020 is displayed in Figure 10d, in which anomalies in Dd are highly correlated with variabilities in Do and De. Moreover, Pearson correlation analysis of Do, De, and Dd revealed significant relationships between De and Dd (r = 0.82, p < 0.01) over the 2001–2020 period. Correlations between Do and Dd (r = 0.66, p < 0.01) were also significant. Considering that there were no statistically significant changes in Do, Dd changes over the NH from 2001 to 2020 are mostly attributed to changes in De.
The attribution analysis of Do and De is demonstrated in Figure 10e,f. The contributions of each variable to Do and De variability were computed annually to display the changing influence of climate variables on underlying SCP variability. An analysis of linear correlations of Do with Ta and Pa over the snow accumulation season revealed that Do was largely determined by Ta anomalies (Figure 10e). Meanwhile, a similar analysis revealed that changes in De were highly correlated with Ta, Tm, and Pa at the 95% confidence level. However, compared with contributions from Ta and Pa, Tm dominated De anomalies over the NH from 2001 to 2020 (Figure 10f).
4. Discussion
Accurate estimates of SCP are highly relevant for improving atmospheric reanalysis [54], climate predictions [55], and climate projections. To overcome the shortage of individual datasets in the SCP retrieve, in situ measurements are highly dependent on the location (latitude and elevation) and limited in spatial coverage, visible and near-infrared satellite data are largely influenced by cloud coverage, and it is difficult to distinguish wet and shallow snow in PM snow maps, this study employed the combination of MOD10C2 and IMS prior to the retrieval of SCP matrices. The combination of MOD10C2 and IMS data largely reduced the error in retrieved SCP caused by missing observations in optical SCE products.
Validating satellite-retrieved SCP matrixes using field measurements involves uncertainties because there is a large spatial bias between satellite-retrieved SCP at a spatial resolution of 0.05° and ground measurements at specific locations. Moreover, the different temporal resolution between satellite-retrieved SCP and ground measurements may result in systematic bias in the cross validation process. However, the validation of satellite-retrieved SCP matrixes using GHCN ground-based snow depth observations indicated that satellite-retrieved SCP matrixes can generally capture the “real” distributions of Do (r = 0.57), De (r = 0.54), and Dd (r = 0.66) at the 95% significance level, which indicate the fitness of using satellite-retrieved SCP in climate change studies over the NH.
Based on satellite-retrieved SCP matrixes, this study reported a delayed Do, associated with an advanced De over the NH from 2001 to 2020. The above findings are consistent with the published results of Choi et al. [22] and Chen et al. [24], who reported that changes in SCP are largely determined by De anomalies for the periods of 1967–2008 and 2001–2014. However, the results are in contrast with the findings reported by Allchin and Déry [56], who observed shifting spatial and temporal patterns in the onset of seasonally snow-dominated conditions in the NH from 1972 to 2017. Because the attribution analysis is significantly influenced by temporal coverage, the different time interval may be the possible reason for the inconsistency of the analysis results.
According to the latest climate projections, the reduction of NH SCE will continue in the future [20,57], along with hemispheric land surface warming and a positive feedback on the Earth’s climate system through snow-albedo mechanisms [1,18,19,58]. Therefore, the response of SCP to SCE reduction should be investigated in future studies. Moreover, reductions in terrestrial snow cover accounted for one-third of the Arctic albedo decline from 1982 to 2014 [59]. Thus, a coupled study between terrestrial snow cover and Arctic sea ice should be conducted in the future.
5. Conclusions
With the help of satellite-retrieved snow cover observations, ground-based snow depth records, and reanalysis climate variables, this study explored the SCP distribution and its causes over the NH in the past two decades from 2001 to 2020, which are important data for current cryosphere change studies and future climate projections.
The observed longterm anomalies in SCE over the NH demonstrated that, compared with the monthly averaged SCE in the earlier period of 1966–2000, the later period of 2001–2020 exhibited an increased SCE in the snow accumulation season from September to November, but a decreased SCE in the snow melting season from May to August in the later period of 2001–2020. The enhanced seasonal SCE differences between snow accumulation season and melting season led to corresponding SCP anomalies. The climatology of 20-year averaged Do, De, and Dd over the NH from 2001 to 2020 are well represented in spatial and temporal by satellite-retrieved SCP matrixes. Moreover, the validation results by using 850 GHCN snow depth observations revealed that satellite-retrieved SCP matrixes generally capture the spatial variability of Do, De, and Dd at the 95% significance level during the overlapping period of 2001–2017, which makes it reasonable to employ satellite-retrieved SCP in climate change studies.
Based on satellite-retrieved SCP matrixes, this study reported a delay in Do (1.69 ± 5.93 days) and an advanced De (−0.94 ± 5.90 days) over the NH for the period of 2016–2020, compared with the period of 2001–2005. The combination of anomalies in Do and De result in a shortened Dd (−2.63 ± 7.26 days) over the NH at the corresponding period. Moreover, Pearson correlation analysis revealed that changes in Dd are highly correlated with variabilities in both Do and De. However, linear analysis displayed unnoticed changes in Do. Therefore, Dd changes over the NH from 2001 to 2020 are mostly attributed to anomalies in De. Furthermore, attribution analysis revealed that the increased melting season temperature is a key driving factor of De anomalies over the NH from 2001 to 2020. Compared with total precipitation, surface air temperature should be of high concern in SCP analysis.
Although the distribution and attribution of NH SCP has been discussed in previous research, this study provides better results with finer spatial resolution and present the latest SCP changes, which is necessary in the rapid climate change background. Hence, we believe that our study benefits understanding of terrestrial SCP changes and related climate projection studies in response to surface warming in the past decades.
Author Contributions
Conceptualization, X.C. and Y.Y.; methodology, X.C.; software, Y.M.; validation, X.C., Y.M., and H.L.; formal analysis, X.C.; investigation, Y.M. and X.C.; resources, X.C.; data curation, X.C. and H.L.; writing—original draft preparation, X.C.; writing—review and editing, X.C., Y.M., and H.L.; visualization, X.C.; supervision, Y.Y.; project administration, Y.Y.; funding acquisition, X.C. All authors have read and agreed to the published version of the manuscript.
Funding
This work was jointly supported by the National Natural Science Foundation of China (No. 42001377), the comprehensive survey of biodiversity over the Mongolian Plateau (No. 2019FY102001), and the National Earth System Science Data Sharing Infrastructure (No. 2005DKA32300).
Institutional Review Board Statement
Not applicable.
Informed Consent Statement
Not applicable.
Data Availability Statement
The data presented in this study are openly available in Hall and Riggs at https://0-doi-org.brum.beds.ac.uk/10.5067/MODIS/MOD10C2.006 [36], U.S. National Ice Center at https://0-doi-org.brum.beds.ac.uk/10.7265/N52R3PMC [37], Robinson et al. at 10.7289/V5N014G9 [35], and Muñoz Sabater at 10.24381/cds.68d2bb30 [44]. Moreover, the GHCN-Daily can be found at https://www.ncdc.noaa.gov/ghcnd-data-access.
Acknowledgments
We acknowledge the three anonymous reviewers for their valuable comments and suggestions. Moreover, we would like to thank the National Snow and Ice Data Center of United States (https://nsidc.org/) for the online available MOD10C2 and IMS datasets, the Rutgers University Global Snow Lab for the online available NH snow cover extent chart product, as well as the Copernicus Climate Change Service for the online available ECMWF ERA5-Land reanalysis 2-m temperature and total precipitation datasets. Furthermore, we would like to thank all people fighting with COVID-19.
Conflicts of Interest
The authors declare no conflict of interest.
Appendix

Table A1.
Abbreviations used in this study.
| Abbreviations | Definitions |
|---|---|
| SCP | snow cover phenology |
| NH | Northern Hemisphere |
| SCE | Snow cover extent |
| SCF | Snow cover fraction |
| SProb | Snow cover probability |
| Do | Snow onset date |
| De | Snow end date |
| Dd | Snow duration days |
| MOD10C2 | 8-day Level 3 snow cover fraction products derived from the Moderate Resolution Imaging Spectroradiometer Satellite |
| IMS | Interactive Multi-sensor Snow and Ice Mapping System |
| NH SCE CDR | Northern Hemisphere Snow Cover Extent Climate Data Record |
| GHCN | Global Historical Climatology Network |
| RMSE | Root Mean Square Error |
| MRE | Mean Relative Error |
| Ta | Surface air temperature in snow accumulation season |
| Tm | Surface air temperature in snow melting season |
| Pa | Precipitation in snow accumulation season |
| Pm | Precipitation in snow melting season |
References
- Flanner, M.G.; Shell, K.M.; Barlage, M.; Perovich, D.K.; Tschudi, M.A. Radiative forcing and albedo feedback from the Northern Hemisphere cryosphere between 1979 and 2008. Nat. Geosci. 2011, 4, 151–155. [Google Scholar] [CrossRef]
- Chen, X.; Liang, S.; Cao, Y. Satellite observed changes in the Northern Hemisphere snow cover phenology and the associated radiative forcing and feedback between 1982 and 2013. Environ. Res. Lett. 2016, 11, 084002. [Google Scholar] [CrossRef]
- Thackeray, C.W.; Fletcher, C.G. Snow albedo feedback: Current knowledge, importance, outstanding issues and future directions. Prog. Phys. Geogr. 2016, 40, 392–408. [Google Scholar] [CrossRef]
- Henderson, G.R.; Peings, Y.; Furtado, J.C.; Kushner, P.J. Snow–atmosphere coupling in the Northern Hemisphere. Nat. Clim. Chang. 2018, 8, 954–963. [Google Scholar] [CrossRef]
- Immerzeel, W.W.; Lutz, A.F.; Andrade, M.; Bahl, A.; Biemans, H.; Bolch, T.; Hyde, S.; Brumby, S.; Davies, B.J.; Elmore, A.C.; et al. Importance and vulnerability of the world’s water towers. Nature 2019. [Google Scholar] [CrossRef]
- Barnett, T.P.; Adam, J.C.; Lettenmaier, D.P. Potential impacts of a warming climate on water availability in snow-dominated regions. Nature 2005, 438, 303–309. [Google Scholar] [CrossRef]
- Pulliainen, J.; Luojus, K.; Derksen, C.; Mudryk, L.; Lemmetyinen, J.; Salminen, M.; Ikonen, J.; Takala, M.; Cohen, J.; Smolander, T.; et al. Patterns and trends of Northern Hemisphere snow mass from 1980 to 2018. Nature 2020, 581, 294–298. [Google Scholar] [CrossRef] [PubMed]
- Ma, N.; Yu, K.; Zhang, Y.; Zhai, J.; Zhang, Y.; Zhang, H. Ground observed climatology and trend in snow cover phenology across China with consideration of snow-free breaks. Clim. Dyn. 2020, 55, 2867–2887. [Google Scholar] [CrossRef]
- Johansson, M.; Callaghan, T.V.; Bosiö, J.; Åkerman, H.J.; Jackowicz-Korczynski, M.; Christensen, T.R. Rapid responses of permafrost and vegetation to experimentally increased snow cover in sub-arctic Sweden. Environ. Res. Lett. 2013, 8, 035025. [Google Scholar] [CrossRef] [Green Version]
- Wang, X.; Wu, C.; Peng, D.; Gonsamo, A.; Liu, Z. Snow cover phenology affects alpine vegetation growth dynamics on the Tibetan Plateau: Satellite observed evidence, impacts of different biomes, and climate drivers. Agric. For. Meteorol. 2018, 256, 61–74. [Google Scholar] [CrossRef]
- Chen, X.; Yang, Y. Observed earlier start of the growing season from middle to high latitudes across the Northern Hemisphere snow-covered landmass for the period 2001–2014. Environ. Res. Lett. 2020. [Google Scholar] [CrossRef]
- Pulliainen, J.; Aurela, M.; Laurila, T.; Aalto, T.; Takala, M.; Salminen, M.; Kulmala, M.; Barr, A.; Heimann, M.; Lindroth, A.; et al. Early snowmelt significantly enhances boreal springtime carbon uptake. Proc. Natl. Acad. Sci. USA 2017, 114, 11081–11086. [Google Scholar] [CrossRef] [Green Version]
- Peng, S.; Piao, S.; Ciais, P.; Friedlingstein, P.; Zhou, L.; Wang, T. Change in snow phenology and its potential feedback to temperature in the Northern Hemisphere over the last three decades. Environ. Res. Lett. 2013, 8, 014008. [Google Scholar] [CrossRef] [Green Version]
- Qin, Y.; Abatzoglou, J.T.; Siebert, S.; Huning, L.S.; AghaKouchak, A.; Mankin, J.S.; Hong, C.; Tong, D.; Davis, S.J.; Mueller, N.D. Agricultural risks from changing snowmelt. Nat. Clim. Chang. 2020, 10, 459–465. [Google Scholar] [CrossRef]
- Diffenbaugh, N.S.; Scherer, M.; Ashfaq, M. Response of snow-dependent hydrologic extremes to continued global warming. Nat. Clim. Chang. 2013, 3, 379–384. [Google Scholar] [CrossRef] [PubMed] [Green Version]
- Déry, S.J.; Brown, R.D. Recent Northern Hemisphere snow cover extent trends and implications for the snow-albedo feedback. Geophys. Res. Lett. 2007, 34, L22504. [Google Scholar] [CrossRef]
- Derksen, C.; Brown, R. Spring snow cover extent reductions in the 2008-2012 period exceeding climate model projections. Geophys. Res. Lett. 2012, 39, L19504. [Google Scholar] [CrossRef] [Green Version]
- Brown, R.D.; Robinson, D.A. Northern Hemisphere spring snow cover variability and change over 1922–2010 including an assessment of uncertainty. Cryosphere 2011, 5, 219–229. [Google Scholar] [CrossRef] [Green Version]
- Brown, R.; Derksen, C.; Wang, L. A multi-data set analysis of variability and change in Arctic spring snow cover extent, 1967–2008. J. Geophys. Res. Atmos. 2010, 115, D16111. [Google Scholar] [CrossRef]
- Mudryk, L.; Santolaria-Otín, M.; Krinner, G.; Ménégoz, M.; Derksen, C.; Brutel-Vuilmet, C.; Brady, M.; Essery, R. Historical Northern Hemisphere snow cover trends and projected changes in the CMIP6 multi-model ensemble. Cryosphere 2020, 14, 2495–2514. [Google Scholar] [CrossRef]
- Hori, M.; Sugiura, K.; Kobayashi, K.; Aoki, T.; Tanikawa, T.; Kuchiki, K.; Niwano, M.; Enomoto, H. A 38-year (1978–2015) Northern Hemisphere daily snow cover extent product derived using consistent objective criteria from satellite-borne optical sensors. Remote Sens. Environ. 2017, 191, 402–418. [Google Scholar] [CrossRef]
- Choi, G.; Robinson, D.A.; Kang, S. Changing Northern Hemisphere Snow Seasons. J. Clim. 2010, 23, 5305–5310. [Google Scholar] [CrossRef]
- Wang, L.; Derksen, C.; Brown, R.; Markus, T. Recent changes in pan-Arctic melt onset from satellite passive microwave measurements. Geophys. Res. Lett. 2013, 40, 522–528. [Google Scholar] [CrossRef]
- Chen, X.; Liang, S.; Cao, Y.; He, T.; Wang, D. Observed contrast changes in snow cover phenology in northern middle and high latitudes from 2001–2014. Sci. Rep. 2015, 5, 16820. [Google Scholar] [CrossRef] [Green Version]
- Tang, Q.; Zhang, X.; Francis, J.A. Extreme summer weather in northern mid-latitudes linked to a vanishing cryosphere. Nat. Clim. Chang. 2013, 4, 45–50. [Google Scholar] [CrossRef]
- Francis, J.A.; Vavrus, S.J. Evidence linking Arctic amplification to extreme weather in mid-latitudes. Geophys. Res. Lett. 2012, 39, L06801. [Google Scholar] [CrossRef]
- Cohen, J.; Screen, J.A.; Furtado, J.C.; Barlow, M.; Whittleston, D.; Coumou, D.; Francis, J.; Dethloff, K.; Entekhabi, D.; Overland, J.; et al. Recent Arctic amplification and extreme mid-latitude weather. Nat. Geosci. 2014, 7, 627–637. [Google Scholar] [CrossRef] [Green Version]
- Screen, J.A. Arctic amplification decreases temperature variance in northern mid—To high-latitudes. Nat. Clim. Chang. 2014, 4, 577–582. [Google Scholar] [CrossRef] [Green Version]
- Mölg, T.; Maussion, F.; Scherer, D. Mid-latitude westerlies as a driver of glacier variability in monsoonal High Asia. Nat. Clim. Chang. 2013, 4, 68–73. [Google Scholar] [CrossRef]
- Min, S.K.; Zhang, X.; Zwiers, F. Human-induced Arctic moistening. Science 2008, 320, 518–520. [Google Scholar] [CrossRef]
- Swann, A.L.; Fung, I.Y.; Chiang, J.C. Mid-latitude afforestation shifts general circulation and tropical precipitation. Proc. Natl. Acad. Sci. USA 2012, 109, 712–716. [Google Scholar] [CrossRef] [Green Version]
- WMO. WMO Statement on the State of the Global Climate in 2019; WMO: Geneva, Switzerland, 2020. [Google Scholar]
- Cohen, J.L.; Furtado, J.C.; Barlow, M.A.; Alexeev, V.A.; Cherry, J.E. Arctic warming, increasing snow cover and widespread boreal winter cooling. Environ. Res. Lett. 2012, 7, 014007. [Google Scholar] [CrossRef]
- Riggs, G.A.; Hall, D.K.; Román, M.O. MODIS Snow Products Collection 6 User Guide. 2016. Available online: https://modis-snow-ice.gsfc.nasa.gov/uploads/C6_MODIS_Snow_User_Guide.pdf (accessed on 15 September 2020).
- Estilow, T.W.; Young, A.H.; Robinson, D.A. A long-term Northern Hemisphere snow cover extent data record for climate studies and monitoring. Earth Syst. Sci. Data 2015, 7, 137–142. [Google Scholar] [CrossRef] [Green Version]
- Hall, D.K.; Riggs, G.A.; Salomonson, V.V. Development of methods for mapping global snow cover using moderate resolution imaging spectroradiometer data. Remote Sens. Environ. 1995, 54, 127–140. [Google Scholar] [CrossRef]
- Helfrich, S.R.; McNamara, D.; Ramsay, B.H.; Baldwin, T.; Kasheta, T. Enhancements to, and forthcoming developments in the Interactive Multisensor Snow and Ice Mapping System (IMS). Hydrol. Process. 2007, 21, 1576–1586. [Google Scholar] [CrossRef]
- Frei, A.; Tedesco, M.; Lee, S.; Foster, J.; Hall, D.K.; Kelly, R.; Robinson, D.A. A review of global satellite-derived snow products. Adv. Space Res. 2012, 50, 1007–1029. [Google Scholar] [CrossRef] [Green Version]
- Yu, J.; Zhang, G.; Yao, T.; Xie, H.; Zhang, H.; Ke, C.; Yao, R. Developing Daily Cloud-Free Snow Composite Products from MODIS Terra–Aqua and IMS for the Tibetan Plateau. IEEE Trans. Geosci. Remote Sens. 2016, 54, 2171–2180. [Google Scholar] [CrossRef]
- Chen, X.; Long, D.; Liang, S.; He, L.; Zeng, C.; Hao, X.; Hong, Y. Developing a composite daily snow cover extent record over the Tibetan Plateau from 1981 to 2016 using multisource data. Remote Sens. Environ. 2018, 215, 284–299. [Google Scholar] [CrossRef]
- Chen, C.; Lakhankar, T.; Romanov, P.; Helfrich, S.; Powell, A.; Khanbilvardi, R. Validation of NOAA-Interactive Multisensor Snow and Ice Mapping System (IMS) by Comparison with Ground-Based Measurements over Continental United States. Remote Sens. 2012, 4, 1134–1145. [Google Scholar] [CrossRef] [Green Version]
- Menne, M.J.; Durre, I.; Vose, R.S.; Gleason, B.E.; Houston, T.G. An Overview of the Global Historical Climatology Network-Daily Database. J. Atmos. Ocean. Technol. 2012, 29, 897–910. [Google Scholar] [CrossRef]
- Chen, Y.; Sharma, S.; Zhou, X.; Yang, K.; Li, X.; Niu, X.; Hu, X.; Khadka, N. Spatial performance of multiple reanalysis precipitation datasets on the southern slope of central Himalaya. Atmos. Res. 2021, 250, 105365. [Google Scholar] [CrossRef]
- Muñoz Sabater, J. ERA5-Land monthly averaged data from 1981 to present. Copernicus Climate Change Service (C3S) Climate Data Store (CDS). 2019. Available online: https://cds.climate.copernicus.eu/cdsapp#!/home (accessed on 30 September 2020).
- Harris, I.; Osborn, T.J.; Jones, P.; Lister, D. Version 4 of the CRU TS monthly high-resolution gridded multivariate climate dataset. Sci. Data 2020, 7, 109. [Google Scholar] [CrossRef] [PubMed] [Green Version]
- Wipfler, E.L.; Metselaar, K.; van Dam, J.C.; Feddes, R.A.; van Meijgaard, E.; van Ulft, L.H.; van den Hurk, B.; Zwart, S.J.; Bastiaanssen, W.G.M. Seasonal evaluation of the land surface scheme HTESSEL against remote sensing derived energy fluxes of the Transdanubian region in Hungary. Hydrol. Earth Syst. Sci. 2011, 15, 1257–1271. [Google Scholar] [CrossRef] [Green Version]
- Scipal, K.; Beljaars, A.; Balsamo, G.; Viterbo, P.; van den Hurk, B.; Hirschi, M.; Betts, A.K. A Revised Hydrology for the ECMWF Model: Verification from Field Site to Terrestrial Water Storage and Impact in the Integrated Forecast System. J. Hydrometeorol. 2009, 10, 623–643. [Google Scholar] [CrossRef]
- Brutel-Vuilmet, C.; Ménégoz, M.; Krinner, G. An analysis of present and future seasonal Northern Hemisphere land snow cover simulated by CMIP5 coupled climate models. Cryosphere 2013, 7, 67–80. [Google Scholar] [CrossRef] [Green Version]
- Hansen, J.; Ruedy, R.; Sato, M.; Lo, K. Global Surface Temperature Change. Rev. Geophys. 2010, 48, RG4004. [Google Scholar] [CrossRef] [Green Version]
- Wang, Y.; Huang, X.; Liang, H.; Sun, Y.; Feng, Q.; Liang, T. Tracking Snow Variations in the Northern Hemisphere Using Multi-Source Remote Sensing Data (2000–2015). Remote Sens. 2018, 10, 136. [Google Scholar] [CrossRef] [Green Version]
- Allchin, M.I.; Déry, S.J. A spatio-temporal analysis of trends in Northern Hemisphere snow-dominated area and duration, 1971–2014. Ann. Glaciol. 2018, 58, 21–35. [Google Scholar] [CrossRef] [Green Version]
- Lenssen, N.; Schmidt, G.; Hansen, J.; Menne, M.; Persin, A.; Ruedy, R.; Zyss, D. Improvements in the GISTEMP Uncertainty Model. J. Geophys. Res. Atmos. 2019, 124, 6307–6326. [Google Scholar] [CrossRef]
- WMO. WMO Statement on the State of the Global Climate in 2016; WMO: Geneva, Switzerland, 2017. [Google Scholar]
- Batrak, Y.; Muller, M. On the warm bias in atmospheric reanalyses induced by the missing snow over Arctic sea-ice. Nat. Commun. 2019, 10, 4170. [Google Scholar] [CrossRef] [PubMed]
- Peers, M.J.L.; Majchrzak, Y.N.; Menzies, A.K.; Studd, E.K.; Bastille-Rousseau, G.; Boonstra, R.; Humphries, M.; Jung, T.S.; Kenney, A.J.; Krebs, C.J.; et al. Climate change increases predation risk for a keystone species of the boreal forest. Nat. Clim. Chang. 2020, 10, 1149–1153. [Google Scholar] [CrossRef]
- Allchin, M.I.; Déry, S.J. Shifting Spatial and Temporal Patterns in the Onset of Seasonally Snow-Dominated Conditions in the Northern Hemisphere, 1972–2017. J. Clim. 2019, 32, 4981–5001. [Google Scholar] [CrossRef]
- Wang, A.; Xu, L.; Kong, X. Assessments of the Northern Hemisphere snow cover response to 1.5 and 2.0 °C warming. Earth Syst. Dyn. 2018, 9, 865–877. [Google Scholar] [CrossRef] [Green Version]
- Groisman, P.Y.; Karl, T.R.; Knight, R.W. Observed Impact of Snow Cover on the Heat Balance and the Rise of Continental Spring Temperatures. Science 1994, 14, 198–200. [Google Scholar] [CrossRef]
- Zhang, R.; Wang, H.; Fu, Q.; Rasch, P.J.; Wang, X. Unraveling driving forces explaining significant reduction in satellite-inferred Arctic surface albedo since the 1980s. Proc. Natl. Acad. Sci. USA 2019, 116, 23947–23953. [Google Scholar] [CrossRef] [PubMed] [Green Version]
Figure 1.
Distribution of study area and exclude season snow-covered area in this study.

Figure 2.
Distribution of the selected GHCN snow depth observations over the NH.

Figure 3.
Flowchart of gap-free MOD10C2-based snow cover extent dataset generation.

Figure 4.
Definition of the snow onset date (Do), snow end date (De), and snow duration days (Dd) based on the original MOD10C2 SCF dataset.
Figure 4.
Definition of the snow onset date (Do), snow end date (De), and snow duration days (Dd) based on the original MOD10C2 SCF dataset.

Figure 5.
Monthly snow cover extent (SCE) anomalies from 1966 to 2020 over the NH derived from NH SCE CDR v01r01. Anomalies were calculated by subtracting the 55-year averaged SCE in each month from the monthly SCE.
Figure 5.
Monthly snow cover extent (SCE) anomalies from 1966 to 2020 over the NH derived from NH SCE CDR v01r01. Anomalies were calculated by subtracting the 55-year averaged SCE in each month from the monthly SCE.

Figure 6.
Climatology of snow cover phenology over the NH from 2001 to 2020. 20-year averaged (a) snow onset date (Do), (b) snow end date (De), and (c) snow duration days (Dd) over the NH from 2001 to 2020.
Figure 6.
Climatology of snow cover phenology over the NH from 2001 to 2020. 20-year averaged (a) snow onset date (Do), (b) snow end date (De), and (c) snow duration days (Dd) over the NH from 2001 to 2020.

Figure 7.
17-year averaged (a) snow onset date (Do), (b) snow end date (De), and (c) snow duration days (Dd) derived from GHCN observations from 2001 to 2017. Scatter plots between GHCN observations and (d) Do, (e) De, and (f) De from satellite-retrieved SCP matrices.
Figure 7.
17-year averaged (a) snow onset date (Do), (b) snow end date (De), and (c) snow duration days (Dd) derived from GHCN observations from 2001 to 2017. Scatter plots between GHCN observations and (d) Do, (e) De, and (f) De from satellite-retrieved SCP matrices.

Figure 8.
Changes in the (a) snow onset date, (b) snow end date, and (c) snow duration days over the NH from 2001 to 2020. Changes are estimated using the five-year averaged SCP during 2016–2020 minus the comparable value during 2001–2005.
Figure 8.
Changes in the (a) snow onset date, (b) snow end date, and (c) snow duration days over the NH from 2001 to 2020. Changes are estimated using the five-year averaged SCP during 2016–2020 minus the comparable value during 2001–2005.

Figure 9.
Latitudinal distribution of changes in the (a) snow onset date, (b) snow end date, and (c) snow duration days over the NH from 2001 to 2020. Changes are estimated using the five-year averaged SCP during 2016–2020 minus the comparable value during 2001–2005.
Figure 9.
Latitudinal distribution of changes in the (a) snow onset date, (b) snow end date, and (c) snow duration days over the NH from 2001 to 2020. Changes are estimated using the five-year averaged SCP during 2016–2020 minus the comparable value during 2001–2005.

Figure 10.
Attribution of changes in snow cover phenology over the NH from 2001 to 2020. Changes in (a) snow accumulation season temperature, Ta, (b) precipitation, Pa, and (c) snow melting season temperature, Tm. (d) Contribution of snow onset date (Do) and snow end date (De) to snow duration day (Dd) anomalies over the NH from 2001 to 2020. Attribution analysis of (e) Do and (f) De anomalies over the NH from 2001 to 2020.

Table 1.
Summary of datasets used in this study.
| Parameters | Dataset | Time Span | Spatial Resolution | Temporal Resolution | Purpose | References |
|---|---|---|---|---|---|---|
| SCF | MOD10C2 | 2001–2020 | 0.05° | 8-day | SCP maps | Hall et al. [36] |
| Binary snow mask | IMS | 2005–2019 | 4 km | Daily | SCE gap filling | Helfrich et al. [37] |
| SCE charts | NH SCE CDR v01r01 | 1966–2020 | – | – | Longterm SCE changes analysis | Estilow et al. [35] |
| Snow depth observations | GHCN-Daily | 2001–2017 | – | Daily | Validation | Menne et al. [42] |
| Reanalysis temperature and precipitation | ERA5-Land | 2001–2020 | 0.10° | Monthly | Attribution analysis | Muñoz [44] |
Table 2.
Snow cover extent changes (106 km2) in each month over the NH from 1966 to 2020. Changes are expressed as linear trends multiplied by the time interval.
Table 2.
Snow cover extent changes (106 km2) in each month over the NH from 1966 to 2020. Changes are expressed as linear trends multiplied by the time interval.
| Season | Month | Mean (106 km2) | Changes (106 km2) | ||
|---|---|---|---|---|---|
| 1966–2000 | 2001–2020 | 1966–2000 | 2001–2020 | ||
| Spring | Mar | 40.81 (±1.91) | 39.83 (±1.59) | −0.0728 (**) | −0.0297 |
| Apr | 30.93 (±1.74) | 29.75 (±1.24) | −0.0497 (*) | 0.0009 | |
| May | 20.00 (±1.71) | 17.79 (±1.48) | −0.0626 (**) | −0.1012 (**) | |
| Summer | Jun | 10.71 (±1.98) | 7.49 (±1.68) | −0.0899 (***) | −0.1848 (***) |
| Jul | 4.53 (±1.19) | 2.98 (±1.47) | −0.0721 (***) | −0.0482 (***) | |
| Aug | 3.23 (±0.79) | 2.58 (±0.21) | −0.0329 (**) | −0.0072 | |
| Autumn | Sep | 5.39 (±1.02) | 5.44 (±0.83) | 0.0104 | 0.0119 |
| Oct | 17.67 (±2.62) | 19.96 (±2.13) | −0.0886 (**) | 0.1583 (**) | |
| Nov | 33.74 (±2.17) | 35.15 (±1.69) | 0.0187 | 0.1784 (***) | |
| Winter | Dec | 43.27 (±1.95) | 44.51 (±1.22) | 0.0126 | −0.0257 |
| Jan | 46.82 (±1.59) | 47.71 (±1.21) | −0.0373 | 0.0068 | |
| Feb | 45.84 (±1.87) | 46.13 (±1.69) | −0.0691 (**) | −0.0245 | |
Significance levels: * 90%; ** 95%; *** 99%; others are not significant at the 90% level.
Publisher’s Note: MDPI stays neutral with regard to jurisdictional claims in published maps and institutional affiliations. |
© 2021 by the authors. Licensee MDPI, Basel, Switzerland. This article is an open access article distributed under the terms and conditions of the Creative Commons Attribution (CC BY) license (https://creativecommons.org/licenses/by/4.0/).
Share and Cite
MDPI and ACS Style
Chen, X.; Yang, Y.; Ma, Y.; Li, H. Distribution and Attribution of Terrestrial Snow Cover Phenology Changes over the Northern Hemisphere during 2001–2020. Remote Sens. 2021, 13, 1843. https://0-doi-org.brum.beds.ac.uk/10.3390/rs13091843
AMA Style
Chen X, Yang Y, Ma Y, Li H. Distribution and Attribution of Terrestrial Snow Cover Phenology Changes over the Northern Hemisphere during 2001–2020. Remote Sensing. 2021; 13(9):1843. https://0-doi-org.brum.beds.ac.uk/10.3390/rs13091843
Chicago/Turabian StyleChen, Xiaona, Yaping Yang, Yingzhao Ma, and Huan Li. 2021. "Distribution and Attribution of Terrestrial Snow Cover Phenology Changes over the Northern Hemisphere during 2001–2020" Remote Sensing 13, no. 9: 1843. https://0-doi-org.brum.beds.ac.uk/10.3390/rs13091843
Note that from the first issue of 2016, this journal uses article numbers instead of page numbers. See further details here.