
Towards the Spectral Mapping of Plastic Debris on Beaches
by
 , , , , and
Jenna A. Guffogg
1,* ,
,
Mariela Soto-Berelov
1,
Simon D. Jones
1,
Chris J. Bellman
1,
Jennifer L. Lavers
2 and
Andrew K. Skidmore
3,4 1
School of Science, Royal Melbourne Institute of Technology University, 124 La Trobe St, Melbourne, VIC 3000, Australia
2
Institute for Marine and Antarctic Studies, University of Tasmania, 20 Castray Esplanade, Battery Point, Hobart, TAS 7004, Australia
3
Faculty of Geo-Information Science and Earth Observation (ITC), University of Twente, Hengelosestraat 99, 7514 AE Enschede, The Netherlands
4
Department of Environmental Science, Macquarie University, Balaclava Rd, Macquarie Park, Sydney, NSW 2109, Australia
*
Author to whom correspondence should be addressed.
Remote Sens. 2021, 13(9), 1850; https://0-doi-org.brum.beds.ac.uk/10.3390/rs13091850
Submission received: 9 March 2021
/
Revised: 24 April 2021
/
Accepted: 26 April 2021
/
Published: 10 May 2021
(This article belongs to the Section Ocean Remote Sensing)
Abstract
:Floating and washed ashore marine plastic debris (MPD) is a growing environmental challenge. It has become evident that secluded locations including the Arctic, Antarctic, and remote islands are being impacted by plastic pollution generated thousands of kilometers away. Optical remote sensing of MPD is an emerging field that can aid in monitoring remote environments where in-person observation and data collection is not always feasible. Here we evaluate MPD spectral features in the visible to shortwave infrared regions for detecting varying quantities of MPD that have accumulated on beaches using a spectroradiometer. Measurements were taken from a range of in situ MPD accumulations ranging from 0.08% to 7.94% surface coverage. Our results suggest that spectral absorption features at 1215 nm and 1732 nm are useful for detecting varying abundance levels of MPD in a complex natural environment, however other absorption features at 931 nm, 1045 nm and 2046 nm could not detect in situ MPD. The reflectance of some in situ MPD accumulations was statistically different from samples that only contained organic debris and sand between 1.56% and 7.94% surface cover; however other samples with similar surface cover did not have reflectance that was statistically different from samples containing no MPD. Despite MPD being detectable against a background of sand and organic beach debris, a clear relationship between the surface cover of MPD and the strength of key absorption features could not be established. Additional research is needed to advance our understanding of the factors, such as type of MPD assemblage, that contribute to the bulk reflectance of MPD contaminated landscapes.
1. Introduction
Marine plastic debris (MPD) has become a major environmental problem over the last half century, with implications for environmental health, ecosystem functioning and economic output. A considerable amount of literature has been published documenting the effects of plastic ingestion and the implication for wildlife and human food chains [1,2]. In addition to environmental effects, the impacts of MPD on economic systems, such as the implications of MPD for tourism [3] and fishing operations [4], have been assessed. A key challenge for addressing the environmental and economic impacts of MPD is locating where these pollutants accumulate, and in what concentrations. The volume of plastic in the environment is difficult to quantify, though it is currently suggested there are more than 250,000 tons of buoyant plastics in the world’s oceans [5], and that 10% of the plastic waste generated globally each year will end up in marine environments [6]. Once there, MPD can accumulate in several sinks; the water surface, water column, benthic sediments and beaches [7]. There are a variety of entry points for MPD into marine ecosystems, with the most likely sources being river outflow from terrestrial environments [8,9]. There has been a shift in the assemblages of MPD over time, with historical assemblages being composed predominantly of plastic manufacturing nurdles [10]. Nowadays, commonly found plastics retrieved from ocean debris hotspots include fishing related debris [5] and fragmented plastics [11].
A growing body of literature has emerged over the past decade investigating the use of remote sensing techniques for the detection and monitoring of MPD. Satellite, airborne and RPAS (remote piloted aerial systems) mounted sensors have been used for mapping other pollutants in oceans including oil spills [12], algal blooms [13] and suspended solids [14] and it has been predicted that similar techniques could be extended to the detection of buoyant MPD [15]. Direct observations of buoyant MPD have been tested with RGB video and multispectral, hyperspectral and thermal sensors [14]. Plastics tested have included drink bottles, bags, styrofoam, nets, fibreglass and a variety of hard plastic fragments [16,17,18,19,20]. The application of remote sensing for detecting MPD is a small but growing field, and it is expected that the use of these platforms will play an increasing role in MPD observation over the coming decade [21].
MPD detection using RGB video and imagery can be complicated by variable light [22] and surface characteristics [23], which can both contribute to false positive identification of plastic items. Item transparency is also noted to affect item detection in the visisble [23] and SWIR [24] regions. To date, thermal imaging studies have been unable to consistently detect fishing debris targets [15]. Recent studies focusing on the use of multispectral and hyperspectral sensors over open bodies of water suggest that detection of large plastic targets (0.5 m to 10 m) is possible using some airborne and spaceborne platforms [17,25,26]. However there are significant challenges for detecting MPD using multispectral and hyperspectral sensors. Studies of MPD detection over beach environments can be complicated by discontinuous backgrounds and vegetation [22,23], variety of substrates and sediment types and the moisture content of the underlying sediments [18]. When investigating floating MPD in open waters, significant attenuation of MPD reflectance from water interaction has been noted [27] and suspended sediment concentrations have been documented as impacting plastic item detection [19]. Nevertheless, there has been progress in addressing these challenges, with research efforts for developing appropriate reflectance models and algorithms in the early stages of development and testing [19,20,24,28]. Several spectral libraries of marine harvested and weathered plastics have been published in recent years that are expected to further aid efforts to develop algorithms [29,30,31].
To date, several studies have investigated the use of spectral absorption features common to plastic polymers and the usefulness of these features for detecting MPD with multispectral or hyperspectral sensors [16,19,20,30,31]. Features of interest for remote sensing have been identified at 931 nm, 1045 nm, 1215 nm, 1430 nm, 1537 nm, 1732 nm, 2046 nm and 3400 nm [29,30,31,32,33], However, some of these features may be difficult to use due to atmospheric interference, or coinciding with spectral features of common substrates [16]. The plastic absorption feature at 931 nm co-incides with a narrow region of minor atmospheric interference, and thus may be problematic for satellite earth observations [17,30,32]. While small in magnitude, the 1732 nm feature may be more promising as there are no conflicting signals from background spectra, provided appropriate image enhancements are used [32].
Research into using shortwave infrared (SWIR) spectral features to detect MPD as they occur within the environment has increased over the last 10 years. Hibbits et al. tested a dual-band camera for detecting plastic items in both indoor and outdoor environments [16] and in another study a hyperspectral camera was used to image tiles made of a variety of coloured plastic polymers in a controlled, outdoor setting [34]. Garaba et al. tested several samples of weathered and new plastics with surface covers between 0.01% and 100% against a black background, finding that below 20% fractional cover accurate detection was challenging [29]. Goddijn-Murphy and Dufaur tested surface covers of plastics over water between 25% and 100%, finding that plastic transparency complicated detection using spectral features [20]. Given that MPD are likely to represent fractional cover of pixels of less than 20% on beaches, this is an area that warrants further research. A greater understanding of the detection limits of plastics, and the spectral response of different types of plastics as a component of a beach environment will be required for accurate MPD detection.
While the remote sensing of buoyant MPD in open waters is receiving some attention, similar studies over beach environments are rare, despite a need for monitoring solutions at the catchment level and for coastal zones [35]. The coast represents a complicated and challenging environment for detecting MPD, as sediments can have high reflectance that may mask plastic spectral features and there is a wide variety of sediment types and grain sizes for MPD to be deposited over [18]. However, coastlines are one potential sink for plastic pollution, and global accounting needs to rely on accurate measurements in both beach and ocean environments. Some of the highest MPD densities reported worldwide are from remote islands such as Henderson Island in the Pacific Ocean and the Cocos (Keeling) Islands in the Indian Ocean [36,37]. Both locations are remote, removed from major landmasses by thousands of kilometers, yet the amount of MPD recorded in these places is incongruent with the local sources. Henderson Island is uninhabited, and while the Cocos (Keeling) Islands have a small human population, the volume of some debris items documented here would take the local population hundreds of years to produce [37]. A 2017 survey determined the Cocos (Keeling) Islands may have accumulated an estimated 373,000 toothbrushes and 977,000 shoes [37].
The most common method of recording MPD accumulation on beaches are cleanups and surveys. However, beach surveying is time consuming and expensive [38] and requires training individuals in field and laboratory classification of plastics [39]. The accuracy to which plastic debris is correctly identified is not uniform, with colour and shape affecting the ability of trained observers to correctly identify beach litter [39]. Smaller pieces of plastic and white plastic in particular are difficult to separate from organic matter and sediment, regardless of observer training [39]. In addition, there is variability in the reporting of, and no accepted standard technique for recording plastic concentrations in the environment [38,40]. This variability has hampered efforts to combine localised studies across large geographical areas [39,41].
The impact of MPD on coastal environments is significant [42,43] and the potential for multispectral and hyperspectral sensing of plastic debris has been highlighted in recent studies [18,21]. Currently there is a lack of field data collected on in situ MPD reflectance in coastal environments, and improved knowledge is desired to assess the application of spectroscopy and remote sensing for quantifying MPD accumulation in these environments.
Our objective in this paper is to investigate the applicability of previously identified plastic spectral features in the near-infrared and short-wave infrared region for detecting MPD in a beach environment. While several studies have examined the use of RGB data for detecting MPD on beaches [23,44,45] and others have examined the short-wave infrared reflectance features of MPD in water [19,20,26] there is a lack of research on the utility of near infrared and shortwave infrared spectral features for detecting MPD on beaches. Further to this, it is important to examine the spectra of MPD in the quantities that naturally accumulate in these environments, and in the context of MPD contributing to the bulk reflectance within a given unit area. While several MPD spectral features have been identified in the literature, it may be that not all of these are appropriate for detecting MPD at low surface covers, or they may be obfuscated by the spectral reflectance of other objects and surfaces within a sampled area. It is anticipated that several key absorption features identified as usable over open waters will also be detectable over a sandy substrate and that there will be a relationship between the depth of these absorption features and the surface cover (%) of MPD on beaches.
To accomplish these objectives we present VIS-SWIR spectra (350–2300 nm) collected from two field sites on the Cocos (Keeling) Islands, in the Indian Ocean, from sample plots with varying MPD surface cover. These spectra were collected using a proximal sensor. The Cocos (Keeling) Islands have been previously surveyed using ground survey techniques and, like other remote islands around the world [36] are a site of exceptional accumulation of MPD [37].
2. Materials and Methods
2.1. Study Site
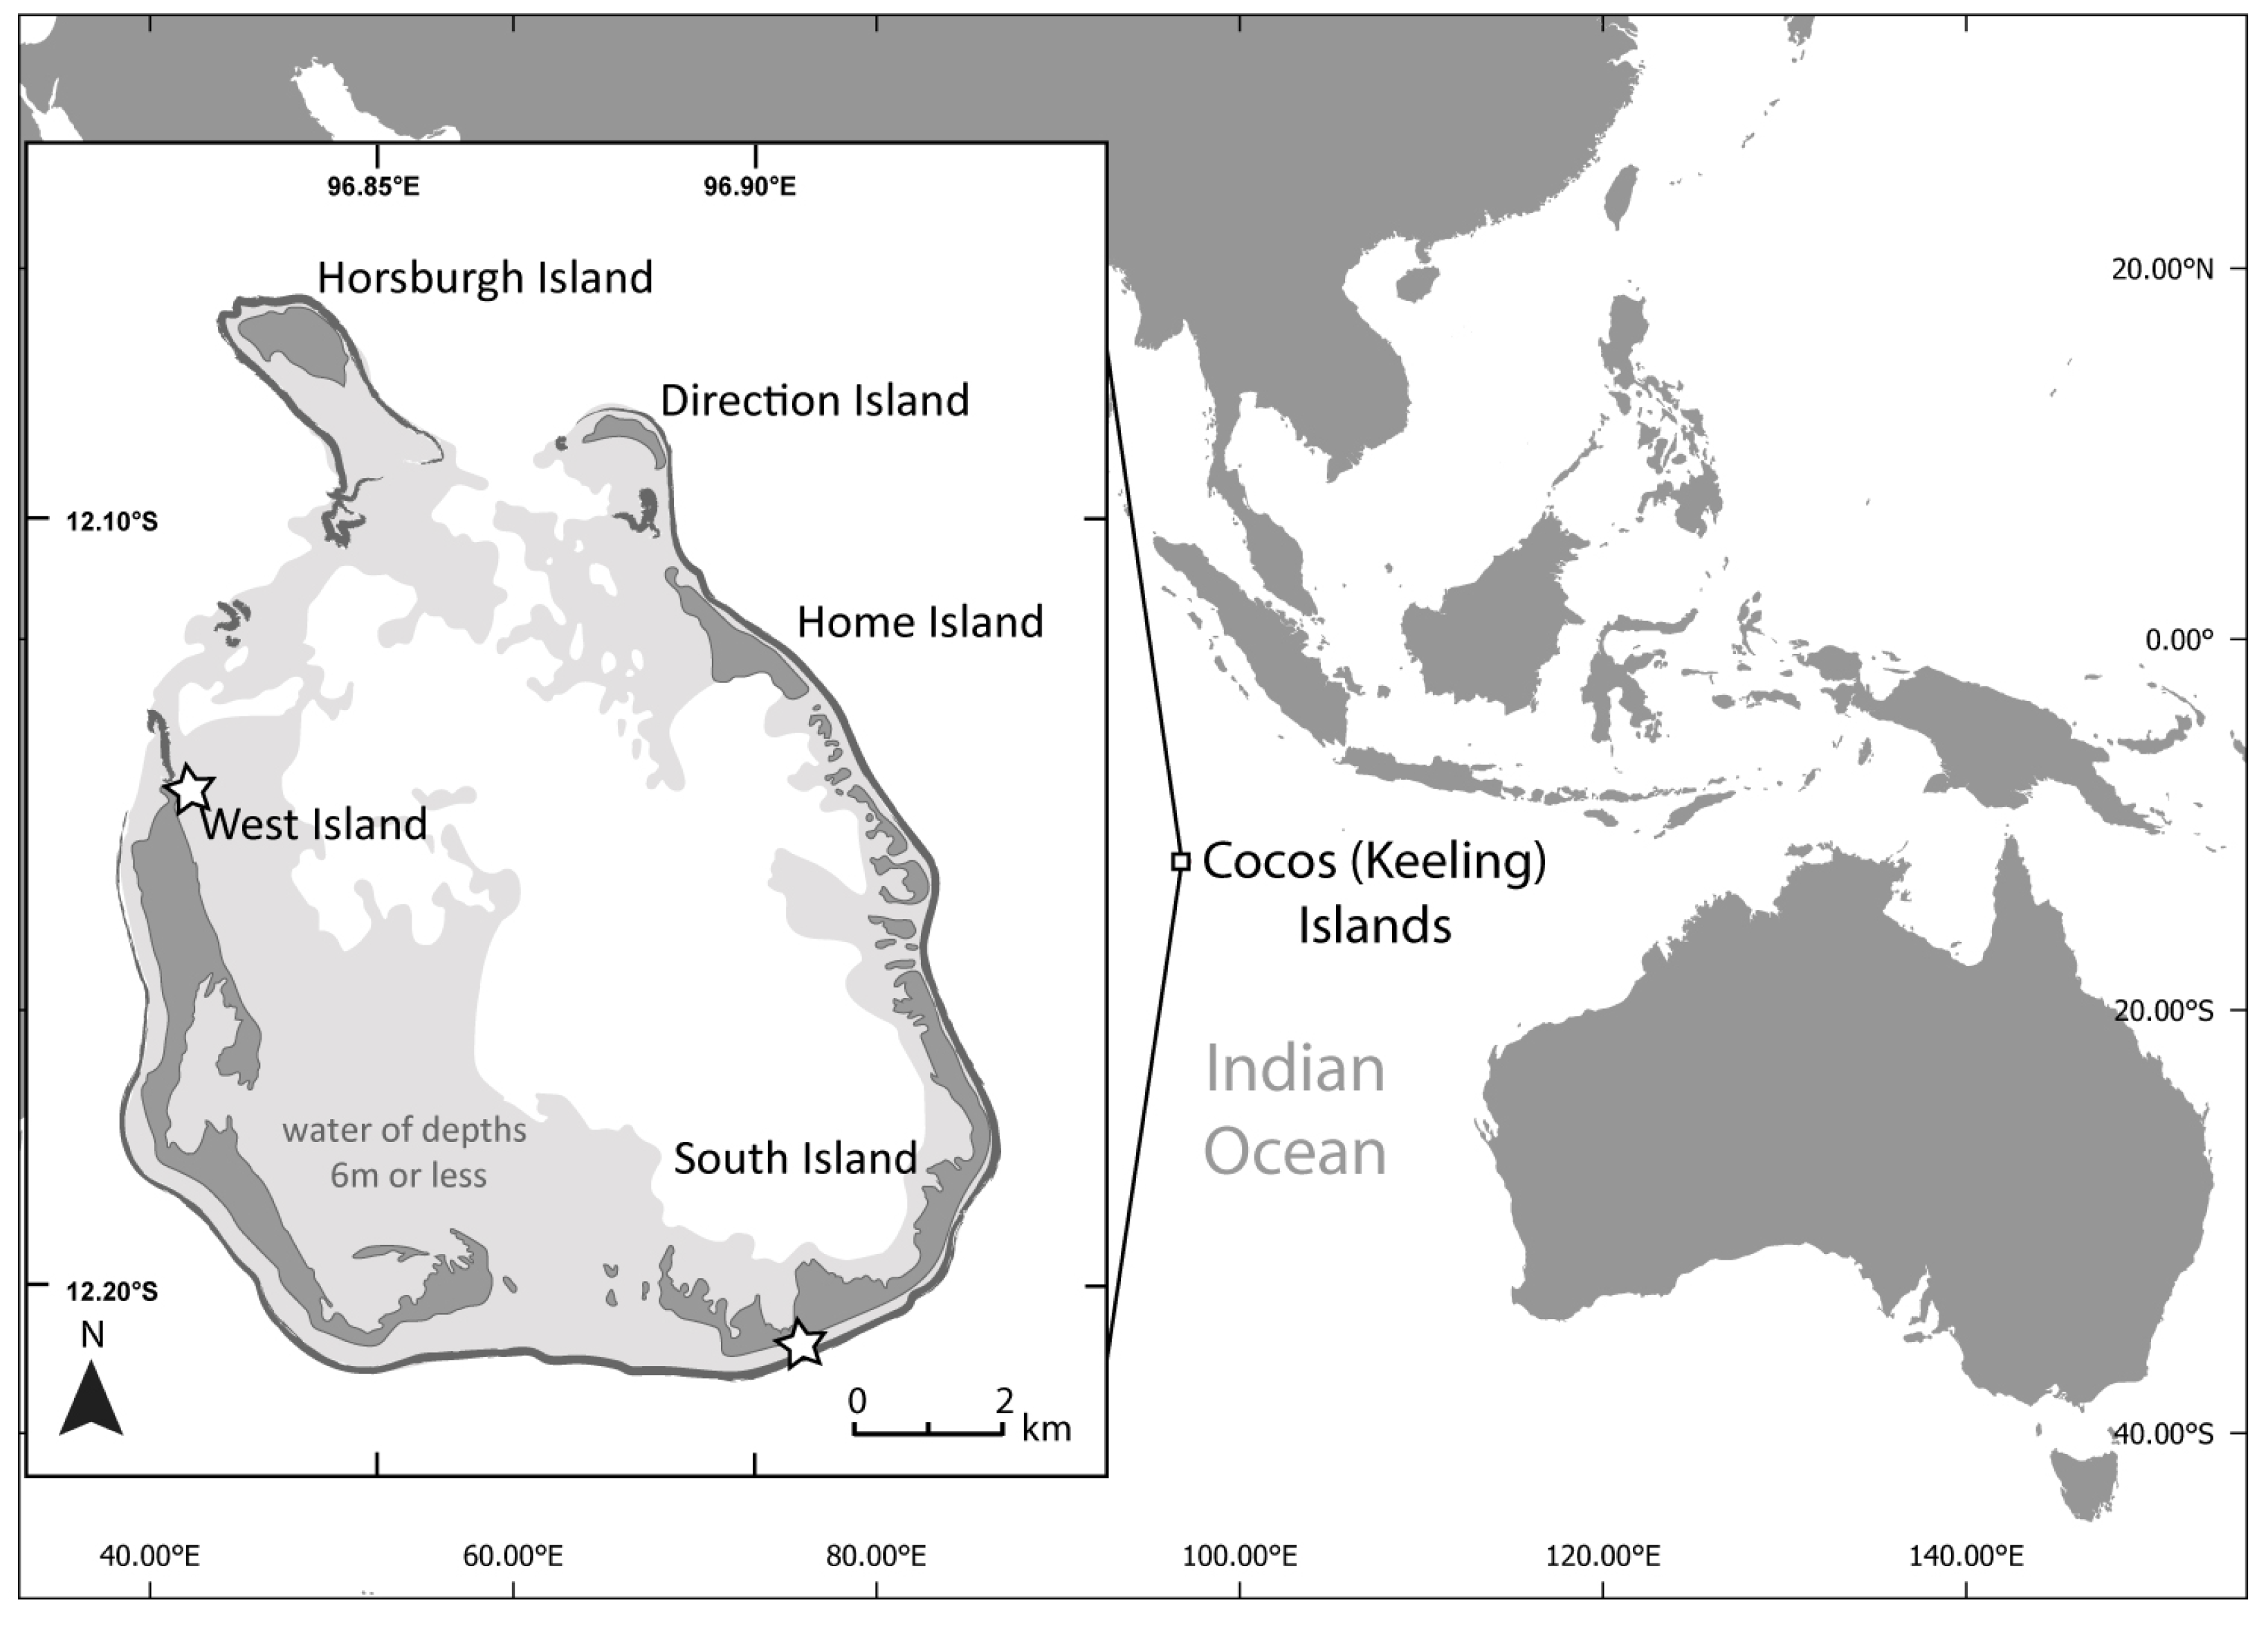
Fieldwork was undertaken between the 1st and 12th February 2020 on the Cocos (Keeling) Islands (12°05S, 96°53E Figure 1). The islands, located approximately 2100 km north-west of Exmouth, Western Australia, comprise of a carbonate atoll and smaller atoll with a total surface area of 14 km2 atop a volcanic seamount [46]. The smaller atoll consists of a single island 27 km north of the main atoll, designated as the Pulu Keeling National Park. The main atoll consists of 26 small islands around a lagoon, with West Island and Home Island populated by approximately 550 people [47]. West and South Island were visited during the 2020 survey (Figure 2) and data were collected from ocean-facing beaches on each island, with the intent of sampling MPD that had been brought to the atoll through ocean currents.
2.2. Ground Survey Design
A visual census using quadrat sampling was conducted on ocean-facing beaches on West and South Island (Figure 1). All quadrats were 1 m2 and distributed randomly above the high-tide mark; on South Island the quadrats were distributed along a 15 × 200 m section of beach, while on West Island the quadrats were distributed along a 30 × 80 m area of the beach. The position of quadrats was determined by using the random points research tool in QGIS 3.2 to select a number of locations within the sampling area of each beach. The intertidal area was not sampled due to the tidal patterns being unfavourable for sampling when fieldwork was carried out. In addition to the randomly distributed quadrats containing deposited debris, an additional 1 m2 quadrat was setup with an artificially created 25% surface cover of MPD. Material for this quadrat was gathered from non-sampled areas on the beach.
Previous studies of MPD accumulation on remote islands have used quadrats to record the standing surface stock of micro (1–5 mm) and macro (>5 mm) plastics [36,37]. However, the size of these quadrats were limited to 40 cm2 due to the significant time required to record both micro and macro-plastics. It was decided that microplastics would be excluded from this study to accommodate a larger sampling area that more closely reflects the spatial resolutions achievable by aerial and spaceborne platforms. Therefore, all macroplastic items within a quadrat were recorded using datasheets (see Figure 3 for example quadrats). As remote sensing techniques are only suitable for monitoring surface layers, buried MPD were not included in this study, as they had been previously by Lavers et al. [37].
We used the classification scheme developed by Tangaraoa Blue [48], which has been used to document MPD around Australia, and includes categories like fishing gear and consumer items, as well as non-plastic materials like glass, wood and foam. The categories have not been altered, though additional items were added to account for commonly found items on Cocos (Keeling) Island beaches, like single-serve water cups and shoes. The classification method was adapted to include colour; as there is currently no standard scheme for colour designation [49] so we employed a 7-colour classification scheme similar to that suggested by Provencher et al. [49].
Each quadrat was assessed by a pair of trained interpreters to determine the number of MPD items within the specified area. To ensure these data are of high quality, operating procedures and reference materials were developed prior to and implemented during fieldwork. Additionally, prior to fieldwork interpreters underwent training and mock surveys were conducted on another beach to ensure consistency throughout the data gathering process.
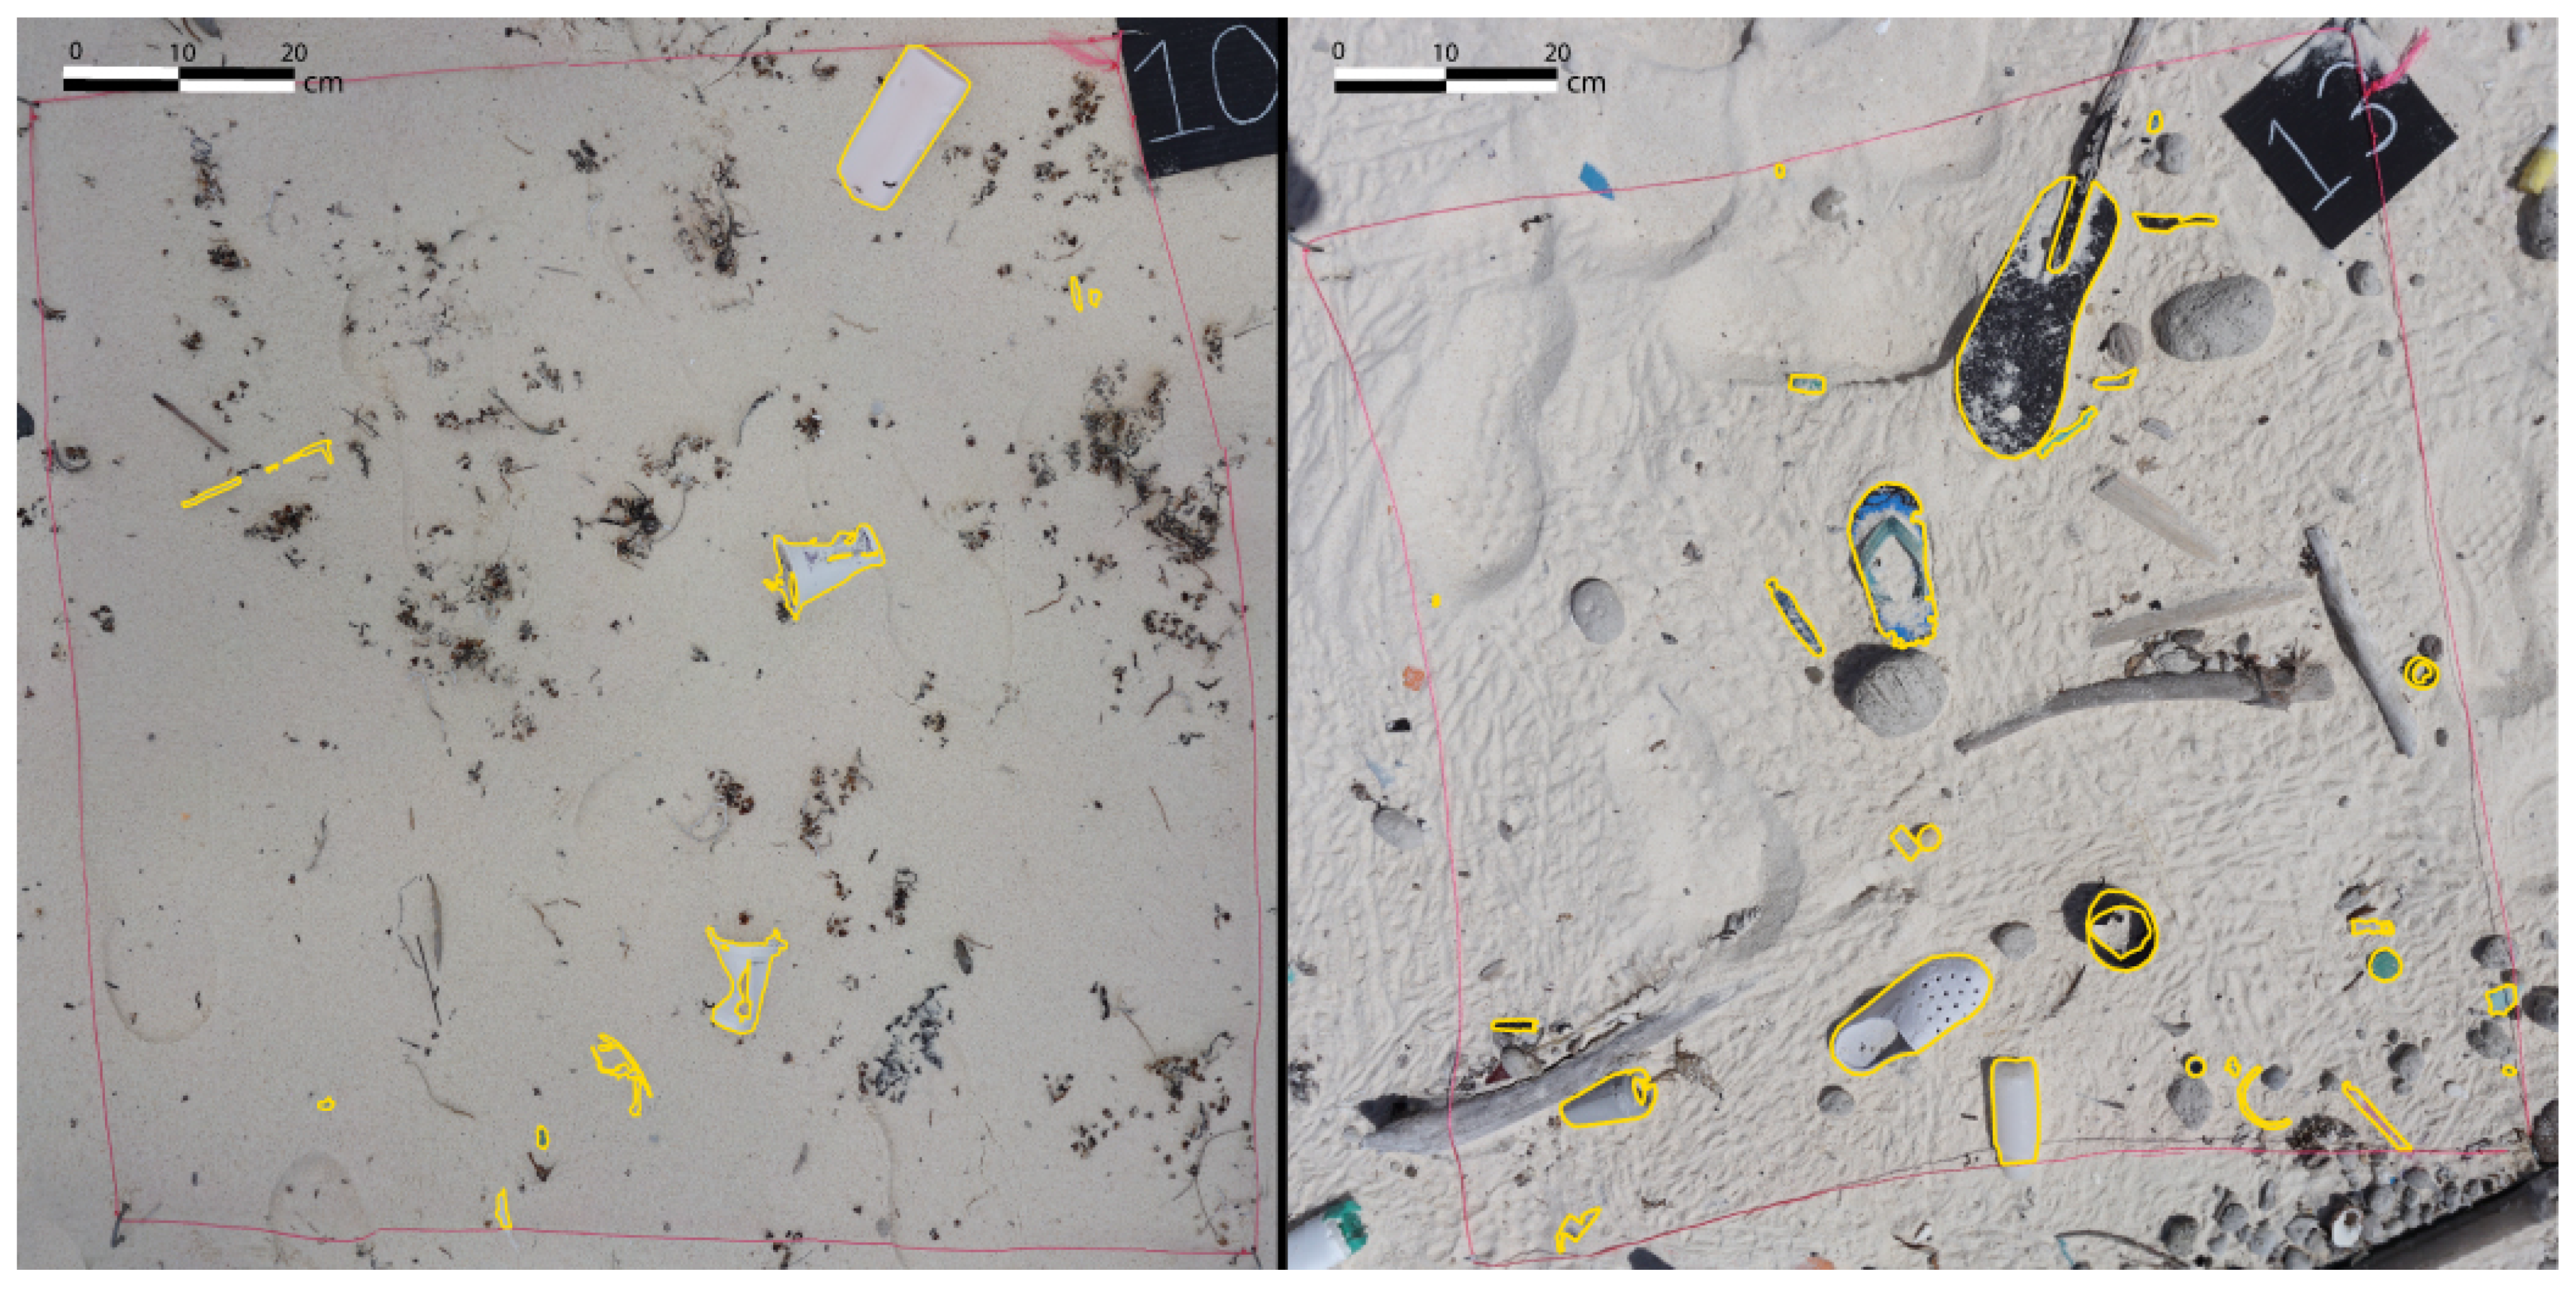
To determine the surface cover of MPD within the quadrats multiple photographs were taken of each quadrat at nadir from 1 m above ground height. These photographs were then used to create a single orthomosaic of each quadrat using Agisoft Metashape Professional. Using the information collected by the field interpreters, each macroplastic item within a quadrat was manually digitised (Figure 3) using QGIS 3.2. 20% of the quadrats were assigned to multiple digitisers independently for quality control purposes.
2.3. Spectral Data Collection
Spectral reflectance for all quadrats were measured ±3 h around solar noon (local time) using an Analytical Spectral Device (ASD) Fieldspec® Pro 4 hyperspectral radiometer (Malvern Panalytical, Boulder, CO, USA), capable of recording full solar reflected spectrum between 350–2500 nm (VIS-SWIR). Measurements were captured at nadir with no foreoptic attached and an extended 5 m fibreoptic cable, at approximately 40 cm above surface, resulting in an FOV with a diameter of 17.7 cm. Each individual reading was comprised of 30 scans (spectrum average = 30), and sampling of the 1 m × 1 m quadrat area was achieved by changing the position of the foreoptic over the quadrat between readings in order to obtain a representative sample of the entire area. The optic was held by hand, however self-shadowing was minimised through positioning of the person operating the device and the use of an extended 5 m fibreoptic cable. A 99% white Spectralon® lambertian panel (Labsphere, North Sutton, NH, USA) was used as white reference. Before each quadrat measurement began the Fieldspec Pro was optimised and a new white reference measurement taken. While conditions were generally sunny, there was variable cloud cover during periods of data collection which required the Fieldspec to be optimised and further reference measurements to be taken. Conducting the data capture in bright, natural light allowed for good signal-to-noise ratio from 350 to 2300 nm, with the exception of bands within the SWIR portion of the spectrum known to be impacted by atmospheric interference (1350–1400 nm and 1800–1920 nm). The use of the extended 5 m fibreoptic cable caused the data to be noisy beyond 2300 nm.
2.4. Spectral Processing and Analysis
Spectra were processed and analysed using MATLAB R2020a and the Field Spectroscopy Facility Post processing toolbox [50]. Spectra were smoothed using a Savitsky-Golay filter with a 19 nm window. The spectral signatures of marine-harvested plastics has been documented and there are several absorption features common across major categories of marine plastic debris [29]. These previously identified features were used as a starting point for visual inspection of the measured spectra. These include a NIR absorption feature centred at 931 nm, and two SWIR absorption features centred at 1215 nm and 1732 nm, identified from previous studies of dry and wet MPD and hydrocarbons [26,32]. Spectra collected for each quadrat were averaged to create a single reading representative of the 1 m2 area, representing a combination of carbonate sand, organic debris like bamboo, coconut husk and seaweed, and MPD.
2.5. Spectral Feature Analysis (SFA)
Analysis of the derivatives of each plastic type was completed and these were compared. 1st and 2nd order derivatives of the averaged spectra for each quadrat were used to confirm the locations of the spectral absorption features identified in the initial visual analysis, and to confirm if they were aligned with previously published literature.
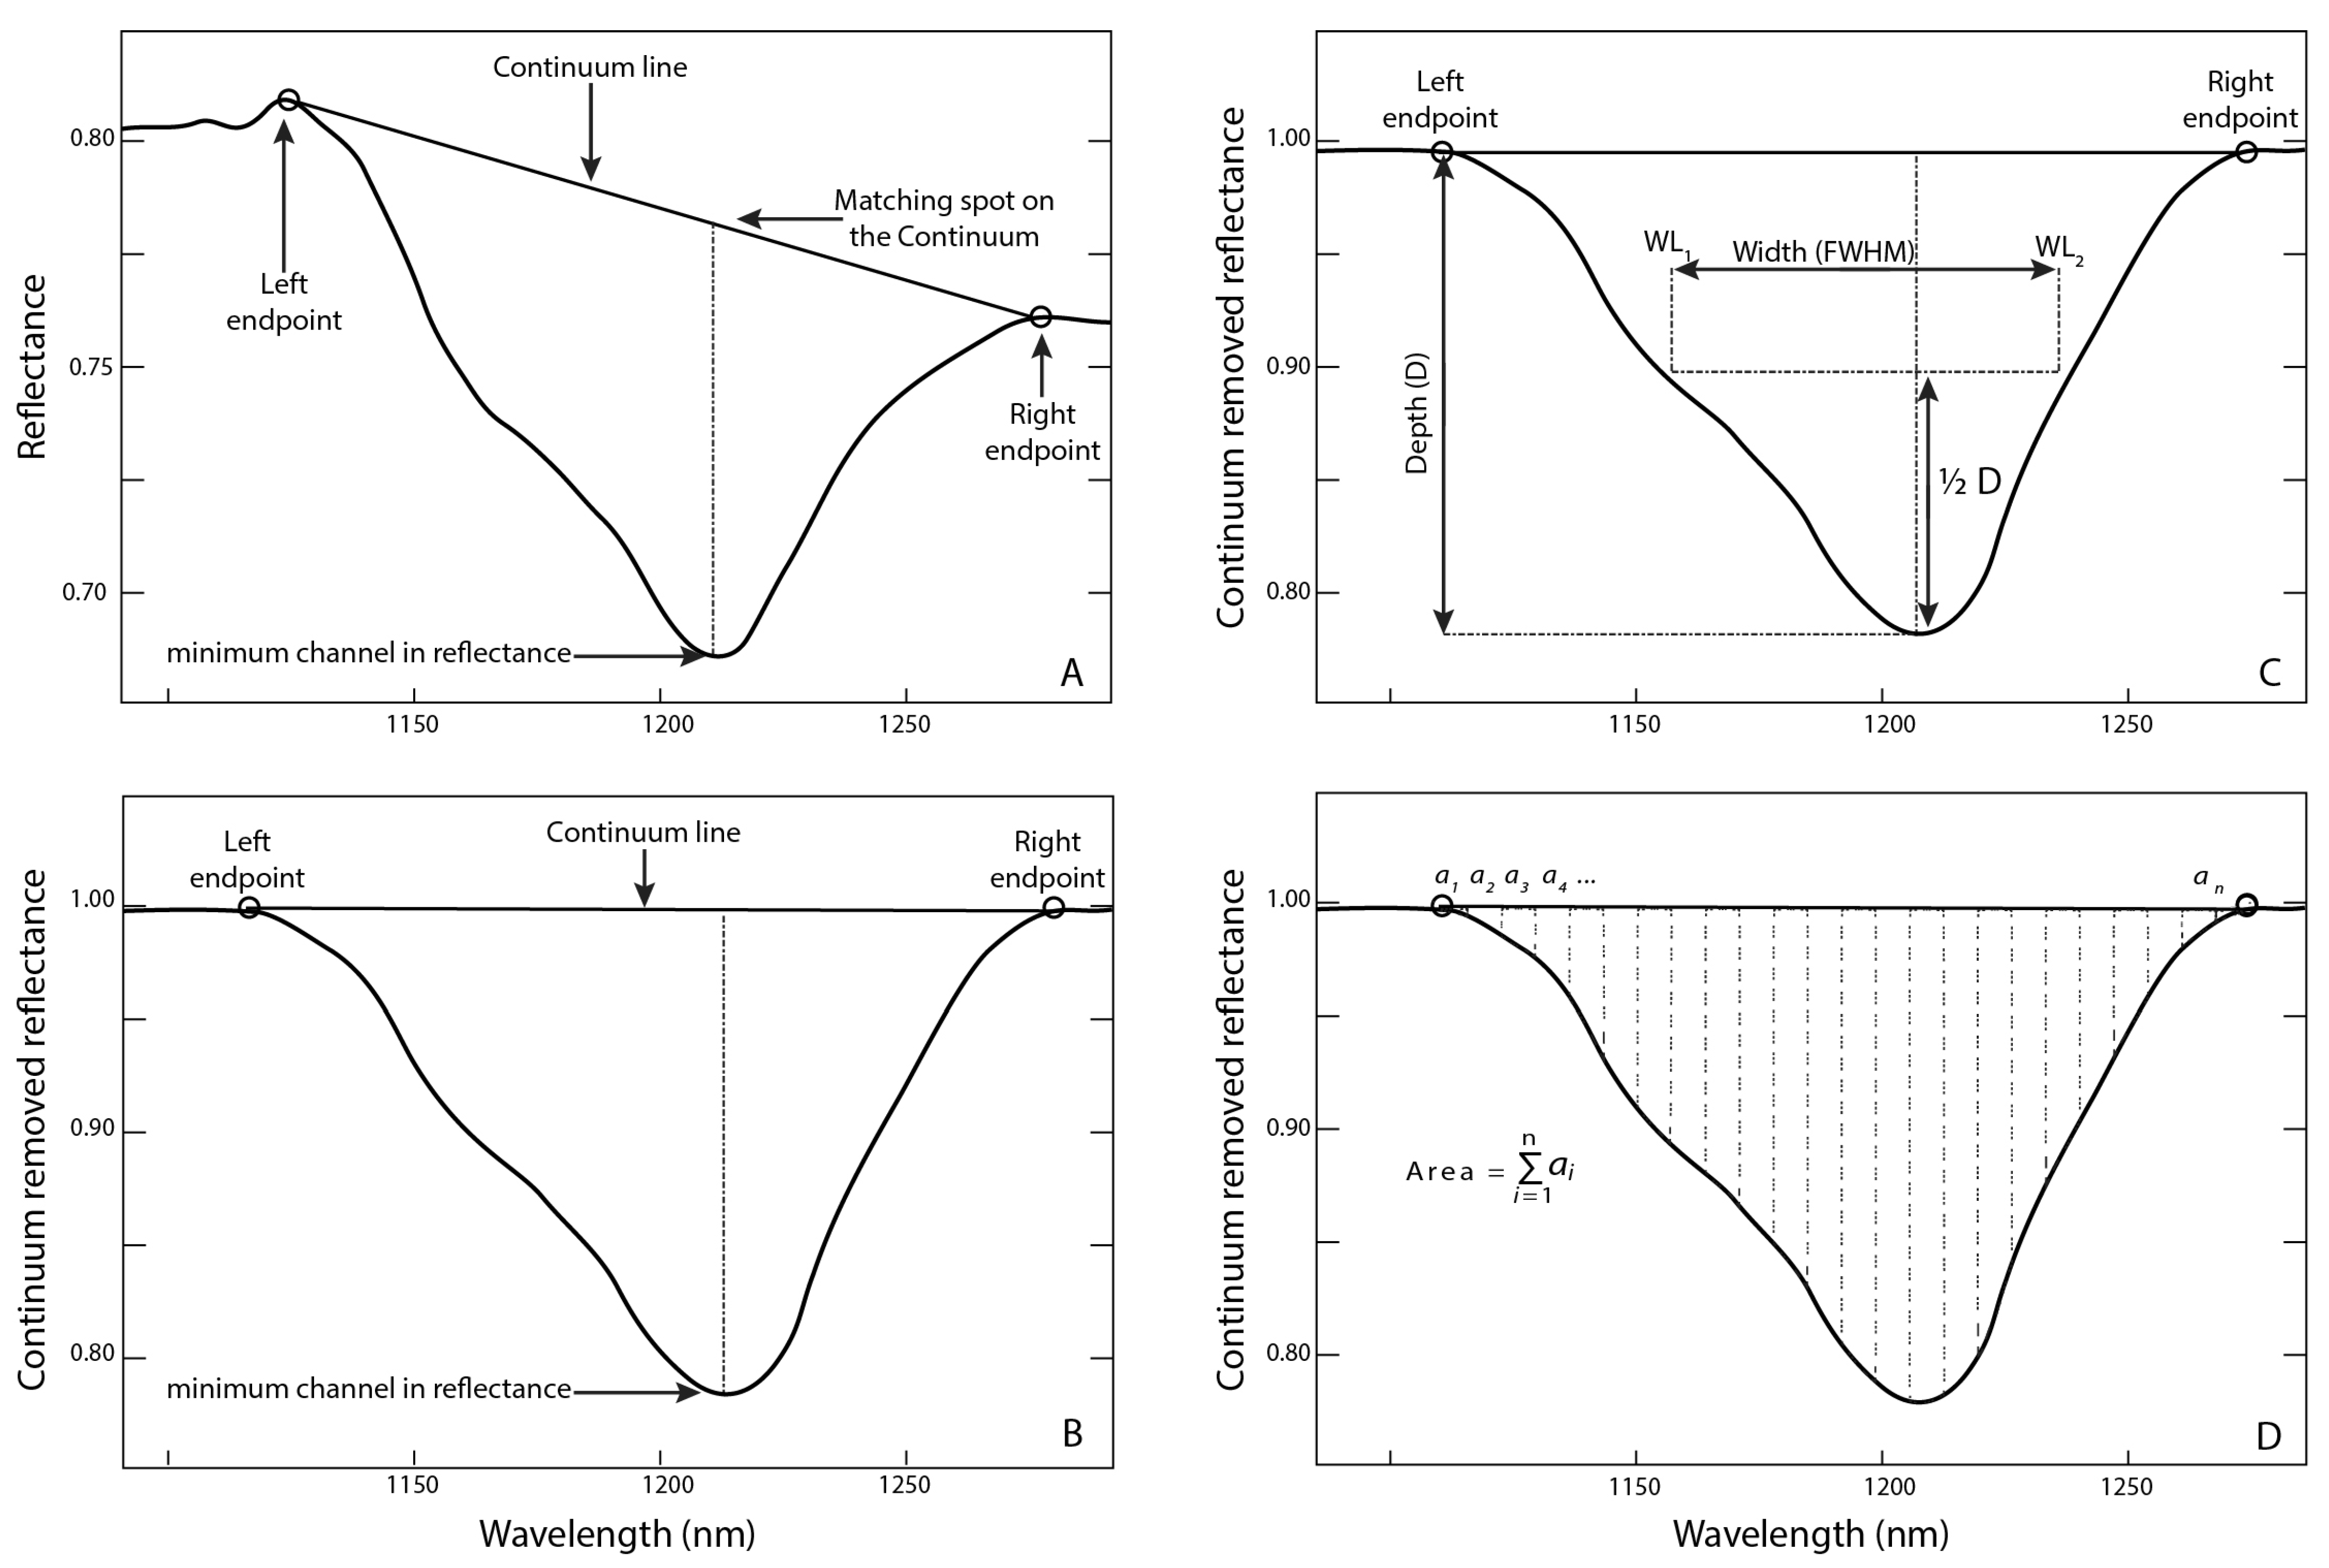
Once the location of spectral features were confirmed, continuum removal was applied to the spectra using the ConvHull function in Mathworks MATLAB R2020a. Removing the reflectance continuum allowed for the relative depth and area of absorption features to be determined by removing the impact of varying lighting conditions (Figure 4). This also allowed these parameters to be compared between the samples. A continuum removal identifies the convex hull on either side of the wavelength values of interest (left endpoint and right endpoint) and calculates the band depth at the point of maximum absorption [51] (Figure 4). Once convex hull is removed, spectral feature parameters such as feature depth, feature width (full width at half-maximum—FWHM [51]) and feature area can be determined.
2.6. Linear Regression of In-Situ Plots
The absorption feature parameters were plotted against the surface cover of MPD to determine the association between depth, width and area of spectral features in key wavelengths and MPD surface cover. Simple linear regression was used to test if the feature parameters determined from SFA—feature depth, width (FWHM) and area—were correlated to the apparent surface cover of plastic debris within the quadrats (Equation (1)).
- d = feature depth
- w = feature width
- a = feature area
- c = MPD surface cover (%)
2.7. Statistical Analysis
Quadrats were divided into groups based on MPD surface cover, here referred to as fractional cover groups. The continuum-removed reflectance spectra for the fractional cover groups were analysed using the Mann–Whitney U-test to determine if variance in reflectance between fractional cover groups was greater than within each fractional cover group. Each group was compared to a sand-only control group. The null hypothesis was tested at a significance level of = 0.05. The Mann–Whitney U-test was also conducted for individual quadrats that exhibited strong absorption in key wavelength areas compared to the control group, to determine if the strength of these features was statistically significant. To determine variation in regions of statistically significant difference, individual quadrats that were shown to be statistically different from the control group were also compared pair-wise.
3. Results
3.1. MPD Surface Cover of Field Sites
The surface cover of MPD within quadrats that contained natural plastic litter ranged from 0.08% to 7.94% (Table 1). The most contaminated sample at the South Island field site contained 5.67% MPD surface cover, and the most contaminated sample at the West Island field site had 7.94% MPD cover. The average surface cover for the South Island field site was 2.24% and for the West Island field site 2.52%. A total of 249 individual MPD items were documented in the ground survey across the 20 quadrats ranging from 5 mm to 50 cm, with 112 plastic items documented in quadrats on South Island and 137 plastic items documented in quadrats on West Island.
3.2. Spectra of Sample Sites
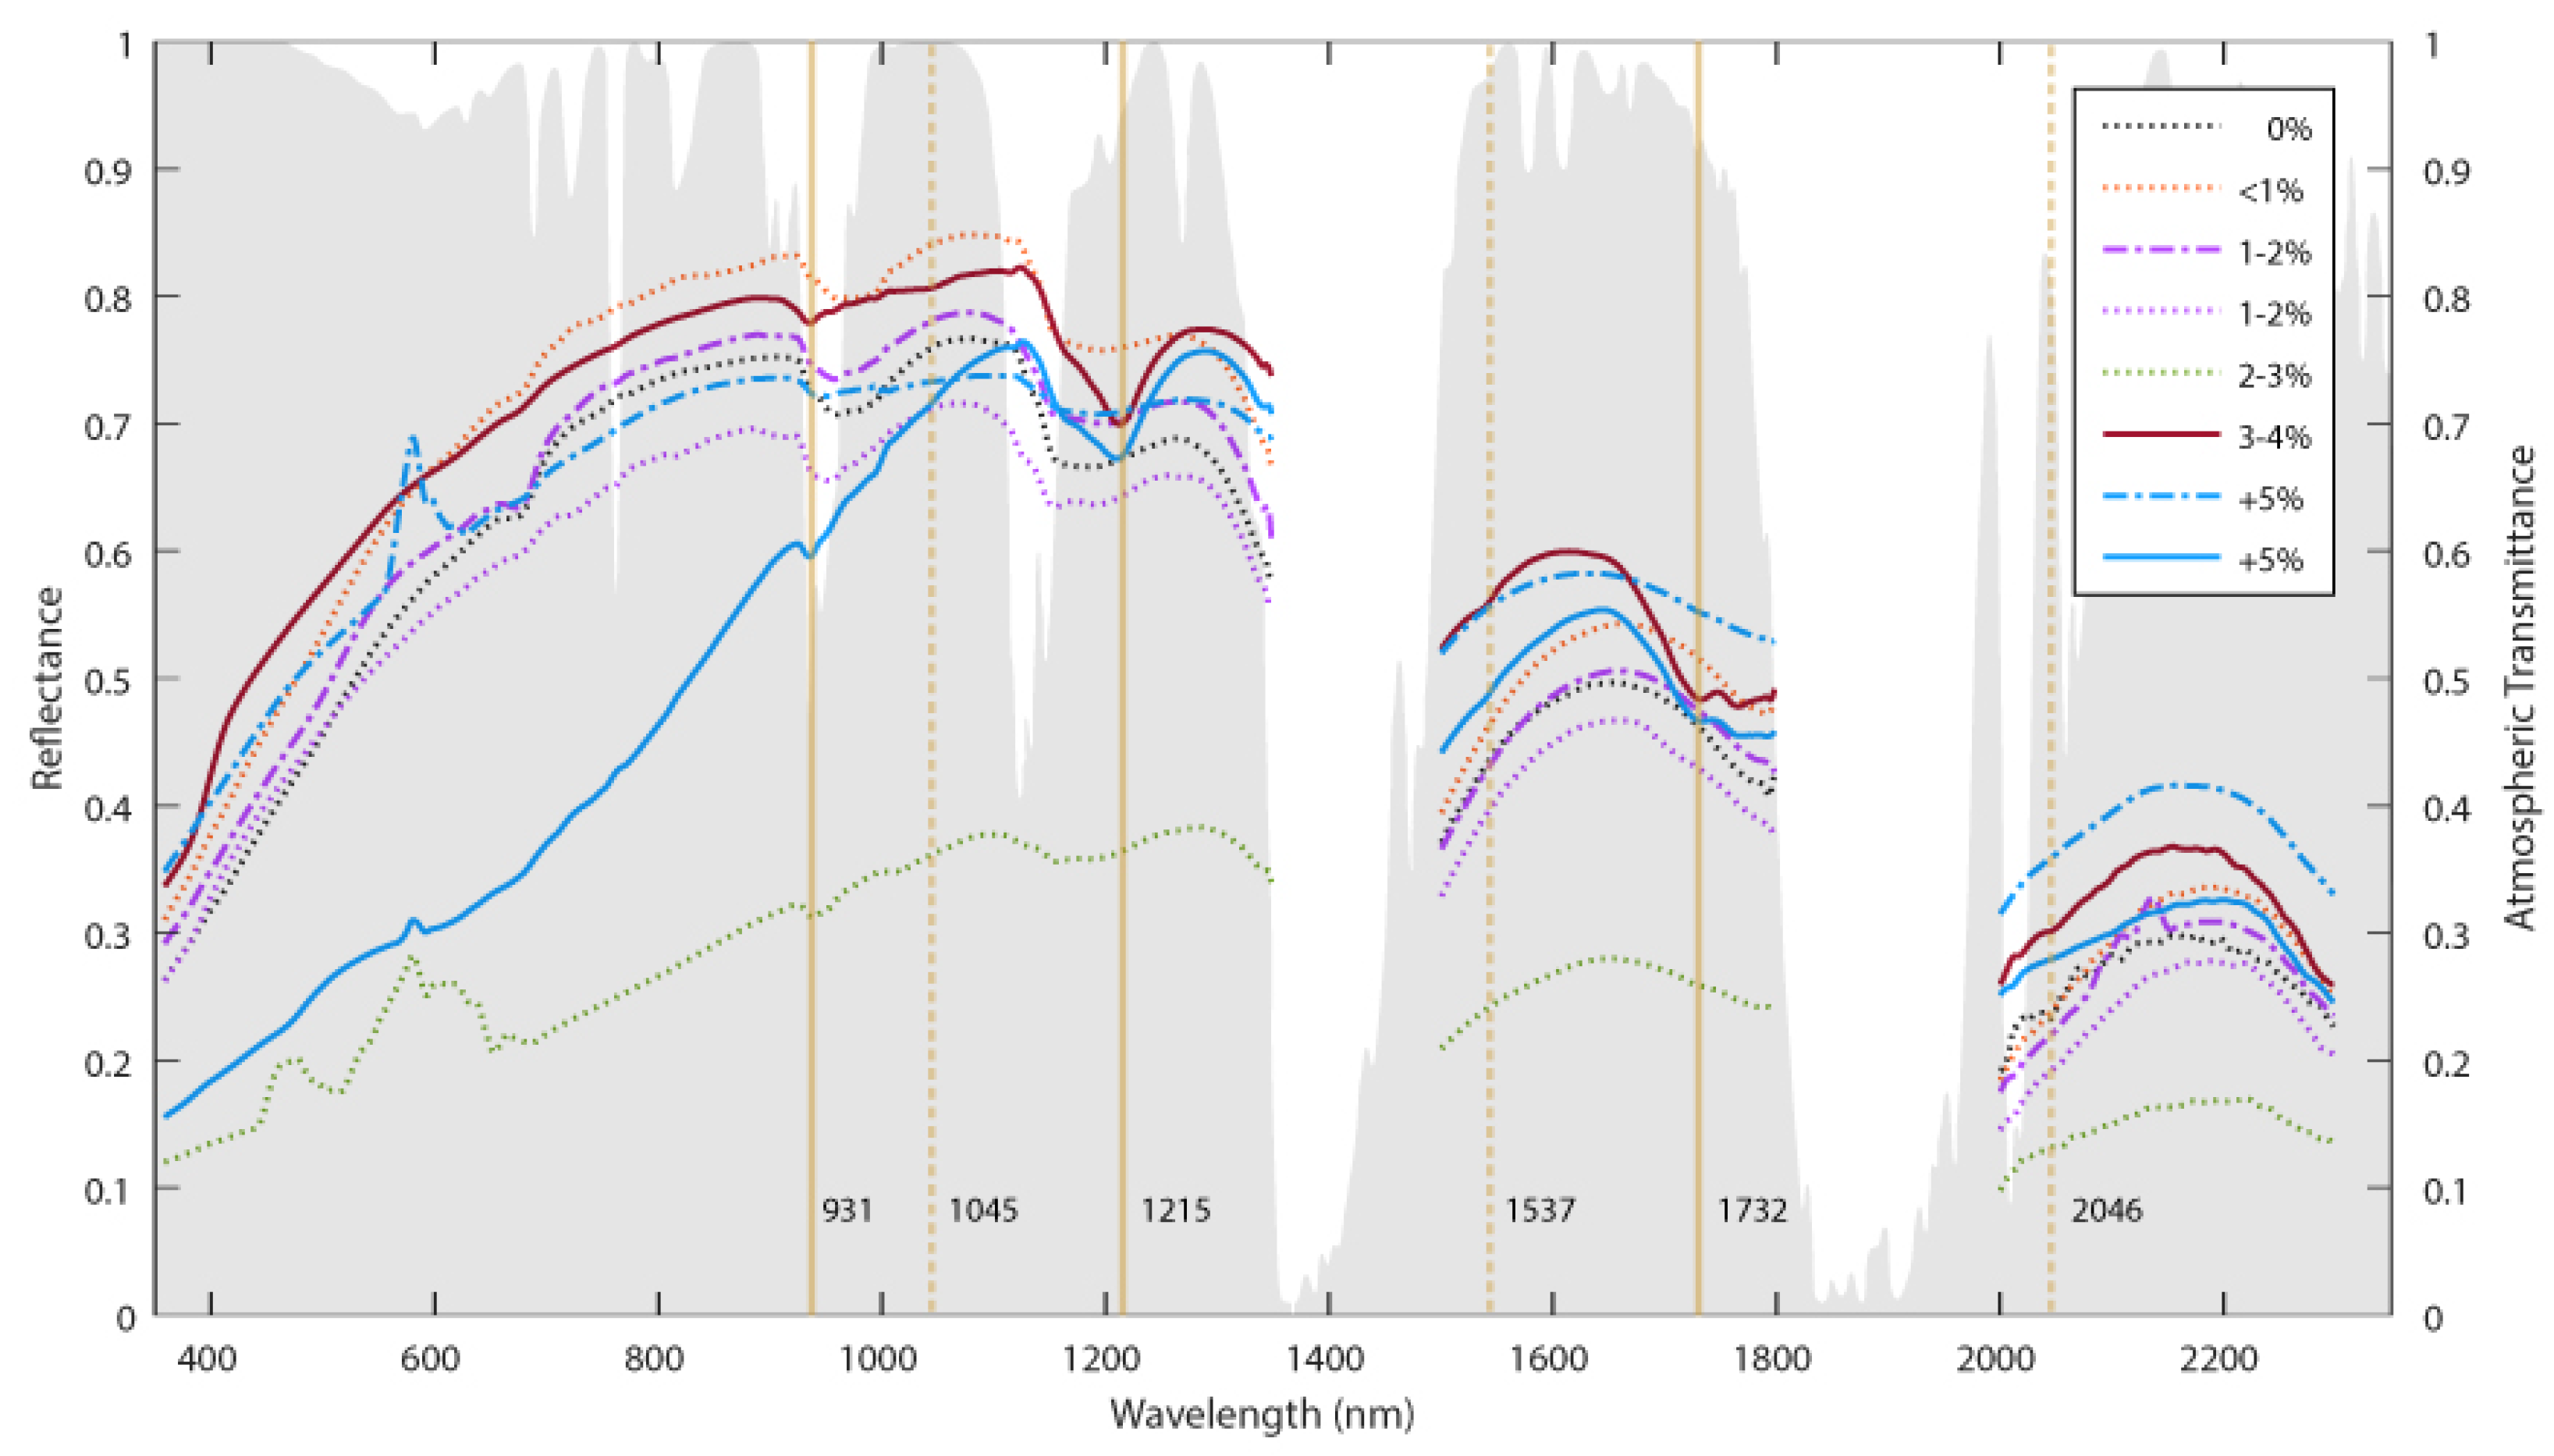
The spectral signature of a quadrat containing no MPD is shown in Figure 5 along with representative samples for several MPD surface covers (pleas see Appendix A for all spectra). Examples that exhibited visible spectral absorption around key plastic features have been highlighted, although these were not the samples with the highest surface cover of MPD. The two samples with visible absorption around key plastic features were used to examine which spectral features, as proposed by others in the broader literature, would be visually distinguishable under natural conditions in the field.
The spectra in Figure 5 are shown alongside modelled transmittance for atmospheric gases [52]. There is a region of minor interference caused by water absorption that coincides with the plastic absorption feature around 931 nm. The 1430 nm falls outside of the atmospheric windows and is not distinguishable from noise. However, our results show that the absorption features at 1215 nm and 1732 nm are unlikely to be affected by atmospheric gases.
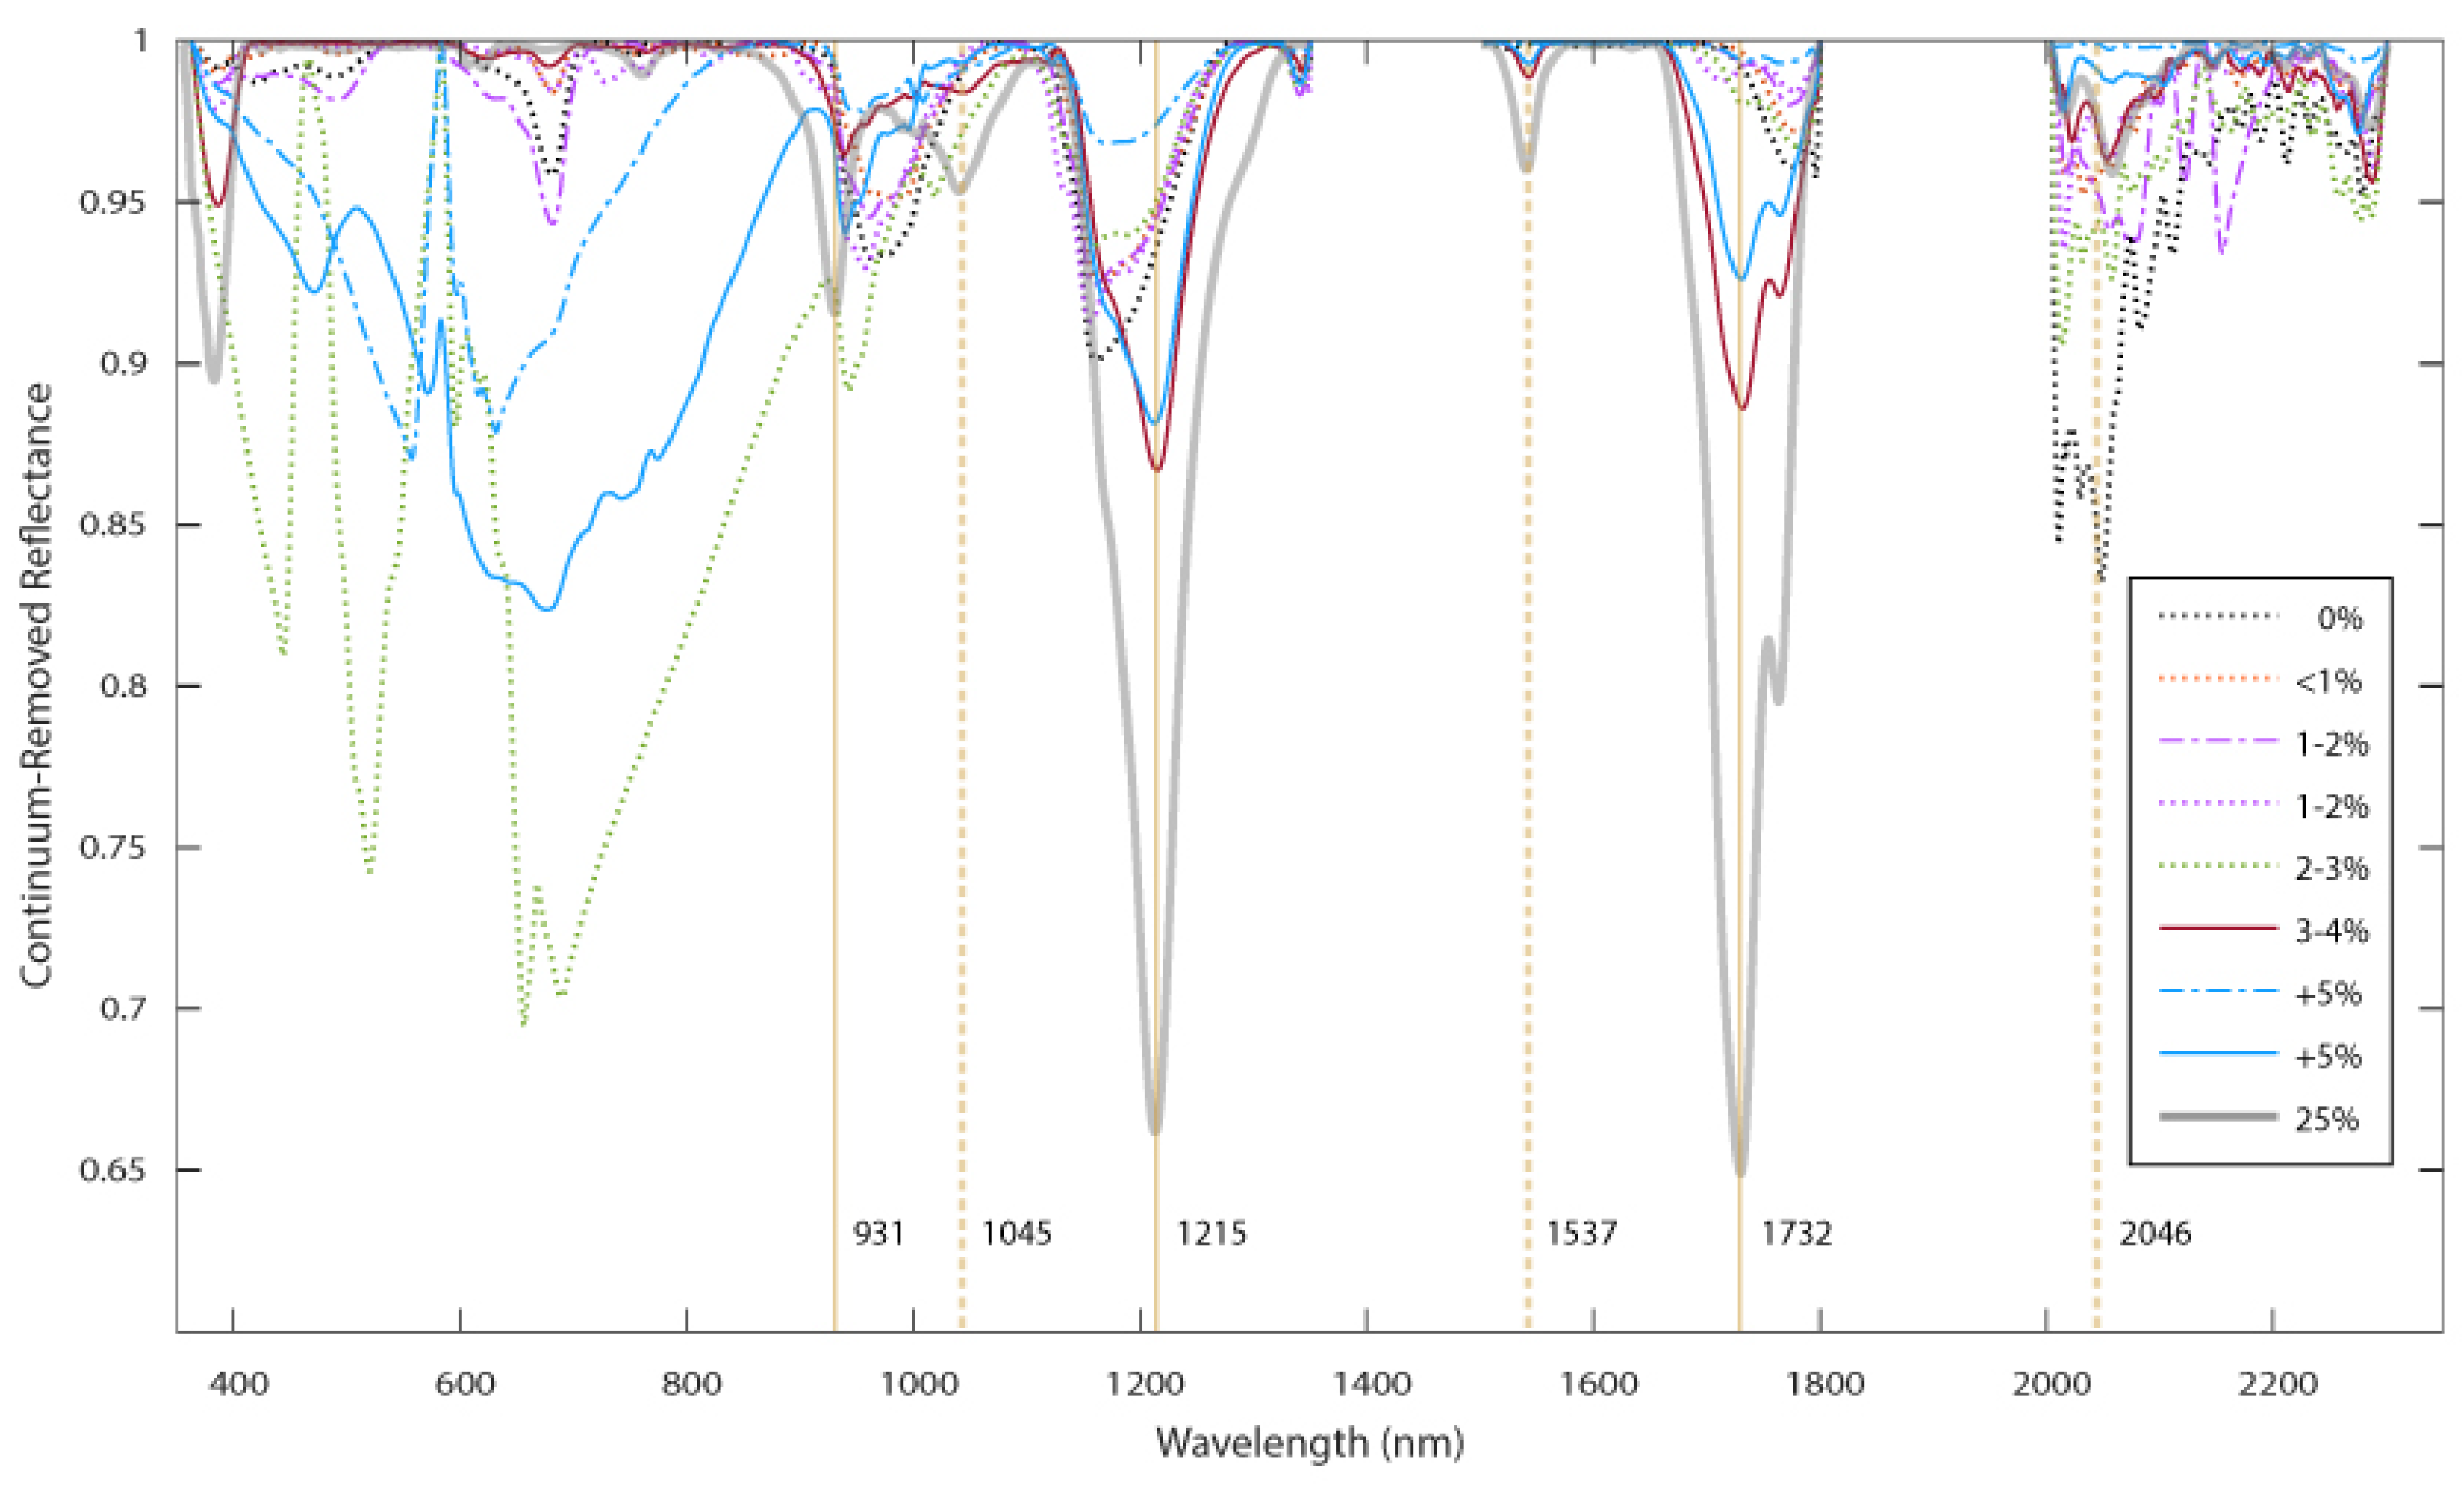
The 931 nm, 1045 nm, 1537 nm and 2046 nm plastic absorption features were not visually distinguishable from non-MPD containing quadrats before or after continuum removal (Figure 5 and Figure 6). This was confirmed with the Mann–Whitney U-test (see below), where no in situ samples were statistically different around these plastic absorption features. On the other hand, the 1215 nm feature and 1732 nm features are visible in some of the samples shown in Figure 5 and were statistically different from quadrats with no MPD. For the intentionally created sample with MPD surface cover of 25%, the 931 nm, 1045 nm, 1215 nm, 1537 nm and 1732 nm absorption features were distinguishable from sand upon visual inspection. The 2313 nm feature was not distinguishable in our samples, however this may be the due to the extended fibreoptic cable used with the Fieldspec Pro.
Both the in situ MPD-containing quadrats, and the artificially created 25% MPD surface cover quadrat had spectra that resemble that of plastic spectra published in the literature [29,30], with the artificially created quadrat having the deepest absorption features at 1215 nm and 1732 nm (Figure 6). In Figure 6, both the relative variability of VIS region spectra can be seen, as well as the relatively similar spectra in the NIR-SWIR region.
3.3. Statistical Differences
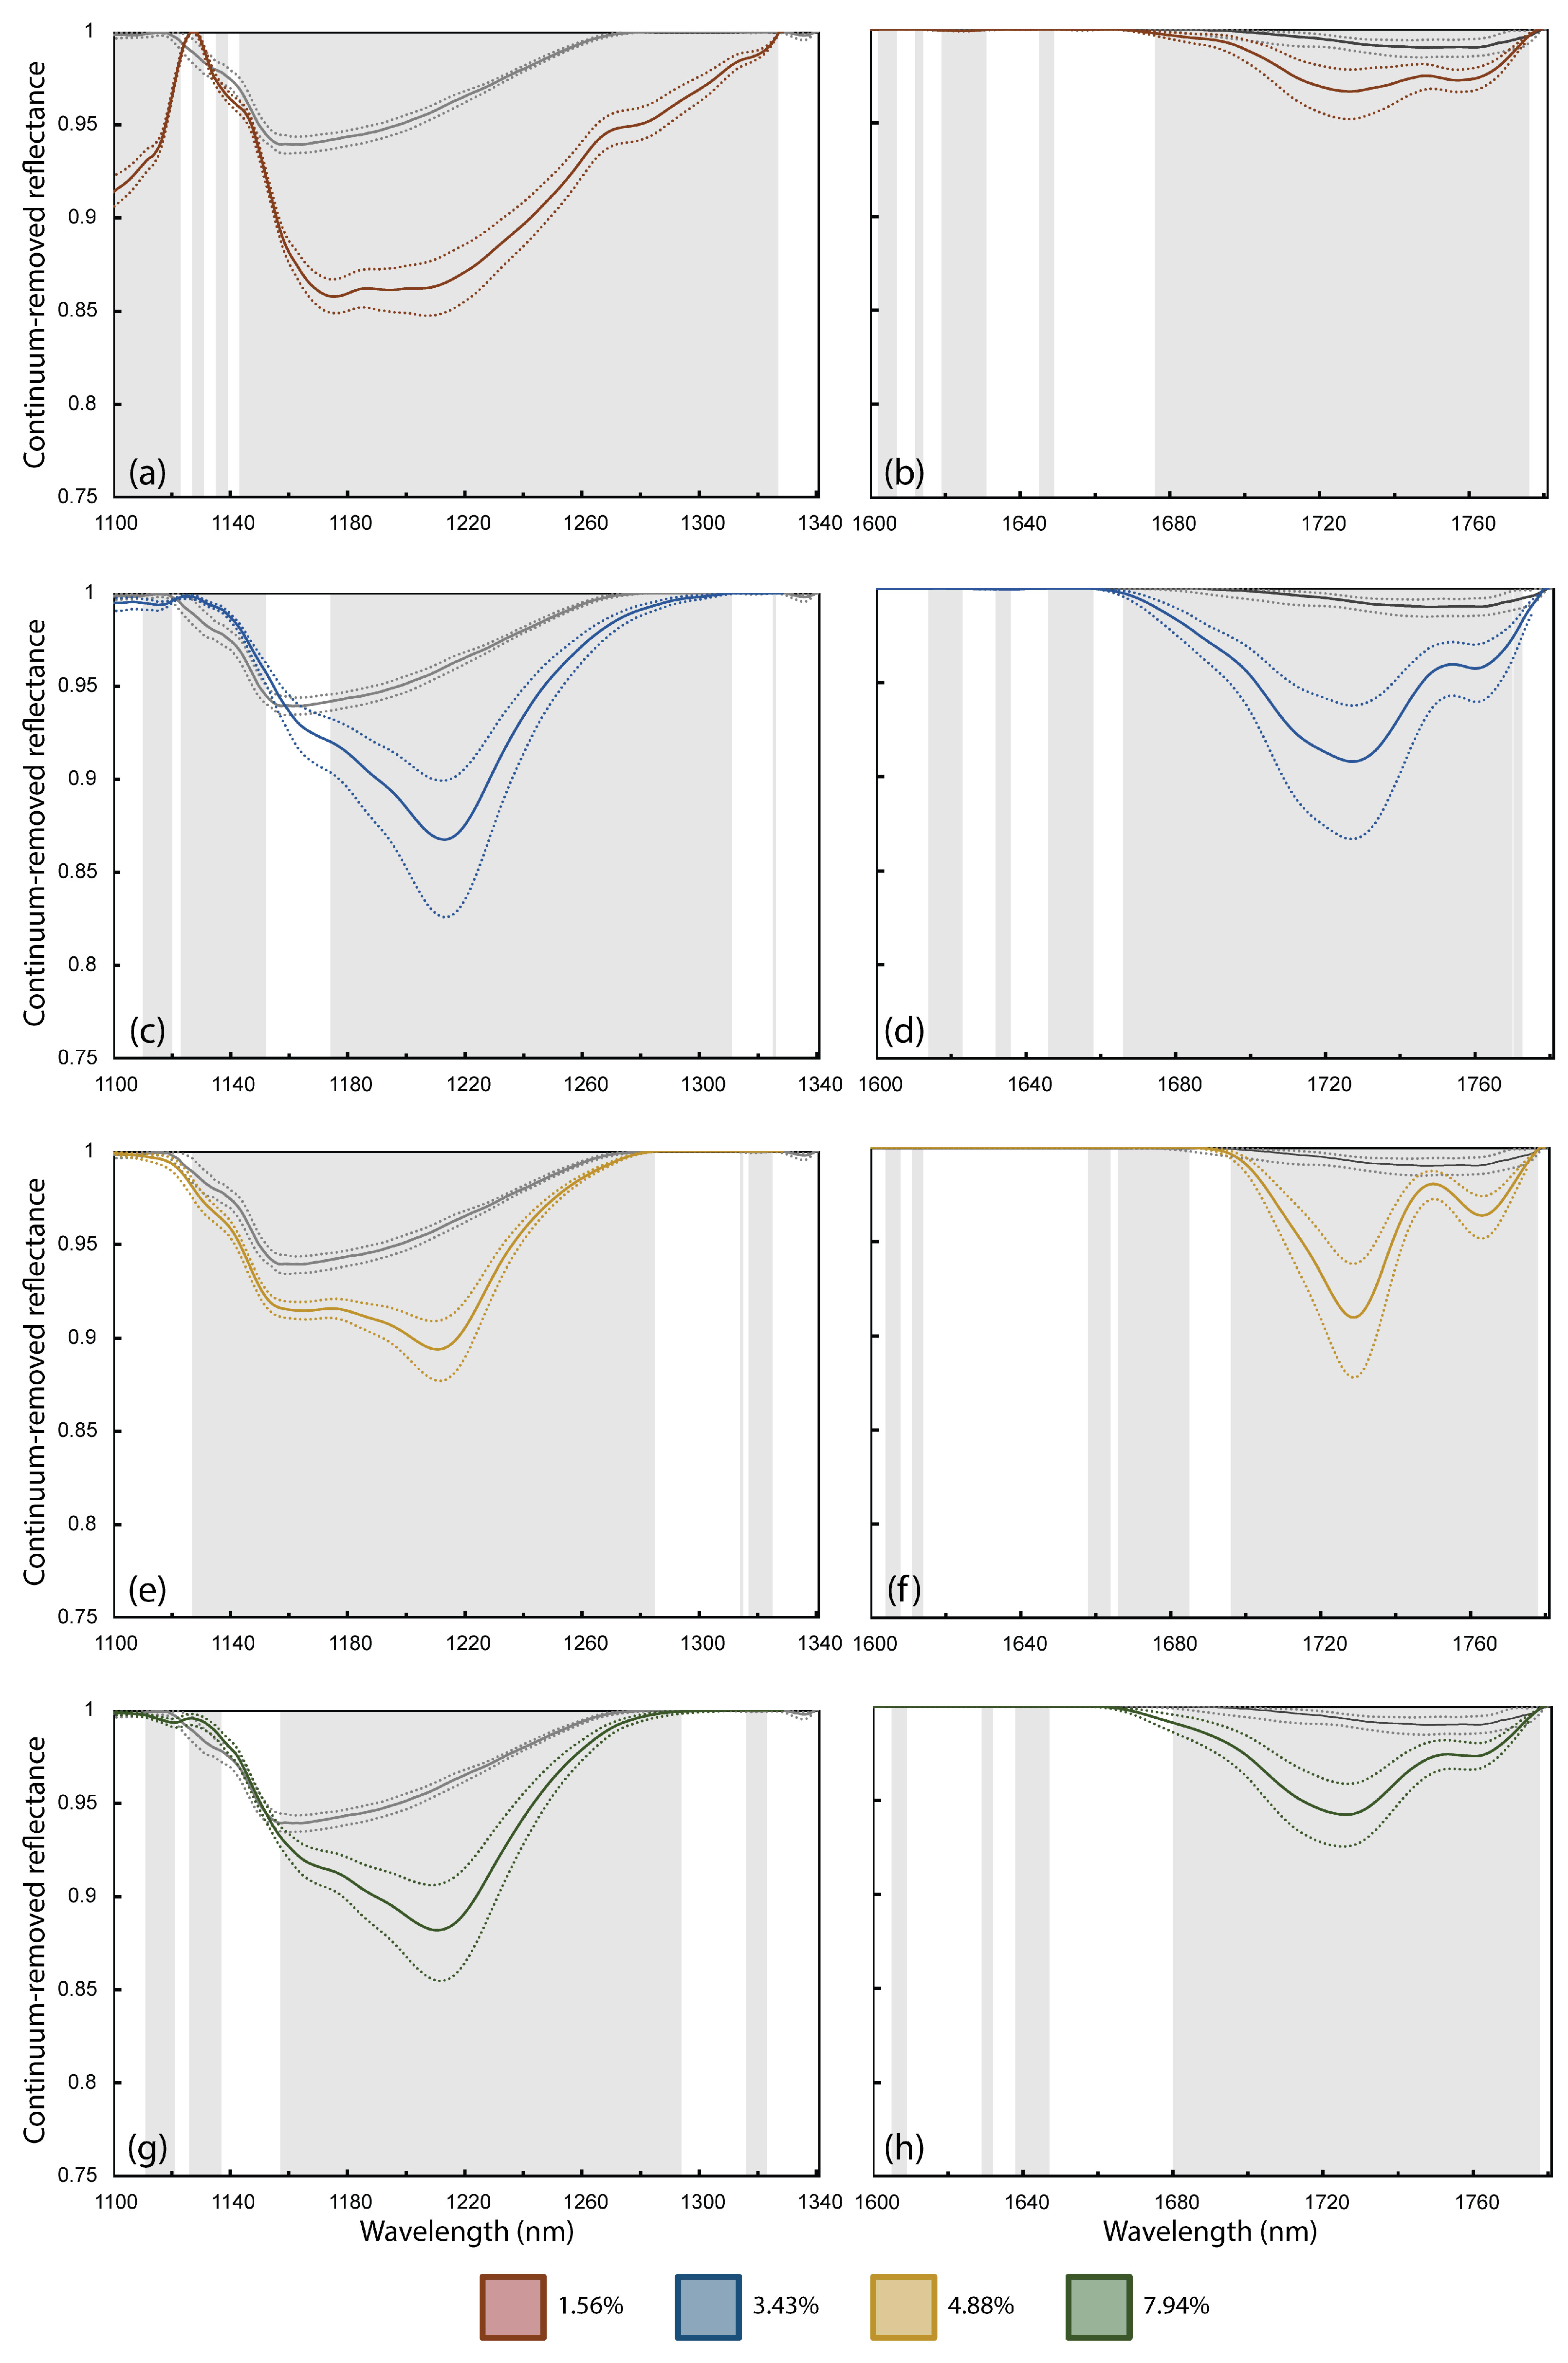
Our results show that these differences in reflectance spectra around 1215 nm and 1732 nm, for in situ MPD, are statistically different from areas of the field sites that did not contain MPD (Figure 7). Additionally, we found that this difference in reflectance occurs across a range of surface covers, from 1.56 to 7.94% MPD surface cover.
However, the spectral absorption features indicative of MPD were not significant in all in situ samples. Only four of the eighteen in situ samples that contained MPD had spectral reflectance that were statistically different from a non-contaminated sample in absorption features at 1215 nm and 1732 nm. One of the samples was from the South Island field site (with 3.43% surface cover), while three were from the West Island field site (with surface covers of 1.56%, 4.88% and 7.94%). For each sample where the spectral feature at 1215 nm was statistically different, the feature at 1732 nm was also statistically different. For the group of quadrats as a whole, the region between 1175 and 1285 nm and between 1695–1775 nm were statistically different when compared to the control group (Figure 7). The sample with the lowest surface cover (1.56%) showed the most similarity in spectral shape to the sand control group. The three samples with higher surface cover had more pronounced absorption centred around 1215 nm and narrower areas of statistical difference when compared to the control group. None of the four samples showed significant difference from the control group relating to spectral absorption features at the 931 nm or 2046 nm.
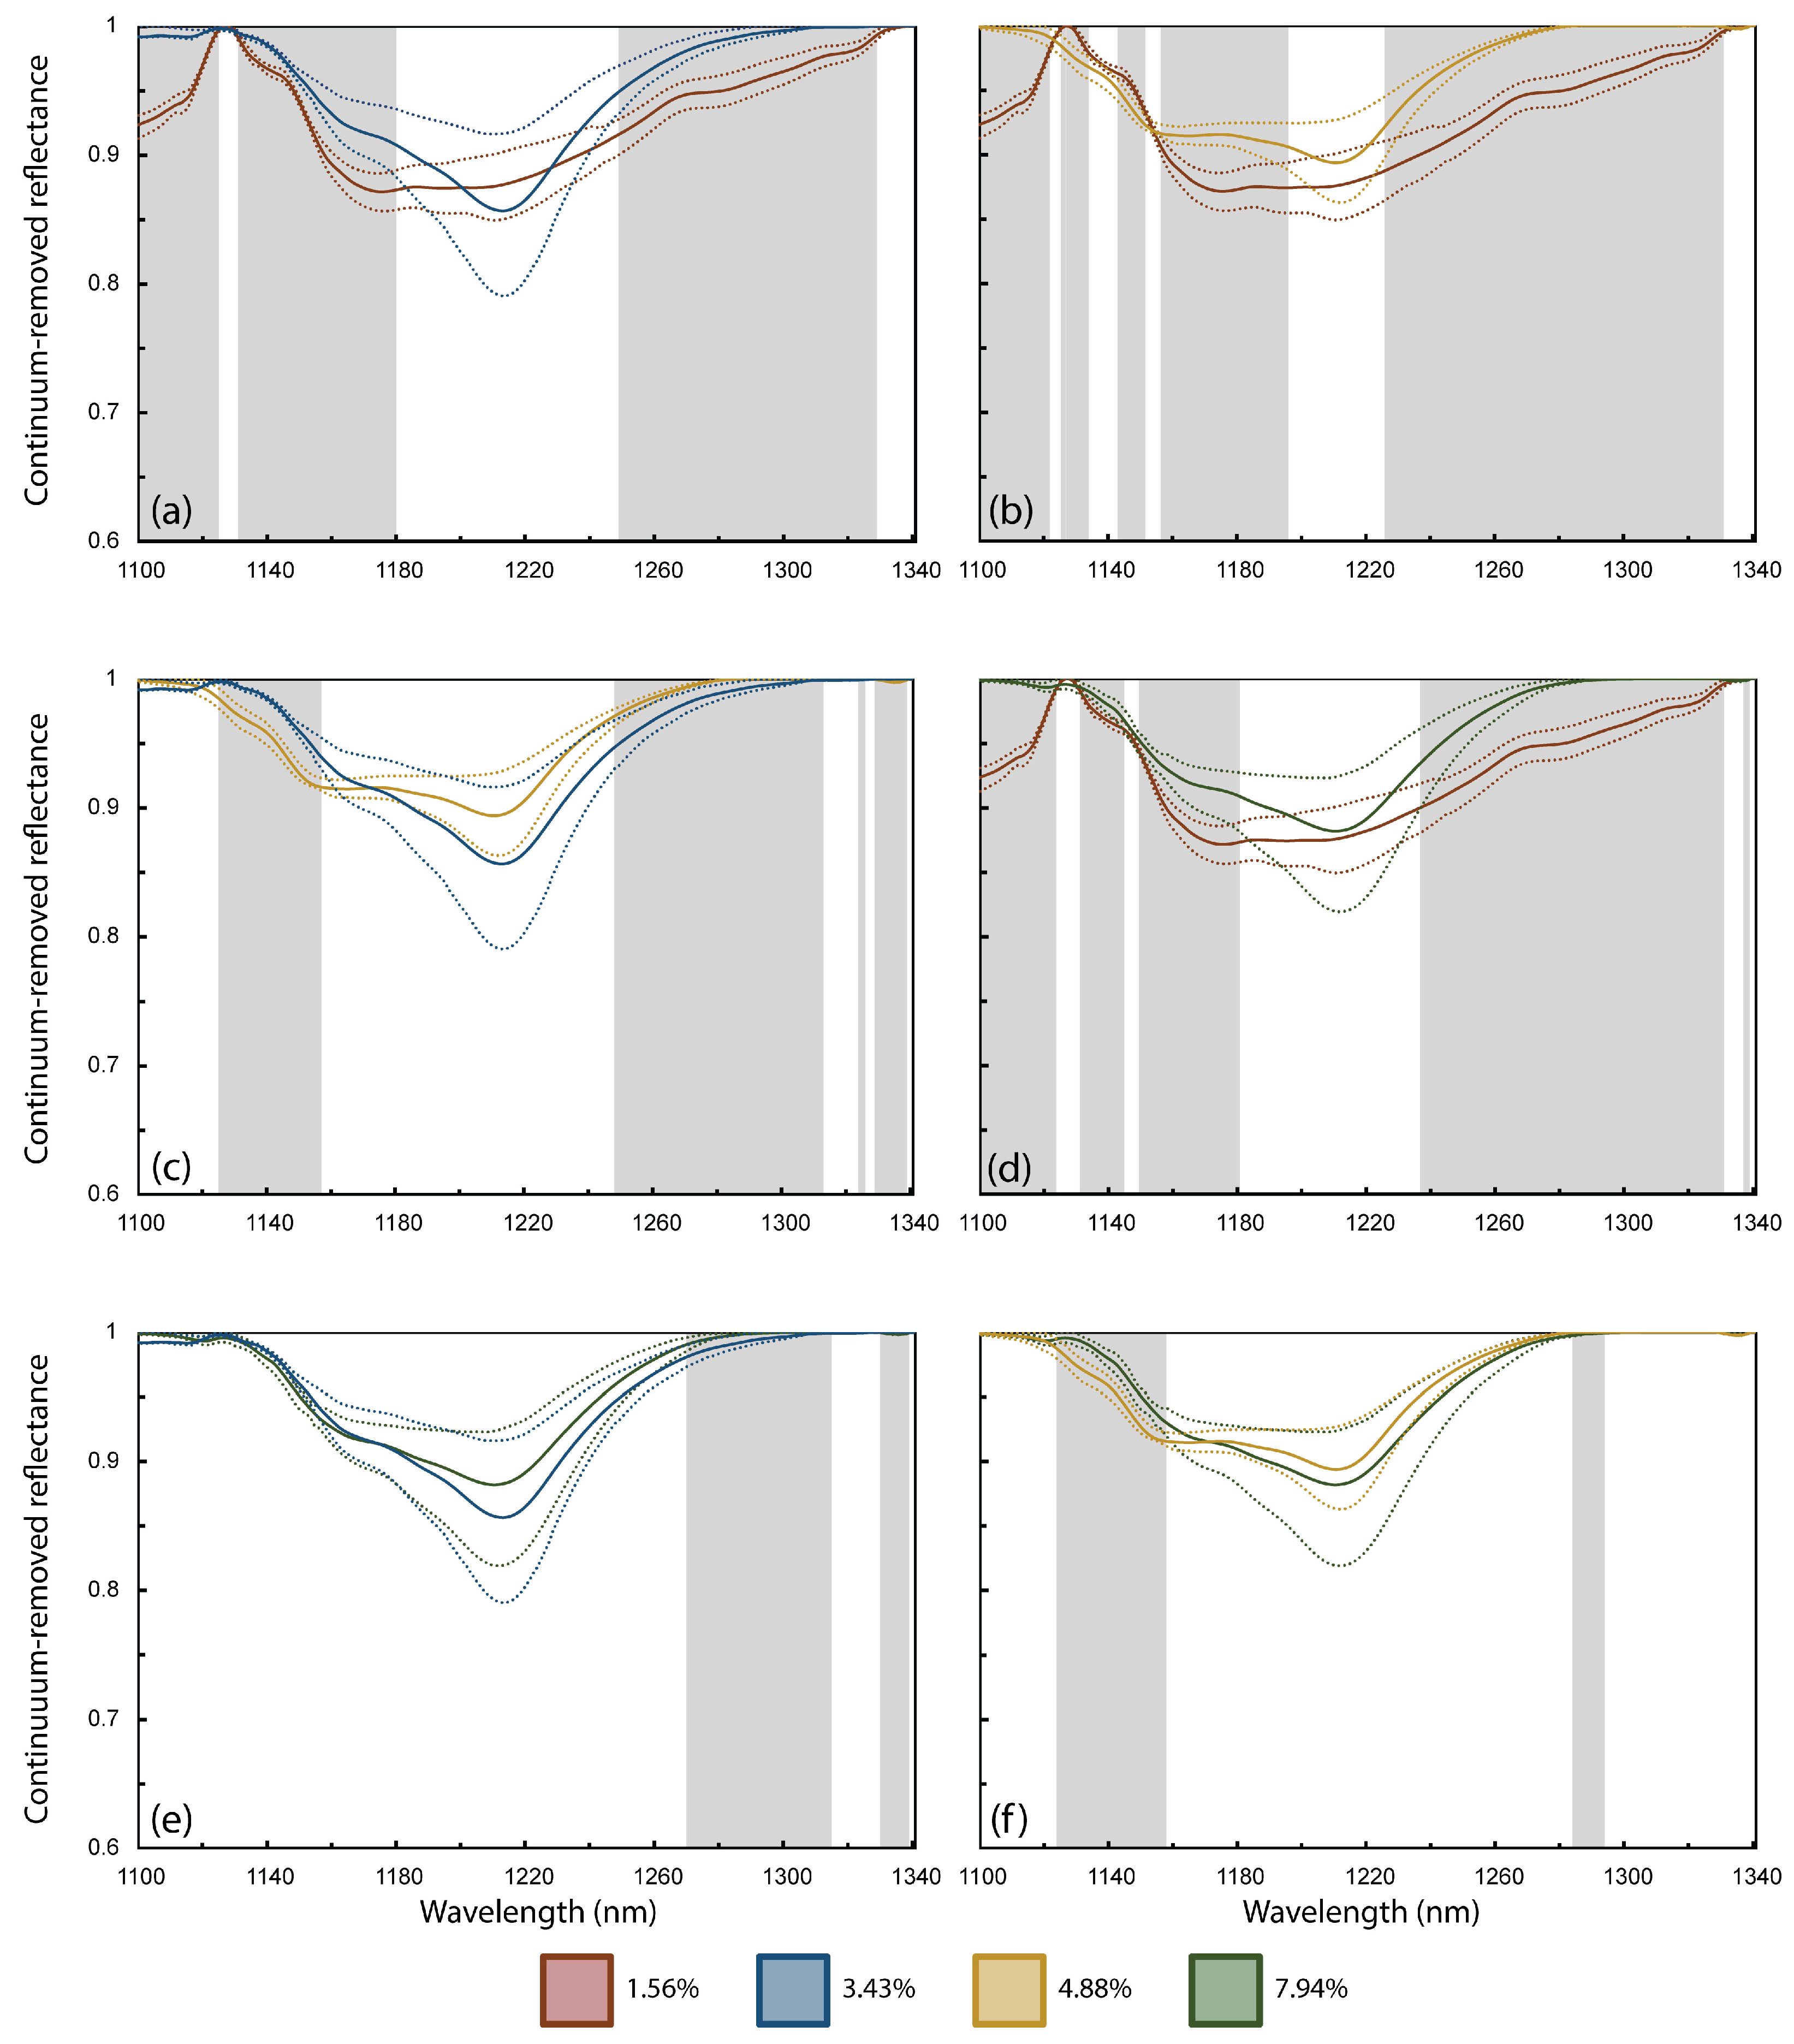
The four samples that were statistically different from the control group were compared to each other, and it was found that there were no statistical differences between the centre-most bands around the 1215 nm feature (Figure 8). For the 1215 nm feature there was no statistical difference in the four quadrats between 1203 nm and 1224 nm. While the central wavelengths of the 1215 nm absorption feature were not statistically different, the ranges on either side of these central wavelengths were (Figure 8). In general the samples with smaller ranges of similarity were those paired with the 1.56% surface cover sample. The samples that showed the most similarity were the ones with 3.43% and 7.94% surface cover and the samples with surface covers of 4.88% and 7.94% (Figure 8).
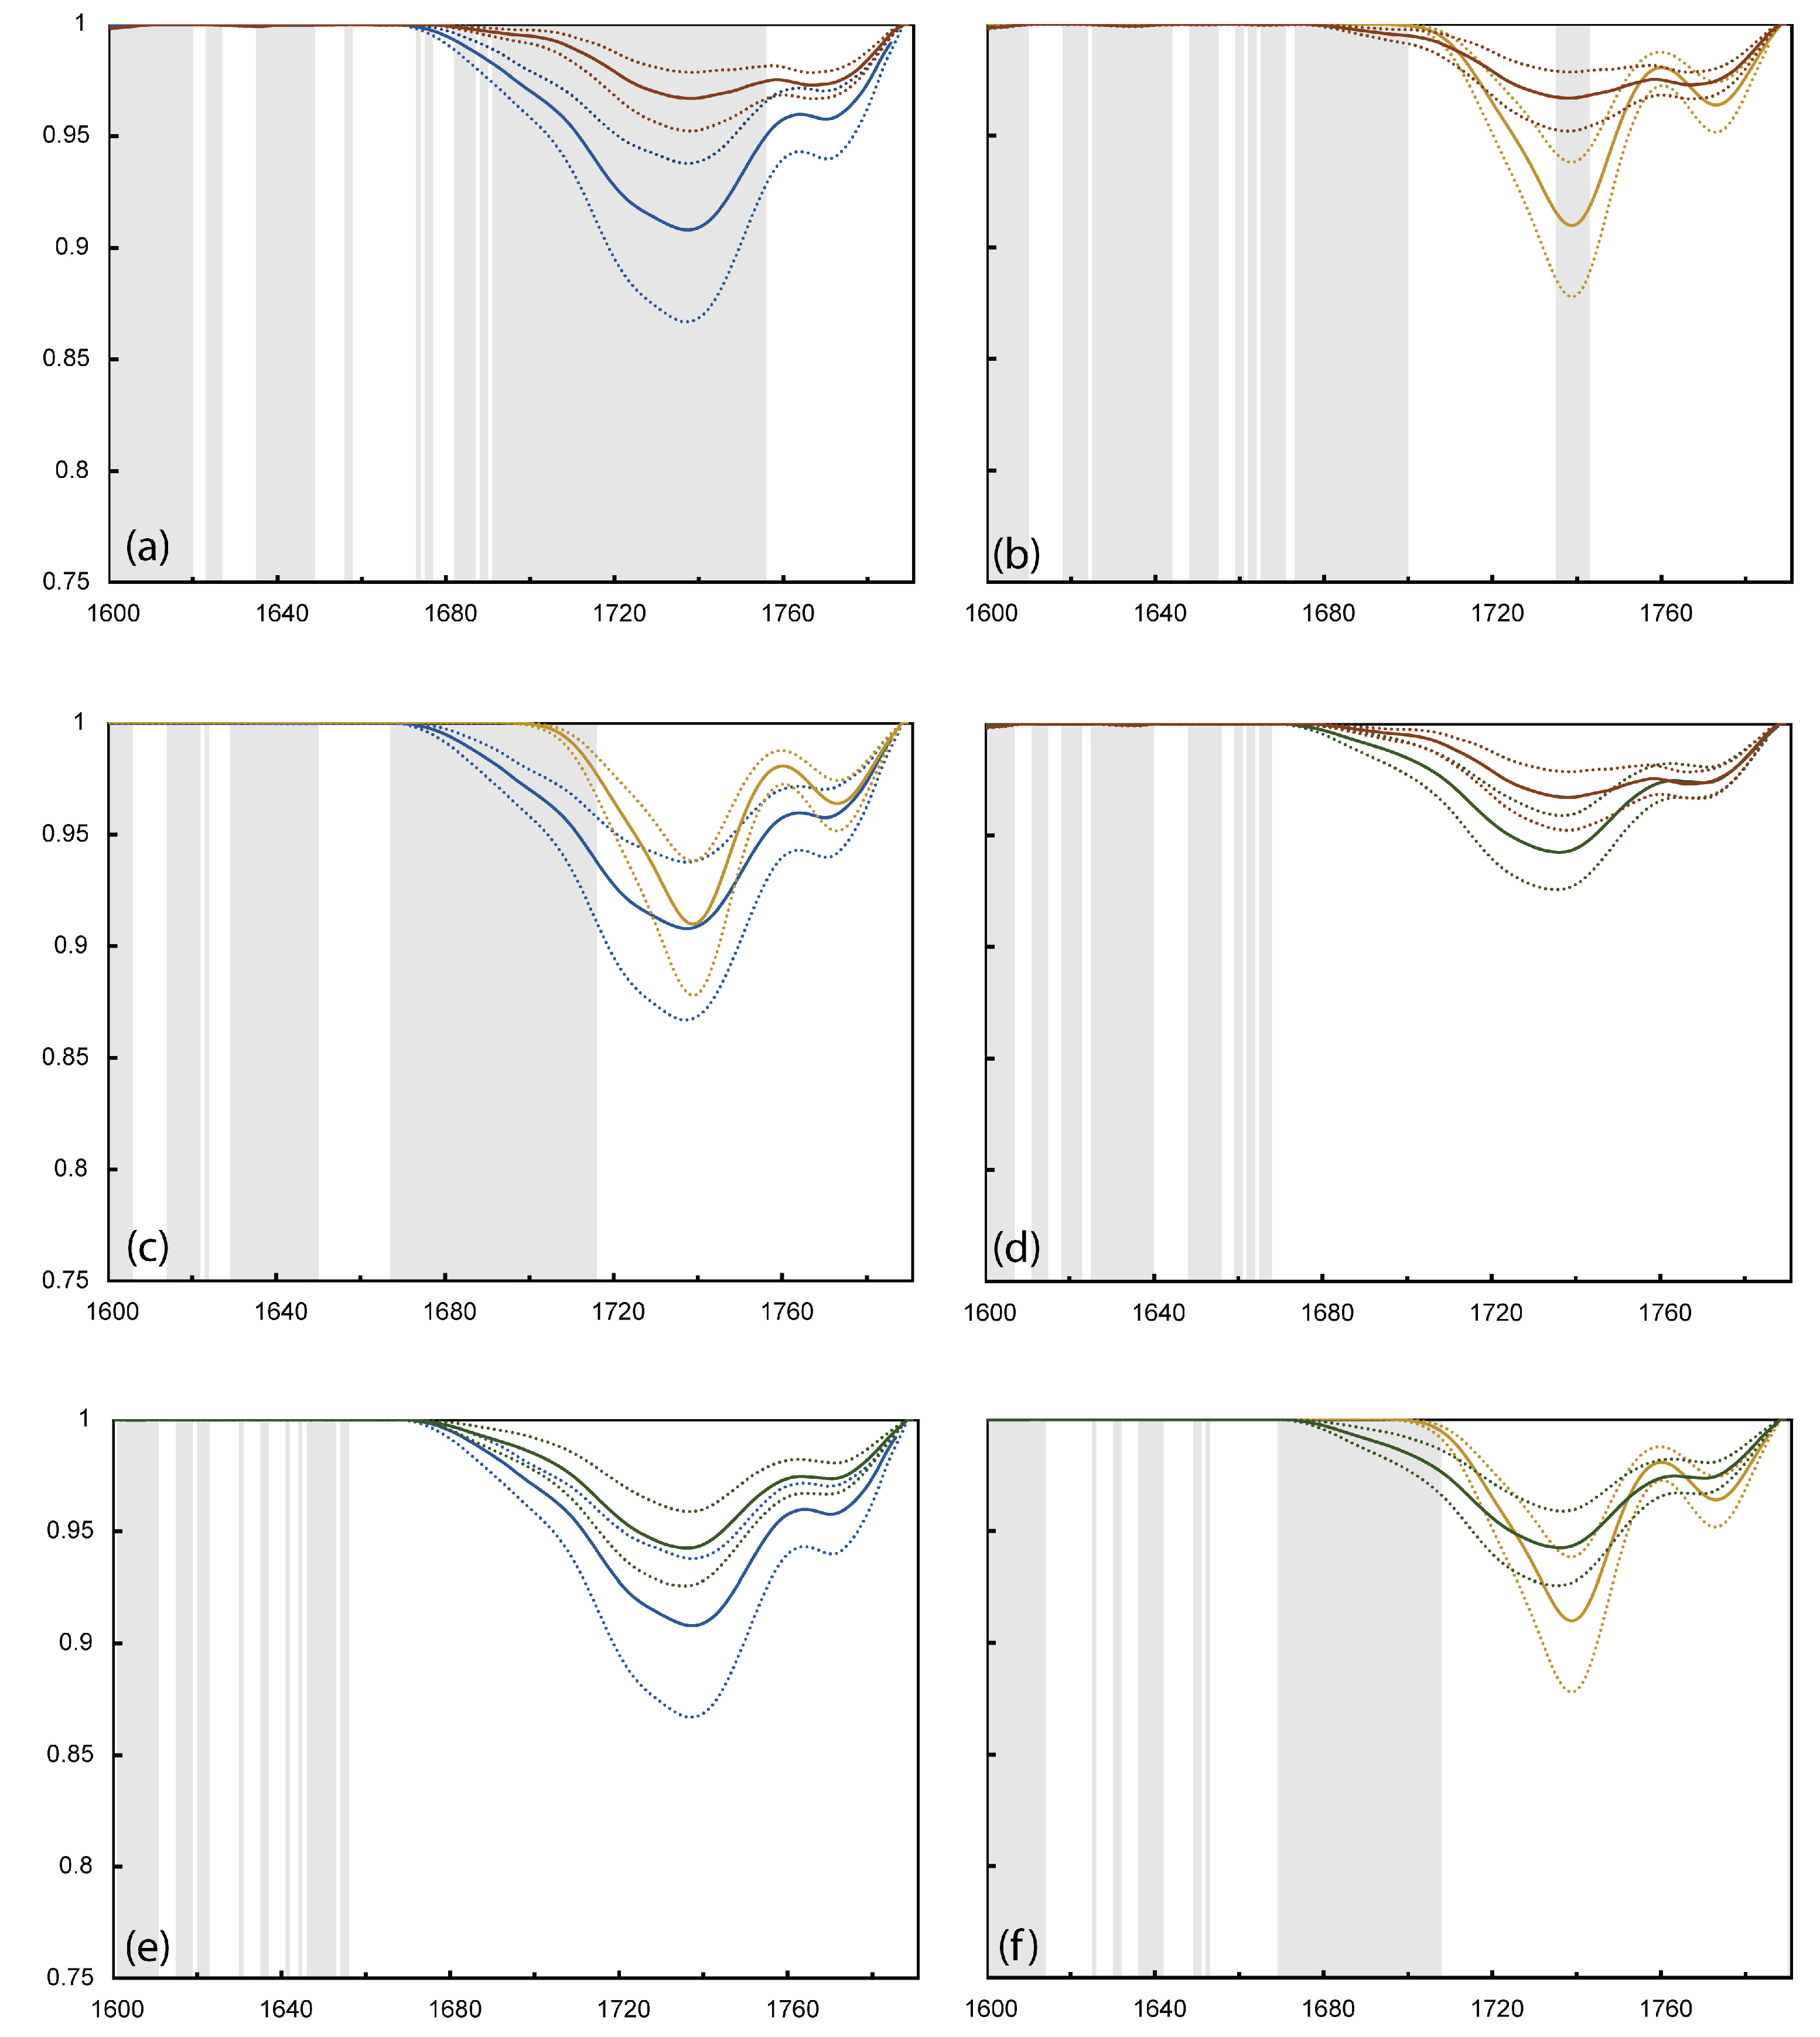
The absorption feature at 1732 nm presented as a double dip, with the first dip around 1732 nm being deeper than the second dip at 1768 nm (Figure 9). The sample with surface cover of 1.56% was statistically different from the samples with surface covers of 3.43% and 4.88% at the 1732 nm absorption peak, but not the one with 7.94% surface cover (Figure 9). The degree of similarity between sample pairs with surface cover of 3.43% and above was greater, with variation in the range of statistical significance observed in the left tail of the absorption feature, between 1640 nm and 1710 nm. Samples with surface cover above 3.43% were not statistically different at the 1732 nm absorption peak. The pair of samples that showed the most similarity (the smallest range of statistically different wavelengths) had surface covers of 3.43% and 7.94%. The sample pair that had the greatest difference (largest range of statistically different wavelengths) were the samples with MPD surface cover of 1.56% and 3.43%.
The results of the Mann–Whitney U-tests indicate that when grouped by MPD surface cover, there was no significant difference between the spectral response of the quadrats with more than 1% MPD surface cover. Groups included samples with more than 1% surface cover, samples with more than 2% cover, samples with more than 3% cover, with more than 4% cover and with more than 5% cover. For the 4 distinguishable spectra, their surface cover ranged from 1.56% to 7.94% and were present in each group (surface cover) of spectra tested.
3.4. Association of Spectral Feature Parameters to Apparent Surface Cover of Marine Plastic Debris
Linear regression results for feature depth, width and area are shown in Table 2. For feature width, there is no evidence of a relationship to MPD surface cover, and in all cases the null hypothesis could not be rejected (p > 0.05). For feature depth at 1215 nm, there was a very weak overall relationship between depth and MPD surface cover (r2 = 0.19) however this relationship was stronger for the West Island beach samples at 1215 nm (r2 = 0.61). Conversely, there was no correlation between MPD surface cover and feature depth for South Island samples with the null hypothesis failing to be rejected. Overall, the West Island samples showed stronger relationships between feature depth and feature area vs. MPD surface cover. The samples from the South Island showed very weak, or no relationship between the spectral feature parameters and MPD surface cover.
Feature depth and area around the 1732 nm absorption feature were smaller than those at 1215 nm, however the relationship between MPD surface cover and depth appears to be stronger (r2 = 0.34, p < 0.05) when compared to the relationship at 1215 nm. When assessed as individual field sites, feature depth maintains a moderate correlation with MPD cover for West Island (r2 = 0.61 at 1215 nm and r2 = 0.65 at 1732 nm).
There is no establishable relationship between feature width and MPD surface cover at 1215 nm (r2 =0.05, p > 0.05) or 1732 nm (r2 =0.02, p > 0.05) when assessing all samples in bulk. When assessed as separate field sites, there is still no relationship. There is a moderate relationship between feature area and MPD surface cover at 1732 nm when assessing all samples as a single group (r2 = 0.31, p < 0.05), however when examining each field site separately, only the West Island samples showed a statistically significant relationship (r2 = 0.75, p < 0.05), while results from the South Island sites showed no relationship and were not statistically significant.
4. Discussion
We utilised proximal remote sensing techniques to measure the spectral reflectance of in situ MPD, on ocean-facing beaches on the Cocos (Keeling) Islands. Spectral samples were collected from 1 m2 quadrats that were randomly distributed above the high tide mark. The substrate in both field sites were carbonate sands [53] which had no notable spectral features in the regions of the EMR that were examined for MPD spectral features. The predominant ocean currents in the region around the Cocos (Keeling) Islands flow in a westerly direction and result in the transport of MPD to the islands [37,54]. While the substrate present here had consistent high reflectance against which the spectral absorption of some plastics could be seen, MPD are deposited on a diversity of substrates with variance in composition and grain size [18]. Additional studies examining MPD deposition on a range of surfaces are needed to develop a better understanding of the spectral contrast between MPD and various substrates.
Our results indicate that it is possible to detect MPD on beaches at concentrations that occur as a result of deposition from ocean sources using proximal spectral remote sensing, although not consistently. We examined several spectral absorption features (931 nm, 1045 nm, 1215 nm, 1537 nm, 1732 nm, 2046 nm) identified in previous studies as candidates for the detection of MPD [29,30,31,32,33]. We found that absorption features at 1215 nm and 1732 nm could be used to detect MPD presence after continuum removal. Previous studies have shown that the 1215 nm feature is suitable for detecting plastic objects floating in the ocean [27], and that the 1215 nm and 1732 nm features can detect large concentrations of debris within landfill and urban settings [26]. The 1045 nm and 1537 nm absorption features could be seen in the spectra of the manipulated sample with 25% MPD surface cover, but not in the samples of naturally occurring in situ MPD. While the absorption features in the manipulated sample were visible, statistical analysis indicated there was insufficient separability between the manipulated sample and the control group around 931 nm. Previous literature suggested that this absorption feature was unlikely to be operationalised given the small magnitude of this feature and the integration of the signal from atmospheric water vapour around 900 nm [30]. Our results confirm that at surface covers between 1 and 10% these three absorption features are not appropriate for detecting MPD on beaches.
There was wide variability in the in situ samples in the visible to near-infrared portion of the spectrum (360–900 nm) as seen in Figure 6. The colour of plastic items contributes to this variability and is one of the challenges for detecting MPD using RGB imagery and video [15]. Several studies utilising low-cost, consumer-ready drones over beaches have highlighted the issues that variable material, colour and geometry of MPD pose to automated detection methods based on RGB high-spatial resolution imagery [21,44]. However, the use of high spatial resolution data collected from RPAS and aerial platforms can provide additional information on plastic items like geometry, which may aid in separating plastics from other non-synthetic targets like whitecaps [19]. There is evidence that some low-cost plug-and-play multispectral devices mounted on RPAS are capable of separating plastic objects from terrestrial backgrounds using VNIR and thermal IR data [55].
Our results for the location of maximum spectral absorption around 1215 nm and 1732 nm agrees with findings from other studies of MPD [29,30,31,32,33]. Previous studies have examined the position and depth of these absorption features using wet and dry ocean-harvested MPD as concentrated 100% plastic samples [30]. The effect of surface cover has also recently been investigated, however for surface covers below 20% this was done with a homogeneous sample of individual polymer type against a black backdrop [29]. In this study, we were able to detect spectral features around 1215 nm and 1732 nm in a natural environment that included other objects such as organic debris and sand that contribute to the bulk spectral reflectance of the sample area. The importance of collecting in situ MPD spectral data has been highlighted in several recent studies [17,18,28] and is still one of the major challenges in developing and validating remote sensing approaches for detecting MPD.
We found that the relationship between MPD surface cover and the strength of the spectral features was inconsistent. Four of the eighteen sites that contained MPD had statistically different spectral reflectance around 1215 nm and 1732 nm when compared to the control group. Two samples with some of the highest MPD surface cover (4.47% and 5.67%) were not statistically different from the control group at the anticipated wavelengths. While individual spectral reflectance were not collected for the plastic items within these quadrats, we hypothesise that the assemblage of MPD in these quadrats, which contained some translucent items and small amounts of hard opaque plastics contributed to the lack of spectral response. By comparison, the quadrat with MPD surface cover of 1.56% was entirely made up of hard, light coloured or white fragments of plastic. This was the only sample with MPD surface cover below 3% that showed statistically different reflectance from the control group.
The difficulty of detecting translucent plastics has been highlighted by Goddijn-Murphy and Dufaur [20] who sampled translucent milk bottles and PET bottles, and by Moshtaghi et al. [19], who sampled films and transparent plastics as part of their studies of the spectral reflectance of MPD in aqueous environments. Both studies observed that detection of thin, translucent and transparent plastics was challenging, with the depth of absorption features being impacted by both object transparency and thickness [19,20,24]. It was noted by Garaba et al. [29] that hard plastics exhibited enhanced reflectance at surface covers of less than 20%, when compared to other plastic types from the same study. Furthermore, in their study using WorldView-3 VNIR imagery to detect MPD, Acuna-Ruz noted that styrofoam spectral features were separable from other MPD in their test sites [18], supporting the idea that different plastic assemblages impact detection accuracy.
The use of spectral feature analysis to compare the shapes of spectral features is an established technique for vegetation monitoring using remote sensing [51,56], and was used here to determine which spectral parameters could be useful for measuring a relationship between MPD surface cover and spectral reflectance (Table 2). No relationship could be established between feature width and MPD surface cover. While no relationship could be established for feature area at 1215 nm, there was a weak relationship at 1732 nm. When both field sites were considered, feature depth at 1215 nm and 1732 nm showed a very weak, but statistically significant relationship with MPD surface cover. We note that the presence of plastics of differing transparency and composition likely contributed to the weak relationships between spectral feature parameters and MPD surface cover. The strength of the relationships for feature depth and feature area were slightly stronger at 1732 nm, possibly due to the lack of coinciding atmospheric absorption [52]. The similarity in feature depths between the quadrats with visible absorption features may indicate that detection limits for MPD on beaches occurs somewhere between 1% and 8% surface cover. At these surface covers, a binary MPD presence/non-presence classification may be a better approach, as suggested by Goddijn-Murphy and Dufaur [20]. This analysis was conducted using data collected in the field, however supplementing these with further studies in a laboratory environment, where the MPD surface cover can be controlled, would be useful and should be a subject for further experiments.
At present, investigations into the impact of MPD surface cover are limited, with Goddijn-Murphy and Dufaur [20] reporting results for surface covers of 25%, 50%, 75% and 100%, and Garaba et al. [29] reporting on surface covers of 0.01%, 0.1%, 1%, 10%, 20%, 40%, 60%, 80% and 100%. Neither of these studies examined MPD surface cover over a sandy substrate as the focus of these studies was buoyant MPD in open waters. While Biermann et al. [28] also examined in situ MPD, their study focused on detecting the presence of floating MPD in coastal waters among other debris like wood, seaweed and spume, rather than quantifying the volume of MPD present. Our results indicate that MPD surface cover between 0.01% and 10% are likely to occur in the beach environment and thus future research should investigate these lower percent covers to find the detection limits for various MPD materials.
The organic debris cover also varied considerably between samples, with some quadrats containing only sand and MPD, but others containing significant cover of non-plastic, non-sand materials like dried seaweed, bamboo and coconut husks alongside MPD. Similarly, MPD is found to be one component of floating debris in coastal waters, with common co-occurrences of wood, seaweed, spume, pumice and organic matter [28]. This presents a complicated mix of background material that contribute to the bulk reflectance of a pixel, and investigating how the proportion of organic non-synthetic debris affects the visibility of the spectral features of MPD should be investigated.
An end-goal for MPD remote sensing is the ability to not only detect the presence of, but to quantify the volumes of MPD. Currently, several challenges need to be resolved before this can be realised. The wide variety of plastic, both in terms of polymer composition and optical properties, makes it challenging to develop a unified detection algorithm. Moshtaghi et al. recently illustrated this when they applied the floating plastic index (FDI) developed by Biermann et al. [28] to a set of plastic items in a controlled environment [19]. The challenge of object thickness and transparency, and the interactions of light on multiple layers of plastics has been highlighted by Goddijn-Murphy et al. [24]. The presence of other synthetic but non-plastic debris on beaches, such as shoes and flip-flops [36,37], also presents another challenge for accurately quantifying MPD accumulations. The variety of substrates that MPD can be found on, including clear water, water containing suspended sediment and algae, mixed with flotsam and various beach sediments support further investigation of the spectral interactions of MPD with these other contributing factors. Indeed, it has been shown that the presence of suspended sediment can alter which wavelengths are most appropriate for separating plastics from murky waters [19].
Studies attempting to use spectral remote sensing to detect or quantify volumes of MPD are still in the early stages of development. For studies over beaches, they are largely limited to the use of RGB drones, though more recent attempts have also included airborne and spaceborne platforms [18,27]. As progress is made towards the accurate detection of MPD in coastal [27,28] and beach environments [18], we can expect the field to progress further towards quantification of volumes of MPD as well. This study represents one of the first attempts to determine the association between SWIR spectral features and MPD litter accumulation on remote island beaches.
5. Conclusions
This study investigated if optical remote sensing was suitable for detecting marine plastic debris (MPD) deposited on beaches by ocean currents. To do this, we collected proximal hyperspectral measurements of in situ MPD on island beaches in the Indian Ocean, and evaluated whether previously identified NIR and SWIR plastic spectral features could be detected in areas that contained MPD. Our results indicate that it is possible to detect in situ MPD using spectral features at 1215 nm and 1732 nm. While further data are needed on the spectral response of MPD as part of the beach environment, these initial results indicate that, despite the differences between open-water and beach environments, there are some similar spectral regions that could be useful for the development of MPD detection algorithms. However, of the eighteen MPD-containing quadrats that were measured, only four were statistically different from beach areas with no MPD, and their apparent surface cover ranged from 1.56% to 7.94%. Our results suggest that other factors, in addition to MPD surface cover, may affect the strength of spectral reflectance from MPD contaminated areas. As such, we were unable to establish a clear relationship between MPD surface cover and spectral parameters like feature depth, width and area. Other potential factors influencing the detection of in situ MPD, like different substrates and plastic composition within a pixel should be investigated. Such studies will help to clarify other components contributing to the bulk reflectance of contaminated beaches and would help advance the field towards remote sensing algorithms that can successfully and reliably detect plastic debris on beaches.
Author Contributions
Conceptualisation of study and methodology used, J.A.G., S.D.J., M.S.-B., data collection and curation by J.L.L., C.J.B., S.D.J., M.S.-B., J.A.G., analysis by J.A.G. Project supervised by A.K.S., S.D.J. All co-authors contributed to original draft preparation and review and editing. All authors have read and agreed to the published version of the manuscript.
Funding
J.A.G. is supported by an Australian Government Research Training Program Scholarship from RMIT University Australia. A.K.S. has received funding and support from the European Research Council (ERC) under the European Union’s Horizon 2020 research and innovation programme (grant agreement n° 834709).
Acknowledgments
We thank Eija Aeonn, Samantha Blades and James Bradley for their assistance in the field, Liza and Mike Dicks for providing accommodation, and members of the Cocos community including Kylie James, Ash James, Peter McCartney and Cat McCartney for transport and logistics assistance. A.K.S. supported by the European Commission ‘BIOSPACE Monitoring Biodiversity from Space’ project (Grant agreement ID 834709, H2020-EU.1.1.).
Conflicts of Interest
The authors declare no conflict of interest.
Appendix A
Figure A1.
Average spectral reflectance measurements from each of the MPD containing quadrats from the two field sites, grouped by surface cover.
Figure A1.
Average spectral reflectance measurements from each of the MPD containing quadrats from the two field sites, grouped by surface cover.

References
- Lavers, J.L.; Bond, A.L.; Hutton, I. Plastic ingestion by flesh-footed shearwaters (Puffinus carneipes): Implications for fledgling body condition and the accumulation of plastic-derived chemicals. Environ. Pollut. 2014, 187, 124–129. [Google Scholar] [CrossRef] [PubMed]
- Gall, S.C.; Thompson, R.C. The impact of debris on marine life. Mar. Pollut. Bull. 2015, 92, 170–179. [Google Scholar] [CrossRef] [PubMed]
- Williams, A.T.; Rangel-Buitrago, N.G.; Anfuso, G.; Cervantes, O.; Botero, C.M. Litter impacts on scenery and tourism on the Colombian north Caribbean coast. Tour. Manag. 2016, 55, 209–224. [Google Scholar] [CrossRef]
- Watkins, E.; Ten Brink, P.; Withana, S.; Mutafoglu, K.; Schweitzer, J.P.; Russi, D.; Kettunen, M. Marine Litter: Socio-Economic Study Scoping Report Commissioned by the United Nations Environment Programme (UNEP); Technical Report; Institute for European Environmental Policy: London, UK; Brussels, Belgium, May 2015. [Google Scholar]
- Eriksen, M.; Lebreton, L.C.; Carson, H.S.; Thiel, M.; Moore, C.J.; Borerro, J.C.; Galgani, F.; Ryan, P.G.; Reisser, J. Plastic Pollution in the World’s Oceans: More than 5 Trillion Plastic Pieces Weighing over 250,000 Tons Afloat at Sea. PLoS ONE 2014, 9, e111913. [Google Scholar] [CrossRef] [Green Version]
- Thompson, R.C. Plastic debris in the marine environment: Consequences and solutions. Mar. Nat. Conserv. Eur. 2006, 193, 107–116. [Google Scholar]
- Olivelli, A.; Hardesty, B.D.; Wilcox, C. Coastal margins and backshores represent a major sink for marine debris: Insights from a continental-scale analysis. Environ. Res. Lett. 2020, 15, 074037. [Google Scholar] [CrossRef]
- Jambeck, J.; Geyer, R.; Wilcox, C.; Siegler, T.; Perryman, M.; Andrady, A.; Narayan, R.; Law, K. Plastic waste inputs from Land into the Ocean. Science 2015, 347, 768–771. [Google Scholar] [CrossRef]
- Lebreton, L.C.; Van Der Zwet, J.; Damsteeg, J.W.; Slat, B.; Andrady, A.; Reisser, J. River plastic emissions to the world’s oceans. Nat. Commun. 2017, 8, 1–10. [Google Scholar] [CrossRef]
- Ryan, P. A Brief History of Marine Litter Research. In Marine Anthropogenic Litter, 1st ed.; Bergmann, M., Gutow, L., Klages, M., Eds.; Springer Open: Berlin/Heidelberg, Germany, 2015; Chapter 1; pp. 1–25. [Google Scholar] [CrossRef] [Green Version]
- Lebreton, L.C.; Andrady, A.; Eriksen, M.; Lebreton, L.C.; Carson, H.S.; Thiel, M.; Moore, C.J.; Borerro, J.C.; Galgani, F.; Ryan, P.G.; et al. Future scenarios of global plastic waste generation and disposal. Palgrave Commun. 2019, 5, 1–11. [Google Scholar] [CrossRef] [Green Version]
- Fingas, M.; Brown, C. Review of oil spill remote sensing. Mar. Pollut. Bull. 2014, 83, 9–23. [Google Scholar] [CrossRef] [PubMed] [Green Version]
- Moses, W.J.; Gitelson, A.A.; Berdnikov, S.; Bowles, J.H.; Povazhnyi, V.; Saprygin, V.; Wagner, E.J.; Patterson, K.W. HICO-based NIR-red models for estimating chlorophyll-a concentration in productive coastal waters. IEEE Geosci. Remote Sens. Lett. 2014, 11, 1111–1115. [Google Scholar] [CrossRef]
- Paige, M.L.B.; Painho, M. Detection of exogenous floating marine debris: An overview of techniques associated with remote sensing. Water Resour. Manag. VIII 2015, 196, 537–548. [Google Scholar] [CrossRef] [Green Version]
- Veenstra, T.S.; Churnside, J.H. Airborne sensors for detecting large marine debris at sea. Mar. Pollut. Bull. 2012, 65, 63–68. [Google Scholar] [CrossRef]
- Hibbitts, C.A.; Bekker, D.; Hanson, T.; Knuth, D.; Goldberg, A.; Ryan, K.; Cantillo, D.; Daubon, D.; Morgan, F. Dual-band discrimination and imaging of plastic objects. In Proceedings of the SPIE—The International Society for Optical Engineering (SPIE 2019), Baltimore, MD, USA, 14–18 April 2019; Volume 11012. [Google Scholar] [CrossRef]
- Topouzelis, K.; Papakonstantinou, A.; Garaba, S.P. Detection of floating plastics from satellite and unmanned aerial systems (Plastic Litter Project 2018). Int. J. Appl. Earth Obs. Geoinf. 2019, 79, 175–183. [Google Scholar] [CrossRef]
- Acuña-Ruz, T.; Uribe, D.; Taylor, R.; Amézquita, L.; Guzmán, M.C.; Merrill, J.; Martínez, P.; Voisin, L.; Mattar, C.B. Anthropogenic marine debris over beaches: Spectral characterization for remote sensing applications. Remote Sens. Environ. 2018, 217, 309–322. [Google Scholar] [CrossRef]
- Moshtaghi, M.; Knaeps, E.; Sterckx, S.; Garaba, S. Spectral reflectance of marine macroplastics in the VNIR and SWIR measured in a controlled environment. Sci. Rep. 2021, 11, 5436. [Google Scholar] [CrossRef]
- Goddijn-Murphy, L.; Dufaur, J. Proof of concept for a model of light reflectance of plastics floating on natural waters. Mar. Pollut. Bull. 2018, 135, 1145–1157. [Google Scholar] [CrossRef]
- Maximenko, N.; Corradi, P.; Law, K.; Sebille, E.; Garaba, S.; Lampitt, R.; Galgani, F.; Martinez-Vicente, V.; Goddijn-Murphy, L.; Veiga, J.; et al. Towards the integrated marine debris observing system. Front. Mar. Sci. 2019, 6. [Google Scholar] [CrossRef] [Green Version]
- Fallati, L.; Polidori, A.; Salvatore, C.; Saponari, L.; Savini, A.; Galli, P. Anthropogenic Marine Debris assessment with Unmanned Aerial Vehicle imagery and deep learning: A case study along the beaches of the Republic of Maldives. Sci. Total Environ. 2019, 693, 133581. [Google Scholar] [CrossRef]
- Martin, C.; McCabe, M.F.; Zhang, Q.; Duarte, C.M.; Parkes, S.; Zhang, X.; Parkes, S.; Zhang, Q.; Zhang, X.; McCabe, M.F.; et al. Use of unmanned aerial vehicles for efficient beach litter monitoring. Mar. Pollut. Bull. 2018, 131, 662–673. [Google Scholar] [CrossRef] [Green Version]
- Goddijn-Murphy, L.; Peters, S.; Sebille, E.V.; James, N.A.; Gibb, S. Concept for a hyperspectral remote sensing algorithm for fl oating marine macro plastics. Mar. Pollut. Bull. 2018, 126, 255–262. [Google Scholar] [CrossRef] [Green Version]
- Aoyama, T. Extraction of marine debris in the Sea of Japan using high-spatial-resolution satellite images. In Proceedings of the SPIE Asia-Pacific Remote Sensing, New Delhi, India, 4–7 April 2016; Volume 9878. [Google Scholar] [CrossRef]
- Garaba, S.P.; Aitken, J.; Slat, B.; Dierssen, H.M.; Lebreton, L.; Zielinski, O.; Reisser, J. Sensing Ocean Plastics with an Airborne Hyperspectral Shortwave Infrared Imager. Environ. Sci. Technol. 2018, 52, 11699–11707. [Google Scholar] [CrossRef]
- Garaba, S.P.; Dierssen, H.M. An airborne remote sensing case study of synthetic hydrocarbon detection using short wave infrared absorption features identified from marine-harvested macro- and microplastics. Remote Sens. Environ. 2018, 205, 224–235. [Google Scholar] [CrossRef]
- Biermann, L.; Clewley, D.; Martinez-Vicente, V.; Topouzelis, K. Finding Plastic Patches in Coastal Waters using Optical Satellite Data. Sci. Rep. 2020, 10, 5364. [Google Scholar] [CrossRef] [Green Version]
- Garaba, S.P.; Arias, M.; Corradi, P.; Harmel, T.; de Vries, R.; Lebreton, L. Concentration, anisotropic and apparent colour effects on optical reflectance properties of virgin and ocean-harvested plastics. J. Hazard. Mater. 2021, 406, 124290. [Google Scholar] [CrossRef] [PubMed]
- Garaba, S.P.; Dierssen, H.M. Hyperspectral ultraviolet to shortwave infrared characteristics of marine-harvested, washed ashore and virgin plastics. Earth Syst. Sci. Data 2020, 12, 77–86. [Google Scholar] [CrossRef] [Green Version]
- Balsi, M.; Esposito, S.; Moroni, M. Hyperspectral characterization of marine plastic litters. In Proceedings of the IEEE International Workshop on Metrology for the Sea, Learning to Measure Sea Health Parameters, MetroSea 2018—Proceedings, Bari, Italy, 8–10 October 2018; pp. 28–32. [Google Scholar] [CrossRef]
- Kühn, F.; Oppermann, K.; Hörig, B. Hydrocarbon index—An algorithm for hyperspectral detection of hydrocarbons. Int. J. Remote Sens. 2004, 25, 2467–2473. [Google Scholar] [CrossRef]
- Chércoles Asensio, R.; San Andrés Moya, M.; De La Roja, J.M.; Gómez, M. Analytical characterization of polymers used in conservation and restoration by ATR-FTIR spectroscopy. Anal. Bioanal. Chem. 2009, 395, 2081–2096. [Google Scholar] [CrossRef]
- Mehrubeoglu, M.; Van Sickle, A.; Turner, J. Detection and identification of plastics using SWIR hyperspectral imaging. In Proceedings of the SPIE—The International Society for Optical Engineering, Online Only, CA, USA, 24 August–4 September 2020; Volume 11504, p. 15. [Google Scholar] [CrossRef]
- Vegter, A.C.; Barletta, M.; Beck, C.; Borrero, J.; Burton, H.; Campbell, M.L.; Costa, M.F.; Eriksen, M.; Eriksson, C.; Estrades, A.; et al. Global research priorities to mitigate plastic pollution impacts on marine wildlife. Endanger. Species Res. 2014, 25, 225–247. [Google Scholar] [CrossRef] [Green Version]
- Lavers, J.L.; Bond, A.L. Exceptional and rapid accumulation of anthropogenic debris on one of the world’s most remote and pristine islands. Proc. Natl. Acad. Sci. USA 2017, 114, 6052–6055. [Google Scholar] [CrossRef] [PubMed] [Green Version]
- Lavers, J.L.; Dicks, L.; Dicks, M.R.; Finger, A. Significant plastic accumulation on the Cocos (Keeling) Islands, Australia. Sci. Rep. 2019, 9, 7102. [Google Scholar] [CrossRef] [PubMed]
- Hanvey, J.S.; Lewis, P.J.; Lavers, J.L.; Crosbie, N.D.; Pozo, K.; Clarke, B.O. A review of analytical techniques for quantifying microplastics in sediments. Anal. Methods 2017, 9, 1369–1383. [Google Scholar] [CrossRef]
- Lavers, J.L.; Oppel, S.; Bond, A.L. Factors influencing the detection of beach plastic debris. Mar. Environ. Res. 2016, 119, 245–251. [Google Scholar] [CrossRef] [PubMed]
- Nelms, S.; Coombes, C.; Galloway, T.; Godley, B.; Lindeque, P.; Witt, M. Marine anthropogenic litter on British beaches: A 10-year nationwide assessment using citizen science data. Sci. Total. Environ. 2017, 579, 1399–1409. [Google Scholar] [CrossRef] [Green Version]
- Serra-Gonçalves, C.; Lavers, J.L.; Bond, A.L. Global Review of Beach Debris Monitoring and Future Recommendations. Environ. Sci. Technol. 2019, 53, 12158–12167. [Google Scholar] [CrossRef] [PubMed]
- Lavers, J.L.; Sharp, P.B.; Stuckenbrock, S.; Bond, A.L. Entrapment in plastic debris endangers hermit crabs. J. Hazard. Mater. 2020, 387, 121703. [Google Scholar] [CrossRef] [PubMed]
- Ballance, A.; Ryan, P.G.; Turpie, J.K. How much is a clean beach worth? The impact of litter on beach users in the Cape Peninsula, South Africa. S. Afr. J. Sci. 2000, 96, 210–213. [Google Scholar]
- Gonçalves, G.; Andriolo, U.; Pinto, L.; Duarte, D. Mapping marine litter with Unmanned Aerial Systems: A showcase comparison among manual image screening and machine learning techniques. Mar. Pollut. Bull. 2020, 155, 111158. [Google Scholar] [CrossRef]
- Kako, S.; Morita, S.; Taneda, T. Estimation of plastic marine debris volumes on beaches using unmanned aerial vehicles and image processing based on deep learning. Mar. Pollut. Bull. 2020, 155, 111127. [Google Scholar] [CrossRef]
- Woodroffe, C.D.; McLean, R.F.; Wallensky, E. Geomorphology of the Cocos (Keeling) Islands. Attol Res. Bull. 1994, 402, 1–34. [Google Scholar] [CrossRef]
- ABS. Census QuickStats for Cocos (Keeling) Islands. 2016. Available online: www.quickstats.censusdata.abs.gov.au (accessed on 15 December 2020).
- Tangaroa, B. Tangaroa Blue. Available online: https://www.tangaroablue.org/resources/clean-up-data-collection/data-sheet/ (accessed on 2 December 2019).
- Provencher, J.F.; Bond, A.L.; Avery-Gomm, S.; Borrelle, S.B.; Bravo Rebolledo, E.L.; Hammer, S.; Kühn, S.; Lavers, J.L.; Mallory, M.L.; Trevail, A.; et al. Quantifying ingested debris in marine megafauna: A review and recommendations for standardization. Anal. Methods 2017, 9, 1454–1469. [Google Scholar] [CrossRef]
- Robinson, I. The field spectroscopy facility post processing toolbox user guide: Post processing spectral data in MATLAB. 2011. Available online: https://www.research.ed.ac.uk/en/publications/the-field-spectroscopy-facility-post-processing-toolbox-user-guid (accessed on 8 March 2021).
- Kokaly, R.F.; Skidmore, A.K. Plant phenolics and absorption features in vegetation reflectance spectra near 1.66 μm. Int. J. Appl. Earth Obs. Geoinf. 2015, 43, 55–83. [Google Scholar] [CrossRef] [Green Version]
- Gao, B.C.; Montes, M.J.; Ahmad, Z.; Davis, C.O. Atmospheric correction algorithm for hyperspectral remote sensing of ocean color from space. Appl. Opt. 2000, 39, 887–896. [Google Scholar] [CrossRef] [PubMed] [Green Version]
- Woodroffe, C.D.; McLean, R.F.; Smithers, S.G.; Lawson, E.M. Atoll reef-island formation and response to sea-level change: West Island, Cocos (Keeling) Islands. Mar. Geol. 1999, 160, 85–104. [Google Scholar] [CrossRef]
- Schott, F.A.; Xie, S.P.; McCreary, J.P. Indian ocean circulation and climate variability. Rev. Geophys. 2009, 47, 1–46. [Google Scholar] [CrossRef]
- Baur, J.; Steinberg, G.; Nikulin, A.; Chiu, K.; de Smet, T.S. Applying deep learning to automate UAV-based detection of scatterable landmines. Remote Sens. 2020, 12, 859. [Google Scholar] [CrossRef] [Green Version]
- Kokaly, R.F.; Despain, D.G.; Clark, R.N.; Livo, K.E. Mapping vegetation in Yellowstone National Park using spectral feature analysis of AVIRIS data. Remote Sens. Environ. 2003, 84, 437–456. [Google Scholar] [CrossRef] [Green Version]
Figure 1.
The Cocos (Keeling) Islands (North Keeling atoll not shown). West and Home Islands have permanent settlements, while Direction Island is a popular tourist location. South Island is more remote and is visited infrequently. Location of field sites indicated with stars, the barrier reefs are shown in dark grey and areas of shallow water in light grey.

Figure 2.
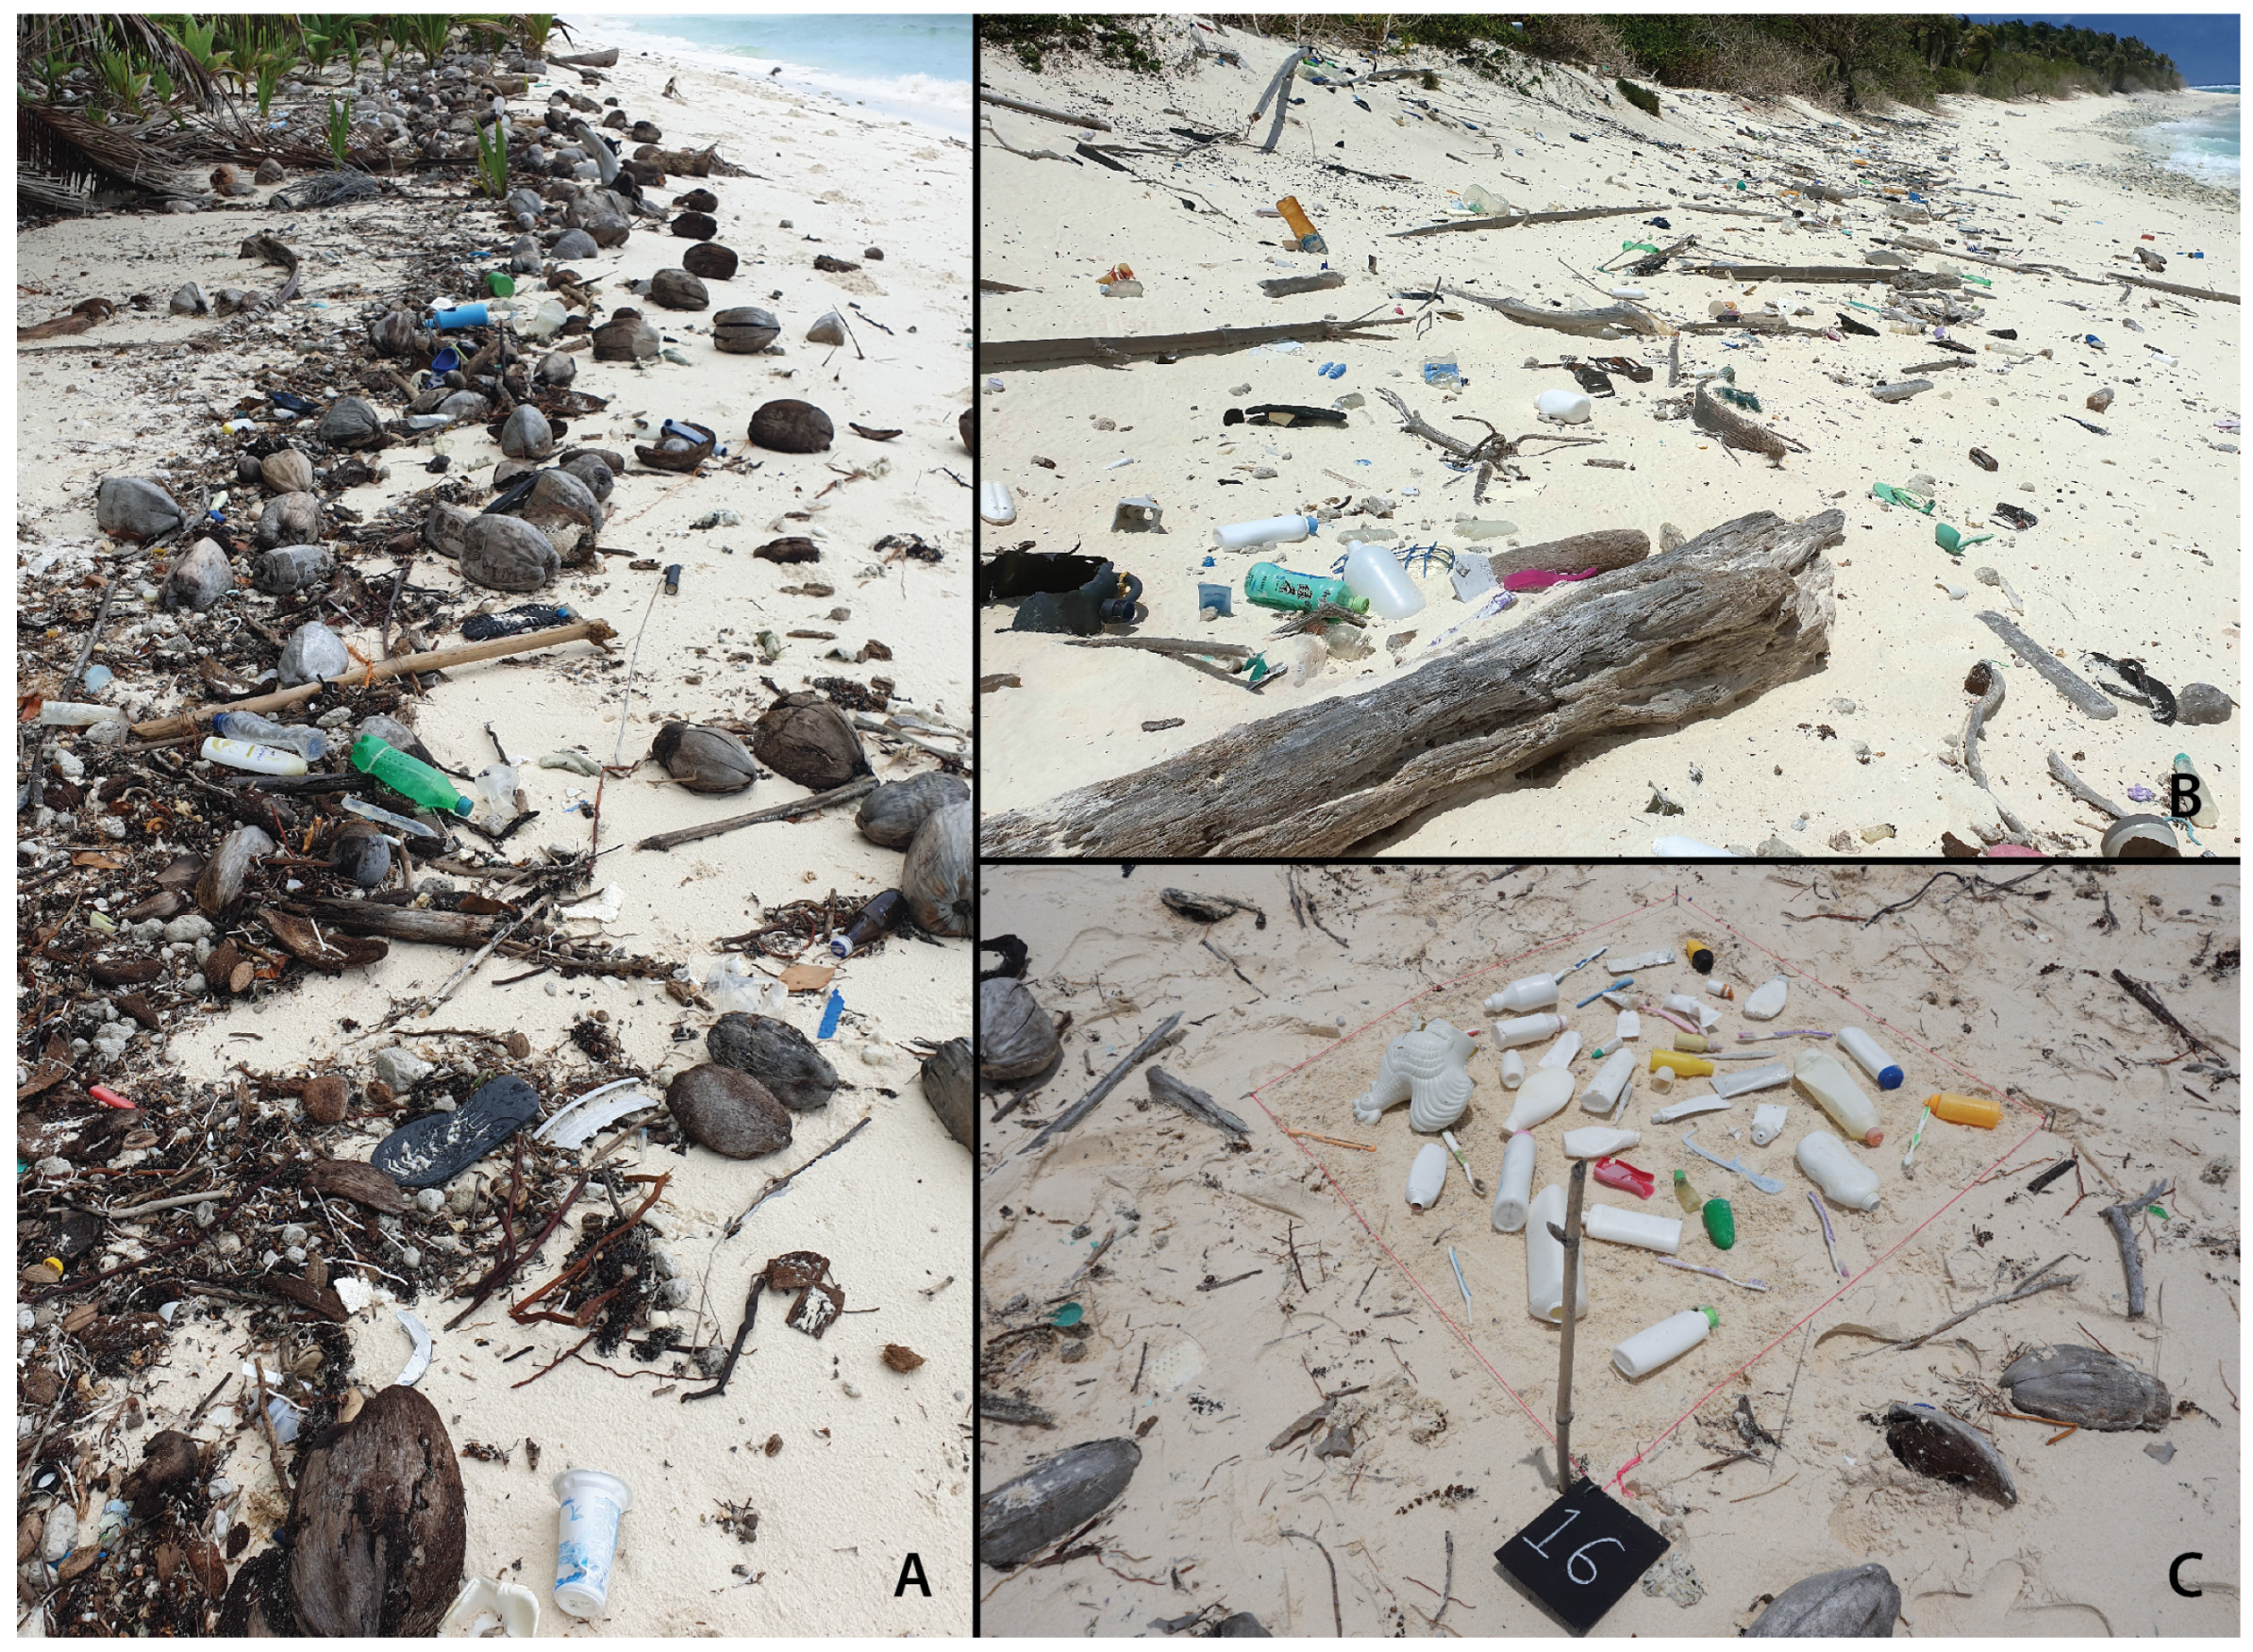
Marine plastic debris (MPD) on the Cocos (Keeling) Islands, February 2020 (A) Northern ocean-facing beach on West Island (B) southern ocean-facing beach on South Island (C) a quadrat setup with an artificially created MPD surface cover of 25%.
Figure 2.
Marine plastic debris (MPD) on the Cocos (Keeling) Islands, February 2020 (A) Northern ocean-facing beach on West Island (B) southern ocean-facing beach on South Island (C) a quadrat setup with an artificially created MPD surface cover of 25%.

Figure 3.
Plastic items within quadrats were digitised to determine the apparent surface coverage of plastic debris (yellow outline).
Figure 3.
Plastic items within quadrats were digitised to determine the apparent surface coverage of plastic debris (yellow outline).

Figure 4.
Spectral Feature Analysis (A) Continuum endpoints used to determine the continuum line for the spectral absorption feature (B) Continuum-hull removed spectral absorption (C) feature depth and feature width (full width at half-maximum as defined by Kokalay and Skidmore [51] and (D) feature area, calculated by summing the individual band depths of each channel within the continuum-removed spectral absorption feature.

Figure 5.
Average spectra of representative quadrats collected on Cocos (Keeling) Island beaches, including a quadrat with no MPD and quadrats with varying MPD abundance (<1%, 1–2%, 2–3%, 3–4% and +5%). The presence of organic matter like seaweed in some quadrats reduced overall reflectance. Wavelengths of interest for plastic detection are shown as vertical lines. Modelled atmospheric transmittance is shown as shaded grey to illustrate the position of atmospheric windows [Adapted with permission from [52] ©The Optical Society].

Figure 6.
Average continuum-removed reflectance of representative quadrats collected on Cocos (Keeling) Island beaches, including a quadrat with no MPD, quadrats with varying MPD abundance (<1%, 1–2%, 2–3%, 3–4% and +5%) and an intentionally created quadrat with 25% surface cover. Vertical lines show the position of absorption features identified in the literature [30]. Plastic absorption features at 931 nm, 1045 nm and 2046 nm were not readily distinguishable in the in situ quadrats when compared to the quadrat with no MPD. The 1215 nm feature and the 1732 nm features are distinguishable when compared to the sand-only sample.

Figure 7.
Continuum-removed reflectance of quadrats that had statistically significant differences in spectra when compared to a control sand group. The mean and 95% upper and lower confidence intervals are shown for both sand-only spectra (dark tones) and the MPD contaminated quadrat (in colour). Statistically significant differences are shaded in grey. Quadrats exhibited surface covers of (a) 1.56% at 1215 nm and (b) 1732 nm, (c) 3.43% at 1215 nm and (d) 1732 nm (e) 4.88% at 1215 nm and (f) 1732 nm and (g) 7.94% at 1215 nm and (h) 1732 nm.

Figure 8.
Continuum-removed reflectance of samples that were statistically different from sand spectra around 1215 nm, compared to each other. The mean and 95% upper and lower confidence intervals are shown for the MPD contaminated quadrats in each graph (in colour). Statistically significant differences are shaded in grey. Sample pairings are (a) 1.56% and 3.43% (b) 1.56% and 4.88% (c) 3.43% and 4.88% (d) 1.56% and 7.94% (e) 3.43% and 7.94% and (f) 4.88% and 7.94%.

Figure 9.
Continuum-removed reflectance of quadrats that were statistically different from sand spectra around 1732 nm, compared to each other. The mean and 95% upper and lower confidence intervals are shown for the MPD contaminated quadrats in each graph (in colour). Sample pairings are (a) 1.56% and 3.43% (b) 1.56% and 4.88% (c) 3.43% and 4.88% (d) 1.56% and 7.94% (e) 3.43% and 7.94% and (f) 4.88% and 7.94%.


Table 1.
Quadrat samples from two field sites (South Island and West Island), with surface cover of plastic debris and the final number of spectra used in analysis.In order to get a representative sample of each quadrat, the spectra were averaged to create one reading per quadrat. An additional quadrat with intentionally created surface cover of 25% was also included for comparison.
| South Island | West Island | ||
|---|---|---|---|
| Surface Cover % | Nr of Spectra | Surface Cover % | Nr of Spectra |
| 0.00 | 20 | 0.00 | 18 |
| 0.46 | 15 | 0.08 | 18 |
| 0.49 | 16 | 1.43 | 19 |
| 0.96 | 15 | 1.50 | 18 |
| 1.24 | 14 | 1.56 | 9 |
| 1.45 | 15 | 1.61 | 20 |
| 1.50 | 11 | 1.63 | 17 |
| 2.69 | 14 | 1.96 | 16 |
| 3.43 | 20 | 2.62 | 20 |
| 4.47 | 16 | 4.89 | 16 |
| 5.67 | 19 | 7.94 | 17 |
| 25.00 1 | 20 | ||
1 Additional quadrat with intentionally created surface cover of 25%.
Table 2.
r2 for feature parameters near 1215 nm and 1732 nm. The two quadrats that contained sand only are excluded.
Table 2.
r2 for feature parameters near 1215 nm and 1732 nm. The two quadrats that contained sand only are excluded.
| Samples | Feature Location (nm) | Feature Parameter | r2 | p-Value |
|---|---|---|---|---|
| All samples (quadrats = 20) | 1215 | Depth | 0.19 | 0.053 |
| Width | 0.05 | 0.3 | ||
| Area | 0.13 | 0.1 | ||
| 1732 | Depth | 0.34 | <0.05 | |
| Width | 0.02 | 0.51 | ||
| Area | 0.31 | <0.05 | ||
| South Island (quadrats = 10) | 1215 | Depth | 0.03 | 0.62 |
| Width | 0.01 | 0.77 | ||
| Area | 0.08 | 0.42 | ||
| 1732 | Depth | 0.09 | 0.78 | |
| Width | 0.13 | 0.31 | ||
| Area | 0.05 | 0.49 | ||
| West Island (quadrats = 10) | 1215 | Depth | 0.61 | <0.05 |
| Width | 0.18 | 0.22 | ||
| Area | 0.31 | 0.09 | ||
| 1732 | Depth | 0.65 | <0.05 | |
| Width | 0.03 | 0.64 | ||
| Area | 0.75 | <0.05 |
Publisher’s Note: MDPI stays neutral with regard to jurisdictional claims in published maps and institutional affiliations. |
© 2021 by the authors. Licensee MDPI, Basel, Switzerland. This article is an open access article distributed under the terms and conditions of the Creative Commons Attribution (CC BY) license (https://creativecommons.org/licenses/by/4.0/).
Share and Cite
MDPI and ACS Style
Guffogg, J.A.; Soto-Berelov, M.; Jones, S.D.; Bellman, C.J.; Lavers, J.L.; Skidmore, A.K. Towards the Spectral Mapping of Plastic Debris on Beaches. Remote Sens. 2021, 13, 1850. https://0-doi-org.brum.beds.ac.uk/10.3390/rs13091850
AMA Style
Guffogg JA, Soto-Berelov M, Jones SD, Bellman CJ, Lavers JL, Skidmore AK. Towards the Spectral Mapping of Plastic Debris on Beaches. Remote Sensing. 2021; 13(9):1850. https://0-doi-org.brum.beds.ac.uk/10.3390/rs13091850
Chicago/Turabian StyleGuffogg, Jenna A., Mariela Soto-Berelov, Simon D. Jones, Chris J. Bellman, Jennifer L. Lavers, and Andrew K. Skidmore. 2021. "Towards the Spectral Mapping of Plastic Debris on Beaches" Remote Sensing 13, no. 9: 1850. https://0-doi-org.brum.beds.ac.uk/10.3390/rs13091850
Note that from the first issue of 2016, this journal uses article numbers instead of page numbers. See further details here.