
Small Object Detection in Remote Sensing Images with Residual Feature Aggregation-Based Super-Resolution and Object Detector Network


Abstract
:
1. Introduction
1.1. Objective and Research Problem
1.2. Background and Related Literature
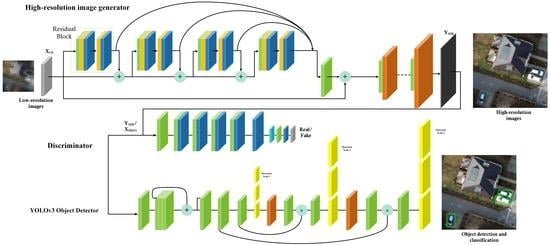
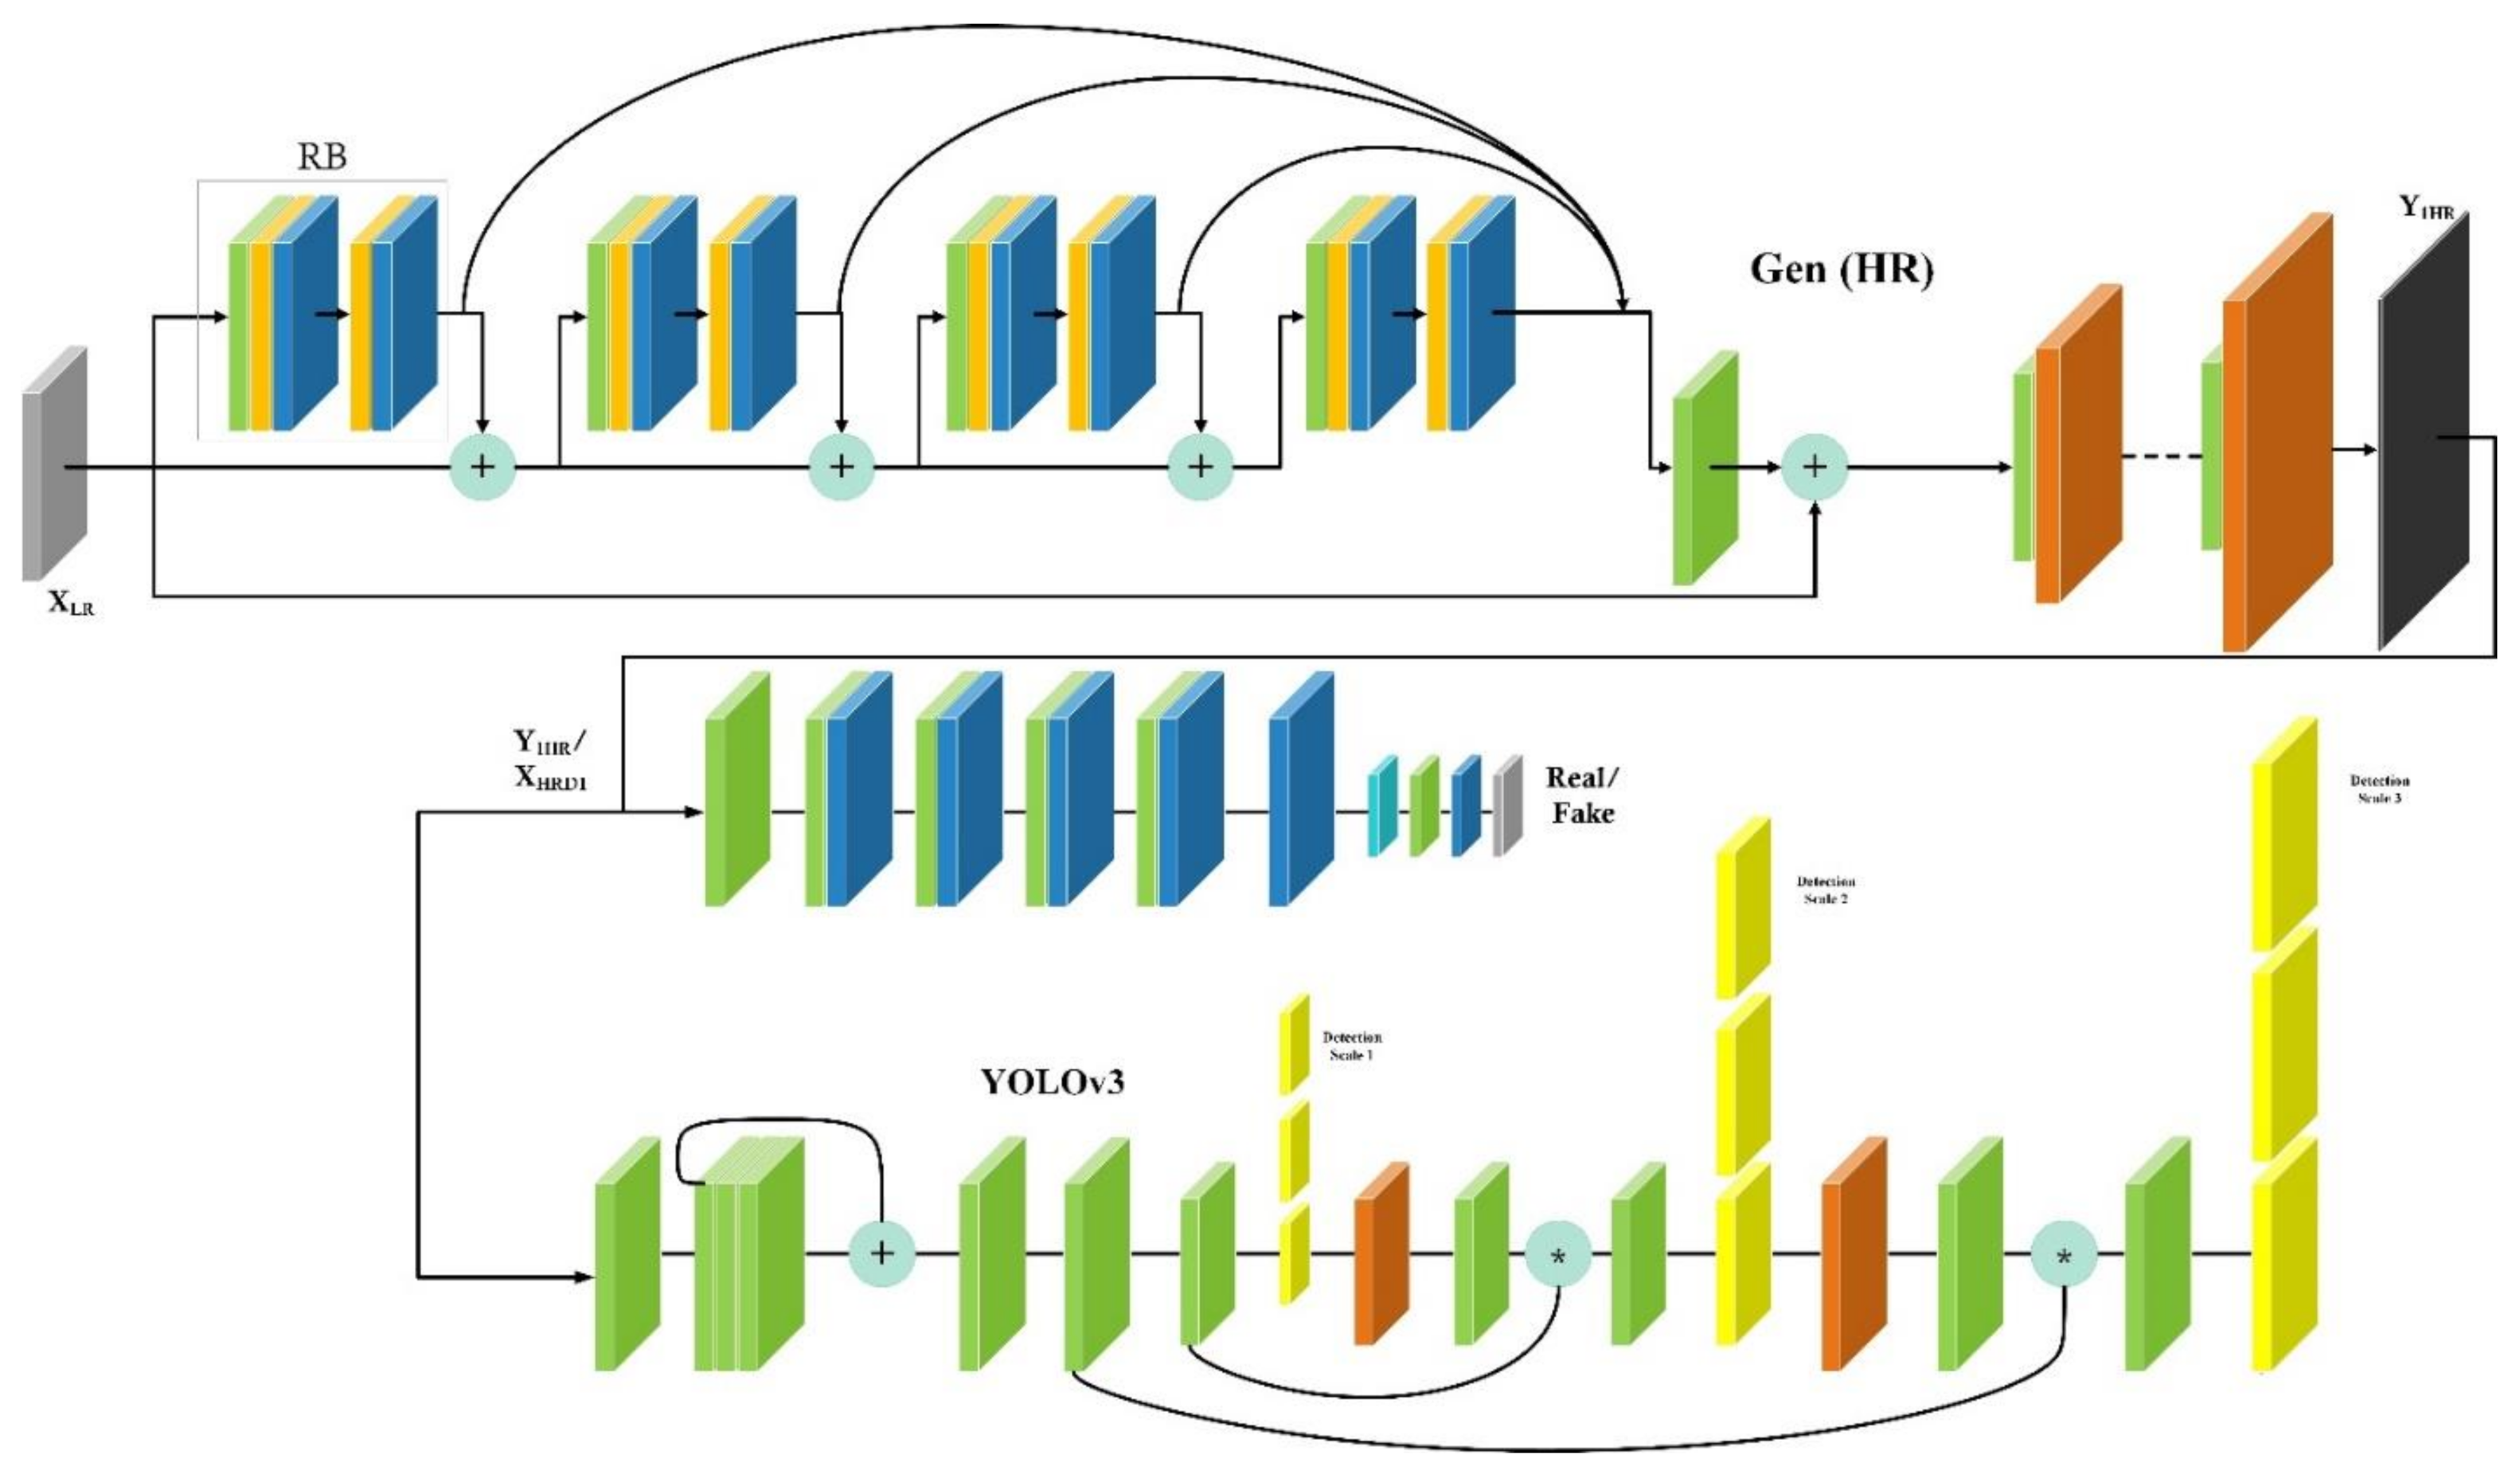
1.3. Proposed Method
1.4. Organization of Research
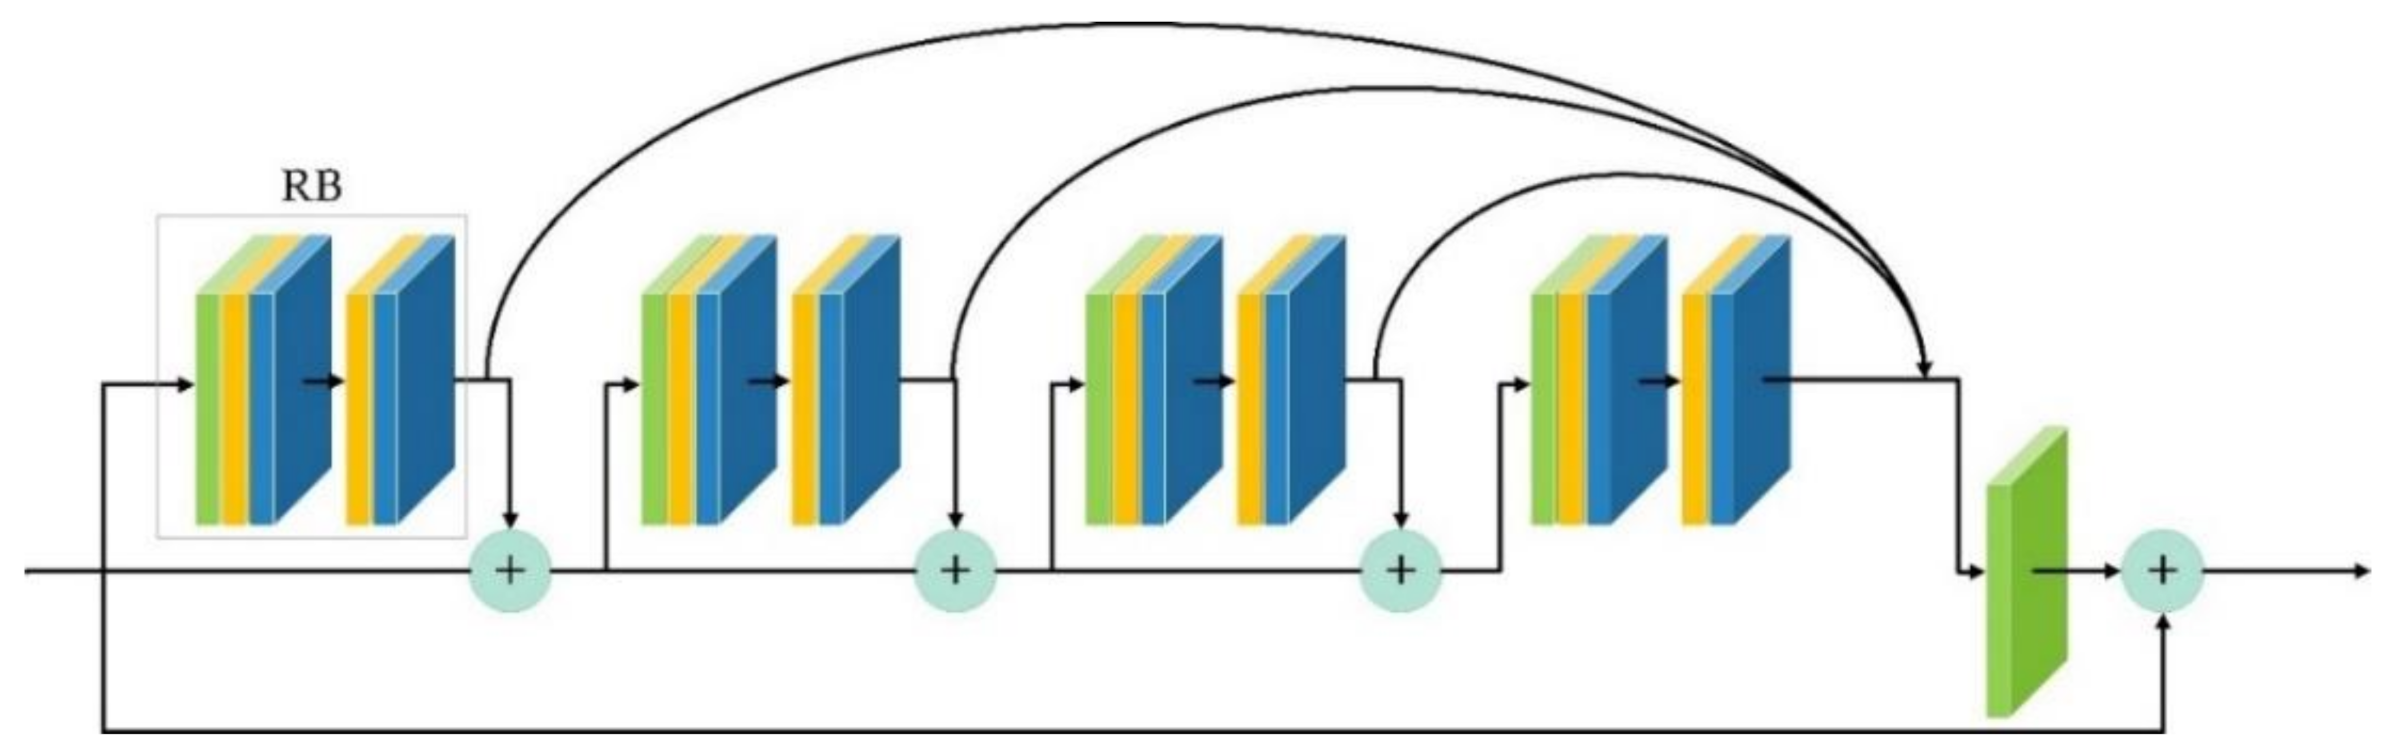
2. Residual Learning for the Image Super-Resolution
3. Methodology
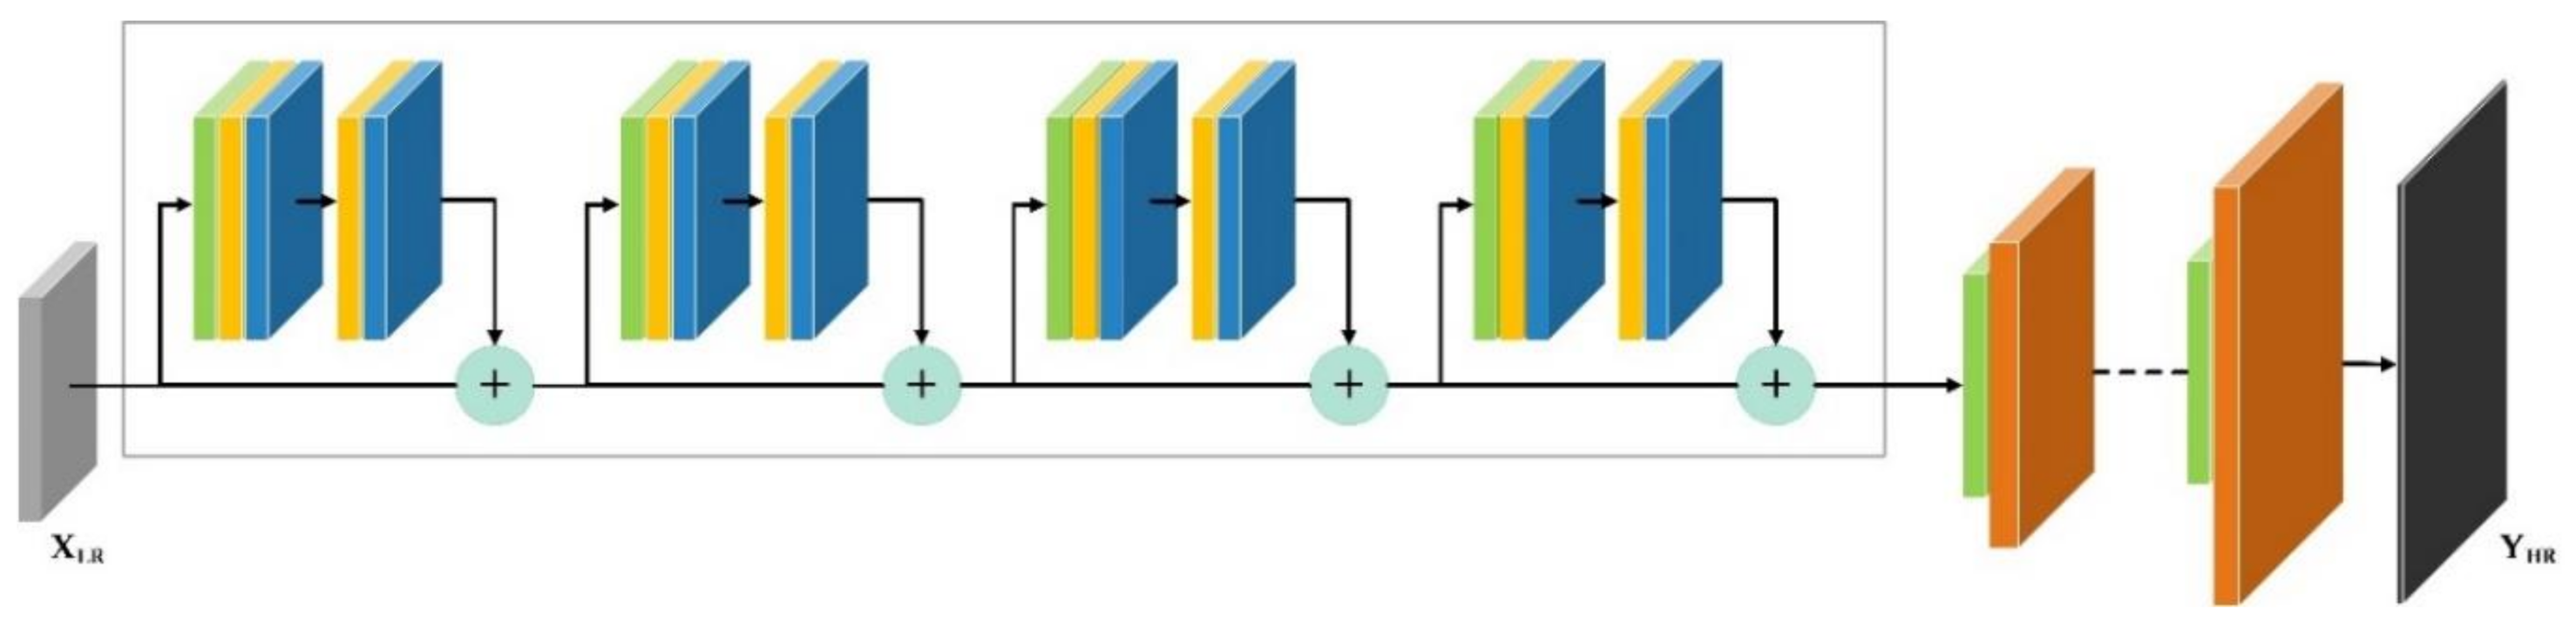
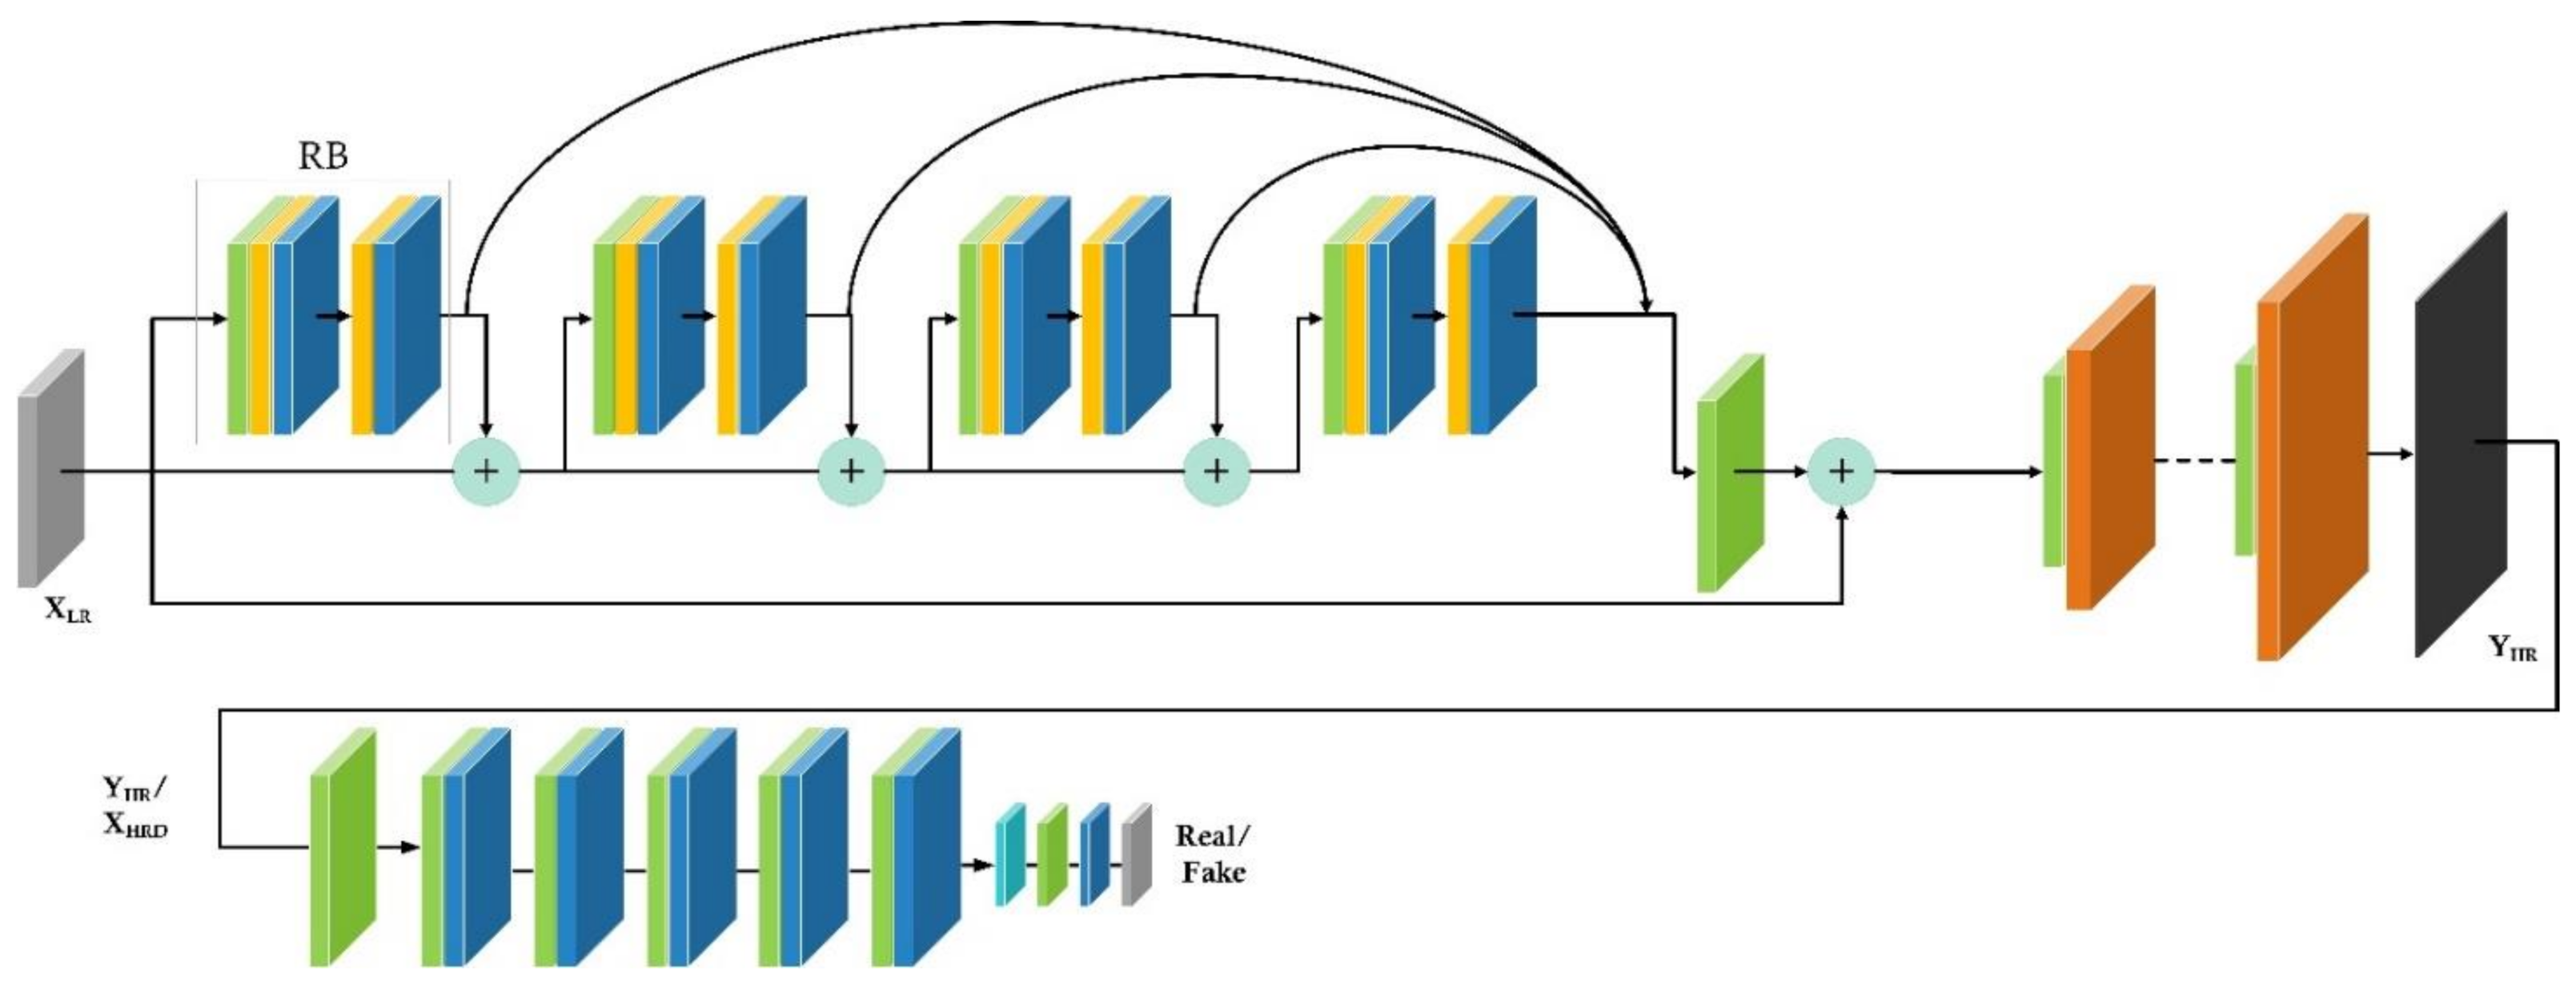
3.1. Basic Network Architecture for Image SR
3.2. Network Improvements
3.2.1. Using Generative Adversarial Network Pipeline
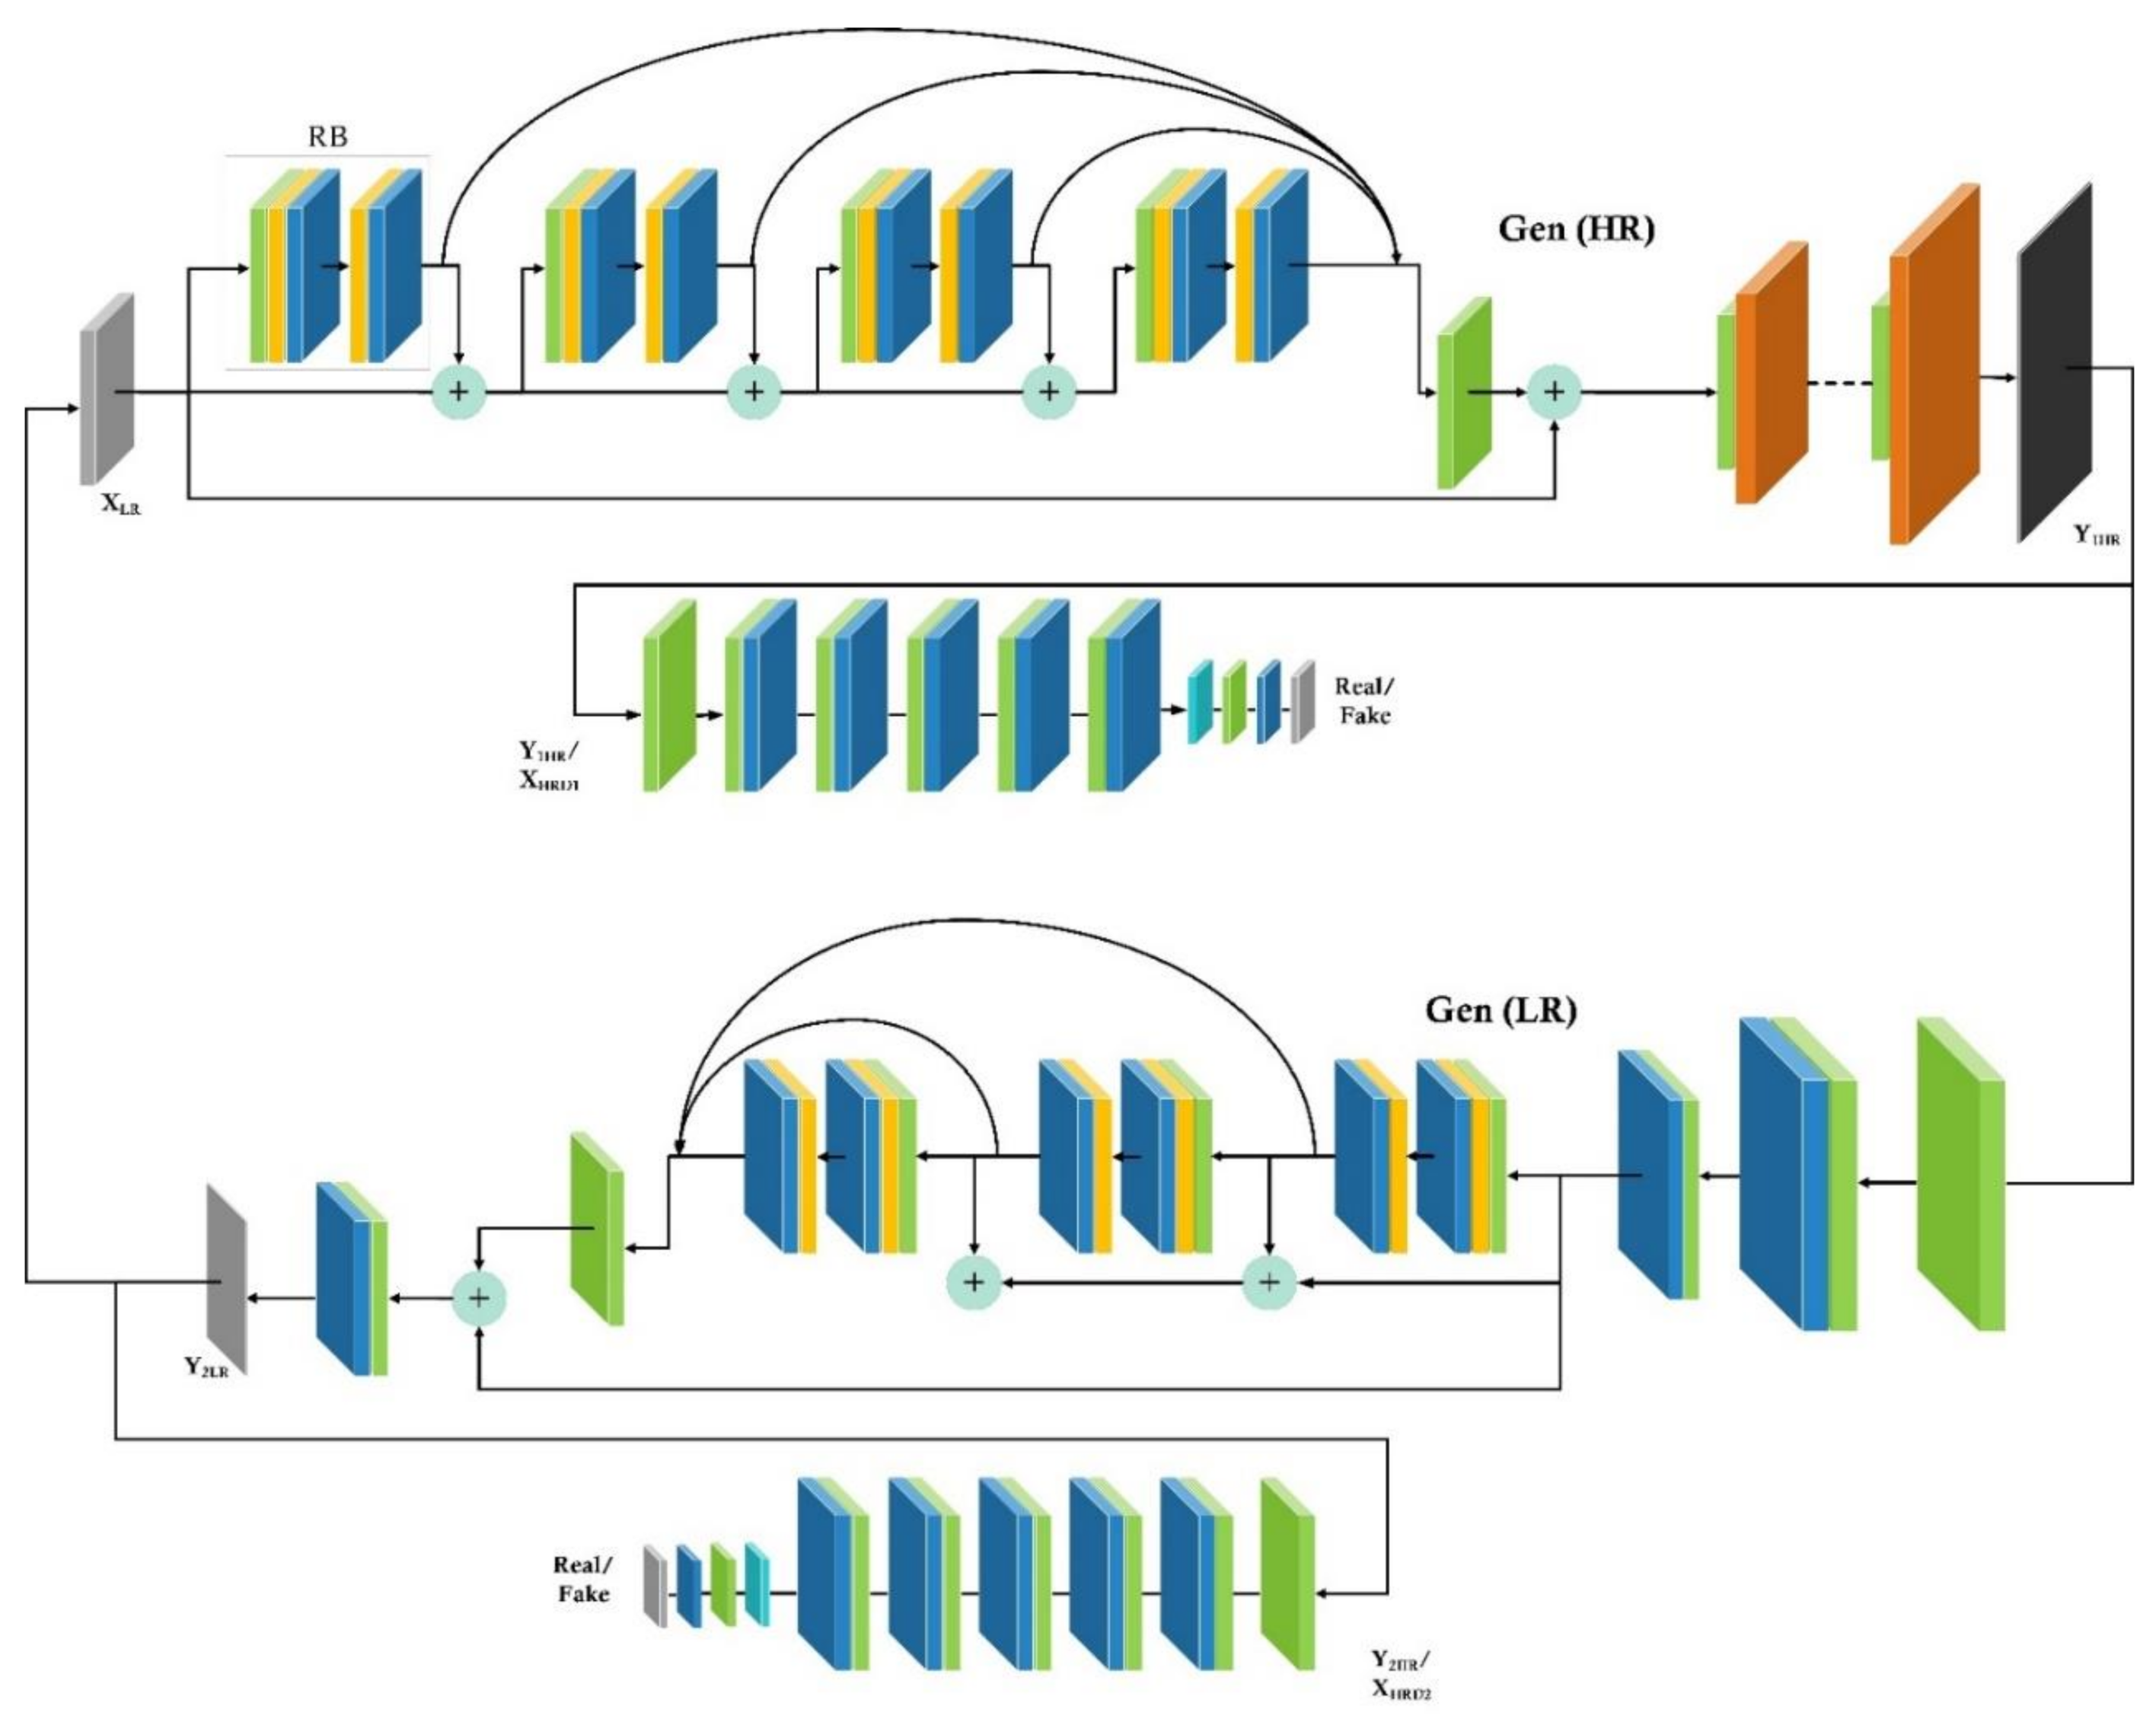
3.2.2. Cyclic Network
3.2.3. Detection Network
3.3. Implementation Details
4. Results
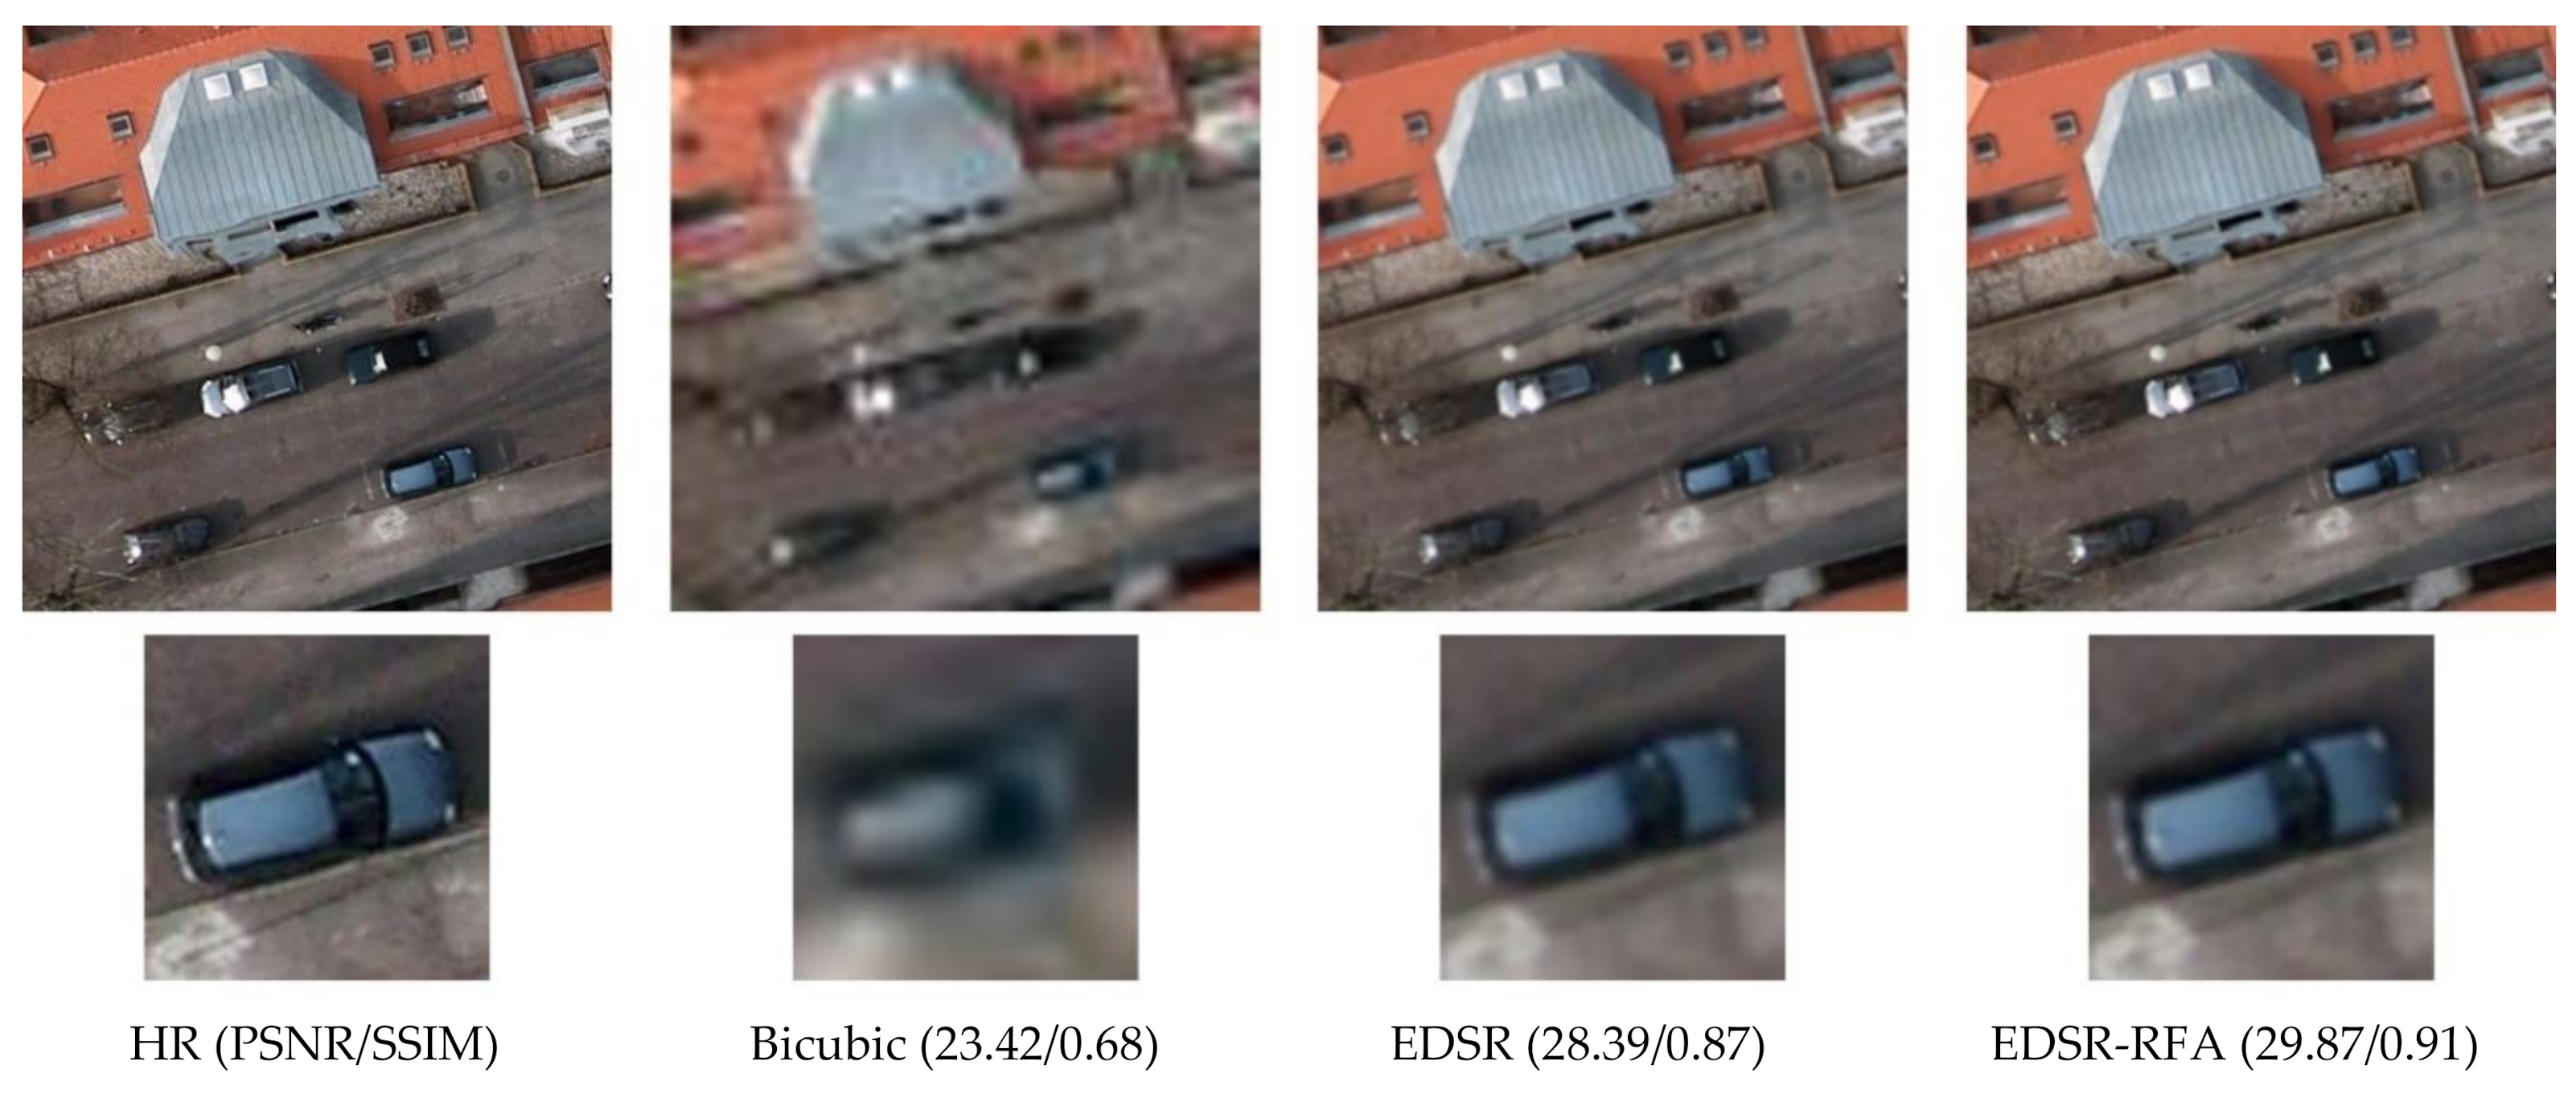
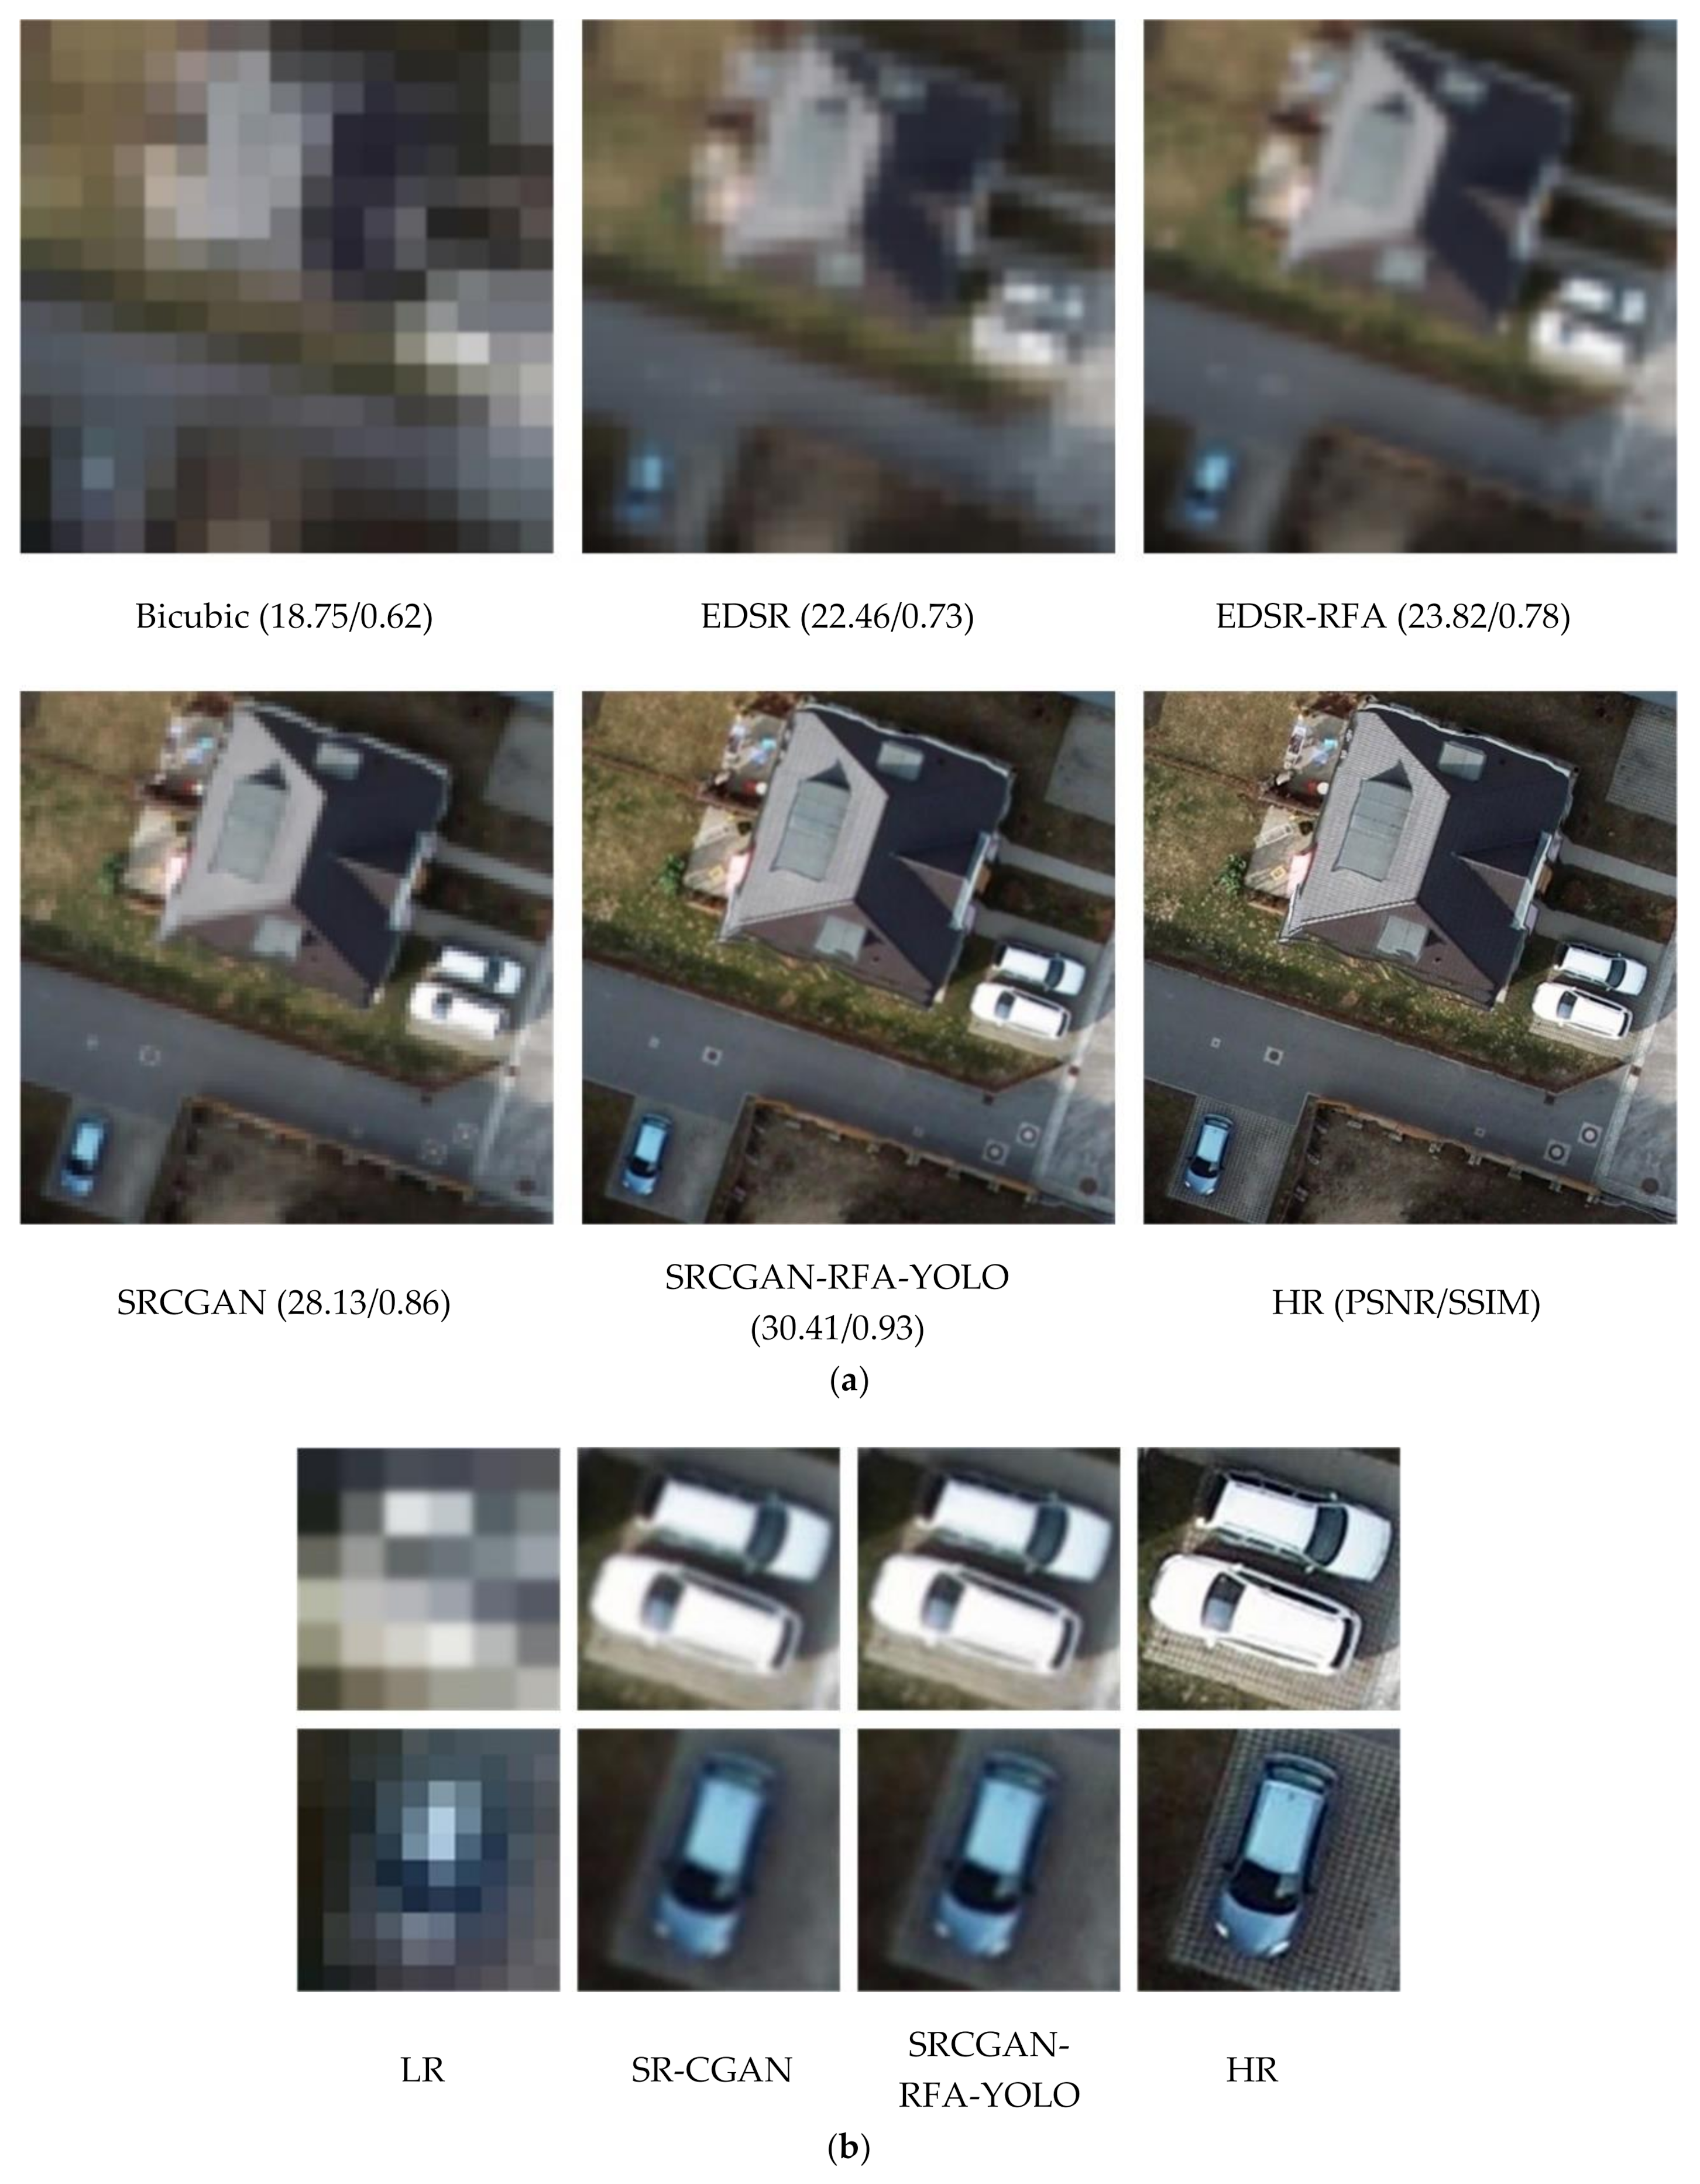
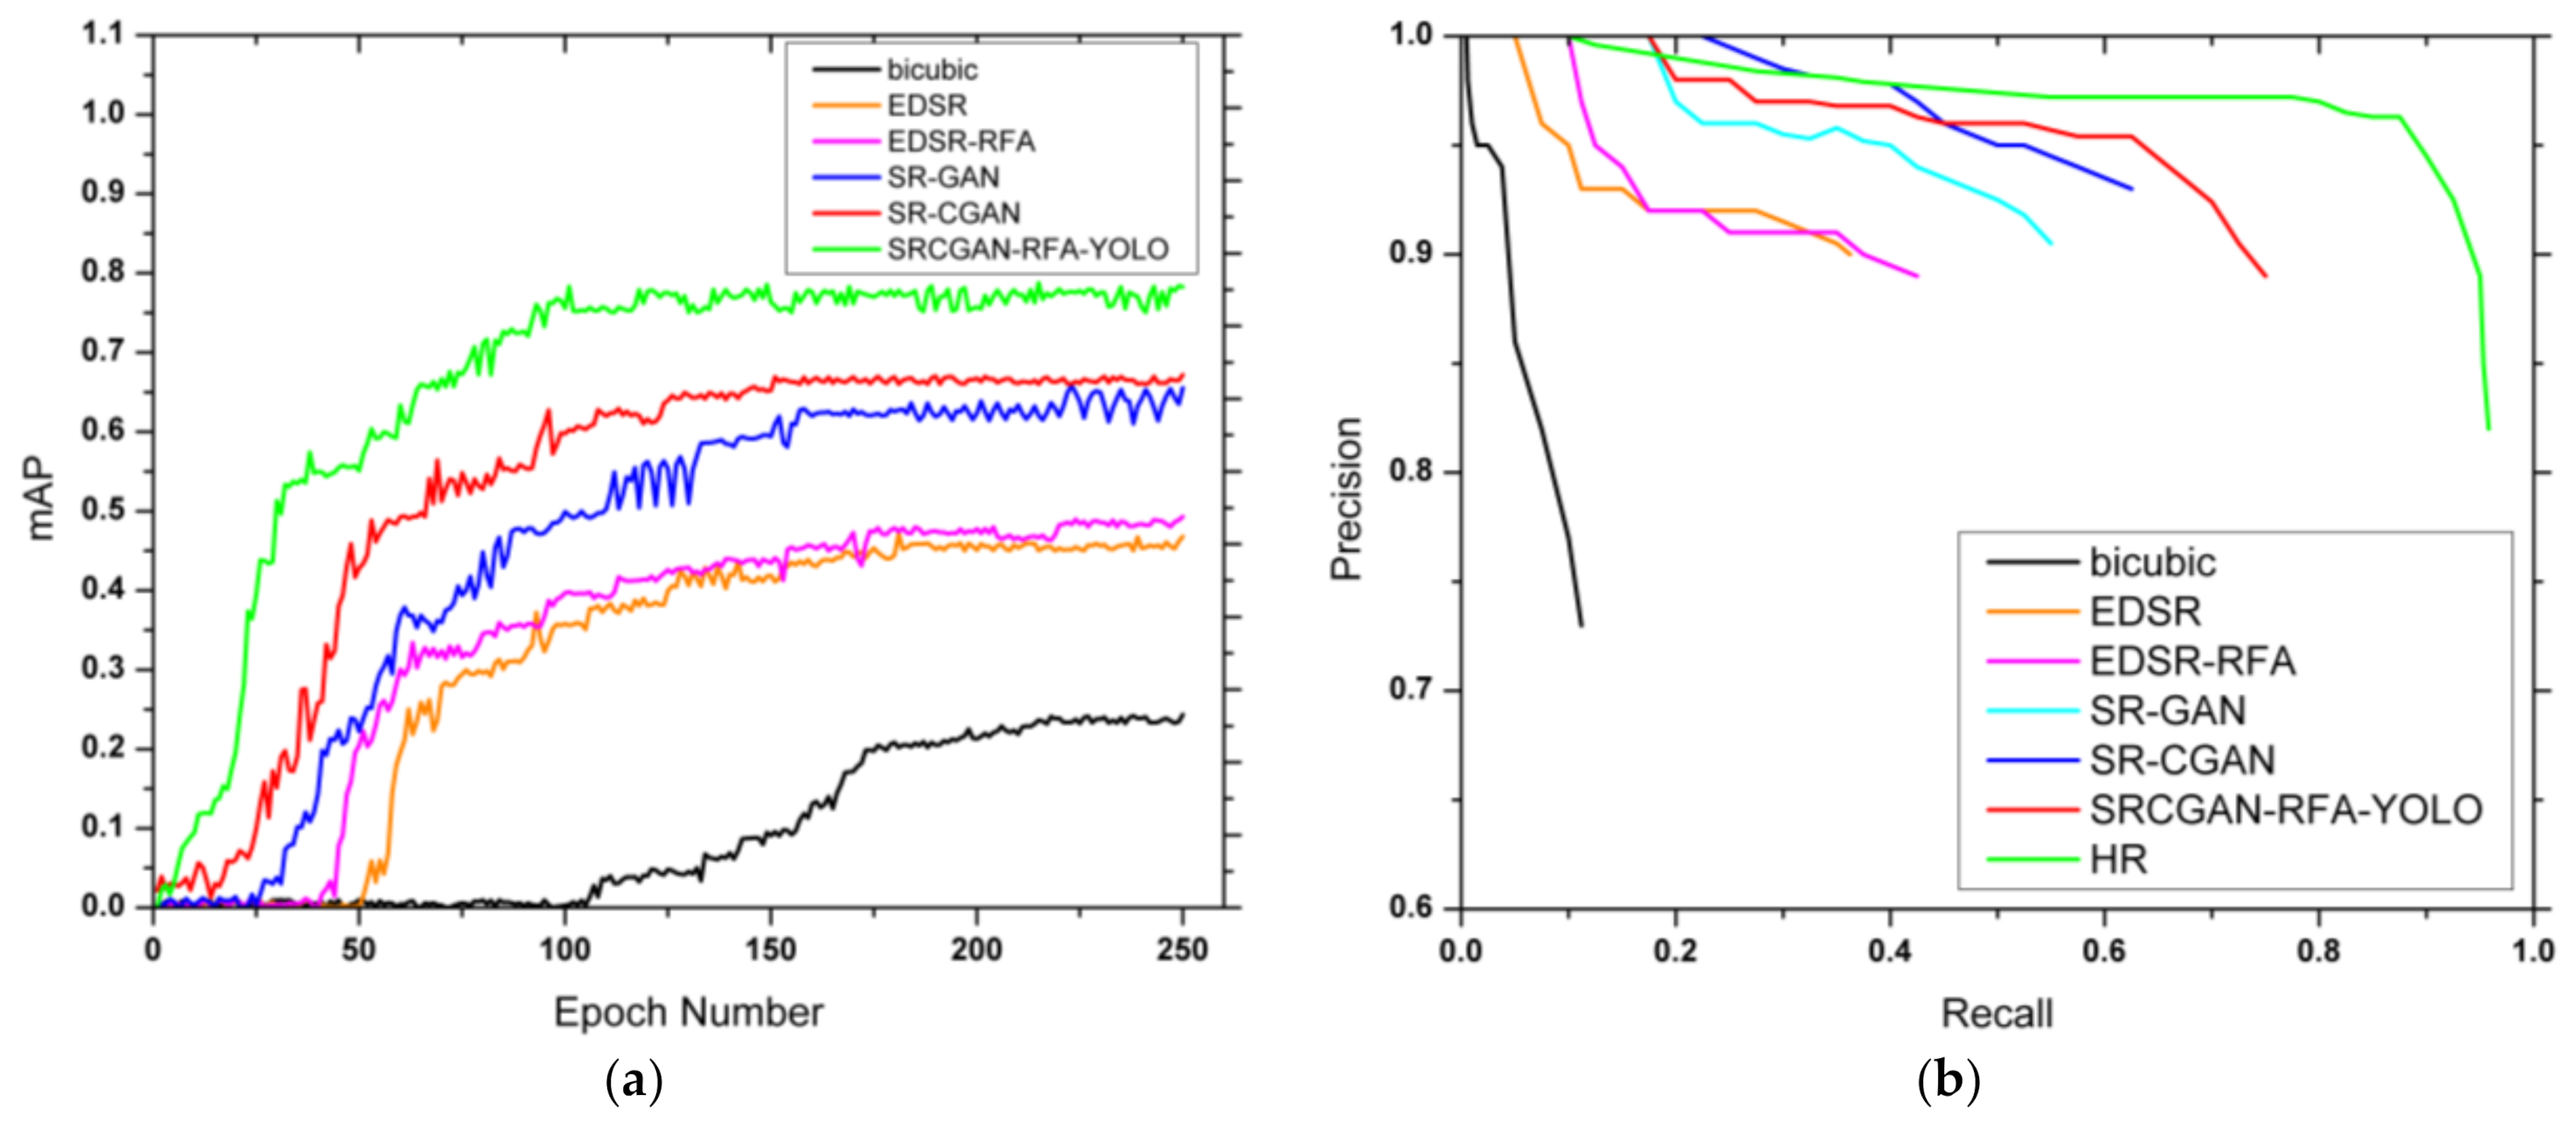
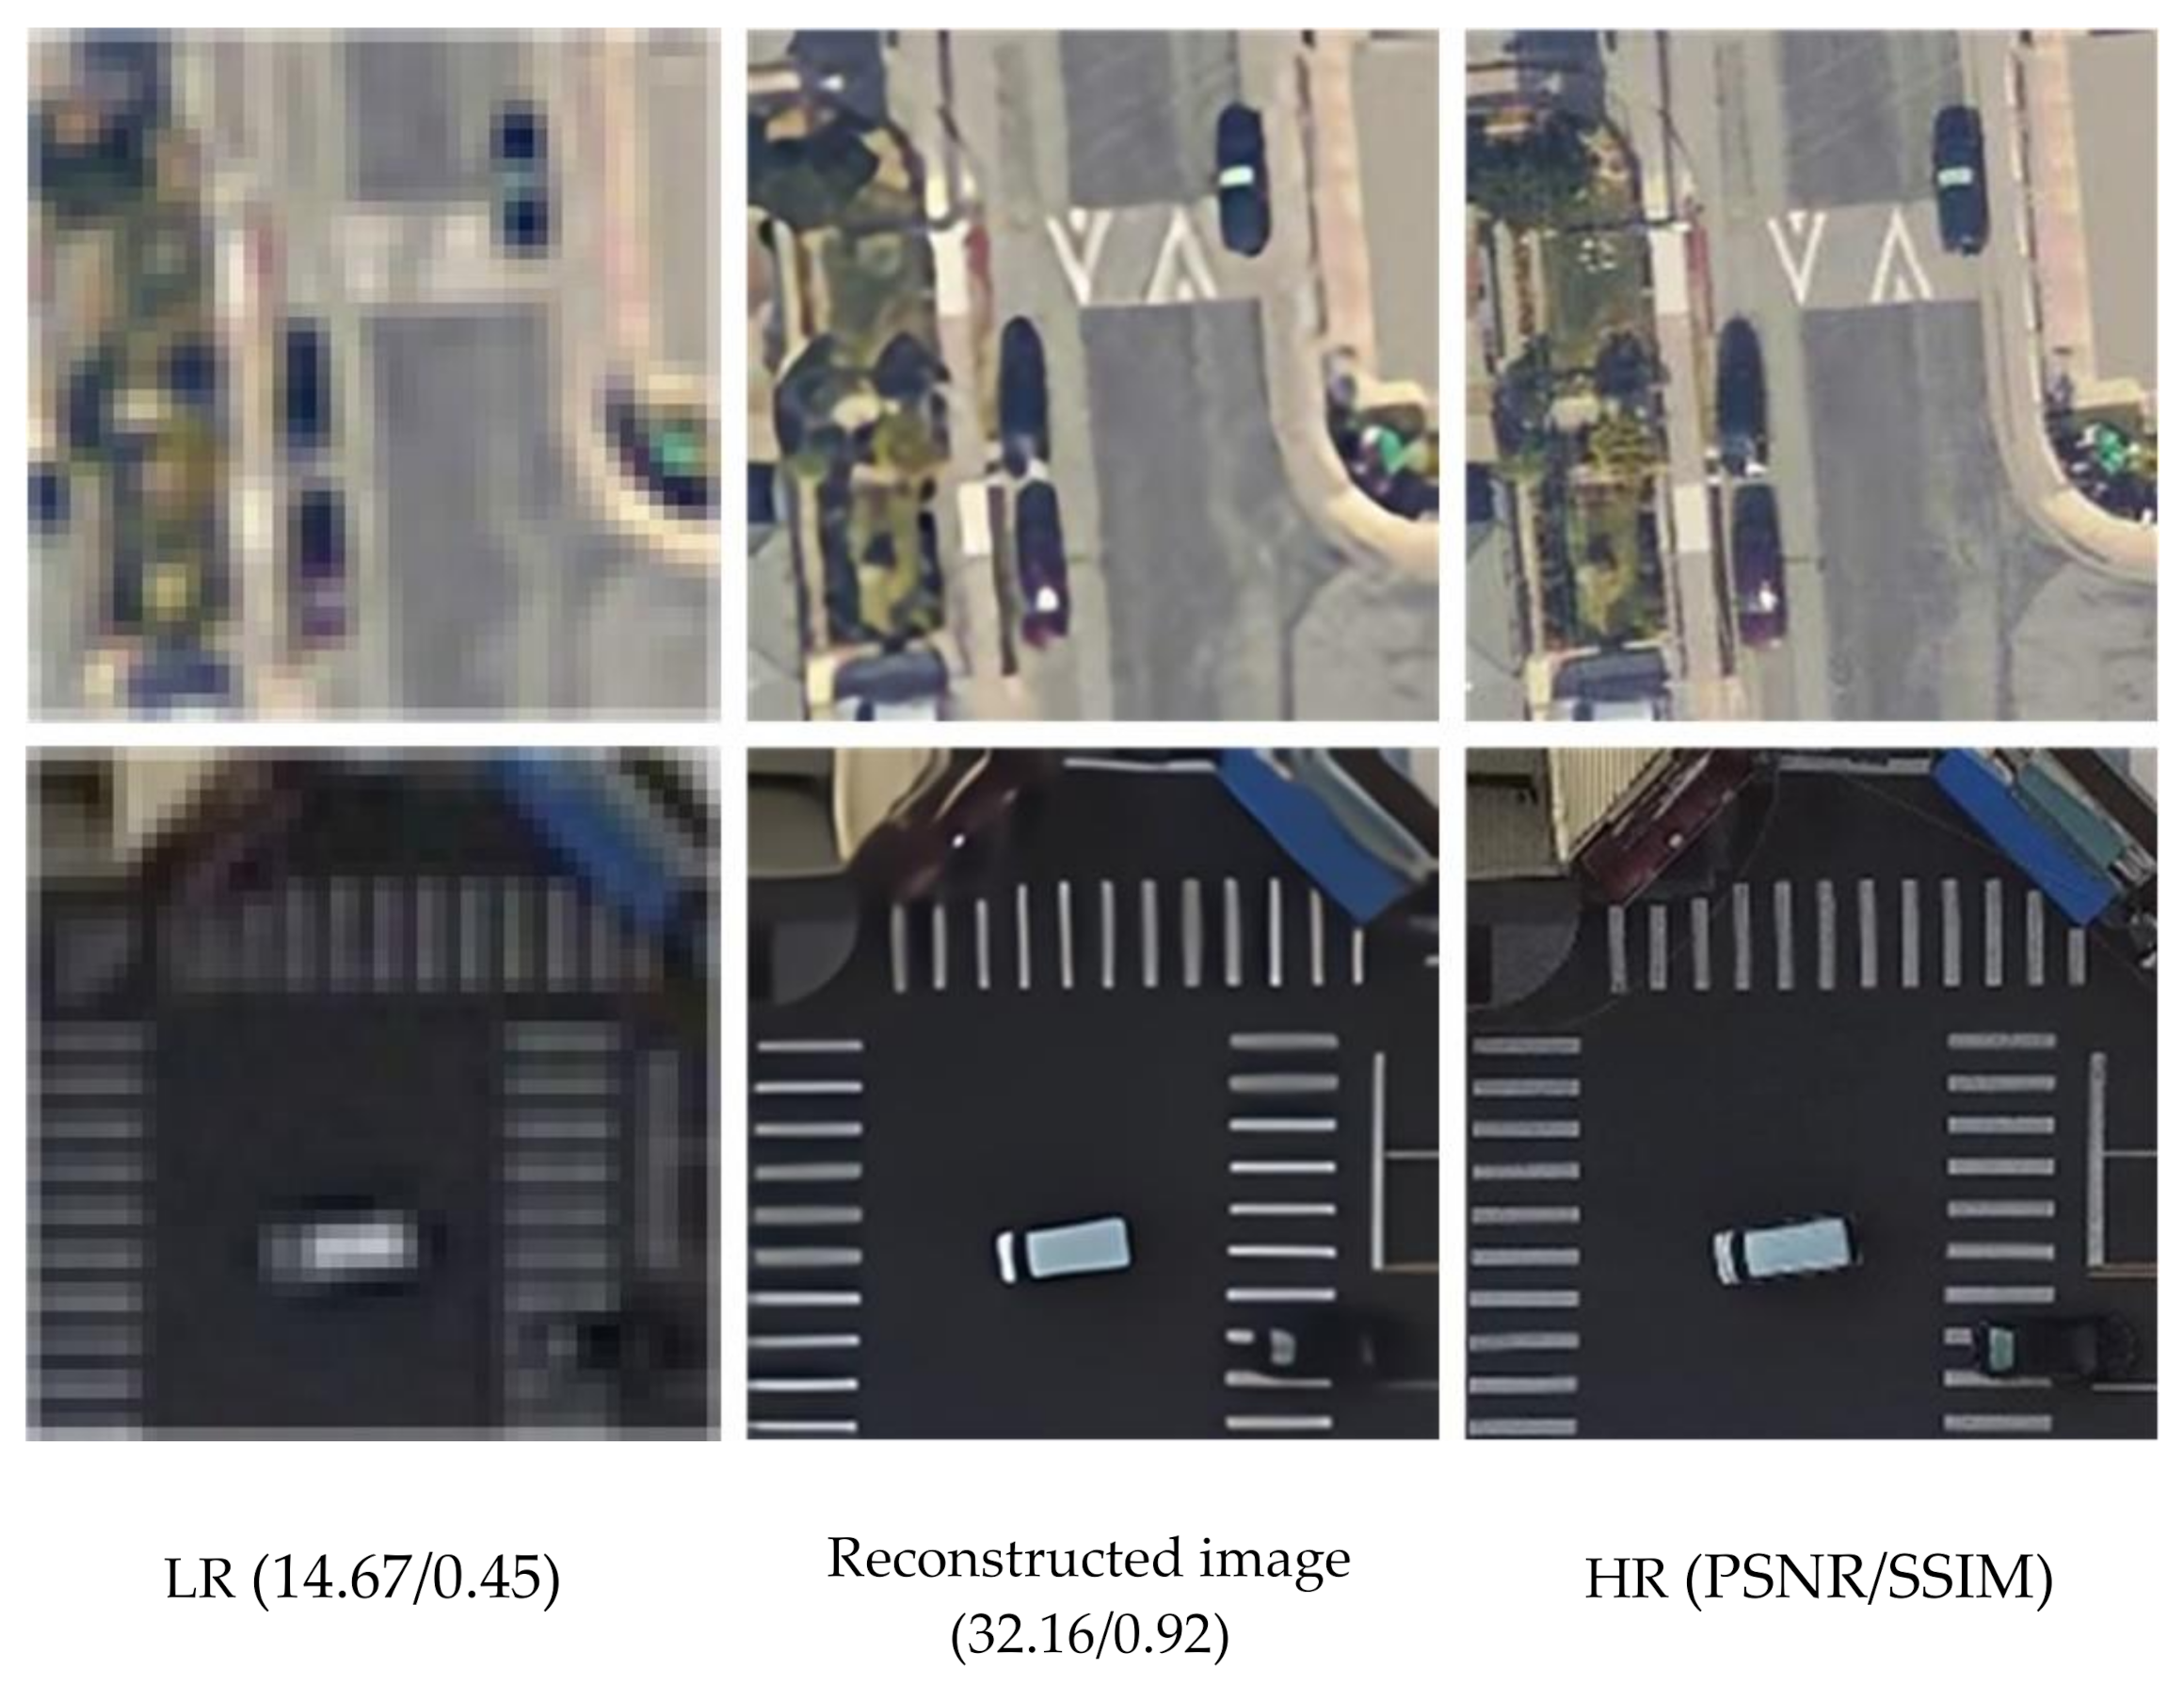
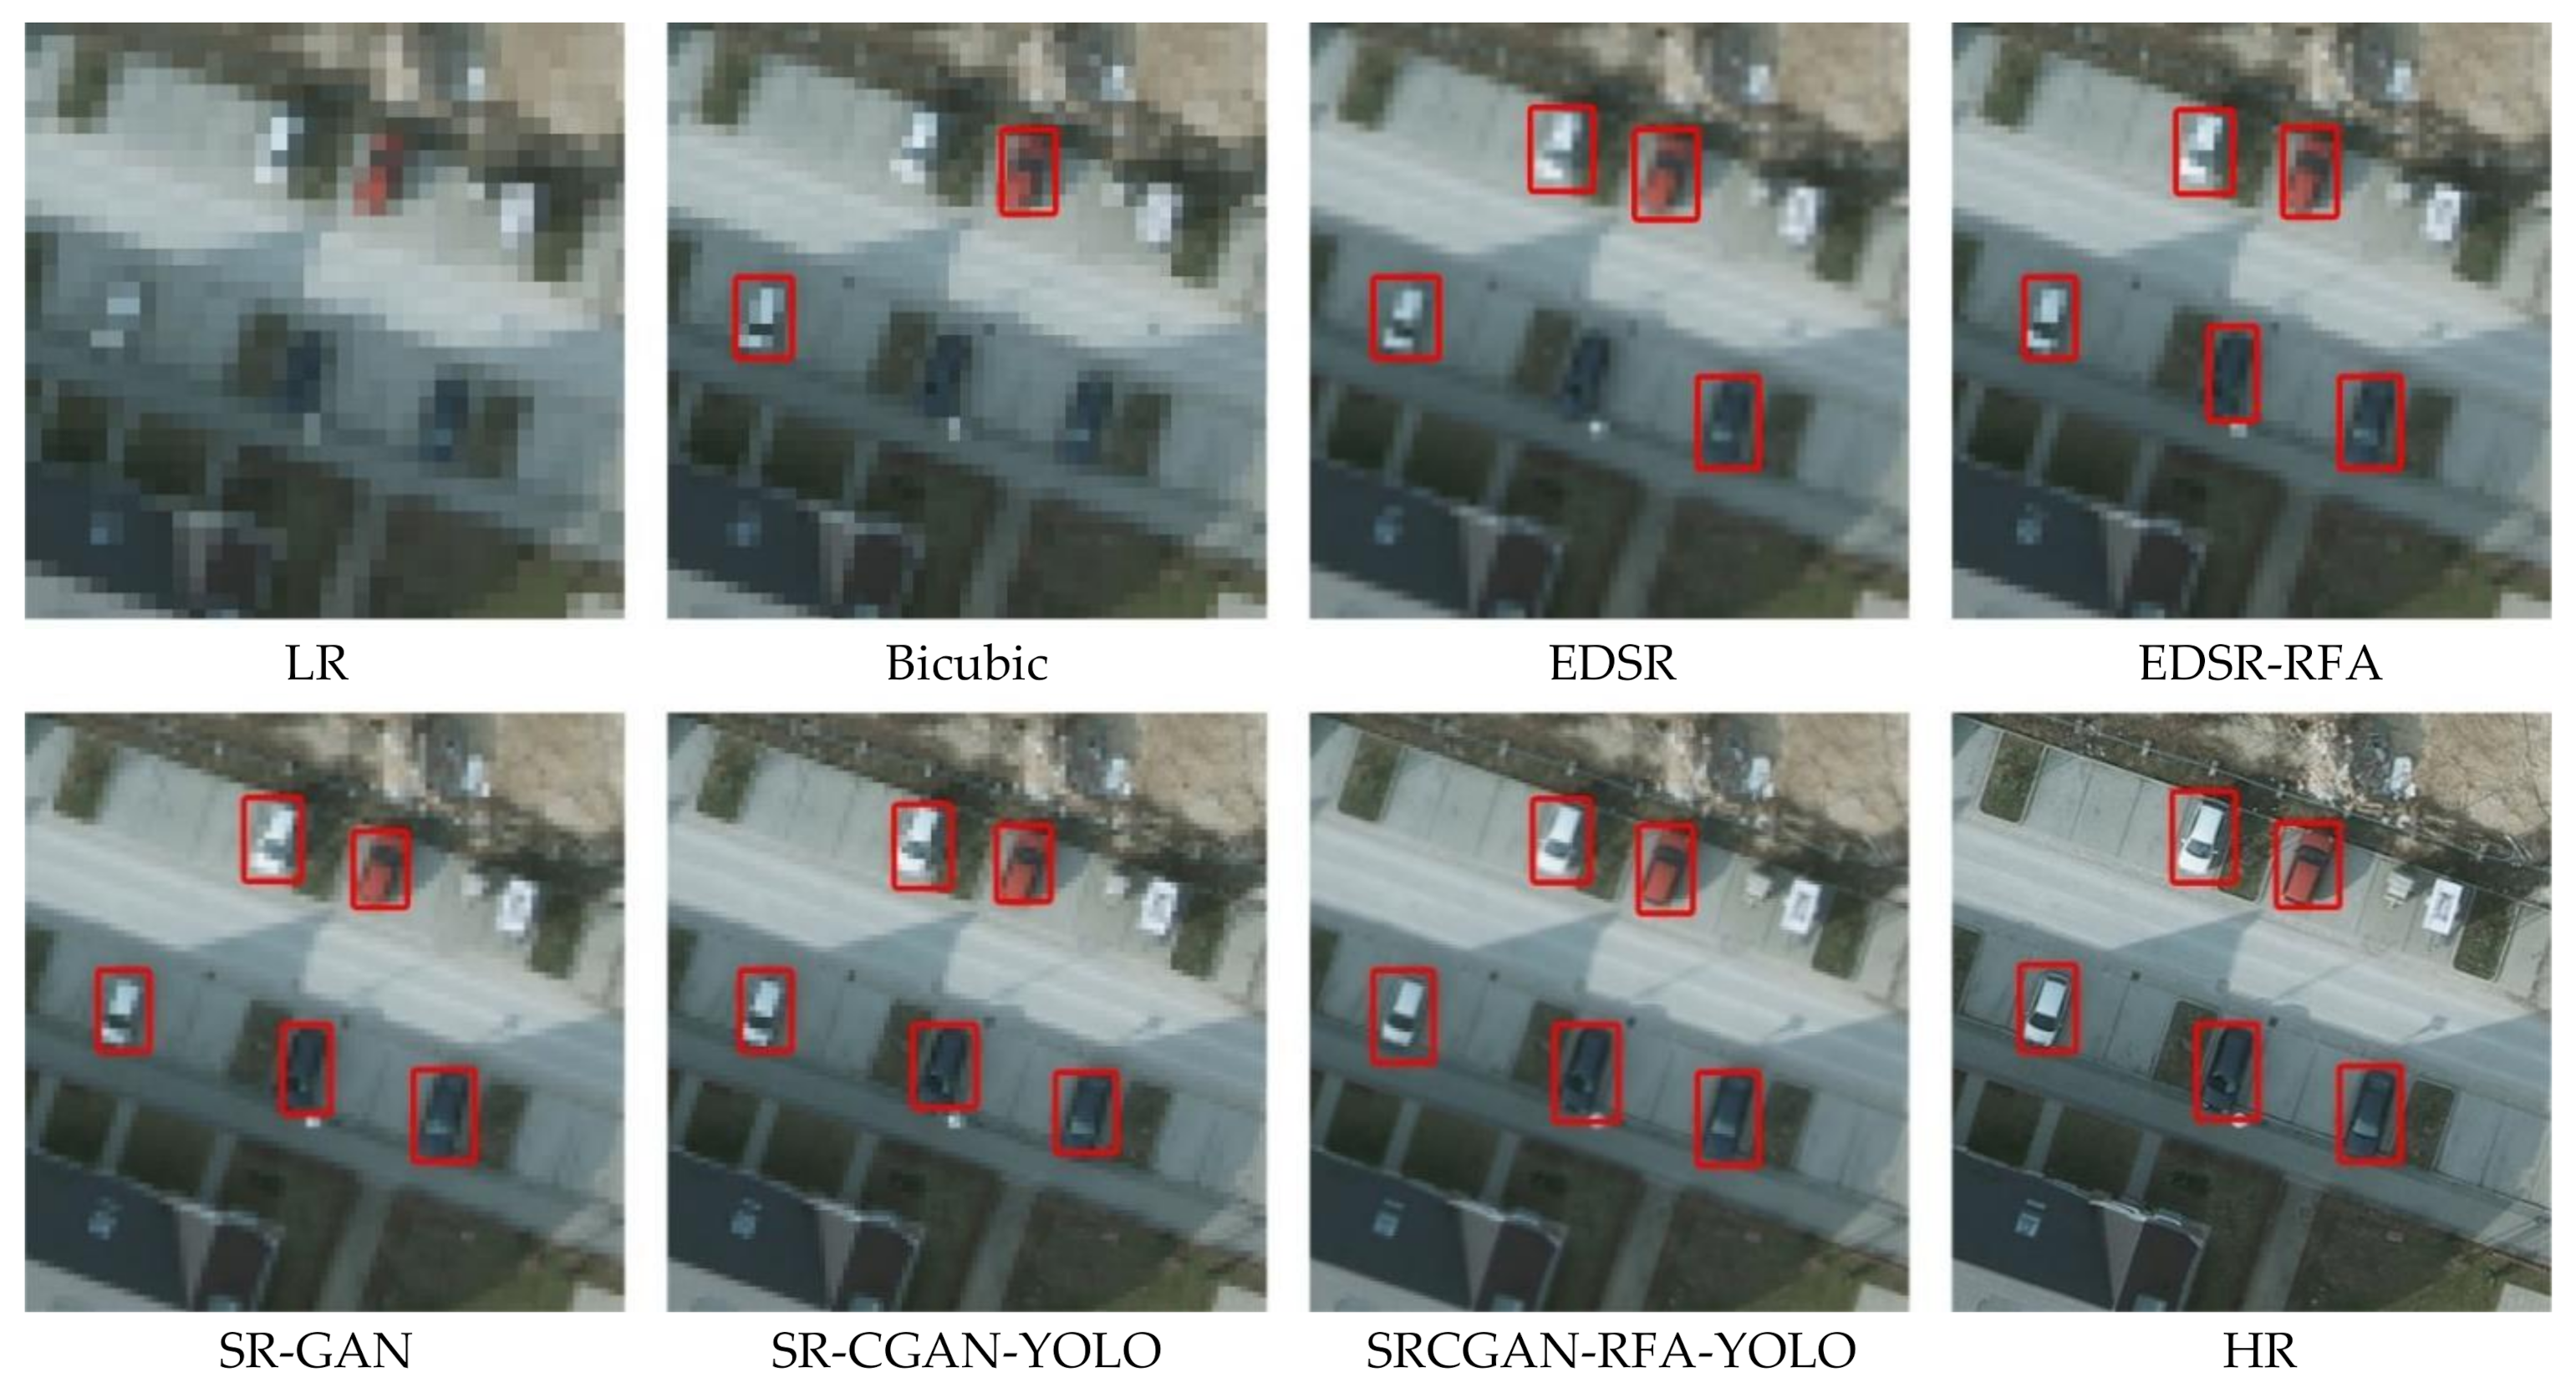
4.1. Improvement in Image Quality and the Detection Accuracy
4.2. Performance against Other Object Detectors
4.3. Applying Transfer Learning on Different Remote Sensing Datasets
5. Discussion
6. Conclusions and Future Directions
Author Contributions
Funding
Institutional Review Board Statement
Informed Consent Statement
Data Availability Statement
Conflicts of Interest
References
- Cao, C.; Wang, B.; Zhang, W.; Zeng, X.; Yan, X.; Feng, Z.; Liu, Y.; Wu, Z. An Improved Faster R-CNN for Small Object Detection. IEEE Access 2019, 7, 106838–106846. [Google Scholar] [CrossRef]
- Stuparu, D.G.; Ciobanu, R.I.; Dobre, C. Vehicle detection in overhead satellite images using a one-stage object detection model. Sensors 2020, 20, 6485. [Google Scholar] [CrossRef]
- Guan, L.; Wu, Y.; Zhao, J. SCAN: Semantic context aware network for accurate small object detection. Int. J. Comput. Intell. Syst. 2018, 11, 951–961. [Google Scholar] [CrossRef] [Green Version]
- Yao, Q.; Hu, X.; Lei, H. Multiscale Convolutional Neural Networks for Geospatial Object Detection in VHR Satellite Images. IEEE Geosci. Remote Sens. Lett. 2021, 18, 23–27. [Google Scholar] [CrossRef]
- Alganci, U.; Soydas, M.; Sertel, E. Comparative research on deep learning approaches for airplane detection from very high-resolution satellite images. Remote Sens. 2020, 12, 458. [Google Scholar] [CrossRef] [Green Version]
- Tong, K.; Wu, Y.; Zhou, F. Recent advances in small object detection based on deep learning: A review. Image Vis. Comput. 2020, 97, 103910. [Google Scholar] [CrossRef]
- Robinson, Y.H.; Vimal, S.; Khari, M.; Hernández, F.C.L.; Crespo, R.G. Tree-based convolutional neural networks for object classification in segmented satellite images. Int. J. High. Perform. Comput. Appl. 2020. [Google Scholar] [CrossRef]
- Uehara, K.; Nosato, H.; Murakawa, M.; Nakamura, R.; Miyamoto, H.; Sakanashi, H. Multi-channel higher-order local autocorrelation for object detection on satellite images. Int. J. Remote Sens. 2020, 41, 752–771. [Google Scholar] [CrossRef]
- Zhang, W.; Wang, S.; Thachan, S.; Chen, J.; Qian, Y. Deconv R-CNN for small object detection on remote sensing images. In Proceedings of the International Geoscience and Remote Sensing Symposium (IGARSS), Valencia, Spain, 22–27 July 2018; pp. 2483–2486. [Google Scholar]
- Ren, S.; He, K.; Girshick, R.; Sun, J. Faster R-CNN: Towards real-time object detection with region proposal networks. In Proceedings of the Advances in Neural Information Processing Systems, Montreal, QC, Canada, 10–12 December 2015. [Google Scholar]
- Lin, T.Y.; Dollár, P.; Girshick, R.; He, K.; Hariharan, B.; Belongie, S. Feature pyramid networks for object detection. In Proceedings of the 30th IEEE Conference on Computer Vision and Pattern Recognition, CVPR 2017, Honolulu, HI, USA, 21–26 July 2017. [Google Scholar]
- Redmon, J.; Farhadi, A. YOLOv3: An incremental improvement. arXiv 2018, arXiv:1804:02767. [Google Scholar]
- Bochkovskiy, A.; Wang, C.Y.; Liao, H.Y.M. YOLOv4: Optimal Speed and Accuracy of Object Detection. arXiv 2020, arXiv:2004:10934. [Google Scholar]
- Liu, W.; Anguelov, D.; Erhan, D.; Szegedy, C.; Reed, S.; Fu, C.Y.; Berg, A.C. SSD: Single shot multibox detector. In Proceedings of the European Conference on Computer Vision (ECCV), Amsterdam, The Netherlands, 11–14 October 2016; pp. 21–37. [Google Scholar]
- Lin, T.Y.; Goyal, P.; Girshick, R.; He, K.; Dollar, P. Focal Loss for Dense Object Detection. In Proceedings of the IEEE International Conference on Computer Vision, Venice, Italy, 22–29 October 2017; pp. 2980–2988. [Google Scholar]
- Yan, J.; Wang, H.; Yan, M.; Diao, W.; Sun, X.; Li, H. IoU-adaptive deformable R-CNN: Make full use of IoU for multi-class object detection in remote sensing imagery. Remote Sens. 2019, 11, 286. [Google Scholar] [CrossRef] [Green Version]
- Xu, Z.; Shi, H.; Li, N.; Xiang, C.; Zhou, H. Vehicle Detection under UAV Based on Optimal Dense YOLO Method. In Proceedings of the 2018 5th International Conference on Systems and Informatics, ICSAI 2018, Nanjing, China, 10–12 November 2018; pp. 407–411. [Google Scholar]
- Liu, M.; Wang, X.; Zhou, A.; Fu, X.; Ma, Y.; Piao, C. Uav-yolo: Small object detection on unmanned aerial vehicle perspective. Sensors 2020, 20, 2238. [Google Scholar] [CrossRef] [PubMed] [Green Version]
- Froidevaux, A.; Julier, A.; Lifschitz, A.; Pham, M.T.; Dambreville, R.; Lefèvre, S.; Lassalle, P.; Huynh, T.L. Vehicle Detection and Counting from VHR Satellite Images: Efforts and Open Issues. In Proceedings of the IGARSS 2020—2020 IEEE International Geoscience and Remote Sensing Symposium, Virtual Symposium, 26 September–2 October 2020; pp. 256–259. [Google Scholar]
- Pham, M.T.; Courtrai, L.; Friguet, C.; Lefèvre, S.; Baussard, A. YOLO-fine: One-stage detector of small objects under various backgrounds in remote sensing images. Remote Sens. 2020, 12, 2501. [Google Scholar] [CrossRef]
- Wang, J.; Lin, Y.; Guo, J.; Zhuang, L. SSS-YOLO: Towards more accurate detection for small ships in SAR image. Remote Sens. Lett. 2021, 12, 122–131. [Google Scholar] [CrossRef]
- Courtrai, L.; Pham, M.T.; Lefèvre, S. Small object detection in remote sensing images based on super-resolution with auxiliary generative adversarial networks. Remote Sens. 2020, 12, 3152. [Google Scholar] [CrossRef]
- Hui, Z.; Li, J.; Gao, X.; Wang, X. Progressive perception-oriented network for single image super-resolution. Inf. Sci. 2021, 769–786. [Google Scholar] [CrossRef]
- Bashir, S.M.A.; Wang, Y.; Khan, M. A Comprehensive Review of Deep Learning-based Single Image Super-resolution. arXiv 2021, arXiv:2102.09351v1. [Google Scholar]
- Dong, C.; Loy, C.C.; He, K.; Tang, X. Learning a deep convolutional network for image super-resolution. In Lecture Notes in Computer Science; Including Subseries Lecture Notes in Artificial Intelligence and Lecture Notes in Bioinformatics; Springer: Berlin/Heidelberg, Germany, 2014; Volume 8692 LNCS. [Google Scholar]
- Kim, J.; Lee, J.K.; Lee, K.M. Deeply-recursive convolutional network for image super-resolution. In Proceedings of the IEEE Computer Society Conference on Computer Vision and Pattern Recognition, Las Vegas, NV, USA, 27–30 June 2016; pp. 1637–1645. [Google Scholar]
- Dong, C.; Loy, C.C.; Tang, X. Accelerating the super-resolution convolutional neural network. In Lecture Notes in Computer Science; Including Subseries Lecture Notes in Artificial Intelligence and Lecture Notes in Bioinformatics; Springer: Berlin/Heidelberg, Germany, 2016; Volume 9906 LNCS, pp. 391–407. [Google Scholar]
- Kim, J.; Lee, J.K.; Lee, K.M. Accurate image super-resolution using very deep convolutional networks. In Proceedings of the IEEE Computer Society Conference on Computer Vision and Pattern Recognition, Las Vegas, NV, USA, 27–30 June 2016; pp. 1646–1654. [Google Scholar]
- Lai, W.S.; Huang, J.B.; Ahuja, N.; Yang, M.H. Deep laplacian pyramid networks for fast and accurate super-resolution. In Proceedings of the 30th IEEE Conference on Computer Vision and Pattern Recognition, CVPR 2017, Honolulu, HI, USA, 21–26 July 2017; pp. 624–632. [Google Scholar]
- Lim, B.; Son, S.; Kim, H.; Nah, S.; Lee, K.M. Enhanced Deep Residual Networks for Single Image Super-Resolution. In Proceedings of the IEEE Computer Society Conference on Computer Vision and Pattern Recognition Workshops, Honolulu, HI, USA, 21–26 July 2017; pp. 136–144. [Google Scholar]
- Sajjadi, M.S.M.; Scholkopf, B.; Hirsch, M. EnhanceNet: Single Image Super-Resolution through Automated Texture Synthesis. In Proceedings of the IEEE International Conference on Computer Vision, Honolulu, HI, USA, 21–26 July 2017; pp. 4491–4500. [Google Scholar]
- Haris, M.; Shakhnarovich, G.; Ukita, N. Recurrent back-projection network for video super-resolution. In Proceedings of the IEEE Computer Society Conference on Computer Vision and Pattern Recognition, Long Beach, CA, USA, 16–20 June 2019; pp. 3897–3906. [Google Scholar]
- Ioffe, S.; Szegedy, C. Batch normalization: Accelerating deep network training by reducing internal covariate shift. In Proceedings of the 32nd International Conference on Machine Learning, ICML 2015, Lille, France, 6–11 July 2015. [Google Scholar]
- Xue, S.; Qiu, W.; Liu, F.; Jin, X. Wavelet-based residual attention network for image super-resolution. Neurocomputing 2020, 382, 116–126. [Google Scholar] [CrossRef]
- Zhang, L.; Ma, J. Salient Object Detection Based on Progressively Supervised Learning for Remote Sensing Images. IEEE Trans. Geosci. Remote. Sens. 2021. [Google Scholar] [CrossRef]
- Ferdous, S.N.; Mostofa, M.; Nasrabadi, N. Super resolution-assisted deep aerial vehicle detection. In Proceedings of the Artificial Intelligence and Machine Learning for Multi-Domain Operations Applications, Baltimore, MD, USA, 15–17 April 2019; p. 1100617. [Google Scholar]
- Rabbi, J.; Ray, N.; Schubert, M.; Chowdhury, S.; Chao, D. Small-object detection in remote sensing images with end-to-end edge-enhanced GAN and object detector network. Remote Sens. 2020, 12, 1432. [Google Scholar] [CrossRef]
- Wang, X.; Yu, K.; Wu, S.; Gu, J.; Liu, Y. ESRGAN: Enhanced Super-Resolution Generative Adversarial Networks. In Computer Vision—ECCV 2018 Workshops. ECCV 2018; Leal-Taixé, L., Roth, S., Eds.; Springer: Cham, Switzerland, 2019; pp. 63–79. ISBN 978-3-030-11021-5. [Google Scholar]
- Jiang, K.; Wang, Z.; Yi, P.; Wang, G.; Lu, T.; Jiang, J. Edge-Enhanced GAN for Remote Sensing Image Superresolution. IEEE Trans. Geosci. Remote Sens. 2019, 57, 5799–5812. [Google Scholar] [CrossRef]
- Rottensteiner, F.; Sohn, G.; Jung, J.; Gerke, M.; Baillard, C.; Benitez, S.; Breitkopf, U. The ISPRS benchmark on urban object classification and 3D building reconstruction. ISPRS Ann. Photogramm. Remote Sens. Spat. Inf. Sci. 2012, I-3, 293–298. [Google Scholar] [CrossRef] [Green Version]
- Draper Draper Satellite Image Chronology. Available online: https://www.kaggle.com/c/draper-satellite-image-chronology/overview (accessed on 8 May 2021).
- Li, C.Y.; Lin, H.Y. Vehicle detection and classification in aerial images using convolutional neural networks. In Proceedings of the VISIGRAPP 2020—15th International Joint Conference on Computer Vision, Imaging and Computer Graphics Theory and Applications, Valetta, Malta, 27–29 February 2020; pp. 775–782. [Google Scholar]
- Shermeyer, J.; Van Etten, A. The effects of super-resolution on object detection performance in satellite imagery. In Proceedings of the IEEE Computer Society Conference on Computer Vision and Pattern Recognition Workshops, Long Beach, CA, USA, 16–20 June 2019. [Google Scholar]
- Wei, Z.; Liu, Y. Deep Intelligent Neural Network for Medical Geographic Small-target Intelligent Satellite Image Super-resolution. J. Imaging Sci. Technol. 2021. [Google Scholar] [CrossRef]
- Shi, W.; Caballero, J.; Huszar, F.; Totz, J.; Aitken, A.P.; Bishop, R.; Rueckert, D.; Wang, Z. Real-Time Single Image and Video Super-Resolution Using an Efficient Sub-Pixel Convolutional Neural Network. In Proceedings of the IEEE Computer Society Conference on Computer Vision and Pattern Recognition, Las Vegas, NV, USA, 27–30 June 2016; pp. 1874–1883. [Google Scholar]
- Dong, C.; Loy, C.C.; He, K.; Tang, X. Image Super-Resolution Using Deep Convolutional Networks. IEEE Trans. Pattern Anal. Mach. Intell. 2016, 38, 295–307. [Google Scholar] [CrossRef] [PubMed] [Green Version]
- Freeman, W.T.; Jones, T.R.; Pasztor, E.C. Example-based super-resolution. IEEE Comput. Graph. Appl. 2002, 22, 56–65. [Google Scholar] [CrossRef] [Green Version]
- Liu, J.; Zhang, W.; Tang, Y.; Tang, J.; Wu, G. Residual Feature Aggregation Network for Image Super-Resolution. In Proceedings of the IEEE Computer Society Conference on Computer Vision and Pattern Recognition, Virtual Conference, 14–19 June 2020. [Google Scholar]
- Audebert, N.; Le Saux, B.; Lefèvre, S. Segment-before-detect: Vehicle detection and classification through semantic segmentation of aerial images. Remote Sens. 2017, 9, 368. [Google Scholar] [CrossRef] [Green Version]
- Arjovsky, M.; Chintala, S.; Bottou, L. Wasserstein generative adversarial networks. In Proceedings of the 34th International Conference on Machine Learning, ICML 2017, Sydney, Australia, 6–11 August 2017. [Google Scholar]
- Ledig, C.; Theis, L.; Huszár, F.; Caballero, J.; Cunningham, A.; Acosta, A.; Aitken, A.; Tejani, A.; Totz, J.; Wang, Z.; et al. Photo-realistic single image super-resolution using a generative adversarial network. In Proceedings of the 30th IEEE Conference on Computer Vision and Pattern Recognition, CVPR 2017, Honolulu, HI, USA, 21–26 July 2017; pp. 4681–4690. [Google Scholar]
- Gulrajani, I.; Ahmed, F.; Arjovsky, M.; Dumoulin, V.; Courville, A. Improved training of wasserstein GANs. In Proceedings of the Advances in Neural Information Processing Systems, Long Beach, CA, USA, 4–9 December 2017; pp. 5767–5777. [Google Scholar]
- Zhu, J.Y.; Park, T.; Isola, P.; Efros, A.A. Unpaired Image-to-Image Translation Using Cycle-Consistent Adversarial Networks. In Proceedings of the IEEE International Conference on Computer Vision, Honolulu, HI, USA, 21–26 July 2017; pp. 2223–2232. [Google Scholar]
- Tan, M.; Pang, R.; Le, Q.V. EfficientDet: Scalable and efficient object detection. In Proceedings of the IEEE Computer Society Conference on Computer Vision and Pattern Recognition, Virtual Conference, 14–19 June 2020; pp. 10781–10790. [Google Scholar]
- Sumbul, G.; Charfuelan, M.; Demir, B.; Markl, V. Bigearthnet: A Large-Scale Benchmark Archive for Remote Sensing Image Understanding. In Proceedings of the IEEE International Geoscience and Remote Sensing Symposium, Yokohama, Japan, 28 July–2 August 2019; pp. 5901–5904. [Google Scholar]


| Degradation Model | Method | TP | FP | AP | F1 Score |
|---|---|---|---|---|---|
| HR | 1390 | 55 | 0.962 | 0.963 | |
| Bicubic Degradation | Bicubic | 976 | 393 | 0.713 | 0.683 |
| EDSR | 1176 | 177 | 0.869 | 0.864 | |
| EDSR-RFA | 1261 | 145 | 0.897 | 0.889 | |
| Blur Degradation | Bicubic | 934 | 422 | 0.689 | 0.656 |
| EDSR | 1044 | 240 | 0.813 | 0.798 | |
| EDSR-RFA | 1213 | 211 | 0.852 | 0.844 |
| Scale Factor | Method | PSNR (dB) | SSIM |
|---|---|---|---|
| 8× | Bicubic | 23.42 | 0.6814 |
| EDSR | 28.39 | 0.8732 | |
| EDSR-RFA | 29.87 | 0.9081 | |
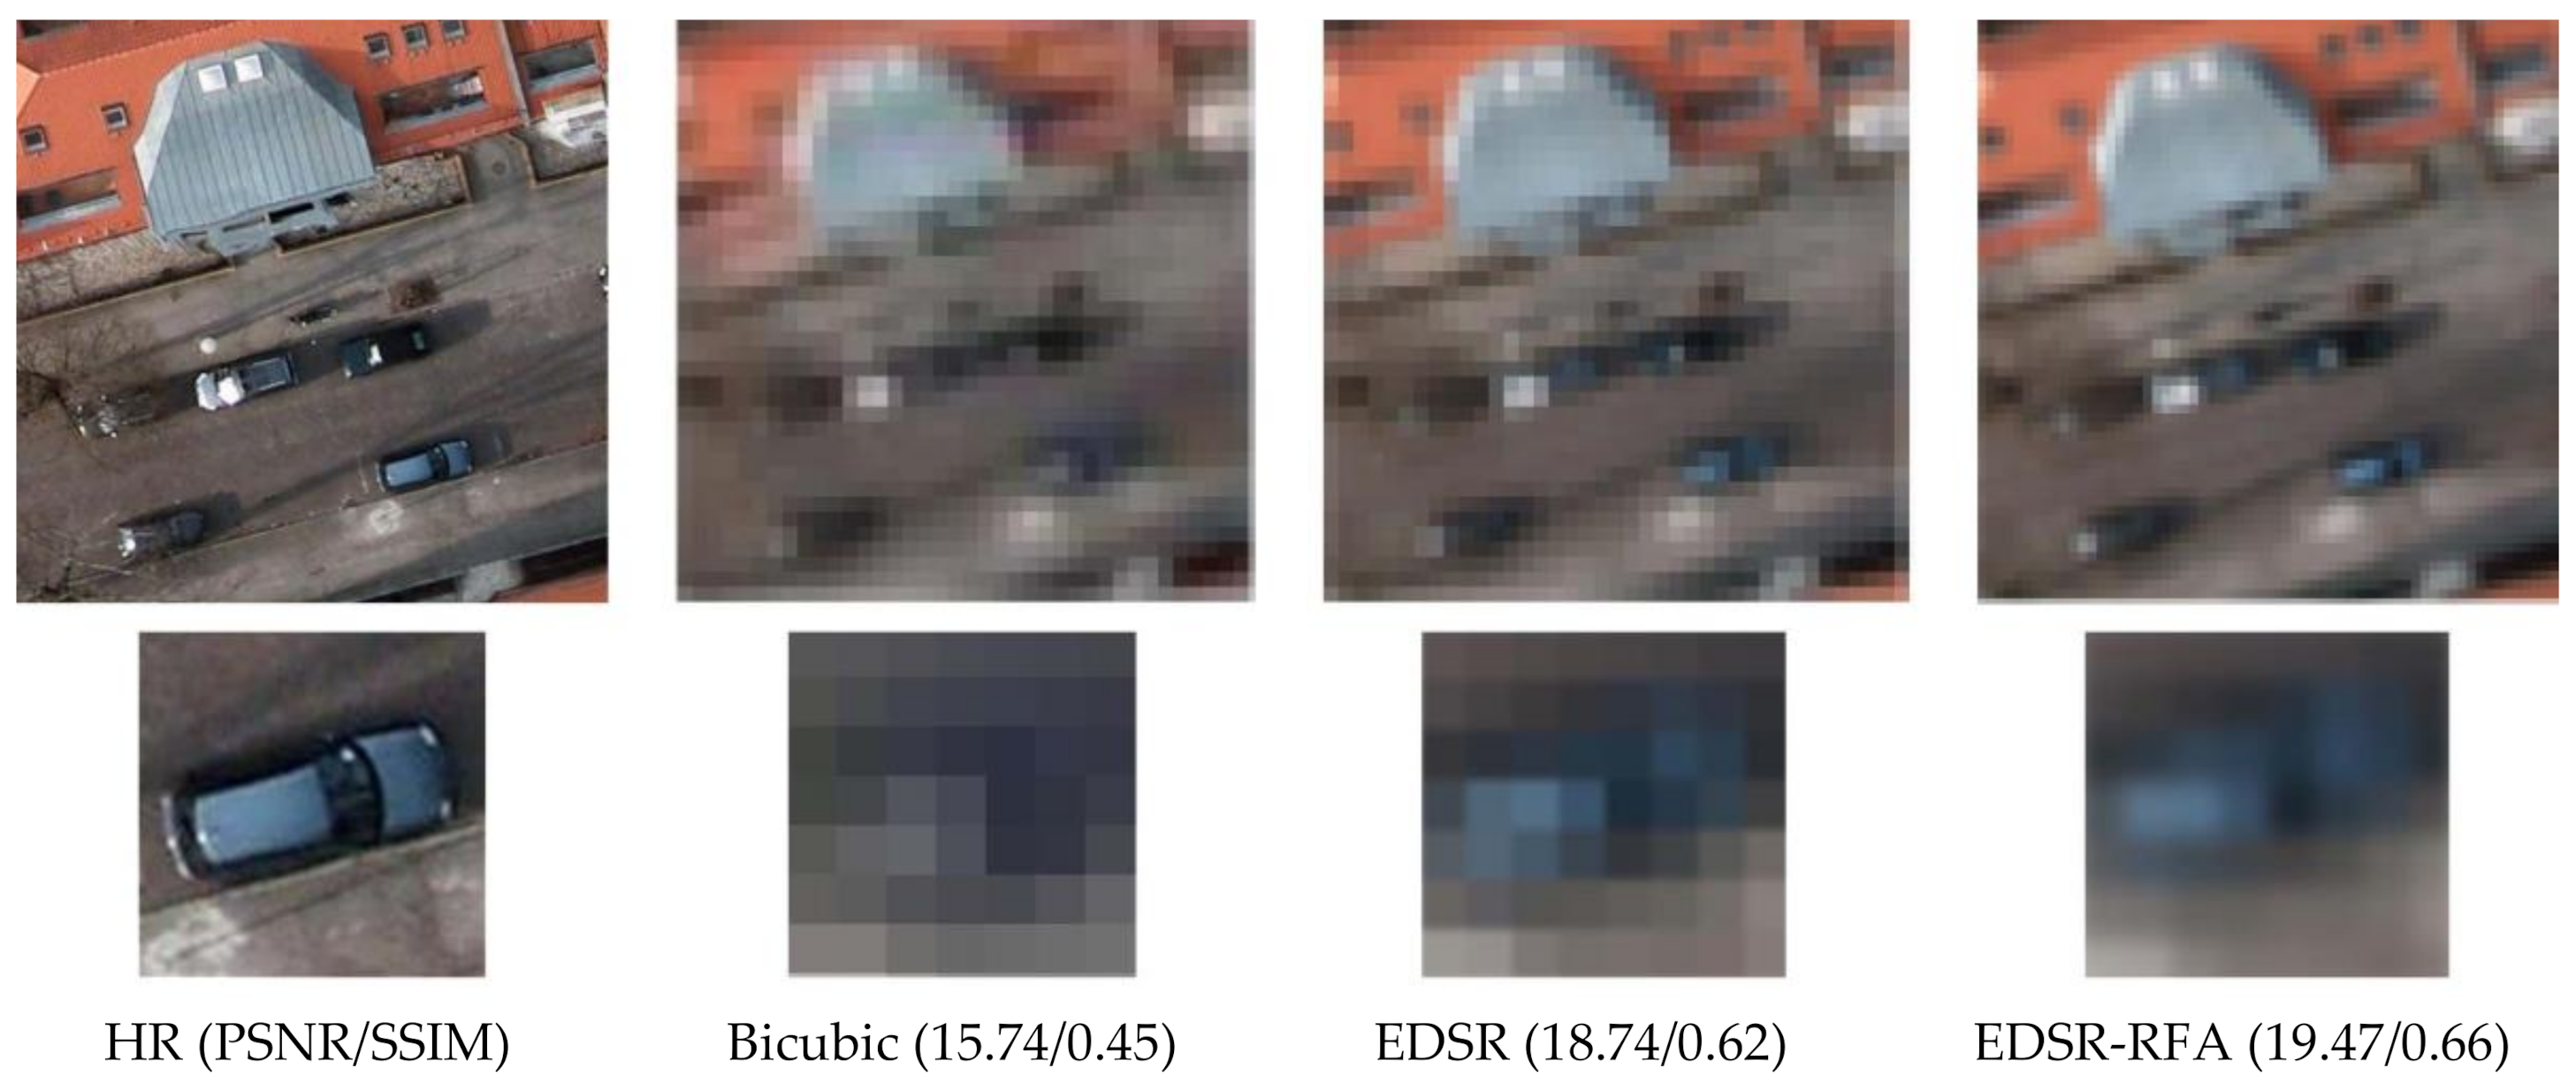
| 16× | Bicubic | 15.74 | 0.4531 |
| EDSR | 18.74 | 0.6240 | |
| EDSR-RFA | 19.47 | 0.6604 |
| Degradation Model. | Method | TP | FP | AP | F1 Score |
|---|---|---|---|---|---|
| HR | 1390 | 55 | 0.962 | 0.963 | |
| Bicubic Degradation | Bicubic | 24 | 97 | 0.198 | 0.028 |
| EDSR | 27 | 86 | 0.239 | 0.034 | |
| EDSR-RFA | 28 | 63 | 0.308 | 0.036 | |
| Blur Degradation | Bicubic | 16 | 123 | 0.115 | 0.018 |
| EDSR | 23 | 104 | 0.181 | 0.028 | |
| EDSR-RFA | 25 | 98 | 0.203 | 0.031 |
| Degradation | Method | TP | FP | AP | F1 Score |
|---|---|---|---|---|---|
| HR | 1390 | 55 | 0.962 | 0.963 | |
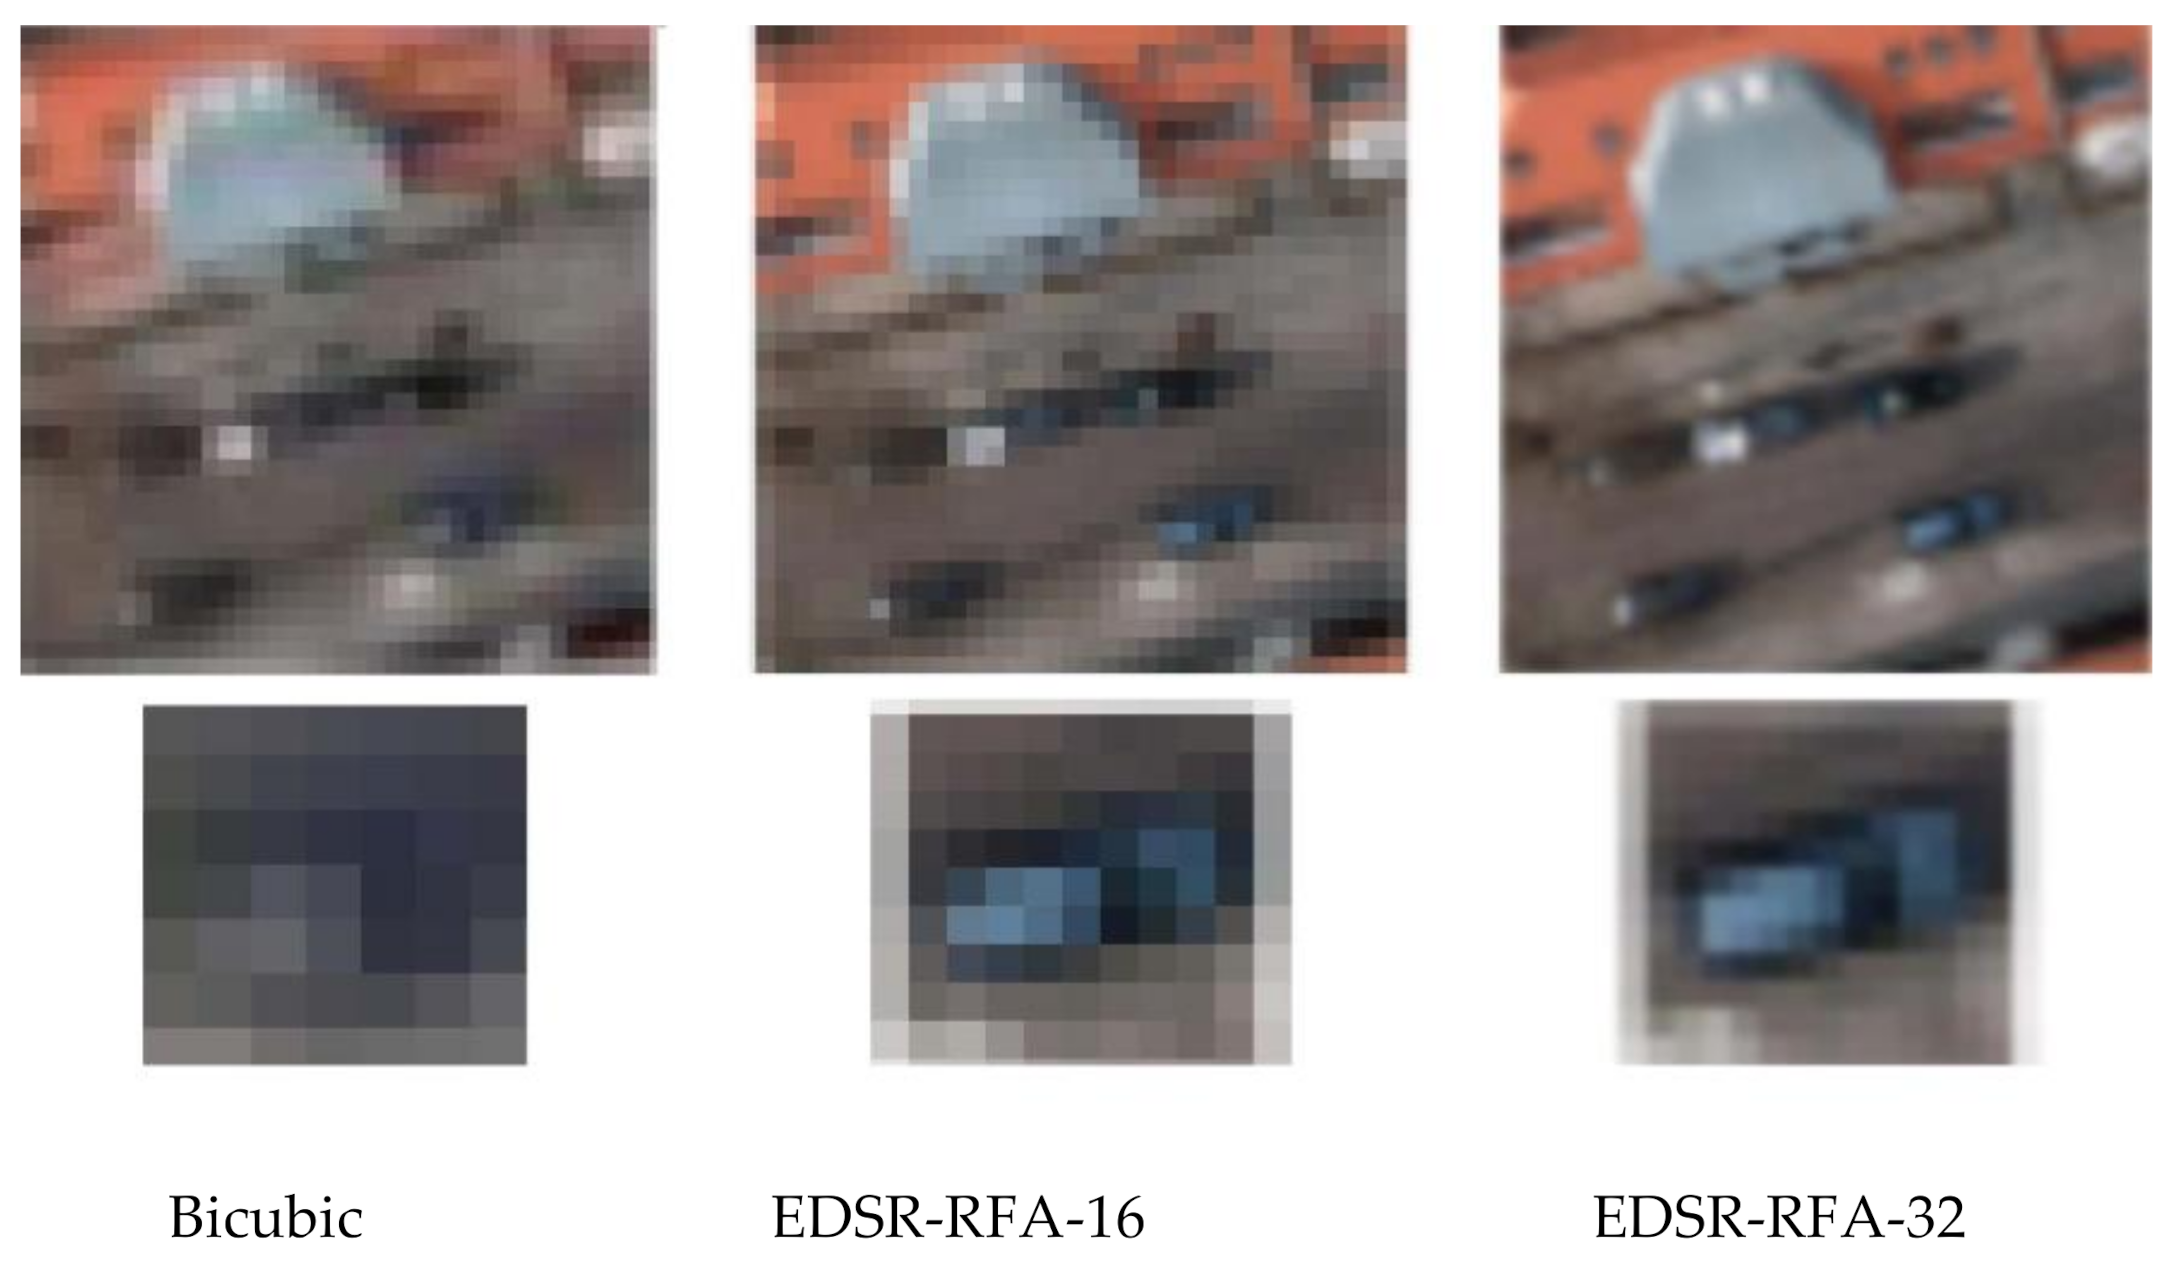
| Bicubic Degradation | EDSR-RFA-16 | 27 | 86 | 0.239 | 0.034 |
| EDSR-RFA-32 | 173 | 130 | 0.571 | 0.206 | |
| Blur Degradation | EDSR-RFA-16 | 23 | 104 | 0.181 | 0.028 |
| EDSR-RFA-32 | 154 | 148 | 0.510 | 0.175 |
| Method | Precision | Recall | F1 Score |
|---|---|---|---|
| HR | 0.96 | 0.96 | 0.96 |
| Bicubic | 0.20 | 0.02 | 0.03 |
| EDSR | 0.24 | 0.02 | 0.03 |
| EDSR-RFA | 0.31 | 0.02 | 0.04 |
| SR-GAN | 0.86 | 0.48 | 0.61 |
| SR-CGAN | 0.90 | 0.56 | 0.69 |
| SRCGAN-RFA-YOLO | 0.87 | 0.84 | 0.86 |
| Method | HR (AP) | SF = 8 (AP) | SF = 16 (AP) | Time (ms) |
|---|---|---|---|---|
| YOLOv3 | 96.83 | 0.713 | 24.34 | 27.73 |
| RetinaNet | 92.41 | 0.687 | 14.78 | 91.64 |
| SSD (VGG16) | 97.05 | 0.761 | 41.31 | 32.45 |
| EfficientDet | 96.97 | 0.754 | 42.23 | 51.24 |
| Faster R-CNN | 96.93 | 0.727 | 39.72 | 94.19 |
| SRCGAN-RFA-YOLO | 96.57 | 0.897 | 78.67 | 33.67 |
| Method | HR | Bicubic | EDSR-RFA | SRCGAN-RFA-YOLO |
|---|---|---|---|---|
| YOLOv3 | 96.83 | 24.34 | 49.31 | 78.67 |
| RetinaNet | 92.41 | 14.78 | 29.84 | 64.72 |
| SSD (VGG16) | 97.05 | 41.31 | 69.98 | 87.54 |
| EfficientDet | 96.97 | 42.23 | 69.17 | 88.56 |
| Faster R-CNN | 96.93 | 39.72 | 70.26 | 88.81 |
| Method | IoU = 0.10 | IoU = 0.25 | IoU = 0.50 |
|---|---|---|---|
| HR | 96.83 | 95.71 | 85.64 |
| Bicubic | 24.34 | 19.52 | 12.24 |
| EDSR | 46.81 | 42.68 | 31.12 |
| EDSR-RFA | 49.31 | 45.13 | 36.84 |
| SR-GAN | 65.53 | 61.18 | 48.82 |
| SR-CGAN | 67.19 | 63.97 | 48.63 |
| SRCGAN-RFA-YOLO | 78.67 | 72.28 | 58.76 |
| Method | Precision | Recall | F1 Score |
|---|---|---|---|
| HR | 0.96 | 0.95 | 0.96 |
| Bicubic | 0.27 | 0.05 | 0.09 |
| EDSR | 0.24 | 0.07 | 0.11 |
| EDSR-RFA | 0.25 | 0.10 | 0.14 |
| SR-GAN | 0.70 | 0.44 | 0.54 |
| SR-CGAN | 0.82 | 0.59 | 0.69 |
| SRCGAN-RFA-YOLO | 0.88 | 0.80 | 0.84 |
Publisher’s Note: MDPI stays neutral with regard to jurisdictional claims in published maps and institutional affiliations. |
© 2021 by the authors. Licensee MDPI, Basel, Switzerland. This article is an open access article distributed under the terms and conditions of the Creative Commons Attribution (CC BY) license (https://creativecommons.org/licenses/by/4.0/).
Share and Cite
Bashir, S.M.A.; Wang, Y. Small Object Detection in Remote Sensing Images with Residual Feature Aggregation-Based Super-Resolution and Object Detector Network. Remote Sens. 2021, 13, 1854. https://0-doi-org.brum.beds.ac.uk/10.3390/rs13091854
Bashir SMA, Wang Y. Small Object Detection in Remote Sensing Images with Residual Feature Aggregation-Based Super-Resolution and Object Detector Network. Remote Sensing. 2021; 13(9):1854. https://0-doi-org.brum.beds.ac.uk/10.3390/rs13091854
Chicago/Turabian StyleBashir, Syed Muhammad Arsalan, and Yi Wang. 2021. "Small Object Detection in Remote Sensing Images with Residual Feature Aggregation-Based Super-Resolution and Object Detector Network" Remote Sensing 13, no. 9: 1854. https://0-doi-org.brum.beds.ac.uk/10.3390/rs13091854