
Retrieval of DTM under Complex Forest Stand Based on Spaceborne LiDAR Fusion Photon Correction

1
School of Information Science and Technology, Beijing Forestry University, Beijing 100083, China
2
Engineering Research Center for Forestry-Oriented Intelligent Information Processing, National Forestry and Grassland Administration, Beijing 100083, China
3
Guangxi Gaofeng Forest Farm, Nanning 530001, China
*
Author to whom correspondence should be addressed.
Remote Sens. 2022, 14(1), 218; https://0-doi-org.brum.beds.ac.uk/10.3390/rs14010218
Submission received: 29 November 2021
/
Revised: 24 December 2021
/
Accepted: 31 December 2021
/
Published: 4 January 2022
(This article belongs to the Special Issue Microtopography in Geomorphology, Forest Sciences and Biomass Categorization)
Abstract
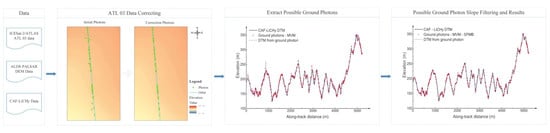
:The new generation of satellite-borne laser radar Ice, Cloud, and land Elevation Satellite-2 (ICESat-2) data has been successfully used for ground information acquisition. However, when dealing with complex terrain and dense vegetation cover, the accuracy of the extracted understory Digital Terrain Model (DTM) is limited. Therefore, this paper proposes a photon correction data processing method based on ICESat-2 to improve the DTM inversion accuracy in complex terrain and high forest coverage areas. The correction value is first extracted based on the ALOS PALSAR DEM reference data to correct the cross-track photon data of ICESat-2. The slope filter threshold is then selected from the reference data, and the extracted possible ground photons are slope filtered to obtain accurate ground photons. Finally, the impacts of cross-track photon and slope filtering on fine ground extraction from the ICESat-2 data are discussed. The results show that the proposed photon correction and slope filtering algorithms help to improve the extraction accuracy of forest DTM in complex terrain areas. Compared with the forest DTM extracted without the photon correction and slope filtering methods, the MAE (Mean Absolute Error) and RMSE (Root Mean Square Error) are reduced by 51.90~57.82% and 49.37~53.55%, respectively. To the best of our knowledge, this is the first study demonstrating that photon correction can improve the terrain inversion ability of ICESat-2, while providing a novel method for ground extraction based on ICESat-2 data. It provides a theoretical basis for the accurate inversion of canopy parameters for ICESat-2.
1. Introduction
The spaceborne laser radar (lidar) remote sensing is an advanced technology that can directly obtain vertical dimensions and provide various highly relevant information for global scientific studies [1]. At present, there are four successfully launched earth observation satellites with laser altimetry technology as the main payload: Ice, Cloud, and land Elevation Satellite (ICESat); Earth Science Laser Altimeter System (GLAS); Ice, Cloud, and land Elevation Satellite-2 (ICESat-2); Advanced Topographic Laser Altimeter System (ATLAS); Gaofen-7 (GF-7) and Global Ecosystem Dynamics Investigation (GEDI). The ICESat, GF-7, and GEDI record the laser altimetry data in a waveform mode. ICESat-2 is the first satellite platform that uses the micro-pulse multi-beam photon-counting lidar technology for laser altimetry [2]. ATLAS provides distance measurements from space. The combination of these distance measurements and precise satellite positioning information produces the geographic location and elevation of the photon events detected by ATLAS [3,4]. The data products related to the Digital Terrain Model (DTM) include the Global Positioning Photonic Data Product (ATL03) and Land and Vegetation Height Data Product (ATL08). The ICESat-2 aims to continuously monitor changes in the height of the polar glaciers, ice sheets, and sea ice. Simultaneously, it collects data on all surface types of the earth, including forests, oceans, lakes, and land. This can be used as an important supplementary data source for biomass and vegetation mapping [5,6,7,8,9,10,11]. ICESat-2 does not require professional surveying and mapping tasks. However, the data of ICESat-2 can provide terrain and forest stand heights on a global scale, which is suitable for regional studies [12]. In areas such as glaciers, sea ice, and lakes, the surface signal photons of the corresponding ground objects can be accurately obtained after photon denoising the ICESat-2 data. For instance, Brunt et al. [13] refer to the Global Navigation Satellite System (GNSS) surface height data. They deduce that the surface height accuracy of ICESat-2 ATL03 based on photons is better than 13 cm. However, in the forest area, the denoised photon cloud contains ground photon points, canopy points, and canopy top photon points. In complex terrain and dense forest areas, the extracted ground photon points usually include non-ground points, such as near-ground photon points or vegetation canopy points. The ICESat-2 estimation of canopy parameters is based on having accurate ground information [14,15,16]. Therefore, effectively identifying ground photon points in areas with complex terrain and high forest coverage is crucial for extracting the canopy parameters from ATLAS data.
For the traditional discrete echo LiDAR system, several point classification algorithms exist for separating the ground echo and the tree canopy echo [17,18,19]. However, the photons generated by the photon counting system are displayed on the cross-section along the track, which is completely different from the traditional LIDAR point cloud. In this case, a new point classification algorithm is required to separate the ground photons and canopy photons [20]. In terms of ground photon point extraction, the existing algorithms usually divide all the signal points into different windows along the track. They then use the lowest elevation point corresponding to each window [21,22] or the point within the elevation quantile range as ground photon points [20,23]. Neuenschwander and Magruder [14] use ATLAS data simulated by airborne small spot lidar to analyze the uncertainty of photon-counting lidar for canopy height estimation under different ecosystem conditions. The obtained results demonstrate that the forest structure parameters, extracted from the photon-counting lidar data, have a strong correlation with the corresponding index calculated by the airborne small-spot lidar. Neuenschwander et al. [24] found a strong correlation between the understory DTM retrieved from the airborne lidar data in the Finnish forest area and the corresponding ICESat-2/ATLAS data (R2 = 0.99, RMSE = 0.85 m). Wang et al. [25] also showed, through experiments in the forest area of Alaska, that a strong correlation exists between the ICESat-2/ATLAS data and DTM obtained by airborne lidar (R2 = 0.99, RMSE = 1.96 m). Their data processing algorithm achieves satisfactory results in the plain test area, which indicates that ICESat-2/ATLAS has the ability to describe the understory terrain. However, due to the lack of corresponding studies in areas with complex terrain, the researchers have turned their focus to DTM extraction under complex terrain conditions. In the complex terrain area, the highest density photon point at the lowest elevation peak of the photon data elevation frequency histogram is used as the initial ground photon. In addition, the empirical mode decomposition algorithm is used to eliminate pseudo ground photons, such as noise points and canopy photon points in the initial ground photons. This method improves the accuracy of ground photon extraction under complex terrain conditions (R2 = 1, RMSE = 4.03 m) [26]. Moreover, the DTM error increases with the increase of the slope and forest coverage. Extracting DTM in areas with steep slopes > 30° is the biggest challenge faced by ICESat-2 [11]. The existing ground extraction algorithm can achieve satisfactory results in the plain experimental area. However, it requires further improvements when dealing with complex terrain conditions.
ICESat-2 provides ATL08 products for global change height, while its quality characteristics are not fully understood. In order to evaluate the accuracy of ATL08 data, and verify the accuracy of the ground elevation extracted from Atlas data in complex terrain areas, the presented study is carried out in the state-owned Gaofeng forest farm of Guangxi Zhuang Autonomous Region, China. This area was chosen not only because the project team of “Research on Key Technologies of Planted Forest Resources Monitoring” was able to provide airborne lidar data, but also due to the fact that it has a complex terrain and high forest coverage, and it provides necessary conditions for verifying the ATLAS data in extracting understory DTM in complex terrain and dense forest areas. This paper proposes efficient methods to improve the accuracy of understory ground elevation extraction from ICESat-2 data. The main objectives of this paper can be summarized as follows. It first evaluates the performance of ICESat-2/ATLAS data ATL08 product in identifying ground photons in areas with complex terrain and high forest coverage. It then explores the impact of point-cloud cross-track migration on the accuracy of inverted DTM understory and proposes to use ALOS PALSAR DEM as reference elevation data to perform photon correction on ATL03 data, which verifies the feasibility of eliminating point-cloud cross-track migration. Finally, before the moving curve is fitted to the ground, slope filtering is used to perform the initial ground photon point selection, and the impact of this method on removing the vegetation points near the ground is evaluated.
2. Materials and Methods
2.1. Description of the Study Area
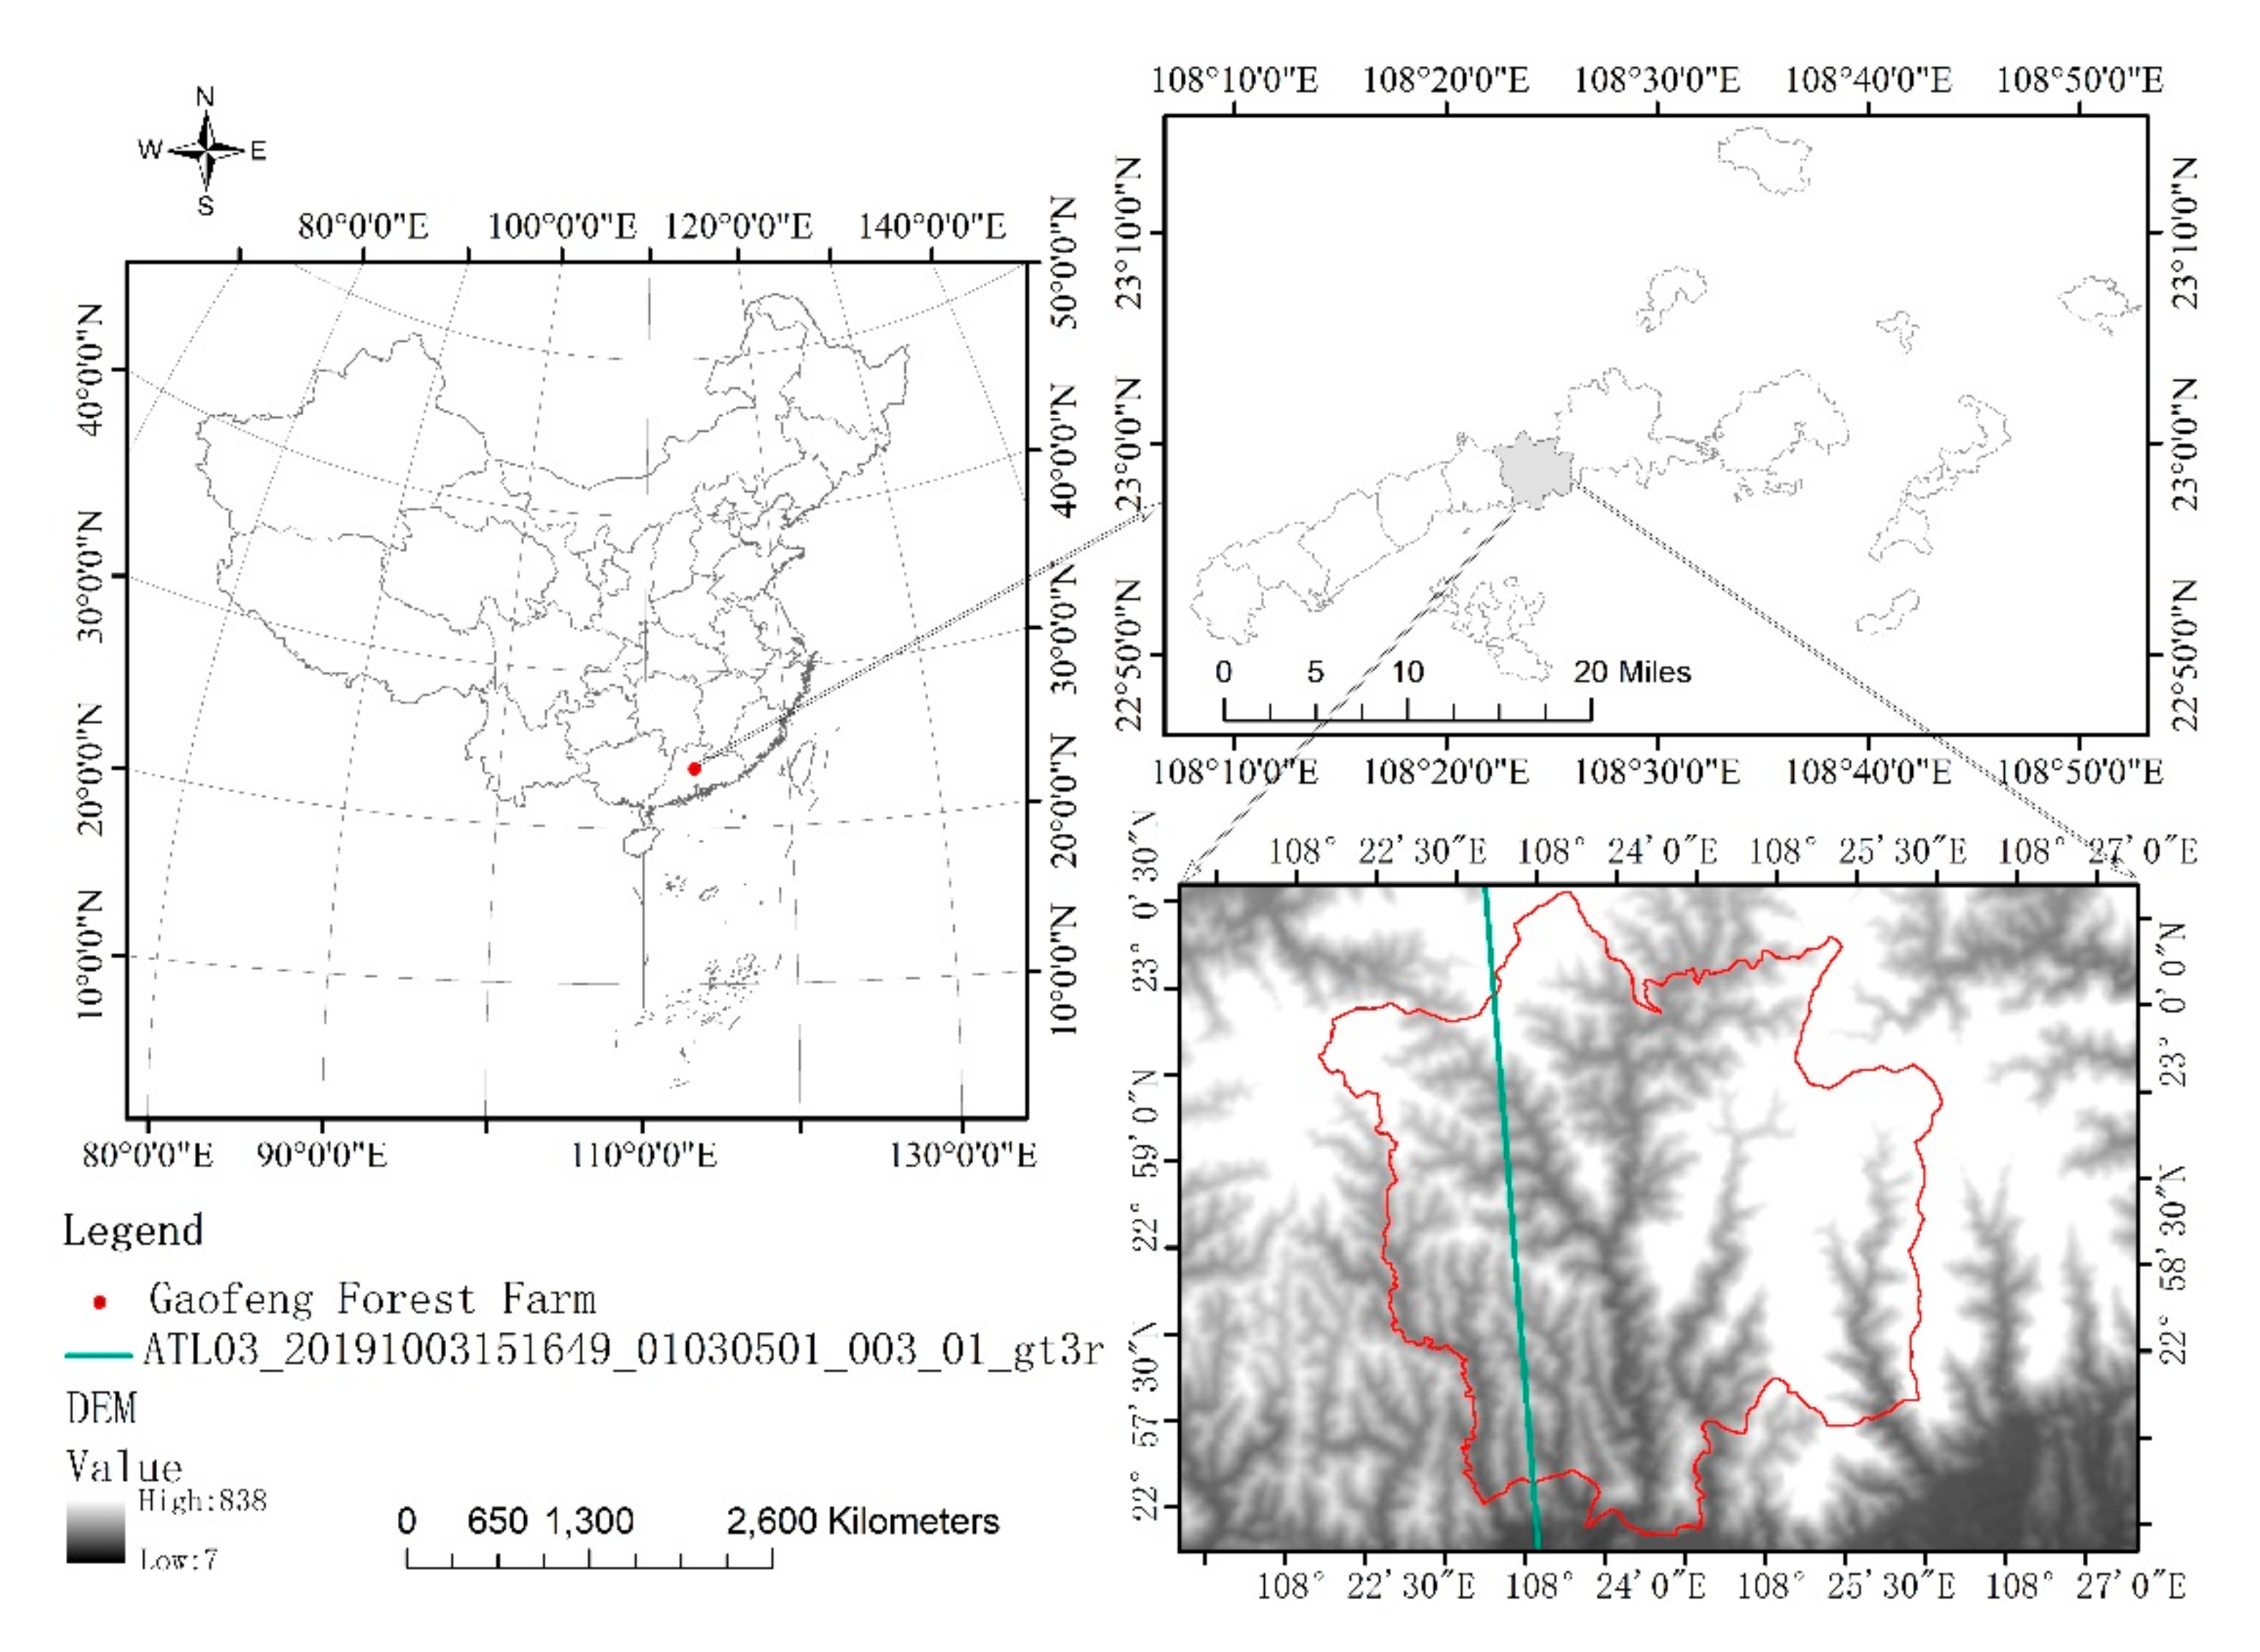
The study area is located in Nanning City, Guangxi Zhuang Autonomous Region, China, and it has a latitude and longitude range of (22.57°N~23.00°N, 108.23°E~108.24°E), as shown in Figure 1. Nanning, located in the southwest of Guangxi Zhuang Autonomous Region, has a subtropical monsoon climate, with an average annual rainfall of 1241~1753 mm, and an annual average temperature of almost 21.6 °C [27]. The study area is located at the hilly land. The slope of the terrain ranges between 10° and 48°, the area with a slope greater than 15° accounts for 62.21%. The altitude range of the study area is 120~360 m above mean sea level (World Geodetic System 1984, WGS84). The study area is dominated by forest land and unforested land. The existing main tree species are Eucalyptus urohpylla S.T. Blake, Eucalyptus grandis x urohpylla, Pinus massoniana Lamb., Pinus elliottii, Illicium verum Hook.f., Castanopsis hystrix Miq., Michelia macclurei Dandy, Mytilaria laosensis Lec., Acacia crassicarpa Benth., etc. The forest coverage rate exceeds 90%, while the canopy height ranges between 0.1 m and 24.6 m.
2.2. Considered Data
2.2.1. ICESat-2 Data
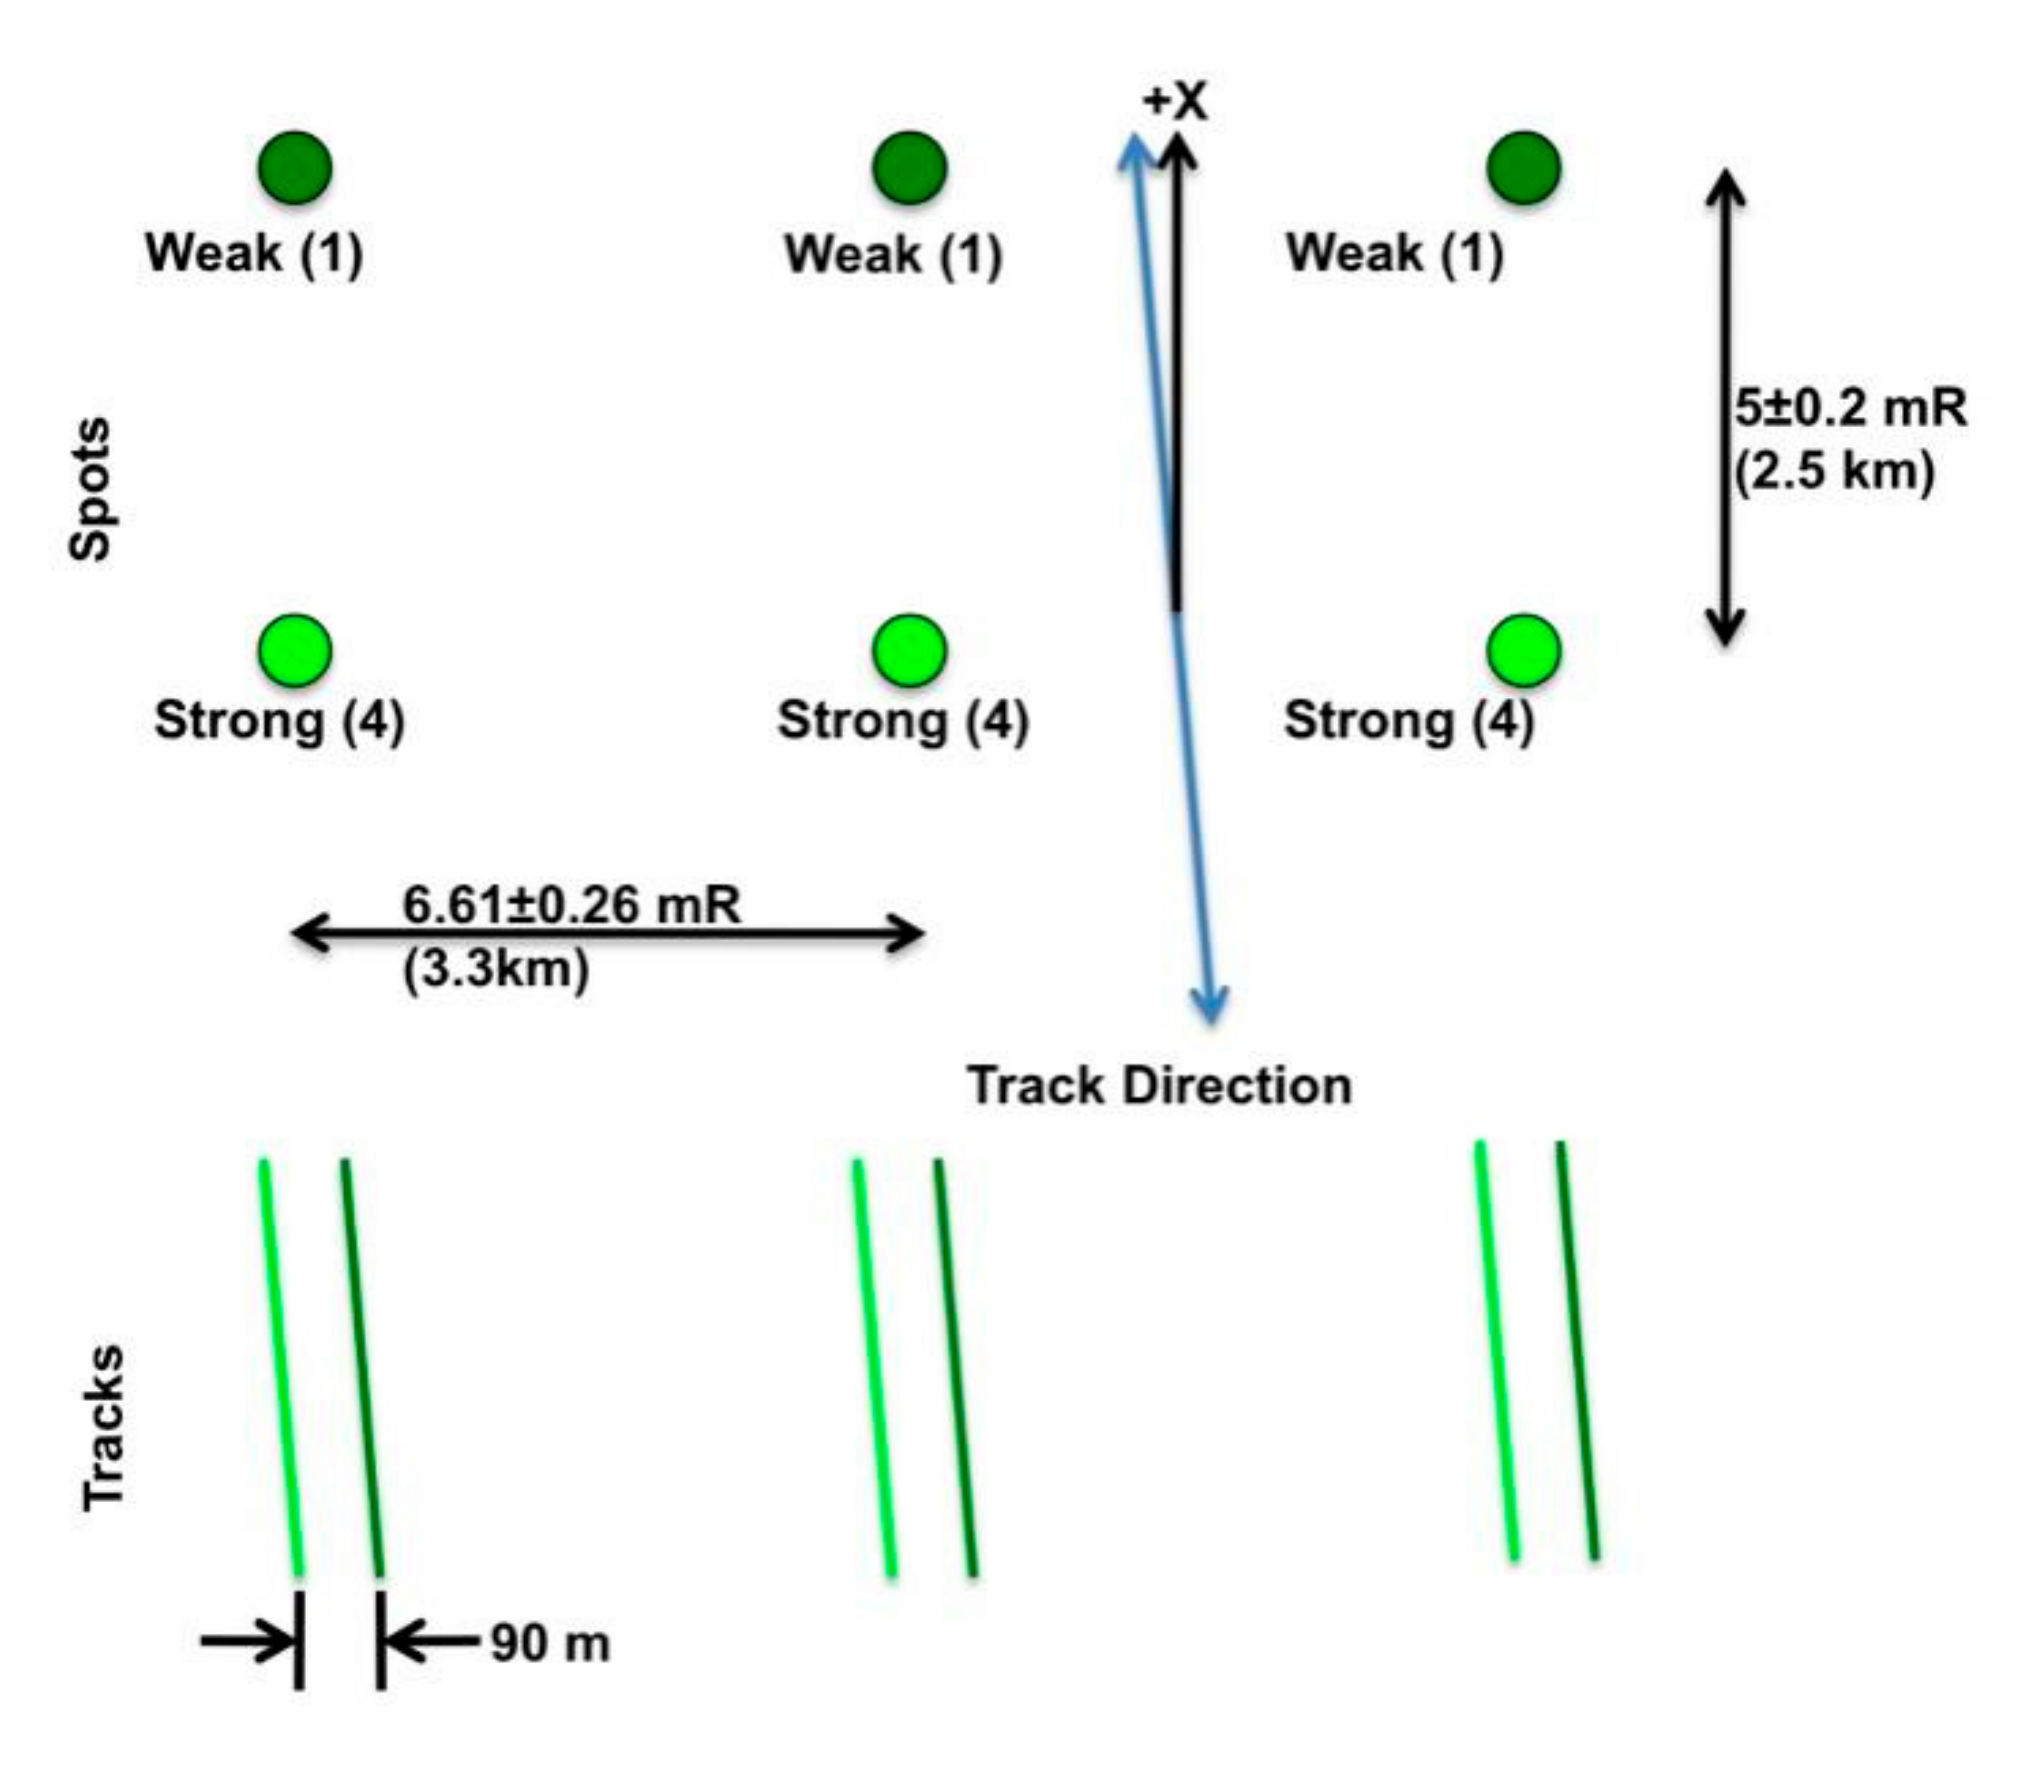
In September 2018, the National Aeronautics and Space Administration (NASA) launched a new type of space-based laser altimetry mission referred to as Ice, Cloud, and Ground Elevation Satellite 2 (ICESat-2). The average orbital height of the spacecraft is 496 km (± 6 km), the geographic coordinates refer to the WGS84 ellipsoid, and the spatial coverage is between 88° N and 88° S [25,28]. In order to be consistent with the airborne lidar data, the height of the ATL03 data is subtracted from the geoid correction information recorded in the ATL03 data. The Advanced Terrain Laser Altimeter System (ATLAS) [29] is the only instrument on ICESat-2. ATLAS generates 532 nm laser pulses at a frequency of 10 kHz, with a footprint of almost 14 m in diameter, and a footprint of 0.7 m along the track [26,30,31]. It uses 3 pairs of 6 beams, where each group contains one strong signal and one weak signal, with an energy ratio of 4:1. The vertical track distance of each pair of beams is almost 3.3 km. For each pair of beams, the distance between the strong and weak beams in the vertical track direction is almost 90 m, while the distance along the track direction is almost 2.5 km [4]. The footprint distribution form of the ATLAS data is presented in Figure 2.
According to the ICESat-2 data product announced by the National Snow and Ice Data Center (NSIDC), ICESat-2 has 4 levels and a total of 21 products, referred to as ATL01~ATL21, while the files are stored in h5 hierarchical files format data. The data products related to forest DTM include ATL03 and ATL08. ATL03 is a Global Geo-located Photon Data product. The ATL03 product includes the time, latitude, longitude, and elevation information of each photon event. ATL08 is a land vegetation data product (Land and Vegetation Height). The ATL08 product uses Differential, Regressive, and Gaussian Adaptive Nearest Neighbor (DRAGANN) to denoise the ATL03 data, while the official NASA classification algorithm is used to perform the classification of the photon point cloud. The photon cloud is divided into canopy apex photons, canopy photons, ground photons, and noise photons. The statistics of terrain and tree canopy are reported in 100-m steps [32]. The file names of the used data are ATL03_20191003151649_0103 0501_003_01_gt3r and ATL08_ 20191003151649_01030501 _003_01_gt3r. The ATL03 and ATL08 data used in the study are available at https://search.earthdata.nasa.gov (accessed on 5 March 2021).
2.2.2. Alos Palsar Dem Data
The Advanced Land Observing Satellite (ALOS) was launched by the Japan Aerospace Exploration Agency (JAXA) on 24 January 2005. ALOS has three remote sensing instruments: the Panchromatic Remote-sensing Instrument for Stereo Mapping (PRISM) for digital elevation mapping, the Advanced Visible and Near Infrared Radiometer type 2 (AVNIR-2) for precise land cover observations, and the Phased Array L-type band Synthetic Aperture Radar (PALSAR) for all-weather terrestrial observations [33]. The ALOS PALSAR DEM, having a pixel spacing of 12.5 m [34], was downloaded from the Alaska Satellite Facility (https://asf.alaska.edu, accessed on 20 March 2021), and used as the reference elevation data with the file name AP_16054_FBS_F0440_RT1.
2.2.3. CAF-LiCHy Data
The detection ability of small spot lidar data on forest spatial structure and understory terrain has been widely studied [35]. The CAF-LiCHy (Chinese Academy of Forestry, LiDAR, CCD, Hyperspectral) and the trajectory markup language (Keyhole Markup Language, KML) of the ATL03 file are used to determine the coincidence position of the two types of data. The CAF-LiCHy, integrating a remote sensing observation platform, was proposed by the Institute of resource information, Chinese Academy of Forestry, which is located at No. 1, Dongxiaofu, Xiangshan Road, Beijing, China. It includes a full-waveform airborne lidar (LMS-Q680i), an airborne push-broom hyperspectral scanner (AISA Eagle II), and a high-resolution CCD camera (DigiCAM-H60). LMS-Q680i, AISA Eagle II, and DigiCAM-H60 share a set of POS positions and attitude systems [36]. CAF-LiCHy is similar to NASA’s onboard integrated system (Goddard’s LiDAR Hyperspectral Thermal, G-LiHT). In order to verify the accuracy of the ATLAS data inversion of understory DTM, this paper used the digital surface model (DTM) extracted from the lidar data obtained by LMS-Q680i in CAF-LiCHy, as the verification data. The data have a spatial resolution of 1 m and a vertical accuracy of 0.15 m. The data format is GeoTIFF. In the absence of ground truth datasets, CAF-LiCHy provides truly independent verification. All the DEM/DTM were geometrically corrected using WGS-84 geoid as the elevation datum. They were analyzed using the ArcMap spatial analysis tools.
2.3. Methodologies
In this study, the ICESat-2 data processing steps included point cloud correction, noise elimination, ground surface extraction, and accuracy evaluation. These processes are prerequisites for obtaining accurate and reliable terrain data. An overview of the main steps of the proposed method is presented in Figure 3.
2.3.1. Photon Correction
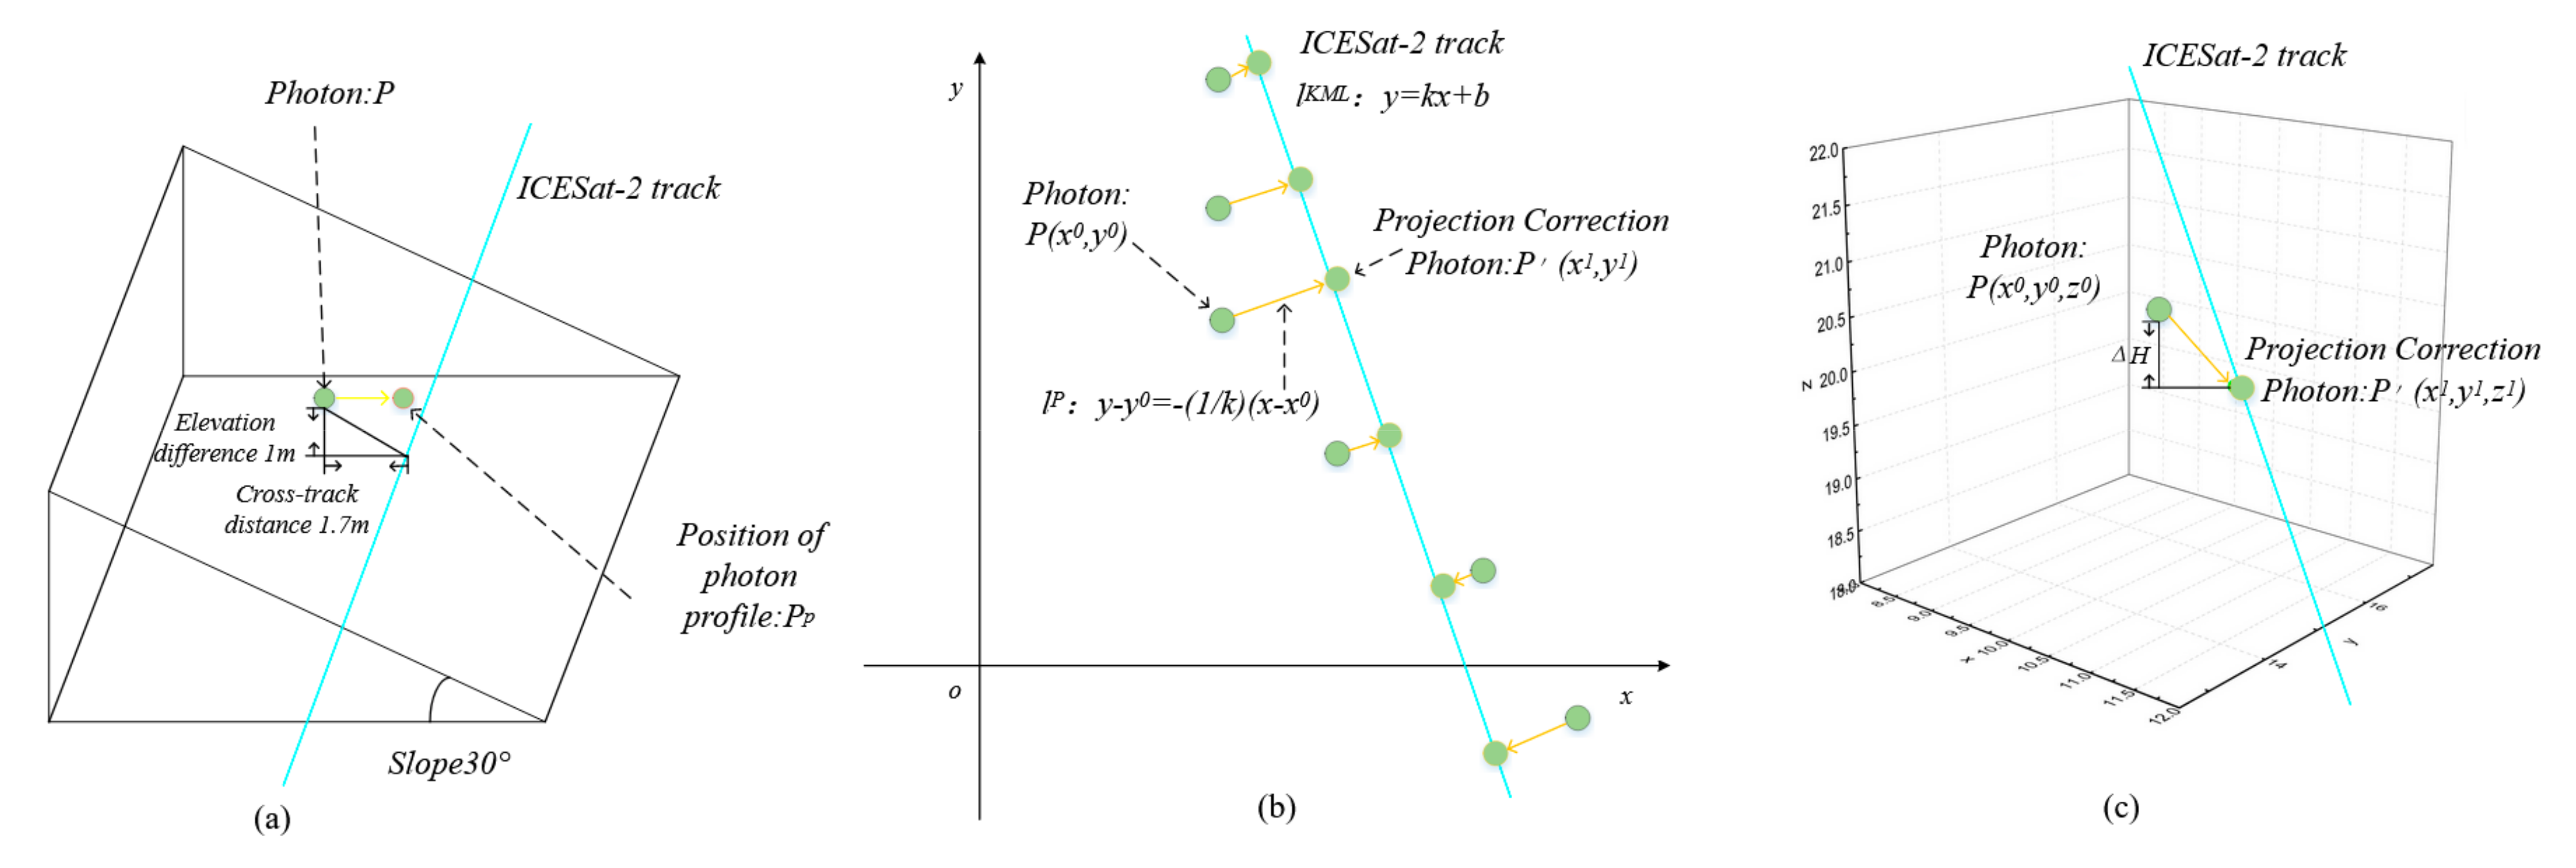
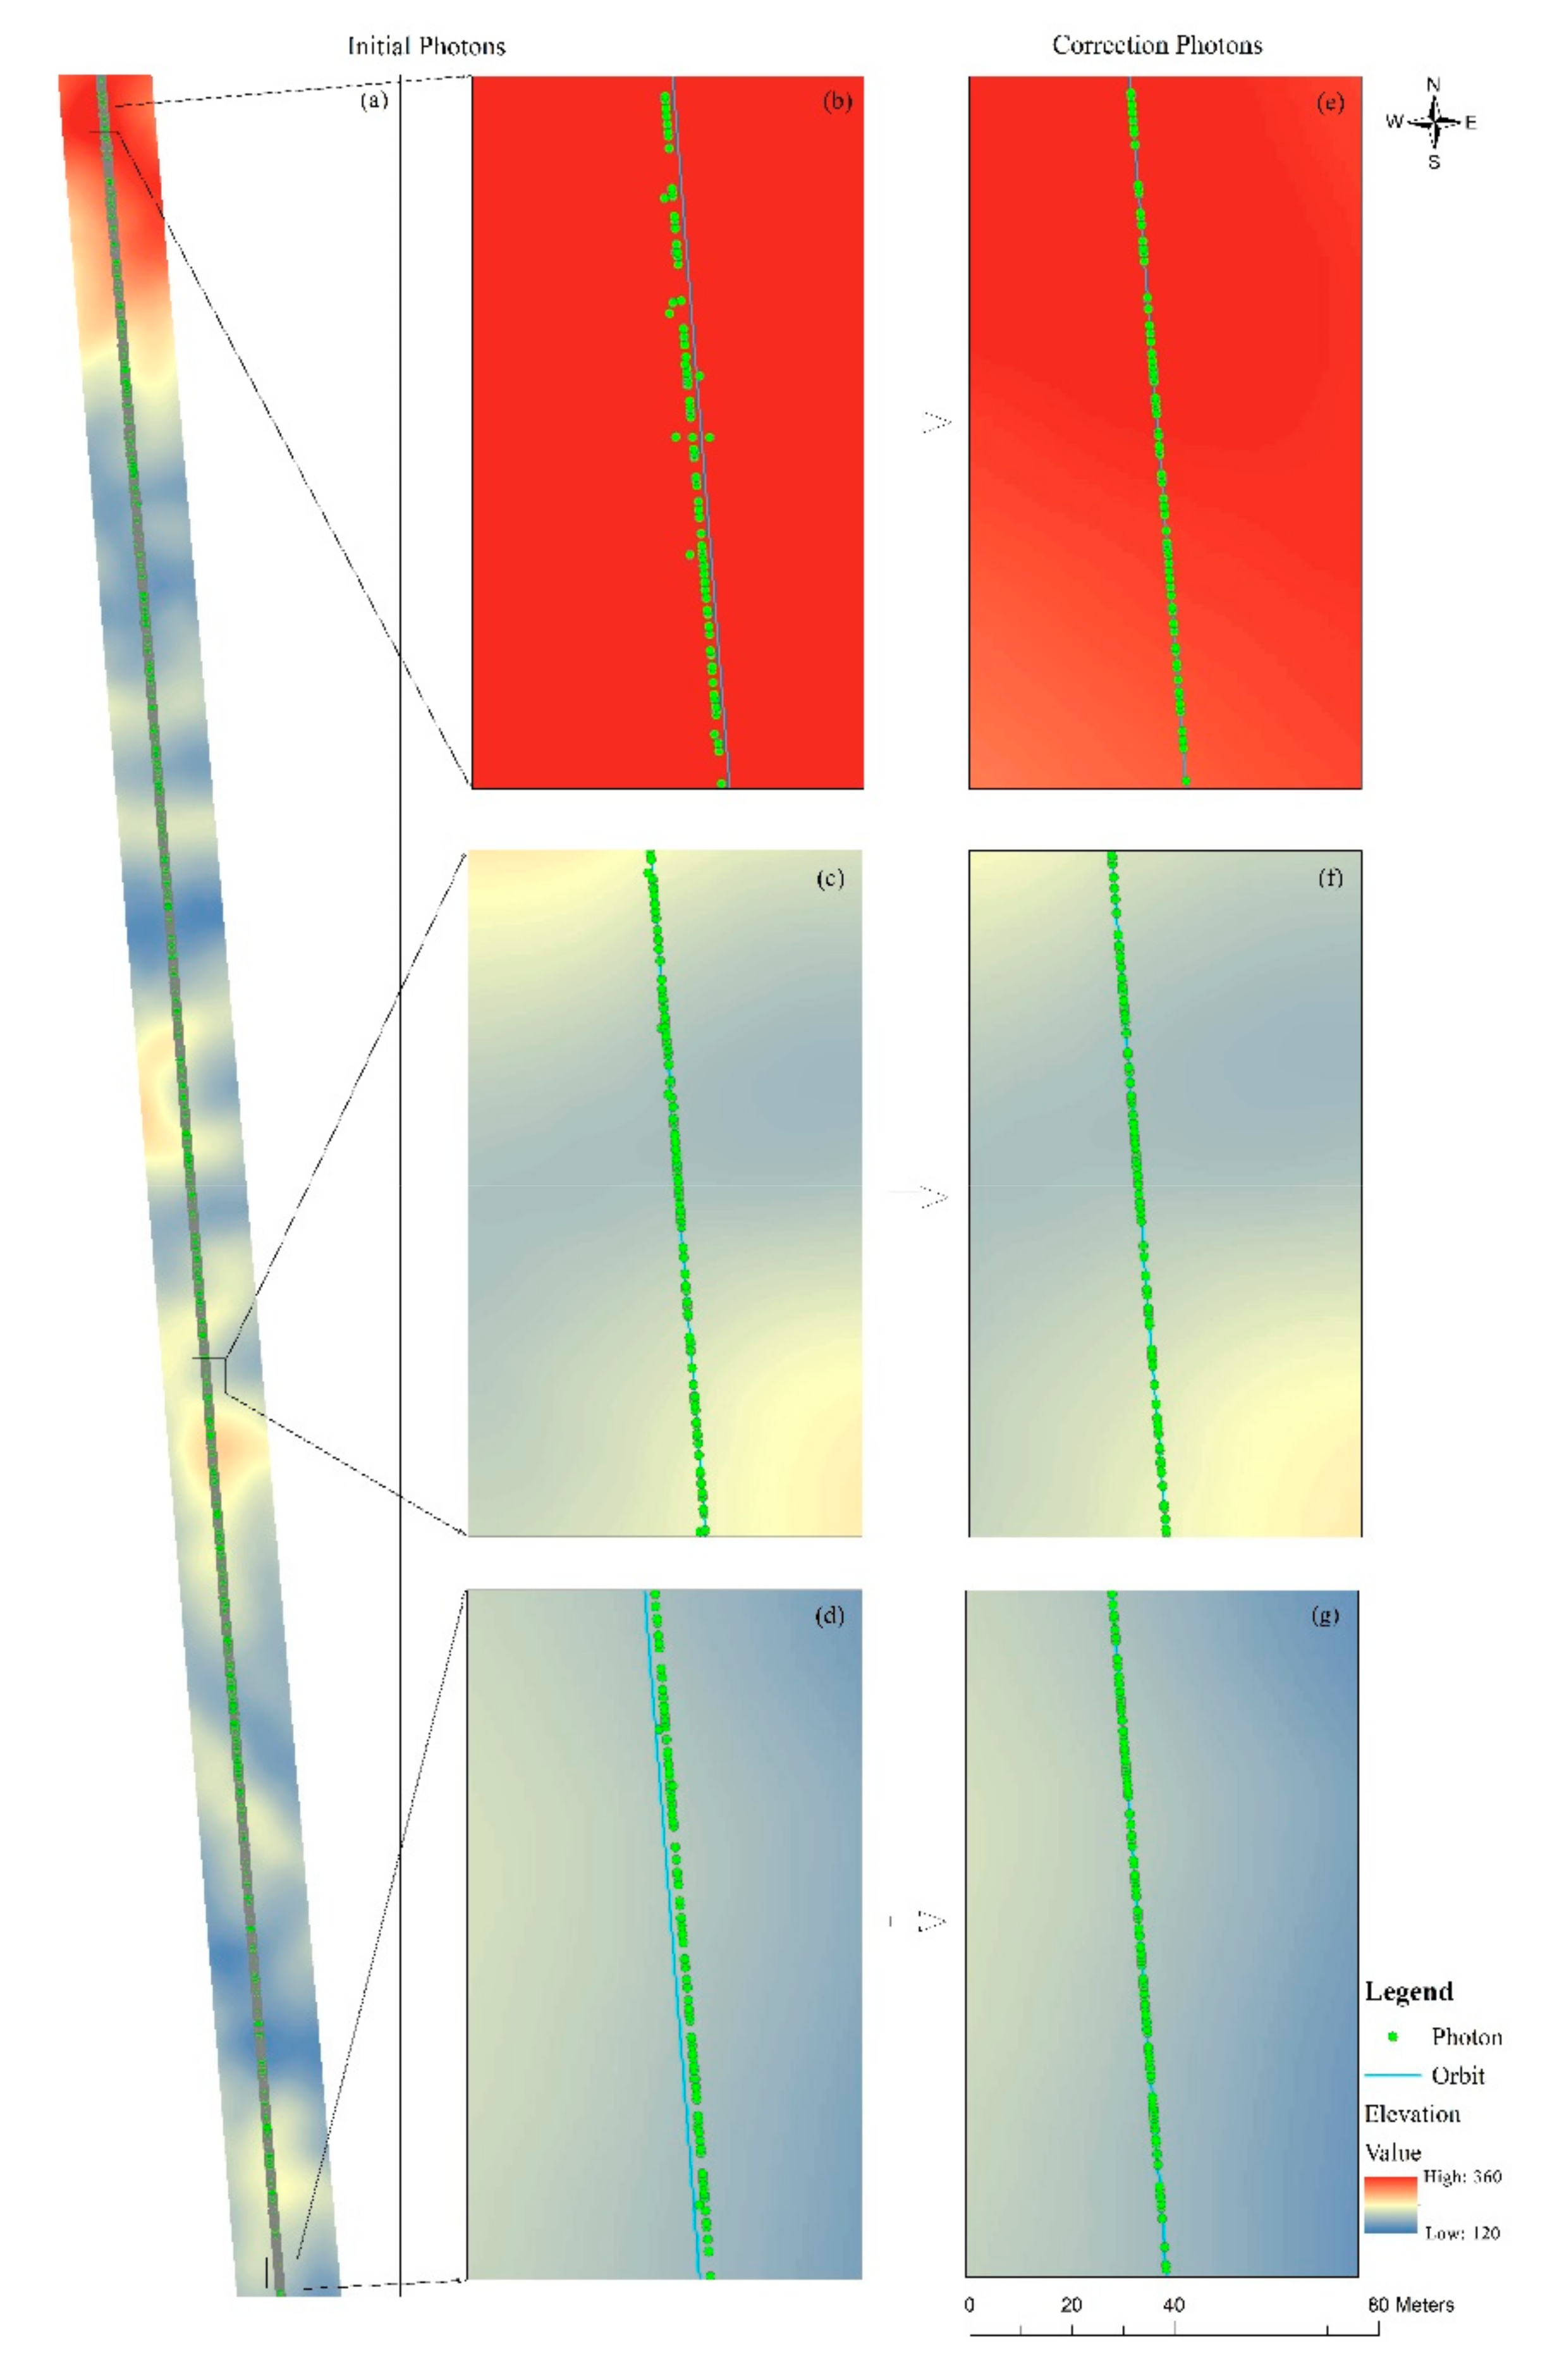
The existing methods mainly perform coordinate projection transformation on point clouds. The abscissa represents the distance along the track, and the ordinate represents the elevation. Photon denoising and photon classification were performed for the profile photon point cloud. This type of method ignores the error caused by the photon cross-track distance when transforming the photon data into the profile photon point cloud. The ICESat-2 task allows a 6.5 m horizontal offset [24,37], and the photon cross-track distance does not affect the extraction of ground photons on flat ground or a small slope. However, in the case of large study area slope and complex terrain changes, when the cross-track photon (P) is directly converted to the profile photon (PP) by ignoring the photon cross-track distance, it may cause errors in the selection of ground photons (cf. Figure 4a). It can be observed from Figure 5a–d that the photons are not evenly distributed on one or both sides of the reference ground track, and the cross-track distances of different photons are also different. It is difficult to move all the photons into the orbit by adjusting the orbital position to make the photon distribution similar to the trajectory. Therefore, the photon position is only adjusted so that the cross-track photon is in the orbit.
Therefore, we proposed to use ALOS PALSAR DEM as the reference elevation data, correct the ATL03 data to the same track, and then convert the photon point cloud into a profile photon point cloud where the abscissa indicates the distance along the track and the ordinate as the elevation. The steps of the photon point cloud correction are summarized as follows.
The vertical mapping point of the photon on the track was first determined. The photon position and the reference ground track (RGT) of the ATL03 data are displayed in the XY plane. By considering that on the XY plane, the actual position of the photon is P(x0, y0) and the theoretical position converted to the profile photon is P’(x1, y1), the mapping function (cf. Equation (1)) can be used to express the mapping relationship between the actual position and the theoretical position (cf. Figure 4b). was used to fit RGT to obtain the parameters. Equation (2) was then used to obtain the coordinates of the mapping point.
Afterward, the reference elevation was extracted. Although the DEM obtained by airborne lidar has higher spatial resolution and accuracy, its improvement in terms of large-scale and even global applications is limited. Therefore, a high-precision global open-source DEM was used as reference data, with a view to wide-ranging applications. The ATL03 data and ALOS PALSAR DEM data were put on the same coordinate system, and the cubic interpolation was used to interpolate the ALOS PALSAR DEM data to DEM with 1 m pixel spacing. After interpolation, the real spatial resolution of DEM was not changed. However, it can reflect the finer ground changes to a certain extent so as to meet the requirements of photon correction. The ATL03’s initial photon coordinates (P) and mapping point coordinates (P’) were used to extract the reference elevation from the interpolated ALOS PALSAR DEM. The two values are respectively used as the reference elevation of the initial photon and the mapped point.
Finally, the elevation difference between the initial photon point and the mapped point was calculated using Equation (3). No matter how the slope between the initial photon point and the mapped point changes, the absolute elevation difference between the two points did not change. Therefore, this difference was used as the correction value. The correction value of each photon was subtracted from the photon height in the initial ATL03 data (cf. Equation (4)) to obtain the corrected height value, which was used as the elevation (Ec) of the mapping point, and (x1, y1, Ec) was the ATL03 correction data. The correction data of each initial photon was obtained according to these steps. Figure 5 shows the corrected photon position. We then verified whether this idea helps to improve the ground extraction accuracy by comparing the differences in ground extraction from the initial ATL03 data and the corrected data, and the requirements to correct the initial photons are discussed.
where x0 is the initial photon longitude of ATL03, y0 is the initial photon latitude of ATL03, x1 is the longitude of the photon mapping point, y1 is the latitude of the photon mapping point, x is the reference ground track longitude, y is the reference ground track latitude, k and b are parameters, ΔH is the correction value, z0 is the initial photon reference elevation of ATL03, z1 is the reference elevation of the photon mapping point, is the elevation of the mapping point, and is the initial height of the photon in the ATL03 data.
2.3.2. Noise Photon Removal
Before noise removal, the geographic location (latitude and longitude) was converted into the Along-Track Distance (ATD) from the start position to the end position. Data filtering was first performed to avoid classifying noisy photons in dense cloud areas such as ground photons and to obtain high-quality photons. Due to the fact that the clouds are much higher than the surface, the ICESat-2 data with altitude values higher than 60 m above the ALOS PALSAR DEM were considered to be affected by the clouds [26], and they are then excluded.
The algorithm proposed by Zhu et al. [12] was used to filter out noise photons and extract ground photons. The noise removal algorithm mainly includes two steps. It first creates an elevation frequency histogram to remove obvious noisy photons. It then establishes a local photon density distribution histogram to eliminate the remaining noisy photons. Figure 6a presents the initial data of ATL03, and Figure 6b presents the results of data filtering and noise removal of ATL03.
2.3.3. Ground Surface Extraction
After these steps were processed, the noise photons, ground photons, and canopy photons were still mixed together. It is very difficult to extract a low number of ground photons from them to accurately depict the peaks and valleys [1]. Therefore, an overlapping moving window was designed to process the remaining photons, and therefore identify the ground photons and canopy photons. The cubic spline interpolation method was then used to generate continuous ground estimates. The steps of ground photon classification are summarized as follows.
The extraction moving window was first established. Compared with searching for the possible top-of-canopy photons, identifying possible ground photons is more challenging, especially under dense vegetation conditions. This is due to the fact that a large number of noise photons are generated as the raw transmitted energy passes through the atmosphere and tree cover. Therefore, the detected ground information photon is relatively small, and the noise photon and the ground information photon are mixed together [21,38,39]. Note that the larger the extraction window and the moving step, the larger the extraction error. Based on previous experiments, the width of the moving window used to select ground photons was set to 20 m. In addition, when the moving step length is 10 m, the information photons can be more finely extracted.
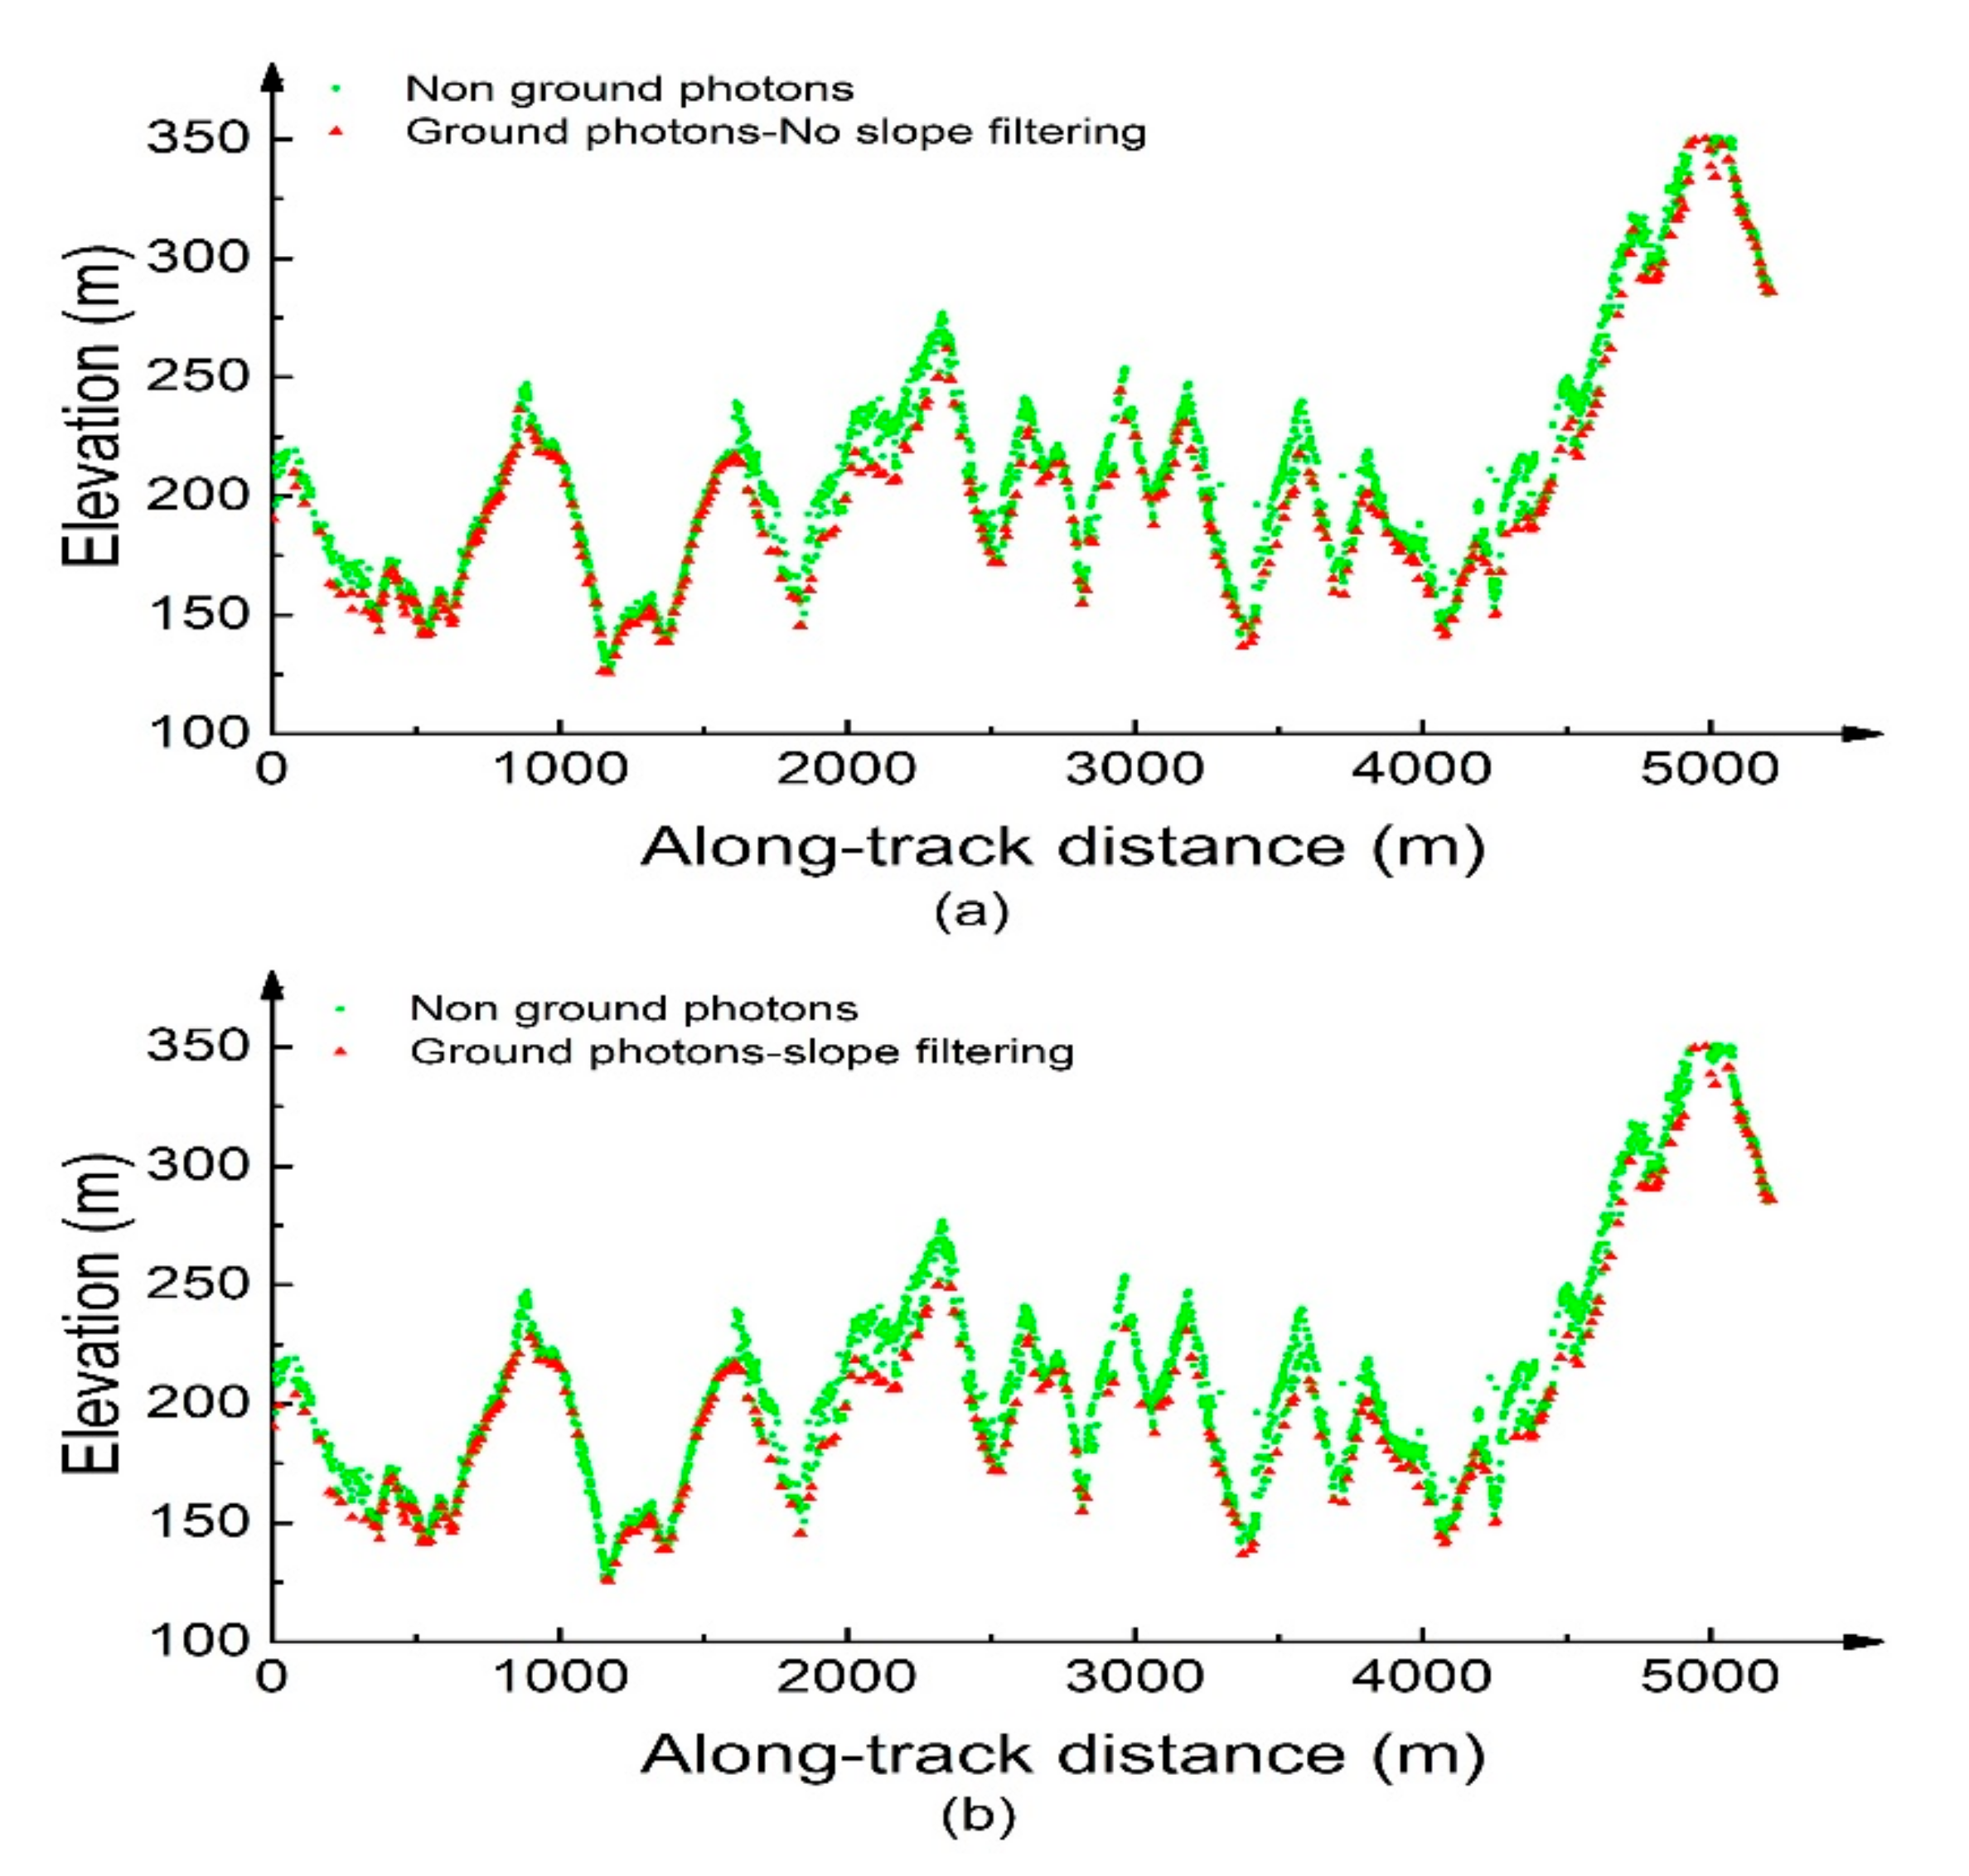
The possible ground photons were then chosen. The percentile method (using the range of elevation quantiles to extract the ground surface in the window range, referred to as PM in the sequel) and the minimum value method (the lowest elevation points in the window range of extracting the ground surface, referred to as MVM in the sequel) were used to select the possible ground photons. For the PM, because the photon density of the ATL03 data in this study area is relatively sparse, the photons within the elevation quantile of [0.00, 0.15] were selected in each interval to ensure that a sufficient number of photons can be used to estimate the terrain height. For the MVM, the minimum value in each interval is selected as the possible ground photon. The obtained results are shown as red dots in Figure 7a.
Afterward, the slope filtering method was used to filter the possible ground photons obtained in the previous step, and to remove the photons near the ground surface vegetation. The existing methods directly perform the interpolation based on the possible ground photons to generate continuous ground readings [23,26,39]. However, it is different from the uncertainty of sudden increase or sudden decrease in the top shape of the canopy by considering that the topographic undulation has a certain continuous smoothness (or the correlation between adjacent data points). Therefore, two filtering methods based on slope were designed to eliminate the influence of near-ground vegetation points, wrongly divided into ground points. The first method consists of calculating the slope of the possible ground photons, using the maximum slope corresponding to the ALOS PALSAR DEM in the study area as the threshold, and marking the points less than the threshold as ground photons. This method is referred to as the slope filtering method A, and referred to as SFMA in the sequel. The second method is based on SFMA results. More precisely, the maximum value of slope change in the reference elevation data ALOS PALSAR DEM was used as the threshold, and the points less than the threshold a were marked as ground photons. This method is referred to as slope filtering method B, and referred to as SFMB in the sequel. Finally, the cubic spline interpolation was used to fit the ground photons to obtain a continuous ground. In the sequel, the significance of slope filtering for selecting ground photons was assessed, and the data filtering ability of the two methods was compared.
2.3.4. Accuracy Validation
The efficiency and accuracy of the ground photon extraction method were analyzed using the airborne lidar CAF-LiCHy generated DTM data products. The determination coefficient (R2), error bias (bias), mean absolute error (MAE), and root mean square error (RMSE) are used to quantitatively verify the accuracy of the ground photon extraction from ICESat-2 data.
R2 Coefficient of determination:
Bias:
MAE, Mean absolute error:
RMSE, Root Mean Square Error:
where is the height metric measured by the airborne lidar CAF-LiCHy, is the height fitting value reversed by ICESat-2, n is the total number of evaluated photons, is the variance of , R2 represents the proportion of the total variation of the dependent variable that can be explained by the independent variable through the regression relationship, the deviation denotes the average difference between the inverted height of ICESat-2 and the height of CAF-LiCHy, where a negative value indicates an underestimation and a positive value indicates an overestimation, MAE represents the absolute difference between the two altitude indicators and provides an indicator of the magnitude of the difference, and RMSE is used to measure the deviation between the predicted value and the true value.
3. Results
3.1. ATL08 Ground Photon Accuracy Evaluation
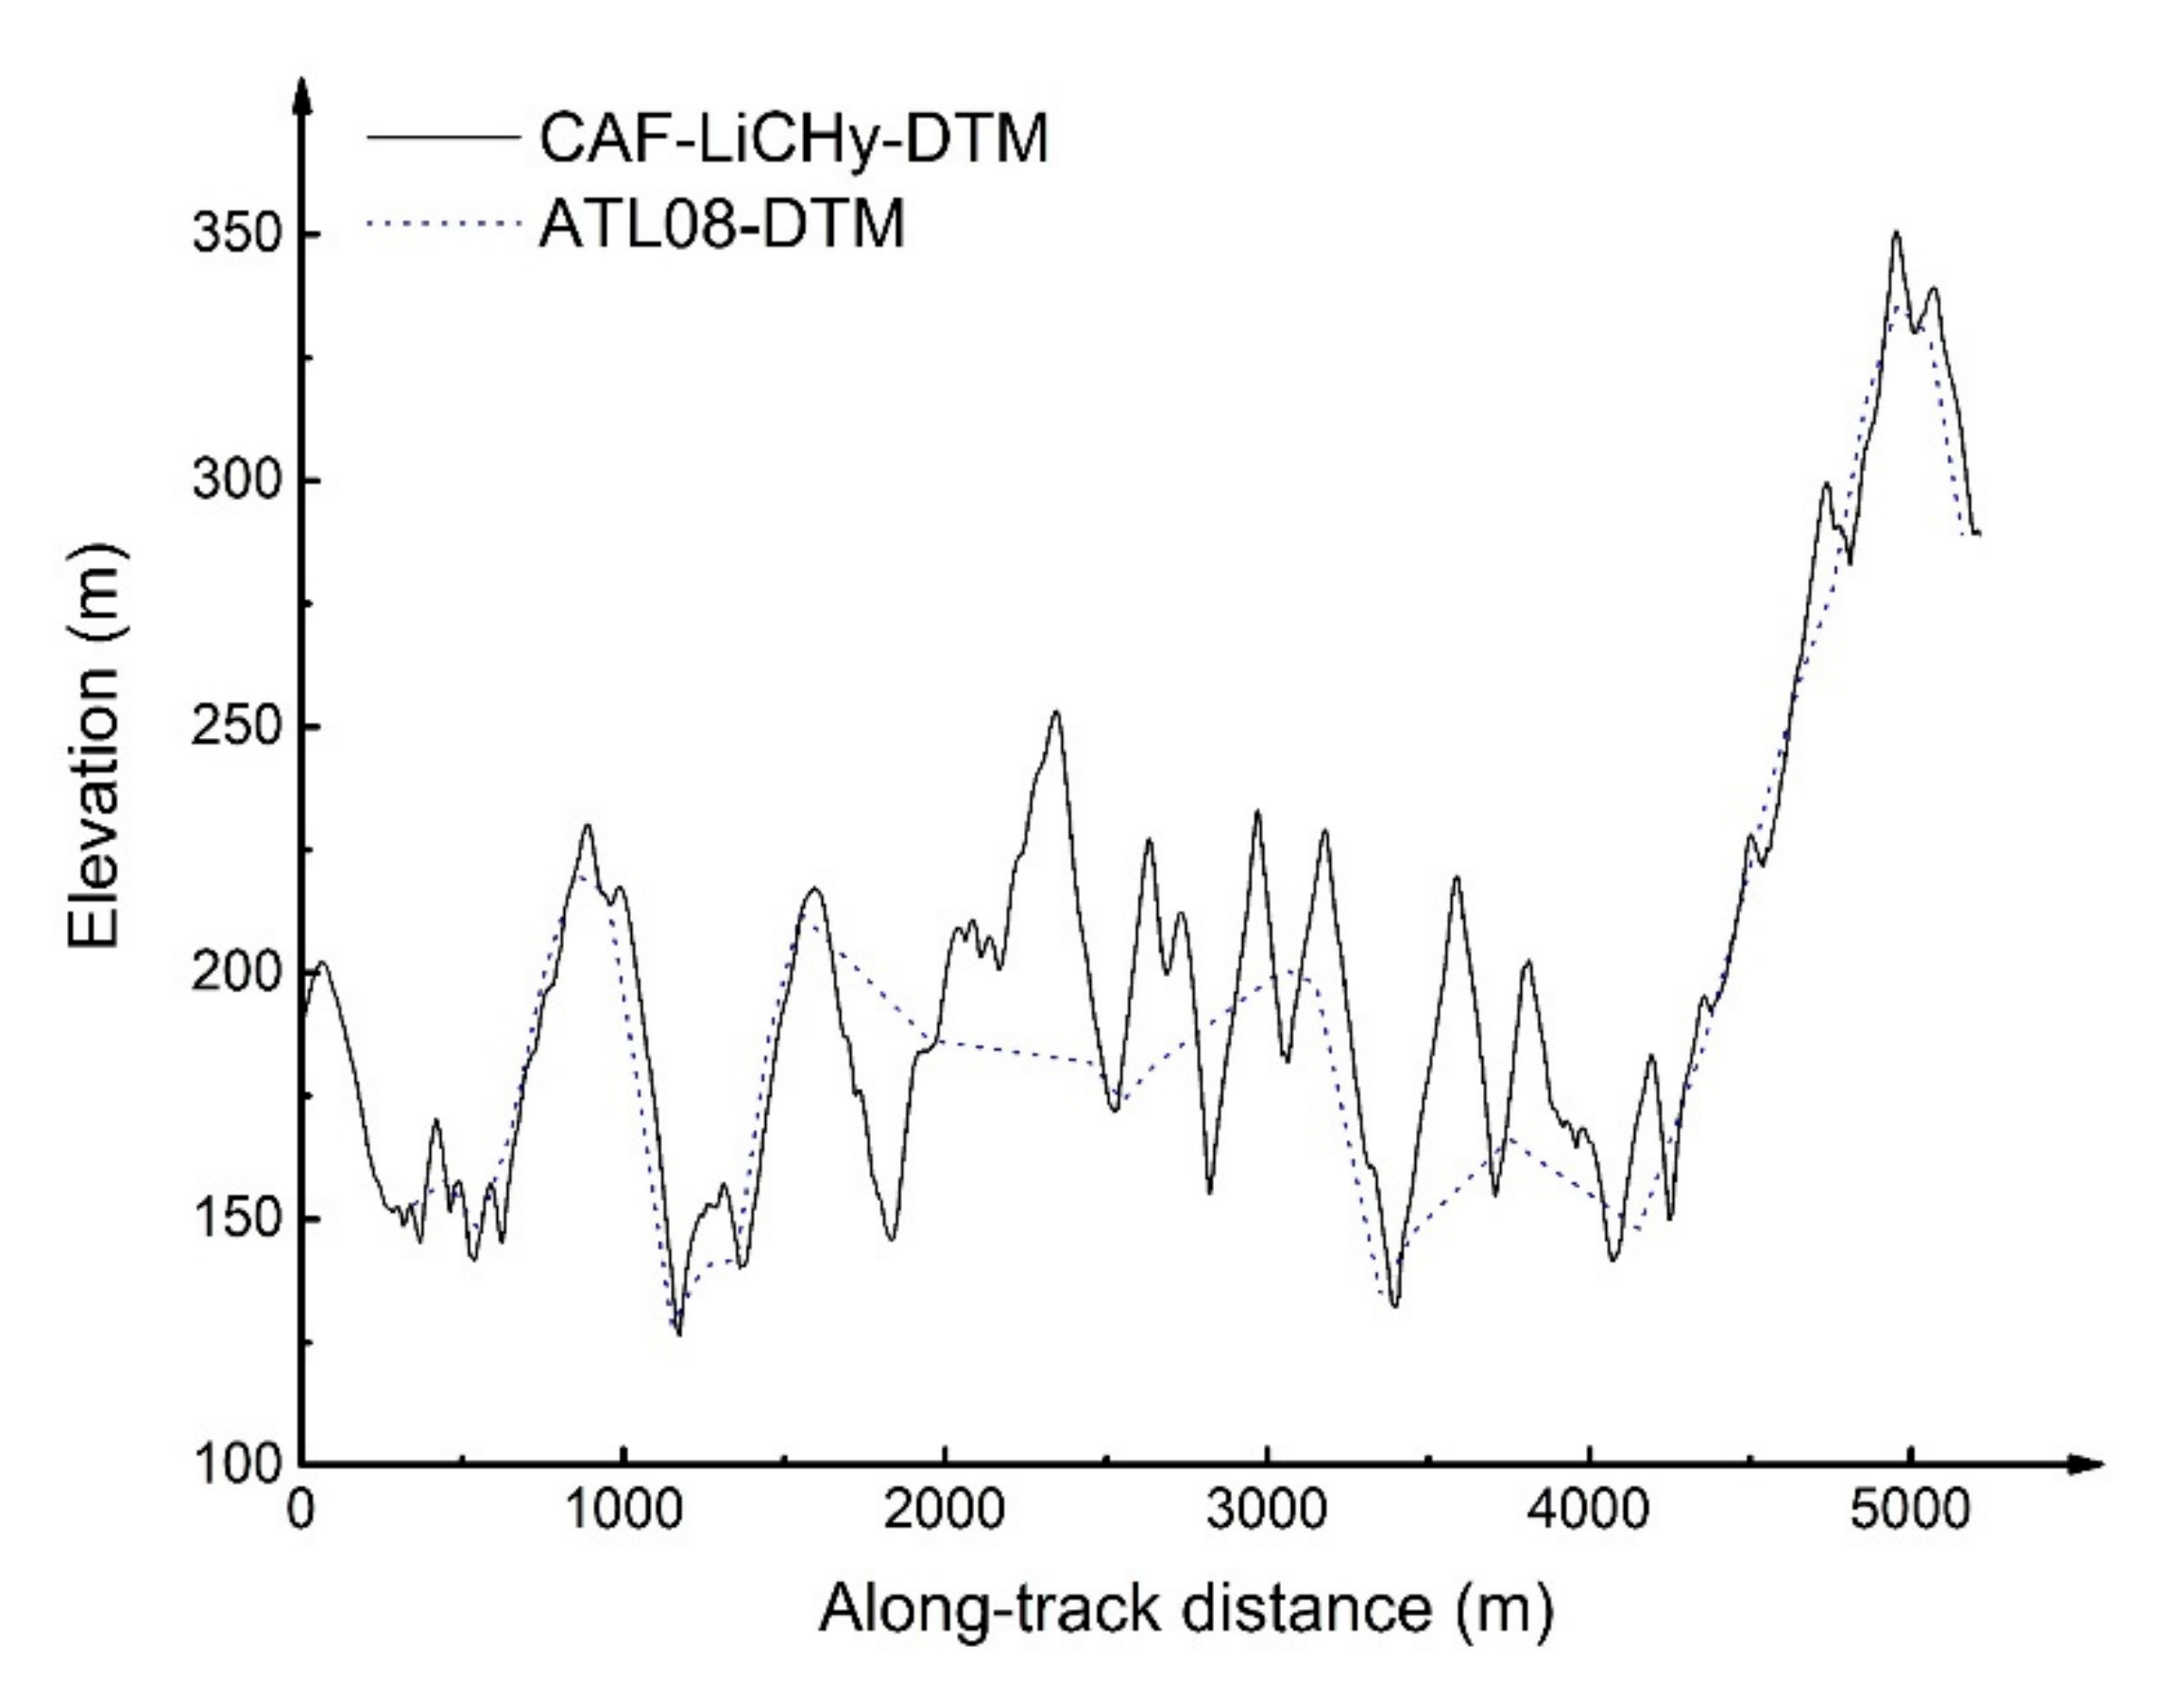
In this study, qualitative and quantitative evaluations of the ground surface extraction in the ATL03 and ATL08 data were performed. The qualitative analysis was mainly achieved through visual inspection. By visually inspecting the denoised ATL03 data in Figure 6b, it can be concluded that the ATL03 data can extract the ground surface. Figure 8 presents the understory terrain profile provided by the CAF-LiCHy product (i.e., CAF-LiCHy-DTM), the best-fitting terrain height result from the ATL08 data product under the conditions of high forest coverage and complex terrain in the subtropical forest area (h_te_best Fit), and the understory topography profile obtained by the cubic spline interpolation method (i.e., is ATL08-DTM). The ground photons identified by the ATL08 product were quite different from the understory terrain profile revealed by the lidar in CAF-LiCHy.
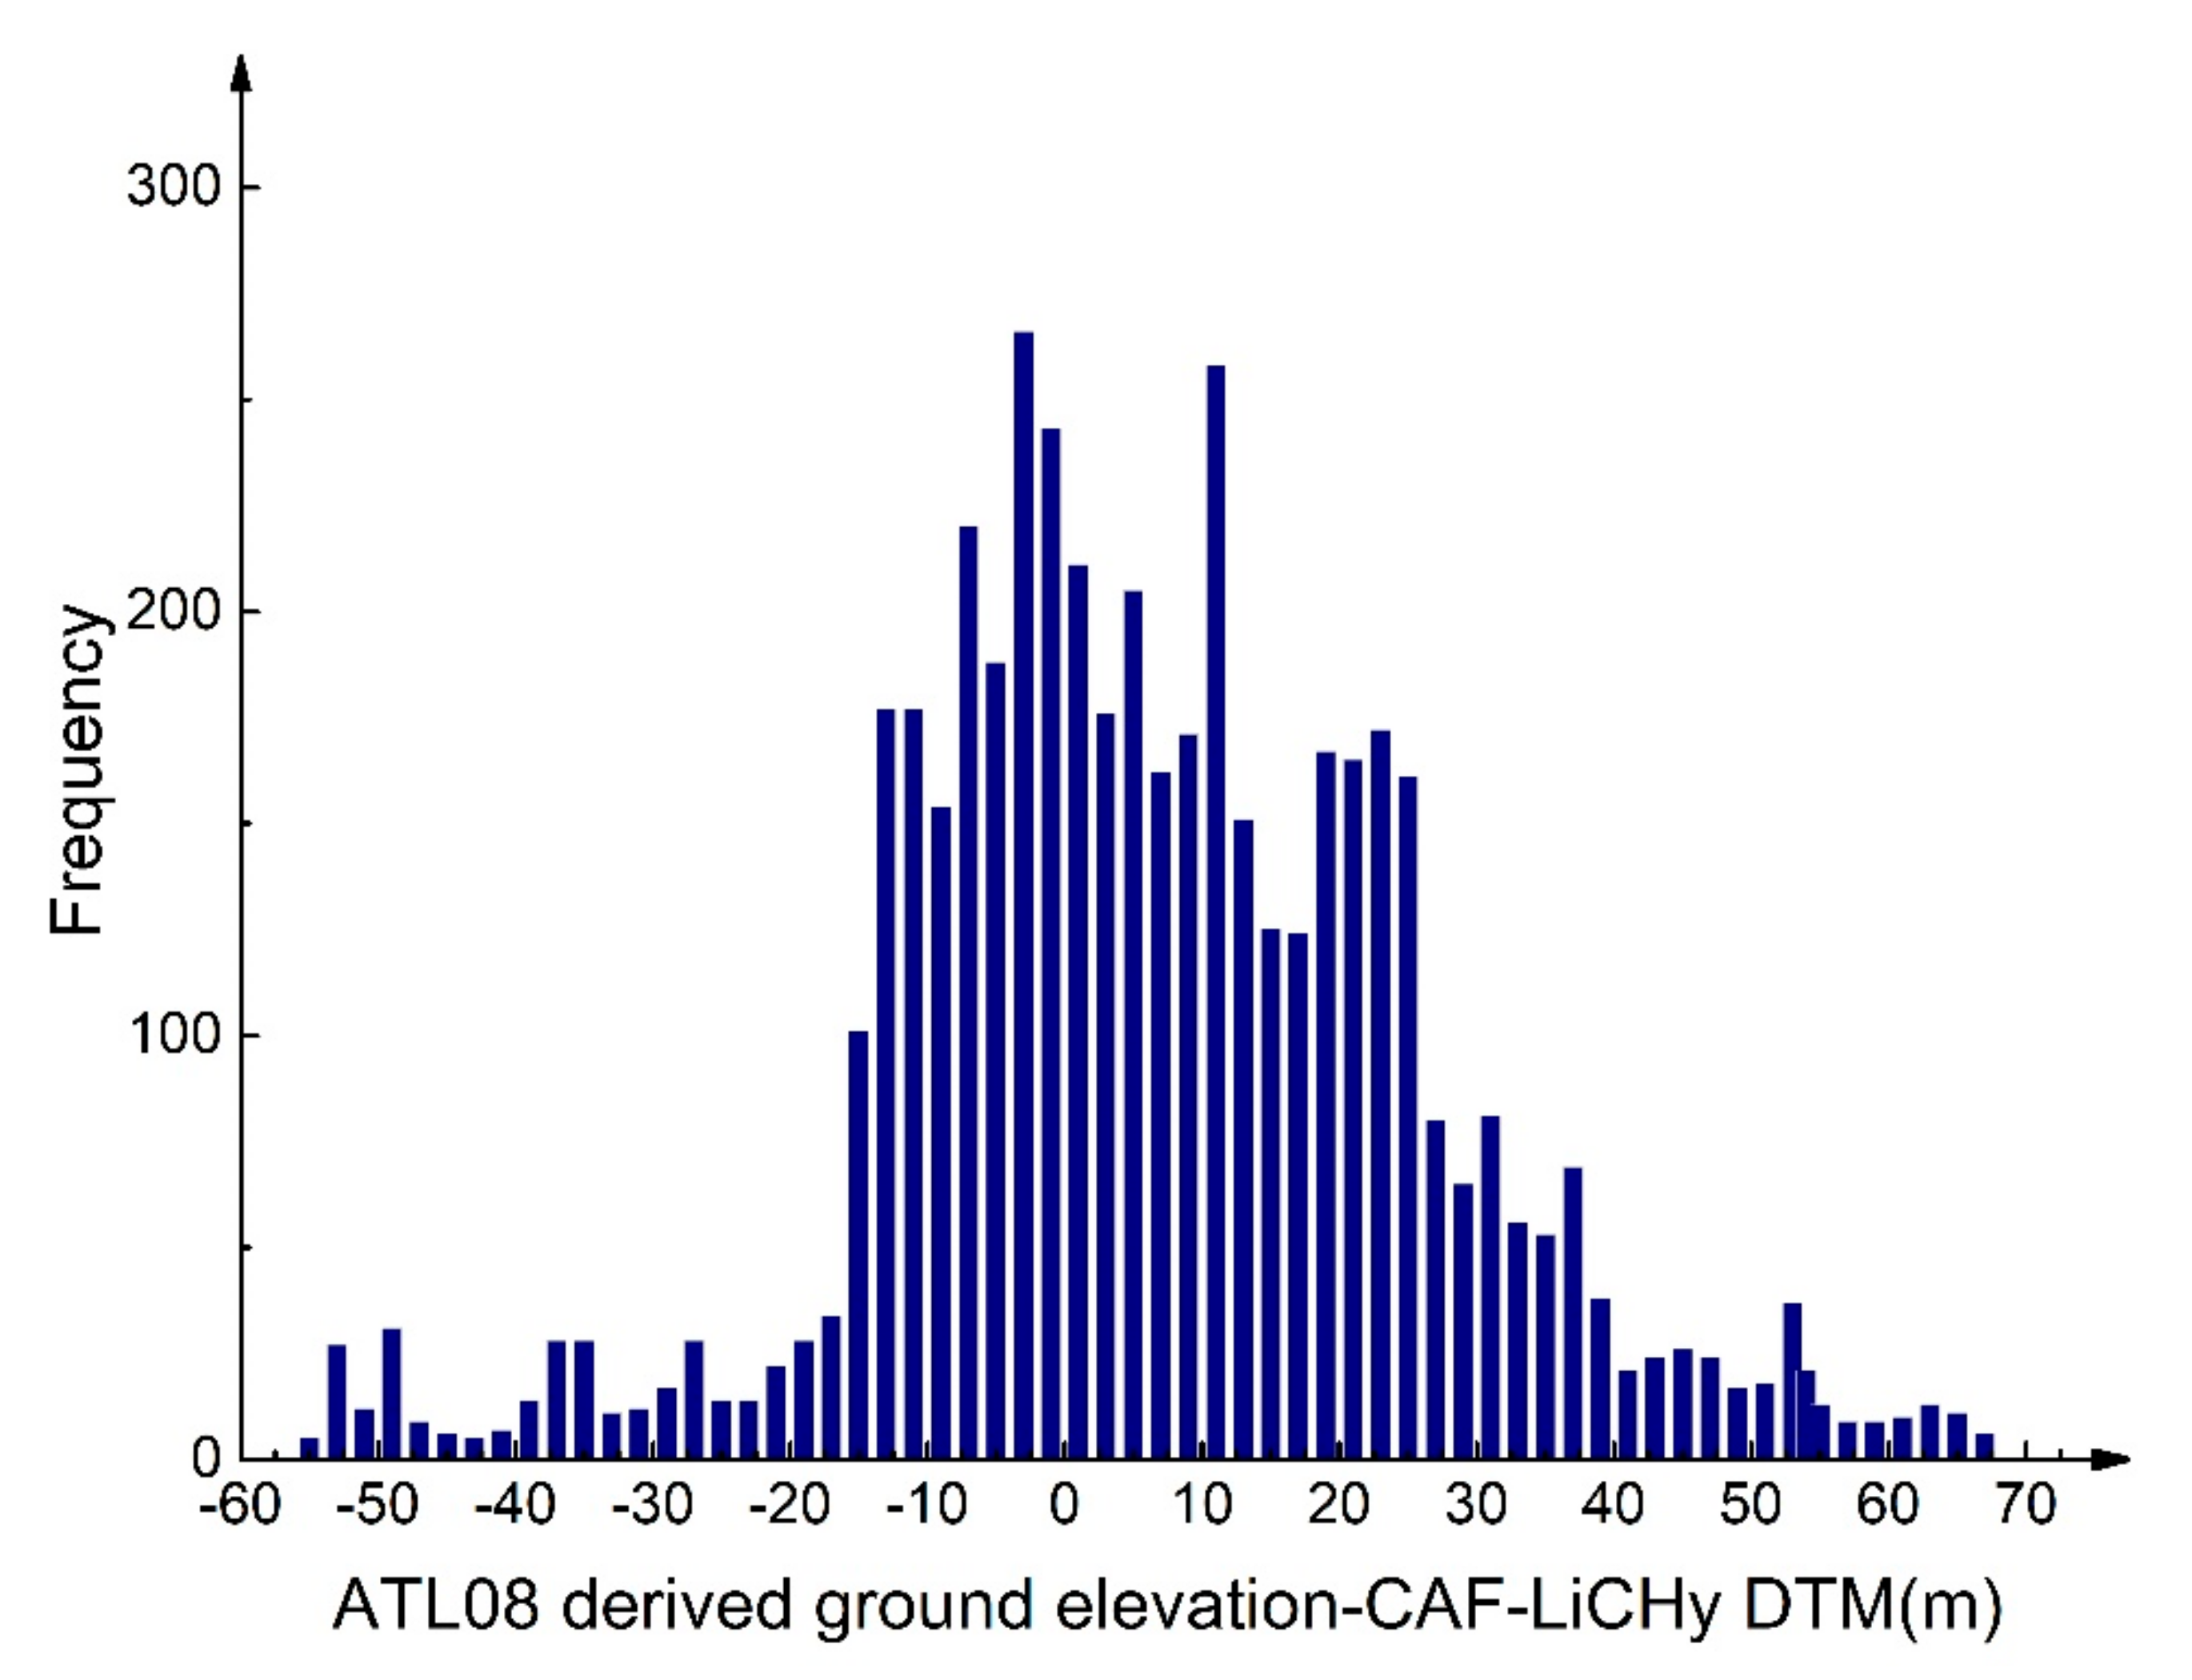
In order to further evaluate the performance of the ATL08 data product in extracting the surface, the DTM derived from the airborne lidar (CAF-LiCHy) was used to verify the accuracy of the ground elevation. Table 1 summarizes the quantitative statistics of the ground elevation error. Figure 9 presents the frequency histogram of the ground elevation error of the ATL08 data product. It can be observed from Table 1, and Figure 8 and Figure 9 that a certain consistency exists between the ground elevation estimated by the ATL08 product and the airborne lidar-derived DTM. The R2 was higher between ATL08-DTM and CAF-LiCHy-DTM. However, the bias, MAE, and RMSE were, respectively, 13.06 m, 17.59 m, and 20.97 m, all showing large errors. The combination of Figure 8 and Figure 9 shows that the ATL08 products cannot accurately describe valleys and peaks, to a certain extent.
In addition, the slope was divided into six grades (cf. Table 2). It can also be seen that the error increases with the increase of the terrain slope. The large topography changes may also be important factors affecting the understory terrain inversion.
3.2. ATL03 Data Correction and Ground Photon Extraction
3.2.1. ATL03 Data Correction
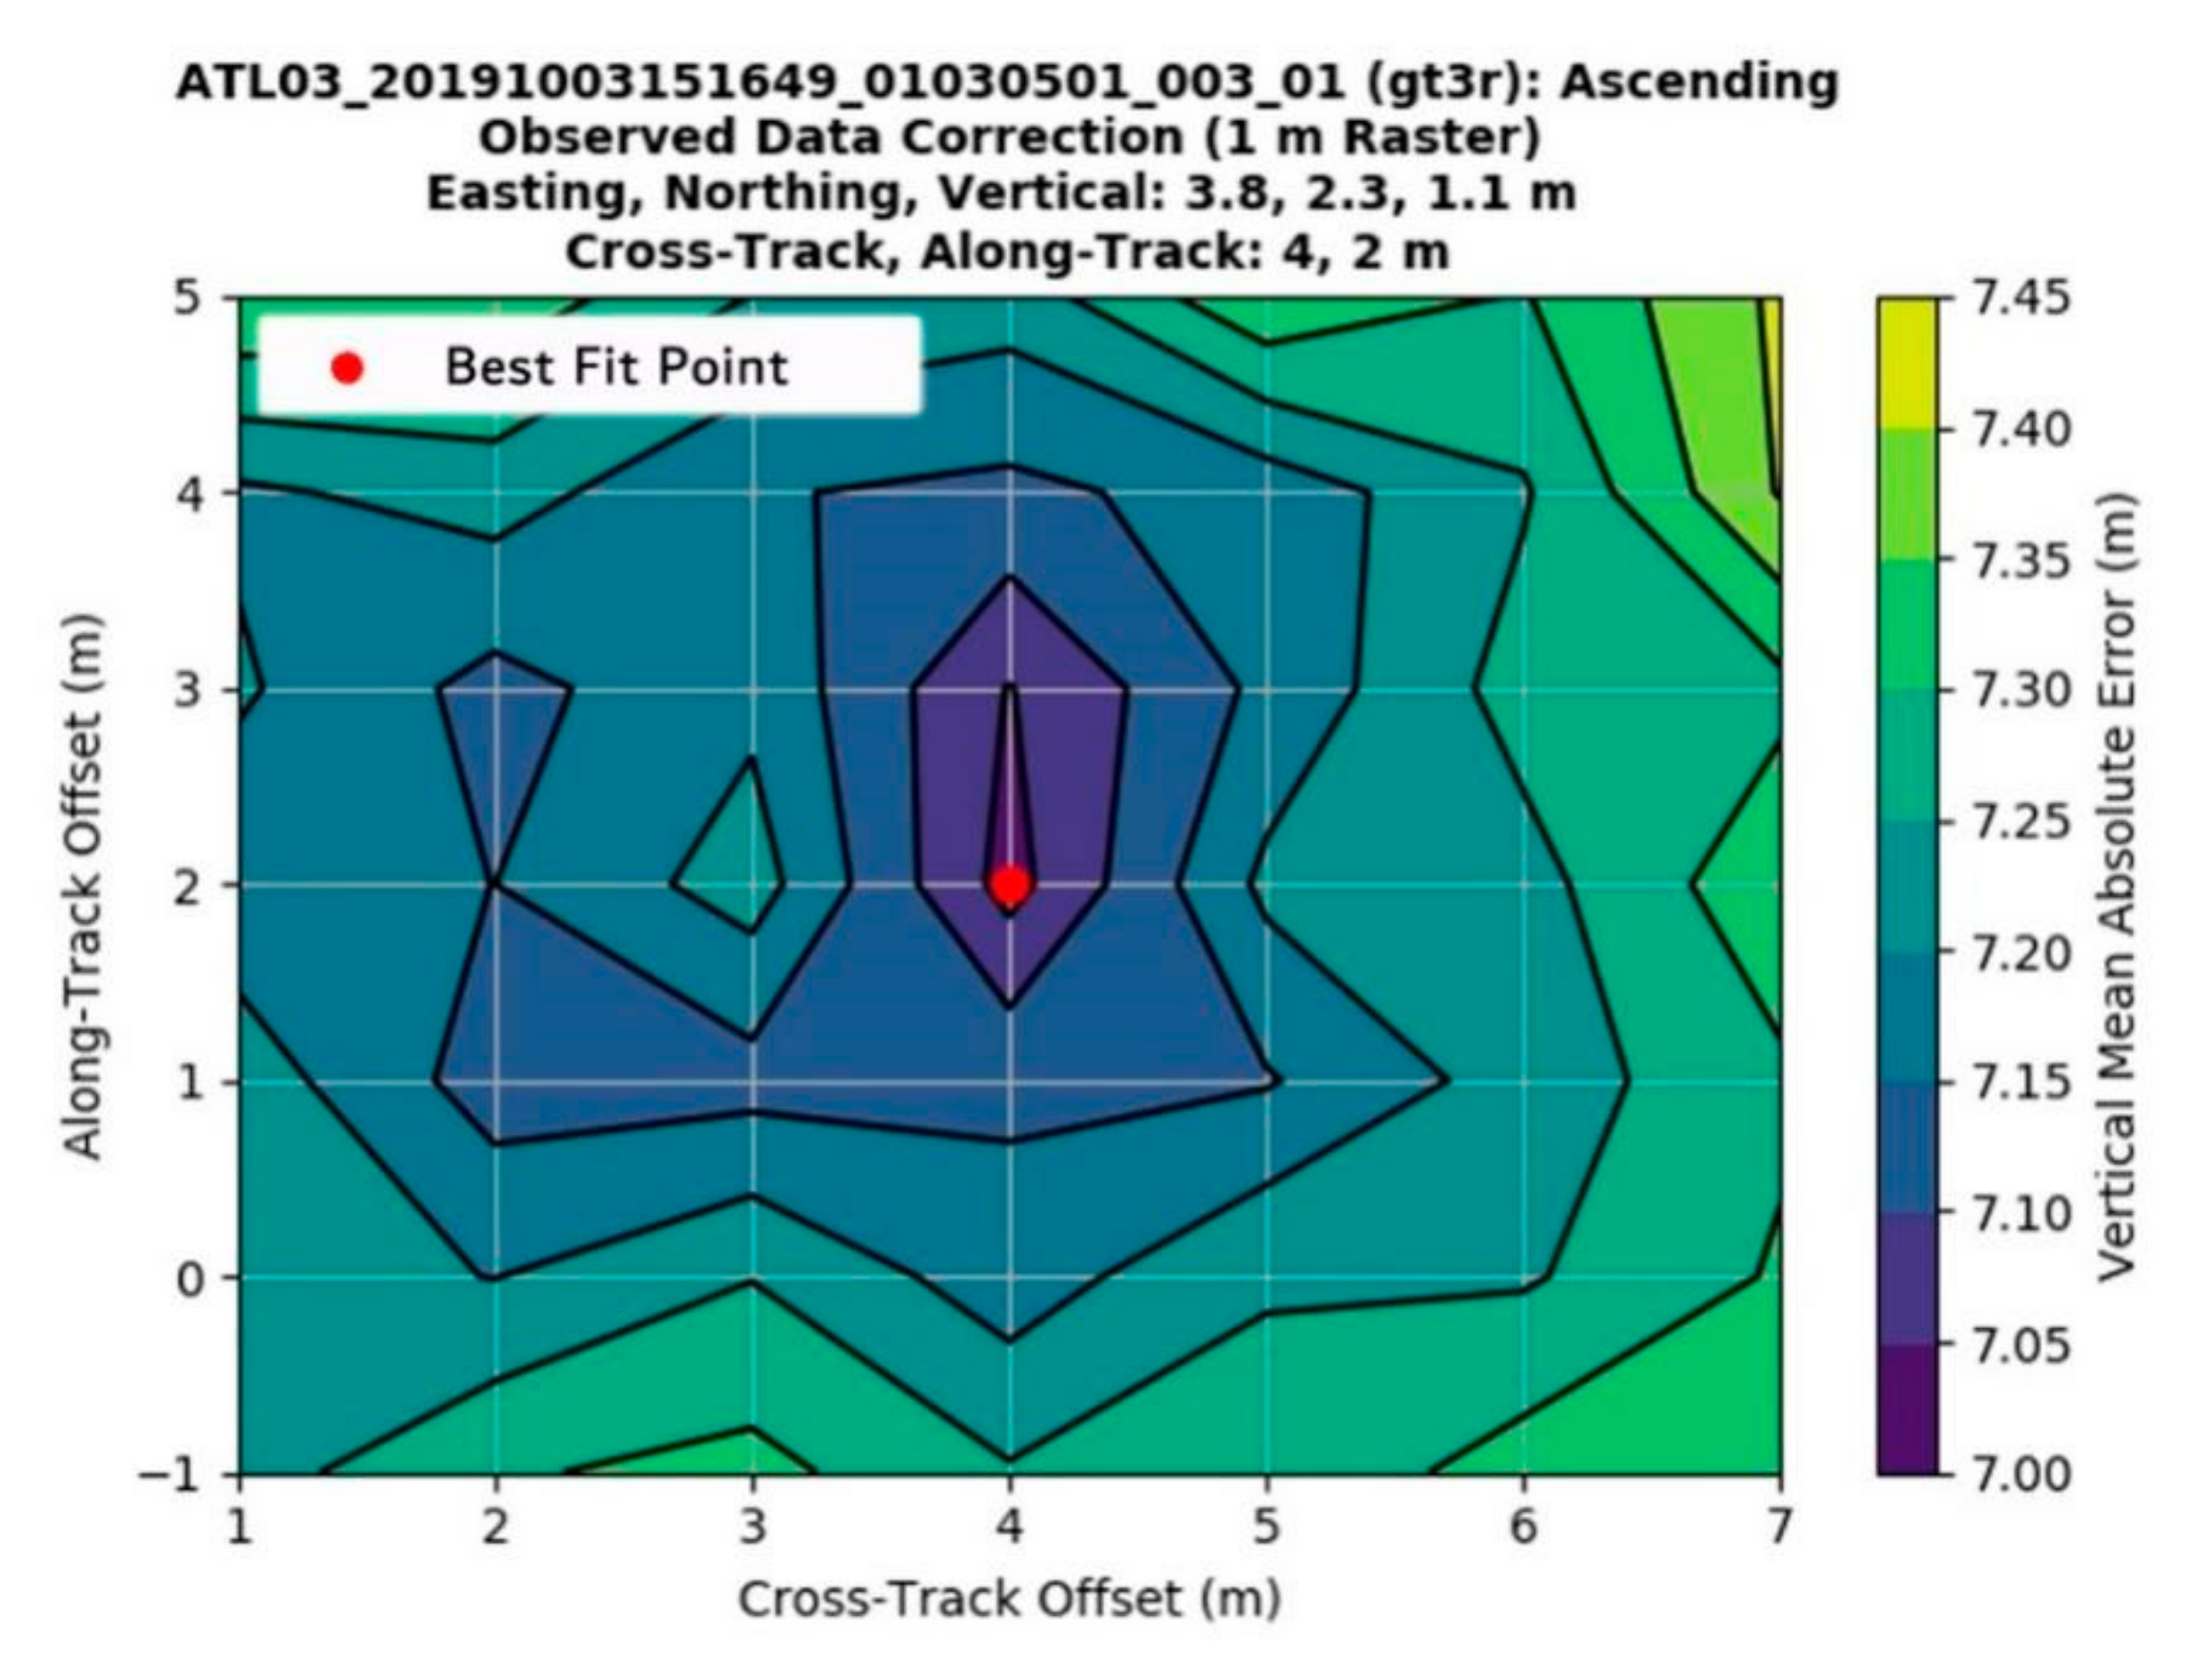
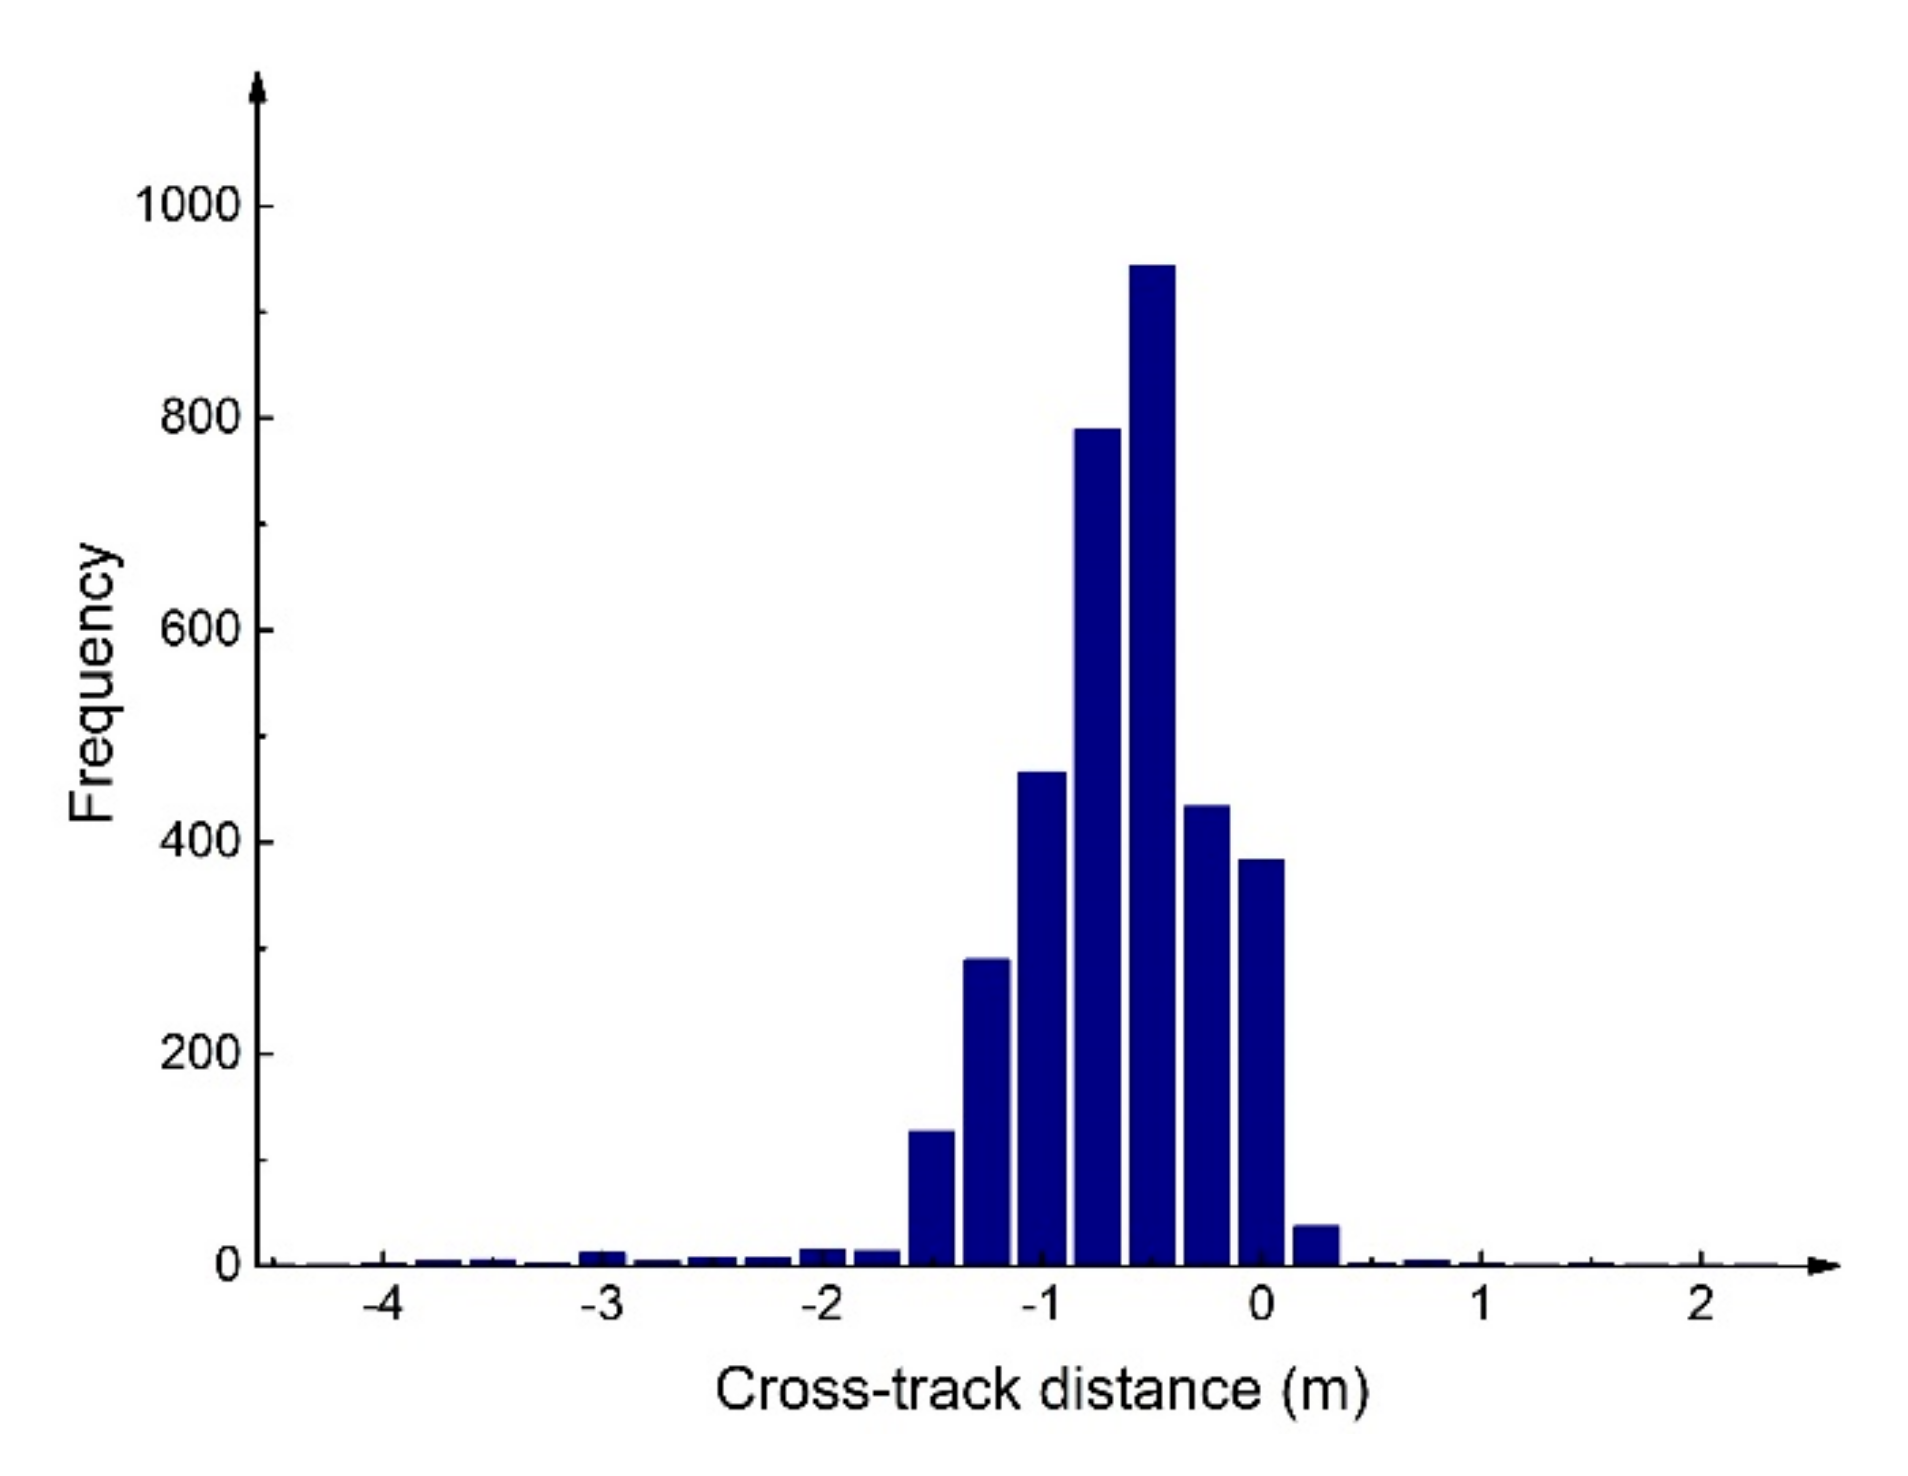
The geolocation accuracy of the ICESat-2 data was verified by comparing it with the high-resolution airborne lidar dataset. The accuracy level of these datasets was within the performance accuracy range of the space-based system (6.5 m). The geolocation accuracy is presented in Figure 10. In this area, the error of ICESat-2 in the cross-track direction was 4 m, and the error in the along-track direction was 2 m. The red dot represents the best-fit point. Figure 11 presents the frequency distribution diagram of the cross-track distance of the ATL03 data in the study area. The photons with the highest frequency were divided between −0.25 m and −0.50 m, accounting for 26.5% of the total. The photons with farther cross-track distances had a greater the distribution number. Taking into account the limited spatial resolution of the reference elevation data, the photons with a cross-track distance greater than or equal to ±0.5 m were corrected, and the photons with a cross-track distance less than ±0.5 m were not corrected. The corrected photons accounted for 44% of the total. The correction values were distributed in −2 m~4 m.
3.2.2. Comparison of Ground Extraction Accuracy before and after Photon Correction
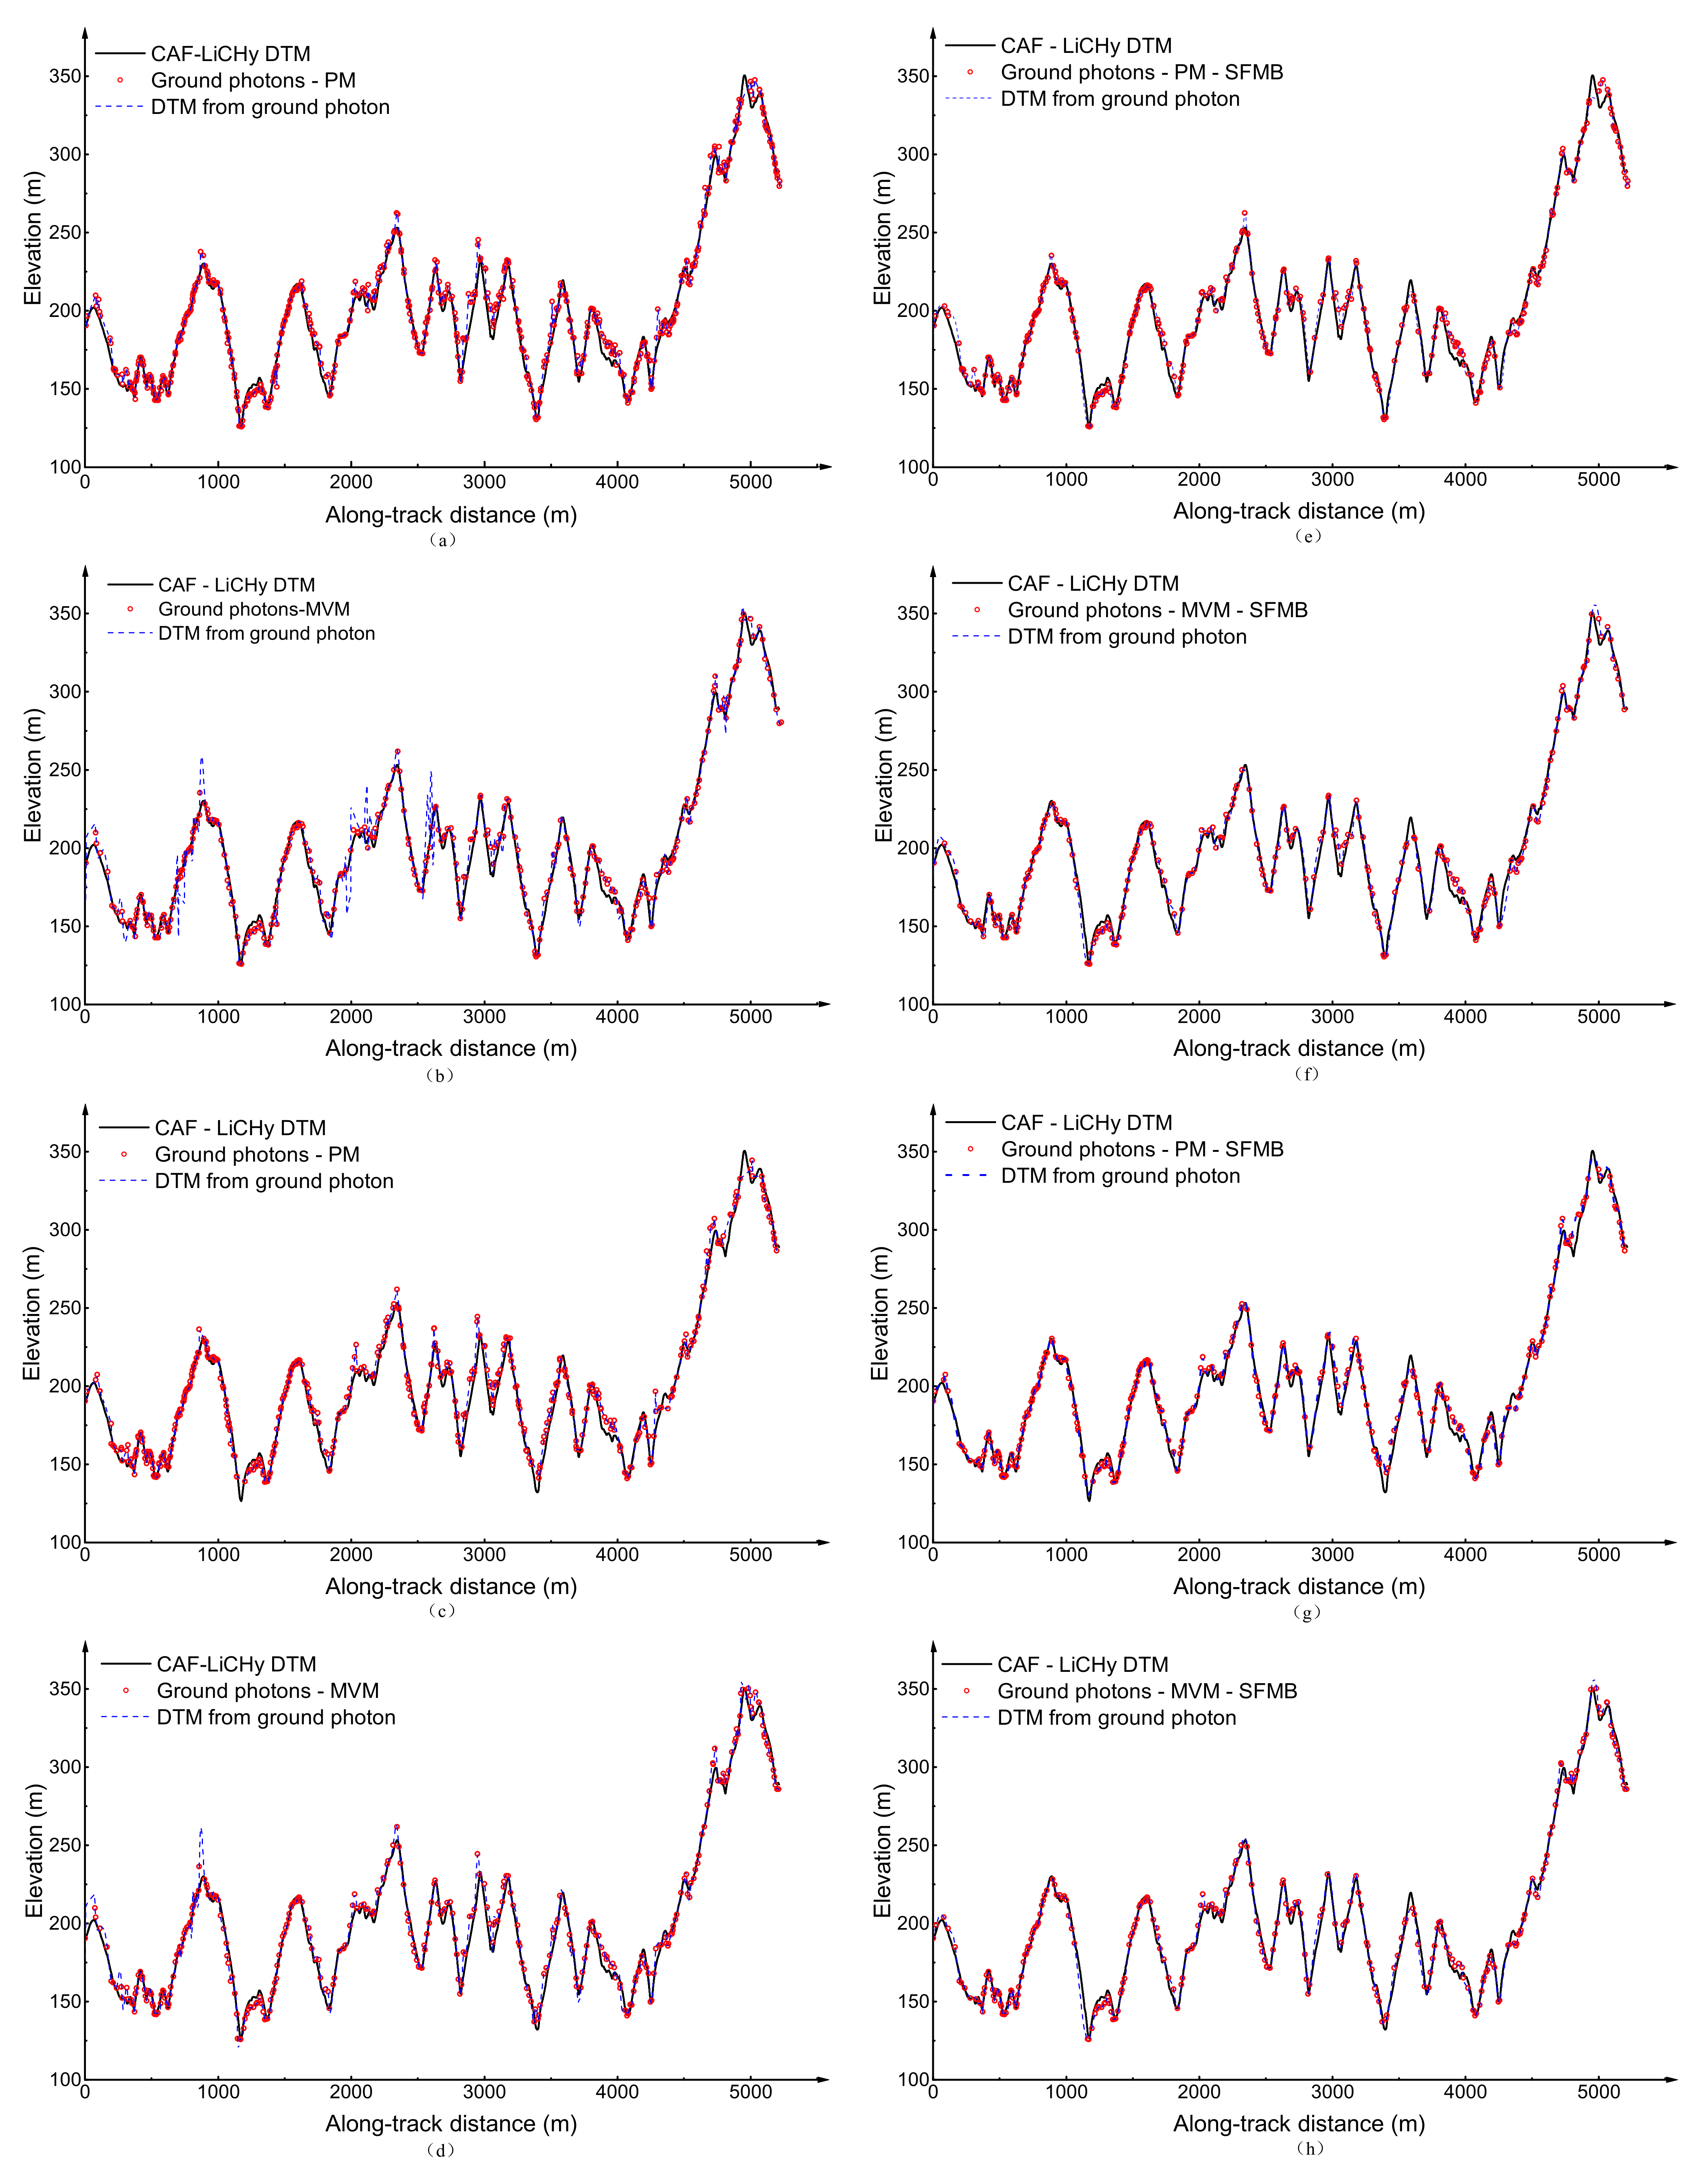
Figure 12a–d present the results of extracting ground photons from ATL03 initial photons and corrected photons, using the MVM and PM. Table 1 summarizes the error statistics of DTM based on the initial data and the corrected data, using the MVM and PM, respectively. For the ground photon extraction method, the ground photon MAE and RMSE extracted based on the ATL03 raw data (regardless of the PM or MVM) were reduced by more than 10 m compared with the ground photon provided in the ATL08 data product. The error was smaller and its distribution range was more concentrated, which demonstrates that the ground photons extraction method is efficient. In addition, it can be seen from Table 1 that PM is slightly better than MVM in terms of ground photon extraction. However, there was no significant difference between the results obtained by the two methods, which indicates that both methods can be used for ground photon extraction.
It can be deduced from the comparison between the initial ATL03 data and the corrected data (cf. Table 1) that the R2 of the ground extracted by the PM based on the corrected data is 1.21% higher than the ground extracted from the initial data. In addition, the bias, MAE, and RMSE were reduced by 34.18%, 40.78%, and 32.47%, respectively. Compared with the ground extracted from the initial data, the R2 of the ground extracted by the MVM based on the correction data increased by 1.82%, while the bias, MAE, and RMSE were reduced by 45.02%, 38.64%, and 32.15%, respectively. It can be concluded that ground photon selection after photon correction can significantly reduce the error of ground photon selection, and the method of photon correction is feasible.
3.3. Ground Photon Slope Filtering
It can be observed from Figure 12a–d that the ground photons extracted from the initial data and corrected data were overestimated at the mountain peaks. The ALOS PALSAR DEM was used as reference data to perform slope filtering on the extracted ground photons. The SFMB slope filtering results are presented in Figure 12e–h. Table 3 summarizes the quantitative statistics of the ground elevation errors after the SFMA and SFMB slope filtering on the basis of the ground obtained by the PM and MVM methods for the photon data before and after correction. After using the SFMA method to filter the ground photons extracted based on the initial data, the MAE and RMSE were reduced by an average of 0.93 m and 1.19 m, respectively. After treatment using the SFMB method, the MAE and RSME decreased by 0.14 m and 0.21 m, respectively, on the basis of the SFMA method. This shows that the proposed slope filtering method is efficient for improving the accuracy of ground photon extraction. After using the SFMA method to filter the ground photons extracted based on correction data, the MAE and RMSE were reduced by 0.80 m and 1.20 m on average. After treatment using the SFMB method, the MAE and RMSE were reduced by 0.11 m and 0.22 m on average. This indicates that SFMB outperforms SFMA.
4. Discussion
4.1. Error Analysis of DTM Inversion
The ground surface detection is a key step for photon-counting lidar to accurately extract the surface information in several application domains. At present, the main steps of the surface detection algorithms are pretreatment, ground photon detection, and subsequent processing [12,20,40]. In this study, the photon correction method was added to the preprocessing step, and the slope filter method was added to the ground photon detection to improve the accuracy of the ground photon recognition. The advantages and disadvantages of the PM and MVM for surface detection are discussed.
The results of the initial comparison of the photon positioning accuracy highly exceed the mission requirements. However, a further correction analysis helps to eliminate several errors and deviations. It can be deduced from Table 2 and from previous studies that the greater the slope along the track, the greater the error caused by the understory DTM. Similarly, when the study area is located in a mountainous area or an area with large undulations, the cross-track photons should be affected by the slope, while the cross-track photons are higher or lower than the theoretical elevation of the track position. When converting the photon data into a profile photon point cloud, ignoring the impact of the photon cross-track under the influence of the slope will inevitably affect the DTM extraction accuracy to a certain extent. Gwenzi [39] and Wang [25] demonstrated that using more accurate latitude and longitude geolocation of photons can lead to better verification results. Therefore, this paper proposes a method of photon correction based on reference elevation data to obtain a more accurate ground elevation. After the photon correction based on the reference elevation data, the extracted understory DTM and the RMSE were respectively reduced by 1.86~2.52 m and 2.12~2.50 m, compared with the uncorrected MAE. It can be seen that using the ALOS PALSAR DEM data as the reference elevation data for photon correction eliminated the influence of cross-track photons and helped to improve the accuracy of understory DTM inversion. In addition, the higher the spatial resolution of the used reference elevation data, the more accurate the correction result. However, the photon correction method based on the reference elevation data changes the photon density and distribution range within the area, which inevitably leads to the change of the photon denoising method.
The ground elevation errors have a high impact on the inversion of the terrain slope and canopy height. In order to ensure the accuracy of the terrain slope and canopy height inversion in extremely complex environments, it is necessary to improve the surface extraction method [26]. In this paper, after the ground photons were extracted by PM and MVM, a gradient filtering step was added. The latter aims at eliminating the canopy photons that are mistakenly classified as ground photons. In this algorithm, the criterion for judging whether a photon is a ground point consists of the distance and elevation difference between the point and its neighboring points. If the two points are close and the elevation difference is large, then the point with the greater elevation value has a low possibility of being the ground point. These points are filtered out and the ground points are retained. Therefore, the selection of the judgment criterion threshold value is particularly important. Vosselman [41] demonstrates that the appropriate threshold should be selected based on prior knowledge, which requires a certain understanding of the survey area topography. The ALOS PALSAR DEM is used as the reference elevation data, while the maximum slope and maximum difference between the continuous slope changes in the reference data are set as the threshold. The threshold can be more accurately selected, which allows the application of this method in unfamiliar areas. It can be deduced from the results of ground photon slope filtering that both SFMA and SFMB methods can efficiently improve the accuracy of ground photon extraction. It can also be seen from the comparison of the DTM obtained by the cubic spline interpolation method before and after slope filtering that, regardless of whether the photon correction is performed, the DTM fitted after the SFMB method reduces the influence of outliers to different extents. This shows that slope filtering after identifying possible ground photons can improve the accuracy of understory DTM inversion. The denoising method cannot accurately identify the noise photons near the ground and canopy in the ICESat-2 data. However, the slope filtering can more accurately select the ground information photons. SFMA and SFMB can identify some canopy photons or noise photons that are misclassified as ground photons. Although the effect of SFMB is better, the accuracy improvement of the two methods on the initial data and correction data is within the same order of magnitude. Therefore, both filtering methods can be used for slope filtering. However, this type of slope-based filtering method is sensitive to slope changes. In areas with steep slopes, it is easy to flatten the convex parts of the terrain. That is, the DTM at the top of the mountain is underestimated compared with the DTM inverted by CAF-LiCHy.
Both PM and MVM are highly affected by the results of the noise removal algorithm. The MVM directly considers the photon at the lowest elevation of the window as the ground photon. This will affect the actual ground photon extraction due to the presence of near-ground noise photons [20,21,22,42]. The PM is used to extract the ground surface. However, the results obtained under dense vegetation conditions are not satisfactory [23,39]. The dense undergrowth vegetation in the study area is such that, when [0, 0.15] is used as the interval for selecting ground photons for the PM, the ground photons should include a certain degree of near-ground vegetation photons, which results in an overestimation of the ground, and therefore makes the PM inferior to the MVM. However, after adding the slope filtering step to the ground photon extraction method, the accuracy of the understory DTM extracted by the PM is better than that of the MVM (cf. Table 3). This is due to the fact that the slope filtering removes the near-ground vegetation photons in the result of the PM, while the MVM extracts the lowest point within the step range. The slope filtering may remove the ground information photons.
4.2. Contrast with Existing Methods
The process of verifying the terrain height estimates obtained by ICESat-2 should be compared with a large amount of real data [24]. The ATL08 products generated based on ATL03 data have large errors. However, the ground points extracted based on ATL03 can accurately depict the understory terrain. This is due to the fact that the ATL08 product uses DRAGANN to set the ratio of the distance along the track to the elevation when denoising the ATL03 data, which solves the problem of uneven photon density along the track and elevation to a certain extent [32,40], at the expense of losing many signal photons [43]. Therefore, the ATL08 algorithm may lead to unexpected results in different scenarios. The ATL08 products cannot be directly used in this field and can only be used after further processing. In addition, other studies use custom algorithms to directly obtain the terrain height from the ATL03 data [25,44]. The slope is divided into six grades (cf. Table 2). It can be deduced that the error increases with the increase of the terrain slope, which is coherent with the results obtained by Wang et al. [25] and Zhu et al. [26]. The sampling ability of ICESat-2 is lower than that of the airborne lidar scans. At a lower sampling rate, the undulating valleys and peaks on the surface may not be described, which results in overestimated valleys and underestimated peaks [45]. The topography of the study area greatly varies. It will become one of the most important factors affecting the inversion of understory topography at a lower sampling rate. Moreover, the study area in this paper is similar to that of Lin et al. [46], and the obtained results are comparable. The RMSE reported by the latter is almost 5.7–6.8 m. The RMSE obtained by the two methods, after photon correction and slope filtering, are both less than 4 m. Finally, compared with the existing photon point cloud classification methods, adding photon correction in the preprocessing step and slope filtering in the ground photon detection can improve the ground extraction accuracy.
5. Conclusions
This paper tackles the accuracy of the ICESat-2/ATLAS data inverting the understory digital ground model. It considers the forest area of Guangxi Zhuang Autonomous Region of China as the study area, and uses the CAF-LiCHy data as verification data to analyze the accuracy of the ICESat-2/ATLAS data in identifying understory DTM in areas with complex terrain and high forest coverage. A correction method is proposed to eliminate the photon cross-track and the ground photon slope filtering. The impact of the photon cross-track correction and the ground photon filtering on the inversion accuracy is assessed. This study leads to the following conclusions: (1) the results demonstrate that the digital ground model provided by the ATL08 data product for this area cannot be directly used; (2) based on the DEM data covering the whole world, a method for cross-track photon correction before ATL03 data processing is proposed. This method can efficiently reduce the error of ground photon extraction. More precisely, the MAE and RMSE are respectively reduced by 1.86~2.52 m and 2.12~2.50 m, and the universal verification can be performed in different regions; (3) after using the PM or the MVM to extract the ground photons, adding a slope filter can reduce the extraction error of the digital ground model under the forest. The result of SFMB slope filtering is better than that of SFMA.
In general, this study has explored the understory ground elevation inversion by ICESat-2/ATLAS and analyzed the influence of the slope on the ground elevation error, which provides a basis for the ATL03 data to retrieve understory surface parameters. Due to the fact that the precise extraction of the surface parameters is affected by several factors such as the laser characteristics, topography, and coverage, it is necessary to further explore the internal relationship between the surface parameters, photon characteristics, vegetation coverage, and topographic factors, eliminating the influence of these factors on the surface inversion accuracy.
Author Contributions
Conceptualization and methodology, B.L.; data curation, Y.Y.; data curation and data processing, B.L. and Z.D.; original draft preparation, B.L.; paper review and editing, G.F.; project administration and funding acquisition, T.Z. All authors have read and agreed to the published version of the manuscript.
Funding
This research was funded by the Key National Research and Development Program of China (Grant number 2017YFD0600906).
Institutional Review Board Statement
Not applicable.
Informed Consent Statement
Not applicable.
Data Availability Statement
Not applicable.
Acknowledgments
The authors would like to thank the NASA NSIDC for distributing the ICESat-2 data (https://search.earthdata.nasa.gov, accessed on 5 March 2021), the Alaska Satellite Facility for distributing the ALOS PALSAR DEM (https://asf.alaska.edu, accessed on 20 March 2021), and the anonymous reviewers and members of the editorial team for their constructive comments.
Conflicts of Interest
The authors declare no conflict of interest.
References
- Tian, X.; Shan, J. Comprehensive Evaluation of the ICESat-2 ATL08 Terrain Product. IEEE Trans. Geosci. Remote 2021, 59, 8195–8209. [Google Scholar] [CrossRef]
- Markus, T.; Neumann, T.; Martino, A.; Abdalati, W.; Brunt, K.; Csatho, B.; Farrell, S.; Fricker, H.; Gardner, A.; Harding, D.; et al. The ice, cloud, and land elevation satellite-2 (ICESat-2): Science requirements, concept, and implementation. Remote Sens. Environ. 2017, 190, 260–273. [Google Scholar] [CrossRef]
- Yang, G.; Martino, A.J.; Lu, W.; Cavanaugh, J.; Bock, M.; Krainak, M.A. ICESat-2 ATLAS photon-counting receiver: Initial on-orbit performance. Proc. SPIE Def. Commer. Sens. 2019, 10978, 109780B. [Google Scholar]
- Neumann, T.A.; Martino, A.J.; Markus, T.; Bae, S.; Bock, M.R.; Brenner, A.C.; Brunt, K.M.; Cavanaugh, J.; Fernandes, S.T.; Hancock, D.W.; et al. The Ice, Cloud, and Land Elevation Satellite-2 mission: A global geolocated photon product derived from the Advanced Topographic Laser Altimeter System. Remote Sens. Environ. 2019, 233, 111325. [Google Scholar] [CrossRef]
- Mcgarry, J.F.; Carabajal, C.C.; Saba, J.L.; Reese, A.R.; Liiva, P.M. ICESat-2/ATLAS Onboard Flight Science Receiver Algorithms: Purpose, Process, and Performance. Earth Space Sci. 2020, 8, e2020EA001235. [Google Scholar] [CrossRef]
- Michaelides, R.J.; Bryant, M.B.; Siegfried, M.R.; Borsa, A.A. Quantifying Surface-Height Change Over a Periglacial Environment with ICESat-2 Laser Altimetry. Earth Space Sci. 2021, 8, e2021EA001538. [Google Scholar] [CrossRef]
- Mertikas, S.P.; Donlon, C.; Matsakis, D.; Mavrocordatos, C.; Altamimi, Z.; Kokolakis, C.; Tripolitsiotis, A. Fiducial reference systems for time and coordinates in satellite altimetry. Adv. Space Res. 2021, 68, 1140–1160. [Google Scholar] [CrossRef]
- Andersen, N.H.; Simonsen, S.B.; Winstrup, M.; Nilsson, J.; Srensen, L.S. Regional assessments of surface ice elevations from swath-processed cryosat-2 sarin data. Remote Sens. 2021, 13, 2213. [Google Scholar] [CrossRef]
- Tiggelen, M.V.; Smeets, P.C.J.P.; Reijmer, C.H.; Wouters, B.; Broeke, M.R.V.D. Mapping the aerodynamic roughness of the Greenland ice sheet surface using ICESat-2: Evaluation over the K-transect. Cryosphere 2021, 15, 2601–2621. [Google Scholar] [CrossRef]
- Sochor, L.; Seehaus, T.; Braun, M.H. Increased Ice Thinning over Svalbard Measured by ICESat/ICESat-2 Laser Altimetry. Remote Sens. 2021, 13, 2089. [Google Scholar] [CrossRef]
- Liu, A.B.; Cheng, X.; Chen, Z.Q. Performance evaluation of GEDI and ICESat-2 laser altimeter data for terrain and canopy height retrievals. Remote Sens. Environ. 2021, 264, 112571. [Google Scholar] [CrossRef]
- Zhu, X.; Nie, S.; Wang, C.; Xi, X.H.; Hu, Z.Y. A Ground Elevation and Vegetation Height Retrieval Algorithm Using Micro-Pulse Photon-Counting Lidar Data. Remote Sens. 2018, 10, 1962. [Google Scholar] [CrossRef] [Green Version]
- Brunt, K.M.; Neumann, T.A.; Smith, B.E. Assessment of ICESat Ice Sheet Surface Heights, Based on Comparisons Over the Interior of the Antarctic Ice Sheet. Geophys. Res. Lett. 2019, 46, 13072–13078. [Google Scholar] [CrossRef] [Green Version]
- Neuenschwander, A.N.; Magruder, L.M. The Potential Impact of Vertical Sampling Uncertainty on ICESat-2/ATLAS Terrain and Canopy Height Retrievals for Multiple Ecosystems. Remote Sens. 2016, 8, 1039. [Google Scholar] [CrossRef] [Green Version]
- Kelly, M.; Su, Y.; Di, T.S.; Fry, D.; Collins, B.; Stephens, S.; Guo, Q. Impact of Error in Lidar-Derived Canopy Height and Canopy Base Height on Modeled Wildfire Behavior in the Sierra Nevada, California, USA. Remote Sens. 2017, 10, 10. [Google Scholar] [CrossRef] [Green Version]
- Fu, H.; Zhu, J.; Wang, C.; Wang, H.; Zhao, R. Underlying topography estimation over forest areas using high-resolution p-band single-baseline polinsar data. Remote Sens. 2017, 9, 363. [Google Scholar] [CrossRef] [Green Version]
- Sithole, G.; Vosselman, G. Experimental comparison of filter algorithms for bare-Earth extraction from airborne laser scanning point clouds. ISPRS J. Photogramm. 2004, 59, 85–101. [Google Scholar] [CrossRef]
- Queinnec, M.; White, J.C.; Coops, N.C. Comparing airborne and spaceborne photon-counting lidar canopy structural estimates across different boreal forest types. Remote Sens. Environ. 2021, 262, 112510. [Google Scholar] [CrossRef]
- Nie, S.; Wang, C.; Dong, P.; Xi, X.; Luo, S.; Qin, H. A revised progressive TIN densification for filtering airborne LiDAR data. Measurement 2017, 104, 70–77. [Google Scholar] [CrossRef]
- Klotz, B.W.; Neuenschwander, A.; Magruder, L.A. High-resolution ocean wave and wind characteristics determined by the ICESat-2 land surface algorithm. Geophys. Res. Lett. 2020, 47, e2019GL085907. [Google Scholar] [CrossRef]
- Moussavi, M.S.; Abdalati, W.; Scambos, T.; Neuenschwander, A. Applicability of an automatic surface detection approach to micro-pulse photon-counting lidar altimetry data: Implications for canopy height retrieval from future ICESat-2 data. Int. J. Remote Sens. 2014, 35, 5263–5279. [Google Scholar] [CrossRef]
- Chen, B.; Pang, Y.; Li, Z.; Lu, H.; Liu, L.X.; North, P.R.J.; Rosette, J.A.B. Ground and top of canopy extraction from photon-counting LiDAR data using local outlier factor with ellipse searching area. IEEE Geosci. Remote Lett. 2019, 16, 1447–1451. [Google Scholar] [CrossRef] [Green Version]
- Popescu, S.C.; Zhou, T.; Nelson, R.; Neuenschwander, A.; Sheridan, R.; Narine, L.; Walsh, K.M. Photon counting LiDAR: An adaptive ground and canopy height retrieval algorithm for ICESat-2 data. Remote Sens. Environ. 2018, 208, 154–170. [Google Scholar] [CrossRef]
- Neuenschwander, A.L.; Magruder, L.A. Canopy and Terrain Height Retrievals with ICESat-2: A First Look. Remote Sens. 2019, 11, 1721. [Google Scholar] [CrossRef] [Green Version]
- Wang, C.; Zhu, X.; Nie, S.; Xi, X.H.; Li, D.; Zheng, W.W.; Chen, S.C. Ground elevation accuracy verification of ICESat-2 data: A case study in Alaska, USA. Opt. Express 2019, 27, 38168. [Google Scholar] [CrossRef]
- Zhu, X.; Nie, S.; Wang, C.; Xi, X.B.; Li, D.; Li, G.Y.; Wang, P.; Cao, D.; Yang, X.B. Estimating Terrain Slope from ICESat-2 Data in Forest Environments. Remote Sens. 2020, 12, 3300. [Google Scholar] [CrossRef]
- Ni, X.; Xu, M.; Cao, C.; Chen, W.; Yang, B.; Xie, B. Forest height estimation and change monitoring based on artificial neural network using Geoscience Laser Altimeter System and Landsat data. J. Appl. Remote Sens. 2019, 14, 022207. [Google Scholar] [CrossRef]
- Martino, A.; Bock, M.R.; Jones, R.L., III; Neumann, T.A.; Hancock, D.W., III; Dabney, P.W.; Webb, C.E. The Ice, Cloud and Land Elevation Satellite-2 Project: Algorithm Theoretical Basis Document (ATBD)for ATL02 (Level 1B) Data Product, NASA Tech. Document, ICESat-2-SIPS-SPEC-0150. Available online: https://ICESat-2.gsfc.nasa.gov/sites/default/files/page_files/ICESat2_ATL02_ATBD_r003.pdf (accessed on 1 November 2020).
- Ranndal, H.; Christiansen, P.S.; Kliving, P.; Andersen, O.B.; Nielsen, K. Evaluation of a Statistical Approach for Extracting Shallow Water Bathymetry Signals from ICESat-2 ATL03 Photon Data. Remote Sens. 2021, 13, 3548. [Google Scholar] [CrossRef]
- Magruder, L.A.; Brunt, K.M. Performance Analysis of Airborne Photon-Counting Lidar Data in Preparation for the ICESat-2 Mission. IEEE Trans. Geosci. Remote 2018, 56, 2911–2918. [Google Scholar] [CrossRef]
- Thomas, N.; Pertiwi, A.P.; Traganos, D.; Lagomasino, D.; Poursanidis, D.; Moreno, S.; Fatoyinbo, L. Space-Borne Cloud-Native Satellite-Derived Bathymetry (SDB) Models Using ICESat-2 And Sentinel-2. Geophys. Res. Lett. 2020, 48, e2020GL092170. [Google Scholar] [CrossRef]
- Neuenschwander, A.; Pitts, K. The ATL08 land and vegetation product for the ICESat-2 Mission. Remote Sens. Environ. 2019, 221, 247–259. [Google Scholar] [CrossRef]
- Tadono, T.; Ishida, H.; Oda, F.; Naito, S.; Minakawa, K.; Iwamoto, H. Precise global DEM generation by ALOS PRISM. ISPRS Ann. Photogramm. Remote Sens. Spat. Inf. Sci. 2014, 2, 71–76. [Google Scholar] [CrossRef] [Green Version]
- Shebl, A.; Csámer, A. Reappraisal of DEMs, radar and optical datasets in lineaments extraction with emphasis on the spatial context—Sciencedirect. Remote Sens. Appl. Soc. Environ. 2021, 24, 100617. [Google Scholar]
- Ma, L.X.; Zheng, G.; Eitel, J.U.H.; Magney, T.S.; Moskal, L.M. Retrieving forest canopy extinction coefficient from terrestrial and airborne LiDAR. Agric. For. Meteorol. 2017, 236, 1–21. [Google Scholar] [CrossRef]
- Pang, Y.; Li, Z.Y.; Ju, H.B.; Lu, H.; Jia, W.; Si, L.; Guo, Y.; Liu, Q.W.; Li, S.M.; Liu, L.X.; et al. LiCHy: The CAF’s LiDAR, CCD and Hyperspectral Integrated Airborne Observation System. Remote Sens. 2016, 8, 398. [Google Scholar] [CrossRef] [Green Version]
- Magruder, L.A.; Brunt, K.M.; Alonzo, M. Early ICESat-2 on-orbit Geolocation Validation Using Ground-Based Corner Cube Retro-Reflectors. Remote Sens. 2020, 12, 3653. [Google Scholar] [CrossRef]
- Herzfeld, U.C.; McDonald, B.W.; Wallin, B.F.; Neumann, T.A.; Markus, T.; Brenner, A.; Fileld, C. Algorithm for detection of ground and canopy cover in micropulse photon-counting Lidar altimeter data in preparation for the ICESat-2 mission. IEEE Trans. Geosci. Remote Sens. 2014, 52, 2109–2125. [Google Scholar] [CrossRef]
- Gwenzi, D.; Lefsky, M.A.; Suchdeo, V.P.; David, J.H. Prospects of the ICESat-2 laser altimetry mission for savanna ecosystem structural studies based on airborne simulation data. ISPRS J. Photogramm. Remote Sens. 2016, 118, 68–82. [Google Scholar] [CrossRef]
- Xie, H.; Tang, H.; Jin, Y.; Li, B.; Zhang, J.; Liu, S.; Tong, X. An Improved Surface Slope Estimation Model Using Space-borne Laser Altimetric Waveform Data Over Antarctica Ice Sheet. IEEE Geosci. Remote Sens. Lett. 2021, 14, 7604–7623. [Google Scholar]
- Vosselman, G. Slope based filtering of laser altimetry data. Int. Arch. Photogramm. Remote Sens. 2000, 33, 935–942. [Google Scholar]
- Altmann, Y.; Ren, X.; McCarthy, A.; Buller, G.S.; McLaughlin, S. Lidar waveform-based analysis of depth images constructed using sparse single-photon data. IEEE Trans. Image Process. 2016, 25, 1935–1946. [Google Scholar] [CrossRef] [Green Version]
- Harding, D.J.; Dabney, P.W.; Valett, S. Polarimetric, two-color, photon-counting laser altimeter measurements of forest canopy structure. In Proceedings of the SPIE—The International Society for Optical Engineering, Nanjing, China, 24 October 2011; Volume 8286, p. 828629. [Google Scholar]
- Comprehensive bathymetry and intertidal topography of the Amazon estuary. Earth Syst. Sci. Data 2021, 13, 2275–2291. [CrossRef]
- Malambo, L.; Popescu, S.C. Assessing the agreement of ICESat-2 terrain and canopy height with airborne lidar over US ecozones. Remote Sens. Environ. 2021, 266, 112711. [Google Scholar] [CrossRef]
- Lin, X.; Xu, M.; Cao, C.; Dang, Y.; Huang, Z. Estimates of forest canopy height using a combination of ICESatat-2/ATLAS data and stereo-photogrammetry. Remote Sens. 2020, 12, 3649. [Google Scholar] [CrossRef]
Figure 1.
Location of the study area.

Figure 2.
Schematic diagram of the track of ICESat-2 (https://icesat-2.gsfc.nasa.gov/science/specs, accessed on 14 December 2021).
Figure 2.
Schematic diagram of the track of ICESat-2 (https://icesat-2.gsfc.nasa.gov/science/specs, accessed on 14 December 2021).

Figure 3.
Data processing flowchart of photon-counting lidar.

Figure 4.
Schematic diagram of the cross-track photon error and correction diagram. (a) Cross-track photon error: when the slope is 30°, and the photon spans 1.73 m across the track, the point is converted to profile data distributed along the track, which is actually located 1 m above the track. This results in an overestimation of the elevation in the ground photon extraction. (b) Cross-track photon projection onto track. (c) Cross-track photon correction.

Figure 5.
Schematic diagram of the initial photon position and the photon position after correction. (a–d) Distribution of photons in the study area. (e–g) Positions of the photons after correction of (b–d), respectively.
Figure 5.
Schematic diagram of the initial photon position and the photon position after correction. (a–d) Distribution of photons in the study area. (e–g) Positions of the photons after correction of (b–d), respectively.

Figure 6.
Comparison between ATL03 initial photons and denoised photons: (a) ATL03 initial photons; (b) ATL03 denoising photons.
Figure 6.
Comparison between ATL03 initial photons and denoised photons: (a) ATL03 initial photons; (b) ATL03 denoising photons.

Figure 7.
The distribution map of the ground points before and after slope filtering: (a) without slope filtering; (b) after slope filtering.
Figure 7.
The distribution map of the ground points before and after slope filtering: (a) without slope filtering; (b) after slope filtering.

Figure 8.
DTM established by ATL08 and CAF-LiCHy.

Figure 9.
Frequency histogram of the ground elevation errors of ICESat-2data.

Figure 10.
Geolocation accuracy plot showing the absolute accuracy of the ICESat-2 data compared to an airborne lidar.
Figure 10.
Geolocation accuracy plot showing the absolute accuracy of the ICESat-2 data compared to an airborne lidar.

Figure 11.
Frequency histogram of the cross-track distance of ATL03 data.

Figure 12.
Ground points extracted from ATL03 initial photons and corrected photons using different methods. (a) Ground photons obtained using PM based on the ATL03 initial data; (b) ground photons obtained using MVM based on the ATL03 initial data; (c) ground photons obtained using PM based on the ATL03 corrected data; (d) ground photons obtained using MVM based on the ATL03 corrected data; (e) ground photons obtained using PM based on the initial ATL03 data and then filtered by SFMB; (f) ground photons obtained using MVM based on the initial ATL03 data and then filtered by SFMB; (g) ground photons obtained using PM based on the corrected ATL03 data and then filtered by SFMB; (h) result of ground photons based on ATL03 correction data using MVM and then filtered by SFMB.


Table 1.
Statistical errors of ground elevation based on ICESat-2 data, using different methods.
| Datasets | R2 | Bias (m) | MAE (m) | RMSE (m) |
|---|---|---|---|---|
| ATL08 ground points | 0.946 | 13.06 | 17.59 | 20.97 |
| ATL03 initial photons—PM | 0.975 | 7.52 | 6.18 | 7.70 |
| ATL03 initial photons—MVM | 0.973 | 6.99 | 5.77 | 7.06 |
| ATL03 calibration photons—PM | 0.987 | 4.95 | 3.66 | 5.20 |
| ATL03 calibration photons—MVM | 0.991 | 4.82 | 3.91 | 4.94 |
Table 2.
Elevation accuracies of the extracted ICESat-2 ground photons under different terrains (classification criteria by slope of forest land).
Table 2.
Elevation accuracies of the extracted ICESat-2 ground photons under different terrains (classification criteria by slope of forest land).
| Accuracy Indexes | Gradient Classification | |||||
|---|---|---|---|---|---|---|
| Ⅰ (0° ≤ Slope ˂ 5°) | Ⅱ (5° ≤ Slope ˂ 15°) | III (15° ≤ Slope ˂ 25°) | IV (25° ≤ Slope ˂ 35°) | Ⅴ (35° ≤ Slope ˂ 45°) | Ⅵ (Slope ≥ 45°) | |
| MAE (m) | 13.2 | 15.07 | 15.93 | 18.08 | 18.2 | 22.33 |
| RMSE (m) | 18.44 | 20.08 | 20.94 | 22.39 | 22.93 | 23.04 |
Table 3.
Statistical errors of ground elevation using the MVM and PM methods for slope filtering, using ATL03 ground points extracted from the initial and corrected photons.
Table 3.
Statistical errors of ground elevation using the MVM and PM methods for slope filtering, using ATL03 ground points extracted from the initial and corrected photons.
| Datasets | R2 | Bias (m) | MAE (m) | RMSE (m) |
|---|---|---|---|---|
| ATL03 initial photons—PM—SFMA | 0.983 | 6.03 | 4.96 | 6.05 |
| ATL03 initial photons—MVM—SFMA | 0.976 | 6.33 | 5.14 | 6.33 |
| ATL03 calibration photons—PM—SFMA | 0.993 | 3.58 | 2.64 | 3.61 |
| ATL03 calibration photons—MVM—SFMA | 0.993 | 8.32 | 2.96 | 3.98 |
| ATL03 initial photons—PM—SFMB | 0.984 | 5.88 | 4.85 | 5.90 |
| ATL03 initial photons—MVM—SFMB | 0.978 | 6.07 | 4.97 | 6.07 |
| ATL03 calibration photons—PM—SFMB | 0.993 | 3.55 | 2.61 | 3.58 |
| ATL03 calibration photons—MVM—SFMB | 0.995 | 3.56 | 2.78 | 3.57 |
Publisher’s Note: MDPI stays neutral with regard to jurisdictional claims in published maps and institutional affiliations. |
© 2022 by the authors. Licensee MDPI, Basel, Switzerland. This article is an open access article distributed under the terms and conditions of the Creative Commons Attribution (CC BY) license (https://creativecommons.org/licenses/by/4.0/).
Share and Cite
MDPI and ACS Style
Li, B.; Fan, G.; Zhao, T.; Deng, Z.; Yu, Y. Retrieval of DTM under Complex Forest Stand Based on Spaceborne LiDAR Fusion Photon Correction. Remote Sens. 2022, 14, 218. https://0-doi-org.brum.beds.ac.uk/10.3390/rs14010218
AMA Style
Li B, Fan G, Zhao T, Deng Z, Yu Y. Retrieval of DTM under Complex Forest Stand Based on Spaceborne LiDAR Fusion Photon Correction. Remote Sensing. 2022; 14(1):218. https://0-doi-org.brum.beds.ac.uk/10.3390/rs14010218
Chicago/Turabian StyleLi, Bin, Guangpeng Fan, Tianzhong Zhao, Zhuo Deng, and Yonghui Yu. 2022. "Retrieval of DTM under Complex Forest Stand Based on Spaceborne LiDAR Fusion Photon Correction" Remote Sensing 14, no. 1: 218. https://0-doi-org.brum.beds.ac.uk/10.3390/rs14010218
Note that from the first issue of 2016, this journal uses article numbers instead of page numbers. See further details here.