Next Issue
Volume 14, June-1
Previous Issue
Volume 14, May-1
 
 
remotesensing-logo

Journal Browser

Journal Browser

Remote Sens., Volume 14, Issue 10 (May-2 2022) – 221 articles

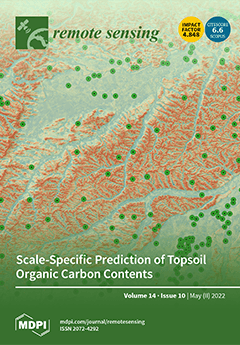
Cover Story (view full-size image): The application of machine learning methods for the spatial prediction of soil properties has a long tradition. The prediction quality is affected by factors such as the spatial and temporal representativeness of the samples or the scale-specific explanatory power of the variables used. In this study, the explanatory power of novel multitemporal soil reflectance composites (SRCs) for the prediction of (top)soil organic carbon content (SOC) is analyzed using a Bavarian study area as an example and compared with the explanatory power of established multihierarchical terrain attributes. Accordingly, parameters based on SRCs are characterized by a higher explanatory power at fine scales compared to terrain attributes. The study results suggest that digital soil modeling (DSM) workflows should include scale-related optimizations. View this paper
  • Issues are regarded as officially published after their release is announced to the table of contents alert mailing list.
  • You may sign up for e-mail alerts to receive table of contents of newly released issues.
  • PDF is the official format for papers published in both, html and pdf forms. To view the papers in pdf format, click on the "PDF Full-text" link, and use the free Adobe Reader to open them.
Order results
Result details
Section
Select all
Export citation of selected articles as:
19 pages, 8944 KiB  
Article
A Registration Method for Dual-Frequency, High-Spatial-Resolution SAR Images
by Junnan Huang, Daoxiang An, Yuxiao Luo, Jingwei Chen, Zhimin Zhou, Leping Chen and Dong Feng
Remote Sens. 2022, 14(10), 2509; https://0-doi-org.brum.beds.ac.uk/10.3390/rs14102509 - 23 May 2022
Cited by 1 | Viewed by 2061
Abstract
With the continuous development of synthetic-aperture-radar (SAR) technology, SAR-image data are becoming increasingly abundant. For the same scene, dual-frequency (high-frequency and low-frequency) SAR images can present different details and feature information. Image fusion of the two frequencies can combine the advantages of both, [...] Read more.
With the continuous development of synthetic-aperture-radar (SAR) technology, SAR-image data are becoming increasingly abundant. For the same scene, dual-frequency (high-frequency and low-frequency) SAR images can present different details and feature information. Image fusion of the two frequencies can combine the advantages of both, thus describing targets more comprehensively. Image registration is the key step of image fusion and determines the quality of fusion. Due to the complex geometric distortion and gray variance between dual-frequency SAR images with high resolution, it is difficult to realize accurate registration between the two. In order to solve this problem, this paper proposes a method to achieve accurate registration by combining edge features and gray information. Firstly, this paper applies the edge features of images and a registration algorithm based on fast Fourier transform (FFT) to realize rapid coarse registration. Then, combining a registration algorithm based on the enhanced correlation coefficient (ECC) with the concept of segmentation, the coarse-registration result is registered to achieve accurate registration. Finally, by processing the airborne L-band and Ku-band SAR data, the correctness, effectiveness, and practicability of the proposed method are verified, with a root mean square error (RMSE) of less than 2. Full article
Show Figures

Graphical abstract

16 pages, 7538 KiB  
Article
High-Precision Joint Magnetization Vector Inversion Method of Airborne Magnetic and Gradient Data with Structure and Data Double Constraints
by Guoqing Ma, Yanan Zhao, Bowen Xu, Lili Li and Taihan Wang
Remote Sens. 2022, 14(10), 2508; https://0-doi-org.brum.beds.ac.uk/10.3390/rs14102508 - 23 May 2022
Cited by 5 | Viewed by 1651
Abstract
Airborne magnetic and gradient measurements are commonly used geophysical remote sensing tools to obtain the distribution features of ore mineral bodies. It is known that ore mineral bodies generally contain remanent magnetization, and magnetization vector inversion (MVI) can produce the magnetization intensity and [...] Read more.
Airborne magnetic and gradient measurements are commonly used geophysical remote sensing tools to obtain the distribution features of ore mineral bodies. It is known that ore mineral bodies generally contain remanent magnetization, and magnetization vector inversion (MVI) can produce the magnetization intensity and direction of the source, which is more suitably used to interpret measured airborne magnetic and gradient data. To accurately reveal the underground magnetization vector distribution, we proposed a high-precision method with double constraints on the data and physical structure, and we used the cross-gradient inversion of airborne magnetic anomalies and the combination matrix of airborne magnetic and gradient (CMG) data to recover the physical parameters of the sources with different depths. We used the combination matrix to produce the different component data constraints and the cross-gradient function to finish the inversion to provide structural constraints. For anomaly sources at similar depths, joint inversion based on the cross-gradient of magnetic gradient data and CMG data is more suitably used. The superiority of the double constraints method is proven by theoretical model tests. We apply the proposed method to interpret airborne magnetic and gradient data in Shandong Province to detect iron mineral resources, and we select the cross-gradient inversion of airborne magnetic anomalies and CMG data depending on the nonlinear features of the power spectrum. The main ore bodies have a northeast distribution with a depth range of 1048–1800 m, successfully giving the distribution range of the high-magnetic bodies; a better mineral potential is in the northern part of the survey area. Full article
Show Figures

Graphical abstract

19 pages, 3965 KiB  
Article
Comprehensive Precipitable Water Vapor Retrieval and Application Platform Based on Various Water Vapor Detection Techniques
by Qingzhi Zhao, Xiaoya Zhang, Kan Wu, Yang Liu, Zufeng Li and Yun Shi
Remote Sens. 2022, 14(10), 2507; https://0-doi-org.brum.beds.ac.uk/10.3390/rs14102507 - 23 May 2022
Cited by 17 | Viewed by 2148
Abstract
Atmospheric water vapor is one of the important parameters for weather and climate studies. Generally, atmospheric water vapor can be monitored by some techniques, such as the Global Navigation Satellite System (GNSS), radiosonde (RS), remote sensing and numerical weather forecast (NWF). However, the [...] Read more.
Atmospheric water vapor is one of the important parameters for weather and climate studies. Generally, atmospheric water vapor can be monitored by some techniques, such as the Global Navigation Satellite System (GNSS), radiosonde (RS), remote sensing and numerical weather forecast (NWF). However, the comprehensive retrieval and application of precipitable water vapor (PWV) using multi techniques has been hardly performed before, which becomes the focus of this study. A comprehensive PWV retrieval and application platform (CPRAP) is first established by combing the ground-based (GNSS), space-based (Fengyun-3A, Sentinel-3A) and reanalysis-based (the fifth-generation reanalysis dataset of the European Centre for Medium-Range Weather Forecasting, ERA5) techniques. Additionally, its applications are then extended to drought and rainfall monitoring using the CPRAP-derived PWV. The statistical result shows that PWV derived from ground-based GNSS has high accuracy in China, with the root mean square (RMS), Bias and mean absolute error (MAE) of 2.15, 0.05 and 1.65 mm, respectively, when the RS-derived PWV is regarded as the reference. In addition, the accuracy of PWV derived from the space-based (FY-3A and Sentinel-3A) techniques technique is also validated and the RMS, Bias and MAE of a Medium Resolution Spectral Imager (MERSI) onboard Fengyun-3A (FY-3A) and an Ocean and Land Color Instrument (OLCI) onboard Sentinel-3A are 4.46/0.56/3.61 mm and 2.95/0.01/1.37 mm, respectively. Then, the performance of ERA5-derived PWV is evaluated based on GNSS-derived and RS-derived PWV. The result also shows good accuracy of ERA5-provided PWV with the averaged RMS, Bias and MAE of 1.86/0.11/1.48 mm and 0.90/−0.05/1.51 mm, respectively. Finally, the PWV data derived from the established CPRAP are further used for drought and rainfall monitoring. The applied results reveal that the calculated the standardized precipitation evapotranspiration index (SPEI) using the CPRAP-derived PWV can monitor the drought and the correlation coefficient ranges from 0.83 to 0.9 when compared with the SPEI. Furthermore, in this paper correlation analysis between PWV derived from the CPRAP and rainfall, and its potential for rainfall monitoring was also validated. Such results verify the significance of the established CPRAP for weather and climate studies. Full article
Show Figures

Graphical abstract

15 pages, 7319 KiB  
Technical Note
Research on Detection Technology of Spoofing under the Mixed Narrowband and Spoofing Interference
by Long Huang, Zukun Lu, Chao Ren, Zhe Liu, Zhibin Xiao, Jie Song and Baiyu Li
Remote Sens. 2022, 14(10), 2506; https://0-doi-org.brum.beds.ac.uk/10.3390/rs14102506 - 23 May 2022
Cited by 3 | Viewed by 1753
Abstract
The global navigation satellite system has achieved great success in the civil and military fields and is an important resource for space-time information services. However, spoof interference has always been one of the main threats to the application security of satellite navigation receivers. [...] Read more.
The global navigation satellite system has achieved great success in the civil and military fields and is an important resource for space-time information services. However, spoof interference has always been one of the main threats to the application security of satellite navigation receivers. In order to further improve the application security of satellite navigation receivers, this paper focuses on the application scenarios where narrowband and spoofing interference exist at the same time, studies the problem of spoofing interference detection under mixed interference conditions, then proposes a spoofing interference detection method based on the tracking loop identification curve. This method can effectively deal with the detection of spoofing interference under the conditions of narrowband interference and, at the same time, it can effectively detect the spoofing interference of gradual deviation. Simulation experiments verify the effectiveness of the spoofing interference detection method, based on the tracking loop discrimination curve. In typical jamming and spoofing scenarios, when the spoofing signal is about 7.5 m away from the real signal, the method used in this paper can achieve effective detection. The proposed detection method is of great significance for improving the anti-spoofing capability of satellite navigation receivers. Full article
(This article belongs to the Topic GNSS Measurement Technique in Aerial Navigation)
Show Figures

Graphical abstract

25 pages, 109946 KiB  
Article
Drone-Sensed and Sap Flux-Derived Leaf Phenology in a Cool Temperate Deciduous Forest: A Tree-Level Comparison of 17 Species
by Noviana Budianti, Masaaki Naramoto and Atsuhiro Iio
Remote Sens. 2022, 14(10), 2505; https://0-doi-org.brum.beds.ac.uk/10.3390/rs14102505 - 23 May 2022
Cited by 1 | Viewed by 3030
Abstract
Understanding the relationship between leaf phenology and physiological properties has important implications for improving ecosystem models of biogeochemical cycling. However, previous studies have investigated such relationships only at the ecosystem level, limiting the biological interpretation and application of the observed relationships due to [...] Read more.
Understanding the relationship between leaf phenology and physiological properties has important implications for improving ecosystem models of biogeochemical cycling. However, previous studies have investigated such relationships only at the ecosystem level, limiting the biological interpretation and application of the observed relationships due to the complex vegetation structure of forest ecosystems. Additionally, studies focusing on transpiration are generally limited compared to those on photosynthesis. Thus, we investigated the relationship between stem sap flux density (SFD) and crown leaf phenology at the individual tree level using the heat dissipation method, unmanned aerial vehicle (UAV)-based observation, and ground-based visual observation across 17 species in a cool temperate forest in Japan, and assessed the potential of UAV-derived phenological metrics to track individual tree-level sap flow phenology. We computed five leaf phenological metrics (four from UAV imagery and one from ground observations) and evaluated the consistency of seasonality between the phenological metrics and SFD using Bayesian modelling. Although seasonal trajectories of the leaf phenological metrics differed markedly among the species, the daytime total SFD (SFDday) estimated by the phenological metrics was significantly correlated with the measured ones across the species, irrespective of the type of metric. Crown leaf cover derived from ground observations (CLCground) showed the highest ability to predict SFDday, suggesting that the seasonality of leaf amount rather than leaf color plays a predominant role in sap flow phenology in this ecosystem. Among the UAV metrics, Hue had a superior ability to predict SFDday compared with the other metrics because it showed seasonality similar to CLCground. However, all leaf phenological metrics showed earlier spring increases than did sap flow in more than half of the individuals. Our study revealed that UAV metrics could be used as predictors of sap flow phenology for deciduous species in cool, temperate forests. However, for a more accurate prediction, phenological metrics representing the spring development of sap flow must be explored. Full article
(This article belongs to the Special Issue Hyperspectral Remote Sensing of Vegetation Functions)
Show Figures

Graphical abstract

18 pages, 2765 KiB  
Article
Digital Mapping of Soil Organic Carbon with Machine Learning in Dryland of Northeast and North Plain China
by Xianglin Zhang, Jie Xue, Songchao Chen, Nan Wang, Zhou Shi, Yuanfang Huang and Zhiqing Zhuo
Remote Sens. 2022, 14(10), 2504; https://0-doi-org.brum.beds.ac.uk/10.3390/rs14102504 - 23 May 2022
Cited by 12 | Viewed by 3082
Abstract
Due to the importance of soil organic carbon (SOC) in supporting ecosystem services, accurate SOC assessment is vital for scientific research and decision making. However, most previous studies focused on single soil depth, leading to a poor understanding of SOC in multiple depths. [...] Read more.
Due to the importance of soil organic carbon (SOC) in supporting ecosystem services, accurate SOC assessment is vital for scientific research and decision making. However, most previous studies focused on single soil depth, leading to a poor understanding of SOC in multiple depths. To better understand the spatial distribution pattern of SOC in Northeast and North China Plain, we compared three machine learning algorithms (i.e., Cubist, Extreme Gradient Boosting (XGBoost) and Random Forest (RF)) within the digital soil mapping framework. A total of 386 sampling sites (1584 samples) following specific criteria covering all dryland districts and counties and soil types in four depths (i.e., 0–10, 10–20, 20–30 and 30–40 cm) were collected in 2017. After feature selection from 249 environmental covariates by the Genetic Algorithm, 29 variables were used to fit models. The results showed SOC increased from southern to northern regions in the spatial scale and decreased with soil depths. From the result of independent verification (validation dataset: 80 sampling sites), RF (R2: 0.58, 0.71, 0.73, 0.74 and RMSE: 3.49, 3.49, 2.95, 2.80 g kg−1 in four depths) performed better than Cubist (R2: 0.46, 0.63, 0.67, 0.71 and RMSE: 3.83, 3.60, 3.03, 2.72 g kg−1) and XGBoost (R2: 0.53, 0.67, 0.70, 0.71 and RMSE: 3.60, 3.60, 3.00, 2.83 g kg−1) in terms of prediction accuracy and robustness. Soil, parent material and organism were the most important covariates in SOC prediction. This study provides the up-to-date spatial distribution of dryland SOC in Northeast and North China Plain, which is of great value for evaluating dynamics of soil quality after long-term cultivation. Full article
(This article belongs to the Special Issue Remote Sensing for Soil Mapping and Monitoring)
Show Figures

Figure 1

24 pages, 1979 KiB  
Article
Assessment of the Usefulness of Spectral Bands for the Next Generation of Sentinel-2 Satellites by Reconstruction of Missing Bands
by Jordi Inglada, Julien Michel and Olivier Hagolle
Remote Sens. 2022, 14(10), 2503; https://0-doi-org.brum.beds.ac.uk/10.3390/rs14102503 - 23 May 2022
Viewed by 1973
Abstract
The Sentinel-2 constellation has been providing high spatial, spectral and temporal resolution optical imagery of the continental surfaces since 2015. The spatial and temporal resolution improvements that Sentinel-2 brings with respect to previous systems have been demonstrated in both the literature and operational [...] Read more.
The Sentinel-2 constellation has been providing high spatial, spectral and temporal resolution optical imagery of the continental surfaces since 2015. The spatial and temporal resolution improvements that Sentinel-2 brings with respect to previous systems have been demonstrated in both the literature and operational applications. On the other hand, the spectral capabilities of Sentinel-2 appear to have been exploited to a limited extent only. At the moment of definition of the new generation of Sentinel-2 satellites, an assessment of the usefulness of the current available spectral bands seems appropriate. In this work, we investigate the unique information contained by each 20 m resolution Sentinel-2 band. A statistical quantitative approach is adopted in order to yield conclusions that are application agnostic: multivariate regression is used to reconstruct some bands, using the others as predictors. We conclude that, for most observed surfaces, it is possible to reconstruct the reflectances of most red edge or NIR bands from the rest of the observed bands with an accuracy within the radiometric requirements of Sentinel-2. Removing two of those bands could be possible at the cost of slightly higher reconstruction errors. We also identify mission scenarios for which several of the current Sentinel-2 bands could be removed for the next generation of sensors. Full article
(This article belongs to the Section Satellite Missions for Earth and Planetary Exploration)
Show Figures

Graphical abstract

21 pages, 36109 KiB  
Article
Retrieving Mediterranean Sea Surface Salinity Distribution and Interannual Trends from Multi-Sensor Satellite and In Situ Data
by Michela Sammartino, Salvatore Aronica, Rosalia Santoleri and Bruno Buongiorno Nardelli
Remote Sens. 2022, 14(10), 2502; https://0-doi-org.brum.beds.ac.uk/10.3390/rs14102502 - 23 May 2022
Cited by 6 | Viewed by 3078
Abstract
Sea surface salinity (SSS) is one of the Essential Climate Variables (ECVs), defined by the Global Climate Observing System (GCOS). Salinity is modified by river discharge, land run-off, precipitation, and evaporation, and it is advected by oceanic currents. In turn, ocean circulation, the [...] Read more.
Sea surface salinity (SSS) is one of the Essential Climate Variables (ECVs), defined by the Global Climate Observing System (GCOS). Salinity is modified by river discharge, land run-off, precipitation, and evaporation, and it is advected by oceanic currents. In turn, ocean circulation, the water cycle, and biogeochemistry are deeply impacted by salinity variations. The Mediterranean Sea represents a hot spot for the variability of salinity. Despite the ever-increasing number of moorings and floating buoys, in situ SSS estimates have low coverage, hindering the monitoring of SSS patterns. Conversely, satellite sensors provide SSS surface data at high spatial and temporal resolution, complementing the sparseness of in situ datasets. Here, we describe a multidimensional optimal interpolation algorithm, specifically configured to provide a new daily SSS dataset at 1/16° grid resolution, covering the entire Mediterranean Sea (Med L4 SSS). The main improvements in this regional algorithm are: the ingestion of satellite SSS estimates from multiple satellite missions (NASA’s Soil Moisture Active Passive (SMAP), ESA’s Soil Moisture and Ocean Salinity (SMOS) satellites), and a new background (first guess), specifically built to improve coastal reconstructions. The multi-sensor Med L4 SSS fields have been validated against independent in situ SSS samples, collected between 2010–2020. They have also been compared with global weekly Copernicus Marine Environment Monitoring Service (CMEMS) and Barcelona Expert Centre (BEC) regional products, showing an improved performance. Power spectral density analyses demonstrated that the Med L4 SSS field achieves the highest effective spatial resolution, among all the datasets analysed. Even if the time series is relatively short, a clear interannual trend is found, leading to a marked salinification, mostly occurring in the Eastern Mediterranean Sea. Full article
(This article belongs to the Section Ocean Remote Sensing)
Show Figures

Graphical abstract

17 pages, 8567 KiB  
Article
Soil Salinity Variations and Associated Implications for Agriculture and Land Resources Development Using Remote Sensing Datasets in Central Asia
by Simon Measho, Fadong Li, Petri Pellikka, Chao Tian, Hubert Hirwa, Ning Xu, Yunfeng Qiao, Sayidjakhon Khasanov, Rashid Kulmatov and Gang Chen
Remote Sens. 2022, 14(10), 2501; https://0-doi-org.brum.beds.ac.uk/10.3390/rs14102501 - 23 May 2022
Cited by 9 | Viewed by 2943
Abstract
Global agricultural lands are becoming saline because of human activities that have affected crop production and food security worldwide. In this study, the spatiotemporal variability of soil electrical conductivity (EC) in Central Asia was evaluated based on high-resolution multi-year predicted soil EC data, [...] Read more.
Global agricultural lands are becoming saline because of human activities that have affected crop production and food security worldwide. In this study, the spatiotemporal variability of soil electrical conductivity (EC) in Central Asia was evaluated based on high-resolution multi-year predicted soil EC data, Moderate Resolution Imaging Spectroradiometer (MODIS) land cover product, precipitation, reference evapotranspiration, population count, and soil moisture datasets. We primarily detected pixel-based soil EC trends over the past three decades and correlated soil EC with potential deriving factors. The results showed an overall increase in salt-affected areas between 1990 and 2018 for different land cover types. The soil EC trend increased by 6.86% (p < 0.05) over Central Asia during 1990–2018. The open shrub lands dominated by woody perennials experienced the highest increasing soil salinity trend, particularly in Uzbekistan and Turkmenistan local areas, while there was a decreasing soil EC trend in the cropland areas, such as in Bukhara and Khorezm (Uzbekistan). The main factors that affect the variability of soil salinity were strongly associated with population pressure and evapotranspiration. This study provides comprehensive soil EC variations and trends from the local to regional scales. Agriculture and land resource managers must tackle the rising land degradation concerns caused by the changing climate in arid lands and utilise geoinformatics. Full article
(This article belongs to the Special Issue Integrating Earth Observations into Ecosystem Service Models)
Show Figures

Figure 1

16 pages, 5857 KiB  
Article
Oil-Contaminated Soil Modeling and Remediation Monitoring in Arid Areas Using Remote Sensing
by Gordana Kaplan, Hakan Oktay Aydinli, Andrea Pietrelli, Fabien Mieyeville and Vincenzo Ferrara
Remote Sens. 2022, 14(10), 2500; https://0-doi-org.brum.beds.ac.uk/10.3390/rs14102500 - 23 May 2022
Cited by 8 | Viewed by 3241
Abstract
Oil contamination is a major source of pollution in the environment. It may take decades for oil-contaminated soils to be remedied. This study models oil-contaminated soils using one of the world’s greatest environmental disasters, the onshore oil spill in the desert of Kuwait [...] Read more.
Oil contamination is a major source of pollution in the environment. It may take decades for oil-contaminated soils to be remedied. This study models oil-contaminated soils using one of the world’s greatest environmental disasters, the onshore oil spill in the desert of Kuwait in 1991. This work uses state-of-art remote sensing technologies and machine learning to investigate the oil spills during the first Gulf War. We were able to identify oil-contaminated and clear locations in Kuwait using unsupervised classification over pre- and post-oil spill data. The research area’s pre-war and post-war circumstances, in terms of oil spills, were discovered by developing spectral signatures with different wavelengths and several spectral indices utilized for oil-contamination detection. Following that, we use this data for sampling and training to model various oil-contaminated soil levels. In addition, we analyze two separate datasets and used three modeling methodologies, Random Tree (RT), Support Vector Machine (SVM) and Random Forest (RF). The results show that the suggested approach is effective in detecting oil-contaminated soil. As a result, the location and degree of contamination may be established. The results of this analysis can be a valid support to the studies of an appropriate remediation. Full article
Show Figures

Graphical abstract

14 pages, 2834 KiB  
Article
Alpine Grassland Reviving Response to Seasonal Snow Cover on the Tibetan Plateau
by Ying Ma, Xiaodong Huang, Qisheng Feng and Tiangang Liang
Remote Sens. 2022, 14(10), 2499; https://0-doi-org.brum.beds.ac.uk/10.3390/rs14102499 - 23 May 2022
Cited by 6 | Viewed by 1803
Abstract
Season snow cover plays an important role in vegetation growth in alpine regions. In this study, we analyzed the spatial and temporal variations in seasonal snow cover and the start of the growing season (SOS) of alpine grasslands and preliminarily studied the mechanism [...] Read more.
Season snow cover plays an important role in vegetation growth in alpine regions. In this study, we analyzed the spatial and temporal variations in seasonal snow cover and the start of the growing season (SOS) of alpine grasslands and preliminarily studied the mechanism by which snow cover affects SOS changes by modifying the soil temperature (ST) and soil moisture (SM) in spring. The results showed that significant interannual trends in the SOS, snow end date (SED), snow cover days (SCD), ST, and SM existed over the Tibetan Plateau (TP) in China from 2000 to 2020. The SOS advanced by 2.0 d/10 a over the TP over this period. Moreover, the SOS showed advancing trends in the eastern and central parts of the TP and a delayed trend in the west. The SED and SCD exhibited an advancing trend and a decreasing trend in high-elevation areas, respectively, and the opposite trends in low-elevation areas. The ST showed a decreasing trend in low-elevation areas and an increasing trend in high-elevation areas. The SM tended to increase in most areas. The effects of the seasonal snow cover on the ST and SM indirectly influenced the SOS of alpine grasslands. The delayed SEDs and more SCD observed herein could provide increasingly wet soil conditions optimal for the advancement of the SOS, while less snow and shorter snow seasons could delay the SOS of alpine grasslands on the TP. Full article
(This article belongs to the Special Issue Remote Sensing for Mountain Vegetation and Snow Cover)
Show Figures

Figure 1

18 pages, 5086 KiB  
Article
Construction of an Ecological Security Pattern in an Urban–Lake Symbiosis Area: A Case Study of Hefei Metropolitan Area
by Xin Fan, Yuejing Rong, Chongxin Tian, Shengya Ou, Jiangfeng Li, Hong Shi, Yi Qin, Jiawen He and Chunbo Huang
Remote Sens. 2022, 14(10), 2498; https://0-doi-org.brum.beds.ac.uk/10.3390/rs14102498 - 23 May 2022
Cited by 13 | Viewed by 2177
Abstract
In the context of rapid urbanization, building an ecological security pattern that takes into account both ecological protection and economic growth is of great significance for guiding high-quality regional development. Taking the Hefei metropolitan area as an example, we identified the ecological source [...] Read more.
In the context of rapid urbanization, building an ecological security pattern that takes into account both ecological protection and economic growth is of great significance for guiding high-quality regional development. Taking the Hefei metropolitan area as an example, we identified the ecological source from three aspects—the importance of ecosystem services, ecological sensitivity, and landscape connectivity—by using NPP-VIIRS night light data, impervious surfaces, and the topographical index to the rest of the landscape resistance surface, and the least cumulative resistance model to identify ecological corridors and ecological buffer zones. We then constructed a comprehensive regional ecological security pattern. The results show the following: (1) The ecological source area of the Hefei metropolitan area is 15,538.74 km2, accounting for 24.5% of the total study area. It is mainly composed of the Dabie Mountains, the Yangtze River, the Huai River, and Chaohu Lake. (2) The area of an ecological buffer zone, ecological transition zone, and development and construction zone account for 21.8%, 39.7%, and 38.5%, respectively. Among them, the ecological buffer zone serves as a protective barrier for the ecological source area; therefore, development and construction activities should be restricted. The ecological transition zone should be constructed with low development intensity, and the development and construction zone can be carried out with greater development intensity. (3) The total length of the ecological corridor is 2816.89 km, with the mainland of the corridor being cultivated land. Identified by superposition of the land use, the area of conflict of urban expansion is 305.23 km2, mainly distributed along the Yangtze River and around Chao Lake. The results may provide decision support for the construction of ecological security in the study area. Full article
(This article belongs to the Special Issue Integrating Earth Observations into Ecosystem Service Models)
Show Figures

Figure 1

17 pages, 9220 KiB  
Article
Spatiotemporal Dynamics of Terrestrial Vegetation and Its Driver Analysis over Southwest China from 1982 to 2015
by Chunhui Duan, Jinghao Li, Yanan Chen, Zhi Ding, Mingguo Ma, Jing Xie, Li Yao and Xuguang Tang
Remote Sens. 2022, 14(10), 2497; https://0-doi-org.brum.beds.ac.uk/10.3390/rs14102497 - 23 May 2022
Cited by 4 | Viewed by 2176
Abstract
Global environmental changes have been dramatic recently, exerting substantial effects on the structures and functions of terrestrial ecosystems, especially for the ecologically-fragile karst regions. Southwest China is one of the largest karst continuum belts around the world, which also contributes about 1/3 of [...] Read more.
Global environmental changes have been dramatic recently, exerting substantial effects on the structures and functions of terrestrial ecosystems, especially for the ecologically-fragile karst regions. Southwest China is one of the largest karst continuum belts around the world, which also contributes about 1/3 of terrestrial carbon sequestration to China. Therefore, a deep understanding of the long-term changes of vegetation across Southwest China over the past decades is critical. Relying on the long time series of Advanced Very High Resolution Radiometer (AVHRR) Global Inventory Modeling and Mapping Studies normalized difference vegetation index (GIMMS NDVI3g) data set, this study examined the spatial and temporal patterns of vegetation conditions in Southwest China from 1982 to 2015, as well as their response to the environmental factors including temperature, precipitation and downward shortwave radiation. Multi-year mean NDVI showed that except the northwestern region, the NDVI of Southwest China was large, ranging from 0.5 to 0.8. Meanwhile, nearly 43.7% of the area experienced significant improvements in NDVI, whereas only 3.47% of the area exhibited significant decreases in NDVI. Interestingly, the NDVI in karst area increased more quickly with 1.035 × 10⁻³/a in comparison with that in the non-karst area with about 0.929 × 10⁻³/a. Further analysis revealed that temperature is the dominant environmental factor controlling the interannual changes in NDVI, accounting for 48.19% of the area, followed by radiation (3.71%) and precipitation (3.09%), respectively. Full article
Show Figures

Graphical abstract

24 pages, 1375 KiB  
Article
Green Area Index and Soil Moisture Retrieval in Maize Fields Using Multi-Polarized C- and L-Band SAR Data and the Water Cloud Model
by Jean Bouchat, Emma Tronquo, Anne Orban, Xavier Neyt, Niko E. C. Verhoest and Pierre Defourny
Remote Sens. 2022, 14(10), 2496; https://0-doi-org.brum.beds.ac.uk/10.3390/rs14102496 - 23 May 2022
Cited by 2 | Viewed by 2143
Abstract
The green area index (GAI) and the soil moisture under the canopy are two key variables for agricultural monitoring. The current most accurate GAI estimation methods exploit optical data and are rendered ineffective in the case of frequent cloud cover. Synthetic aperture radar [...] Read more.
The green area index (GAI) and the soil moisture under the canopy are two key variables for agricultural monitoring. The current most accurate GAI estimation methods exploit optical data and are rendered ineffective in the case of frequent cloud cover. Synthetic aperture radar (SAR) measurements could allow the remote estimation of both variables at the parcel level, on a large scale and regardless of clouds. In this study, several methods were implemented and tested for the simultaneous estimation of both variables using the water cloud model (WCM) and dual-polarized radar backscatter measurements. The methods were tested on the BELSAR-Campaign data set consisting of in-situ measurements of bio-geophysical variables of vegetation and soil in maize fields combined with multi-polarized C- and L-band SAR data from Sentinel-1 and BELSAR. Accurate GAI estimates were obtained using a random forest regressor for the inversion of a pair of WCMs calibrated using cross and vertical co-polarized SAR data in L- and C-band, with correlation coefficients of 0.79 and 0.65 and RMSEs of 0.77 m2 m−2 and 0.98 m2 m−2, respectively, between estimates and in-situ measurements. The WCM, however, proved inadequate for soil moisture monitoring in the conditions of the campaign. These promising results indicate that GAI retrieval in maize crops using only dual-polarized radar data could successfully substitute for estimates derived from optical data. Full article
(This article belongs to the Special Issue Innovative Belgian Earth Observation Research for the Environment)
Show Figures

Figure 1

18 pages, 3950 KiB  
Article
The Development of A Rigorous Model for Bathymetric Mapping from Multispectral Satellite-Images
by Jiasheng Xu, Guoqing Zhou, Sikai Su, Qiaobo Cao and Zhou Tian
Remote Sens. 2022, 14(10), 2495; https://0-doi-org.brum.beds.ac.uk/10.3390/rs14102495 - 23 May 2022
Cited by 21 | Viewed by 3168
Abstract
Models for bathymetry retrieval from multispectral images have not considered the errors caused by tidal fluctuation. A rigorous bathymetric model that considers the variation in tide height time series, including the tide height calculation and instantaneous tide height correction at the epoch of [...] Read more.
Models for bathymetry retrieval from multispectral images have not considered the errors caused by tidal fluctuation. A rigorous bathymetric model that considers the variation in tide height time series, including the tide height calculation and instantaneous tide height correction at the epoch of satellite flight into the bathymetric retrieval model, is proposed in this paper. The model was applied on Weizhou Island, located in Guangxi Province, China, and its accuracy verificated with four check lines and seven checkpoints. A scene from the Landsat 8 satellite image was used as experimental data. The reference (“true”) water depth data collected by a RESON SeaBat 7125 multibeam instrument was used for comparison analysis. When satellite-derived bathymetry is compared, it is found that maximum absolute error, mean absolute error, and RMSE have decreased 54, 45, and 30% relative to that of the traditional model in the entire test field. The accuracy of the water depths retrieved by our model increased 30 and 56% when validated using four check lines and seven checkpoints, respectively. Therefore, it can be concluded that the model proposed in this paper can effectively improve the accuracy of bathymetry retrieved from Landsat 8 images. Full article
(This article belongs to the Topic Remote Sensing in Water Resources Management Models)
Show Figures

Figure 1

20 pages, 43746 KiB  
Article
Monitoring the Impact of Large Transport Infrastructure on Land Use and Environment Using Deep Learning and Satellite Imagery
by Marko Pavlovic, Slobodan Ilic, Nenad Antonic and Dubravko Culibrk
Remote Sens. 2022, 14(10), 2494; https://0-doi-org.brum.beds.ac.uk/10.3390/rs14102494 - 23 May 2022
Cited by 2 | Viewed by 2749
Abstract
Large-scale infrastructure, such as China–Europe Railway Express (CER-Express), which connects countries and regions across Asia and Europe, has a potentially profound effect on land use, as evidenced by changes in land cover along the railway. To ensure sustainable development of such infrastructure and [...] Read more.
Large-scale infrastructure, such as China–Europe Railway Express (CER-Express), which connects countries and regions across Asia and Europe, has a potentially profound effect on land use, as evidenced by changes in land cover along the railway. To ensure sustainable development of such infrastructure and appropriate land administration, effective ways to monitor and assess its impact need to be developed. Remote sensing based on publicly available satellite imagery represents an obvious choice. In the study presented here, we employ a state-of-the-art deep-learning-based approach to automatically detect different types of land cover based on multispectral Sentinel-2 imagery. We then use these data to conduct and present a study of the changes in land use in two geopolitically diverse regions of interest (in Serbia and China and with and without CER-Express infrastructure) for the period of the last three years. Our results show that the standard image-patch-based land cover classification approaches suffer a significant drop in performance in our target scenario in which each pixel needs to be assigned a cove class, but still, validate the applicability of the proposed approach as a remote sensing tool to support the sustainable development of large infrastructure. We discuss the technical limitations of the proposed approach in detail and potential ways in which it can be improved. Full article
Show Figures

Figure 1

21 pages, 12969 KiB  
Article
A Morphological Feature-Oriented Algorithm for Extracting Impervious Surface Areas Obscured by Vegetation in Collaboration with OSM Road Networks in Urban Areas
by Taomin Mao, Yewen Fan, Shuang Zhi and Jinshan Tang
Remote Sens. 2022, 14(10), 2493; https://0-doi-org.brum.beds.ac.uk/10.3390/rs14102493 - 23 May 2022
Cited by 2 | Viewed by 1765
Abstract
Remote sensing is the primary way to extract the impervious surface areas (ISAs). However, the obstruction of vegetation is a long-standing challenge that prevents the accurate extraction of urban ISAs. Currently, there are no general and systematic methods to solve the problem. In [...] Read more.
Remote sensing is the primary way to extract the impervious surface areas (ISAs). However, the obstruction of vegetation is a long-standing challenge that prevents the accurate extraction of urban ISAs. Currently, there are no general and systematic methods to solve the problem. In this paper, we present a morphological feature-oriented algorithm, which can make use of the OSM road network information to remove the obscuring effects when the ISAs are extracted. Very high resolution (VHR) images of Wuhan, China, were used in experiments to verify the effectiveness of the proposed algorithm. Experimental results show that the proposed algorithm can improve the accuracy and completeness of ISA extraction by our previous deep learning-based algorithm. In the proposed algorithm, the overall accuracy (OA) is 86.64%. The results show that the proposed algorithm is feasible and can extract the vegetation-obscured ISAs effectively and precisely. Full article
Show Figures

Graphical abstract

33 pages, 23848 KiB  
Article
Design and Verification of a Double-Grating Spectrometer System (DGSS) for Simultaneous Observation of Aerosols, Water Vapor and Clouds
by Jifeng Li, Guanyu Lin, Heng Wu, Minzheng Duan, Diansheng Cao and Longqi Wang
Remote Sens. 2022, 14(10), 2492; https://0-doi-org.brum.beds.ac.uk/10.3390/rs14102492 - 23 May 2022
Cited by 1 | Viewed by 1684
Abstract
Simultaneous observation of aerosols, water vapor, and clouds is conducive to the analysis of their interactions, and the consistency of observation equipment, instrument performance, and observation time is crucial. Molecular oxygen A-band (758–778 nm) and water vapor absorption band (758–880 nm) are two [...] Read more.
Simultaneous observation of aerosols, water vapor, and clouds is conducive to the analysis of their interactions, and the consistency of observation equipment, instrument performance, and observation time is crucial. Molecular oxygen A-band (758–778 nm) and water vapor absorption band (758–880 nm) are two bands with similar wavelengths, and the hyperspectral remote sensing information of these two bands can be exploited to invert the vertical profile of aerosol and water vapor. In this paper, a double-grating spectrometer system (DGSS) was developed. DGSS uses a telescope system and fiber to introduce multi-angle, double-band sunlight, and it splits light synchronously (non-sequentially) to different positions of the detector through a slit plate and two gratings. The DGSS was calibrated in the laboratory and observed in the external field. The results indicated that the spectral resolution reached 0.06 nm (molecular oxygen A-band, 758–778 nm) and 0.24 nm (water vapor absorption band, 758–880 nm). Meanwhile, the spectra of the two bands (three angles in each band) are not aliased on the detector. Besides, the multi-angle simultaneous observation of the high-resolution spectra of the two bands is realized, which proves the effectiveness of this method. This study will provide a scientific basis for the observation of aerosol, water vapor, and cloud ground-based networks. Full article
Show Figures

Graphical abstract

21 pages, 7385 KiB  
Article
Incorporating a Hyperspectral Direct-Diffuse Pyranometer in an Above-Water Reflectance Algorithm
by Thomas M. Jordan, Stefan G. H. Simis, Philipp M. M. Grötsch and John Wood
Remote Sens. 2022, 14(10), 2491; https://0-doi-org.brum.beds.ac.uk/10.3390/rs14102491 - 23 May 2022
Cited by 4 | Viewed by 1964
Abstract
In situ hyperspectral remote-sensing reflectance (Rrs(λ)) is used to derive water quality products and perform autonomous monitoring of aquatic ecosystems. Conventionally, above-water Rrs(λ) is estimated from three spectroradiometers which measure downwelling [...] Read more.
In situ hyperspectral remote-sensing reflectance (Rrs(λ)) is used to derive water quality products and perform autonomous monitoring of aquatic ecosystems. Conventionally, above-water Rrs(λ) is estimated from three spectroradiometers which measure downwelling planar irradiance (Ed(λ)), sky radiance (Ls(λ)), and total upwelling radiance (Lt(λ)), with a scaling of Ls(λ)/Ed(λ) used to correct for surface-reflected radiance. Here, we incorporate direct and diffuse irradiance, (Edd(λ)) and Eds(λ)), from a hyperspectral pyranometer (HSP) in an Rrs(λ) processing algorithm from a solar-tracking radiometry platform (So-Rad). HSP measurements of sun and sky glint (scaled Edd(λ)/Ed(λ) and Eds(λ)/Ed(λ)) replace model-optimized terms in the 3C (three-glint component) Rrs(λ) algorithm, which estimates Rrs(λ) via spectral optimization of modelled atmospheric and water properties with respect to measured radiometric quantities. We refer to the HSP-enabled method as DD (direct-diffuse) and compare differences in Rrs(λ) and Rrs(λ) variability (assessed over 20 min measurement cycles) between 3C and DD as a function of atmospheric optical state using data from three ports in the Western Channel. The greatest divergence between the algorithms occurs in the blue part of the spectrum where DD has significantly lower Rrs(λ) variability than 3C in clearer sky conditions. We also consider Rrs(λ) processing from a hypothetical two-sensor configuration (using only the Lt(λ) spectroradiometer and the HSP and referred to as DD2) as a potential lower-cost measurement solution, which is shown to have comparable Rrs(λ) and Rrs(λ) variability to DD in clearer sky conditions. Our results support that the HSP sensor can fulfil a dual role in aquatic ecosystem monitoring by improving precision in Rrs(λ) alongside its primary function to characterize aerosols. Full article
Show Figures

Figure 1

14 pages, 9321 KiB  
Article
Robust Extraction of Soil Characteristics Using Landsat 8 OLI/TIRS
by Thanh-Van Hoang, Tien-Yin Chou, Yao-Min Fang, Chun-Tse Wang, Ching-Yun Mu, Nguyen Quang Tuan, Do Thi Viet Huong, Ha Van Hanh and Doan Ngoc Nguyen Phong
Remote Sens. 2022, 14(10), 2490; https://0-doi-org.brum.beds.ac.uk/10.3390/rs14102490 - 23 May 2022
Viewed by 2583
Abstract
This research utilized various methods for extracting soil characteristics from Landsat 8 OLI/TIRS imagery in the Thua Thien Hue province, Vietnam. In this study, the Object-Based Oriented Classification (OBOC) method was used to extract information about land cover (focusing on rock outcrops) on [...] Read more.
This research utilized various methods for extracting soil characteristics from Landsat 8 OLI/TIRS imagery in the Thua Thien Hue province, Vietnam. In this study, the Object-Based Oriented Classification (OBOC) method was used to extract information about land cover (focusing on rock outcrops) on the basis of the TGSI, NDVI, and NDBI indicators. The soil moisture information was determined by examining the correlation between the Land Surface Temperature (LST) and the Normalized Difference Vegetation Index (NDVI). The findings indicated that 40 locations in the study area were covered with rock outcrops, with a Kappa index of 85.10%. In addition, soil moisture varied markedly from the sandy coastal regions, urban areas, and hilly and mountainous areas on the study area’s surface. The extracted soil information can serve as a foundation for local socio-economic development planning. Full article
(This article belongs to the Special Issue Applications of Remote Sensing for Resources Conservation)
Show Figures

Graphical abstract

17 pages, 15131 KiB  
Article
UAV-Based Multitemporal Remote Sensing Surveys of Volcano Unstable Flanks: A Case Study from Stromboli
by Teresa Gracchi, Carlo Tacconi Stefanelli, Guglielmo Rossi, Federico Di Traglia, Teresa Nolesini, Luca Tanteri and Nicola Casagli
Remote Sens. 2022, 14(10), 2489; https://0-doi-org.brum.beds.ac.uk/10.3390/rs14102489 - 23 May 2022
Cited by 6 | Viewed by 2397
Abstract
UAV-based photogrammetry is becoming increasingly popular even in application fields that, until recently, were deemed unsuitable for this technique. Depending on the characteristics of the investigated scenario, the generation of three-dimensional (3D) topographic models may in fact be affected by significant inaccuracies unless [...] Read more.
UAV-based photogrammetry is becoming increasingly popular even in application fields that, until recently, were deemed unsuitable for this technique. Depending on the characteristics of the investigated scenario, the generation of three-dimensional (3D) topographic models may in fact be affected by significant inaccuracies unless site-specific adaptations are implemented into the data collection and processing routines. In this paper, an ad hoc procedure to exploit high-resolution aerial photogrammetry for the multitemporal analysis of the unstable Sciara del Fuoco (SdF) slope at Stromboli Island (Italy) is presented. Use of the technique is inherently problematic because of the homogeneous aspect of the gray ash slope, which prevents a straightforward identification of match points in continuous frames. Moreover, due to site accessibility restrictions enforced by local authorities after the volcanic paroxysm in July 2019, Ground Control Points (GCPs) cannot be positioned to constrain georeferencing. Therefore, all 3D point clouds were georeferenced using GCPs acquired in a 2019 (pre-paroxysm) survey, together with stable Virtual Ground Control Points (VGCPs) belonging to a LiDAR survey carried out in 2012. Alignment refinement was then performed by means of an iterative algorithm based on the closest points. The procedure succeeded in correctly georeferencing six high-resolution point clouds acquired from April 2017 to July 2021, whose time-focused analysis made it possible to track several geomorphological structures associated with the continued volcanic activity. The procedure can be further extended to smaller-scale analyses such as the estimation of locally eroded/accumulated volumes and pave the way for rapid UAV-based georeferenced surveys in emergency conditions at the SdF. Full article
Show Figures

Figure 1

21 pages, 6360 KiB  
Article
Runoff Estimation in the Upper Reaches of the Heihe River Using an LSTM Model with Remote Sensing Data
by Huazhu Xue, Jie Liu, Guotao Dong, Chenchen Zhang and Dao Jia
Remote Sens. 2022, 14(10), 2488; https://0-doi-org.brum.beds.ac.uk/10.3390/rs14102488 - 23 May 2022
Cited by 3 | Viewed by 2160
Abstract
Runoff estimations play an important role in water resource planning and management. Many accomplishments have been made in runoff estimations based on data recorded at meteorological stations; however, the advantages of the use of remotely sensed data in estimating runoff in watersheds for [...] Read more.
Runoff estimations play an important role in water resource planning and management. Many accomplishments have been made in runoff estimations based on data recorded at meteorological stations; however, the advantages of the use of remotely sensed data in estimating runoff in watersheds for which data are lacking remain to be investigated. In this study, the MOD13A2 normalized difference vegetation index (NDVI), TRMM3B43 precipitation (P), MOD11A2 land–surface temperature (LST), MOD16A2 evapotranspiration (ET) and hydrological station data were used as data sources with which to estimate the monthly runoff through the application of a fully connected long short–term memory (LSTM) model in the upstream reach of the Heihe River basin in China from 2001 to 2016. The results showed that inputting multiple remote sensing parameters improved the quality of runoff estimation compared to the use of rain gauge observations; an increase in R2 from 0.91 to 0.94 was observed from the implementation of this process, and Nash–Sutcliffe efficiency (NSE) showed an improvement from 0.89 to 0.93. The incorporation of rain gauge data as well as satellite data provided a slight improvement in estimating runoff with a respective R2 value of 0.95 and NSE value of 0.94. This indicates that the LSTM model based on remote sensing data has great potential for runoff estimation, and data obtained by remote sensing technology provide an alternative approach for estimating runoff in areas for which available data are lacking. Full article
(This article belongs to the Special Issue Remote Sensing for Streamflow Simulation II)
Show Figures

Figure 1

15 pages, 6550 KiB  
Article
QuikSCAT Climatological Data Record: Land Contamination Flagging and Correction
by Alexander G. Fore, Bryan W. Stiles, Paul Ted Strub and Richard D. West
Remote Sens. 2022, 14(10), 2487; https://0-doi-org.brum.beds.ac.uk/10.3390/rs14102487 - 23 May 2022
Cited by 1 | Viewed by 1438
Abstract
We develop, utilize, and validate techniques to produce a global data set of accurate coastal ocean surface vector winds. The dataset extends as near to the coast as 5 km and includes 10 years of SeaWinds on QuikSCAT ocean scatterometer data obtained from [...] Read more.
We develop, utilize, and validate techniques to produce a global data set of accurate coastal ocean surface vector winds. The dataset extends as near to the coast as 5 km and includes 10 years of SeaWinds on QuikSCAT ocean scatterometer data obtained from 1999 to 2009. We demonstrate improved retrievals over other large land-locked bodies of water as well, such as the Caspian Sea and the Great lakes. To determine the coastal winds we quantify the extent of land contamination in each scatterometer backscatter measurement and to the extent possible remove that contamination. After the measurements are thus corrected we retrieve winds with the corrected measurements using a previously published algorithm which has been extensively used for JPL scatterometer wind products. The coastal processing vastly increases the number of wind vector cells near coasts. We have ten times the number of wind vectors within 10 km of coast as without coastal processing, and over twice as many at 20 km from coast. These new wind vectors are high-quality, and have zero effect on non-coastal wind vectors. The effect of residual land contamination is quantified by comparing to buoys at varying distance from the coast and comparing coastal wind vector cells to oceanward neighbors. We show that the non-coastal QuikSCAT processing has very few good wind vectors nearer to the coast than about 22.5 km. In comparison to buoys, and oceanward neighbors, we find a small increase in speed errors of these new coastal wind vectors versus the performance of non-coastal QuikSCAT at 22.5 km, indicating the high-quality of these new coastal wind vectors. A quality control scheme is employed that flags regions where the coastal wind retrieval is poor due to the assumptions inherent in the technique being locally invalid. The coastal winds retrieved in this manner have been publicly distributed to the oceanography community and utilized in other published works. Full article
(This article belongs to the Special Issue Remote Sensing of Ocean Surface Winds)
Show Figures

Figure 1

26 pages, 7859 KiB  
Review
The Development of Frequency Multipliers for Terahertz Remote Sensing System
by Yong Zhang, Chengkai Wu, Xiaoyu Liu, Li Wang, Chunyue Dai, Jianhang Cui, Yukun Li and Nicholas Kinar
Remote Sens. 2022, 14(10), 2486; https://0-doi-org.brum.beds.ac.uk/10.3390/rs14102486 - 23 May 2022
Cited by 6 | Viewed by 3153
Abstract
This paper summarizes the development of novel Schottky-diode-based terahertz frequency multipliers. The basic structure and manufacturing process of planar Schottky barrier diodes (SBDs) are reviewed, along with other diode structures that have been proposed in the literature. A numerical modeling method for the [...] Read more.
This paper summarizes the development of novel Schottky-diode-based terahertz frequency multipliers. The basic structure and manufacturing process of planar Schottky barrier diodes (SBDs) are reviewed, along with other diode structures that have been proposed in the literature. A numerical modeling method for the novel diodes in the context of terahertz frequency multipliers is presented, which includes 3D electromagnetic (EM) modeling, electro-thermal modeling and modeling of physical non-ideal effects. Furthermore, a general design methodology for developing terahertz frequency multipliers is introduced, involving a sub-division design method (SDM), a global design method (GDM) and a half-sub-division and half-global design method (HS-HGDM). These methods are summarized and compared for 110 GHz and 220 GHz frequency multipliers in the context of communication and imaging applications. Laboratory measurements of these multipliers show good agreement with numerical simulations. Finally, several classic terahertz remote sensing systems are reviewed, and a 220 GHz remote sensing system established using novel frequency multipliers for security inspection purposes is presented along with associated imaging results. Full article
Show Figures

Graphical abstract

20 pages, 7744 KiB  
Article
The Relative Roles of Climate Variation and Human Activities in Vegetation Dynamics in Coastal China from 2000 to 2019
by Honglei Jiang, Xia Xu, Tong Zhang, Haoyu Xia, Yiqin Huang and Shirong Qiao
Remote Sens. 2022, 14(10), 2485; https://0-doi-org.brum.beds.ac.uk/10.3390/rs14102485 - 22 May 2022
Cited by 7 | Viewed by 2330
Abstract
Vegetation in the terrestrial ecosystem, sensitive to climate change and human activities, exerts a crucial influence on the carbon cycles in land, ocean, and atmosphere. Discrimination between climate and human-induced vegetation dynamics is advocated but still limited, especially in coastal China, which is [...] Read more.
Vegetation in the terrestrial ecosystem, sensitive to climate change and human activities, exerts a crucial influence on the carbon cycles in land, ocean, and atmosphere. Discrimination between climate and human-induced vegetation dynamics is advocated but still limited, especially in coastal China, which is characterized by a developed economy, a large population, and high food production, but also by unprecedented climate change and warming. Taking coastal China as the research area, our study used the normalized difference vegetation index (NDVI) in growing seasons, as well as precipitation, temperature, and sunlight hours datasets, adopted residual trend analysis at pixel and regional scales in coastal China from 2000–2019 and aims to (1) delineate the patterns and processes of vegetation changes, and (2) separate the relative contributions of climate and human activities by adopting residual trend analysis. The results indicated that (1) coastal China experienced the most vegetation greening (83.04% of the whole region) and partial degradation (16.86% of the whole region) with significant spatial heterogeneity; (2) compared with climate change, human activities have a greater positive impact on NDVI, and the regions were mainly located in the north of the North China Plain and the south of southern China; (3) the relative contribution rates of climate change and human activities were detected to be 0–60% and 60–100%, respectively; (4) in the northern coastal areas, the improvement of cultivated land management greatly promoted the greening of vegetation and thus the increase of grain yield, while in southern coastal areas, afforestation and the restoration of degraded forest were responsible for vegetation restoration; and (5) similar results obtained by partial correlation between nighttime lights and NDVI indicated the reliability of the residual trend analysis. The linear relationships of precipitation, temperature, and radiation on NDVI may limit the accurate estimation of climate drivers on vegetation, and further ecosystem process-modeling approaches can be used to estimate the relative contribution of climate change and human activities. The findings in our research emphasized that the attribution for vegetation dynamics with heterogeneity can provide evidence for the designation of rational ecological conservation policies. Full article
Show Figures

Graphical abstract

17 pages, 2680 KiB  
Article
Divergent Climate Sensitivities of the Alpine Grasslands to Early Growing Season Precipitation on the Tibetan Plateau
by Zhipeng Wang, Xianzhou Zhang, Ben Niu, Yunpu Zheng, Yongtao He, Yanan Cao, Yunfei Feng and Jianshuang Wu
Remote Sens. 2022, 14(10), 2484; https://0-doi-org.brum.beds.ac.uk/10.3390/rs14102484 - 22 May 2022
Cited by 6 | Viewed by 2034
Abstract
Warming is expected to intensify hydrological processes and reshape precipitation regimes, which is closely related to water availability for terrestrial ecosystems. Effects of the inter-annual precipitation changes on plant growth are widely concerned. However, it is not well-known how plant growth responds to [...] Read more.
Warming is expected to intensify hydrological processes and reshape precipitation regimes, which is closely related to water availability for terrestrial ecosystems. Effects of the inter-annual precipitation changes on plant growth are widely concerned. However, it is not well-known how plant growth responds to intra-annual precipitation regime changes. Here, we compiled reanalysis climate data (ERA5) and four satellite-based vegetation indices, including the Normalized Difference Vegetation Index (NDVI), the Enhanced Vegetation Index (EVI), the Solar-induced Chlorophyll Fluorescence (SIF), and the Modified Triangular Vegetation Index (MTVI2), to evaluate the response of alpine grasslands (including alpine meadow and alpine steppe) to the change of precipitation regimes, especially to the intra-annual precipitation regimes on the Tibetan Plateau. We found monthly precipitation over the alpine steppe significantly increased in the growing season (May–September), but precipitation over the alpine meadow significantly increased only in the early growing season (May–June) (MJP) during the past four decades (1979–2019). The inter-annual plant growth (vegetation indices changes) on the alpine meadow was dominated by temperature, but it was driven by precipitation for the alpine steppe. On the intra-annual scale, the temperature sensitivity of the vegetation indices generally decreased but precipitation sensitivity increased during the growing season for both the alpine meadow and steppe. In response to the increase in MJP, we found the temperature sensitivity of the vegetation indices during the mid-growing season (July–August) (MGNDVI, MGEVI, MGSIF, and MGMTVI2) in the alpine meadow significantly increased (p < 0.01) while its precipitation sensitivity significantly decreased (p < 0.01). We infer that more MJP over the meadow may be the result of enhanced evapotranspiration, which is at the expense of soil moisture and even induces soil “drought” in the early growing season. This may be to elevate community water acquisition capacity through altering root mass allocation and community composition, consequently regulating the divergent climate sensitivities of vegetation growth in the mid-growing season. Our findings highlight that it is inadequate to regard precipitation as an indicator of water availability conditions for plant growth, which may limit our understanding of the response and acclimatization of plants to climate change. Full article
Show Figures

Graphical abstract

17 pages, 2531 KiB  
Article
Pair-Wise Similarity Knowledge Distillation for RSI Scene Classification
by Haoran Zhao, Xin Sun, Feng Gao and Junyu Dong
Remote Sens. 2022, 14(10), 2483; https://0-doi-org.brum.beds.ac.uk/10.3390/rs14102483 - 22 May 2022
Cited by 6 | Viewed by 1824
Abstract
Remote sensing image (RSI) scene classification aims to identify the semantic categories of remote sensing images based on their contents. Owing to the strong learning capability of deep convolutional neural networks (CNNs), RSI scene classification methods based on CNNs have drawn much attention [...] Read more.
Remote sensing image (RSI) scene classification aims to identify the semantic categories of remote sensing images based on their contents. Owing to the strong learning capability of deep convolutional neural networks (CNNs), RSI scene classification methods based on CNNs have drawn much attention and achieved remarkable performance. However, such outstanding deep neural networks are usually computationally expensive and time-consuming, making them impossible to apply on resource-constrained edge devices, such as the embedded systems used on drones. To tackle this problem, we introduce a novel pair-wise similarity knowledge distillation method, which could reduce the model complexity while maintaining satisfactory accuracy, to obtain a compact and efficient deep neural network for RSI scene classification. Different from the existing knowledge distillation methods, we design a novel distillation loss to transfer the valuable discriminative information, which could reduce the within-class variations and restrain the between-class similarity, from the cumbersome model to the compact model. This method could obtain the compact student model with higher performance compared with existing knowledge distillation methods in RSI scene classification. To be specific, we distill the probability outputs between sample pairs with the same label and match the probability outputs between the teacher and student models. Experiments on three public benchmark datasets for RSI scene classification, i.e., AID, UCMerced, and NWPU-RESISC datasets, verify that the proposed method could effectively distill the knowledge and result in a higher performance. Full article
(This article belongs to the Special Issue Pattern Recognition and Image Processing for Remote Sensing II)
Show Figures

Graphical abstract

25 pages, 6579 KiB  
Article
Evapotranspiration Seasonality over Tropical Ecosystems in Mato Grosso, Brazil
by Marcelo Sacardi Biudes, Hatim M. E. Geli, George Louis Vourlitis, Nadja Gomes Machado, Vagner Marques Pavão, Luiz Octávio Fabrício dos Santos and Carlos Alexandre Santos Querino
Remote Sens. 2022, 14(10), 2482; https://0-doi-org.brum.beds.ac.uk/10.3390/rs14102482 - 22 May 2022
Cited by 8 | Viewed by 2724
Abstract
Brazilian tropical ecosystems in the state of Mato Grosso have experienced significant land use and cover changes during the past few decades due to deforestation and wildfire. These changes can directly affect the mass and energy exchange near the surface and, consequently, evapotranspiration [...] Read more.
Brazilian tropical ecosystems in the state of Mato Grosso have experienced significant land use and cover changes during the past few decades due to deforestation and wildfire. These changes can directly affect the mass and energy exchange near the surface and, consequently, evapotranspiration (ET). Characterization of the seasonal patterns of ET can help in understanding how these tropical ecosystems function with a changing climate. The goal of this study was to characterize temporal (seasonal-to-decadal) and spatial patterns in ET over Mato Grosso using remotely sensed products. Ecosystems over areas with limited to no flux towers can be performed using remote sensing products such as NASA’s MOD16A2 ET (MOD16 ET). As the accuracy of this product in tropical ecosystems is unknown, a secondary objective of this study was to evaluate the ability of the MOD16 ET (ETMODIS) to appropriately represent the spatial and seasonal ET patterns in Mato Grosso, Brazil. Actual ET was measured (ETMeasured) using eight flux towers, three in the Amazon, three in the Cerrado, and two in the Pantanal of Mato Grosso. In general, the ETMODIS of all sites had no significant difference from ETMeasured during all analyzed periods, and ETMODIS had a significant moderate to strong correlation with the ETMeasured. The spatial variation of ET had some similarity to the climatology of Mato Grosso, with higher ET in the mid to southern parts of Mato Grosso (Cerrado and Pantanal) during the wet period compared to the dry period. The ET in the Amazon had three seasonal patterns, a higher and lower ET in the wet season compared to the dry season, and minimal to insignificant variation in ET during the wet and dry seasons. The wet season ET in Amazon decreased from the first and second decades, but the ET during the wet and dry season increased in Cerrado and Pantanal in the same period. This study highlights the importance of deepening the study of ET in the state of Mato Grosso due to the land cover and climate change. Full article
(This article belongs to the Section Environmental Remote Sensing)
Show Figures

Graphical abstract

25 pages, 6965 KiB  
Article
Flash Flood Risk Assessment and Mitigation in Digital-Era Governance Using Unmanned Aerial Vehicle and GIS Spatial Analyses Case Study: Small River Basins
by Ștefan Bilașco, Gheorghe-Gavrilă Hognogi, Sanda Roșca, Ana-Maria Pop, Vescan Iuliu, Ioan Fodorean, Alexandra-Camelia Marian-Potra and Paul Sestras
Remote Sens. 2022, 14(10), 2481; https://0-doi-org.brum.beds.ac.uk/10.3390/rs14102481 - 22 May 2022
Cited by 15 | Viewed by 3739
Abstract
Watercourses act like a magnet for human communities and were always a deciding factor when choosing settlements. The reverse of these services is a potential hazard in the form of flash flooding, for which human society has various management strategies. These strategies prove [...] Read more.
Watercourses act like a magnet for human communities and were always a deciding factor when choosing settlements. The reverse of these services is a potential hazard in the form of flash flooding, for which human society has various management strategies. These strategies prove to be increasingly necessary in the context of increased anthropic pressure on the floodable areas. One of these strategies, Strategic Flood Management (SFM), a continuous cycle of planning, acting, monitoring, reviewing and adapting, seems to have better chances to succeed than other previous strategies, in the context of the Digital-Era Governance (DEG). These derive, among others, from the technological and methodological advantages of DEG. Geographic Information Systems (GIS) and Unmanned Aerial Vehicles (UAV) stand out among the most revolutionary tools for data acquisition and processing of data in the last decade, both in qualitative and quantitative terms. In this context, this study presents a hybrid risk assessment methodology for buildings in case of floods. The methodology is based on detailed information on the terrestrial surface—digital surface model (DSM) and measurements of the last historical flash flood level (occurred on 20 June 2012)—that enabled post-flood peak discharge estimation. Based on this methodology, two other parameters were calculated together with water height (depth): shear stress and velocity. These calculations enabled the modelling of the hazard and risk map, taking into account the objective value of buildings. The two components were integrated in a portal available for the authorities and inhabitants. Both the methodology and the portal are perfectible, but the value of this material consists of the detailing and replicability potential of the data that can be made available to administration and local community. Conceptually, the following are relevant (a) the framing of the SFM concept in the DEG framework and (b) the possibility to highlight the involvement and contribution of the citizens in mapping the risks and their adaptation to climate changes. The subsequent version of the portal is thus improved by further contributions and the participatory approach of the citizens. Full article
(This article belongs to the Topic Natural Hazards and Disaster Risks Reduction)
Show Figures

Figure 1

17 pages, 6237 KiB  
Article
Development and Evaluation of a Real-Time Hourly One-Kilometre Gridded Multisource Fusion Air Temperature Dataset in China Based on Remote Sensing DEM
by Shuai Han, Chunxiang Shi, Shuai Sun, Junxia Gu, Bin Xu, Zhihong Liao, Yu Zhang and Yanqin Xu
Remote Sens. 2022, 14(10), 2480; https://0-doi-org.brum.beds.ac.uk/10.3390/rs14102480 - 22 May 2022
Cited by 4 | Viewed by 1736
Abstract
High-resolution gridded 2 m air temperature datasets are important input data for global and regional climate change studies, agrohydrologic model simulations and numerical weather predictions, etc. In this study, the digital elevation model (DEM) is used to correct temperature forecasts produced by ECMWF. [...] Read more.
High-resolution gridded 2 m air temperature datasets are important input data for global and regional climate change studies, agrohydrologic model simulations and numerical weather predictions, etc. In this study, the digital elevation model (DEM) is used to correct temperature forecasts produced by ECMWF. The multi-grid variation formulation method is then used to fuse the data from corrected temperature forecasts and ground automatic station observations. The fused dataset covers the area over (0–60°N, 70–140°S), where different underlying surfaces exist, such as plains, basins, plateaus, and mountains. The spatial and temporal resolutions are 1 km and 1 h, respectively. The comparison of the fusion data with the verification observations, including 2400 weather stations, indicates that the accuracy of the gridded temperature is superior to European Centre for Medium-Range Weather Forecasts (ECMWF) data. This is because a more significant number of stations and high-resolution terrain data are used to generate the fusion data than are utilized in the ECMWF. The obtained dataset can describe the temperature feature of peaks and valleys more precisely. Due to its continuous temporal coverage and consistent quality, the fusion dataset is one of China’s most widely used temperature datasets. However, data uncertainty will increase for areas with sparse observations and high mountains, and we must be cautious when using data from these areas. Full article
(This article belongs to the Special Issue Environmental Health Diagnosis Based on Remote Sensing)
Show Figures

Graphical abstract

Previous Issue
Next Issue
Back to TopTop