Article

Source Apportionment of Heavy Metal Contamination in Urban-Agricultural-Aquacultural Soils near the Bohai Bay Coast, Using Land-Use Classification and Google Satellite Tracing

1
Geomathematics Key Laboratory of Sichuan Province, College of Mathematics and Physics, Chengdu Technological University, Chengdu 610059, China
2
China Geological Survey Shengyang Center, Shengyang 110034, China
3
Aerospace Information Research Institute, Chinese Academy of Sciences, Beijing 100094, China
*
Author to whom correspondence should be addressed.
Remote Sens. 2022, 14(10), 2436; https://0-doi-org.brum.beds.ac.uk/10.3390/rs14102436
Submission received: 31 March 2022 / Revised: 5 May 2022 / Accepted: 14 May 2022 / Published: 19 May 2022

Abstract

:
Heavy metal concentrations of Cd, As, Pb, Cu, Cr, and Hg were investigated for 86 soil samples in Jinzhou near the Bohai Sea in China, in order to identify what anthropological activities influenced their distribution levels. Ordinary cokriging (OCK) was utilized to map six heavy-metal distributions by incorporating their main environmental influencers. The resultant p values for the six OCK mapping models of 0–2.78% indicated good statistical significance of the models, and the relative mean absolute errors of 4.82–12.53% and relative root mean square errors of 6.23–18.21% indicated allowable predication precision for their concentrations. The contamination distributions by OCK mapping were then graded based on the standards of the China National Environmental Monitoring Center and the Chinese Environmental Protection Administration, which showed that Cu and As contaminations in parts of this area were over the natural level but not polluted, Cr contamination was omnipresent over the natural level in this area and even reached the polluted level in parts of this area. The graded contamination maps that were overlapped with land-use maps and Google satellite maps, as well as the verifications reported in literatures, enabled correlations of the different contamination levels of As, Cu, and Cr with human activities. Resultantly, it indicated that As and Cu contamination over the natural level may be related to agricultural planting and aquacultural activities along the coast of Bohai Bay, with the contaminants transported via watercourses; Cr contamination over the natural level may have been due to vehicle emissions; and, Cr pollution may have been from steel manufacturing and geochemical factories

Graphical Abstract

1. Introduction

Heavy metals generally refer to metals with densities greater than 5 g/cm3 such as cadmium (Cd), mercury (Hg), chromium (Cr), copper (Cu), and lead (Pb), and metalloids such as arsenic (As) due to their similarities in chemical properties and environmental behavior [1,2,3]. The potential public health risk associated with the intake of these heavy metals from soil has received particular attention in recent years, because heavy metals in soil can be easily transferred into the human body via food and water chains. Exposure to these heavy metals is a great health risk. For example, chronic exposure to Cd can have adverse effects such as lung cancer, pulmonary adenocarcinomas, prostatic proliferative lesions, bone fractures, kidney dysfunction, and hypertension [4,5]; the inhalation of Hg can produce harmful effects on the nervous, digestive, and immune systems, and in lungs and in kidneys [4,5]; the exposure to high-concentration Cr may cause nasal and lung cancers, nose and skin ulcers, and weakened immune systems [6]; the toxicity of Cu can change the function of the human central nervous system and respiratory system, and disrupt the endocrine system [7]; excessive intake of Pb can damage the nervous, skeletal, circulatory, enzymatic, endocrine, and immune systems of those exposed to it [8]; a chronic effect of As consists of dermal lesions, peripheral neuropathy, skin cancer, and peripheral vascular disease [5,8].
Heavy metal contamination in urban soils is a great risk to urban inhabitants because of its numerous sources, toxicity, nonbiodegradable properties, and accumulation [1,9]. Although heavy metals can exist naturally in soil, numerous studies have shown that environmental sources of heavy metals are mainly anthropogenic, e.g., agriculture, aquaculture, coal and fuel combustion, chemical industries, vehicle emissions, mining, and municipal waste disposal [1,10,11,12,13,14,15,16]. China’s rapid industrialization and urbanization in the last two decades and the potential public health risk associated with the intake of those heavy metals from soil have received increasing attention from governments and regulatory bodies [9,15,17,18,19,20,21,22].
Different types of land use relate to different anthropogenic activities, which can be used to apportion pollution sources. Qu et al. [23] pointed out that the impact of human activities on soil moisture is gradually increasing these days and strictly speaking human input is closely associated with the land-use type. Especially with the popularization of remote sensing technology, land-use types are relatively easy and inexpensive to obtain and thus may also be valuable information for high-precision source apportionment of soil heavy metal contamination over large areas. Furthermore, the higher-spatial-resolution and real-time locating and tracing technologies of Google satellite maps can help to distinguish more specific pollution sources. In the literature on heavy metal spatial distributions and contamination evaluations [1,3,24,25,26,27,28,29,30], geostatistical methods with variography and kriging were widely used. This is because, unlike other interpolation methods, kriging series incorporates the spatial correlation between unsampled and sampled locations. Furthermore, compared to those univariate geostatistical methods (e.g., ordinary kriging, simple kriging, universal kriging, and indicator kriging), cokriging as a multivariate geostatistical method can process auxiliary information from environmental factors and account for both autocorrelations and cross-correlations among all involved variables—including target and predictor variables—and thus increase estimation accuracy at the spatial locations of interest [31,32]. Finally, compared to universal cokriging (UCK), ordinary cokriging (OCK) satisfies the stationarity that allows us to assume the same degree of variation from place to place [33]; compared to simple cokriging (SCK), OCK does not require the known expected values of variables in the study area that is thus more useful due to its weaker assumption. Also, Zeng et al. [1] pointed out that determining auxiliary variables for mapping different target heavy metals by the OCK technique should quantitatively associate the correlation coefficients of those metals with environmental factors.

2. Background

Jinzhou City, and especially its county, Linghai, which are adjacent to the Bohai Sea, is rich in aquaculture, fishing industries, and agriculture. Also, Jinzhou supplies abundant aquacultural and agricultural products to its neighboring cities. Therefore, the health of the ecosystem in this city is a grave concern. The purposes of this study were (1) to map the distributions of six heavy metals (Cd, As, Hg, Cr, Cu, and Pb) in the Jinzhou City study area, (2) to grade the contamination level for each heavy metal distribution, and (3) to trace and locate the sources of the heavy metal contamination. The technologies and the methods adopted in this study were (1) outlier detection and treatment to clean the sampling data to guarantee its effectiveness in Pearson analyses and OCK mapping, (2) the determination of auxiliary factors in OCK mapping according to their quantitative effects on soil heavy metals, as used in Zeng et al. [1], and (3) overlapping contamination distribution maps, land-use maps, and Google satellite maps to correlate the contamination distribution levels of different heavy metals with different human activities.

3. Materials and Methods
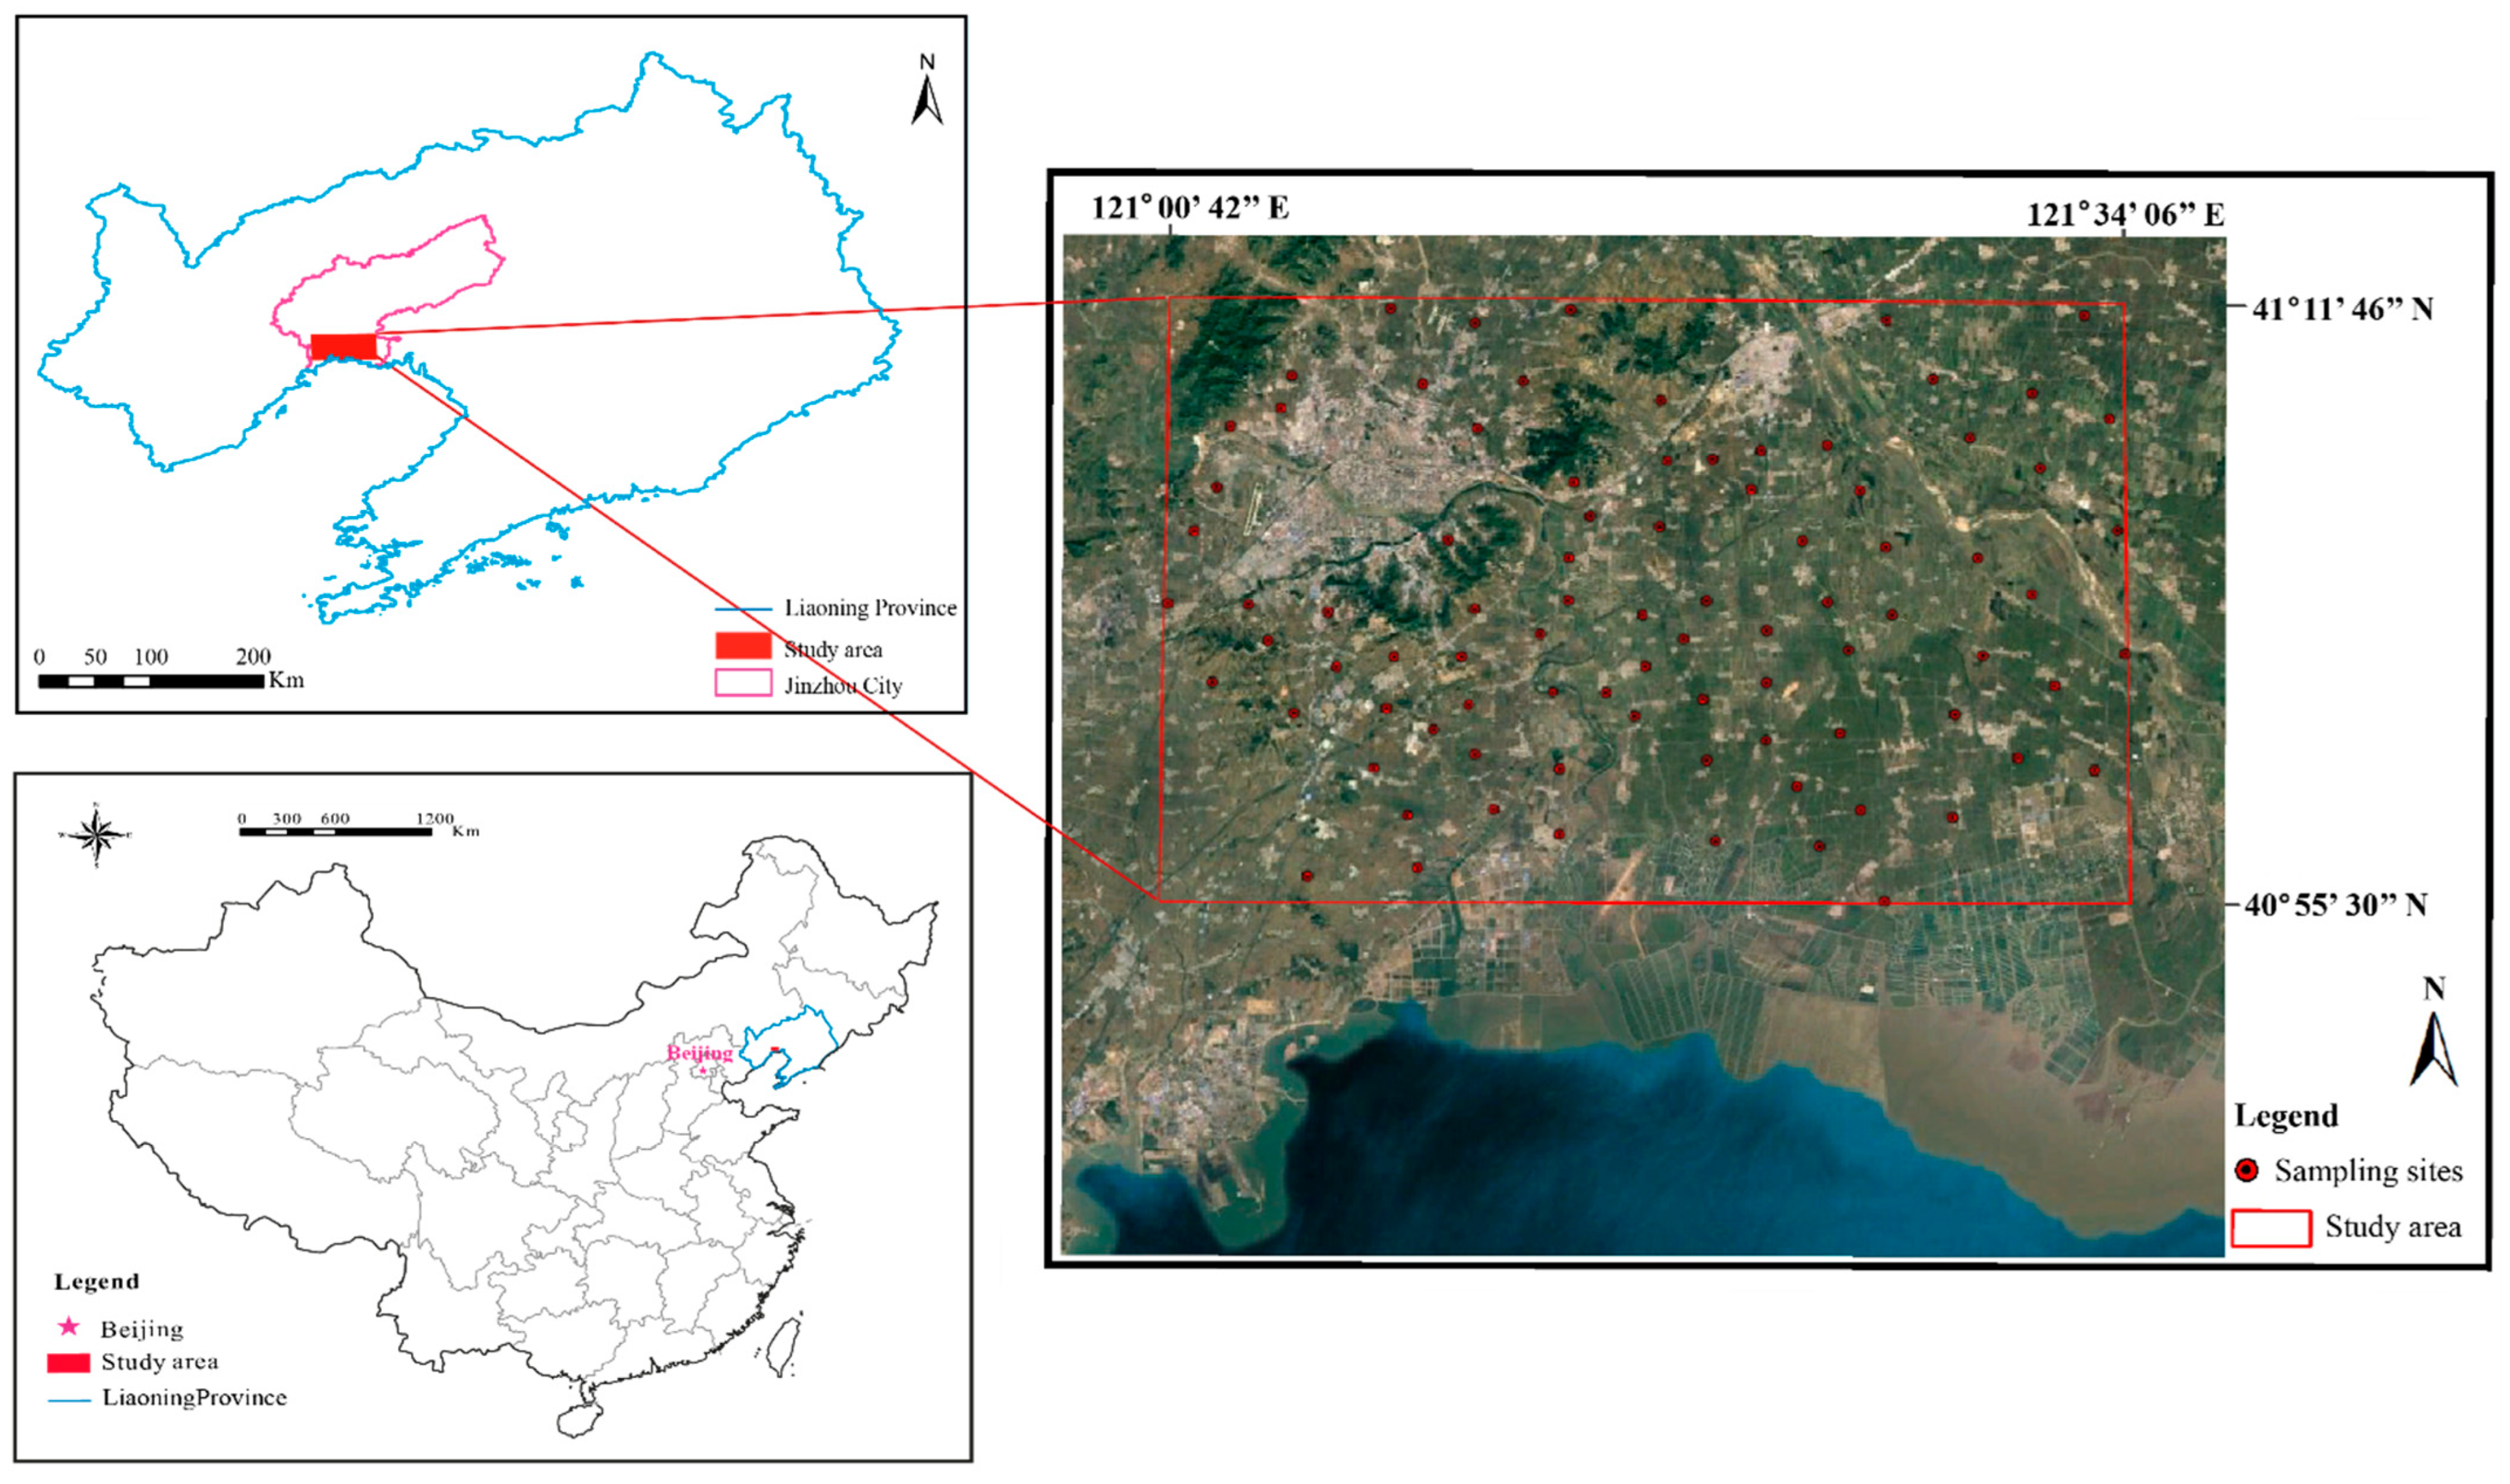
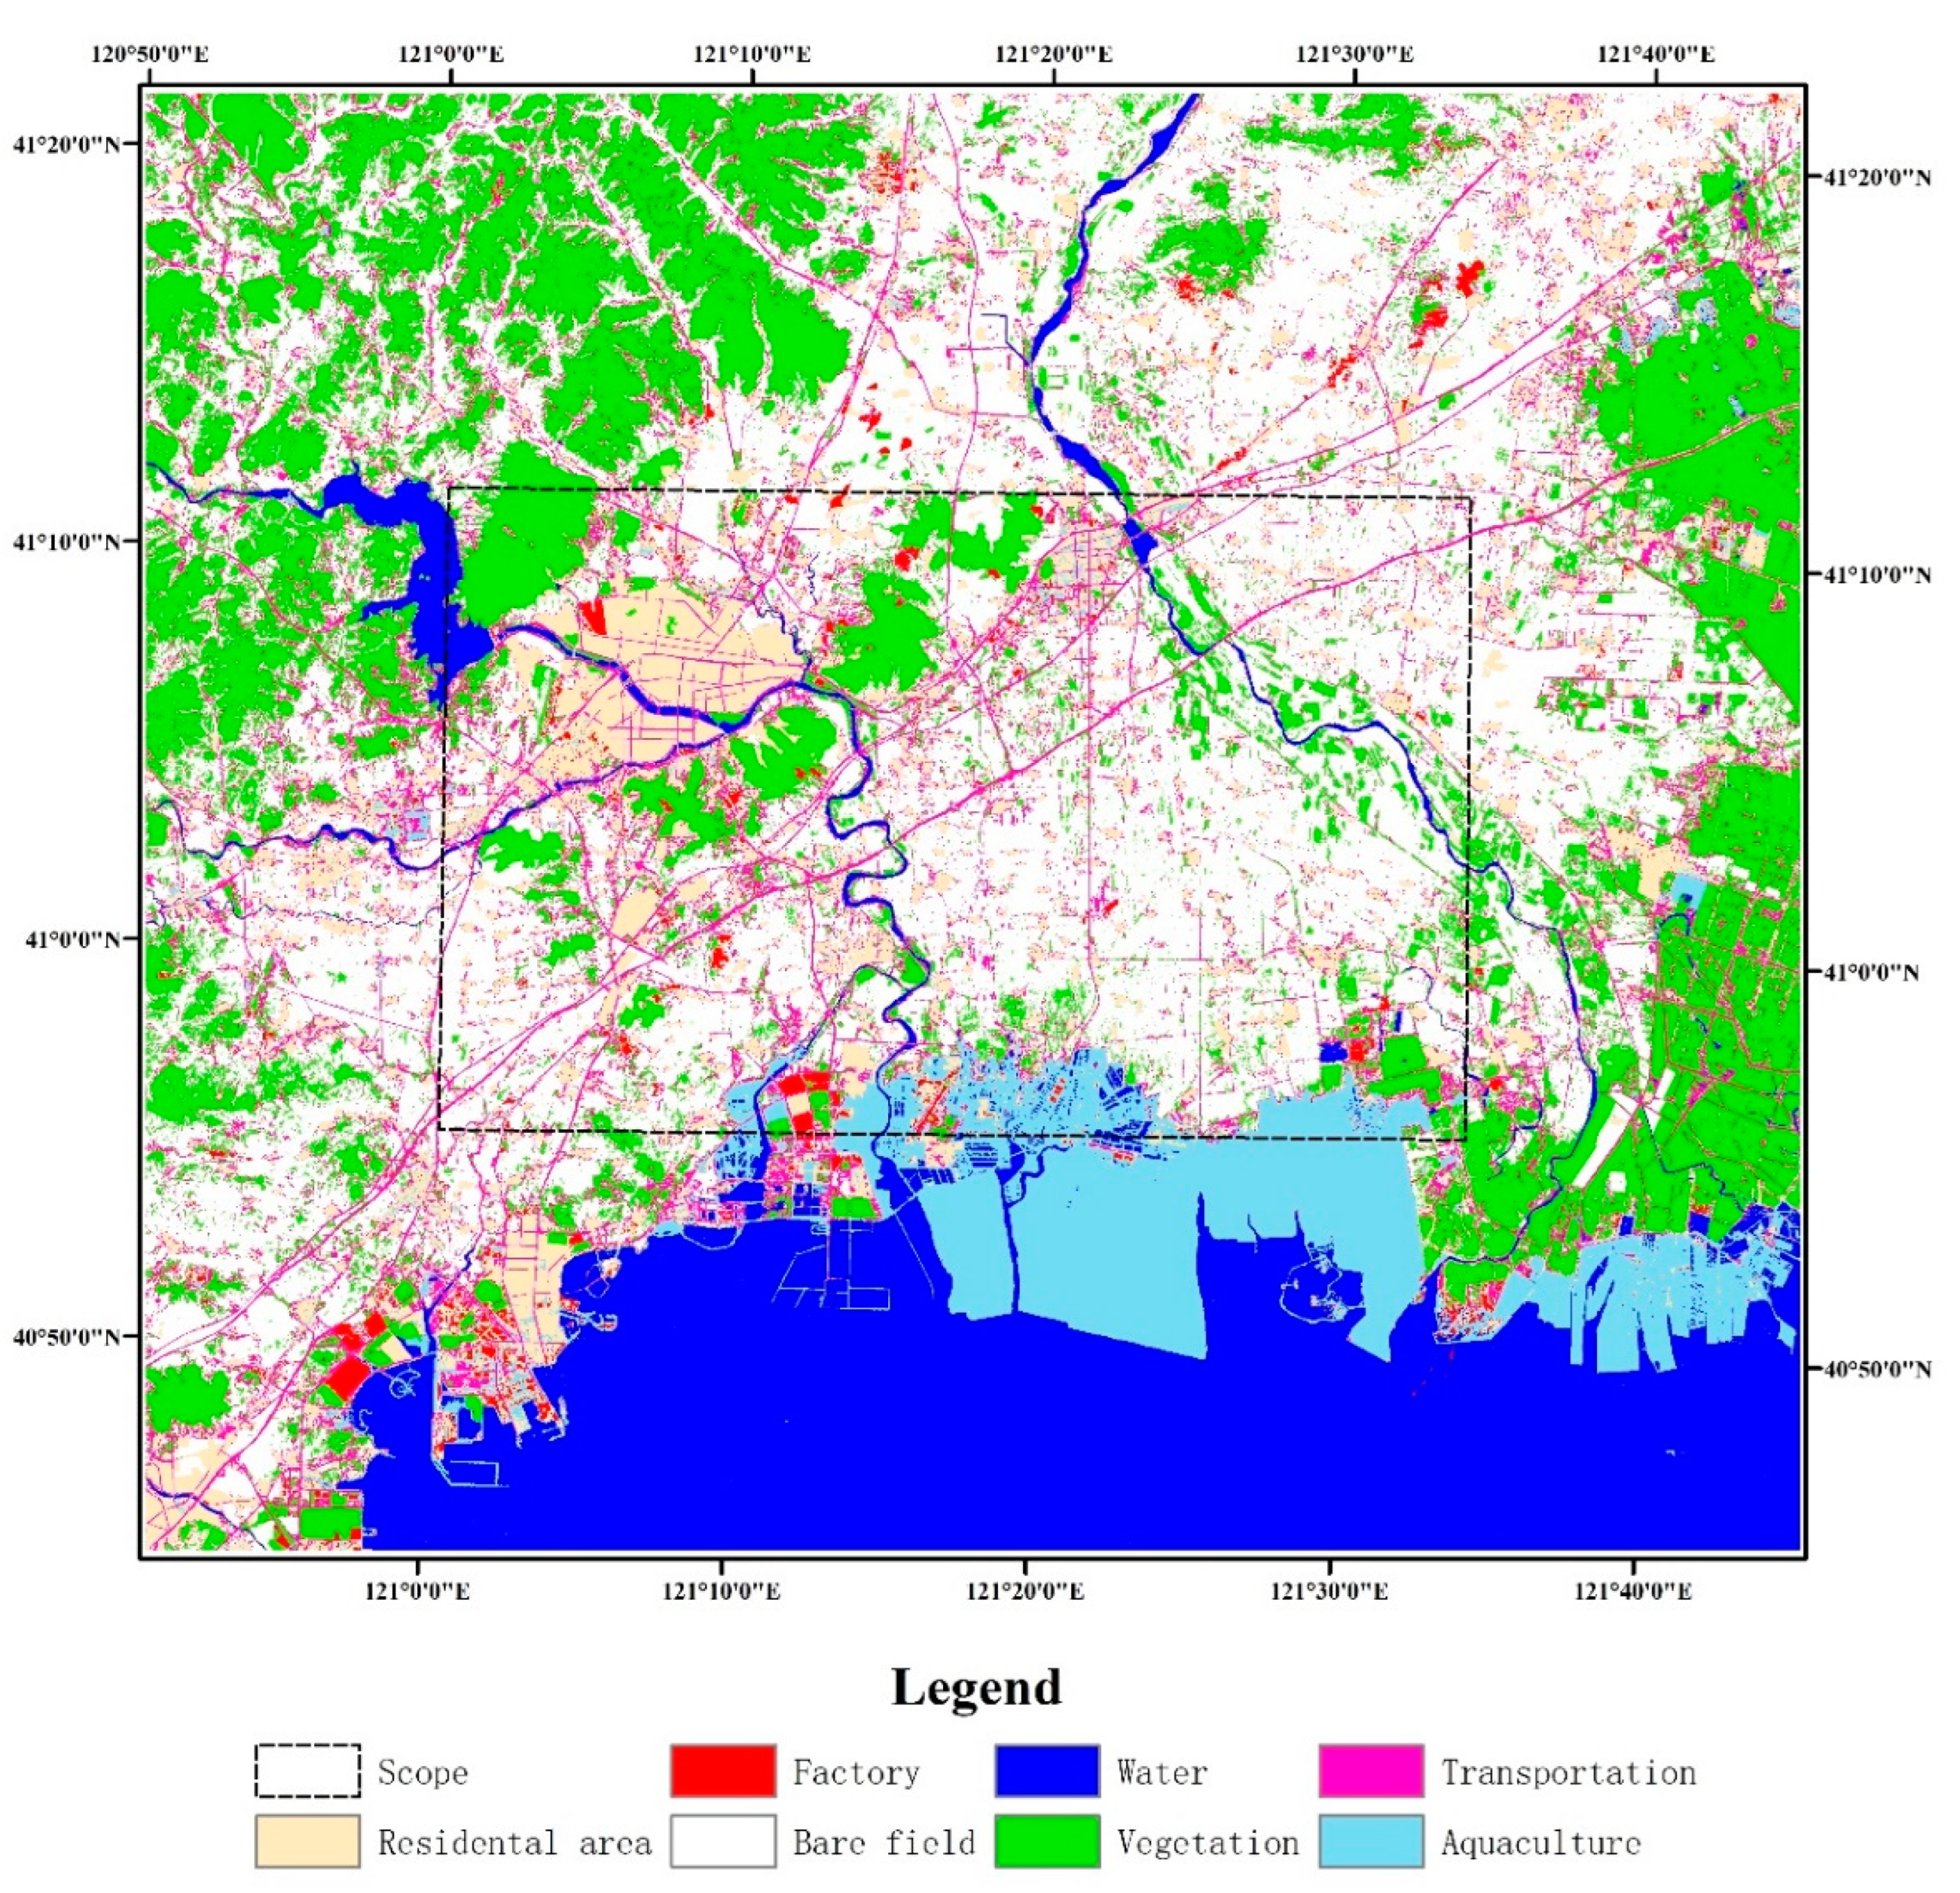
3.1. Study Area

The study area in red in Figure 1 is an urban and agricultural- and aquacultural-cultivation area of Jinzhou, Liaoning Province, which ranges from latitude 40°55′N to 41°12′N and from longitude 121°00′E to 121°34′E. This area covers a region of 1381 km2. In the south of the study area are tillage and aquaculture farms, and in the north are residences and industries (Figure 1).

3.2. Soil Sampling and Chemical Analysis

Soil samples were collected by the Shenyang Center of the China Geological Survey. The irregular network point method was used for collecting samples because of the buildings, infrastructure, water, roads, and other obstacles like them in the study area. The geographic coordinates of the sampling sites were recorded using a global positioning system. Generally speaking, the subsamples were first collected every 0.8 to 1 km, and each sample was a mixture of two to five neighboring subsamples. Therefore, the distances between two samples ranged from approximately 1.6–5 km. Subsamples were soil 0 to 20 cm deep and taken within a radius of 1 m. After stones and other debris were removed, the soil samples were air-dried at ambient temperatures, passed through a 0.8-mm sieve, and then vacuum sealed. A total of 86 samples from the study area were analyzed for six heavy metals (Cd, As, Hg, Cr, Cu, and Pb) and these soil properties: available K (AK), available P (AP), available N (AN), C, S, Fe2O3, K2O, and MgO. The analyses, conducted in the Analysis and Testing Center, China University of Geosciences (Wuhan), determined the mean values and ranges of their concentrations. Statistics on the results of the analysis and the analytical techniques are listed in Table 1.

3.3. Soil Data Preprocessing

The data preprocessing included the detection and the treatment of outliers and normality. In geochemical sampling and analyses, both random and systematic errors commonly occur, producing outliers in the sampling datasets. Outlier detection and treatment are important in geochemistry applications. Moreover, most statistical analyses (e.g., Pearson and kriging) require normality in the data structure, or at least require that the data can be transformed to normality.

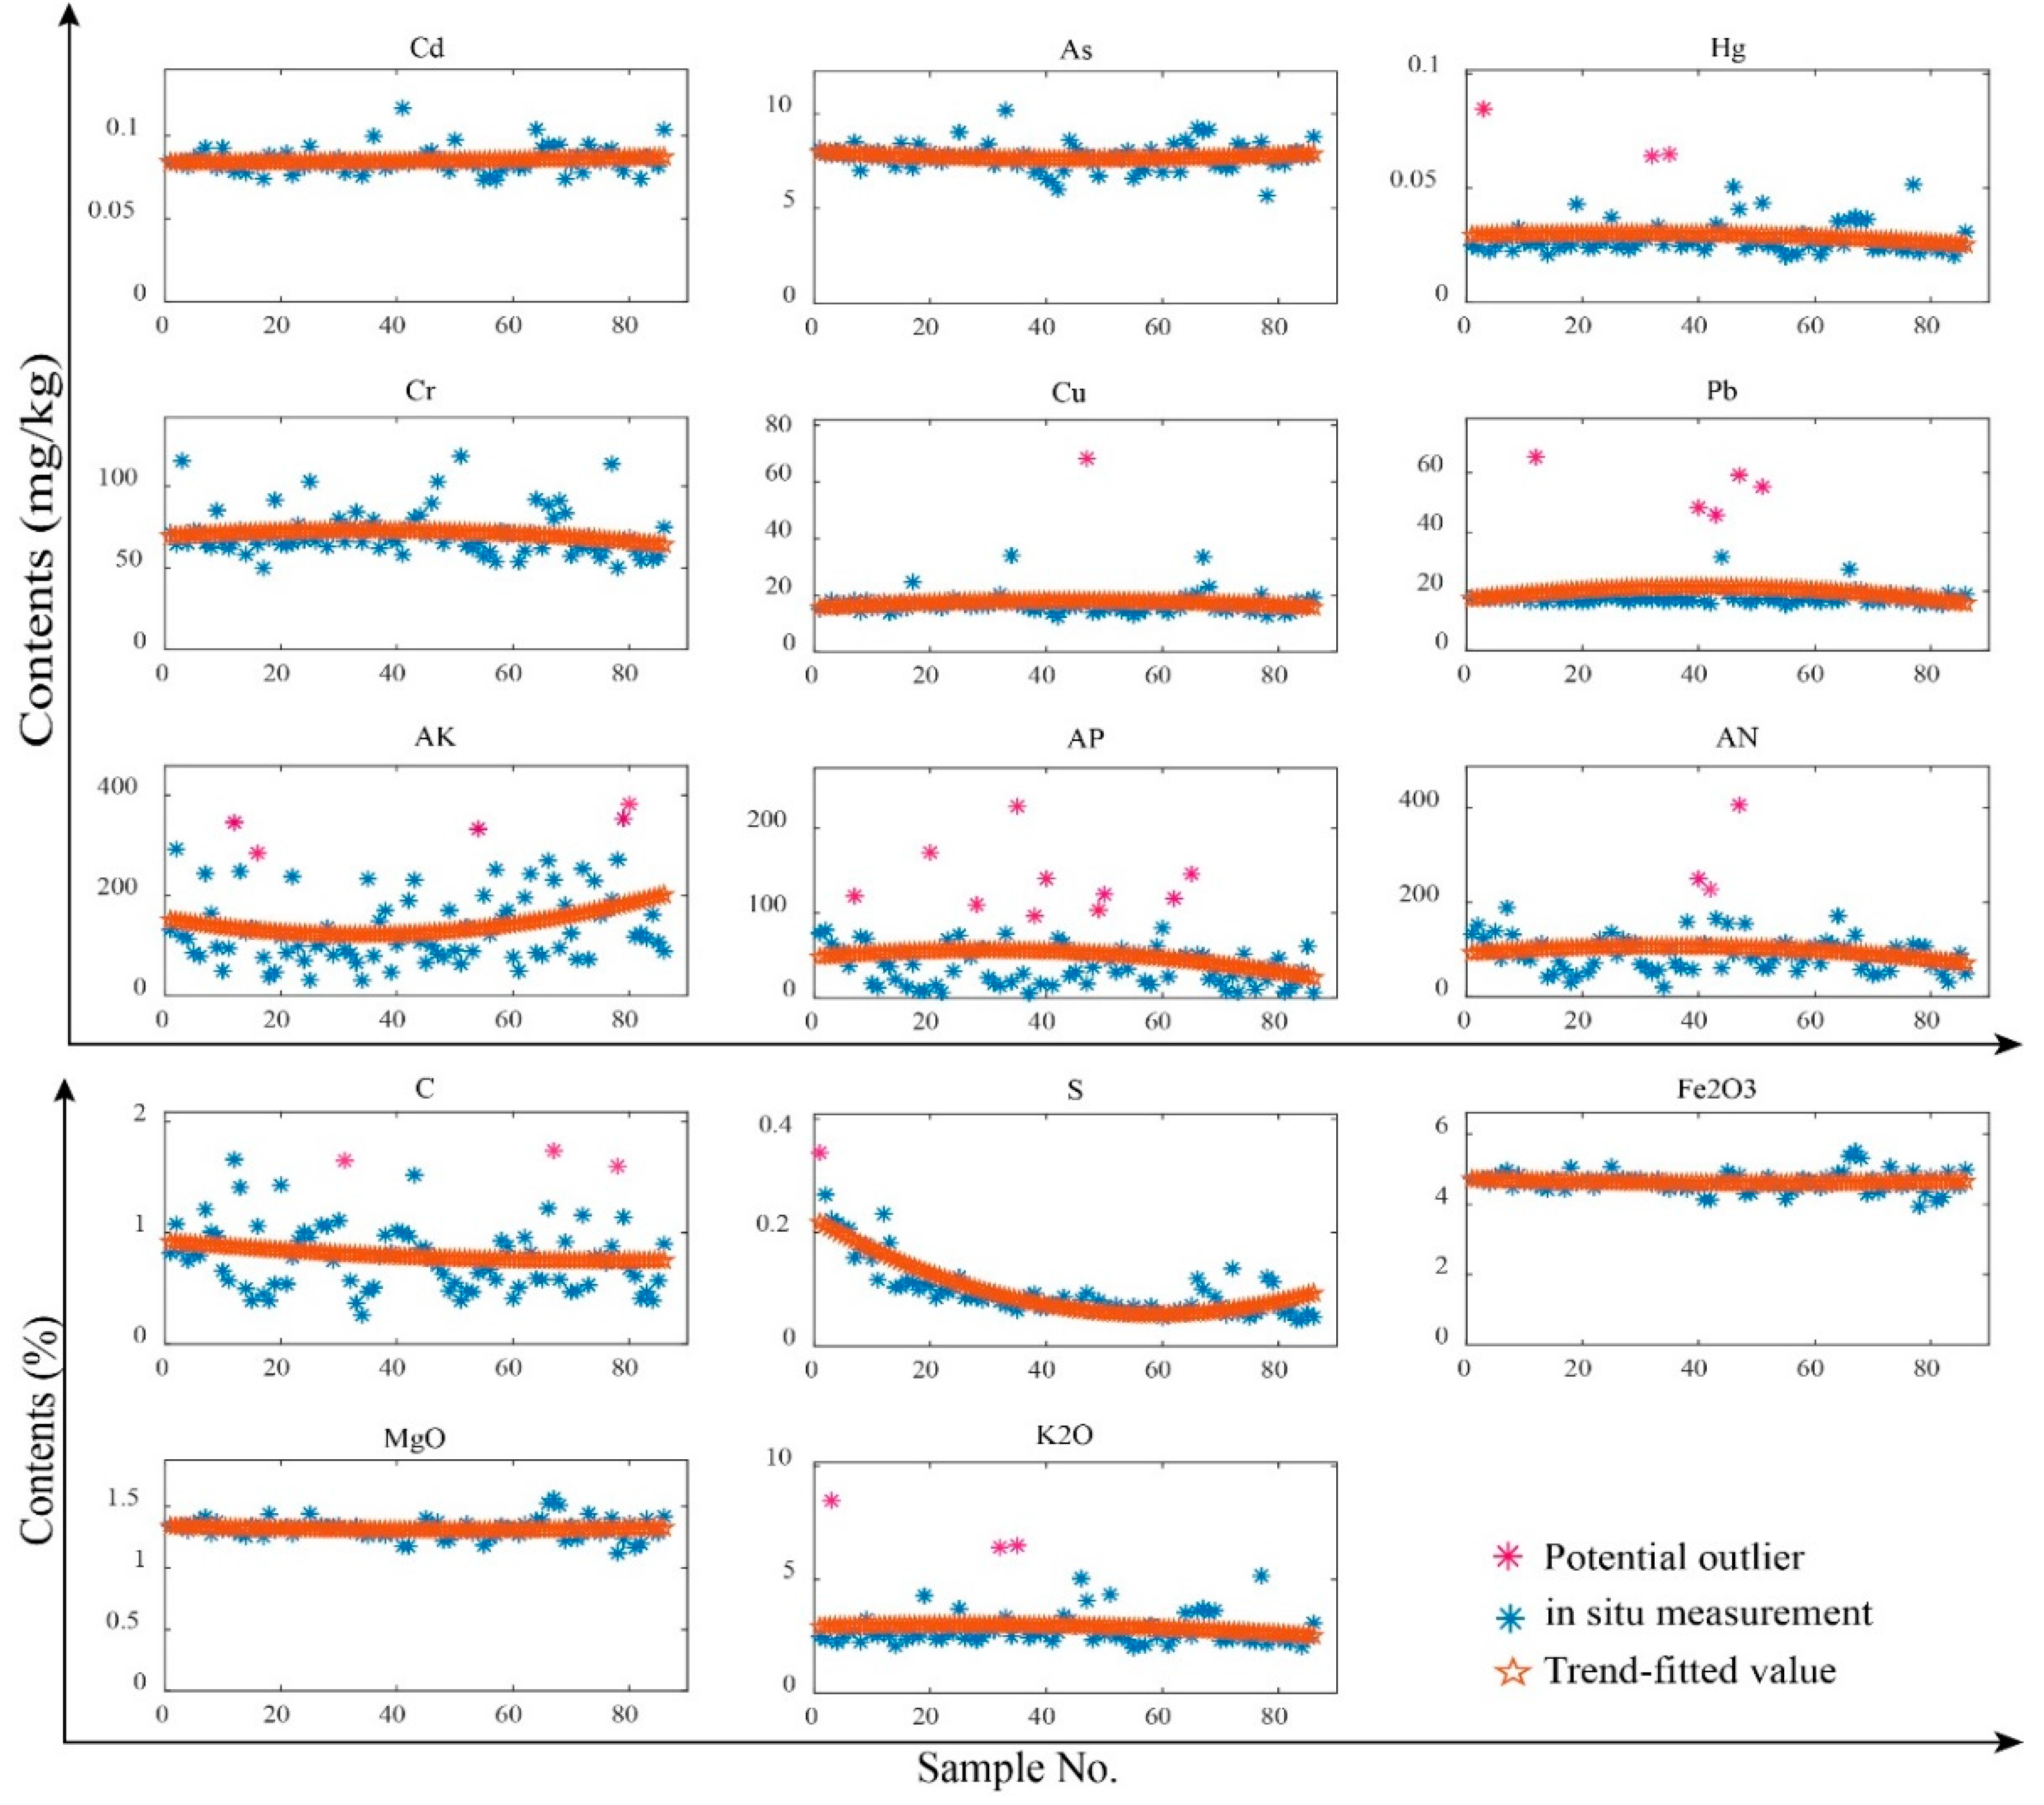
3.3.1. Outlier Detection and Treatment

In this study, simple low-dimensional detectors were used, respectively, for the 14 variables due to the simple data structure and the small size of the samples. The combined trend analysis and four-time average deviation detection is described in Algorithm 1. We first utilized the trend analysis to assume that the potential outliers were those that deviated from their trend-fitted values over the distance of the mean of all trend-fitted values. Figure 2 shows scatter plots of the 14 soil variables and their corresponding trend fits. The potential outliers calculated by the outlier detection algorithm (Algorithm 1) are in pink in Figure 2. Next, those potential outliers were double-checked by the four-time average deviation method [34], and then the final outliers could be determined (Table 2).
Furthermore, the outliers were replaced with the weighted average of their k-nearest neighbors (here, k = 3). The weight ω was negative in proportion to distance, and it was defined as
ω i = 1 d i s t a n c e i / i = 1 k 1 d i s t a n c e i ,
Algorithm 1 A combination algorithm of trend analysis and four-time average deviation to detect outliers
Input:  v a r i a b l e i n   s i t u M = [ v a l u e 1 i n   s i t u _ M ,   v a l u e 2 i n   s i t u _ M ,   ,   v a l u e N i n   s i t u _ M ] .   ( where   N = 86   and   M is one of the 14 soil variables listed in Table 1).
Trend fit by quadratic polynomials:
v a r i a b l e f i t t e d M = [ v a l u e 1 f i t t e d _ M ,   v a l u e 2 f i t t e d _ M ,   ,   v a l u e N f i t t e d _ M ] .
Calculation of residual:
R e s i d u a l = | v a r i a b l e i n   s i t u M v a r i a b l e f i t t e d M | = [ r e s i d u a l 1 M ,   r e s i d u a l 2 M ,   ,   r e s i d u a l N M ] .
Prejudgment of outliers:
if   R e s i d u a l M ( i ) > v a l u e f i t t e d _ M ¯ ,   v a l u e i i n   s i t u _ M p o t e n t i a l   o u t l i e r s ,   end .
( v a l u e f i t t e d _ M ¯ is the mean value of all trend-fitted values of the soil variable M . (This means that sample No. i of soil variable M is a potential outlier.)
Double check of outliers by four-time average deviation: if | v a l u e p o t e n t i a l   o u t l i e r M v a l u e * i n   s i t u _ M ¯ | > 4 d * ,   v a l u e p o t e n t i a l   o u t l i e r M p o t e n t i a l   o u t l i e r s ,   end .
( v a l u e * i n   s i t u _ M ¯ is the mean value of all in situ values except the potential outlier for soil variable M and d * is the average deviation of all in situ values except the potential outlier).

3.3.2. Normality Detection

After all outliers were removed, the normality detection was taken for all updated data (Table 3).

3.4. Determination of Environmental Factors

It is well known that the physical and the chemical properties of soil (e.g., organic matter content and chemical composition, etc.) determine the accumulation and the mobility of heavy metals in soil, and they represent some of the most important factors that lead to the spatial variation of heavy metals in soil [35,36,37]. Generally, among eight environmental factors of soil properties, AK, AP, and AN may be more related to anthropogenic activities (e.g., fertilization), C and S could be more related to fertilizer or biogeochemical processes, and Fe2O3, MgO and K2O may be more related to earth surface processes. Furthermore, the degrees of their influences on heavy metals might differ in different local areas. Consequently, correlation analysis should be conducted to choose suitable auxiliary variables for the heavy metals [1]. Pearson correlations of the target-soil heavy metal with the soil properties were done (Table 4). Note that all correlation analyses were based on normal transformations of the six heavy metals and the eight soil properties after their outliers were replaced.
As a result, the auxiliary factors for Cd, Hg, and Cr were {Fe2O3, MgO, K2O}, and the auxiliary factors for As, Cu, and Pb were {C, Fe2O3, MgO}.

3.5. Definitions of Soil Contamination Grades

The background values (BVs) of metal elements in the soils by the China National Environmental Monitoring Center [38] and the soil quality standards of China by the Chinese Environmental Protection Administration [39] were referred to grade the soil contamination in our study area. Guideline I represents the top limit for sustaining an average natural level for contaminated soil, Guideline II is the top limit for protecting human health, and Guideline III is the top limit for sustaining the normal growth of plants and agricultural products (Table 5) [3,39].
Generally, in this paper the definitions of grades I, II, and III are referred to [1]; and, in this study, contamination between BVs and Guideline I was regarded as an early warning of soil contamination over the natural level. The definitions of all grades are listed in Table 6.

3.6. Land-Use Map

The land-use types of the study area were extracted from Sentinel 2 data by ENVI software. Sentinel 2, an Earth observation mission from the Copernicus Program, systematically acquires optical imagery at high spatial resolution (10 m to 60 m) over land and coastal waters. The spectral bands of Sentinel 2 are coastal aerosol, RGB, three vegetation red edges, near-infrared and narrow near-infrared, water vapor, and three that are short-wave infrared. Supervised classification in ENVI is used for land-use type extraction, and generally eight land-use types are extracted, including residential areas, industries, transportation, vegetation, bare fields, aquaculture, and water (Figure 3).

3.7. Geostatistical Method

Kriging series detect the structural information of a regionalized variable that is reflected by sampled data and the mutual spatial positional relation of the sample points. They therefore provide an unbiased estimation with minimum error variance in unsampled locations [33]. OCK can supply an excellent estimation in regard to predication accuracy by taking the influences of environmental factors into account [1]. OCK takes full advantage of the additional correlated information in auxiliary variables, and it allows samples of one or more auxiliary variables. The multi-auxiliary-variable OCK estimator is expressed in Equation (2), and its detailed formula derivation is referred to in Zeng et al. [1,40].
Z ( u ) OCK metal = i = 1 N ( u ) metal λ i metal · Z ( u ) i metal + k = 1 N f a c t o r i = 1 N ( u ) a u x k λ i a u x k · Z ( u ) i a u x k ,
where Z ( u ) OCK metal is the value of the target heavy metal at location u estimated by OCK, N f a c t o r is the number of the auxiliary variables, Z ( u ) i a u x k is the sampled values of the kth auxiliary variable within the neighborhood of location u , and λ i a u x k is the weights of those neighboring sampled values. N ( u ) a u x k is the number of neighboring sampled values of the kth auxiliary variable.

3.8. Performance Metrics

In this study, the mean absolute error (MAE) and the root mean square error (RMSE) [41] were used as metrics to assess the models’ performances: MAE and RMSE metrics describe linear and quadratic deviations, respectively, of the estimate with respect to the measured soil heavy metals in the unit of concentration. They are defined as
MAE = 1 n n 1 | Z ( u ) i metal ^ Z ( u ) i metal | ,
RMSE = 1 n n 1 ( Z ( u ) i metal ^ Z ( u ) i metal ) 2 ,
where Z ( u ) i metal ^ is the predicted soil heavy metal concentration of sample i , Z ( u ) i metal is the in situ measurement of sample i , Z ( u ) metal ¯ is the mean value of the soil moisture contents of all in situ measurements, and n is the number of all samples.
As Zeng et al. [42] mentioned, the statistical significance reflected by the coefficient of determination R2 in different models with different observations is difficult to compare. First, R2 had different versions of mathematical definitions in past publications [43]. Second, R2 depends heavily on the number of observations [44]. Therefore, as Zeng et al. [42] did, the significance level (p value) of F-test [45] was used as a complementary reference to the MAE and the RMSE metrics in this study, and the statistical significance package integrated with MATLAB software was used.

4. Results of OCK Mapping Soil Heavy Metals

Spatial mapping of heavy metal concentrations was done by ArcGIS software using the OCK method. In an OCK mapping, the choice of auxiliary variables for the six heavy metals estimations was based on their Pearson correlation coefficients with the soil properties listed in Table 4. Also, as mentioned in Section 3.4, Fe2O3, MgO, and K2O were determined as the auxiliary variables for the heavy metals Cd, Hg, and Cr, and C, Fe2O3, and MgO were the auxiliary factors for As, Cu, and Pb. Their validation results from OCK estimation are listed in Table 7. The resultant p values were all below the 5% level, indicating good statistical significance [45].
Additionally, we added the ratio of MAE to the mean concentration of each heavy metal measured and the ratio of RMSE to the mean (Table 7). This made it easier to compare the six heavy-metal OCK models from the perspective of the relative changes of the two deviations of the estimate with respect to the measured soil heavy metals. In summary, according to the relative MAE and the relative RMSE, the OCK mappings of the As and the Cd distributions were more precise than those of the other four heavy metals, those of Cr, Cu, and Pb were in the middle, and that of Hg was ranked the least precise.
Furthermore, as a contrast, we explored ordinary kriging (OK) to estimate the concentrations of the six heavy metals for comparison. The results are shown in Table 8. A contrast of results between OCK estimation and OK estimation indicate that the utility of OCK to estimate heavy metal concentrations by incorporating auxiliary environmental variables could improve predication precision.
Next, based on the soil contamination grade definitions in Section 3.5, the spatial distribution maps of the heavy metals were divided into four levels: warning and grades I, II, and III. According to the results of the OCK mapping for the six heavy metals, the distributions of Cd, Hg, and Pb in our study area were approximately below their respective BVs in Liaoning Province. The contaminations of Cu and As were at the warning level in parts of the area (Figure 4b,c), but Cr contamination was at the warning level throughout most of our study area, and it even reached grade I in parts of the area (Figure 4a).

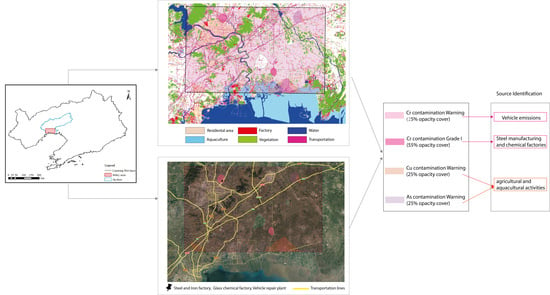
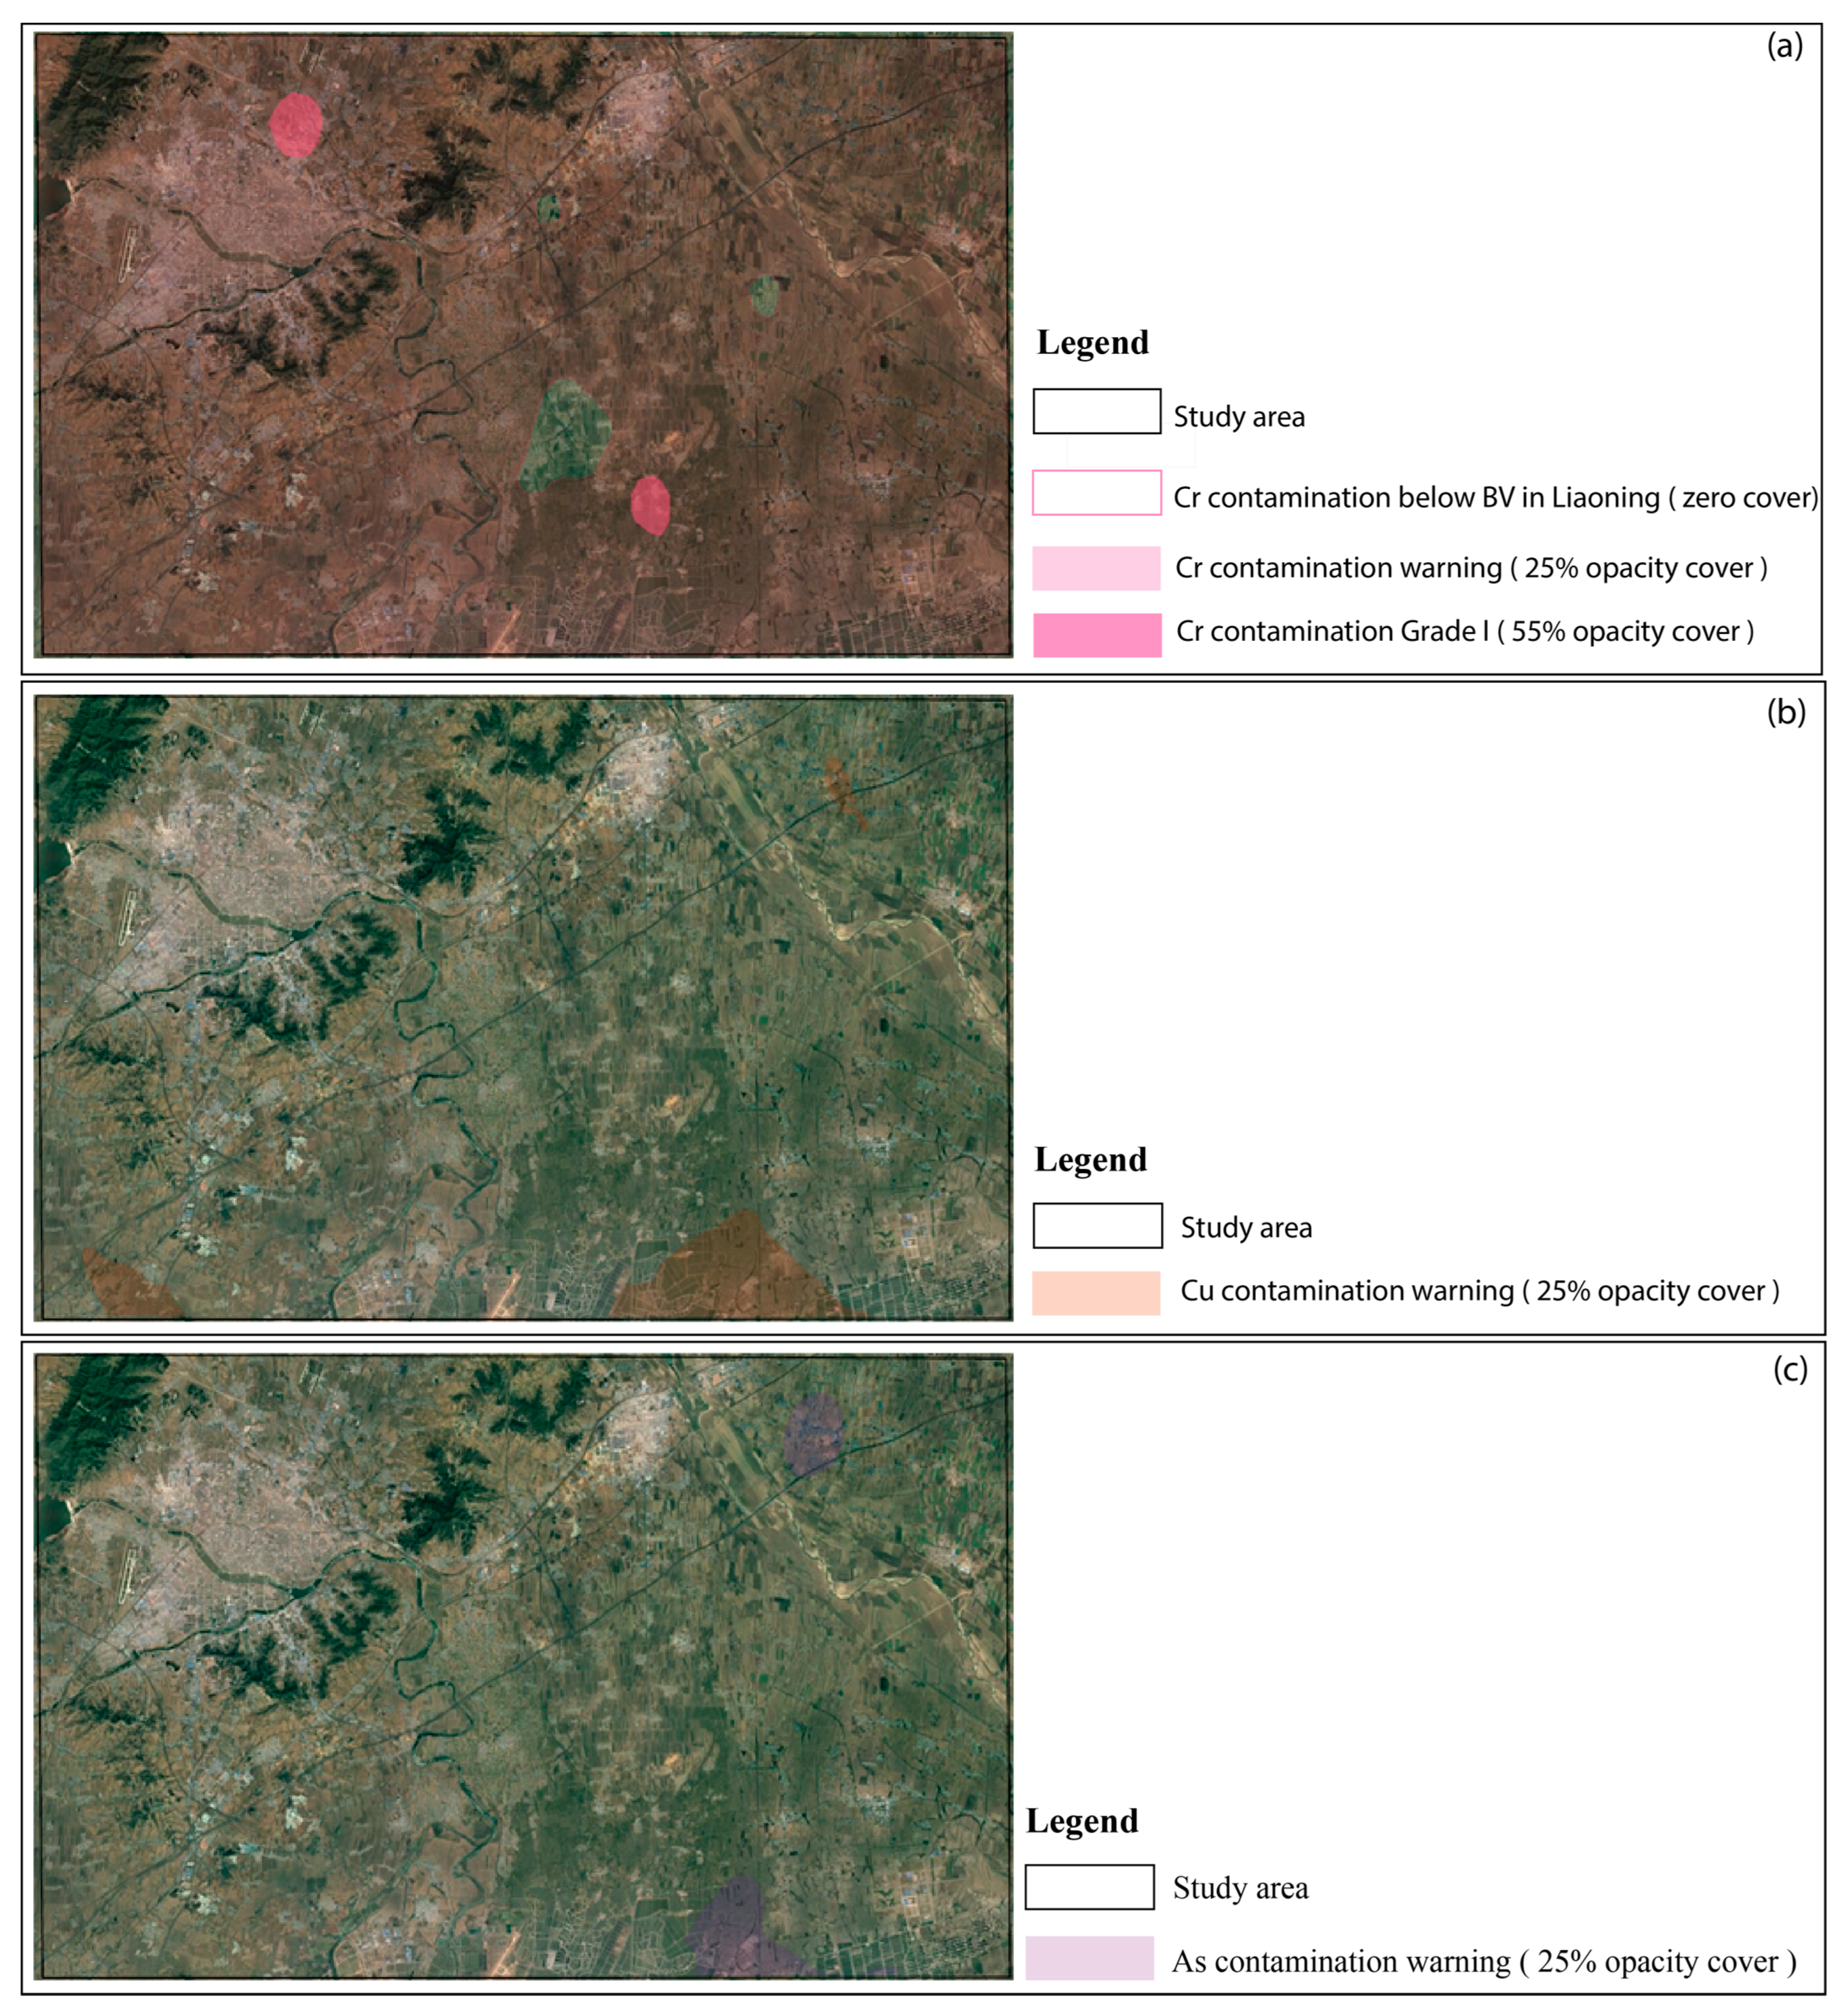
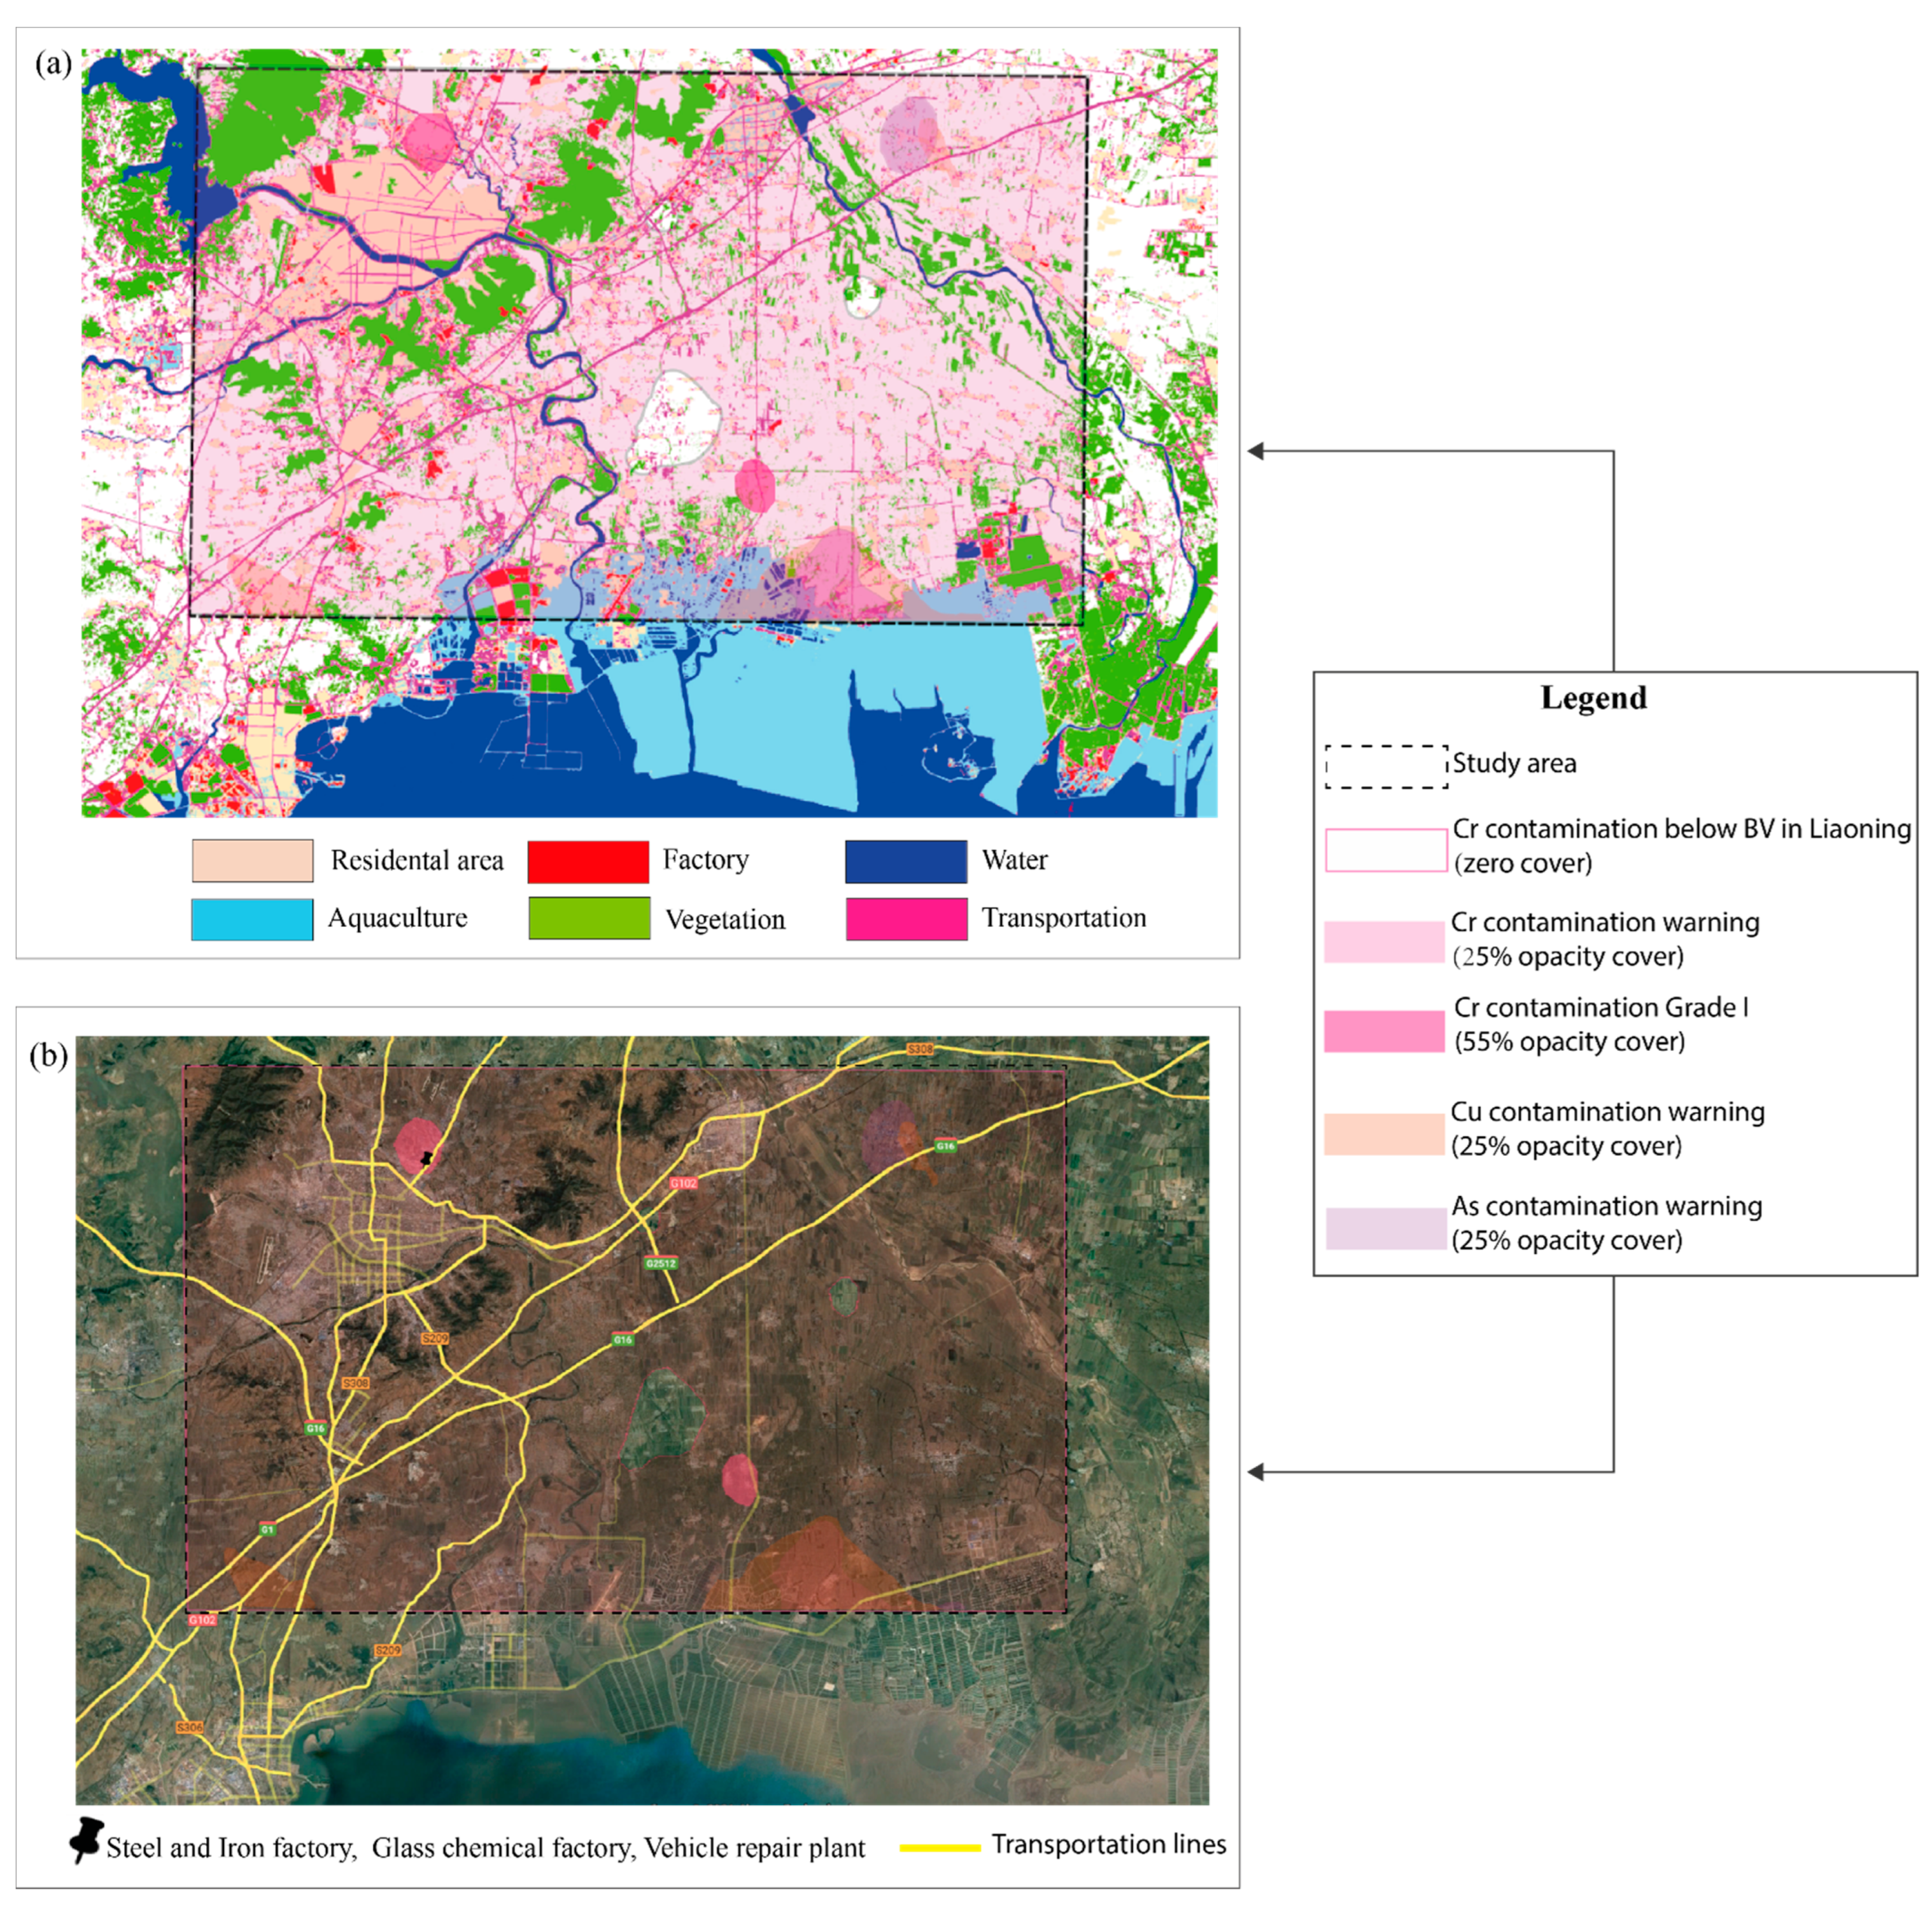
5. Discussion on Sources of Soil Heavy Metals

A combination of contamination maps, land-use maps classified from Sentinel 2 imagery, and a Google satellite map was used to trace the sources of the soil’s heavy metals. Three kinds of contamination—As, Cu, and Cr—were overlapped on both the land-use and the Google satellite maps (Figure 5a,b).
The study area near Bohai Bay had agricultural planting and aquaculture zones (Figure 5a). There were three subareas of warning-level Cu contamination and two of warning-level As contamination. Generally, the distributions of Cu and As contamination were more or less location-analogous. Additionally, the large-scale subareas of warning-level Cu and As contamination overlapped, and they were close to the agricultural planting and aquaculture zone along the coast of Bohai Bay. The sub-large-scale subarea of warning-level Cu contamination was also near the Bohai Bay coast on the left side of the map. Small-scale subareas of warning-level Cu and As contamination partly overlapped on the upper-right part of the study area, which was near water downstream from the south water channeled from the Bohai sea. Moreover, some studies [46,47,48,49] have reported that As and Cu are often used in agriculture as insecticides and other pesticides. Therefore, it may be inferred that the source of the As and the Cu soil contamination in the study area was mainly the agricultural planting activities in the aquaculture zones along the coast of Bohai Bay, which were carried to other places by watercourses.
Cr warning-level contamination was almost everywhere in the study area, and it even reached grade I in two subareas (Figure 5a,b). The upper-side subarea of grade I Cr contamination was in a large-scale residential area (Figure 5b). Additionally, there were at least three factories in that residential area, including a steel and an iron chain manufacturing factory, a glass manufacturing chemical factory, and a vehicle repair factory. There were also main transportation lines around the upper-side subarea of grade I Cr contamination. In the lower-side subarea of that contamination, there were some residential villages, some small factories nearby, and an obvious transportation line from the Bohai Bay coast to the upper-side area (Figure 5a).
Past researchers [50,51] reported that the largest sources of Cr emissions were from the chemical manufacturing industry and the combustion of natural gas, oil, and coal. The most significant use of Cr was in metal alloys such as stainless steel, protective coatings on metal, magnetic tapes, and pigments for paints, cements, and paper. Therefore, it was inferred that the omnipresent warning level of Cr contamination could have been caused by transportation because of vehicle gas and oil combustion. Furthermore, the grade I Cr contamination in the upper-side subarea could have been caused by the chemical and the metal alloy manufacturing industries mentioned above. The sources of the other grade I contamination near the aquaculture zone may have been the more intensive transportation of aquaculture products from the Bohai Bay coast to marketplaces and some nearby manufacturing factories for the sale of aquaculture products (e.g., paper and plastic packaging factories).

6. Conclusions

This study used statistical standards to process and to analyze soil geochemical data by outlier removal, normality transformation, and Pearson correlation analysis, which made those data statistically qualified for OCK mapping. The relative metrics of MAE and RMSE were also introduced to assess model performances to ably compare the precision of OCK mappings among the six heavy metals. The p value of F-tests, instead of determination coefficient R2, was adopted to quantitatively explain the statistical significance of the OCK models. That work was done to more qualifiedly and reasonably estimate the distributions of the six heavy metals in the study area.
Furthermore, the results of six heavy metal OCK mappings were graded in the levels of below BVs, pollution warning, and Grades I, II, and III. The distributions of Cd, Hg, and Pb in the study area were below their respective BVs in Liaoning Province, and thus only the sources of Cr, As, and Cu were identified there.
A land-use classification map was overlapped with the distribution maps of the three heavy metals Cr, As, and Cu to obtain correlation information on the type of land use with contamination grades of heavy metals. Therefore, it was inferred that the warning pollution levels of As and Cu in soils could have been derived from the aquaculture and agricultural plowing water near Bohai Bay. It was also inferred that the warning level of Cr in most of that area could have been caused by its intense transportation. Moreover, the distribution maps of the three heavy metals were put on a Google satellite map to trace the more detailed locations and thus find some metal alloy, chemical, and plastic manufacturing industries inside the Grade I Cr pollution subarea. Finally, previous studies were referred to [46,47,48,49,50,51] about the sources of Cr, As, and Cu to confirm the correctness of our inferences: As and Cu were often used as insecticides and pesticides in agricultural activities, and Cr was derived more from the combustion of vehicle gas and oil and chemical manufacturing factories.

Author Contributions

Conceptualization, L.Z. and S.J.; methodology, L.Z.; validation, L.J. and L.Z.; formal analysis, L.Z.; investigation, S.J.; resources, S.J.; data curation, S.J.; writing—original draft preparation, L.Z.; writing—review and editing, S.J.; visualization, Y.X.; supervision, L.J. and Y.X.; project administration, S.J.; funding acquisition, L.Z., S.J. and L.J. All authors have read and agreed to the published version of the manuscript.

Funding

This work was funded by the National Science Foundation of China (No. 42002294 and No. 41972108), the Integrated Survey Project of Natural Resources in Northeast China (No. DD20211383).

Data Availability Statement

The in situ datasets generated and/or analyzed that support the findings of this study are available at https://0-doi-org.brum.beds.ac.uk/10.4121/19329332.v1, (accessed on 10 March 2022). The Sentinel-2 L1C imagery was acquired on 19 October 2018, and it can be downloaded from the ESA Copernicus Open Access Hub (https://scihub.copernicus.eu/, (accessed on 19 October 2018)).

Acknowledgments

Thanks to Yi Jiang who helped to edit the graphics.

Conflicts of Interest

The authors declare that they have no known competing financial interests or personal relationships that could have appeared to influence the work reported in this paper.

References

  1. Zeng, L.; Wang, Y.H.; Jing, L.H.; Cheng, Q.M. Quantitative determination of auxiliary information for mapping soil heavy metals and soil contamination risk assessment. Appl. Geogr. 2021, 130, 104964. [Google Scholar] [CrossRef]
  2. Oves, M.; Khan, M.S.; Zaidi, A.; Ahmad, E. Soil contamination, nutritive value, and human health risk assessment of heavy metals: An overview. Toxic. Heavy Met. Legumes Bioremed. 2012, 2012, 1–27. [Google Scholar]
  3. Chen, H.Y.; Teng, Y.G.; Lu, S.J.; Wang, J.S. Contamination features and health risk of soil heavy metals in China. Sci. Total Environ. 2015, 512–513, 143–153. [Google Scholar] [CrossRef] [PubMed]
  4. Żukowska, J.; Biziuk, M. Methodological evaluation of method for dietary heavy metal intake. J. Food Sci. 2008, 73, R21–R29. [Google Scholar] [CrossRef] [PubMed]
  5. Li, Z.Y.; Ma, Z.W.; van der Kuijp, T.J.; Yuan, Z.; Huang, L. A review of soil heavy metal pollution from mines in China: Pollution and health risk assessment. Sci. Total Environ. 2014, 456, 212–221. [Google Scholar] [CrossRef]
  6. Shanker, A.K.; Venkateswarlu, B. Chromium: Environmental pollution, health effects and mode of action 2012. Available online: https://www.hindawi.com/journals/jeph/2012/341637/ (accessed on 6 May 2012).
  7. Ma, J.; Singhirunnusorn, W. Distribution and health risk assessment of heavy metals in surface dusts of Maha Sarakham municipality. Procedia Soc. Behav. Sci. 2012, 50, 280–293. [Google Scholar] [CrossRef] [Green Version]
  8. Zhang, S.; Huang, Y.; Shen, C.; Ye, H.; Du, Y. Spatial prediction of soil organic matter using terrain indices and categorical variables as auxiliary information. Geoderma 2012, 171–172, 35–43. [Google Scholar] [CrossRef]
  9. Qing, X.; Yutong, Z.; Shenggao, L. Assessment of heavy metal contamination and human health risk in urban soils of steel industrial city (Anshan), Liaoning, Northeast China. Ecotoxicol. Environ. Saf. 2015, 120, 377–385. [Google Scholar] [CrossRef]
  10. De Kimpe, C.R.; Morel, J.L. Urban soil management: A growing concern. Soil Sci. 2000, 165, 31–40. [Google Scholar] [CrossRef]
  11. Facchinelli, A.; Sacchi, E.; Mallen, L. Multivariate statistical and GIS-based approach to identify heavy metal sources in soils. Environ. Pollut. 2001, 114, 313–324. [Google Scholar] [CrossRef]
  12. Luo, X.S.; Yu, S.; Zhu, Y.G.; Li, X.D. Trace metal contamination in urban soils of China. Sci. Total Environ. 2012, 421–422, 17–30. [Google Scholar] [CrossRef] [PubMed]
  13. Paterson, E.; Sanka, M.; Clark, L. Urban soils as pollutant sinks -a case study from Aberdeen, Scotland. Sci. Total Environ. 1996, 11, 129–131. [Google Scholar] [CrossRef]
  14. Poggio, L.; Vrscaj, B.; Schulin, R.; Hepperle, E.; Marsan, F.A. Metals pollution and human bio-accessibility of topsoils in Grugliasco (Italy). Environ. Pollut. 2009, 157, 680–689. [Google Scholar] [CrossRef] [PubMed]
  15. Wei, B.; Yang, L. A review of heavy metal contaminations in urban soils, urban road dusts and agricultural soils from China. Microchem. J. 2010, 94, 99–107. [Google Scholar] [CrossRef]
  16. Wong, C.S.C.; Li, X.D.; Thornton, I. Urban environmental geochemistry of trace metals. Environ. Pollut. 2006, 142, 1–16. [Google Scholar] [CrossRef] [Green Version]
  17. Aelion, C.M.; Davis, H.T.; McDermott, S.; Lawson, A.B. Metal concentrations in rural topsoil in South Carolina: Potential for human health impact. Sci. Total Environ. 2008, 402, 149–156. [Google Scholar] [CrossRef] [Green Version]
  18. De Miguel, E.; De Grado, M.J.; Llamas, J.F.; Martın-Dorado, A.; Mazadiego, L.F. The overlooked contribution of compost application to the trace element load in the urban soil of Madrid (Spain). Sci. Total Environ. 1998, 215, 113–122. [Google Scholar] [CrossRef]
  19. Doabi, S.A.; Karami, M.; Majid, A.; Yeganeh, M. Contamination and health risk assessment of heavy metals in agricultural soil, atmospheric dust and major food crops in Kermanshah province, Iran. Ecotoxicol. Environ. Saf. 2018, 163, 153–164. [Google Scholar] [CrossRef]
  20. Madrid, L.; Dıáz-Barrientos, E.; Madrid, F. Distribution of heavy metal contents of urban soils in parks of Seville. Chemosphere 2002, 49, 1301–1308. [Google Scholar] [CrossRef]
  21. Li, H.; Qian, X.; Hu, W.; Wang, Y.; Gao, H. Chemical speciation and human health risk of trace metals in urban street dusts from a metropolitan city, Nanjing, SE China. Sci. Total Environ. 2013, 468–469, 843–853. [Google Scholar] [CrossRef]
  22. Wu, S.; Peng, S.; Zhang, X.; Wu, D.; Luo, W.; Zhang, T.; Zhou, S.; Yang, G.; Wan, H.; Wu, L. Levels and health risk assessments of heavy metals in urban soils in Dongguan, China. J. Geochem. Explor. 2015, 148, 71–78. [Google Scholar] [CrossRef]
  23. Qu, M.; Chen, J.; Huang, B.; Zhao, Y. Source apportionment of soil heavy metals using robust spatial recept or model with categorical land-use types and RGWR-corrected in-situ FPXRF data. Environ. Pollut. 2021, 270, 116220. [Google Scholar] [CrossRef] [PubMed]
  24. Pan, L.B.; Ma, J.; Wang, X.L.; Hou, H. Heavy metals in soils from a typical county in Shanxi Province, China: Levels, sources and spatial distribution. Chemosphere 2016, 148, 248–254. [Google Scholar] [CrossRef] [PubMed]
  25. Yang, Y.; Christakos, G.; Guo, M.; Xiao, L.; Huang, W. Space-time quantitative source apportionment of soil heavy metal concentration increments. Environ. Pollut. 2017, 223, 560–566. [Google Scholar] [CrossRef]
  26. Cui, Z.; Wang, Y.; Zhao, N.; Yu, R.; Xu, G.; Yu, Y. Spatial distribution and risk assess- ment of heavy metals in Paddy soils of Yongshuyu irrigation area from Songhua River Basin, Northeast China. Chin. Geogr. Sci. 2018, 28, 797–809. [Google Scholar] [CrossRef] [Green Version]
  27. Lv, J.; Jiao, W.B.; Qiu, H.Y.; Chen, B.; Huang, X.X.; Kang, B. Origin and spatial distribution of heavy metals and carcinogenic risk assessment in mining areas at You’xi county Southeast China. Geoderma 2018, 310, 99–106. [Google Scholar]
  28. Olea, R.A. A six-step practical approach to semivariogram modeling. Stoch. Environ. Res. Risk Assess. 2006, 20, 307–318. [Google Scholar] [CrossRef]
  29. Jiang, Y.; Chao, S.; Liu, J.; Yang, Y.; Chen, Y.; Zhang, A.; Cao, H. Source apportionment and health risk assessment of heavy metals in soil for a township in Jiangsu Province, China. Chemosphere 2017, 168, 1658–1668. [Google Scholar] [CrossRef]
  30. Fei, X.; Christakos, G.; Xiao, R.; Ren, Z.Q.; Liu, Y.; Lv, X.N. Improved heavy metal mapping and contamination source apportionment in Shanghai City soils using auxiliary information. Sci. Total Environ. 2019, 661, 168–177. [Google Scholar] [CrossRef]
  31. Bogaert, P.; D’Or, D. Estimating soil properties from thematic soil maps. Soil Sci. Soc. Am. J. 2002, 66, 1492–1500. [Google Scholar] [CrossRef]
  32. Wang, K.; Zhang, C.R.; Li, W.D. Predictive mapping of soil total nitrogen at a regional scale: A comparison between geographically weighted regression and cokriging. Appl. Geogr. 2013, 42, 73–85. [Google Scholar] [CrossRef]
  33. Oliver, M.A.; Webster, R. A tutorial guide to geostatistics: Computing and modelling variograms and kriging. Catena 2014, 113, 56–69. [Google Scholar] [CrossRef]
  34. Zhu, J.X.; Bao, Y.T.; Li, C. Discussion on the method for testing and treating outliers. Univ. Chem. 2018, 33, 58–65. (In Chinese) [Google Scholar] [CrossRef]
  35. Cao, S.; Lu, A.; Wang, J.; Huo, H. Modeling and mapping of cadmium in soils based on qualitative and quantitative auxiliary variables in a cadmium contaminated area. Sci. Total Environ. 2016, 580, 430–439. [Google Scholar] [CrossRef]
  36. Lu, A.; Wang, J.; Qin, X.; Wang, K.; Han, P.; Zhang, S. Multivariate and geostatistical analyses of the spatial distribution and origin of heavy metals in the agricultural soils in Shunyi, Beijing, China. Sci. Total Environ. 2012, 425, 66–74. [Google Scholar] [CrossRef]
  37. Rodríguez, M.J.A.; López, A.M.; Grau, C.J.M. Heavy metal contents in agricultural topsoils in the Ebro basin (Spain). Application of the multivariate geostatistical methods to study spatial variations. Environ. Pollut 2006, 144, 1001–1012. [Google Scholar] [CrossRef]
  38. CNEMC, China National Environmental Monitoring Center. The Soil Background Value in China; China Environmental Science Press: Beijing, China, 1990. (In Chinese) [Google Scholar]
  39. CEPA, Chinese Environmental Protection Administration. Soil Environmental Quality Risk Control Standard for Soil Contamination of Development Land (GB36600—2018); CEPA: Beijing, China, 2018. Available online: https://www.mee.gov.cn/ywgz/fgbz/bz/bzwb/trhj/201807/t20180703_446027.shtml (accessed on 1 August 2018). (In Chinese)
  40. Zeng, L.; Shi, Q.Y.; Guo, K.; Xie, S.Y.; Herrin, J. A three-variables cokriging method to estimate bare-surface soil moisture using multi-temporal, VV-polarization synthetic-aperture radar data. Hydrogeol. J. 2020, 28, 2129–2139. [Google Scholar] [CrossRef]
  41. Chai, T.; Draxler, R.R. Root mean square error (RMSE) or mean absolute error (MAE)?—Arguments against avoiding RMSE in the literature. Geosci. Model. Dev. 2014, 7, 1247–1250. [Google Scholar] [CrossRef] [Green Version]
  42. Zeng, L.; Liu, Q.M.; Jing, L.H.; Lan, L.; Feng, J. Using generalized regression neural network to retrieve bare surface soil moisture from radarsat-2 backscatter observations, regardless of roughness effect. Front. Earth Sc.-Switz. 2021, 9, 657206. [Google Scholar] [CrossRef]
  43. Kvalseth, T.O. Cautionary note about R2. Am. Stat. 1985, 39, 279–285. [Google Scholar]
  44. Hahn, G.J. The coefficient of determination exposed. Chemtech 1973, 3, 609–612. [Google Scholar]
  45. Box, G.E.P. Non-Normality and Tests on Variances. Biometrika 1953, 40, 318–335. [Google Scholar] [CrossRef]
  46. Garelick, H.; Jones, H.; Dybowska, A.; Valsami-Jones, E. Arsenic Pollution Sources. Rev. Environ. Contam. Trans. 2008, 197, 17–60. [Google Scholar]
  47. Panagos, P.; Ballabio, C.; Lugato, E.; Jones, A.; Borrelli, P.; Scarpa, S.; Orgiazzi, A.; Montanarella, L. Potential sources of anthropogenic copper inputs to European agricultural soil. Sustainability 2018, 10, 2380. [Google Scholar] [CrossRef] [Green Version]
  48. Tóth, G.; Hermann, T.; Da Silva, M.R.; Montanarella, L. Heavy metals in agricultural soils of the European Union with implications for food safety. Environ. Int. 2016, 88, 299–309. [Google Scholar] [CrossRef]
  49. Pietrzak, U.; McPhail, D.C. Copper accumulation, distribution, and fractionation in vineyard soils of Victoria, Australia. Geoderma 2004, 122, 151–166. [Google Scholar] [CrossRef]
  50. Nriagu, J.O. Chromium in Natural and Human Environment; Wiley: New York, NY, USA, 1988. [Google Scholar]
  51. Shanker, A.K.; Cervantes, C.; Loza-Tavera, H.; Avudainayagam, S. Chromium toxicity in plants. Environ. Int. 2005, 31, 739–753. [Google Scholar] [CrossRef]
Figure 1. Study area and Google satellite map showing sampling sites.
Remotesensing 14 02436 g001
Figure 2. Trend analyses of the 14 soil variables for their respective 86 sampling values.
Remotesensing 14 02436 g002
Figure 3. Map of land-cover types of the study area from Sentinel 2 data.
Remotesensing 14 02436 g003
Figure 4. Ordinary cokriging mapping of the distributions of Cr, Cu, Hg, and As heavy metals.
Remotesensing 14 02436 g004
Figure 5. (a) Distribution overlap of heavy metals Cr, Cu, and As on land-use map. (b) Distribution overlap of heavy metals Cr, Cu, and As on Google satellite map.
Remotesensing 14 02436 g005
Table 1. Statistical description of soil heavy metals and soil properties of 86 samples.
Soil VariableMean ValueRangeAnalytical Technique
Cd (mg/kg)0.0850.073 to 0.117AFS 1
As (mg/kg)7.7205.670 to 10.168
Hg (mg/kg)0.0290.02 to 0.085
Cr (mg/kg)70.68649.922 to 118.159ICP-MS 2
Cu (mg/kg)17.28612.356 to 68.266
Pb (mg/kg)19.79215.295 to 65.304
AK 3 (mg/kg)142.42330.802 to 381.803ICP-OES 4
AP 5 (mg/kg)48.1585.532 to 225.954
Fe2O3 (%)4.6313.934 to 5.503
MgO (%)1.3161.118 to 1.564
K2O (%)2.8931.994 to 8.459
AN 6 (mg/kg)97.41020.269 to 406.735CHNS elemental analyzer
C (%)0.8000.260 to 1.740
S (%)0.0970.046 to 0.341
1 AFS: Atomic fluorescence spectrometry; 2 ICP-MS: Inductively coupled plasma mass spectrometry; 3 AK: Available potassium; 4 ICP-OES: Inductively coupled plasma optical emission spectrometry; 5 AP: Available phosphorous; 6 AN: Alkali-hydrolyzable nitrogen.
Table 2. Final outliers of soil variables by the combined detectors.
Soil VariableOutliers (Sample No.)Soil VariableOutliers (Sample No.)
Hg{3, 35, 32}AN{40, 47}
Cu{47}S{1}
Pb{12, 47, 51, 40, 43}K2O{3, 32, 35}
AP{20, 35}
Table 3. Normality to which each soil variable conformed.
VariableNormality Mode VariableNormality Mode
CdBox-Cox –3APLog
AsLogANLog
HgBox-Cox –2CLog
CrBox-Cox –1.5SBox-Cox –1
CuBox-Cox –2.5Fe2O3Log
PbBox-Cox –6MgOLog
AKLogK2OBox-Cox –2.5
Table 4. Pearson correlation coefficients of the six heavy metals with the soil properties and all soil data in the correlation analysis under their normal transformations.
Heavy MetalAN
(mg/kg)
AP
(mg/kg)
AK
(mg/kg)
C (%)S (%)Fe2O3 (%)MgO (%)K2O (%)
Cd (mg/kg)−0.209 −0.023 0.164 0.132 −0.109 0.496 0.496 0.338
As (mg/kg)−0.212 0.009 −0.123 0.491 0.017 0.797 0.797 0.411
Hg (mg/kg)−0.203 0.118 0.106 0.437 0.120 0.517 0.517 0.942
Cr (mg/kg)−0.173 0.158 0.183 0.277 0.184 0.491 0.491 0.859
Cu (mg/kg)−0.230 0.089 −0.229 0.931 0.107 0.721 0.721 0.544
Pb (mg/kg)−0.053 0.160 0.028 0.491 0.063 0.781 0.781 0.451
Table 5. Summary statistics of heavy metal concentrations in Chinese soil (n = 38,393) (mg/kg).
CdAsHgCrCuPb
Background values in Liaoning0.1088.80.03757.919.821.1
Chinese soil Guideline I 0.2150.15903535
Chinese soil Guideline II 0.6300.5200200300
Chinese soil Guideline III1401.5400400500
Table 6. Grading standards of soil contamination in this study.
Contamination GradeRangeExplanation
Warning(BVs in Liaoning, Guideline I]Soil contamination is possibly over the natural level.
Grade I(Guidelines I, II]Soil is polluted, but human health is still within control.
Grade II(Guidelines II, III]Human health is harmed, but plants and crops can still grow normally.
Grade III(Guideline III, + )Human health is destroyed, and crops and plants cannot grow normally.
Table 7. Validation results of OCK predictions for the six heavy metals.
MetricCdAsHgCrCuPb
MAE (mg/kg)0.00570.37200.00436.14021.81402.4809
RMSE (mg/kg)0.00760.48090.00638.35473.14702.8495
p value (%)0.00002.77650.0000.01390.74100.0000
MAE/mean (%)6.714.8214.838.6910.4912.53
RMSE/mean (%)8.946.2321.7211.8218.2114.40
Table 8. Validation results of OK predictions for the six heavy metals.
MetricCdAsHgCrCuPb
MAE (mg/kg)0.00580.55730.004310.19501.98812.5415
RMSE (mg/kg)0.00770.71450.006314.17093.30252.9256
p value (%)0.00000.00000.0000.00000.00270.0000
MAE/mean (%)6.75907.218015.567214.423011.934414.3851
RMSE/mean (%)9.04009.254622.901520.047619.824316.5592
Publisher’s Note: MDPI stays neutral with regard to jurisdictional claims in published maps and institutional affiliations.

