
Formulation of a Structural Equation Relating Remotely Sensed Electron Transport Rate Index to Photosynthesis Activity


Group of Agrophysics Studies, Migal Research Institute, Kiryat Shemona 11016, Israel
Remote Sens. 2022, 14(10), 2439; https://0-doi-org.brum.beds.ac.uk/10.3390/rs14102439
Submission received: 31 March 2022
/
Revised: 10 May 2022
/
Accepted: 17 May 2022
/
Published: 19 May 2022
(This article belongs to the Special Issue Remote Sensing for Crop Stress Monitoring and Yield Prediction)
Abstract
:Chlorophyll fluorescence can be remotely sensed in open fields via the Fraunhofer atmospheric absorption lines of oxygen and is termed Solar-Induced Fluorescence (SIF). SIF has been extensively related to carbon assimilation at global ecology scale and was interpreted as electron transport rate. However, SIF was shown to be unrelated directly to carbon assimilation at finer-scale resolution and may be related to other photosynthetic processes, such as non-photochemical quenching. This raises the question how exactly the SIF relates to actual photosynthetic activity. Based on a recently introduced spectral index that relates the photochemical fraction of SIF to the actual electron transport rate, this study presents the formulation of a structural equation, relating the remotely sensed electron transport rate index to fluorescence yield which considers the various fates of energetic quanta and electron excitation. The proposed structural equations are used to examine and interpret the relation between the novel spectral index and seasonal growth of corn (Z. mays Sh2, ‘super sweet’) on a platform of fertilization concentration gradient. Potential uses, practical and theoretical, for the proposed structural equations are discussed.
1. Introduction
1.1. Solar-Induced Fluorescence as an Indicator for Primary Productivity
Chlorophyll fluorescence has been used for decades to study the organization, function, and acclimation of the photosynthetic apparatus under laboratory conditions [1]. Chlorophyll fluorescence can be remotely sensed in open fields via Fraunhofer’s atmospheric absorption lines of oxygen and is termed Solar-Induced Fluorescence (SIF) [2]. SIF has been extensively related to carbon assimilation at the global ecology scale due to its high positive correlation with global carbon exchange measurements [3], and it has been suggested that SIF holds information regarding photosynthetic electron transport rate within the thylakoid membranes within the chloroplast organelle of plants [4]. However, SIF has been shown to be unrelated directly to carbon assimilation at a finer spatial resolution [5], indicating a discrepancy regarding the role of the SIF in actual photosynthetic activity. A possible explanation for this discrepancy is the fact that SIF measures the overall fluorescence emitted from the apparatus, which includes both fluorescence coming from photochemistry and fluorescence that is emitted from photoprotective mechanisms [6]. Recently, Liran et al. [7] introduced a new spectral index, where the photochemical fraction of SIF was related to actual electron transport rate in the plant, and therefore, indirectly reported on biomass production:
where RS-ETRi stands for Remote Sensing of Electron Transport Rate index, I is the intensity of Photosynthetically Active Radiation [W m−2], A is the fraction of light absorbed by the photosynthetic apparatus (approximated by the established vegetation index NDVI—Normalized Differential Vegetation Index [8]), and SIF# is the Solar-Induced Fluorescence measured at 687 nm and 760 nm. This index, when measured 2 m above the plants, was highly correlated (R2 = 0.99) with the ETR measured directly on leaves from the same plant community with a handheld fluorometer [7].
1.2. Formulation Justification for RS-ETRi as a Reporter of Photosynthetic Activity
The fluorescence detected via the Fraunhofer oxygen absorption line at 687 nm is related mostly to fluorescence emitted from the PhotoSystem II (PSII) super complex. When an electron is excited, it can either be transferred to a different chlorophyll molecule or return to ground level through several pathways—non-radiative decay, fluorescence, transfer between reaction centers, etc. Porcar-Castell et al. [1] developed a fluorescence yield equation that takes into account the various fates the electron undergoes at 687 nm:
where , kchl, kre, kNPQ, qkUU, kp, and kD are the rate constants of reactions of either: fluorescence, re-absorbance of the fluorescence by chlorophyll within the canopy, Non-Photochemical Quenching (NPQ), energy transfer between open reaction centers [9], photochemistry, or non-radiative energy dissipation within the chlorophyll, respectively. α represents the absorption cross section of PSII, i.e., the fraction of photon flux that was absorbed on the Light Harvesting Complex of PSII (LHCII) and elicited a photochemical reaction within the reaction center of PSII. The same physical formulation, following Porcar-Castell et al. [1], can be deduced for the Fraunhofer oxygen absorption line at 760 nm, which relates mostly to the fluorescence emitted from the PhotoSystem I super complex. The fluorescence yield at 760 nm will be:
With the same definitions as above, and with a change in the origin of the emission of fluorescence to PSI and not PSII, the fast-non-radiative rate coefficients kchl and kre can be integrated into kD and Equations (2) and (3) can be placed into Equation (1), where the yield of fluorescence in each absorption line is the actual fluorescence emitted:
The tag annotation on each constant on the right-hand side of Equation (4) refers to its origin—PSII and PSI are k’’ and k’, respectively. The physical interpretation of Equation (4) suggests that the SIF-related term on the left side of Equation (4) behaves in general as an exponential decay function which appears on the right-hand side of Equation (4). By isolating the complex term in the denominator on the right side of Equation (4) without considering light intensity (I) and by taking the overall absorbed energy within the photosynthetic apparatus (A), one can relate the fluorescence emitted on both of the Fraunhofer oxygen absorption lines to the overall attenuation of the complex term:
where this fluorescence ratio at the right side of Equation (5) has been shown in the past to relate to light use efficiency [10]. The objective of this study is to first examine how the RS-ETRi is attenuated along the growing season of the corn against the background of a fertilization gradient experiment; then, to compare it to various established reflectance-based vegetation indices that report on canopy structure and stress. Finally, it is interesting to examine how the SIF ratio in the right side of Equation (5) is attenuated along the season when taking into account that what is actually changing is the left-hand side of the equation.
2. Materials and Methods
2.1. Experimental Set-Up
The information presented in this communication is extracted from the same data set presented in Liran et al. (2020). Essentially, five biological repeats of Z. mays cultivar ‘super sweet’ (sh2) were seeded in quads, on the background of a fertilization gradient organized in random blocks. Slow-release fertilizer granules (Multicote 17:5:17 N:P:K + 2MgO + micronutrients, Haifa Chemicals LTD, Haifa, Israel) were put in the center of each pot roughly 10 cm below the top layer of soil in the middle of each pot. Concentration of nitrogen treatments in that study included: control (no addition of fertilizer), 30, 60, 150, 300, 300′ ppm N. The last treatment was designated 300′, because it was the same dose but twice the release speed in order to imitate a higher concentration in the soil. Seasonal growth was measured as stem length, measured with a meter stand from the last leaf base to the soil of each of the 120 plants during the season.
2.2. Remote Sensing Experimental Set-Up
The experimental setup was described in the original study, Liran et al. [7]. Generally, two units acquired reflected spectra simultaneously. One moved on a cable system (a grid of cables that was set up 4 m above the corn, where each lane received its own cable) and another was located above a 94% reflected sunlight plate (PermaFlect®, LabSphere, Sutton, NH, USA). Spectroradiometers were radiometrically calibrated with a Halogen light source (HA-910, OceanOptics, Orlando, FL, USA) according to the manufacturer’s instructions. Reflectance signatures were calculated and corrected to sun position and distance from Earth as in Gordon et al. [11]. SIF was calculated by the improved Fraunhofer’s Line Discrimination technique (iFLD) [12]. Vegetation index for cover/Leaf Area Index—MTVI2 (Modified Triangular Vegetation Index)—was calculated as in Haboudane et al. [13]; carotenoids to chlorophyll ratio in the canopy—SIPI (Structure Insensitive Pigments Index)—was calculated as in Peñuelas et al. [14]; and total chlorophyll was measured at the red-edge part of the reflectance spectrum as in Gitelson et al. [15].
2.3. Statistics Procedures and Analysis
The study included five biological repeats measured in quadruplicates per fertilizer concentration treatment. The statistical analysis was performed only on the biologically repetitive values, while the technical repeats were averaged and considered as one biological repeat each. Procedures carried out in this study were performed with SPSS software (SPSS©, Chicago, IL, USA). Fertilizer concentration groups were checked for normality with Shapiro–Wilk’s test and homogeneity of variances were checked with Levene’s tests. In case both tests were valid, a one-way ANOVA was carried out with Tukey’s post hoc test to determine differences between groups. In case the Levene’s test was in violation, a Welch’s ANOVA was performed instead. In case Shapiro–Wilk’s test was violated, a Kruskal–Wallis H test with Dunn–Bonferroni post hoc comparison was performed instead, together with an examination of sphericity in the data as a pre-requisite for the non-parametric analysis. Statistically significant differences were always determined at p < 0.05. Comparisons of each concentration group during the season was carried out with a repeated measures one-way ANOVA and Bonferroni adjustment for comparison between the main effects. In case the test for normality was violated, a non-parametric Friedman’s test was used instead with Bonferroni’s adjusted pair-wise comparisons as a post hoc test. Statistically significant differences were always determined at p < 0.05.
3. Results
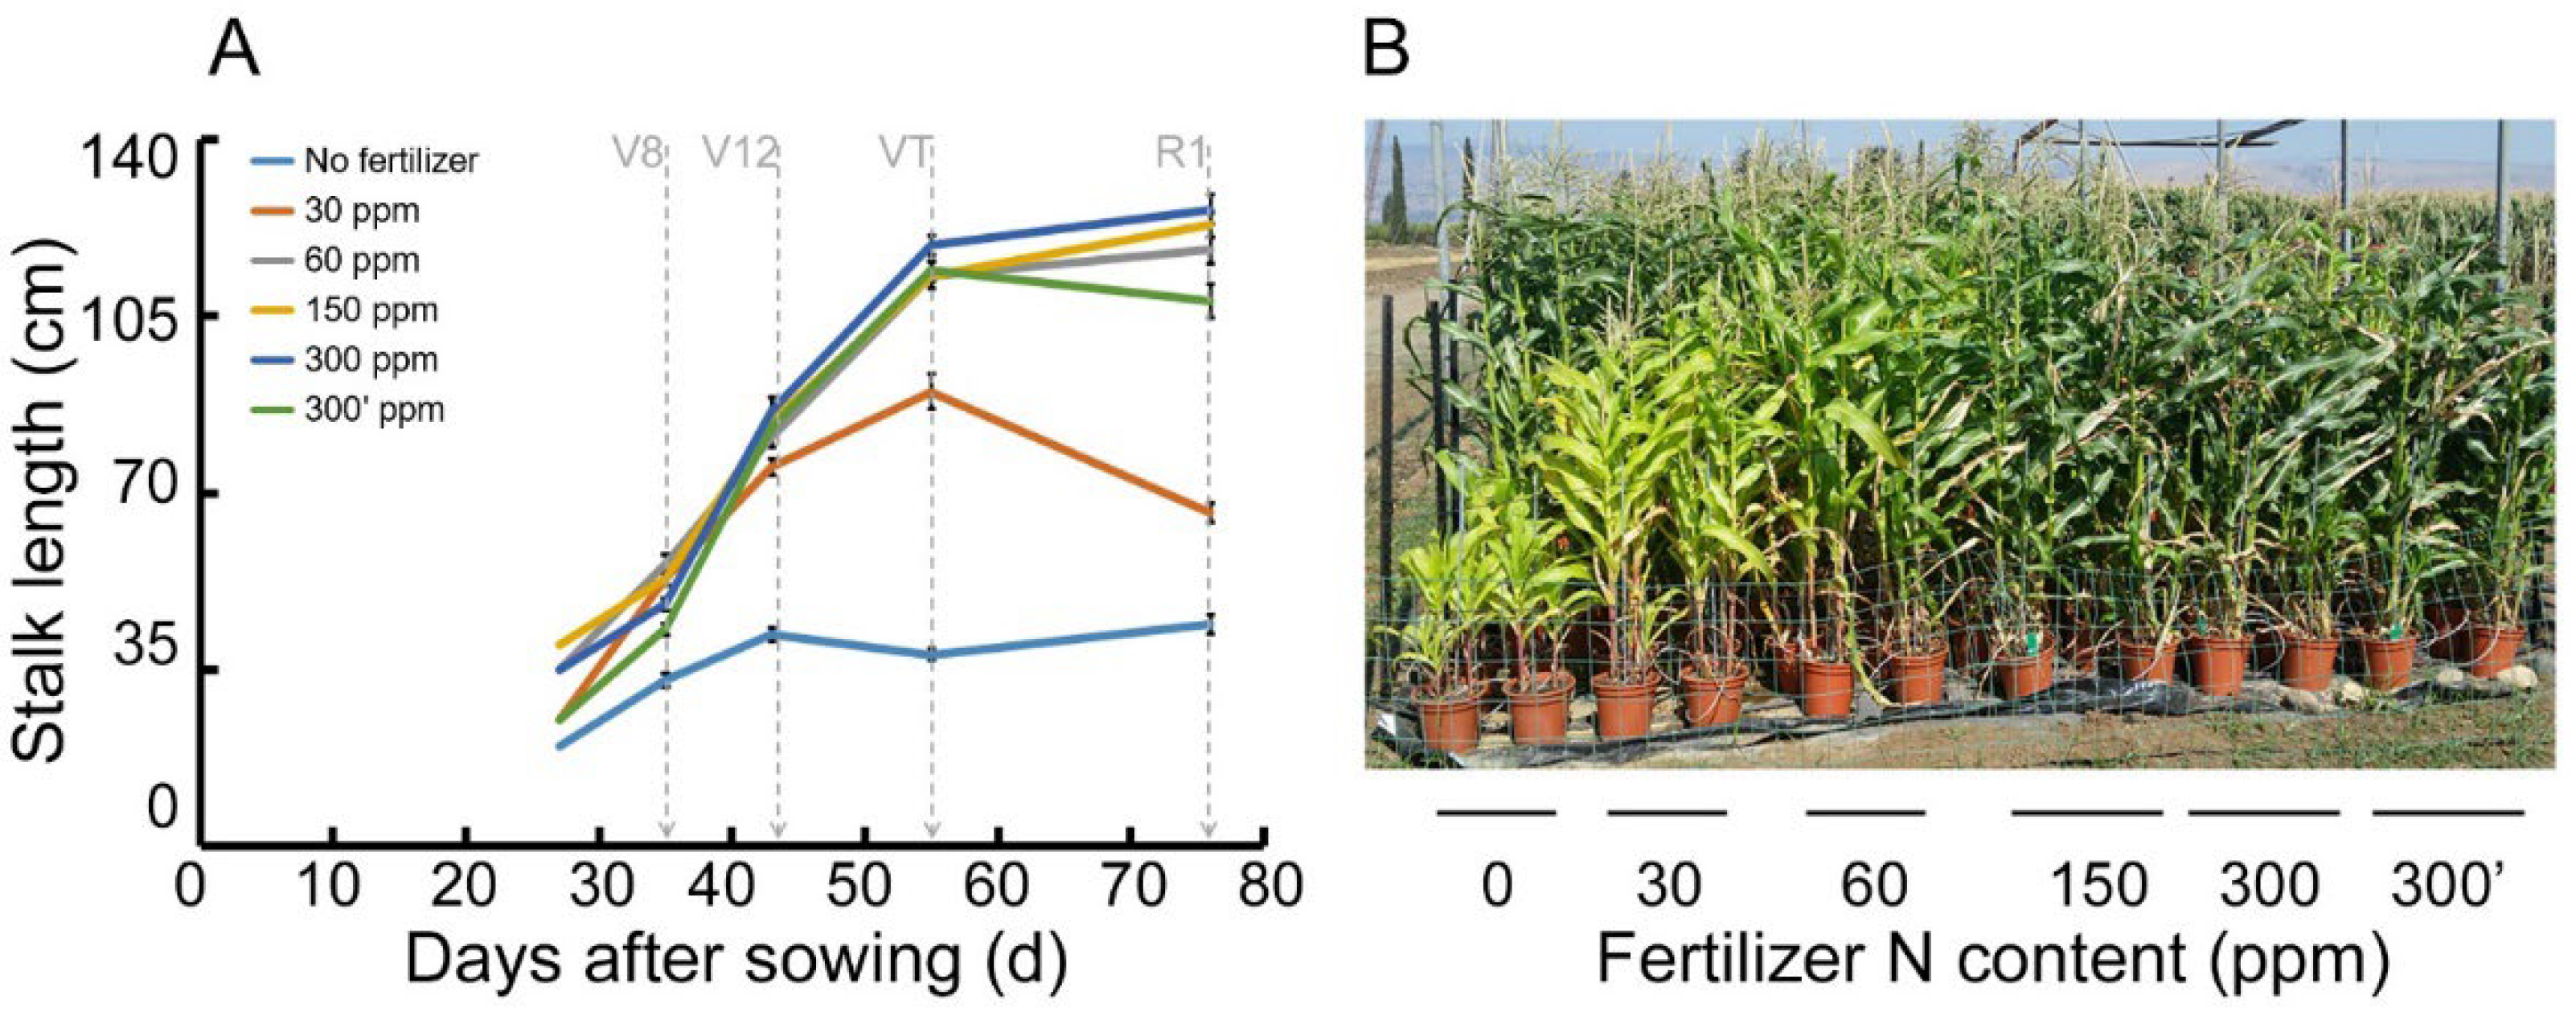
Stalk height of Z. mays (‘Super sweet’, sh2) was measured along the growing season (Figure 1). Each plant’s height increased along the season as expected, where the non-fertilized plant height was lowest, and there was an increase in growing height with increased fertilizer (Figure 1A). There was a statistically significant difference between each of the fertilization treatments and the control, but not between the fertilization treatments themselves. An RGB picture taken during the VT stage demonstrates the effect of the fertilization treatments gradient on the phenotype of the corn (Figure 1B).
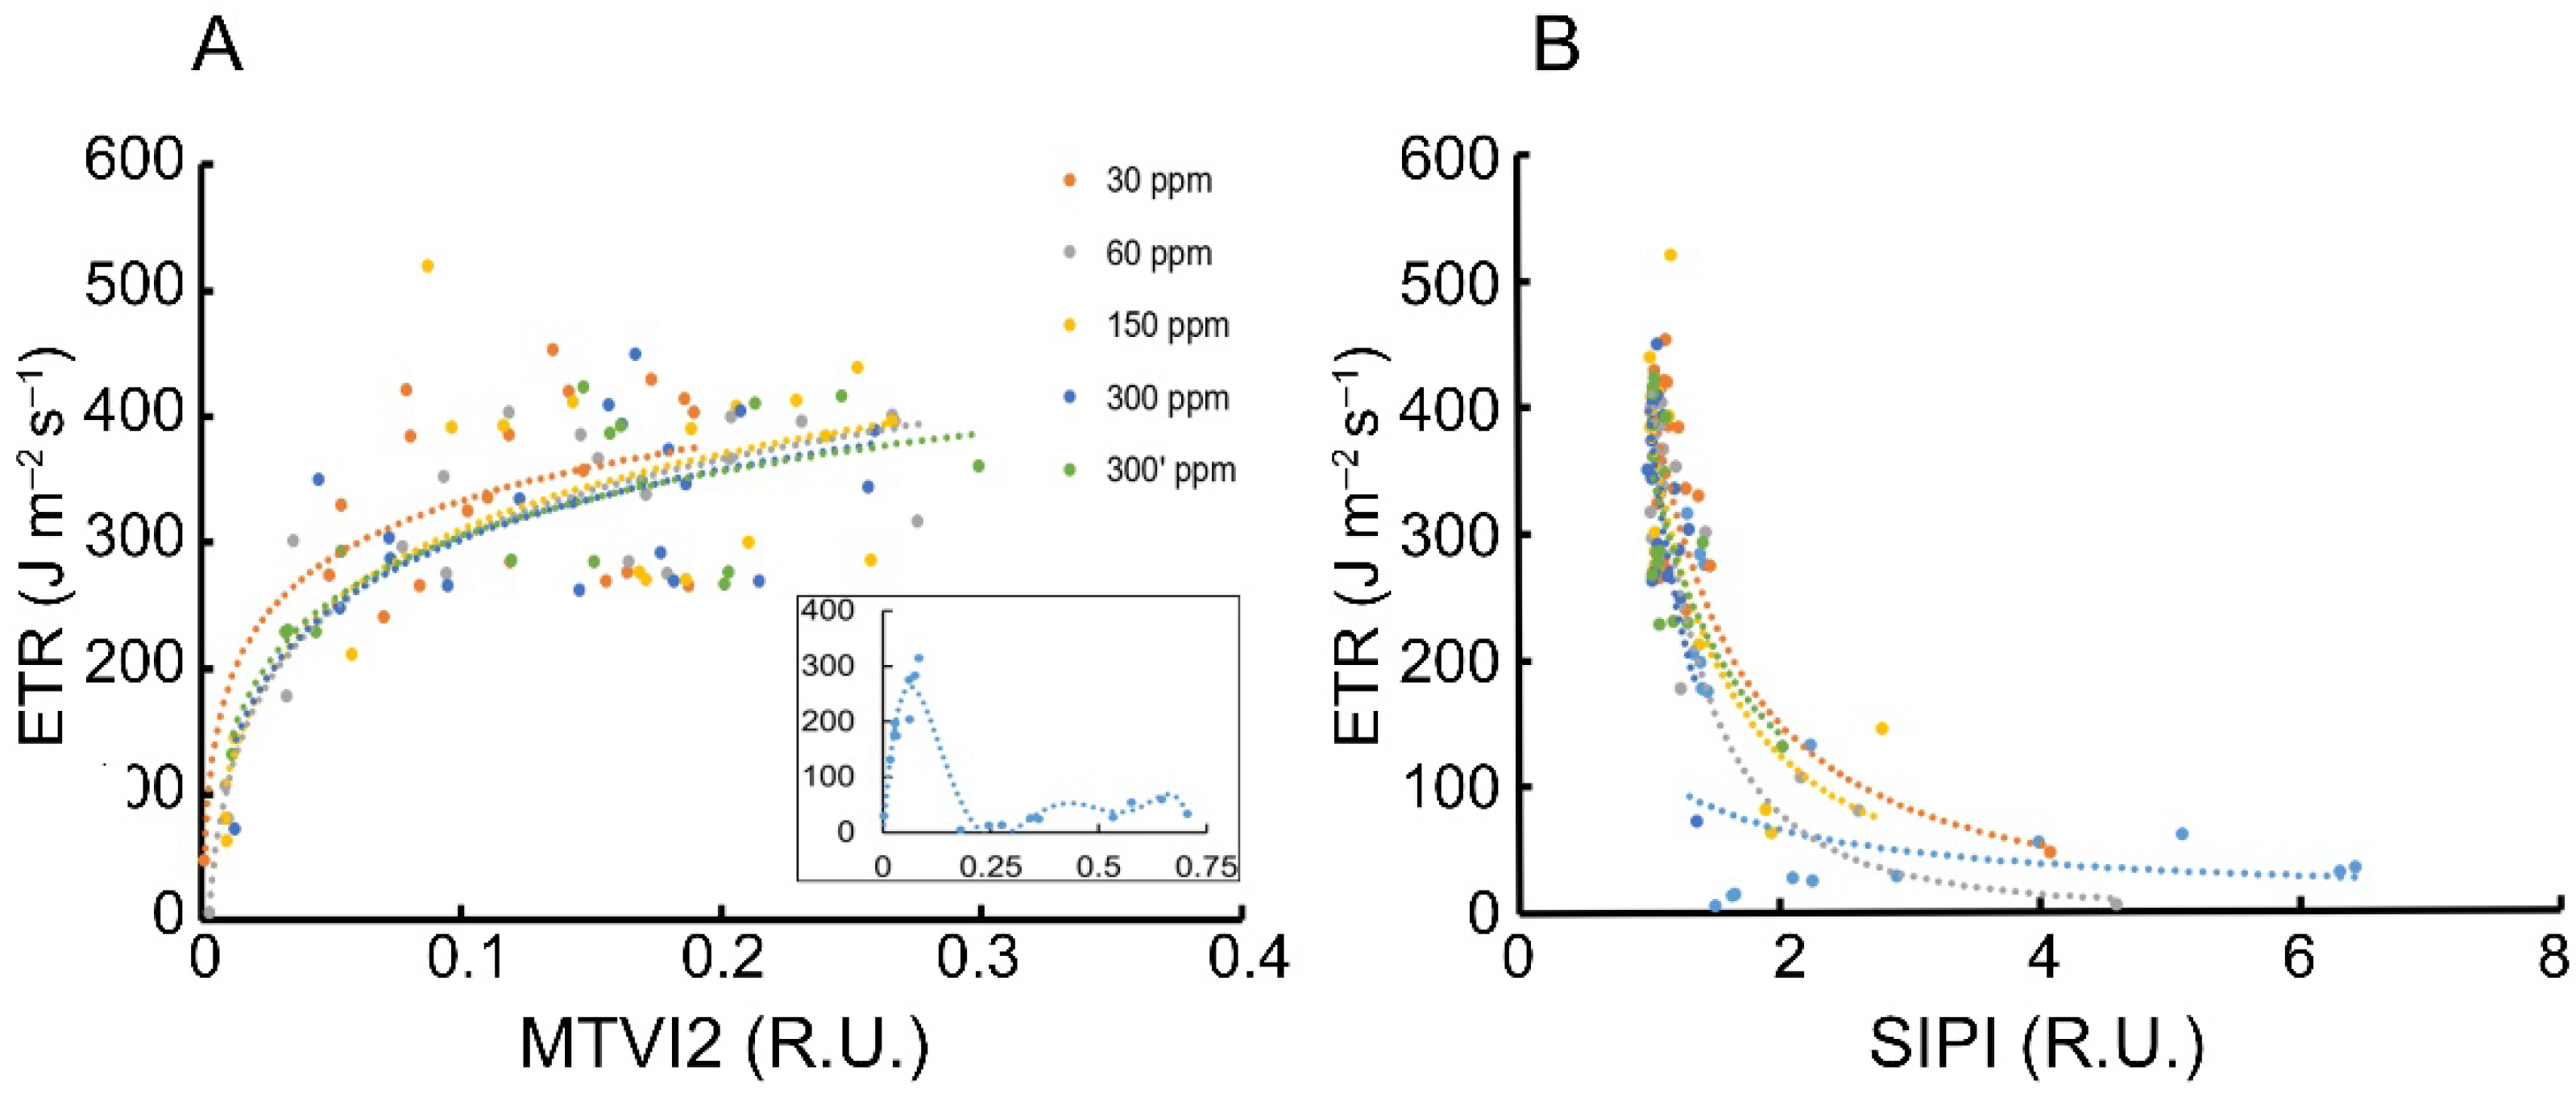
The electron transport rate index (RS-ETRi) (Equation (1)) was compared with established remote sensing indices: canopy structure/Leaf Area Index, which increases with growth, and carotenoid levels normalized to total chlorophyll, which increases when crops are in stress (Figure 2). RS-ETRi increases logarithmically with increasing Leaf Area Index (LAI) (represented as MTVI2 (Figure 2A)). However, with continuous increase in LAI, the RS-ETRi reached an asymptote, and this was true for every fertilization treatment except the control (Figure 2A-inset). RS-ETRi presented an exponentially decreasing trend with increasing SIPI index (Figure 2B). Unlike MTVI2, ETR responded oppositely to increasing SIPI, which responds in turn to an increase in carotenoids, which were normalized to chlorophyll a. Here, with increasing carotenoids, which implies the development of stress, the ETR rate decreased, as expected.
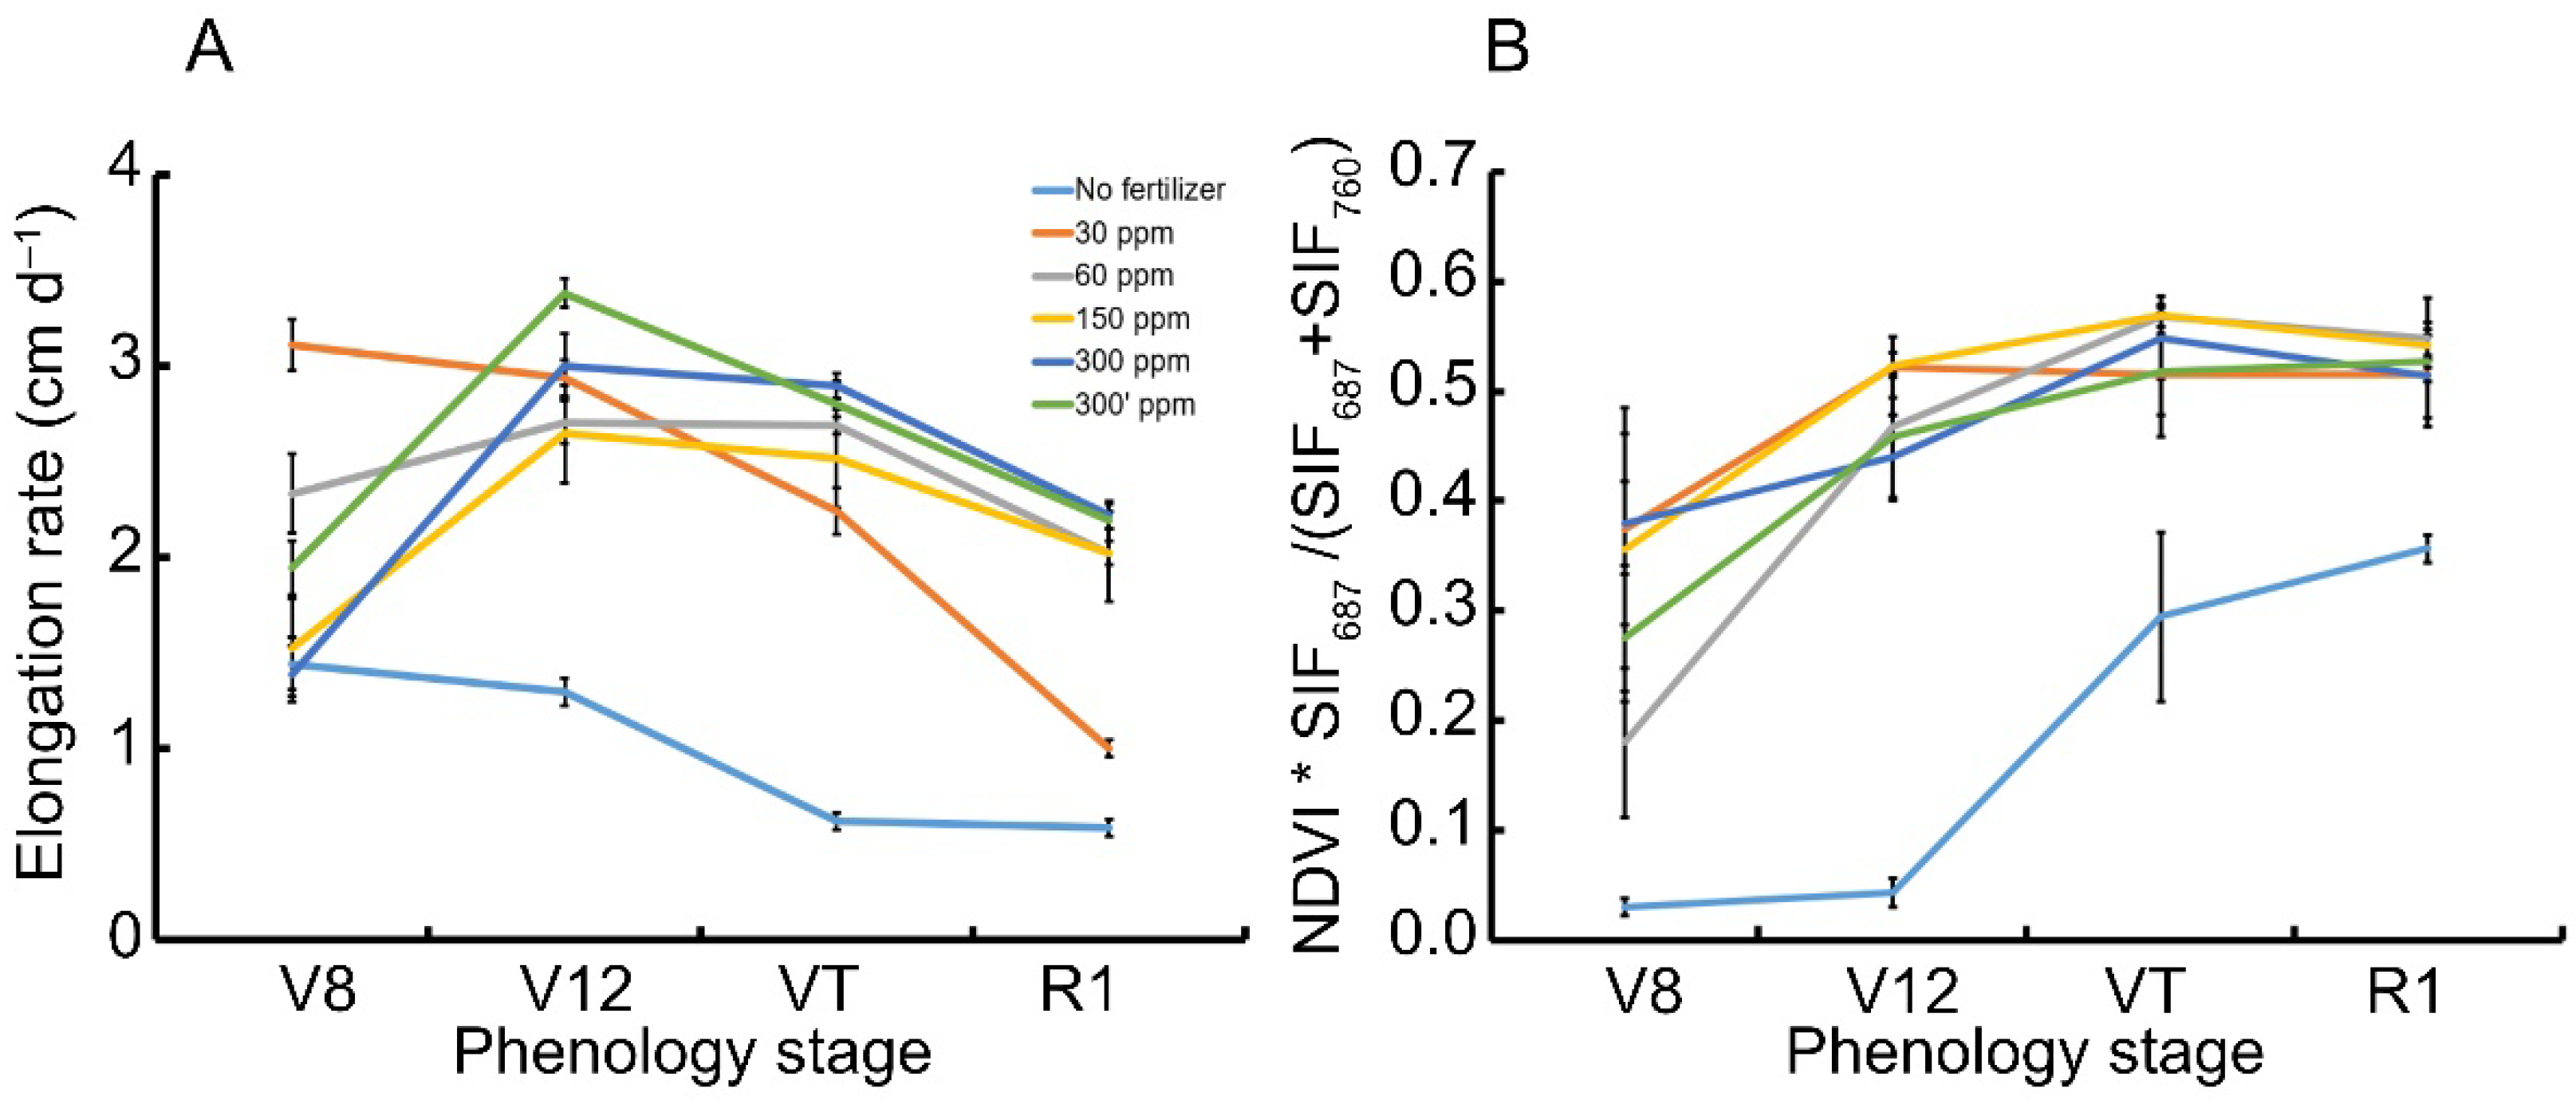
The RS-ETRi index can be left unscaled with regard to light intensity when considering the term which is built out of SIF measurements multiplied by NDVI only in Equation (1). The study examines whether this term can be considered as related to actual biomass production rate (Figure 3), given that at leaf level, the electron transport rate formulation without the use of light intensity is considered to be an effective quantum yield of the system [16]. Besides the negative control and the lowest fertilization treatment, which declined rapidly (Figure 3A), there seems to be an increase in elongation rate until V12 and then a decrease towards R1. This is expected, where the crop transfers between the vegetative to the reproductive stage (control and the low fertilization rate were ignored as they represent nutritional limitation conditions which are beyond the scope of the current communication). The unscaled index measured shows different kinetics (Figure 3B), which is only similar to the elongation rate. The curves of the fertilized treatments show a logarithmic trend, which becomes asymptotic towards the reproductive stage. This is expected, because the light use continues but the developing corn cobs become a major sink for assimilates at this stage on behalf of continued canopy development (see Jans et al. [17]). The fertilized treatments did not differ from one another at each measurement date, as can be seen in the figure.
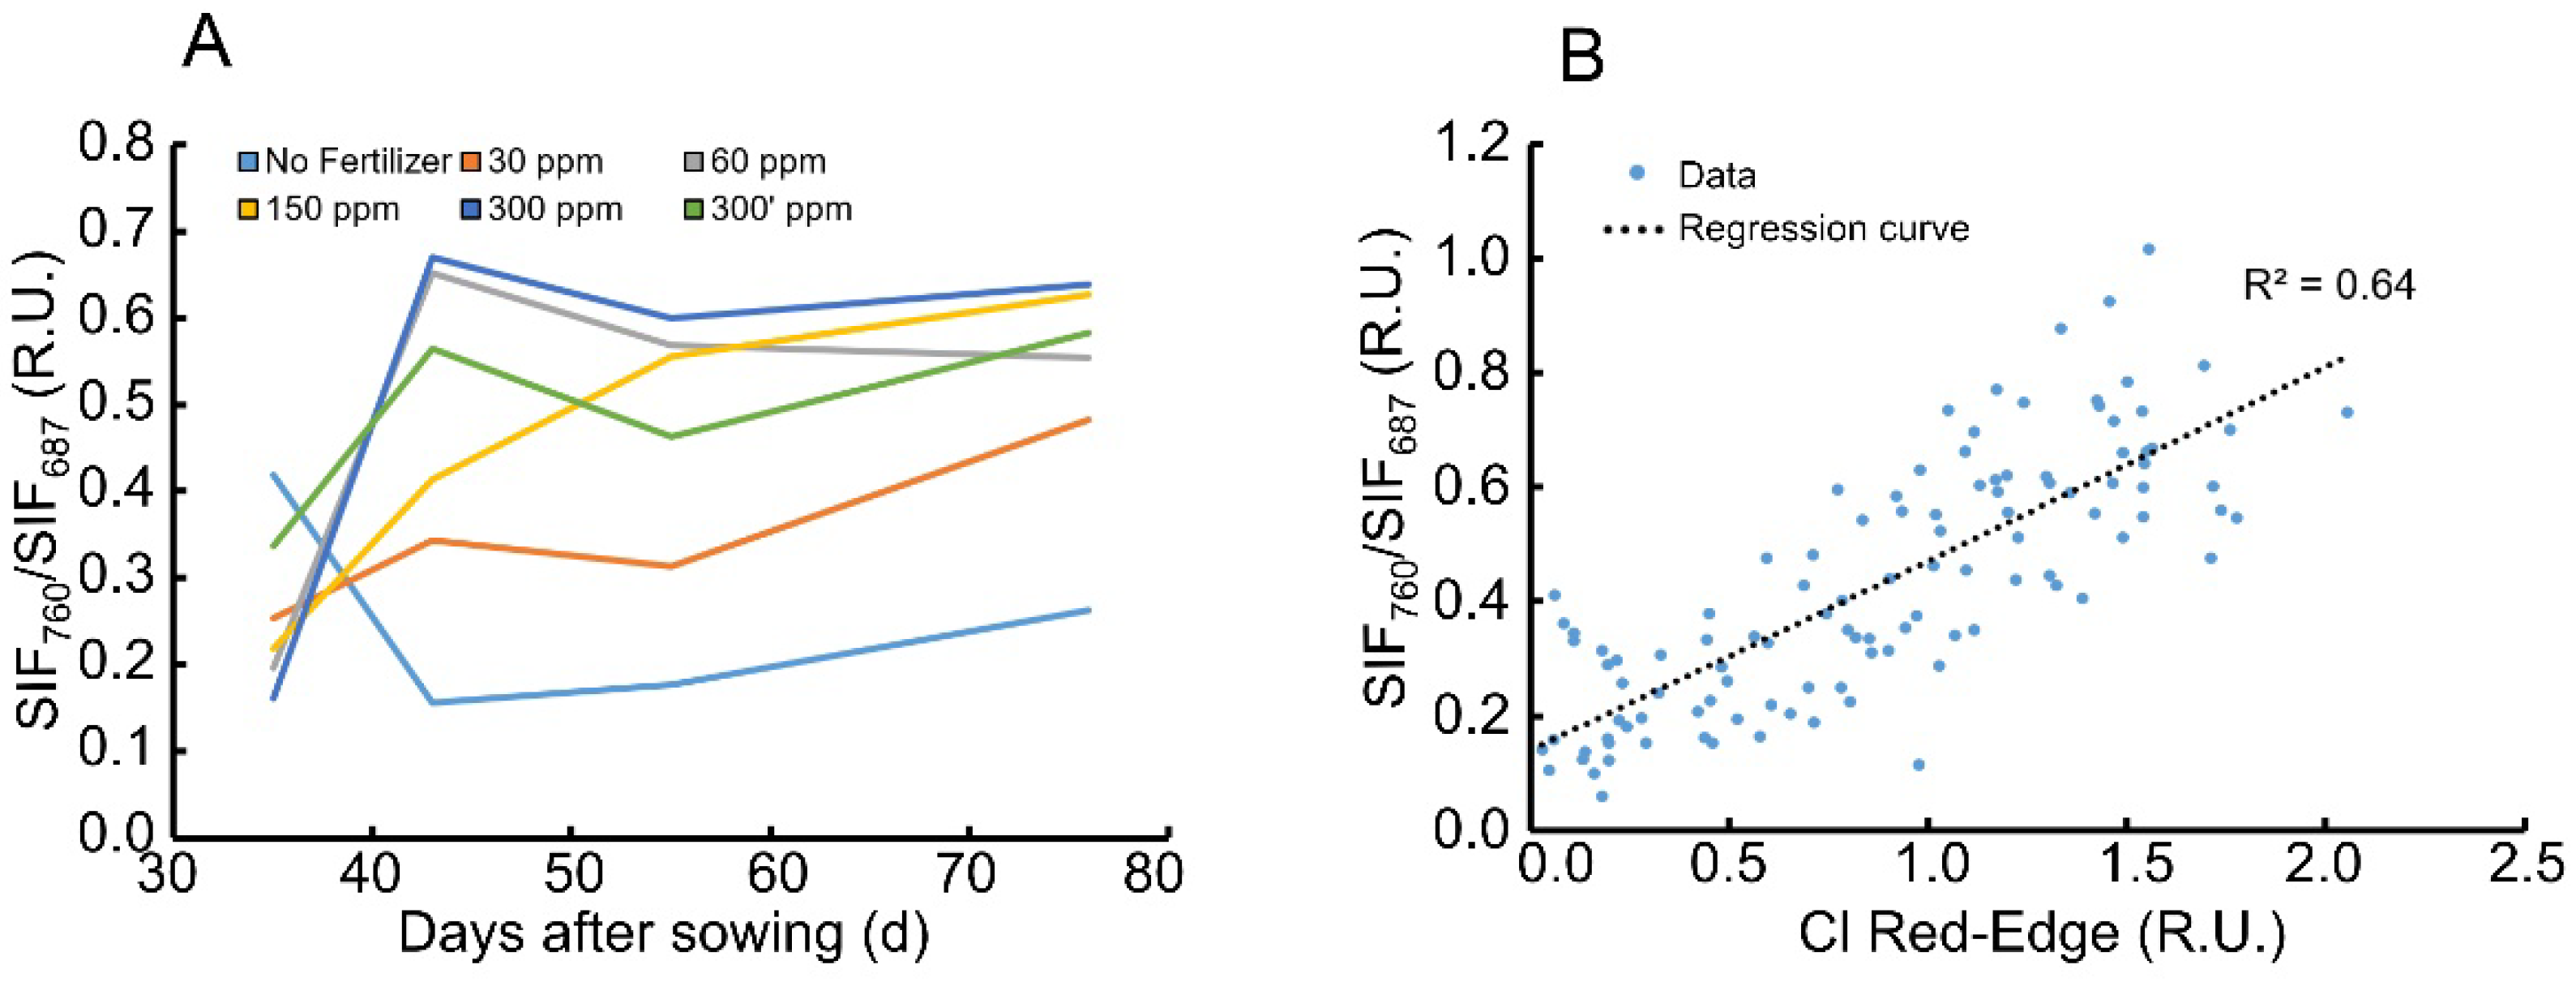
The ratio of the SIF as written in the right side of Equation (5) was calculated for the data along the season in order to track its seasonal variation (Figure 4A). The SIF ratio presented a similar attenuation to the seasonal attenuation in length, where the trends are more separated between fertilization treatments when compared to the seasonal growth attenuation (compare Figure 4A to Figure 1A). The ratio reached a plateau quite quickly, already within 40 days after sowing, but there was no direct relationship between the behavior of the curves and the level of fertilization, which implies a more complex regulation at the level of photosystems when it came to nitrogen concentration. Another index that senses chlorophyll content in plants—the chlorophyll red-edge index—showed similar attenuations to the SIF ratio (Figure 4B), where it covaried positively with the SIF ratio at 65%. There is, however, a large variance around the values of the ratio, which implies the need to break down each term on the left side of Equation (5) further. An increase in chlorophyll content can be the outcome of an increase in photosystems units and/or light harvesting complexes. However, the energy divided between the two photosystems during light absorption may be changed according to the plant’s needs. This will affect the absorption cross section of each of the photosystems and the alpha ratio seen in Equation (5). In turn, it contributes to the spread profile of the varied samples (Figure 4B). This goes along with the SIF ratio in Equation (5) and shows that this ratio is affected by the ratio of the absorption cross section of PSII/PSI.
4. Discussion
This communication suggests a structural formulation between the photosynthesis light reaction rate coefficients and the new spectral index for remote sensing of electron transport rate in plants (RS-ETRi) [7]. The RS-ETRi has a non-linear relationship with traditional vegetation indices—MTVI2 [13] and SIPI [14]. This correlation is justified where ETR (photosynthetic activity of Photosystem II) increases with an increase in canopy structure, which may increase the amount of leaves, and therefore increase the overall concentration of photosynthetic units which can perform photosynthesis (Figure 2A,B) [18,19]. ETR declines with an increase in carotenoids, which are part of the photoprotective mechanism. This is due to the fact that part of the energy is dissipated via the xanthophyll cycle [20]. Tadmor et al. [21] show that an increase in the energetic quenching by non-photochemical quenching results in an increase in the overall NPQ fraction. In the left side of Equation (4), the kNPQII will increase because more energy is dissipated through the xanthophyll cycle. This will increase the value of the denominator of the ETR index, and thereby reduce its overall value. The current photosynthetic dogma suggests that the fluorescence emitted at the 760 nm is mostly derived from antenna complexes of PSII [1,22]. Yet, Klughammer and Schreiber (2021) show that PSI obtains variable fluorescence which is measurable and quantifiable [23], therefore our prior assumption to relate the fluorescence emitted and detected in 760 nm mostly to that coming from PSI is valid. Moreover, the relative absorption cross-section ratio between PSII and PSI also present in this term is related to the regulated balance of absorbed energy between the two photosystems [24]. This relation in this study’s equation is scaled by the fluorescence emission from each of the photosystems. Finally, the non-conforming trend of the non-fertilized treatment (Figure 2A-subset) may come from the MTVI2 index itself, as the plants with zero fertilizer groups did not grow normally and already stopped expanding at the initial growth stage (see the leftmost potted corn in Figure 1B). Kross, A. et al. [25] states that MTVI2 obtains a poor performance in the initial stages of corn growth in an N fertilizer gradient sensed from a RapidEye system, corroborating our results. Liu, J. et al. [26] states that MTVI2 is very sensitive only to high leaf area index, which also corroborates the results of this study.
The established leaf ETR formulation [16] includes a multiplication of the light energy that is absorbed by the leaf and the effective quantum yield at the time of measurement. Its direct translation to the RS-ETRi index multiplies NDVI with the special SIF term in the left side of Equation (4). This is because NDVI has been shown in the past to reflect the fraction of light that was absorbed in the canopy and was used in photosynthesis [8]. Therefore, the product of NDVI and the special SIF term can be interpreted as a successful electron transfer after absorption of light (Figure 3) [7]. There are discrepancies in the general trend between the actual biomass production rate, measured in this study as stem length (Figure 3A) and the multiplication product of the NDVI with the SIF term (Figure 3B). This may indicate that the stem elongation is not the best predictor of biomass production rate; therefore, using a more direct methods is required (e.g., carbon assimilation measurement [4] or actual biomass production quantification along or at the end of the growing season [27]). Finally, previous works have presented the relationship between total chlorophyll and the SIF ratio, as we show in this communication (Figure 4). Hak et al. (1990) [28] showed that the flipped ratio is inversely related to the concentration of total chlorophyll measured in the laboratory, which corroborates this study’s results—a positive relationship is shown between the ratio and a remote sensing index of total chlorophyll. Middleton et al. [10] related the fluorescence ratio 687/760 to the light use efficiency of the photosynthetic apparatus and therefore to productivity, although Freedman et al. [29] showed that this ratio was related more to nutrient stress and increased with decreasing photosynthetic activity. The RS-ETRi index was sensitive to both of the above-mentioned cases, and showed a good differentiation between nutrient stress (light blue curve in the figures, the control which did not receive fertilizer) and fertilized plants. The constructed RS-ETRi index here provides the missing link between SIF information and the mechanisms that underlie the measurable activity of the photosynthetic apparatus, in biophysical terms.
The weakness of this communication lies in the fact that stalk length is used as a standard practice for assessing final crop yield, as is used by growers and corn specialists [30], instead of actual biomass quantification. Additional experimentation which pertains to each process (the left term of Equation (5)) within the photosynthetic apparatus of light reactions is required to elaborate on this complex formulation and how it affects the overall fluorescence emission. There are several future uses stemming from the structural equation suggested in this communication. There are recent publications on the fact that SIF may report on additional processes of the photosynthetic apparatus other than photosystem activity [6]. One part of the fluorescence emitted on the Fraunhofer line at 760 nm may be related to photoprotective mechanisms. This occurs due to fluorescence emitted from transitioned light harvesting complexes of PSII to PSI during stress. Therefore, it is crucial to extract the correct fraction of the emitted fluorescence that is related to photochemistry. Working with mutants of the photosynthetic apparatus and isolating each of the reactions that are manifested in the left side of Equation (5) could contribute to achieving an overall understanding of how each of the rate coefficients change independently with relation to the conditions that are experienced by the plant during measurement. Advanced computational modeling can, in principle, simulate how this equation attenuates the electron transport rate given theoretical as well as real-world conditions. This modeling approach would be useful for identifying sub-optimal photosynthesizing patches in agriculture fields, and screening of new varieties through breeding. Eventually, using this model on periodic satellite scans of RS-ETRi will aid in understanding how global warming affects crops and attenuation in yield [31].
5. Conclusions
The formulation of a structural equation relating ETR to photosynthesis activity links the emitted fluorescence sensed from whole plant to the intricate mechanisms of light use by the plant. The implementation of molecular spectroscopy rate constants in the formulation of the RS-ETRi makes it possible to quantify the relative importance of the various processes of light utilization involved in photosynthesis. This formulation could serve as the center of key research activities on plant canopies under natural conditions: a. dissection of each part of the complex model using plant mutants or inhibitors such that each part of the light reactions can be researched for its proportion in the overall fluorescence signal; b. implementation in advanced computer models in an effort to understand how the photosynthetic apparatus responds to various environmental conditions; c. indirect calculation of biomass production rate from SIF retrieved from satellites orbiting earth, which may contribute to the understanding of how climate change and global warming affect crop production and ecological processes.
Funding
This research received no external funding.
Data Availability Statement
Data are available upon request from the corresponding author.
Conflicts of Interest
The author declares no conflict of interest.
References
- Porcar-Castell, A.; Tyystjärvi, E.; Atherton, J.; van der Tol, C.; Flexas, J.; Pfündel, E.E.; Moreno, J.; Frankenberg, C.; Berry, J.A. Linking Chlorophyll a Fluorescence to Photosynthesis for Remote Sensing Applications: Mechanisms and Challenges. J. Exp. Bot. 2014, 65, 4065–4095. [Google Scholar] [CrossRef] [PubMed]
- Mohammed, G.H.; Colombo, R.; Middleton, E.M.; Rascher, U.; van der Tol, C.; Nedbal, L.; Goulas, Y.; Pérez-Priego, O.; Damm, A.; Meroni, M. Remote Sensing of Solar-Induced Chlorophyll Fluorescence (SIF) in Vegetation: 50 Years of Progress. Remote Sens. Environ. 2019, 231, 111177. [Google Scholar] [CrossRef] [PubMed]
- Guanter, L.; Zhang, Y.; Jung, M.; Joiner, J.; Voigt, M.; Berry, J.A.; Frankenberg, C.; Huete, A.R.; Zarco-Tejada, P.; Lee, J.-E.; et al. Global and Time-Resolved Monitoring of Crop Photosynthesis with Chlorophyll Fluorescence. Proc. Natl. Acad. Sci. USA 2014, 111, E1327–E1333. [Google Scholar] [CrossRef] [PubMed] [Green Version]
- Dechant, B.; Ryu, Y.; Badgley, G.; Zeng, Y.; Berry, J.A.; Zhang, Y.; Goulas, Y.; Li, Z.; Zhang, Q.; Kang, M. Canopy Structure Explains the Relationship between Photosynthesis and Sun-Induced Chlorophyll Fluorescence in Crops. Remote Sens. Environ. 2020, 241, 111733. [Google Scholar] [CrossRef] [Green Version]
- Marrs, J.K.; Reblin, J.S.; Logan, B.A.; Allen, D.W.; Reinmann, A.B.; Bombard, D.M.; Tabachnik, D.; Hutyra, L.R. Solar-Induced Fluorescence Does Not Track Photosynthetic Carbon Assimilation Following Induced Stomatal Closure. Geophys. Res. Lett. 2020, 47, e2020GL087956. [Google Scholar] [CrossRef]
- Acebron, K.; Matsubara, S.; Jedmowski, C.; Emin, D.; Muller, O.; Rascher, U. Diurnal Dynamics of Nonphotochemical Quenching in Arabidopsis Npq Mutants Assessed by Solar-Induced Fluorescence and Reflectance Measurements in the Field. New Phytol. 2021, 229, 2104–2119. [Google Scholar] [CrossRef] [PubMed]
- Liran, O.; Shir, O.M.; Levy, S.; Grunfeld, A.; Shelly, Y. Novel Remote Sensing Index of Electron Transport Rate Predicts Primary Production and Crop Health in L. Sativa and Z. Mays. Remote Sens. 2020, 12, 1718. [Google Scholar] [CrossRef]
- Badgley, G.; Field, C.B.; Berry, J.A. Canopy Near-Infrared Reflectance and Terrestrial Photosynthesis. Sci. Adv. 2017, 3, e1602244. [Google Scholar] [CrossRef] [Green Version]
- Lavergne, J.; Trissl, H.-W. Theory of Fluorescence Induction in Photosystem II: Derivation of Analytical Expressions in a Model Including Exciton-Radical-Pair Equilibrium and Restricted Energy Transfer between Photosynthetic Units. Biophys. J. 1995, 68, 2474–2492. [Google Scholar] [CrossRef] [Green Version]
- Middleton, E.M.; Cheng, Y.-B.; Campbell, P.E.; Huemmrich, K.F.; Corp, L.A.; Bernardes, S.; Zhang, Q.; Landis, D.R.; Kustas, W.P.; Daughtry, C.S.T.; et al. Multi-Angle Hyperspectral Observations Using Fluorescence and PRI to Detect Plant Stress and Productivity in a Cornfield. In Proceedings of the 9th EARSeL Imaging Spectroscopy Workshop, Luxembourg, 14–16 April 2015; pp. 27–39. [Google Scholar]
- Gordon, H.R.; Wang, M. Influence of Oceanic Whitecaps on Atmospheric Correction of Ocean-Color Sensors. Appl. Opt. AO 1994, 33, 7754–7763. [Google Scholar] [CrossRef]
- Alonso, L.; Gomez-Chova, L.; Vila-Frances, J.; Amoros-Lopez, J.; Guanter, L.; Calpe, J.; Moreno, J. Improved Fraunhofer Line Discrimination Method for Vegetation Fluorescence Quantification. IEEE Geosci. Remote Sens. Lett. 2008, 5, 620–624. [Google Scholar] [CrossRef]
- Haboudane, D.; Miller, J.R.; Pattey, E.; Zarco-Tejada, P.J.; Strachan, I.B. Hyperspectral Vegetation Indices and Novel Algorithms for Predicting Green LAI of Crop Canopies: Modeling and Validation in the Context of Precision Agriculture. Remote Sens. Environ. 2004, 90, 337–352. [Google Scholar] [CrossRef]
- Penuelas, J.; Baret, F.; Filella, I. Semi-Empirical Indices to Assess Carotenoids/Chlorophyll a Ratio from Leaf Spectral Reflectance. Photosynthetica 1995, 31, 221–230. [Google Scholar]
- Gitelson, A.A.; Merzlyak, M.N.; Lichtenthaler, H.K. Detection of Red Edge Position and Chlorophyll Content by Reflectance Measurements near 700 nm. J. Plant Physiol. 1996, 148, 501–508. [Google Scholar] [CrossRef]
- Maxwell, K.; Johnson, G.N. Chlorophyll Fluorescence—A Practical Guide. J. Exp. Bot. 2000, 51, 659–668. [Google Scholar] [CrossRef]
- Jans, W.W.P.; Jacobs, C.M.J.; Kruijt, B.; Elbers, J.A.; Barendse, S.; Moors, E.J. Carbon Exchange of a Maize (Zea Mays L.) Crop: Influence of Phenology. Agric. Ecosyst. Environ. 2010, 139, 316–324. [Google Scholar] [CrossRef]
- Gamon, J.A.; Field, C.B.; Goulden, M.L.; Griffin, K.L.; Hartley, A.E.; Joel, G.; Penuelas, J.; Valentini, R. Relationships Between NDVI, Canopy Structure, and Photosynthesis in Three Californian Vegetation Types. Ecol. Appl. 1995, 5, 28–41. [Google Scholar] [CrossRef] [Green Version]
- Ewert, F. Modelling Plant Responses to Elevated CO2: How Important Is Leaf Area Index? Ann. Bot. 2004, 93, 619–627. [Google Scholar] [CrossRef] [Green Version]
- Müller, P.; Li, X.-P.; Niyogi, K.K. Non-Photochemical Quenching. A Response to Excess Light Energy. Plant Physiol. 2001, 125, 1558–1566. [Google Scholar] [CrossRef] [Green Version]
- Tadmor, Y.; Raz, A.; Reikin-Barak, S.; Ambastha, V.; Shemesh, E.; Leshem, Y.; Crane, O.; Stern, R.A.; Goldway, M.; Tchernov, D.; et al. Metamitron, a Photosynthetic Electron Transport Chain Inhibitor, Modulates the Photoprotective Mechanism of Apple Trees. Plants 2021, 10, 2803. [Google Scholar] [CrossRef]
- Franck, F.; Juneau, P.; Popovic, R. Resolution of the Photosystem I and Photosystem II Contributions to Chlorophyll Fluorescence of Intact Leaves at Room Temperature. Biochim. Biophys. Acta (BBA)-Bioenerg. 2002, 1556, 239–246. [Google Scholar] [CrossRef] [Green Version]
- Schreiber, U.; Klughammer, C. Evidence for Variable Chlorophyll Fluorescence of Photosystem I in Vivo. Photosynth. Res. 2021, 149, 213–231. [Google Scholar] [CrossRef] [PubMed]
- Yamazaki, J. Changes in the Photosynthetic Characteristics and Photosystem Stoichiometries in Wild-Type and Chl b-Deficient Mutant Rice Seedlings under Various Irradiances. Photosynthetica 2010, 48, 521–529. [Google Scholar] [CrossRef]
- Kross, A.; McNairn, H.; Lapen, D.; Sunohara, M.; Champagne, C. Assessment of RapidEye vegetation indices for estimation of leaf area index and biomass in corn and soybean crops. Int. J. Appl. Earth Obs. Geoinf. 2015, 34, 235–248. [Google Scholar] [CrossRef] [Green Version]
- Liu, J.; Pattey, E.; Jégo, G. Assessment of vegetation indices for regional crop green LAI estimation from Landsat images over multiple growing seasons. Remote Sens. Environ. 2012, 123, 347–358. [Google Scholar] [CrossRef]
- McSwiney, C.P.; Robertson, G.P. Nonlinear response of N2O flux to incremental fertilizer addition in a continuous maize (Zea mays L.) cropping system. Glob. Chang. Biol. 2005, 11, 1712–1719. [Google Scholar] [CrossRef]
- Hák, R.; Lichtenthaler, H.K.; Rinderle, U. Decrease of the Chlorophyll Fluorescence Ratio F690/F730 during Greening and Development of Leaves. Radiat. Environ. Biophys. 1990, 29, 329–336. [Google Scholar] [CrossRef]
- Freedman, A.; Cavender-Bares, J.; Kebabian, P.L.; Bhaskar, R.; Scott, H.; Bazzaz, F.A. Remote Sensing of Solar-Excited Plant Fluorescence as a Measure of Photosynthetic Rate. Photosynthetica 2002, 40, 127–132. [Google Scholar] [CrossRef]
- Kelly, J.; Crain, J.L.; Raun, W.R. By-Plant Prediction of Corn (Zea Mays L.) Grain Yield Using Height and Stalk Diameter. Commun. Soil Sci. Plant Anal. 2015, 46, 564–575. [Google Scholar] [CrossRef] [Green Version]
- Idris, O.A.; Opute, P.; Orimoloye, I.R.; Maboeta, M.S. Climate Change in Africa and Vegetation Response: A Bibliometric and Spatially Based Information Assessment. Sustainability 2022, 14, 4974. [Google Scholar] [CrossRef]
Figure 1.
Z. mays (‘Super sweet’, sh2) elongation during 90 days after sowing. (A) Elongation length measured from the bottom of the stalk to the last leaf base. The six fertilization treatments were ‘no fertilizer’, 30, 60, 150, 300, 300′ ppm N, and are colored in light blue, orange, grey, yellow, blue, and green, respectively. n = 5, error bars represent standard error of the mean. Vertical dashed light grey arrows represent the data acquisition occasions, where V8, V12, VT and R1 symbolize stages as follows: 8th leaf emergence, 12th leaf emergence, tasseling stage, and corn cob development, respectively. (B) RGB picture of the original experimental design as was performed in: ”Novel Remote Sensing Index of Electron Transport Rate Predicts Primary Production and Crop Health in L. sativa and Z. mays“. Available online: https://0-www-mdpi-com.brum.beds.ac.uk/2072-4292/12/11/1718/htm [7] (accessed on 1 January 2022). Only the first row out of five is clearly visible in the figure. The picture shows a snapshot of the corn growth on the background of the fertilization treatments. The picture was taken during the VT stage and the fertilization gradient treatments are organized from left to right 0–300 ′ ppm N.

Figure 2.
Covariance of the RS-ETRi index with vegetation indices related to canopy structure and stress. (A) Each point represents the covaried value between RS-ETRi and MTVI2. The six fertilization treatments were ‘no fertilizer’, 30, 60, 150, 300, 300′ ppm N, and are colored in light blue, orange, grey, yellow, blue, green, respectively, n = 5. The inset includes only the data of the no fertilization treatment. The dotted lines show the general trend and behavior of the data in each fertilization level; (B) similar to Panel A with a different vegetation index—SIPI. Colors representing the fertilization treatments are the same as in Panel (A).

Figure 3.
RS-ETRi index attenuation compared to the elongation rate of Z. mays (‘Super sweet’, sh2) along the season. Colors in both panels (A) and (B) represent fertilization treatments where light blue, orange, grey, yellow, blue and green relate to the negative control without fertilizer, 30, 60, 150, 300, and 300′ ppm N content, respectively, n = 5. Error bars represent standard error of the mean. Statistical significance differences are checked at p < 0.05. Panel A contains data already presented in the original publication: “Novel Remote Sensing Index of Electron Transport Rate Predicts Primary Production and Crop Health in L. sativa and Z. mays”. Available online: https://0-www-mdpi-com.brum.beds.ac.uk/2072-4292/12/11/1718/htm [7] (accessed on 1 January 2022).

Figure 4.
Attenuation of the SIF ratio along the season and a gradient of fertilization treatments. (A) Fertilization treatments were colored light blue, orange, grey, yellow, blue and green and relate to the negative control without fertilizer, 30, 60, 150, 300, 300′ ppm N content, respectively. n = 5 acquired in quadruplicates. Measurements were taken along the season. Differences were determined between points at a statistical significance of p < 0.05; and (B) correlation plot between the ratio of SIF and total chlorophyll index across all fertilization treatments and dates.

Publisher’s Note: MDPI stays neutral with regard to jurisdictional claims in published maps and institutional affiliations. |
© 2022 by the author. Licensee MDPI, Basel, Switzerland. This article is an open access article distributed under the terms and conditions of the Creative Commons Attribution (CC BY) license (https://creativecommons.org/licenses/by/4.0/).
Share and Cite
MDPI and ACS Style
Liran, O. Formulation of a Structural Equation Relating Remotely Sensed Electron Transport Rate Index to Photosynthesis Activity. Remote Sens. 2022, 14, 2439. https://0-doi-org.brum.beds.ac.uk/10.3390/rs14102439
AMA Style
Liran O. Formulation of a Structural Equation Relating Remotely Sensed Electron Transport Rate Index to Photosynthesis Activity. Remote Sensing. 2022; 14(10):2439. https://0-doi-org.brum.beds.ac.uk/10.3390/rs14102439
Chicago/Turabian StyleLiran, Oded. 2022. "Formulation of a Structural Equation Relating Remotely Sensed Electron Transport Rate Index to Photosynthesis Activity" Remote Sensing 14, no. 10: 2439. https://0-doi-org.brum.beds.ac.uk/10.3390/rs14102439
Note that from the first issue of 2016, this journal uses article numbers instead of page numbers. See further details here.