
Aerosol Distributions and Sahara Dust Transport in Southern Morocco, from Ground-Based and Satellite Observations

 , , , and
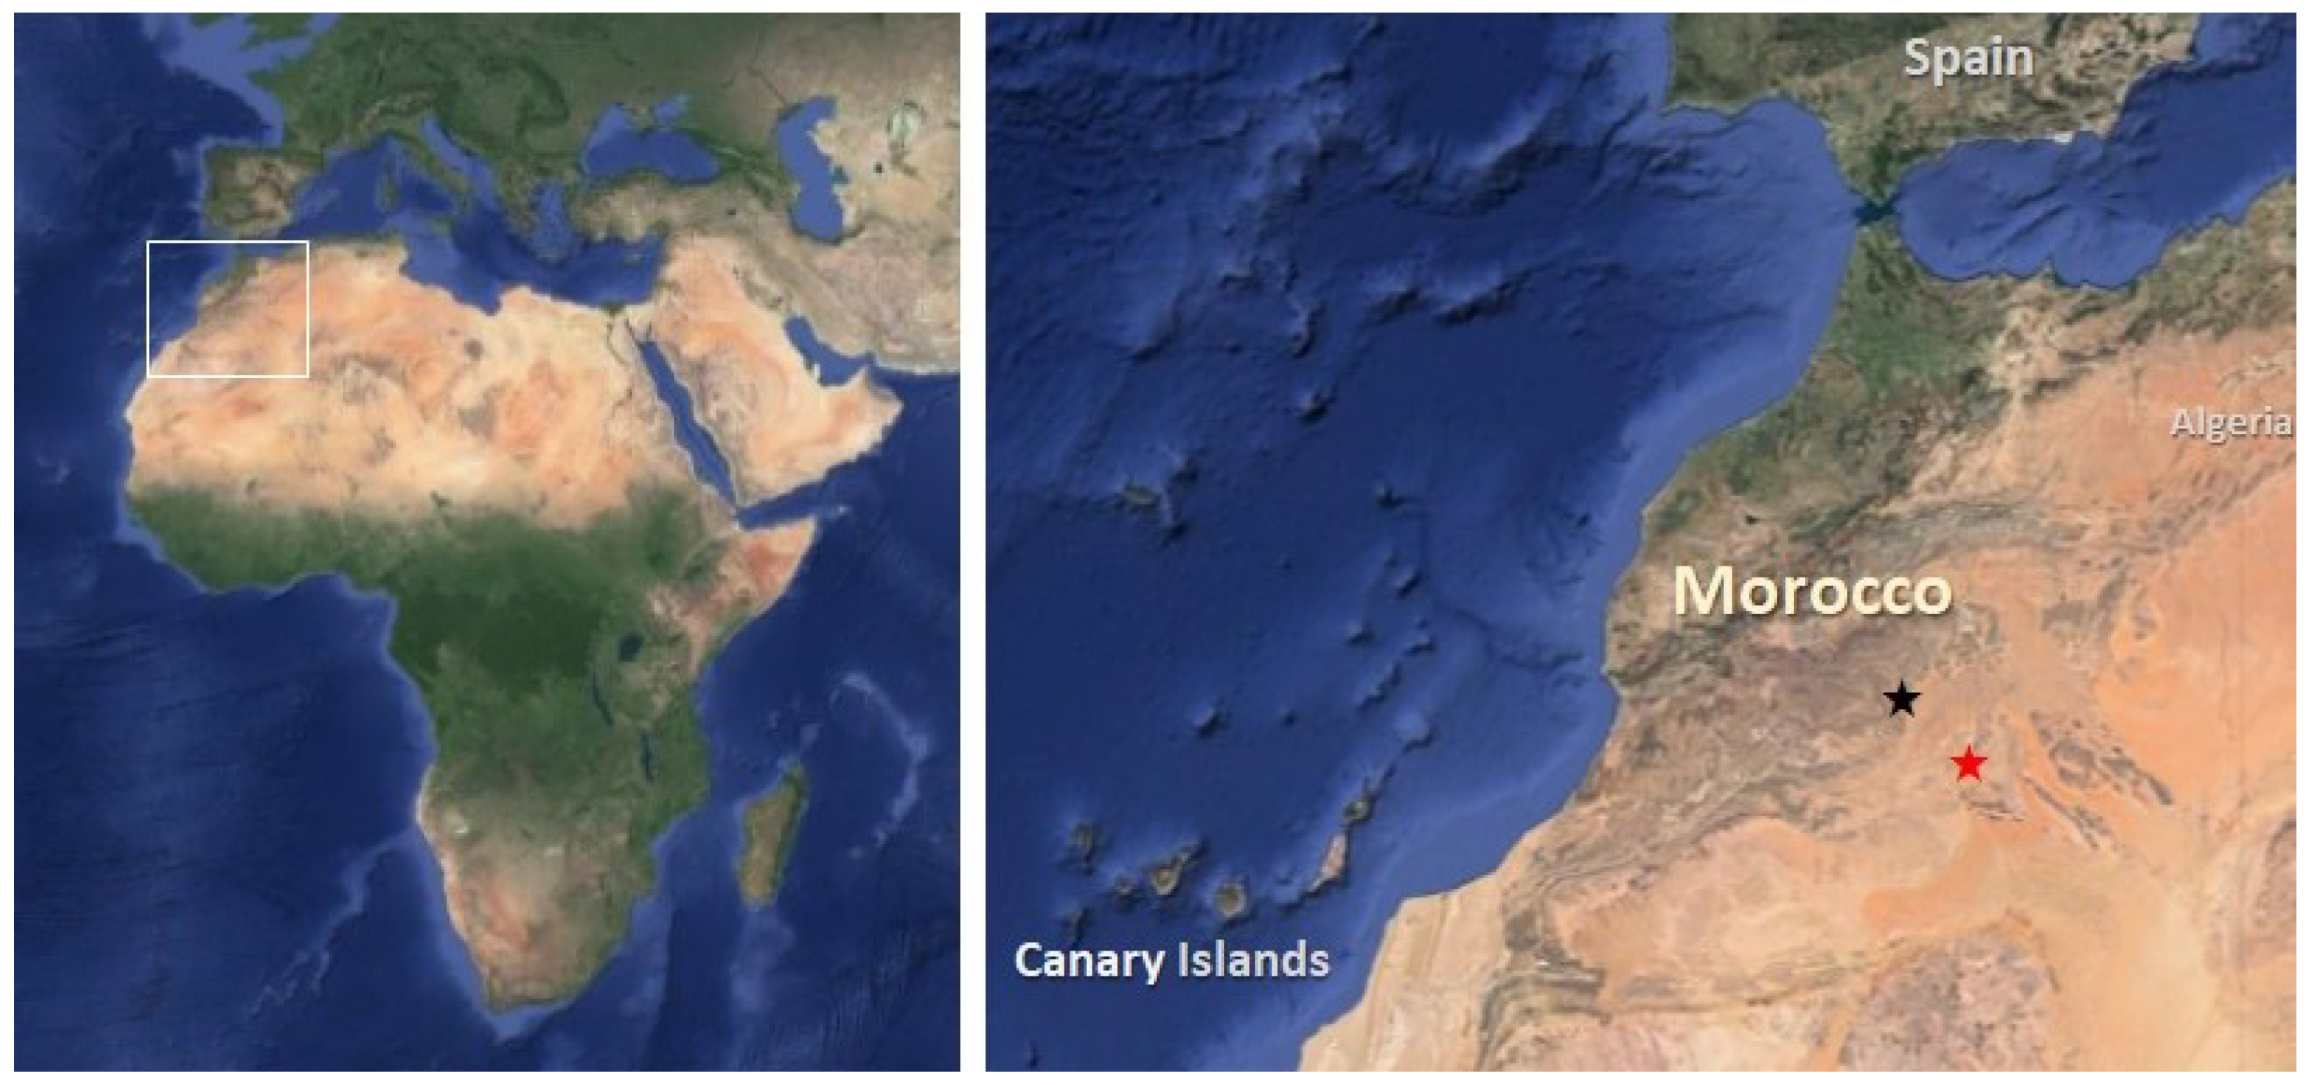
Abstract
:1. Introduction
2. Observation Data, Method, and Location
2.1. Localisation
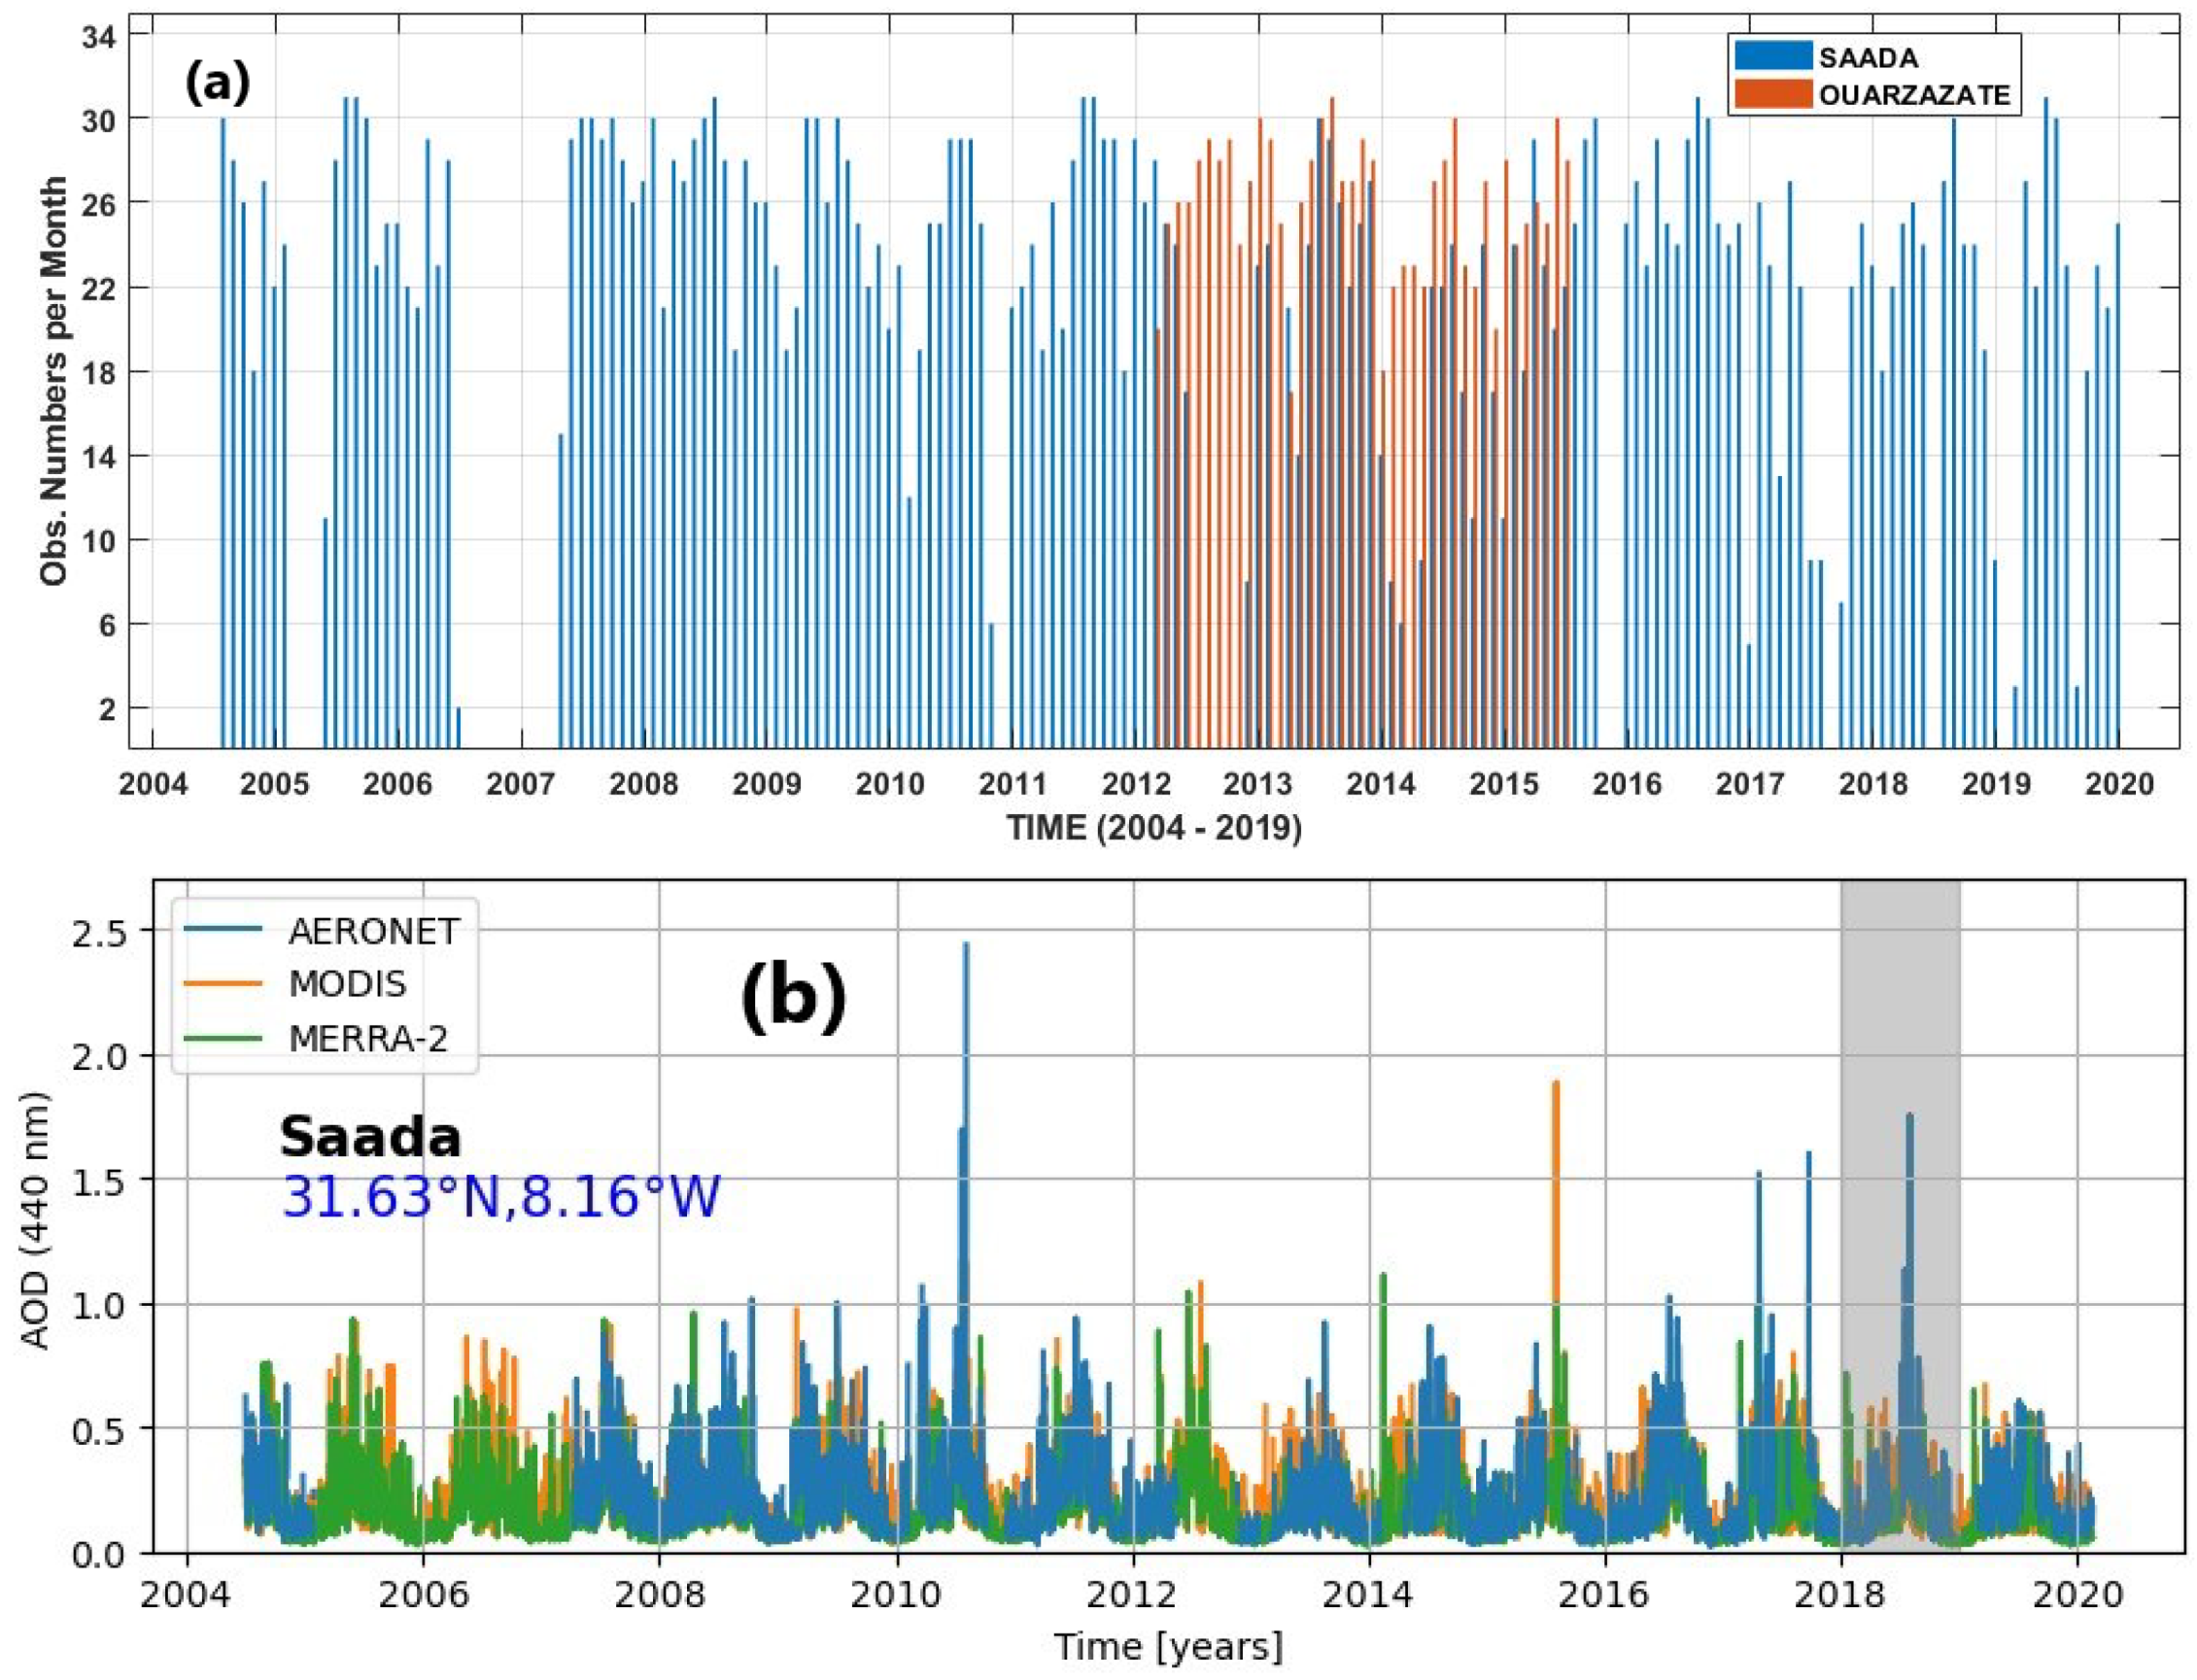
2.2. Ground-Based Observations from AERONET
2.3. Satellite and Assimilation Datasets
2.4. Hysplit Simulations
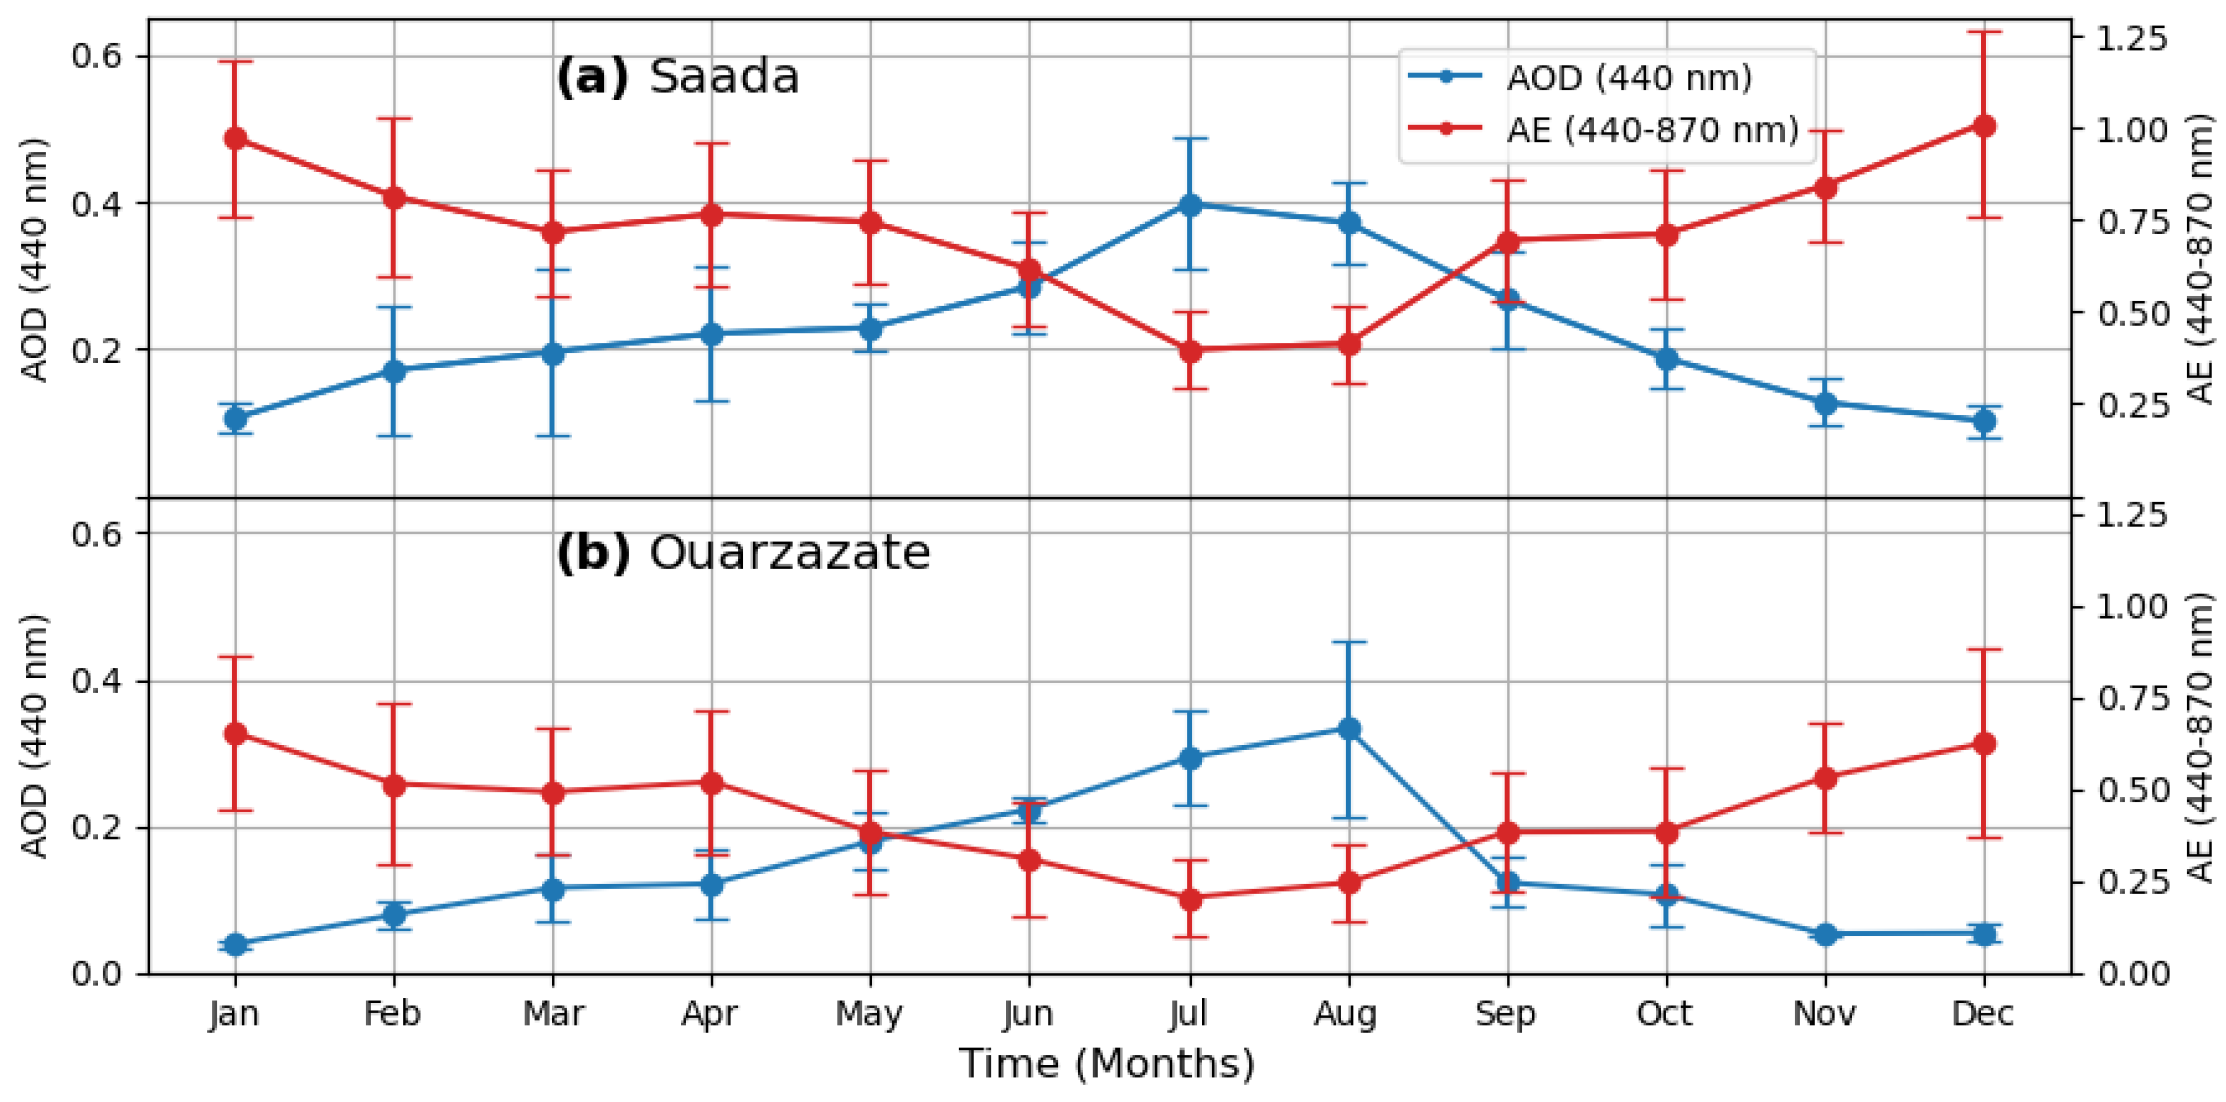
3. Results
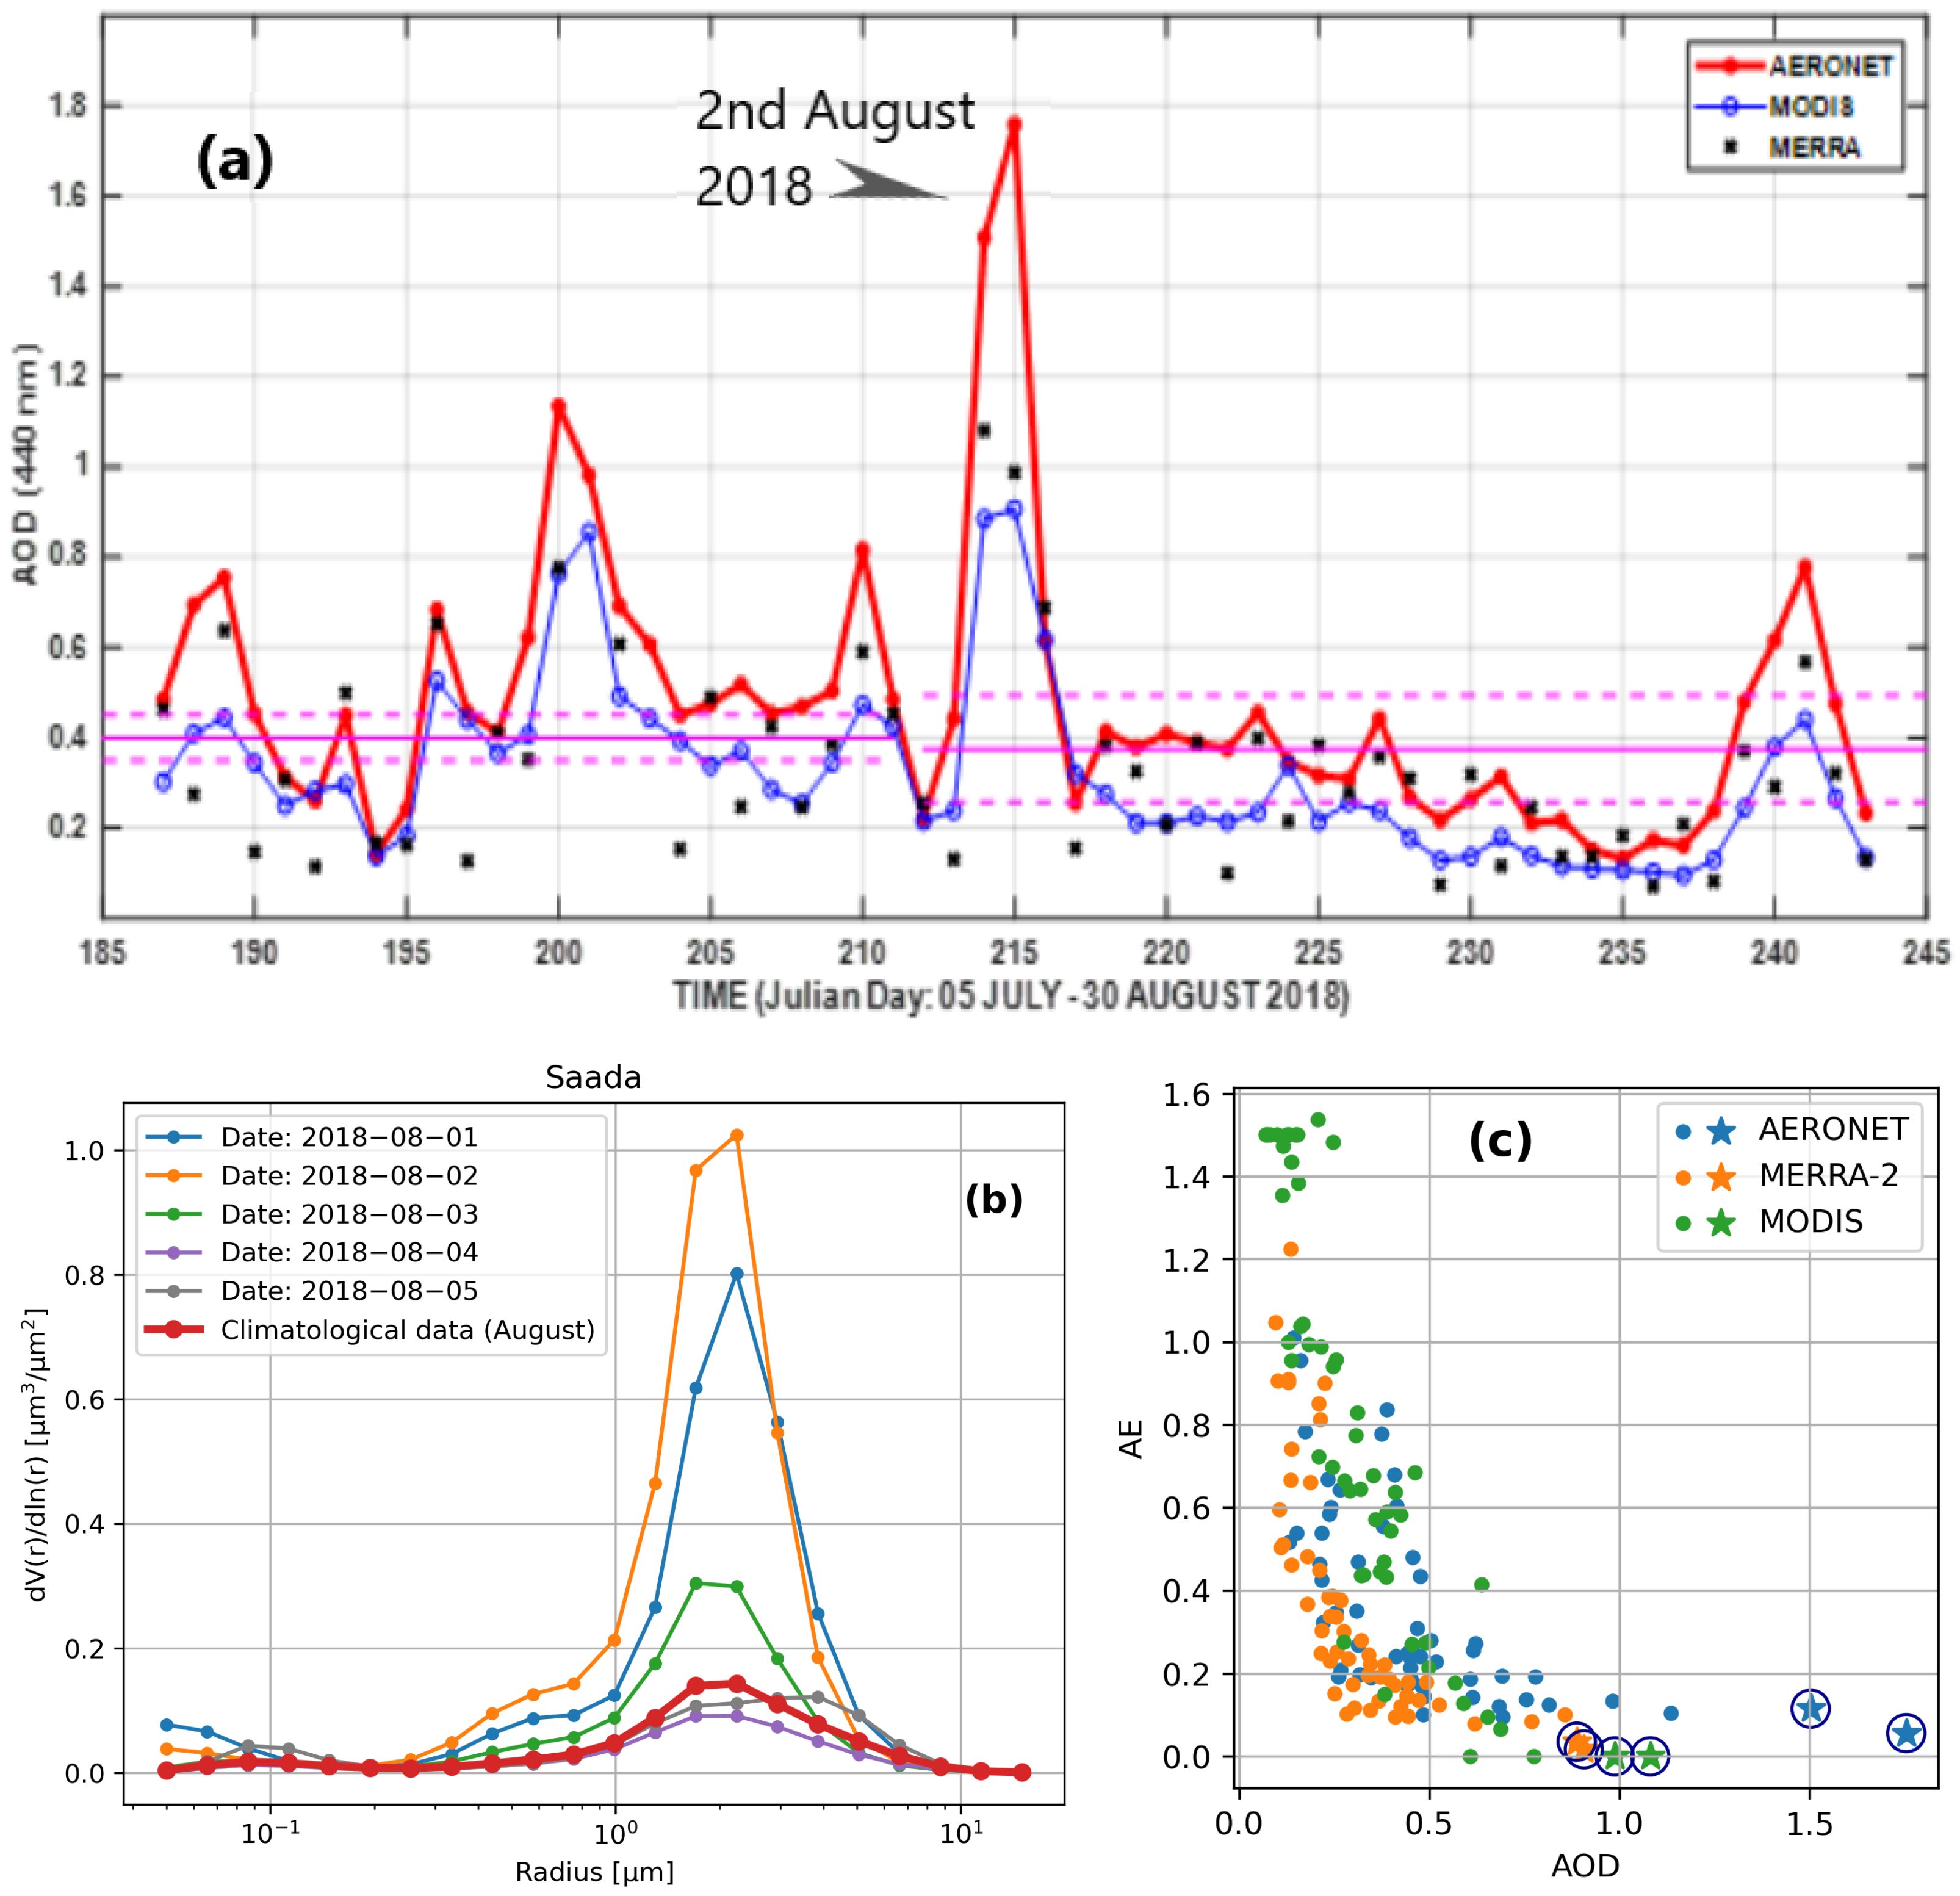
4. Discussion on a Dust-Storm Event in Early August 2018
4.1. Aeronet Ground-Based Data
4.2. Satellite Observations and HYSPLIT Simulations
5. Conclusions
Author Contributions
Funding
Data Availability Statement
Acknowledgments
Conflicts of Interest
References
- IPCC. Climate Change 2013: The Physical Science Basis; IPCC: Geneva, Switzerland, 2013. [Google Scholar]
- Ward, M.N.; Lamb, P.J.; Portis, D.H.; El Hamly, M.; Sebbari, R. Climate Variability in Northern Africa: Understanding Droughts in the Sahel and the Maghreb. In Eyond El Niño: Decadal and Interdecadal Climate Variability; Navarra, A., Ed.; Springer: Berlin/Heidelberg, Germany, 1999; pp. 119–140. [Google Scholar] [CrossRef]
- Knippertz, P.; Christoph, M.; Speth, P. Long-term precipitation variability in Morocco and the link to the large-scale circulation in recent and future climates. Meteorol. Atmos. Phys. 2003, 83, 67–88. [Google Scholar] [CrossRef]
- Mallone, S.; Stafoggia, M.; Faustini, A.; Gobbi, G.P.; Marconi, A.; Forastiere, F. Saharan Dust and Associations between Particulate Matter and Daily Mortality in Rome, Italy. Environ. Health Perspect. 2011, 119, 1409–1414. [Google Scholar] [CrossRef] [PubMed]
- Neophytou, A.M.; Yiallouros, P.; Coull, B.A.; Kleanthous, S.; Pavlou, P.; Pashiardis, S.; Dockery, D.W.; Koutrakis, P.; Laden, F. Particulate matter concentrations during desert dust outbreaks and daily mortality in Nicosia, Cyprus. J. Expo. Sci. Environ. Epidemiol. 2013, 23, 275–280. [Google Scholar] [CrossRef] [PubMed]
- Milford, C.; Cuevas, E.; Marrero, C.L.; Bustos, J.; Gallo, V.; RodrÃguez, S.; Romero-Campos, P.M.; Torres, C. Impacts of Desert Dust Outbreaks on Air Quality in Urban Areas. Atmosphere 2020, 11, 23. [Google Scholar] [CrossRef] [Green Version]
- McLachlan, K.J.L. Cloudsley-Thompson (ed.): Sahara Desert. (Key Environments.) [x], 348 pp. Oxford: Pergamon Press [and] International Union for Conservation of Nature and Natural Resources. 1984. Bull. Sch. Orient. Afr. Stud. 1985, 48, 617–618. [Google Scholar] [CrossRef]
- Sand, W.; Advisory, D.S.W. WMO Airborne Dust Bulletin; WMO: Geneva, Switzerland, 2018. [Google Scholar]
- Middleton, N.J.; Goudie, A.S. Saharan Dust: Sources and Trajectories. Trans. Inst. Br. Geogr. 2001, 26, 165–181. [Google Scholar] [CrossRef]
- Qor-el-aine, A.; Béres, A.; Géczi, G. Dust storm simulation over the Sahara Desert (Moroccan and Mauritanian regions) using HYSPLIT. Atmos. Sci. Lett. 2021, 23, e1076. [Google Scholar] [CrossRef]
- Engelstaedter, S.; Tegen, I.; Washington, R. North African dust emissions and transport. Earth-Sci. Rev. 2006, 79, 73–100. [Google Scholar] [CrossRef]
- Carlson, T.N.; Prospero, J.M. The Large-Scale Movement of Saharan Air Outbreaks over the Northern Equatorial Atlantic. J. Appl. Meteorol. Climatol. 1972, 11, 283–297. [Google Scholar] [CrossRef]
- Barkan, J.; Kutiel, H.; Alpert, P.; Kishcha, P. Synoptics of dust intrusion days from the African continent into the Atlantic Ocean. J. Geophys. Res. Atmos. 2004, 109. [Google Scholar] [CrossRef] [Green Version]
- Ben-Ami, Y.; Koren, I.; Rudich, Y.; Artaxo, P.; Martin, S.T.; Andreae, M.O. Transport of North African dust from the Bodélé depression to the Amazon Basin: A case study. Atmos. Chem. Phys. 2010, 10, 7533–7544. [Google Scholar] [CrossRef] [Green Version]
- Collaud Coen, M.; Weingartner, E.; Schaub, D.; Hueglin, C.; Corrigan, C.; Henning, S.; Schwikowski, M.; Baltensperger, U. Saharan dust events at the Jungfraujoch: Detection by wavelength dependence of the single scattering albedo and first climatology analysis. Atmos. Chem. Phys. 2004, 4, 2465–2480. [Google Scholar] [CrossRef] [Green Version]
- Hamonou, E.; Chazette, P.; Balis, D.; Dulac, F.; Schneider, X.; Galani, E.; Ancellet, G.; Papayannis, A. Characterization of the vertical structure of Saharan dust export to the Mediterranean basin. J. Geophys. Res. Atmos. 1999, 104, 22257–22270. [Google Scholar] [CrossRef] [Green Version]
- Papayannis, A.; Amiridis, V.; Mona, L.; Tsaknakis, G.; Balis, D.; Bosenberg, J.; Chaikovski, A.; De Tomasi, F.; Grigorov, I.; Mattis, I.; et al. Systematic lidar observations of Saharan dust over Europe in the frame of EARLINET (2000–2002). J. Geophys. Res. Atmos. 2008, 113. [Google Scholar] [CrossRef] [Green Version]
- Begue, N.; Tulet, P.; Pelon, J.; Aouizerats, B.; Berger, A.; Schwarzenboeck, A. Aerosol processing and CCN formation of an intense Saharan dust plume during the EUCAARI 2008 campaign. Atmos. Chem. Phys. 2015, 15, 3497–3516. [Google Scholar] [CrossRef] [Green Version]
- Tchorbadjieff, A.; Angelov, C.; Arsov, T.; Nikolova, N.; Kalapov, I.; Boyadjieva, A. Sahara dust events over south-western Bulgaria during the late spring of 2013. Comptes Rendus l’Académie Bulg. Sci. 2015, 68, 1229. [Google Scholar]
- Ansmann, A.; Bösenberg, J.; Chaikovsky, A.; Comerón, A.; Eckhardt, S.; Eixmann, R.; Freudenthaler, V.; Ginoux, P.; Komguem, L.; Linné, H.; et al. Long-range transport of Saharan dust to northern Europe: The 11–16 October 2001 outbreak observed with EARLINET. J. Geophys. Res. Atmos. 2003, 108. [Google Scholar] [CrossRef]
- Franzen, L.G.; Hjelmroos, M.; Kallberg, P.; Brorstrom-Lunden, E.; Juntto, S.; Savolainen, A.L. The ‘yellow snow episode’ of northern Fennoscandia, march 1991—A case study of long-distance transport of soil, pollen and stable organic compounds. Atmos. Environ. 1994, 28, 3587–3604. [Google Scholar] [CrossRef]
- Reiff, J.; Forbes, G.S.; Spieksma, F.T.M.; Reynders, J.J. African Dust Reaching Northwestern Europe: A Case Study to Verify Trajectory Calculations. J. Clim. Appl. Meteorol. 1986, 25, 1543–1567. [Google Scholar] [CrossRef] [Green Version]
- Heintzenberg, J. The SAMUM-1 experiment over Southern Morocco: Overview and introduction. Tellus B 2009, 61, 2–11. [Google Scholar] [CrossRef]
- Mallet, M.; Dulac, F.; Formenti, P.; Nabat, P.; Sciare, J.; Roberts, G.; Pelon, J.; Ancellet, G.; Tanré, D.; Parol, F.; et al. Overview of the Chemistry-Aerosol Mediterranean Experiment/Aerosol Direct Radiative Forcing on the Mediterranean Climate (ChArMEx/ADRIMED) summer 2013 campaign. Atmos. Chem. Phys. 2016, 16, 455–504. [Google Scholar] [CrossRef] [Green Version]
- Middleton, N. Variability and Trends in Dust Storm Frequency on Decadal Timescales: Climatic Drivers and Human Impacts. Geosciences 2019, 9, 261. [Google Scholar] [CrossRef] [Green Version]
- Buchard, V.; Randles, C.A.; da Silva, A.M.; Darmenov, A.; Colarco, P.R.; Govindaraju, R.; Ferrare, R.; Hair, J.; Beyersdorf, A.J.; Ziemba, L.D.; et al. The MERRA-2 Aerosol Reanalysis, 1980 Onward. Part II: Evaluation and Case Studies. J. Clim. 2017, 30, 6851–6872. [Google Scholar] [CrossRef] [PubMed]
- Zender, C.S.; Newman, D.; Torres, O. Spatial heterogeneity in aeolian erodibility: Uniform, topographic, geomorphic, and hydrologic hypotheses. J. Geophys. Res. Atmos. 2003, 108. [Google Scholar] [CrossRef]
- Boucher, O.; Randall, D.; Artaxo, P.; Bretherton, C.; Feingold, G.; Forster, P.; Kerminen, V.; Kondo, Y.; Liao, H.; Lohmann, U.; et al. Climate Change 2013: The Physical Science Basis. Contribution of Working Group I to the Fifth Assessment Report of the Intergovernmental Panel on Climate Change; Stocker, T.F., Qin, D., Plattner, G.-K., Tignor, M.M.B., Allen, S.K., Boschung, J., Nauels, A., Xia, Y., Bex, V., Midgley, P.M., Eds.; Cambridge University Press: Cambridge, UK, 2013. [Google Scholar]
- Swap, R.; Garstang, M.; Greco, S.; Talbot, R.; Kallberg, P. Saharan dust in the Amazon Basin. Tellus B Chem. Phys. Meteorol. 1992, 44, 133–149. [Google Scholar] [CrossRef] [Green Version]
- Martin, R.V.; Jacob, D.J.; Yantosca, R.M.; Chin, M.; Ginoux, P. Global and regional decreases in tropospheric oxidants from photochemical effects of aerosols. J. Geophys. Res. Atmos. 2003, 108. [Google Scholar] [CrossRef]
- De Longueville, F.; Ozer, P.; Doumbia, S.; Henry, S. Desert dust impacts on human health: An alarming worldwide reality and a need for studies in West Africa. Int. J. Biometeorol. 2013, 57, 1–19. [Google Scholar] [CrossRef]
- Diouri, M.; Elhitmy, M.; Sanda, I.; Jeanicke, R.; Kulzer, S.; Leiterer, U.; Schutz, L.; Schultz, K. Indirect determination of particle size distribution using a sunphotometer at Lindenberg (Germany) and Oujda (Morocco). J. Aerosol Sci. 1997, 28, S401–S402. [Google Scholar] [CrossRef]
- Tahiri, A.; Diouri, M.; Steli, H.; Marsli, I.; Meziane, R.; Ben-tayeb, A. Desert aerosol optical properties in morocco. Environ. Sci. 2016, 4, 63–78. [Google Scholar] [CrossRef] [Green Version]
- Born, K.; Christoph, M.; Fink, A.H.; Knippertz, P.; Paeth, H.; Speth, P. Moroccan Climate in the Present and Future: Combined View from Observational Data and Regional Climate Scenarios. In Climatic Changes and Water Resources in the Middle East and North Africa; Zereini, F., Hötzl, H., Eds.; Springer: Berlin/Heidelberg, Germany, 2008; pp. 29–45. [Google Scholar] [CrossRef] [Green Version]
- Holben, B.; Eck, T.; Slutsker, I.; Tanre, D.; Buis, J.; Setzer, A.; Vermote, E.; Reagan, J.; Kaufman, Y.; Nakajima, T.; et al. AERONET, A Federated Instrument Network and Data Archive for Aerosol Characterization. Remote Sens. Environ. 1998, 66, 1–16. [Google Scholar] [CrossRef]
- Giles, D.M.; Sinyuk, A.; Sorokin, M.G.; Schafer, J.S.; Smirnov, A.; Slutsker, I.; Eck, T.F.; Holben, B.N.; Lewis, J.R.; Campbell, J.R.; et al. Advancements in the Aerosol Robotic Network (AERONET) Version 3 database—Automated near-real-time quality control algorithm with improved cloud screening for Sun photometer aerosol optical depth (AOD) measurements. Atmos. Meas. Tech. 2019, 12, 169–209. [Google Scholar] [CrossRef] [Green Version]
- Takamura, T. Overview of SKYNET and its activities. Opt. Pura Apl. 2004, 37, 3303–3308. [Google Scholar]
- Smirnov, A.; Holben, B.N.; Slutsker, I.; Giles, D.M.; McClain, C.R.; Eck, T.F.; Sakerin, S.M.; Macke, A.; Croot, P.; Zibordi, G.; et al. Maritime Aerosol Network as a component of Aerosol Robotic Network. J. Geophys. Res. Atmos. 2009, 114. [Google Scholar] [CrossRef] [Green Version]
- Kazadzis, S.; Kouremeti, N.; Nyeki, S.; Gröbner, J.; Wehrli, C. The World Optical Depth Research and Calibration Center (WORCC) quality assurance and quality control of GAW-PFR AOD measurements. Geosci. Instrum. Methods Data Syst. 2018, 7, 39–53. [Google Scholar] [CrossRef] [Green Version]
- Dubovik, O.; King, M.D. A flexible inversion algorithm for retrieval of aerosol optical properties from Sun and sky radiance measurements. J. Geophys. Res. Atmos. 2000, 105, 20673–20696. [Google Scholar] [CrossRef] [Green Version]
- Dubovik, O.; Smirnov, A.; Holben, B.N.; King, M.D.; Kaufman, Y.J.; Eck, T.F.; Slutsker, I. Accuracy assessments of aerosol optical properties retrieved from Aerosol Robotic Network (AERONET) Sun and sky radiance measurements. J. Geophys. Res. Atmos. 2000, 105, 9791–9806. [Google Scholar] [CrossRef] [Green Version]
- Bright, J.M.; Gueymard, C.A. Climate-specific and global validation of MODIS Aqua and Terra aerosol optical depth at 452 AERONET stations. Sol. Energy 2019, 183, 594–605. [Google Scholar] [CrossRef]
- Bencherif, H.; Bègue, N.; Kirsch Pinheiro, D.; du Preez, D.J.; Cadet, J.M.; da Silva Lopes, F.J.; Shikwambana, L.; Landulfo, E.; Vescovini, T.; Labuschagne, C.; et al. Investigating the Long-Range Transport of Aerosol Plumes Following the Amazon Fires (August 2019): A Multi-Instrumental Approach from Ground-Based and Satellite Observations. Remote Sens. 2020, 12, 3846. [Google Scholar] [CrossRef]
- Randles, C.A.; da Silva, A.M.; Buchard, V.; Colarco, P.R.; Darmenov, A.; Govindaraju, R.; Smirnov, A.; Holben, B.; Ferrare, R.; Hair, J.; et al. The MERRA-2 Aerosol Reanalysis, 1980 Onward. Part I: System Description and Data Assimilation Evaluation. J. Clim. 2017, 30, 6823–6850. [Google Scholar] [CrossRef]
- Gelaro, R.; McCarty, W.; Suárez, M.J.; Todling, R.; Molod, A.; Takacs, L.; Randles, C.A.; Darmenov, A.; Bosilovich, M.G.; Reichle, R.; et al. The Modern-Era Retrospective Analysis for Research and Applications, Version 2 (MERRA-2). J. Clim. 2017, 30, 5419–5454. [Google Scholar] [CrossRef]
- Vaughan, M.A.; Young, S.A.; Winker, D.M.; Powell, K.A.; Omar, A.H.; Liu, Z.; Hu, Y.; Hostetler, C.A. Fully automated analysis of space-based lidar data: An overview of the CALIPSO retrieval algorithms and data products. In Proceedings of the Laser Radar Techniques for Atmospheric Sensing, Maspalomas, Canary Islands, Spain, 13–16 September 2004; Singh, U.N., Ed.; International Society for Optics and Photonics; SPIE: Bellingham, WA, USA, 2004; Volume 5575, pp. 16–30. [Google Scholar] [CrossRef]
- Winker, D.M.; Vaughan, M.A.; Omar, A.; Hu, Y.; Powell, K.A.; Liu, Z.; Hunt, W.H.; Young, S.A. Overview of the CALIPSO Mission and CALIOP Data Processing Algorithms. J. Atmos. Ocean. Technol. 2009, 26, 2310–2323. [Google Scholar] [CrossRef]
- Hunt, W.H.; Winker, D.M.; Vaughan, M.A.; Powell, K.A.; Lucker, P.L.; Weimer, C. CALIPSO Lidar Description and Performance Assessment. J. Atmos. Ocean. Technol. 2009, 26, 1214–1228. [Google Scholar] [CrossRef]
- DeSouza-Machado, S.G.; Strow, L.L.; Imbiriba, B.; McCann, K.; Hoff, R.M.; Hannon, S.E.; Martins, J.V.; Tanré, D.; Deuzé, J.L.; Ducos, F.; et al. Infrared retrievals of dust using AIRS: Comparisons of optical depths and heights derived for a North African dust storm to other collocated EOS A-Train and surface observations. J. Geophys. Res. Atmos. 2010, 115. [Google Scholar] [CrossRef] [Green Version]
- Draxler, R.; Hess, G. An overview of the HYSPLIT_4 modeling system for trajectories, dispersion, and deposition. Aust. Meteorol. Mag. 1998, 47, 295–308. [Google Scholar]
- Stein, A.F.; Draxler, R.R.; Rolph, G.D.; Stunder, B.J.B.; Cohen, M.D.; Ngan, F. NOAA’s HYSPLIT Atmospheric Transport and Dispersion Modeling System. Bull. Am. Meteorol. Soc. 2015, 96, 2059–2077. [Google Scholar] [CrossRef]
- Millet, T.; Bencherif, H.; Bounhir, A.; Bègue, N.; Lamy, K.; Ranaivombola, M.; Benkhaldoun, Z.; Portafaix, T.; Duflot, V. Aerosol distributions and transport over Southern Morocco from ground-based and satellite observations (2004–2020). Atmosphere, 2022; Revised. [Google Scholar]
- Vaughan, M.A.; Powell, K.A.; Winker, D.M.; Hostetler, C.A.; Kuehn, R.E.; Hunt, W.H.; Getzewich, B.J.; Young, S.A.; Liu, Z.; McGill, M.J. Fully Automated Detection of Cloud and Aerosol Layers in the CALIPSO Lidar Measurements. J. Atmos. Ocean. Technol. 2009, 26, 2034–2050. [Google Scholar] [CrossRef]
- Liu, Z.; Kar, J.; Zeng, S.; Tackett, J.; Vaughan, M.; Avery, M.; Pelon, J.; Getzewich, B.; Lee, K.P.; Magill, B.; et al. Discriminating between clouds and aerosols in the CALIOP version 4.1 data products. Atmos. Meas. Tech. 2019, 12, 703–734. [Google Scholar] [CrossRef] [Green Version]


Publisher’s Note: MDPI stays neutral with regard to jurisdictional claims in published maps and institutional affiliations. |
© 2022 by the authors. Licensee MDPI, Basel, Switzerland. This article is an open access article distributed under the terms and conditions of the Creative Commons Attribution (CC BY) license (https://creativecommons.org/licenses/by/4.0/).
Share and Cite
Bencherif, H.; Bounhir, A.; Bègue, N.; Millet, T.; Benkhaldoun, Z.; Lamy, K.; Portafaix, T.; Gadouali, F. Aerosol Distributions and Sahara Dust Transport in Southern Morocco, from Ground-Based and Satellite Observations. Remote Sens. 2022, 14, 2454. https://0-doi-org.brum.beds.ac.uk/10.3390/rs14102454
Bencherif H, Bounhir A, Bègue N, Millet T, Benkhaldoun Z, Lamy K, Portafaix T, Gadouali F. Aerosol Distributions and Sahara Dust Transport in Southern Morocco, from Ground-Based and Satellite Observations. Remote Sensing. 2022; 14(10):2454. https://0-doi-org.brum.beds.ac.uk/10.3390/rs14102454
Chicago/Turabian StyleBencherif, Hassan, Aziza Bounhir, Nelson Bègue, Tristan Millet, Zouhair Benkhaldoun, Kévin Lamy, Thierry Portafaix, and Fouad Gadouali. 2022. "Aerosol Distributions and Sahara Dust Transport in Southern Morocco, from Ground-Based and Satellite Observations" Remote Sensing 14, no. 10: 2454. https://0-doi-org.brum.beds.ac.uk/10.3390/rs14102454