
Identifying Algal Bloom ‘Hotspots’ in Marginal Productive Seas: A Review and Geospatial Analysis

1
Department of Civil Infrastructure and Environmental Engineering, Khalifa University of Science and Technology, Abu Dhabi P.O. Box 127788, United Arab Emirates
2
Engineering Department, University of Cambridge, Cambridge CB2 1TN, UK
*
Author to whom correspondence should be addressed.
Remote Sens. 2022, 14(10), 2457; https://0-doi-org.brum.beds.ac.uk/10.3390/rs14102457
Submission received: 13 March 2022
/
Revised: 16 May 2022
/
Accepted: 17 May 2022
/
Published: 20 May 2022
(This article belongs to the Special Issue Bio-Optical Oceanic Remote Sensing)
Abstract
:Algal blooms in the marginal productive seas of the Indian Ocean are projected to become more prevalent over the coming decades. They reach from lower latitudes up to the coast of the northern Indian Ocean and the populated areas along the Arabian Gulf, Sea of Oman, Arabian Sea, and the Red Sea. Studies that document algal blooms in the Indian Ocean have either focused on individual or regional waters or have been limited by a lack of long-term observations. Herein, we attempt to review the impact of major monsoons on algal blooms in the region and identify the most important oceanic and atmospheric processes that trigger them. The analysis is carried out using a comprehensive dataset collected from many studies focusing on the Indian Ocean. For the first time, we identify ten algal bloom hotspots and identify the primary drivers supporting algal blooms in them. Growth is found to depend on nutrients brought by dust, river runoff, upwelling, mixing, and advection, together with the availability of light, all being modulated by the phase of the monsoon. We also find that sunlight and dust deposition are strong predictors of algal bloom species and are essential for understanding marine biodiversity.
1. Introduction
Algal bloom events have been frequently witnessed in the marginal productive seas in the North Indian Ocean (NIO). Intense blooms have likely always occurred in the Arabian Sea, with the first reported sighting being in 1908 [1], and have occurred in the Sea of Oman in 1976 [2], in the Arabian Gulf in 1987 [3], and in the Red Sea in 1944. Algal blooms detected between 1961 and 1970 were mainly observed in the southern Arabian Sea off the western coast of India. However, over time, blooms have become more widespread and have been reported off the coasts of Oman and Pakistan between 1971 and 1980 [4]. Although their frequency appeared to decrease between 1981 and 1990, the subsequent two decades (1990–2010) witnessed numerous blooms in all regions. In addition, they have occurred in different seasons over the years. Algal blooms in early decades (1961–1970) were typically spotted in the spring season (March–May), but in the following decade (1971–1981) appeared in the summer (June–August). However, thereafter (1981–2010), they occurred across all seasons—see Appendix A Figure A1, Figure A2, Figure A3 and Figure A4.
The aforementioned recent upward trend in the intensity of algal blooms appears to be strongly tied to the strengthening of northeast and southwest monsoons (NEM and SWM, respectively) in the last 15 years [5]. Monsoons cause reverse ocean circulation patterns [6], stronger upwelling events, increased precipitation, and winds blowing and depositing large amounts of flying aerosols in the region, which increase the absorption of solar radiation [7]. These aerosols have proven to be favorable nutrients [8] for algae, in addition to the anthropogenic nutrients’ sources such as ballast water and wastewater from shipping. This increases productivity in the NIO and causes algal blooms.
In addition, the waters of the NIO possess high salinity (>40 psu), caused by extreme evaporation over the waters of the Arabian Gulf and Red Sea, which ultimately flow into the Arabian Sea. Ocean temperatures are also warm, being surrounded by desert and isolated from the cooling influence of higher latitudes [6]. These make the NIO possess favorable ranges of salinity and temperature for various types of algal species.
The types of species comprising these algal blooms have also shown spatial and temporal variabilities. The biota that make up these blooms are dominated by dinoflagellates and cyanobacteria which appear to spread from lower latitudes. Common genera of dinoflagellates and cyanobacteria are also present, such as Noctiluca, Cocholdinium, Trichodemimums, and Gonyalux. Other genera, such as Phaeocystis and Karenia, have appeared inside the Arabian Gulf in recent decades.
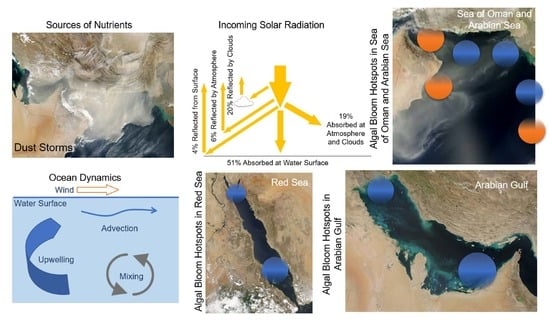
To the best of our knowledge, there is no study that characterizes the distribution of algal blooms and their exact reasons for occurrence in the NIO region. Here, we investigate the role of major monsoons (NEM and SWM) on algal blooms in the NIO (Figure 1) and identify the most important oceanic and atmospheric processes that trigger them. We evaluate the competing effects of upwelling, sunlight, and dust deposition and their geographic variability. A comprehensive dataset of algal blooms in the NIO is brought together. In addition, this dataset is complemented with satellite images of algal bloom events as well as microscopic images of some of the species collected during algal bloom events in the Arabian Gulf in February 2016 and the Sea of Oman in March 2013. Thus, we are able to identify ten bloom hotspots, each of which has unique features supporting their growth and biological composition, which are seen to depend on local meteorological and oceanographic conditions modulated by monsoons.
2. Background: Northern Indian Ocean (NIO)
First, we review the general geographic, oceanographic, and atmospheric properties of the NIO, referring to Figure 1. The Red Sea is the westernmost part of the NIO running between Asia and Africa. The Arabian Peninsula separates the Red Sea from the Arabian Gulf. The latter is bordered by Saudi Arabia to the southeast, the United Arab Emirates (UAE) and Qatar to the south, Kuwait and Iraq to the northwest, Iran to the north, and part of Oman to the east. The Arabian Gulf is connected to the Arabian Sea by the Sea of Oman, which borders Iran and Pakistan on the north and Oman to the south, with the UAE to the west.
Despite the proximity of these waters, geographical boundaries dramatically affect the renewal rate of these sub-regions. The waters of the Arabian Sea have the longest residence time (~8 years, [9]), followed by the Red Sea (~4.8 years, [10]) and the Arabian Gulf (~3 years, [11]). These differences are partly a consequence of the differences in the surface areas of the respective basins: the Red Sea has the smallest surface area of 0.4 million km2, compared to the Arabian Sea with a surface area of 3.8 million km2. The Arabian Sea is the deepest sub-region with a maximum depth of 4 km, whilst the Arabian Gulf is the shallowest with a maximum depth of 90 m.
The geographical features described above and the northern Asian border significantly affect the atmospheric and oceanic circulation patterns of the region. There is a pronounced annual cycle of differential heating and cooling between the Indian Ocean and the Eurasian Continent inducing pronounced migrations of the Inter-tropical Convergence Zone [12] and monsoonal seasonality peaking during June–September (SWM) [13] and December–April (NEM) [12]. These two phenomena are the primary drivers of atmospheric (air temperature, rainfall, and dust storms) and oceanic cycles (water circulation and upwelling) of the region.
During an NEM, the wind is focused over the western Arabian Sea with speeds between 4 and 8 m s−1 [12,13]. During an SWM, the winds are southwesterly and more intense with a speed of 8–12 m s−1 and extend over the major part of the Arabian Sea [12]. These winds cause a significant drop (~2 °C) in the sea surface temperature (SST) of the Arabian Sea [14], and a smaller drop (0.5–1 °C) in that of the Sea of Oman [15] during the SWM season. However, during an NEM, winds cause a drop of 0.9 °C in SST in both regions [16]. As a result, the annual SST ranges from 23 to 29 °C during an SWM and 23–27.7 °C during an NEM in these regions. In contrast, Red Sea and Arabian Gulf waters are less affected by SWMs and NEMs. In the Red Sea and Arabian Gulf, the summertime SST reaches 31 °C [15,17] and 32 °C [15], respectively, whereas in the wintertime, the Red Sea SST reaches 20 °C [17], and that of the Arabian Gulf reaches 17–19 °C [15,18,19]. This drop in SST causes a dramatic decline in the evaporation rate from ~0.7 cm·day−1 (summer) to ~0.3 cm·day−1 (winter) in the Arabian Sea [20,21,22]. Evaporation exceeds precipitation in the region, causing a negative water balance [21], despite heavy rainfall during SWMs [12]. The high evaporation–precipitation ratio causes generally high-salinity water masses in the Arabian Sea region, reaching extremes in the Arabian Gulf and Red Sea, where salinity can exceed 45 psu. The highly saline water masses flow from the Arabian Gulf and Red Sea into the Arabian Sea [13] and cause high salinity in the upper surface layer (~36.5 psu) during an NEM. Some of the highly saline water masses sink to depths of 200–400 m in the Arabian Sea, where salinity can exceed 36 psu [13].
Water masses circulate under the influence of monsoonal variability constrained by geography, as mentioned earlier. NEM wind causes counterclockwise circulations and cools the surface waters, causing deep convective mixing, whereas SWM wind causes clockwise circulations and upwelling in the Arabian Sea. At the same time, waters are driven into and out of the Sea of Oman, the Arabian Gulf, and the Red Sea steered by boundaries, with gyres being found in the eastern part of the Sea of Oman, the central southern and northern Arabian Gulf, and in the southern and northern Red Sea [23], as shown in Figure 2.
As for the biogeochemical properties, there are two distinct periods of high biological activity that emerge as a result of the semiannual wind reversals associated with the monsoon phenomenon. Although monsoon forcing leads to increased rates of primary productivity during both summer and winter monsoons, the entrainment mechanisms are fundamentally different during summer (southwest) and winter (northeast). During an SWM, horizontal advection, wind-driven entrainment, and upwelling are the primary sources of nutrients for offshore phytoplankton blooms. In addition, aeolian deposition also helps regulate phytoplankton blooms offshore. During an NEM, however, the direction of the wind causes downwelling, while the temperature and relative humidity of the northeast winds generate deep convective mixing [24,25]. The exact regional factors, as well as the seasonal and geographical distribution of algal blooms in the NIO, remain unclear. In particular, the relative importance of the role of nutrients (e.g., nitrates, phosphorus, silica, and iron) from coastal rivers, non-localized coastal sources, or atmospheric deposition in initiating and/or sustaining these differing species remains unclear. Thus, we now go on to further discuss the mechanisms that have been proposed to explain blooms in the NIO, in an attempt to identify the most important factors that regulate their spatial and temporal distribution and the algal species that make them up.
3. Data and Methods
- Search strategy and data extraction
The keywords of ‘algal blooms’, ‘red tide’, ‘pollution’, ‘outbreak’, and ‘phytoplankton’ were used in the Scopus engine to identify the key publications on algal blooms in the NIO. Full texts of potential articles were retrieved and assessed independently. A standard data extraction form was developed a priori and refined according to the data extracted. The types of data extracted included: study geographical locations; year and season (date) of the algal blooms outbreak; types of algal species detected; findings and the reported chlorophyll-a (Chl-a: proxy of algal concentration); cell counts and the associated environmental parameters. Chl-a exceeding 5 mg m−3 indicates the presence of algal blooms. Key missing data items were managed by contacting study investigators where possible. Full texts were exported into Endnote, and a database was created in Excel.
- Mapping the frequency of algal blooms
The geographical coordinates of the algal outbreaks and types of species along with the dates of incidents were imported to the geographic information system application called ‘QGIS’. QGIS heat maps were produced by calculating the average frequencies of points within a certain radius of a given point. These heat maps can represent the frequency of the monthly algal bloom outbreaks and the seasonal spatial distributions of the algal species mapped over the NIO region. These provide a visual representation of the distribution of algal blooms.
- Satellite data acquisition
To support the data extracted from the articles and to understand the relation between the algal bloom events at varying dust levels and light conditions, Level 1A satellite images of algal bloom outbreaks were retrieved from the NASA Ocean Color site at https://oceancolor.gsfc.nasa.gov/, accessed on 10 January 2022. These satellite images include the Moderate Resolution Imaging Spectroradiometer (MODIS), Visible Infrared Imaging Radiometer Suite (VIIRS), and Sea-Viewing Wide Field-of-View Sensor (SeaWiFS). The images cover the regions in the NIO where the algal bloom events occurred at specific dates that are discussed in Section 7. The image processing package called the SeaWiFS Data Analysis System (SeaDAS) was used to process the Level 1A images into Level 2 and to calculate the following parameters: chlorophyll-a, true color imagery, the marine dust level (aerosol optical thickness: AOT), and Photosynthetic Active Radiation (PAR). More details about satellite image processing can be found elsewhere [26]. The processed parameters were then mapped using the Universal Transverse Mercator (UTM) cylinder projection system for the allocation of the algal bloom outbreaks, dust levels, and solar radiation. In addition, the monthly Level 3 climatology MODIS Chl-a data for the period between 2002 and 2021 were obtained for the two seasons (i.e., NEM and SWM). These data were used to extract the maximum Chl-a values for each season, which were then employed in the identification of the highly productive areas.
- Samples Preparation for SEM images of species
In an effort to provide a morphological representation of some algal bloom species collected in the NIO during the bloom outbreaks, we obtained images using a scanning electronic microscope (SEM). To obtain high-quality microscopic images, 200–1000 mL of algal bloom seawater samples was filtered and fixed for 24 h with Lugol (20%) after being filtered with 0.45 µm (pore size) GF/F filters. Additionally, the samples were washed three times with distillated water, and they were dried with a freeze-dryer afterward. The sample was mounted on a metal stub and coated with gold in order to prevent charge buildup on the sample surface before being plugged under an SEM. The samples were obtained by the Ministry of Environment and Climate Change (MOCCAE) in the UAE in order to monitor the water quality along the Arabian Gulf and Sea of Oman, indicated as hotspots 3 and 7 (Figure 1).
4. Exuberant Growth of Algae
Generally, the most critical parameters which promote algae (phytoplankton) growth are nutrients, light, salinity, and temperature [27]. The NIO possesses annual means of salinity and SST between 34 and 38 psu and 16 and 30 °C, respectively, which are similar to 50% of the world’s oceans. However, the NIO is more productive in algal growth. What makes the NIO more conducive to blooms, especially at the ten hotspots, is the high nutrient supply and intense light levels. These two parameters are controlled by monsoonal winds (SWM and NEM), which lead to increased nutrient supply to the surface ocean where there is an abundance of light. In addition to these natural processes occurring in the Arabian Sea, the Arabian Gulf and the Red Sea receive extra nutrients from anthropic sources. In this section, we discuss nutrients and light supply in the region and associated processes.
4.1. Nutrients
The Arabian Sea (eastern NIO) is divided into two zonal bands by the 10°S parallel: nutrients are low in the south and high in the north [28]. While the Red Sea is considered to be an oligotrophic region, the Sea of Oman and the Arabian Gulf have varying nutrient levels [29]. This spatial variability is caused by the natural nutrient level typical of the abyssal ocean, modulated by the variability of nutrient levels due to external sources such as river runoff, dust storms, and anthropogenic sources. Several rivers flow into the Arabian Sea and Arabian Gulf, whereas there is no river runoff into the Red Sea [30] and the Sea of Oman. Of the rivers, the Indus is the largest, passing through India and Pakistan at an average rate of more than 4000 m3 s−1 [31] into the northern part of the Arabian Sea. The smaller Lyari river runs from Pakistan with a lesser flow of 1440 m3 s−1 [4]. Furthermore, four rivers—the Shatt Al-Arab, Hendijan, Hilleh, and Mand, in Iraq and Iran—provide a continuous water influx into the northern part of the Arabian Gulf. River discharge varies seasonally: for example, the Indus river has its largest increase during summer and decreases during winter [31], whilst the Shatt Al-Arab has the opposite trend [32]. These rivers provide a continuous supply of nutrients to the coastal region: during NEMs, winds at the Indus river (northern Arabian Sea) push the river surface water downstream, which increases the ebb at the surface and the export of nutrients (nitrate, nitrite, phosphate, silicate, and ammonium) to the coast. These are then transported south by a longshore current [33]. Meanwhile, the Shatt Al-Arab, which is an extension of Tigris and Euphrates rivers, enriches the northern part of the Arabian Gulf with nitrogen or phosphorus [32]. These rivers have depleted flow rates, falling from more than 2000 to 500 m3 s−1, caused by the industrial infrastructure of dams in Turkey and Iran [32]. Therefore, these river discharges have contributed to the algal blooms in the hotspots 3 and 8 in the Indus river and Shatt Al-Arab, as shown in Table 1 and Figure 1, and this is discussed further in Section 6.
Dust storms are the second ‘exterior’ source of nutrients. They are very frequent in the Arabian Sea and its adjacent waters, where dust activity is common from February until August [34]. Dust is deposited over the ocean, especially during heavy SWM rainfall [35]. Dust storms peak in the northwest region, causing thick, extensive dust plumes at an altitude of 3–4 km in the Arabian Gulf, the Red Sea, and the Sea of Oman during NEMs. The emission rates of dust can reach 2.4 Tg day−1 [36], which is 5–6 times higher than that reached during SWMs [37]. This is due to cold fronts associated with cyclones entering with eolian dust levels exceeding 100 mg m−3 (off Kuwait waters) [38]. However, the dust levels reach their peak in the eastern part of Arabian Sea during SWMs due to diurnal heating, turbulent mixing, and strong winds coming mainly from the northwest (Shamal) or over the mountain in northeastern Somalia [37,38,39,40]. The Sahara is the source of these dust/aerosol particles for the Arabian Peninsula and the Red Sea, with an annual contribution of 60–200 × 106 tons of soil dust. This accounts for 50% of the total global dust emissions in the troposphere [38,41]. Dust is found to be one of the main causing factors of algal blooms in the Red Sea during an NEM (hotspots 9 and 10) as well as the Arabian Gulf (hotspots 7 and 8) (Table 1 and Figure 1).
In addition to the natural nutrient sources mentioned above, nutrients can also be found in coastal industrial waste. Due to the rapid economic and population growth in countries surrounding the Arabian Sea and the industrial development of coastal regions, the coastal ecosystem has been affected and has changed considerably during the last few decades. Coastal industrial activities (industrial effluent, ship waste, and coastal reclamation) are described in Table 2. The industrial effluents set out in Table 2 can enrich the nutrients and constituents of the NIO waters because they contain significant organic matter (sewage) [42,43], inorganic matter [44], heavy metals (e.g., Zn, Cu, Co, Pb, and Cd) [45], and hydrocarbons [46]. Coastal infrastructure constructions can cause the formation of relatively large, semi-closed, shallow lagoons with high eutrophication [47] and the removal of coastal mangroves, which are essential for the filtering of nitrates and phosphates carried away by streams to the sea [48,49]. The blooms in the northern Red Sea and in the Arabian Gulf coasts are predicted to be caused by coastal discharges near the industrial zone of the UAE, and Bahrain in the northern Red Sea area (Table 2).
4.2. Sunlight
The intensity and duration of sunlight (shortwave solar radiation with a wavelength <700 nm) is another significant factor regulating algal growth [59]. Its substantial control of ocean biological process is described in Table 3. The NIO represents a region of exceptionally intense solar irradiance, which is sensitive to weather conditions [59]. Typically, the strongest sunlight over the Arabian Sea and the Sea of Oman is received in NEMs.
The Arabian Sea receives a maximum solar radiation of 320 W m−2 during April–May [61,63] and more than 280 W m−2 in the Sea of Oman in May [60]. Lower levels of sunlight are received during SWMs compared to NEMs, since light levels decrease by about 100 W m−2 from a spring peak in the Arabian Sea [61,63]. However, the Arabian Gulf experiences a different surface pattern, similar to that of the North Atlantic, in which shortwave radiation at the ocean’s surface reaches its maximum during SWMs (June–July: ~290 Wm−2) and its minimum during NEMs (December–January: ~140 W m−2) [64]. These different sunlight patterns over the Arabian Sea and the Sea of Oman are due to the effect of seasonal monsoons, which strongly influence cloud cover [59]. SWMs are associated with an increase in deep convective cloud cover over the Arabian Sea, especially during late May and early June [60]. Such clouds reflect a large fraction of the solar radiation, which thus decreases the shortwave radiation incident at the surface of the ocean [65]. In contrast, northeast monsoons are characterized by clear skies, which result in high levels of incoming solar radiation making it through to the surface in the Arabian Sea and the Sea of Oman [63].
In contrast, the Arabian Gulf and the Red Sea do not experience such a strong monsoon climate and instead follow the typical seasonal cycle of higher cloud convergence during winter and less during the summer.
In addition to the effect of clouds, natural aerosols (dust) and industrial aerosols (biomass burning and black and organic carbon) have a marked effect on the solar radiation reaching the surface of the Arabian Sea and its adjacent waters [59]. Along with the significant role of aerosols in adding nutrients to the ocean, aerosols also absorb and scatter solar radiation [66,67], and so can affect the growth of cloud droplets [35]. This can cause a large reduction in the solar radiation at the Earth’s surface in the Arabian Sea.
It should be noted that:
- (1)
- (2)
- By depositing iron, phytoplankton growth is increased, leading to the formation of Dimethylsulfoniopropionate (DMSP) that, when degraded to dimethyl sulphide (DMS), can lead to acidic sulphate aerosols [69]. Aerosols can reduce the shortwave radiation arriving at the surface by 21 W m−2 and increase top-of-the-atmosphere-reflected radiation by 18 W m−2 during March–April [70];
- (3)
- Anthropogenic aerosols have caused a 20 W m−2 (10%) fall in solar radiation over the Arabian Sea during the period 1950 to 2000, due to the 3 km thick layer of pollution over the northern Indian Ocean (south India) [71,72]. This must certainly affect ocean productivity and the types of marine organisms that are found in the NIO. For example, during SWMs, solar radiation is prominent in the Red Sea (hotspots 9 and 10), Arabian Gulf (hotspot 7), and Sea of Oman (hotspot 6). However, during NEMs, solar radiation is prominent in the Arabian Sea (hotspot 5).
5. Transport of Algae and Nutrients
The supply of nutrients and intense solar radiation cause larger blooms with more biomass in the NIO compared to other oceans. The algal blooms and nutrients, wherever originated, tend to travel and spread into new regions. Thus, some of the hotspots receive blooms from other regions, while the other hotspots are the sources of blooms. In their transport and spread, algal blooms can either sustain their growth or perish on their way, depending on whether the evolving conditions are conducive for growth. This migration of algae and nutrients can occur in two main ways: (1) vertically in the water column or (2) horizontally by advection. Vertical transport is localized in nature, whereas horizontal transport connects geographical regions. The latter two-dimensional transport method is driven by strong jet-like winds, which can persist for 3 months or so over large areas [28]. The resultant curl of the wind stress and associated Ekman pumping drive strong vertical motion (upwelling and convective mixing) and horizontal (advective) processes [28]. These in turn change the physical and chemical environment [73], which can occasionally result in large concentrations of phytoplankton. The key relevant processes are shown in Figure 2 and described as follows:
5.1. Upwelling
During SWMs, winds can induce prolonged strong coastal upwelling in the northwestern Arabian Sea during May [28] along the coasts of Somalia, Oman (the southern Arabian Peninsula) [28,54,74], and along the Indian coasts [25], and weak upwelling along the coasts of Pakistan, Iran [25,54,74], and the northern Red Sea (Gulf of Aqaba) [75,76]. At the same time, Ekman suction induces upwelling in the southern Red Sea (the Gulf of Aden) [74,77,78]. Such coastal upwelling regions can be very extensive off the coast of Arabia, exceeding 750 km or so and up to 50 km offshore [28,74,79]. Meanwhile, weaker open-ocean upwelling events occur in the northwestern Indian region [28], affecting 400 km of shoreline to a depth of 50 m or so [74], which can last for several months [28]. Upwelling is considered to be the dominant process promoting blooms in the NIO [25,28,76,80], especially coastal upwelling, which plays a larger role in controlling phytoplankton dynamics than had been previously thought of [73,76]. Upwelling typically: (i) reduces the mixed-layer depth and can make it much shallower, (ii) supplies nutrients (phosphate, nitrate, and silicate) into the mixed layer, drawing up water from depths of 50 to 100 m [25,28,81], (iii) affects the composition of nutrients, especially nitrogenous nutrients, [82], and (iv) affects sea temperature through the injection of colder water from below [79]. Table 1 and Table 4 show the main areas in the NIO that are strongly influenced by upwelling such as hotspots 1, 3, and 4 in the Arabian Sea during SWMs, hotspot 6 in the Sea of Oman during SWMs and NEMs, hotspot 9 during SWMs, and hotspots 9 and 10 during NEMs and SWMs in the Red Sea.
5.2. Convective Mixing
Convective mixing is considered to be the second-most dominant vertical process that plays a role in the regional blooms of the Arabian Sea and its adjacent waters, especially during NEMs [28]. Mixing can deepen the mixed layer and supply nutrients to the euphotic zone by entraining fluid from below the thermocline and incorporating it into the mixed layer [73,76,84,86,87,88]. Mixing appears to be weaker during SWMs when upwelling is dominant [28]. Mixing is strong in the eastern, northern, and western Arabian Sea [87,89], the southern Red Sea (Gulf of Aden) [77,90], and the northern part of the Red Sea (Gulf of Aqaba) during NEMs [84,87,88,91,92]. Convective mixing in the aforementioned regions can reach depths of 300 m during NEMs, and a staggering depth of 860 m was reached during the unusually cold winter of 1992 [76]. It can become weaker during SWMs in some parts of the Arabian Sea and the southern part of the Red Sea (Gulf of Aden) [77,90]. The mixing is a major trigger of algal blooms in the Arabian Sea during NEMs in hotspots 4 and 5 and to lesser extent in SWMs.
5.3. Advection
In addition to the vertical forcing mechanisms mentioned earlier, horizontal advection can carry nutrient-rich waters and algal blooms over large distances [93]. Advection occurs on different scales in the form of mesoscale eddies [28,89], large cyclonic and anticyclonic eddies [74], local cyclonic eddies [90,92,94], and currents [90,95], as summarized in Table 5. These advective patterns are caused by the prevailing winds and by the change in water temperatures [28,90,94]. Advection can replenish nutrients when supply due to, for example, upwelling has been totally consumed [25]. The transported nutrients can facilitate both entrainment and detrainment blooms, modulating the strength of blooms depending on local conditions [90,94]. Ultimately, it is net entrainment that maintains the nutrient supply to the euphotic zone [25,74]. The southward advection is found to be the main cause of algal blooms at hotspot 2 during SWMs and the northward advection at hotspot 3 during NEMs.
6. Hotspots of Algal Blooms in NIO
The variabilities in nutrients supply, sunlight, and the dynamics of the NIO over space and time have resulted in high spatiotemporal variabilities of algal blooms in the NIO, in which they occur more frequently in some regions and seasons than others. In our review of more than a hundred regional studies, we found that reported blooms are more frequent in the ten location ‘hotspots’ shown in Figure 1. The identified ten hotspots of algal blooms in the NIO are scattered in the Arabian Sea, Sea of Oman, Arabian Gulf, and Red Sea. Our findings are also supported by the seasonal climatology satellite images of Chlorophyll-a (Chl-a), which is an indicator of algal bloom growth, as we now describe.
6.1. Southwest Monsoon
During SWMs, algal blooms occur intensively in three hotspots located in the southern region near India (location 1), southern Oman (location 2), and in the Sea of Oman (location 3), as shown in Figure 1 and Figure 3. The occurrence of algal blooms in location 1 is due to strong SWM upwelling caused by alongshore coastal winds [74,80,97]. This upwelling can increase the productivity to more than 1.1 g cm−2 d−1 and supports the growth of larger phytoplankton [28]. These are long-lasting blooms due to continuous nutrient input and result in the water becoming highly oligotrophic due to denitrification [83]. In addition, the blooms that occur in this region during SWMs are also due to southward advection that transports nutrients to this region. Similarly, blooms at location 2 (southern Oman) commonly occur during SWMs in an intensive upwelling area during periods of weak wind due to the weak Findlater jet [98]. The winds are in the northward direction, which activates Ekman pumping, as shown in Figure 2. Therefore, during such times, mechanical mixing exists in the surface layer, which lifts the subsurface nutrients into the region of cyclonic eddy flow [89]. Upwelling and mixing can support the growth of cold-water filaments with high Chl-a (9 mg m−3), extending to 100–700 km offshore [37,97]. They usually form a ring shape following the anticyclonic circulation in this sub-region. In addition, during SWMs, there is strong upwelling in location 3 along the northern Omani coasts [81]. During this period, algal blooms are observed between August and October, with the maximum number of algal bloom occurrences being observed during August (13%). These findings based on in situ observations are consistent with the maximum Chl-a distribution retrieved from MODIS climatology images (Figure 4), where high Chl-a concentrations are observed in the three locations during SWMs.
In contrast, fewer algal bloom events during SWMs occur in the northern Arabian Gulf (location 8). This is mainly due to: (1) the lack of nutrients as they are consumed during the winter season and (2) the weak localized upwelling along the Iranian coast [54]. However, the few blooms observed are due to the summer dust nutrients reaching up to 107 mg m−3 [38], in addition to the elevated organic nutrients (sewage) that make their way into this area (location 8) [43]. Such coastal nutrient eutrophication contributes significantly to bloom development [44]. Moreover, few patches of algae also grow in the south Red Sea (location 9) during SWMs, in which low Chl-a concentrations (0.02–0.04 mg m−3) [76,88] are found [76]. These few blooms are triggered by the prevailing southwesterly winds causing upwelling along the southern coastline and increasing nutrient availability [78]. Similarly, relatively few blooms are observed in the Red Sea during SWMs, which is due to: (i) the stable stratification [99]; (ii) strong downwelling caused by summer mesoscale anticyclonic eddies (Gittings et al., 2017); and (iii) oligotrophic conditions that cover most of the Red Sea caused by prior NEM nutrient consumption.
Furthermore, algal blooms at location 6 occur in SWMs with less intensity caused by entrainment–transitional blooms. Entrainment blooms are similar to upwelling blooms, except that the continuous source of nutrients is provided by entrainment. These blooms are weaker and smaller than upwelling blooms because entrainment steadily thickens the mixed layer, which in turn decreases the depth-averaged light intensity. The blooms formed between the entrainment and detrainment blooms are called transitional blooms. Detrainment blooms do not have a continuous source of nutrients. Instead, they require a nutrient build-up prior to their onset formed after a period of entrainment. Detrainment blooms appear at the initial period of nutrient depletion [25]. Transitional blooms occur in the central Arabian Sea and move northeastward into a newly evolving mixed-layer bloom area. This transitional period extends through to August when the deepened mixed layer covers the northern Arabian Sea. The transitional period ends through the end of the SWM when more typical tropical conditions return [28].
6.2. Northwest Monsoon
Algal blooms occur in more locations during NEMs (eight hotspots) than during SWMs (three hotspots). In this season, algal blooms occur at location 4, on the northern side of location 1, during February to April (Figure 1 and Figure 2). They are mainly caused by the northward advection of nutrients and the peak of solar radiation during April–May in this region. In addition to advective processes, blooms become denser in this region because of strong winds which cause mixing and excess evaporation at the surface [100]. Likewise, algal blooms typically occur in location 5 during NEMs (February to May) and mostly in March. Intense blooming activity is caused by wind and high isolation [101]. Wind causes local upwelling, convective mixing, and northward advection into the area. In addition, the Indus river discharges massive amounts of water into this region during March and April (13,000 m3 s−1) due to snow and glacier melt [102,103]. This carries much sediment and nutrients from the soil, significantly affecting seawater concentrations and promoting blooms compared to during SWMs [104].
Similarly, algal blooms at location 6 intensively occur during NEMs in the northern central Arabian Sea caused by detrainment–entrainment blooms. Detrainment–entrainment bloom events happen during poor nutrient supply periods due to nutrient depletion by prior bloom events. The available nutrients can only support weak blooms within 50 km of the shore. Weaker convective mixing is not enough to activate the blooming over this sub-region. In addition, during this season, location 2 experiences algal blooms, which are mostly not grown in this region and have been transported from the northern area (location 6).
In addition, blooms in location 3 also occur during NEMs (March–April) due to monsoonal winds, and the discharge of warm coastal plume water along the coast of Oman [81] induces upward advection. Most of these blooms occur in January–April with a maximum frequency being recorded in April (17%) due to intense solar radiation. As observed, blooms in this region occur during both monsoons, which is explained by the combination of the environmental factors encouraging the growth of blooms, such as moderate rainfall in December–January, high winds and high light intensity in March–April, and water mass advection during NEMs and SWMs in opposite directions [58,105].
Algal blooms during NEMs get transferred into the Arabian Gulf (location 7). Most of these blooms reach the northern emirates of the UAE and the southern coastal waters of Iran (location 7), causing 50% of the total frequent algal blooms in the area. In fact, 17% of the algal bloom events occur in January, which is the highest compared to other months, and it drops to 13% through the winter months towards May. Algal blooms start to regrow again in November and December (15% and 10%, respectively). Similar to location 7, algal blooms commonly occur during NEMs in location 8 (near Kuwait). This area experiences a period of low winds and a stable water-column during NEMs, and its closeness to the Shatt Al-Arab river triggers the growth of blooms. The blooming intensity is found to be linked with the rate of the Shatt Al-Arab discharge. Intense blooming occurs from March to May (Figure 3), coinciding with high river discharge (~300 m3 s−1) compared to other months (200 m3 s−1). The river carries considerable amounts of nutrients (~50.5 μmol L−1), nitrates, and phosphates.
Moreover, blooms commonly occur in February and March (Figure 1 and Figure 3) in the southern and northern Red Sea (near Gulf of Aqaba) (locations 9 and 10) [76,88,106] with more intensity in the southern part of the region [76,95]. High Chl-a concentrations (around 1.2 μg L−1) [76,88] are found during NEMs in the north Red Sea [76]. The intense blooming during NEMs in the Red Sea is encouraged by: (i) upwelling, deep winter mixing, and heat flux in the north, (ii) wind-induced horizontal intrusions of nutrient-rich water in the south, and (iii) the development of a shallow mixed layer and seasonal thermocline (i.e., a layer within the water column where the vertical gradient of temperature is a local maximum) [30]. These factors contribute to: (i) increasing the average exposure of phytoplankton to light in the north; (ii) enabling the horizontal transport of nutrients (e.g., nitrates: 0.56–0.84 µmol L−1) [90]; and (iii) providing enough oxygen for respiration (Dissolved Oxygen: 7.6–8.19 mg L−1) [30,76,106].
In summary form, Table 1 illustrates the associated oceanic and atmospheric conditions that promote algal blooms in each of the ten hotspots.
7. Biological Makeup of Algal Bloom Genera
The hotspots where algal blooms occur comprise diverse algal genera. The diversity of species is found to be higher in algal blooms in SWMs than those in NEMs. In addition, some species are confined within certain geographical boundaries due to the available supporting environmental conditions, as shown in Figure 5.
The dinoflagellates, Noctiluca species, cause blooms in wide areas of the Arabian Sea, Sea of Oman, Arabian Gulf and Red Sea. Noctiluca are mostly found on the eastern side, and are found the least to the west. This species, Noctiluca scintillans, is a large dinoflagellate, which usually lives in temperate, tropical, and polar waters in coastal regions and open oceans [2,87,93,107,108]. They can appear in the form of red heterotrophic Noctiluca [87] or green mixotrophic Noctiluca, and commonly cause the dark discoloration of waters to depths exceeding 2000 m [2,107,108,109]. Species concentrations can be very high (reaching 3 × 10⁶ cells m−3) in the NIO region [93], and they can become harmful by producing a lot of ammonia [105].
While they exist during both monsoons (SWM and NEM), concentrations are particularly intense during late SWMs (September–November). The high tolerance of Noctiluca (a eurythermal organism) to seasonal change is due to the availability of suitable water temperature ranges [110]. These ranges are within the optimum water temperature for the growth of red Noctiluca (10–25 °C) and green Noctiluca (25–30 °C). This makes the two varieties able to thrive at different SSTs [87]. In addition, Noctiluca are found to be dependent on upwelled nutrients. They appear during SWMs in upwelling locations on the western and southern coasts of India (locations 1, 4, and 5), southern and northern coasts of Oman (location 3), the eastern Arabian Gulf (location 7), and the southern and central Red Sea (location 9). This is indicated in Figure 6a, which represents the enhanced true color image (ERGB), Chl-a, aerosol optical thickness (AOT), and PAR derived from the satellite Moderate Resolution Imaging Spectroradiometer (MODIS) Aqua. These images are captured for a Noctiluca blooming event, which occurred over the upwelling location off the coast of southwestern India during an SWM (1 August 2016). As shown in this image, the red and purple colors in the ERGB image indicates the presence of the algal blooms. The corresponding Chl-a values in this region show high concentrations (>3 mg m−3) indicated by the red color, whereas the blue-purple colors indicate low Chl-a levels. It is clear that this event occurred during light dust conditions (AOT < 0.1: light brown color) and at moderate solar radiation (PAR~55: blue color).
Noctiluca causes blooms during NEMs (March–May) off the northwestern coast of India, southern Pakistan near the convective mixing location, and in the northern Sea of Oman during frequent dust storms. Dust storms blow intensively during March–May, when the aerosol optical thickness (AOT) is high. In addition, these areas show an excess of diatoms and silicate, which can support the growth of Noctiluca through grazing [2,111]. The dependency of Noctiluca on dust deposition is confirmed by Figure 6b,c which show images from MODIS and Visible Infrared Imaging Radiometer Suite (VIIRS) over the Arabian Gulf and the Sea of Oman captured during Noctiluca bloom events on 25 January 2004 and 7 March 2013. As shown in these figures, Noctiluca patches are in an area of high AOT (>0.2: dark brown color), which refers to the high dust loading during these events. These figures also show that Noctiluca grows when PAR in the range between 35 and 56 W m−2 s−1 (low and high light radiance). This confirms that Noctiluca can grow during both seasons during NEMs and SWMs and can tolerate the variability of this PAR range. In addition, Noctiluca is mixotrophic and can benefit from both photosynthesis (light availability) and silica by grazing diatoms.
Similar to Noctiluca, the cyanobacterium Trichodesmium is found to be the second most dominant genus that comprises blooms. Trichodesmium species are frequently found in the Arabian Sea and Red Sea. These species play a major role in the nitrogen cycle/new primary production by fixing atmospheric nitrogen and creating oxygen depleted (anoxic) zones [30,84,112,113]. Thus, their growth in blooms is considered to be a biological indication of stratification and nitrogen limitation in the ocean surface layer [114]. These species have been widely reported in oligotrophic [83,115,116], tropical, subtropical, and temperate seas [116]. In the NIO, Trichodesmium exist in two known forms: (1) tuft colonies (T. erythraeum), which have the appearance of a clutch of bamboo shoots and are dominant near the surface, or (2) as radial or puff colonies (T. thiebautii) that occupy the bottom half of the photic zone [88,115]. These species exceed 100 µm in size [88] and can form colonies (2–3 mm size bundles of trichomes), which can be seen with the naked eye in surface waters [116]. They appear as pinkish-red to orange-colored swirls of sawdust (brown) on the sea surface arranged in extensive long bands [115,117,118]. The sizes of these bands can vary from a few meters wide to several-kilometer-long patches [115,116,119] reaching an area of 105 km2 [116]. Their concentration can be high, reaching 10000 cells per liter [83], >2000 mg L−1 [113,120], or 30–40 mg m−3 of chlorophyll a [112,121], with higher chlorophyll a content in puff-shaped colonies than that in tufts [88] in the Arabian Sea region. Trichodesmium and Noctiluca are found to be associated with other algal types such as Bacteriastrum, Chaetoceros, Leptocylindrus [122], and Gymnodium [122] among other species. The morphological structures of some examples of these algal species are shown in Figure 7, captured by an electronic microscope. These species refer to the algal blooms that occurred in the Arabian Gulf and Sea of Oman during an NEM at hotspots 3 and 7.
Trichodesmium are concentrated in the central and eastern part of the Arabian Sea and especially in locations 1, 4, and 5. They appear during NEMs with the most intensity, especially in March, and less frequently during SWMs. Unlike Noctiluca, the appearance of these species is not dependent on upwelled nutrients. Rather, their appearance is linked to brilliant sunlight and N2 fixation, which are found to be the most important factors contributing to cyanobacterial dominance [116]. They also depend on calm water conditions [122], stable high salinity, especially in Arabian Sea [118], and phosphate and iron availability in the northern Red Sea due to the high deposition of dust from the surrounding deserts [99,123]. Thus, Trichodesmium is more abundant in anoxic and oligotrophic waters that are enriched with iron and phosphate but depleted of nitrogen [124]. These species form dense mats or rafts on the surface of the ocean and occupy the central and eastern Arabian Sea from March to August. During this period, there is plenty of sunlight and iron dust storms dropping their loads (e.g., iron and phosphate) to the ocean, supporting the growth of Trichodesmium. Figure 8 represents the ERGB, Chl-a, AOT, and PAR derived from satellites Sea-Viewing Wide Field-of-View Sensor (SeaWiFS), MODIS Terra, and Aqua captured during Trichodesmium blooming events over the NIO during different seasons. Similar to Noctiluca, high Chl-a levels (>30 mg m−3: red color) are caused by Trichodesmium events. The events shown suggest that Trichodesmium could be present during low to high dusty conditions in which AOT varies from 0.025 (light brown) to >0.2 (dark brown). Unlike Noctiluca, most of the Trichodesmium events occur at the higher PAR range (>55 W m−2 s−1), confirming the high dependency of these species on sunlight levels. This could be also due to the temperate waters occurring at the period of stratification [30].
Likewise, Gonyaulax causes algal blooms in the Arabian Sea, Sea of Oman, Arabian Gulf, and Red Sea during both seasons (NEMs and SWMs). They grow and are advected south of 21 N mostly during the SWM season (Jun–August), and north of 21 N during the NEM season (January–February). Gonyalux also causes localized blooms in the eutrophication area near Kuwait, which is dependent on Shatt-Al-Arab discharge.
Interestingly, the Phaeocystis and Cochlodinium species commonly grow within distinctive geographical boundaries and seasons. Phaeocystis grow in the western northern areas (Arabian Gulf) and the Sea of Oman during NEMs, whereas Cochodinimum grows in these areas during SWMs. However, as we move to the southeast, Phaeocystis appear during the SWM season in the central Arabian Sea and the southeastern Arabian Sea (western Indian coasts). Cochlodinium cause red discoloration of the waters [52], and their concentrations can reach 926 cells L−1 [125], 9 × 10⁶ cells L−1, or 78 mg m−3 [81]. These species can cover large areas (as large as 500 km2) [126].
Other species, Hornellia, Dinophysis, and Gymnodinium, readily grow and cause blooms: (i) in the most southeastern part of the Arabian Sea (Indian coasts) from June to August; and (ii) in the northwestern region (the North Sea of Oman and Arabian Gulf) during NEMs (March–May). The less frequently occurring species, Karenia, Alexandrium, Skeletonema, Nitzschia, and Chattonella, only grow during SWMs (September–November) in the eastern Arabian Sea and southern Sea of Oman. In addition, other species grow intensively in more localized areas, such as: (i) Ceratium in SWM upwelling at the southern Omani coasts and NEM upwelling at the northern Omani coast; and (ii) Synedra in the northern eastern Arabian Sea (near Pakistan), where there is upwelling and Indus river discharge.
8. Conclusions
Algal blooms in the NIO have attracted much attention due to their frequent appearance during the last three decades. Although algae are the primary food source for marine habitats, their increasing frequency and severity may adversely affect other marine life. Thus, understanding the ecology of algal blooms is crucial if we are to monitor and assess their potential risk and forecast their future evolution over the seasonal cycle and modulation by monsoons. This is especially true in coastal areas where blooms can impact, and be impacted by, human activities. The aim of this paper was to identify regions in the NIO that are prone to algal blooms and the reasons behind the overgrowth in these locations. We were able to identify ten locations where algal blooms typically grow during both SWMs and NEMs in the NIO. Their growth was found to be dependent upon nutrients brought by dust and river runoff, upwelling, mixing, and advection. Upwelling and mixing occur in all the regions during the SWM season. Dust occurs in most regions in the NEM season. Contrary to common belief, we found that sunlight radiation has higher intensity during NEMs than SWMs in some regions, with important implications for algal growth. The Arabian Sea was found to be a prime habitat for algal blooming due to its large, open surface area and deep-water column. In contrast, the Red Sea was found to be the region which was least attractive to algal growth. The algal blooms (Chl-a > 5 mg m−3) themselves were found to be dominated by Noctiluca and Trichodesmium species, which are highly dependent on upwelled nutrient and calm, iron-rich, sunny surface waters, respectively. Their frequency has increased over the last 15 years, which can be linked with the increasing intensity of monsoons and upwelling.
Funding
The publication of this research was funded by Khalifa University.
Data Availability Statement
Not applicable.
Acknowledgments
The authors thank Khalifa University for the financial support provided to publish this work. The authors are very grateful to the Ministry of Climate Change and Environment for providing data. We gratefully acknowledge the NASA Ocean Biology Processing Group (OBPG) for providing ocean color data and SeaDAS software.
Conflicts of Interest
The authors declare no conflict of interest.
Appendix A
Figure A1.
Algal bloom outbreaks in the NIO during September–November over four decades: (1) 1971–1980, (2) 1981–1990, (3) 1991–2000, and (4) 2001–2010.
Figure A1.
Algal bloom outbreaks in the NIO during September–November over four decades: (1) 1971–1980, (2) 1981–1990, (3) 1991–2000, and (4) 2001–2010.

Figure A2.
Algal bloom outbreaks in the NIO during June–August over four decades: (1) 1971–1980, (2) 1991–2000, and (3) 2001–2010.
Figure A2.
Algal bloom outbreaks in the NIO during June–August over four decades: (1) 1971–1980, (2) 1991–2000, and (3) 2001–2010.

Figure A3.
Algal bloom outbreaks in the NIO during December–February over four decades: (1) 1971–1980, (2) 1981–1990, (3) 1991–2000, and (4) 2001–2010.
Figure A3.
Algal bloom outbreaks in the NIO during December–February over four decades: (1) 1971–1980, (2) 1981–1990, (3) 1991–2000, and (4) 2001–2010.

Figure A4.
Algal bloom outbreaks in the NIO during March–May over four decades: (1) 1971–1980, (2) 1981–1990, (3) 1991–2000, and (4) 2001–2010.
Figure A4.
Algal bloom outbreaks in the NIO during March–May over four decades: (1) 1971–1980, (2) 1981–1990, (3) 1991–2000, and (4) 2001–2010.

References
- Madhupratap, M.; Sawant, S.; Gauns, M. A First Report on a Bloom of the Marine Prymnesiophycean, Phaeocystis Globosa from the Arabian Sea. Oceanol. Acta 2000, 23, 83–90. [Google Scholar] [CrossRef] [Green Version]
- Al-Azri, A.; Al-Hashmi, K.; Goes, J.; Gomes, H.; Rushdi, A.I.; Al-Habsi, H.; Al-Khusaibi, S.; Al-Kindi, R.; Al-Azri, N. Seasonality of the Bloom-Forming Heterotrophic Dinoflagellate Noctiluca Scintillans in the Gulf of Oman in Relation to Environmental Conditions. Int. J. Ocean. Oceanogr. 2007, 2, 51–60. [Google Scholar]
- Rao, S.; Al-Yamani, F. Phytoplankton Ecology in the Waters between Shatt Al-Arab and Straits of Hormuz, Arabian Gulf: A Review. Plankton Biol. Ecol. 1998, 45, 101–116. [Google Scholar]
- Luqman, M.; Javed, M.M.; Yousafzai, A.; Saeed, M.; Ahmad, J.; Chaghtai, F. Blooms of Pollution Indicator Micro-Alga (Synedra acus) in Northern Arabian Sea along Karachi, Pakistan. Indian J. Geo-Mar. Sci. 2015, 44, 1377–1381. [Google Scholar]
- Jin, Q.; Wang, C. A Revival of Indian Summer Monsoon Rainfall since 2002. Nat. Clim. Chang. 2017, 7, 587. [Google Scholar] [CrossRef]
- Wang, H.; McClean, J.L.; Talley, L.D.; Yeager, S. Seasonal Cycle and Annual Reversal of the Somali Current in an Eddy-Resolving Global Ocean Model. J. Geophys. Res. Ocean. 2018, 123, 6562–6580. [Google Scholar] [CrossRef]
- Li, Z.; Lau, W.; Ramanathan, V.; Wu, G.; Ding, Y.; Manoj, M.G.; Liu, J.; Qian, Y.; Li, J.; Zhou, T. Aerosol and Monsoon Climate Interactions over Asia. Rev. Geophys. 2016, 54, 866–929. [Google Scholar] [CrossRef]
- Singh, A.; Ramesh, R. Environmental Controls on New and Primary Production in the Northern Indian Ocean. Prog. Oceanogr. 2015, 131, 138–145. [Google Scholar] [CrossRef]
- Sarma, V.V.S.S.; Swathi, P.S.; Kumar, M.D.; Prasannakumar, S.; Bhattathiri, P.M.A.; Madhupratap, M.; Ramaswamy, V.; Sarin, M.M.; Gauns, M.; Ramaiah, N.; et al. Carbon Budget in the Eastern and Central Arabian Sea: An Indian JGOFS Synthesis. Glob. Biogeochem. Cycles 2003, 17, 1102. [Google Scholar] [CrossRef]
- Zhai, P.; Bower, A.S.; Smethie, W.M.; Pratt, L.J. Formation and Spreading of Red Sea Outflow Water in the Red Sea. J. Geophys. Res. Ocean. 2015, 120, 6542–6563. [Google Scholar] [CrossRef]
- Alosairi, Y.; Imberger, J.; Falconer, R.A. Mixing and Flushing in the Persian Gulf (Arabian Gulf). J. Geophys. Res. Ocean. 2011, 116, C03029. [Google Scholar] [CrossRef]
- Bruce, J.G.; Johnson, D.R.; Kindle, J.C. Evidence for Eddy Formation in the Eastern Arabian Sea during the Northeast Monsoon. J. Geophys. Res. 1994, 99, 7651–7664. [Google Scholar] [CrossRef]
- Kumar, S.P.; Ramaiah, N.; Gauns, M.; Sarma, V.V.S.S.; Muraleedharan, P.M.; Raghukumar, S.; Kumar, M.D.; Madhupratap, M. Physical Forcing of Biological Productivity in the Northern Arabian Sea during the Northeast Monsoon. Deep. Sea Res. Part II Top. Stud. Oceanogr. 2001, 48, 1115–1126. [Google Scholar] [CrossRef]
- Zaman, Q.; Afzal, M.; Haroon, M.A. Characteristics of Sea Surface Temperature of the Arabian Sea Coast of Pakistan and Impact of Tropical Cyclones on SST. Pak. J. Meteorol. 2014, 11, 61–70. [Google Scholar]
- Nandkeolyar, N.; Raman, M.; Sandhya Kiran, G.; Ajai, A. Comparative Analysis of Sea Surface Temperature Pattern in the Eastern and Western Gulfs of Arabian Sea and the Red Sea in Recent Past Using Satellite Data. Int. J. Oceanogr. 2013, 2013, 16. [Google Scholar] [CrossRef]
- Godad, S.P.; Panmei, C.; Naidu, P.D. Remote Forcing of Winter Cooling in the Arabian Sea: Implications for the NE Monsoon. Palaeogeogr. Palaeoclimatol. Palaeoecol. 2022, 586, 110755. [Google Scholar] [CrossRef]
- Murty, S.A.; Bernstein, W.N.; Ossolinski, J.E.; Davis, R.S.; Goodkin, N.F.; Hughen, K.A. Spatial and Temporal Robustness of Sr/Ca-SST Calibrations in Red Sea Corals: Evidence for Influence of Mean Annual Temperature on Calibration Slopes. Paleoceanogr. Paleoclimatol. 2018, 33, 443–456. [Google Scholar] [CrossRef]
- Forouzan, F.; Ghazban, F.; Ardestani, M. Sea Surface Temperature and Salinity Reconstruction from Geochemical Tracers of a Massive Coral in the Persian Gulf. Int. J. Environ. Res. 2014, 8, 1135–1144. [Google Scholar]
- Al Shehhi, M.R.; Gherboudj, I.; Ghedira, H. In Situ Spectral Response of the Arabian Gulf and Sea of Oman Coastal Waters to Bio-Optical Properties. J. Photochem. Photobiol. B Biol. 2017, 175, 235–243. [Google Scholar] [CrossRef]
- Rao, G.R.; Devi, Y.V.; Reddy, K.G.; Prasad, A.L.N. Studies on Evaporation from the North Indian Ocean. Indian J. Mar. Sci. 1981, 10, 337–340. [Google Scholar]
- Xue, P.; Eltahir, E.A.B. Estimation of the Heat and Water Budgets of the Persian (Arabian) Gulf Using a Regional Climate Model. J. Clim. 2015, 28, 5041–5062. [Google Scholar] [CrossRef]
- Al-Subhi, A.M. Estimation of Evaporation Rates in the Southern Red Sea Based on the AVHRR Sea Surface Temperature Data. J. King Abdulaziz Univ. Mar. Sci. 2012, 23, 77–89. [Google Scholar] [CrossRef]
- Zhai, P. Buoyancy-Driven Circulation in the Red Sea. Ph.D. Thesis, Massachusetts Institute of Technology, Cambridge, MA, USA, 2014. [Google Scholar]
- Wiggert, J.D.; Hood, R.R.; Banse, K.; Kindle, J.C. Monsoon-Driven Biogeochemical Processes in the Arabian Sea. Prog. Oceanogr. 2005, 65, 176–213. [Google Scholar] [CrossRef]
- McCreary, J.P.; Kohler, K.E.; Hood, R.R.; Olson, D.B. A Four-Component Ecosystem Model of Biological Activity in the Arabian Sea. Prog. Oceanogr. 1996, 37, 193–240. [Google Scholar] [CrossRef]
- Volpe, G.; Colella, S.; Forneris, V.; Tronconi, C.; Santoleri, R. The Mediterranean Ocean Colour Observing System–System Development and Product Validation. Ocean Sci. 2012, 8, 869–883. [Google Scholar] [CrossRef] [Green Version]
- Joseph, T.; Shaiju, P.; Laluraj, C.M.; Balachandran, K.K.; Nair, M.; George, R.; Nair, K.K.C.; Sahayak, S.; Prabhakaran, M.P. Nutrient Environment of Red Tide-Infested Waters off South-West Coast of India. Environ. Monit. Assess. 2008, 143, 355–361. [Google Scholar] [CrossRef]
- Brock, J.C.; McClain, C.R.; Luther, M.E.; Hay, W.W. The Phytoplankton Bloom in the Northwestern Arabian Sea during the Southwest Monsoon of 1979. J. Geophys. Res. Ocean. 1991, 96, 20623–20642. [Google Scholar] [CrossRef]
- Shriadah, M.A. Nutrient Salts in the United Arab Emirates Waters (the Arabian Gulf and the Gulf of Oman). Pak. J. Mar. Sci. 2006, 15, 1–9. [Google Scholar]
- Shaikh, E.A.; Roff, J.C.; Dowidar, N.M. Phytoplankton Ecology and Production in the Red Sea off Jiddah, Saudi Arabia. Mar. Biol. 1986, 92, 405–416. [Google Scholar] [CrossRef]
- Khalid, S.; Qasim, M.; Farhan, D. Hydro-Meteorological Characteristics of Indus River Basin at Extreme North of Pakistan. J. Earth Sci. Clim. Chang. 2013, 5, 170. [Google Scholar]
- Al-Handal, A.; Hu, C. MODIS Observations of Human-Induced Changes in the Mesopotamian Marshes in Iraq. Wetlands 2015, 35, 31–40. [Google Scholar] [CrossRef]
- Harrison, P.J.; Khan, N.; Yin, K.; Saleem, M.; Bano, N.; Nisa, M.; Ahmed, S.I.; Rizvi, N.; Azam, F. Nutrient and Phytoplankton Dynamics in Two Mangrove Tidal Creeks of the Indus River Delta, Pakistan. Mar. Ecol. Prog. Ser. 1997, 157, 13–19. [Google Scholar] [CrossRef] [Green Version]
- Al-Shehhi, M.R.; Gherboudj, I.; Ghedira, H. Temporal-Spatial Analysis of Chlorophyll Concentration Associated with Dust and Wind Characteristics in the Arabian Gulf. In Proceedings of the 2012 Oceans-Yeosu IEEE, Yeosu, Korea, 21–24 May 2012; pp. 1–6. [Google Scholar]
- Patra, P.K.; Behera, S.K.; Herman, J.R.; Maksyutov, S.; Akimoto, H.; Yamagata, Y. The Indian Summer Monsoon Rainfall: Interplay of Coupled Dynamics, Radiation and Cloud Microphysics. Atmos. Chem. Phys. 2005, 5, 2181–2188. [Google Scholar] [CrossRef] [Green Version]
- Kalenderski, S.; Stenchikov, G.L.; Zhao, C. Modeling a Typical Winter-Time Dust Event over the Arabian Peninsula and the Red Sea. Atmos. Chem. Phys. 2013, 13, 1999–2014. [Google Scholar] [CrossRef] [Green Version]
- Wiggert, J.D.; Murtugudde, R.G. The Sensitivity of the Southwest Monsoon Phytoplankton Bloom to Variations in Aeolian Iron Deposition over the Arabian Sea. J. Geophys. Res. Ocean. 2007, 112, C05005. [Google Scholar] [CrossRef] [Green Version]
- Rao, D.V.S.; Al-Yamani, F.; Rao, C.V.N. Eolian Dust Affects Phytoplankton in the Waters off Kuwait, the Arabian Gulf. Naturwissenschaften 1999, 86, 525–529. [Google Scholar]
- Kumar, A. Reclaimed Islands and New Offshore Townships in the Arabian Gulf: Potential Natural Hazards. Curr. Sci. 2009, 96, 480. [Google Scholar]
- Anisimov, A.; Tao, W.; Stenchikov, G.; Kalenderski, S.; Prakash, P.J.; Yang, Z.-L.; Shi, M. Quantifying Local-Scale Dust Emission from the Arabian Red Sea Coastal Plain. Atmos. Chem. Phys. 2017, 17, 993–1015. [Google Scholar] [CrossRef] [Green Version]
- Al-Shehhi, M.R.; Gherboudj, I.; Ghedira, H. A Study on the Effect of Dust and Wind on Phytoplankton Activities in the Arabian Gulf. In Proceedings of the 2012 IEEE International Geoscience and Remote Sensing Symposium, Munich, Germany, 22–27 July 2012; pp. 2571–2574. [Google Scholar]
- Sahay, A.; Ali, S.M.; Gupta, A.; Goes, J.I. Ocean Color Satellite Determinations of Phytoplankton Size Class in the Arabian Sea during the Winter Monsoon. Remote Sens. Environ. 2017, 198, 286–296. [Google Scholar] [CrossRef]
- Sale, P.F.; Feary, D.A.; Burt, J.A.; Bauman, A.G.; Cavalcante, G.H.; Drouillard, K.G.; Kjerfve, B.; Marquis, E.; Trick, C.G.; Usseglio, P. The Growing Need for Sustainable Ecological Management of Marine Communities of the Persian Gulf. Ambio 2011, 40, 4–17. [Google Scholar] [CrossRef] [Green Version]
- Heil, C.A.; Glibert, P.M.; Al-Sarawl, M.A.; Faraj, M.; Behbehani, M.; Husain, M. First Record of a Fish-Killing Gymnodinium sp. Bloom in Kuwait Bay, Arabian Sea: Chronology and Potential Causes. Mar. Ecol. Ser. 2001, 214, 15–23. [Google Scholar] [CrossRef]
- Mansour, A.M.; Nawar, A.H.; Madkour, H.A. Metal Pollution in Marine Sediments of Selected Harbours and Industrial Areas along the Red Sea Coast of Egypt. Ann. Nat. Mus. Wien Ser. A Mineral. Petrogr. Geol. Paläontol. Anthropol. Prähist. 2011, 113, 225–244. [Google Scholar]
- Naser, H. Marine Ecosystem Diversity in the Arabian Gulf: Threats and Conservation. In Biodiversity—The Dynamic Balance of the Planet; InTech Publishing: London, UK, 2014; pp. 297–328. [Google Scholar]
- Ismael, A.A. Coastal Engineering and Harmful Algal Blooms along Alexandria Coast, Egypt. Egypt. J. Aquat. Res. 2014, 40, 125–131. [Google Scholar] [CrossRef] [Green Version]
- El-Askary, H.; Abd El-Mawla, S.H.; Li, J.; El-Hattab, M.M.; El-Raey, M. Change Detection of Coral Reef Habitat Using Landsat-5 TM, Landsat 7 ETM+ and Landsat 8 OLI Data in the Red Sea (Hurghada, Egypt). Int. J. Remote Sens. 2014, 35, 2327–2346. [Google Scholar] [CrossRef]
- Robertson, A.I.; Phillips, M.J. Mangroves as Filters of Shrimp Pond Effluent: Predictions and Biogeochemical Research Needs. Hydrobiologia 1995, 295, 311–321. [Google Scholar] [CrossRef]
- Berktay, A. Environmental Approach and Influence of Red Tide to Desalination Process in the Middle East Region. Int. J. Chem. Environ. Eng. 2011, 2, 183–188. [Google Scholar]
- Al Shehhi, M.R.; Gherboudj, I.; Ghedira, H. Satellites-Based Monitoring of Harmful Algal Blooms for Sustainable Desalination. In Desalination Sustainability—A Technical, Socioeconomic, and Environmental Approach; Elsevier: Amsterdam, The Netherlands, 2017; pp. 341–366. [Google Scholar] [CrossRef]
- Richlen, M.L.; Morton, S.L.; Jamali, E.A.; Rajan, A.; Anderson, D.M. The Catastrophic 2008–2009 Red Tide in the Arabian Gulf Region, with Observations on the Identification and Phylogeny of the Fish-Killing Dinoflagellate Cochlodinium polykrikoides. Harmful Algae 2010, 9, 163–172. [Google Scholar] [CrossRef]
- Moufaddal, W.M. Use of Satellite Imagery as Environmental Impact Assessment Tool: A Case Study from the NW Egyptian Red Sea Coastal Zone. Environ. Monit. Assess. 2005, 107, 427–452. [Google Scholar] [CrossRef]
- Al-Azri, A.; Piontkovski, S.; Al-Hashmi, K.; Al-Gheilani, H.; Al-Habsi, H.; Al-Khusaibi, S.; Al-Azri, N. The Occurrence of Algal Blooms in Omani Coastal Waters. Aquat. Ecosyst. Health Manag. 2012, 15, 56–63. [Google Scholar] [CrossRef]
- Karbassi, A.; Abdollahzadeh, E.M.; Attaran-Fariman, G.; Nazariha, M.; Mazaheri-Assadi, M. Predicting the Distribution of Harmful Algal Bloom (HAB) in the Coastal Area of Oman Sea. Nat. Environ. Pollut. Technol. 2017, 16, 753. [Google Scholar]
- Saifullah, S.M.; Mandura, A.S.; Khafaji, A.K. A Platymonas Bloom in Coastal Waters of Jeddah, Saudi Arabia. Pak. J. Bot. 1988, 20, 285–289. [Google Scholar]
- Mikhail, S.K. First Monospecific Bloom of the Harmful Raphidophyte Chattonella antiqua (Hada) Ono in Alexandria Waters Related to Water Quality and Copepod Grazing. Chem. Ecol. 2007, 23, 393–407. [Google Scholar] [CrossRef]
- Al-Hashmi, K.A.; Smith, S.L.; Claereboudt, M.; Piontkovski, S.A.; Al-Azri, A. Dynamics of Potentially Harmful Phytoplankton in a Semi-Enclosed Bay in the Sea of Oman. Bull. Mar. Sci. 2015, 91, 141–166. [Google Scholar] [CrossRef]
- Arnone, R.A.; Ladner, S.; La Violette, P.E.; Brock, J.C.; Rochford, P.A. Seasonal and Interannual Variability of Surface Photosynthetically Available Radiation in the Arabian Sea. J. Geophys. Res. 1998, 103, 7735–7748. [Google Scholar] [CrossRef]
- Chang, J.-H. Global Distribution of Net Radiation According to a New Formula. Ann. Assoc. Am. Geogr. 1970, 60, 340–351. [Google Scholar] [CrossRef]
- Kumar, S.P.; Narvekar, J. Seasonal Variability of the Mixed Layer in the Central Arabian Sea and Its Implication on Nutrients and Primary Productivity. Deep. Sea Res. Part II Top. Stud. Oceanogr. 2005, 52, 1848–1861. [Google Scholar] [CrossRef]
- Shenoi, S.S.C.; Shankar, D.; Gopalakrishna, V.V.; Durand, F. Role of Ocean in the Genesis and Annihilation of the Core of the Warm Pool in the Southeastern Arabian Sea. Mausam 2005, 56, 147–160. [Google Scholar] [CrossRef]
- Weller, R.A.; Baumgartner, M.F.; Josey, S.A.; Fischer, A.S.; Kindle, J.C. Atmospheric Forcing in the Arabian Sea during 1994–1995: Observations and Comparisons with Climatology and Models. Deep Sea Res. Part II Top. Stud. Oceanogr. 1998, 45, 1961–1999. [Google Scholar] [CrossRef]
- Ahmad, F.; Sultan, S.A.R. Annual Mean Surface Heat Fluxes in the Arabian Gulf and the Net Heat Transport through the Strait of Hormuz. Atmos.-Ocean 1991, 29, 54–61. [Google Scholar] [CrossRef] [Green Version]
- Premkumar, K.; Ravichandran, M.; Kalsi, S.R.; Sengupta, D.; Gadgil, S. First Results from a New Observational System over the Indian Seas. Curr. Sci. 2000, 78, 323–330. [Google Scholar]
- Ramanathan, V.; Crutzen, P.J.; Kiehl, J.T.; Rosenfeld, D. Aerosols, Climate, and the Hydrological Cycle. Science 2001, 294, 2119–2124. [Google Scholar] [CrossRef] [PubMed] [Green Version]
- Rahul, P.R.C.; Salvekar, P.S.; Devara, P.C.S. Aerosol Optical Depth Variability over Arabian Sea during Drought and Normal Years of Indian Monsoon. Geophys. Res. Lett. 2008, 35, L22812. [Google Scholar] [CrossRef]
- Dwivedi, R.M.; Raman, M.; Babu, K.N.; Singh, S.K.; Vyas, N.K.; Matondkar, S.G.P. Formation of Algal Bloom in the Northern Arabian Sea Deep Waters during January–March: A Study Using Pooled in Situ and Satellite Data. Int. J. Remote Sens. 2008, 29, 4537–4551. [Google Scholar] [CrossRef]
- Hamza, W.; Enan, M.R.; Al-Hassini, H.; Stuut, J.-B.; de-Beer, D. Dust Storms over the Arabian Gulf: A Possible Indicator of Climate Changes Consequences. Aquat. Ecosyst. Health Manag. 2011, 14, 260–268. [Google Scholar] [CrossRef]
- Vinoj, V.; Satheesh, S.K. Measurements of Aerosol Optical Depth over Arabian Sea during Summer Monsoon Season. Geophys. Res. Lett. 2003, 30, 1263. [Google Scholar] [CrossRef]
- Evan, A.T.; Kossin, J.P.; Chung, C.E.; Ramanathan, V. Arabian Sea Tropical Cyclones Intensified by Emissions of Black Carbon and Other Aerosols. Nature 2011, 479, 94–97. [Google Scholar] [CrossRef]
- Ramanathan, V.; Crutzen, P.J.; Mitra, A.P.; Sikka, D. The Indian Ocean Experiment and the Asian Brown Cloud. Curr. Sci. 2002, 83, 947–955. [Google Scholar]
- Sathyendranath, S.; Stuart, V.; Irwin, B.D.; Maass, H.; Savidge, G.; Gilpin, L.; Platt, T. Seasonal Variations in Bio-Optical Properties of Phytoplankton in the Arabian Sea. Deep. Sea Res. Part II Top. Stud. Oceanogr. 1999, 46, 633–653. [Google Scholar] [CrossRef]
- Longhurst, A. Seasonal Cycles of Pelagic Production and Consumption. Prog. Oceanogr. 1995, 36, 77–167. [Google Scholar] [CrossRef]
- Ben-David-Zaslow, R.; Henning, G.; Hofmann, D.K.; Benayahu, Y. Reproduction in the Red Sea Soft Coral Heteroxenia fuscescens: Seasonality and Long-Term Record (1991 to 1997). Mar. Biol. 1999, 133, 553–559. [Google Scholar] [CrossRef]
- Labiosa, R.G.; Arrigo, K.R.; Genin, A.; Monismith, S.G.; van Dijken, G. The Interplay between Upwelling and Deep Convective Mixing in Determining the Seasonal Phytoplankton Dynamics in the Gulf of Aqaba: Evidence from SeaWiFS and MODIS. Limnol. Oceanogr. 2003, 48, 2355–2368. [Google Scholar] [CrossRef] [Green Version]
- Alkawri, A.; Gamoyo, M. Remote Sensing of Phytoplankton Distribution in the Red Sea and Gulf of Aden. Acta Oceanol. Sin. 2014, 33, 93–99. [Google Scholar] [CrossRef]
- Gittings, J.A.; Raitsos, D.E.; Racault, M.-F.; Brewin, R.J.W.; Pradhan, Y.; Sathyendranath, S.; Platt, T. Seasonal Phytoplankton Blooms in the Gulf of Aden Revealed by Remote Sensing. Remote Sens. Environ. 2017, 189, 56–66. [Google Scholar] [CrossRef] [Green Version]
- Al-Azri, A.R.; Piontkovski, S.A.; Al-Hashmi, K.A.; Goes, J.I.; Gomes, H.D.R. Recent Outbreaks of Harmful Algal Blooms along the Coast of Oman: Possible Response to Climate Change? In Indian Ocean Tropical Cyclones and Climate Change; Springer: Cham, Switzerland, 2010; pp. 349–357. [Google Scholar]
- Lierheimer, L.J.; Banse, K. Seasonal and Interannual Variability of Phytoplankton Pigment in the Laccadive (Lakshadweep) Sea as Observed by the Coastal Zone Color Scanner. Proc. Indian Acad. Sci.-Earth Planet. Sci. 2002, 111, 163–185. [Google Scholar] [CrossRef] [Green Version]
- Al-Azri, A.R.; Piontkovski, S.A.; Al-Hashmi, K.A.; Goes, J.I.; Gomes, H.D.R.; Glibert, P.M. Mesoscale and Nutrient Conditions Associated with the Massive 2008 Cochlodinium Polykrikoides Bloom in the Sea of Oman/Arabian Gulf. Estuaries Coasts 2014, 37, 325–338. [Google Scholar] [CrossRef] [Green Version]
- Gandhi, N.; Ramesh, R.; Prakash, S.; Kumar, S. Nitrogen Sources for New Production in the NE Arabian Sea. J. Sea Res. 2011, 65, 265–274. [Google Scholar] [CrossRef]
- Capone, D.G.; Subramaniam, A.; Montoya, J.P.; Voss, M.; Humborg, C.; Johansen, A.M.; Siefert, R.L.; Carpenter, E.J. An Extensive Bloom of the N2-Fixing Cyanobacterium Trichodesmium erythraeum in the Central Arabian Sea. Mar. Ecol. Prog. Ser. 1998, 172, 281–292. [Google Scholar] [CrossRef] [Green Version]
- Schnack-Schiel, S.B.; Niehoff, B.; Hagen, W.; Böttger-Schnack, R.; Cornils, A.; Dowidar, M.M.; Pasternak, A.; Stambler, N.; Stübing, D.; Richter, C. Population Dynamics and Life Strategies of Rhincalanus nasutus (Copepoda) at the Onset of the Spring Bloom in the Gulf of Aqaba (Red Sea). J. Plankton Res. 2008, 30, 655–672. [Google Scholar] [CrossRef] [Green Version]
- Al-Busaidi, S.S.; Al-Rashdi, K.M.; Al-Gheilani, H.M.; Amer, S. Hydrographical Observations during a Red Tide with Fish Mortalities at Masirah Island, Oman. J. Agric. Mar. Sci. 2008, 13, 63–72. [Google Scholar] [CrossRef] [Green Version]
- Sarma, V.; Patil, J.S.; Shankar, D.; Anil, A.C. Shallow Convective Mixing Promotes Massive Noctiluca scintillans Bloom in the Northeastern Arabian Sea. Mar. Pollut. Bull. 2019, 138, 428–436. [Google Scholar] [CrossRef]
- Harrison, P.J.; Furuya, K.; Glibert, P.M.; Xu, J.; Liu, H.B.; Yin, K.; Lee, J.H.W.; Anderson, D.M.; Gowen, R.; Al-Azri, A.R. Geographical Distribution of Red and Green Noctiluca scintillans. Chin. J. Oceanol. Limnol. 2011, 29, 807–831. [Google Scholar] [CrossRef]
- Post, A.F.; Dedej, Z.; Gottlieb, R.; Li, H.; Thomas, D.N.; El-Absawi, M.; El-Naggar, A.; El-Gharabawi, M.; Sommer, U. Spatial and Temporal Distribution of Trichodesmium spp. in the Stratified Gulf of Aqaba, Red Sea. Mar. Ecol. Prog. Ser. 2002, 239, 241–250. [Google Scholar] [CrossRef] [Green Version]
- Tang, D.; Kawamura, H.; Luis, A.J. Short-Term Variability of Phytoplankton Blooms Associated with a Cold Eddy in the Northwestern Arabian Sea. Remote Sens. Environ. 2002, 81, 82–89. [Google Scholar] [CrossRef]
- Raitsos, D.E.; Pradhan, Y.; Brewin, R.J.W.; Stenchikov, G.; Hoteit, I. Remote Sensing the Phytoplankton Seasonal Succession of the Red Sea. PLoS ONE 2013, 8, e64909. [Google Scholar] [CrossRef] [Green Version]
- Li, W.; El-Askary, H.; Qurban, M.A.; Proestakis, E.; Garay, M.J.; Kalishnikova, O.V.; Amiridis, V.; Gkikas, A.; Marinou, E.; Piechota, T. An Assessment of Atmospheric and Meteorological Factors Regulating Red Sea Phytoplankton Growth. Remote Sens. 2018, 10, 673. [Google Scholar] [CrossRef] [Green Version]
- Kheireddine, M.; Ouhssain, M.; Claustre, H.; Uitz, J.; Gentili, B.; Jones, B.H. Assessing Pigment-Based Phytoplankton Community Distributions in the Red Sea. Front. Mar. Sci. 2017, 4, 132. [Google Scholar] [CrossRef] [Green Version]
- Mohamed, Z.A.; Mesaad, I. First Report on Noctiluca Scintillans Blooms in the Red Sea off the Coasts of Saudi Arabia: Consequences of Eutrophication. Oceanologia 2007, 49, 337–351. [Google Scholar]
- Li, W.; El-Askary, H.; ManiKandan, K.P.; Qurban, M.A.; Garay, M.J.; Kalashnikova, O.V. Synergistic Use of Remote Sensing and Modeling to Assess an Anomalously High Chlorophyll-a Event during Summer 2015 in the South Central Red Sea. Remote Sens. 2017, 9, 778. [Google Scholar] [CrossRef] [Green Version]
- Racault, M.-F.; Raitsos, D.E.; Berumen, M.L.; Brewin, R.J.W.; Platt, T.; Sathyendranath, S.; Hoteit, I. Phytoplankton Phenology Indices in Coral Reef Ecosystems: Application to Ocean-Color Observations in the Red Sea. Remote Sens. Environ. 2015, 160, 222–234. [Google Scholar] [CrossRef] [Green Version]
- Sarangi, R.K.; Chauhan, P.; Nayak, S.R. Inter-Annual Variability of Phytoplankton Blooms in the Northern Arabian Sea during Winter Monsoon Period (February–March) Using IRS-P4 OCM Data. Indian J. Geo-Mar. Sci. 2005, 34, 163–173. [Google Scholar]
- Banzon, V.F.; Evans, R.E.; Gordon, H.R.; Chomko, R.M. SeaWiFS Observations of the Arabian Sea Southwest Monsoon Bloom for the Year 2000. Deep. Sea Res. Part II Top. Stud. Oceanogr. 2004, 51, 189–208. [Google Scholar] [CrossRef]
- Ranjha, R.; Tjernström, M.; Semedo, A.; Svensson, G.; Cardoso, R.M. Structure and Variability of the Oman Coastal Low-Level Jet. Tellus A Dyn. Meteorol. Oceanogr. 2015, 67, 25285. [Google Scholar] [CrossRef]
- Stihl, A.; Sommer, U.; Post, A.F. Alkaline Phosphatase Activities among Populations of the Colony-forming Diazotrophic Cyanobacterium Trichodesmium spp. (Cyanobacteria) in the Red Sea. J. Phycol. 2001, 37, 310–317. [Google Scholar] [CrossRef]
- Dwivedi, R.M.; Raman, M.; Parab, S.; Matondkar, S.G.P.; Nayak, S. Influence of Northeasterly Trade Winds on Intensity of Winter Bloom in the Northern Arabian Sea. Curr. Sci. 2006, 90, 1397–1406. [Google Scholar]
- Brock, J.C.; Sathyendranath, S.; Platt, T. Biohydro-Optical Classification of the Northwestern Indian Ocean. Mar. Ecol. Prog. Ser. 1998, 165, 1–15. [Google Scholar] [CrossRef] [Green Version]
- Karim, A.; Veizer, J. Water Balance of the Indus River Basin and Moisture Source in the Karakoram and Western Himalayas: Implications from Hydrogen and Oxygen Isotopes. J. Geophys. Res. Atmos. 2002, 107, ACH 9-1–ACH 9-12. [Google Scholar] [CrossRef]
- Shrestha, S.; Nepal, S. Water Balance Assessment under Different Glacier Coverage Scenarios in the Hunza Basin. Water 2019, 11, 1124. [Google Scholar] [CrossRef] [Green Version]
- Hassan, D.; Bano, R.; Ansari, K.; Shaikh, M.N. Hydrology of Upper Indus Basin. In Proceedings of the 4th International Conference on Energy, Environment and Sustainable Development 2016, Jamshoro, Pakistan, 1–3 November 2016. [Google Scholar]
- Al-Shehhi, M.R.; Nelson, D.; Farzanah, R.; Alshihi, R.; Salehi-Ashtiani, K. Characterizing Algal Blooms in a Shallow & a Deep Channel. Ocean Coast. Manag. 2021, 213, 105840. [Google Scholar]
- Nassar, M.Z. Nutrients and Phytoplankton Distribution in the Coastal Waters of Aqaba Gulf, Red Sea, Egypt. Egypt. J. Aquat. Res. 2007, 33, 133–151. [Google Scholar]
- Prakash, S.; Ramesh, R.; Sheshshayee, M.S.; Dwivedi, R.M.; Raman, M. Quantification of New Production during a Winter Noctiluca scintillans Bloom in the Arabian Sea. Geophys. Res. Lett. 2008, 35, L08604. [Google Scholar] [CrossRef]
- Basu, S.; Deobagkar, D.D.; Matondkar, S.G.P.; Furtado, I. Culturable Bacterial Flora Associated with the Dinoflagellate Green Noctiluca Miliaris during Active and Declining Bloom Phases in the Northern Arabian Sea. Microb. Ecol. 2013, 65, 934–954. [Google Scholar] [CrossRef] [Green Version]
- Dwivedi, R.; Rafeeq, M.; Smitha, B.R.; Padmakumar, K.B.; Thomas, L.C.; Sanjeevan, V.N.; Prakash, P.; Raman, M. Species Identification of Mixed Algal Bloom in the Northern Arabian Sea Using Remote Sensing Techniques. Environ. Monit. Assess. 2015, 187, 51. [Google Scholar] [CrossRef]
- Al-Hashmi, K.; Sarma, Y.V.B.; Claereboudt, M.; Al-Azri, A.R.; Piontkovski, S.A.; Al-Habsi, H. Phytoplankton Community Structure in the Bay of Bandar Khyran, Sea of Oman with Special Reference to Harmful Algae. Int. J. Mar. Sci. 2012, 2, 31–42. [Google Scholar]
- Baliarsingh, S.K.; Lotliker, A.A.; Sudheesh, V.; Samanta, A.; Das, S.; Vijayan, A.K. Response of Phytoplankton Community and Size Classes to Green Noctiluca Bloom in the Northern Arabian Sea. Mar. Pollut. Bull. 2018, 129, 222–230. [Google Scholar] [CrossRef]
- Sarangi, R.K. Observation of Algal Bloom in the Northwest Arabian Sea Using Multisensor Remote Sensing Satellite Data. Mar. Geod. 2012, 35, 158–174. [Google Scholar] [CrossRef]
- Basu, S.; Matondkar, S.G.P.; Furtado, I. Enumeration of Bacteria from a Trichodesmium spp. Bloom of the Eastern Arabian Sea: Elucidation of Their Possible Role in Biogeochemistry. J. Appl. Phycol. 2011, 23, 309–319. [Google Scholar] [CrossRef]
- Jyothibabu, R.; Karnan, C.; Jagadeesan, L.; Arunpandi, N.; Pandiarajan, R.S.; Muraleedharan, K.R.; Balachandran, K.K. Trichodesmium Blooms and Warm-Core Ocean Surface Features in the Arabian Sea and the Bay of Bengal. Mar. Pollut. Bull. 2017, 121, 201–215. [Google Scholar] [CrossRef]
- Desa, E.S.; Suresh, T.; Matondkar, S.G.P.; Desa, E.; Goes, J.; Mascarenhas, A.; Parab, S.G.; Shaikh, N.; Fernandes, C.E.G. Detection of Trichodesmium Bloom Patches along the Eastern Arabian Sea by IRS-P4/OCM Ocean Color Sensor and by in-Situ Measurements. Indian J. Geo-Mar. Sci. 2005, 34, 374–386. [Google Scholar]
- Krishnan, A.A.; Krishnakumar, P.K.; Rajagopalan, M. Trichodesmium erythraeum (Ehrenberg) Bloom along the Southwest Coast of India (Arabian Sea) and Its Impact on Trace Metal Concentrations in Seawater. Estuar. Coast. Shelf Sci. 2007, 71, 641–646. [Google Scholar] [CrossRef] [Green Version]
- Raghavan, B.R.; Deepthi, T.; Ashwini, S.; Shylini, S.K.; Kumarswami, M.; Kumar, S.; Lotliker, A.A. Spring Inter Monsoon Algal Blooms in the Eastern Arabian Sea: Shallow Marine Encounter off Karwar and Kumbla Coast Using a Hyperspectral Radiometer. Int. J. Earth Sci. Eng. 2010, 3, 827–832. [Google Scholar]
- Padmakumar, K.B.; Smitha, B.R.; Thomas, L.C.; Fanimol, C.L.; SreeRenjima, G.; Menon, N.R.; Sanjeevan, V.N. Blooms of Trichodesmium erythraeum in the South Eastern Arabian Sea during the Onset of 2009 Summer Monsoon. Ocean Sci. J. 2010, 45, 151–157. [Google Scholar] [CrossRef]
- Touliabah, H.E.; El-Kheir, W.S.A.; Kuchari, M.G.; Abdulwassi, N.I.H. Phytoplankton Composition at Jeddah Coast-Red Sea, Saudi Arabia in Relation to Some Ecological Factors. JKAU Sci. 2010, 22, 115–131. [Google Scholar] [CrossRef] [Green Version]
- Gandhi, N.; Singh, A.; Prakash, S.; Ramesh, R.; Raman, M.; Sheshshayee, M.S.; Shetye, S. First Direct Measurements of N2 Fixation during a Trichodesmium Bloom in the Eastern Arabian Sea. Glob. Biogeochem. Cycles 2011, 25, GB4014. [Google Scholar] [CrossRef]
- Raghavan, B.R.; Raman, M.; Chauhan, P.; Kumar, B.S.; Shylini, S.K.; Mahendra, R.S.; Nayak, S.R. Summer Chlorophyll-a Distribution in Eastern Arabian Sea off Karnataka-Goa Coast from Satellite and in-Situ Observations. In Proceedings of the Remote Sensing of the Marine Environment; International Society for Optics and Photonics, Goa, India, 15–17 November 2006; Volume 6406, p. 64060W. [Google Scholar]
- Roy, R.; Pratihary, A.; Narvenkar, G.; Mochemadkar, S.; Gauns, M.; Naqvi, S.W.A. The Relationship between Volatile Halocarbons and Phytoplankton Pigments during a Trichodesmium Bloom in the Coastal Eastern Arabian Sea. Estuar. Coast. Shelf Sci. 2011, 95, 110–118. [Google Scholar] [CrossRef]
- Häse, C.; Al-Qutob, M.; Dubinsky, Z.; Ibrahim, E.A.; Lazar, B.; Stambler, N.; Tilzer, M.M. A System in Balance?? Implications of Deep Vertical Mixing for the Nitrogen Budget in the Northern Red Sea, Including the Gulf of Aqaba (Eilat). Biogeosci. Discuss. 2006, 3, 383–408. [Google Scholar]
- Tang, W.; Cerdán-García, E.; Berthelot, H.; Polyviou, D.; Wang, S.; Baylay, A.; Whitby, H.; Planquette, H.; Mowlem, M.; Robidart, J. New Insights into the Distributions of Nitrogen Fixation and Diazotrophs Revealed by High-Resolution Sensing and Sampling Methods. ISME J. 2020, 14, 2514–2526. [Google Scholar] [CrossRef]
- Munir, S.; Naz, T.; Burhan, Z.; Siddiqui, P.J.A.; Morton, S.L. First Report of the Athecate, Chain Forming Dinoflagellate Cochlodinium fulvescens (Gymnodiniales) from Pakistan. Pak. J. Bot. 2012, 44, 2129–2134. [Google Scholar]
- Bauman, A.G.; Burt, J.A.; Feary, D.A.; Marquis, E.; Usseglio, P. Tropical Harmful Algal Blooms: An Emerging Threat to Coral Reef Communities? Mar. Pollut. Bull. 2010, 60, 2117–2122. [Google Scholar] [CrossRef]
Figure 1.
Bathymetric map of the northern Indian Ocean including the Arabian Sea, Sea of Oman, Arabian Gulf, and Red Sea. The Arabian Sea is the deepest with water depth >4 km, indicated by the dark blue, and the Arabian Gulf is the shallowest with water depth <100 m, indicated by the light green color. The circles show the hotspots of the algal blooms in the NIO. The red circle represents the algal blooms that commonly occur during the SWM, and the blue circle represents the algal blooms that happen during the NEM. The numbered circles indicate the regions of ten algal bloom hotspots (from 1 to 10).

Figure 2.
The major dominant physical oceanic features: upwelling, mixing, and advection that occur in the north Indian Ocean during NEMs and SWMs. Strong upwelling is indicated by the darker green color, while the weak upwelling is indicated by the light green colors. Mixing is represented by the blue wavy lines; the dark blue lines represent strong mixing, and the light blue lines represent weak mixing. Advection is shown by the black arrows, which illustrate the direction of the horizontal flow. The high sunlight radiation coverage is also represented during NEMs and SWMs. Monsoonal winds are shown with the blue arrows: northeasterly during SWMs and southwesterly during NEMs.

Figure 3.
Monthly spatial distribution of algal blooms in the NIO during the whole period (1980–2010). The colors of the heat map circles represent the relative frequency of algal blooms in each location. The darker color represents the higher number of algal bloom events in the region over the three decades, and the lighter color represents less blooming events over the same period.

Figure 4.
Maximum surface Chl-a concentrations in the NIO during SWM and NEM, retrieved from the satellite data for the years 2002–2020. The red color indicates the highest Chl-a, and the blue color shows the lowest Chl-a concentrations. White arrows indicate the directions of the horizontal movements of algae during SWMs and NEMs.

Figure 5.
Seasonal spatial distribution of the two most common algal species: (a) Noctiluca and (b) Trichodesmium, causing blooms in the NIO. These are in situ data collected during the algal bloom events in the region during four different periods. The blue circles represent the appearance of species during the months of December–February, orange during March–May, red during June–August, and green during September–November.

Figure 6.
Enhanced color image (ERGB), Chl-a, AOT, and PAR derived from satellite images captured during Noctiluca bloom events in the Arabian Gulf, Arabian Sea, and Sea of Oman during: (a) 1 August 2016, (b) 25 January 2004, and (c) 7 March 2013. The first column in the figure shows the ERGB images of three different regions where algal blooms occurred, retrieved from Aqua and VIIRS. These images indicate the presence of the blooms. The second column shows the Chl-a concentrations. Red color indicates high concentrations of Chl-a. The third column shows AOT maps during the aforementioned bloom events in which darker brown color indicates high level of dust aerosols (AOT). The last column represents the PAR maps that can indicate the PAR level during the algal bloom events, in which high PAR is indicated by the red color.

Figure 7.
Common algal bloom species in the north Indian Ocean imaged using an electronic microscope: (a,g,o) Thalassiosira, (b,h) Pleurosigma, (c,f) Thalassionema, (d,l,s) Chaetoceros, (e) Bacteriastrum, (i,r) Triceratium, (j) Aulacoseira, (k) Ceratium, (m) Odontella, (n) Dinophysis, (p) Geissleria, (q) Surirella, (t,w,x) Protoperidinium, (u) Diploneis, and (v) Pyrodinium. The bar shows the scale of the image in µm.

Figure 8.
Enhanced color image (ERGB), Chl-a, AOT, and PAR derived from satellite images during Trichodesmium bloom events in the Arabian Sea, Sea of Oman, and the Red Sea during: (a) 11 February 1998, (b) 1 March 2008, and (c) 17 September 2004. The first column in the figure shows the ERGB images of three different regions where algal blooms occurred, retrieved from SeaWiFS, Terra, and Aqua, respectively. These images indicate the presence of the blooms. The second column shows the Chl-a concentrations. Red color indicates high concentrations of Chl-a. The third column shows AOT maps during the aforementioned bloom events in which darker brown color indicates high level of dust aerosols (AOT). The last column represents the PAR maps that can indicate the PAR level during the algal bloom events, in which high PAR is shown by the red color.


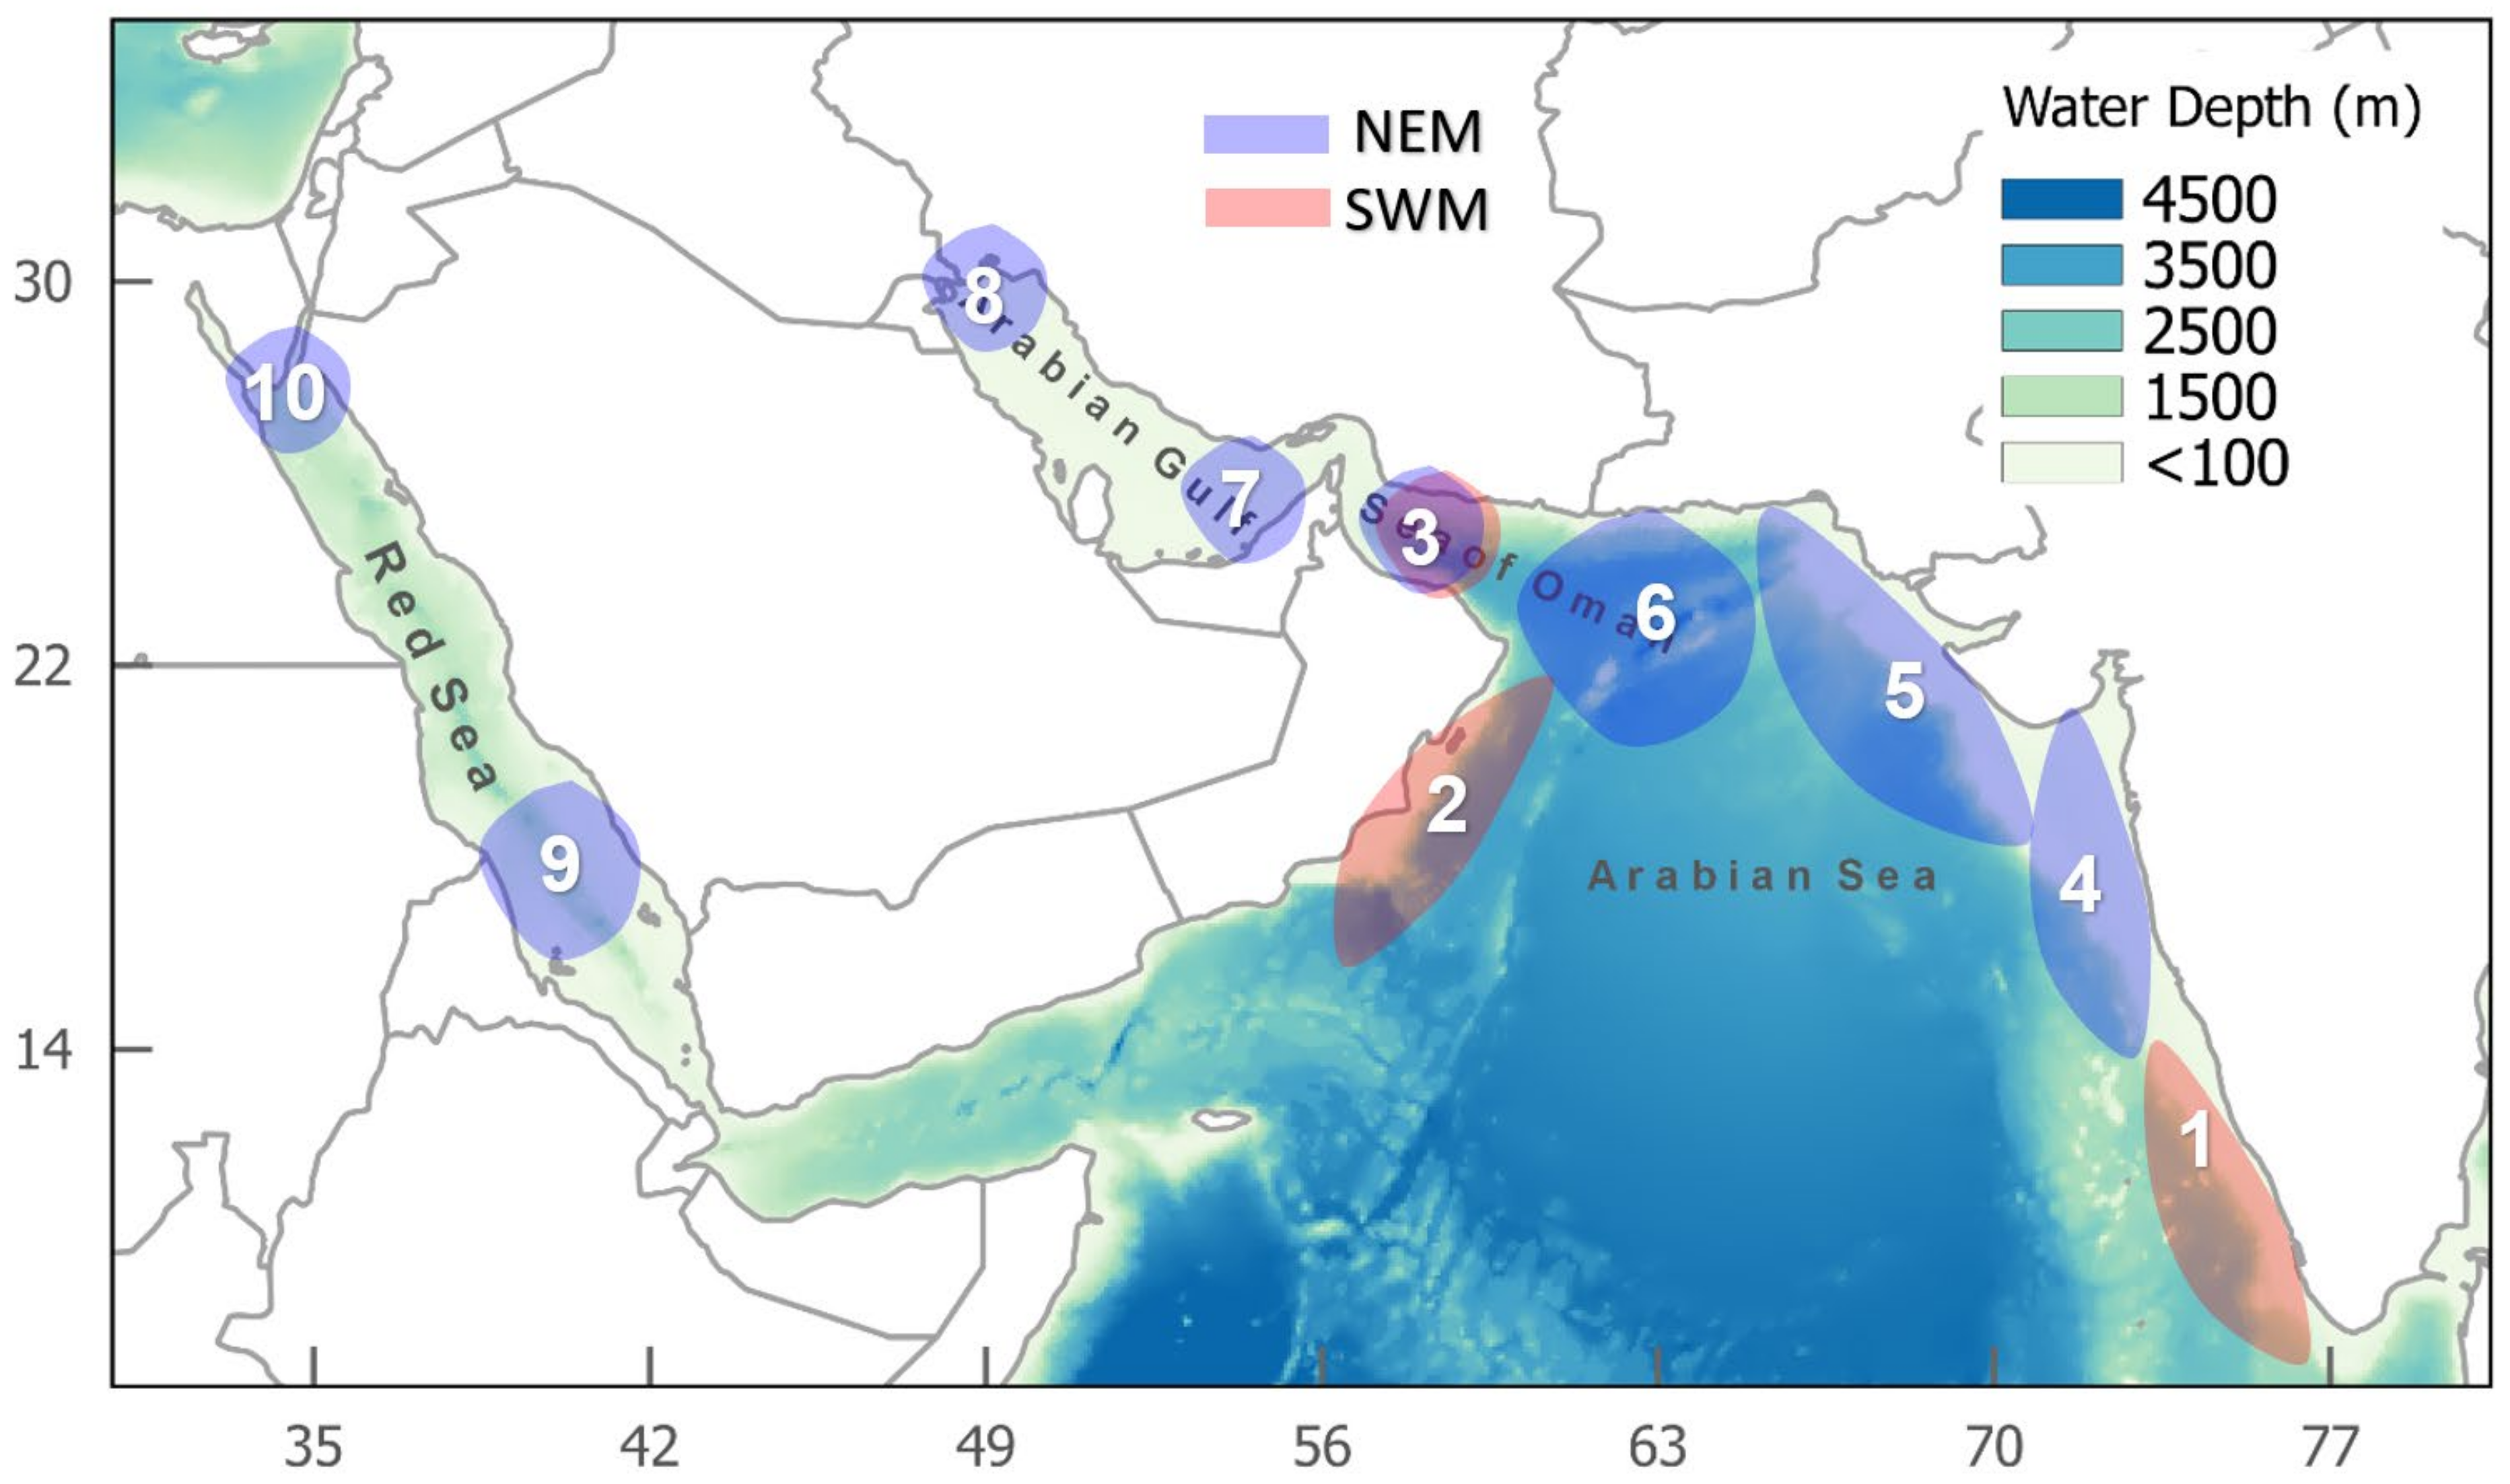
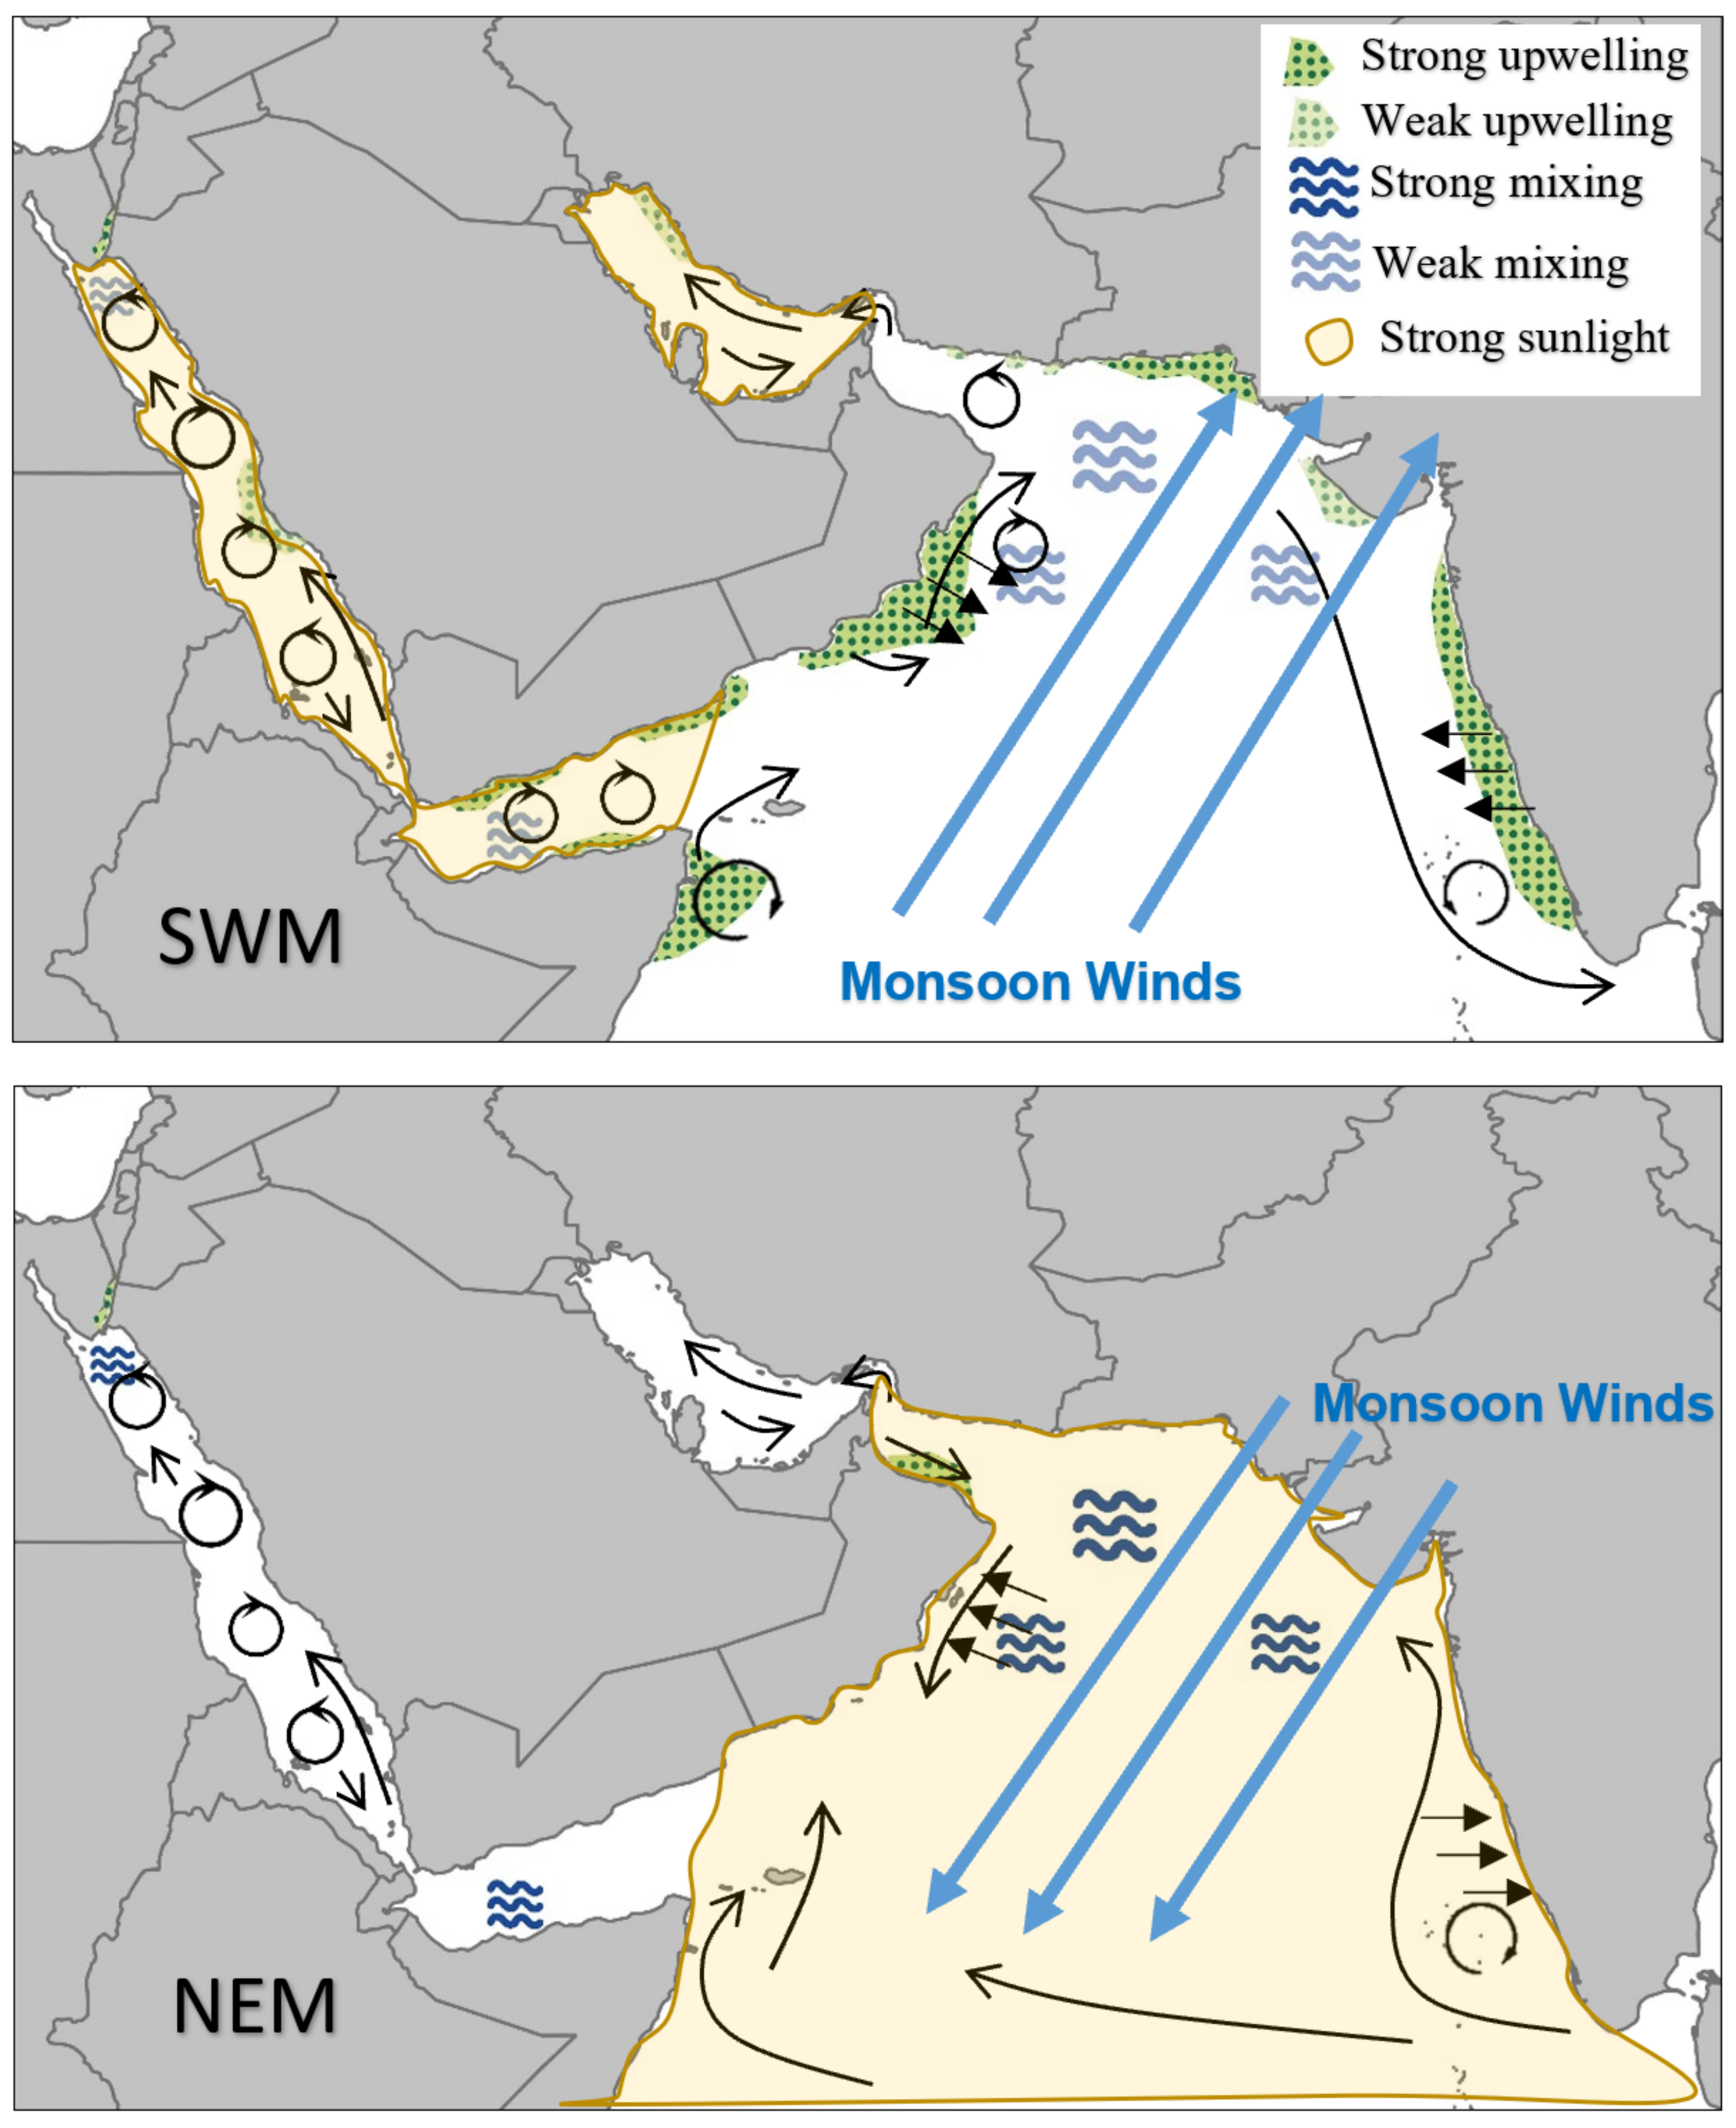
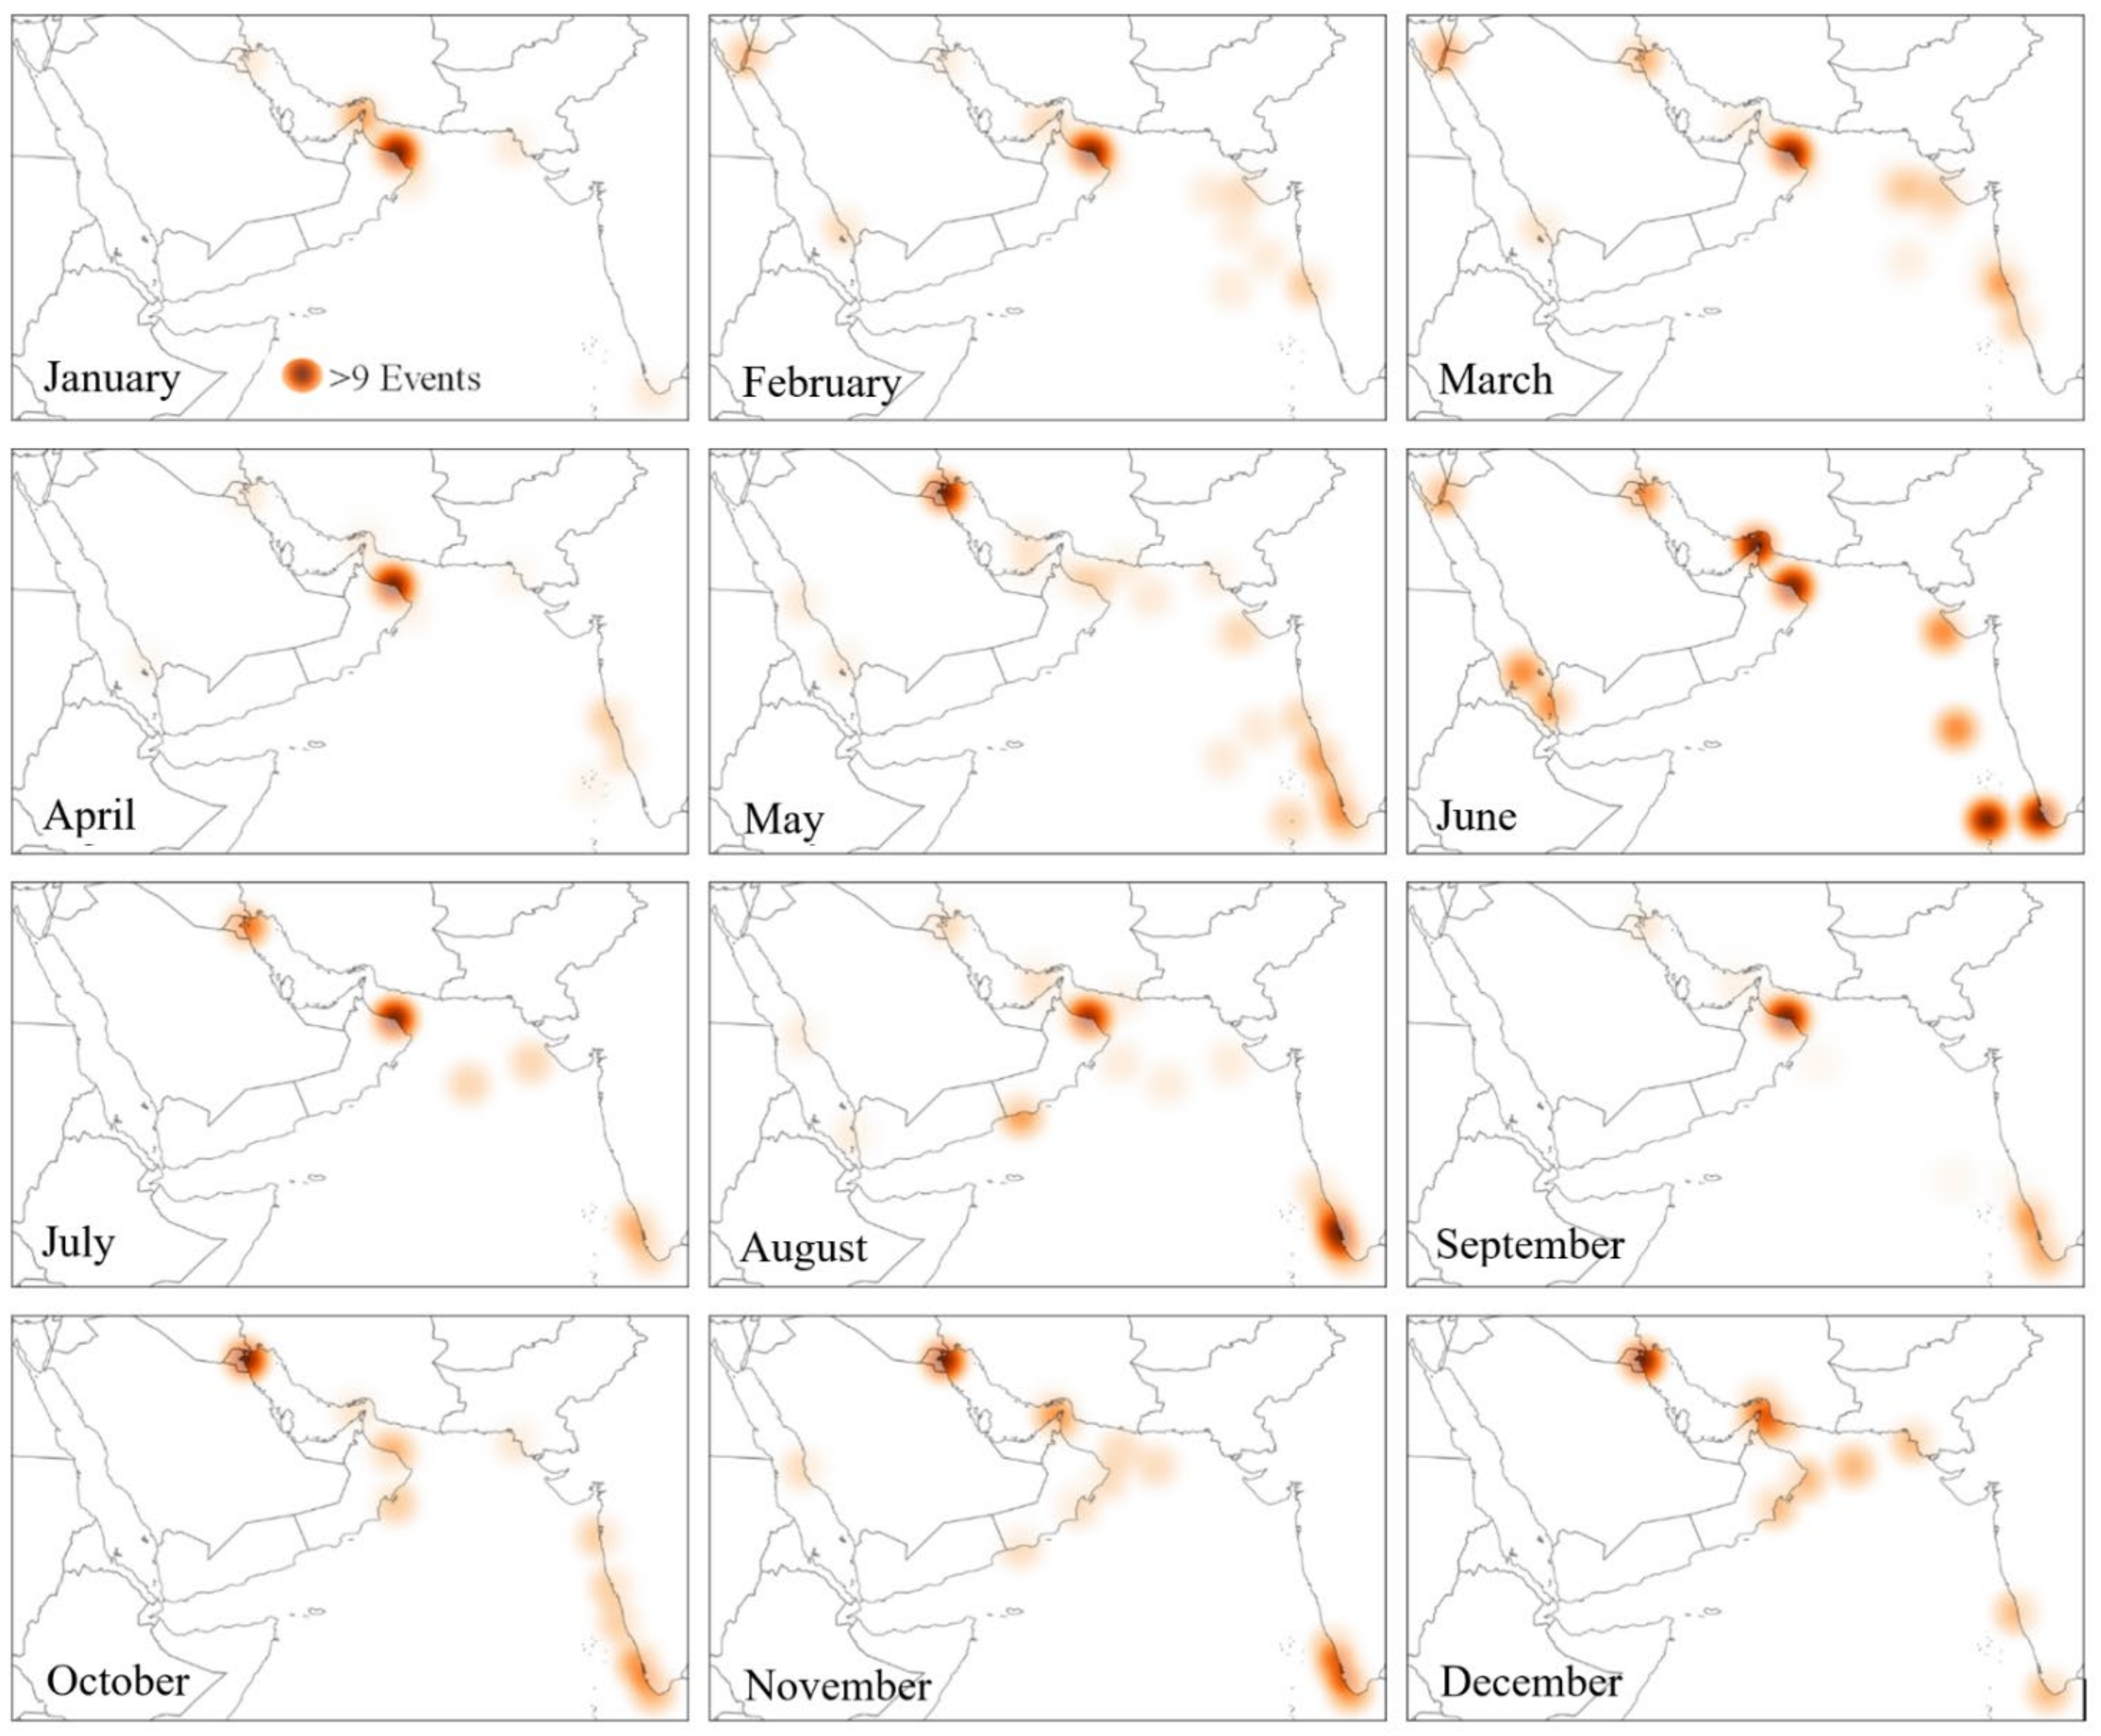
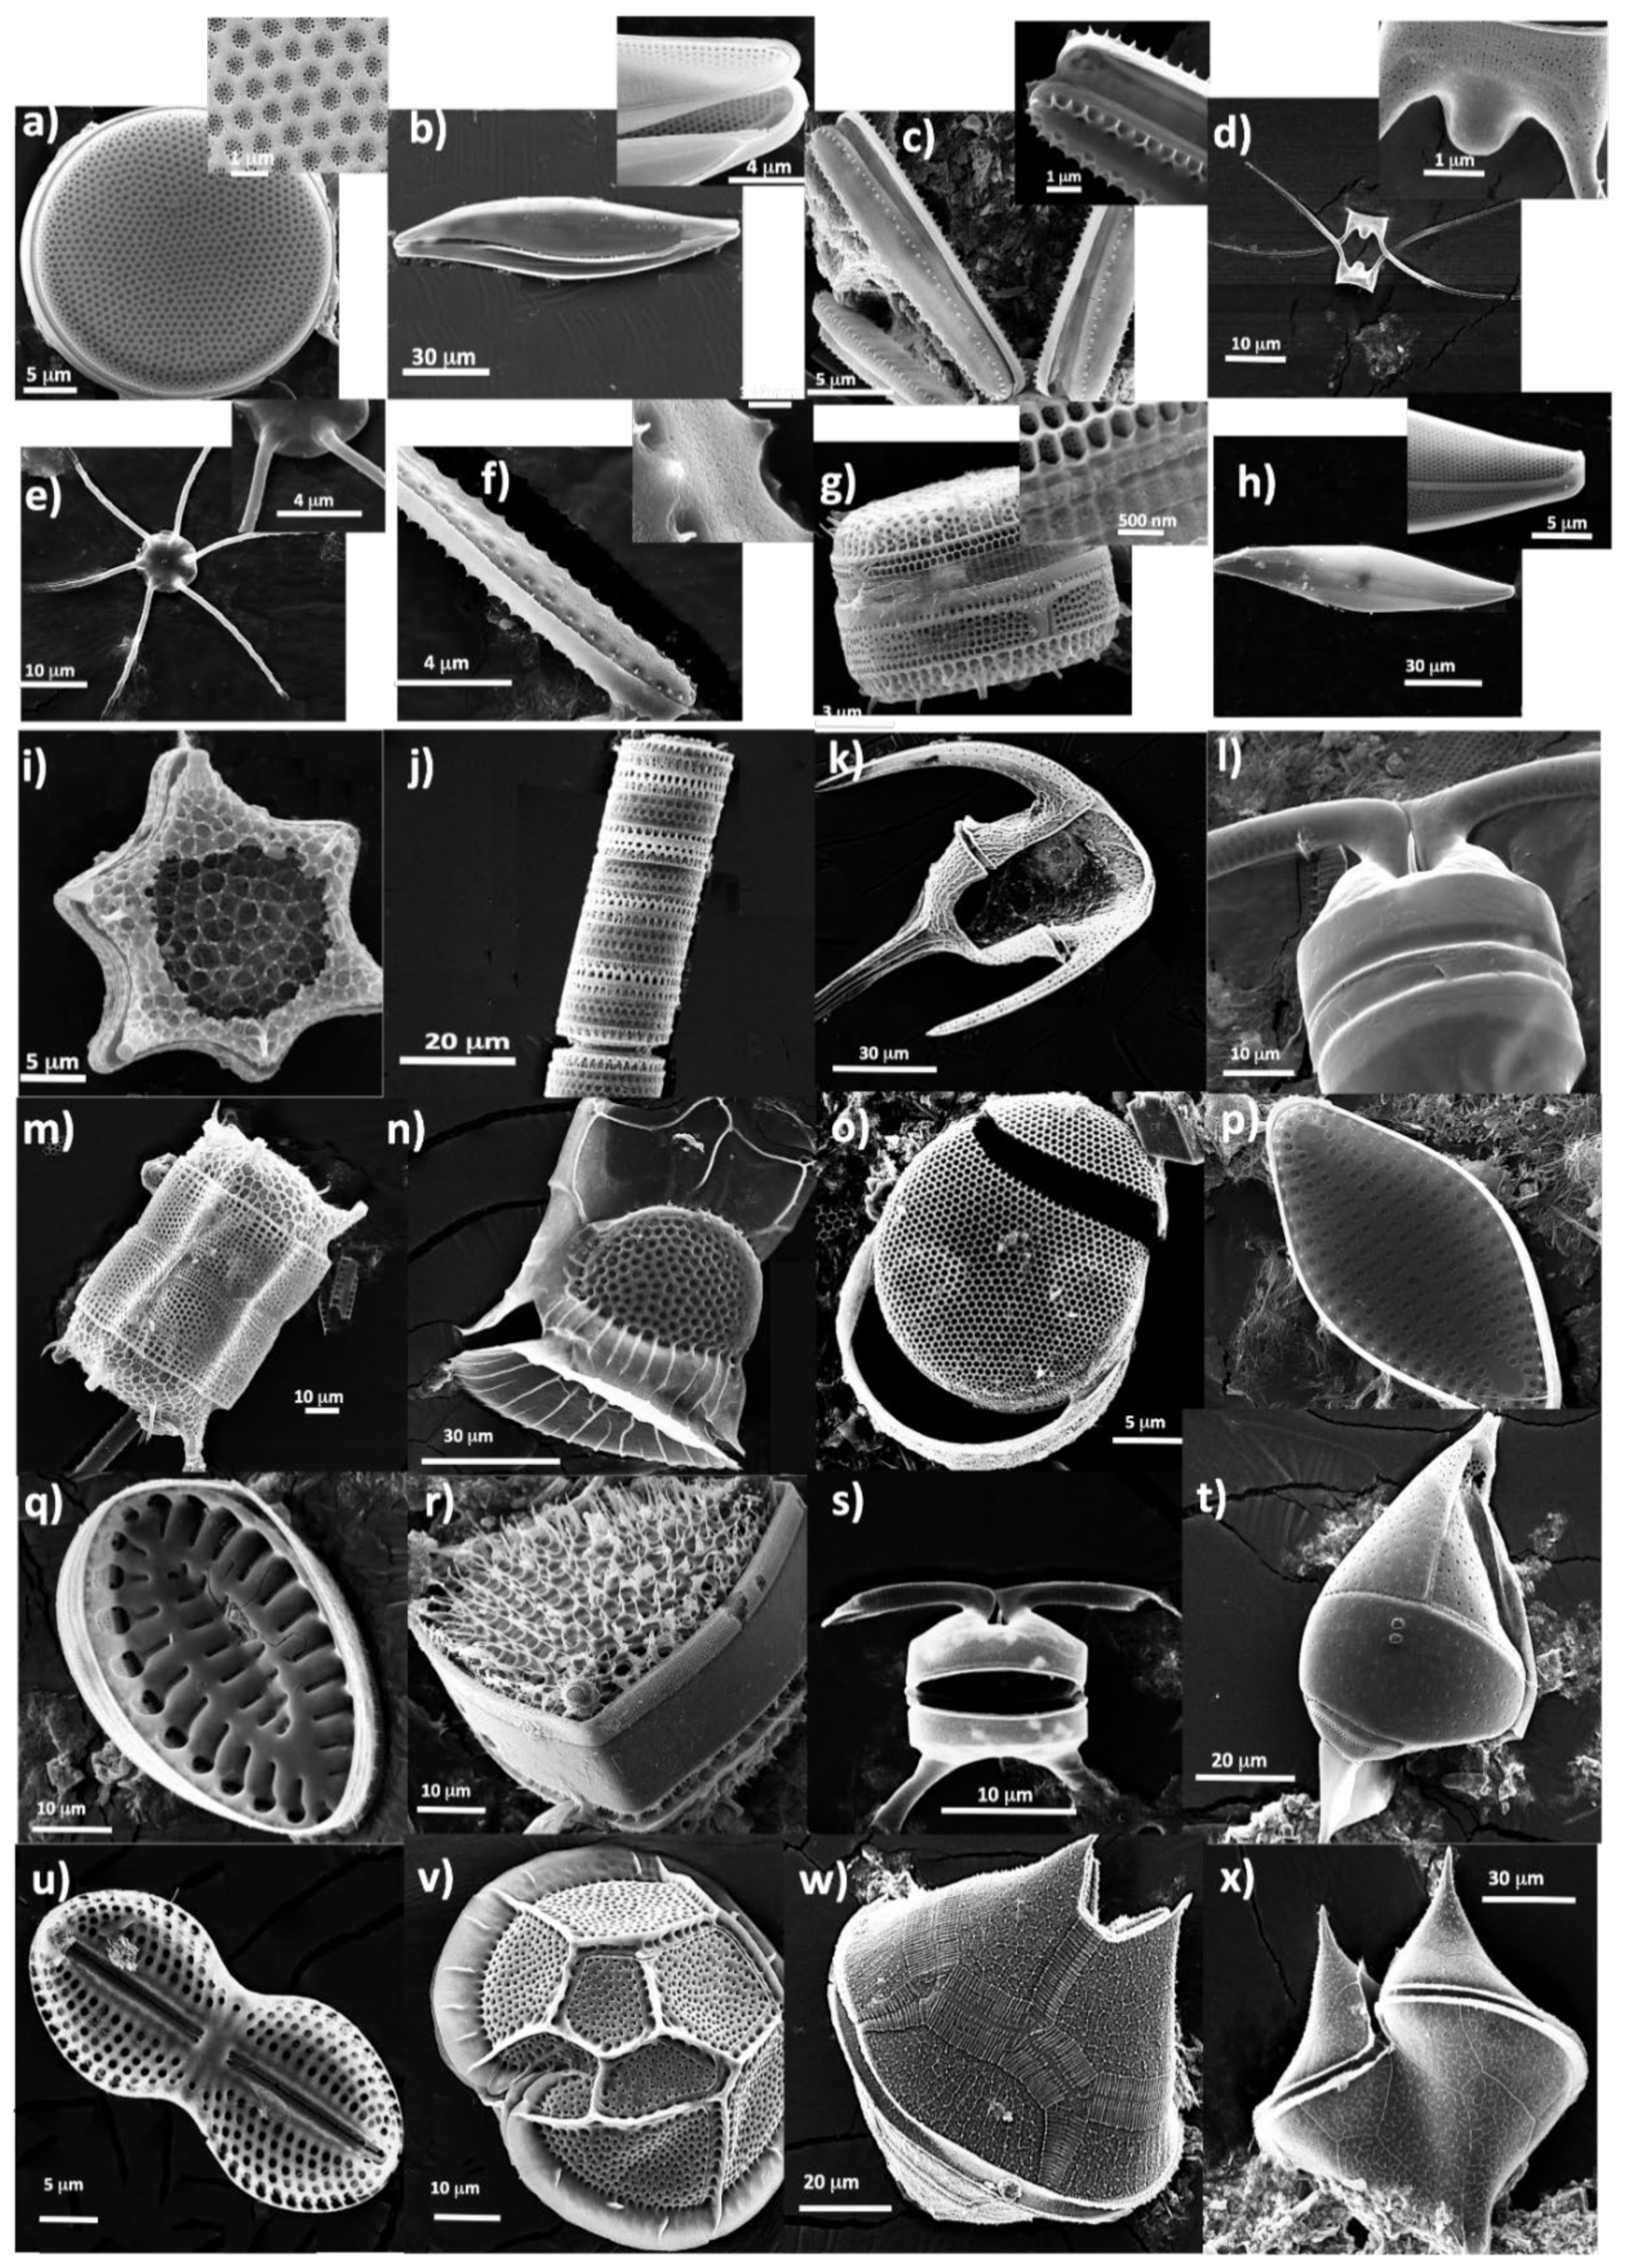
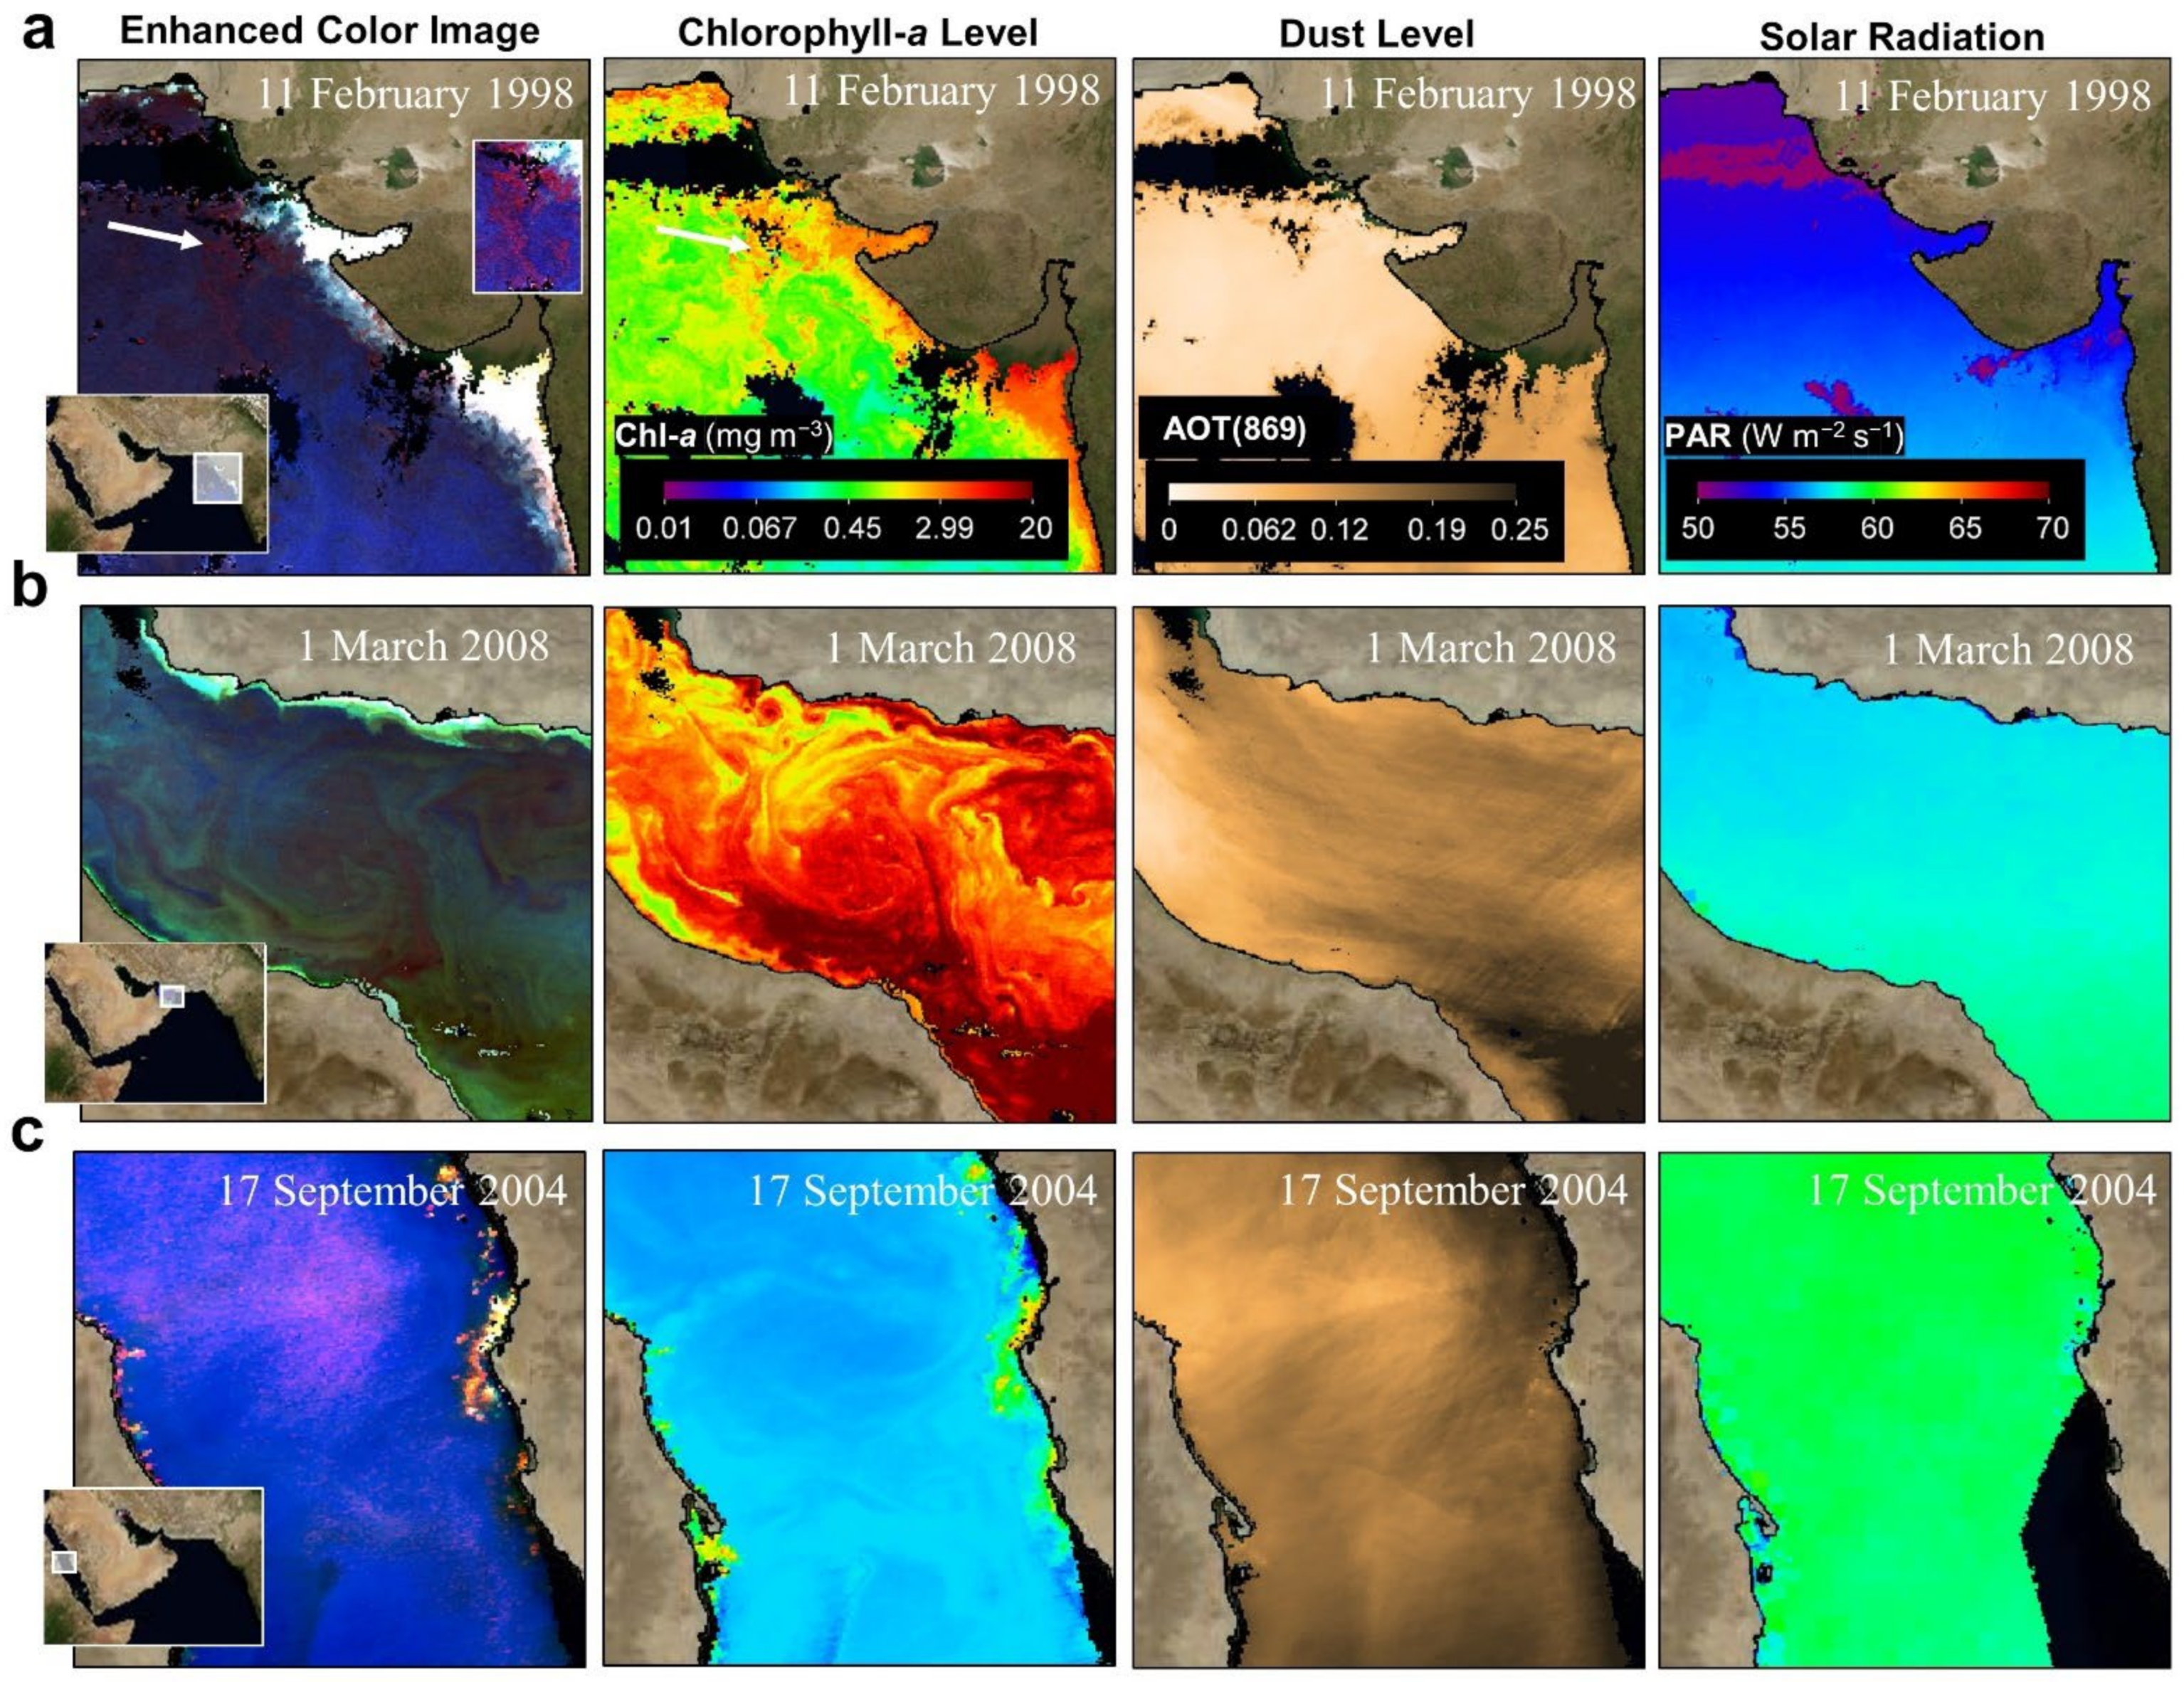
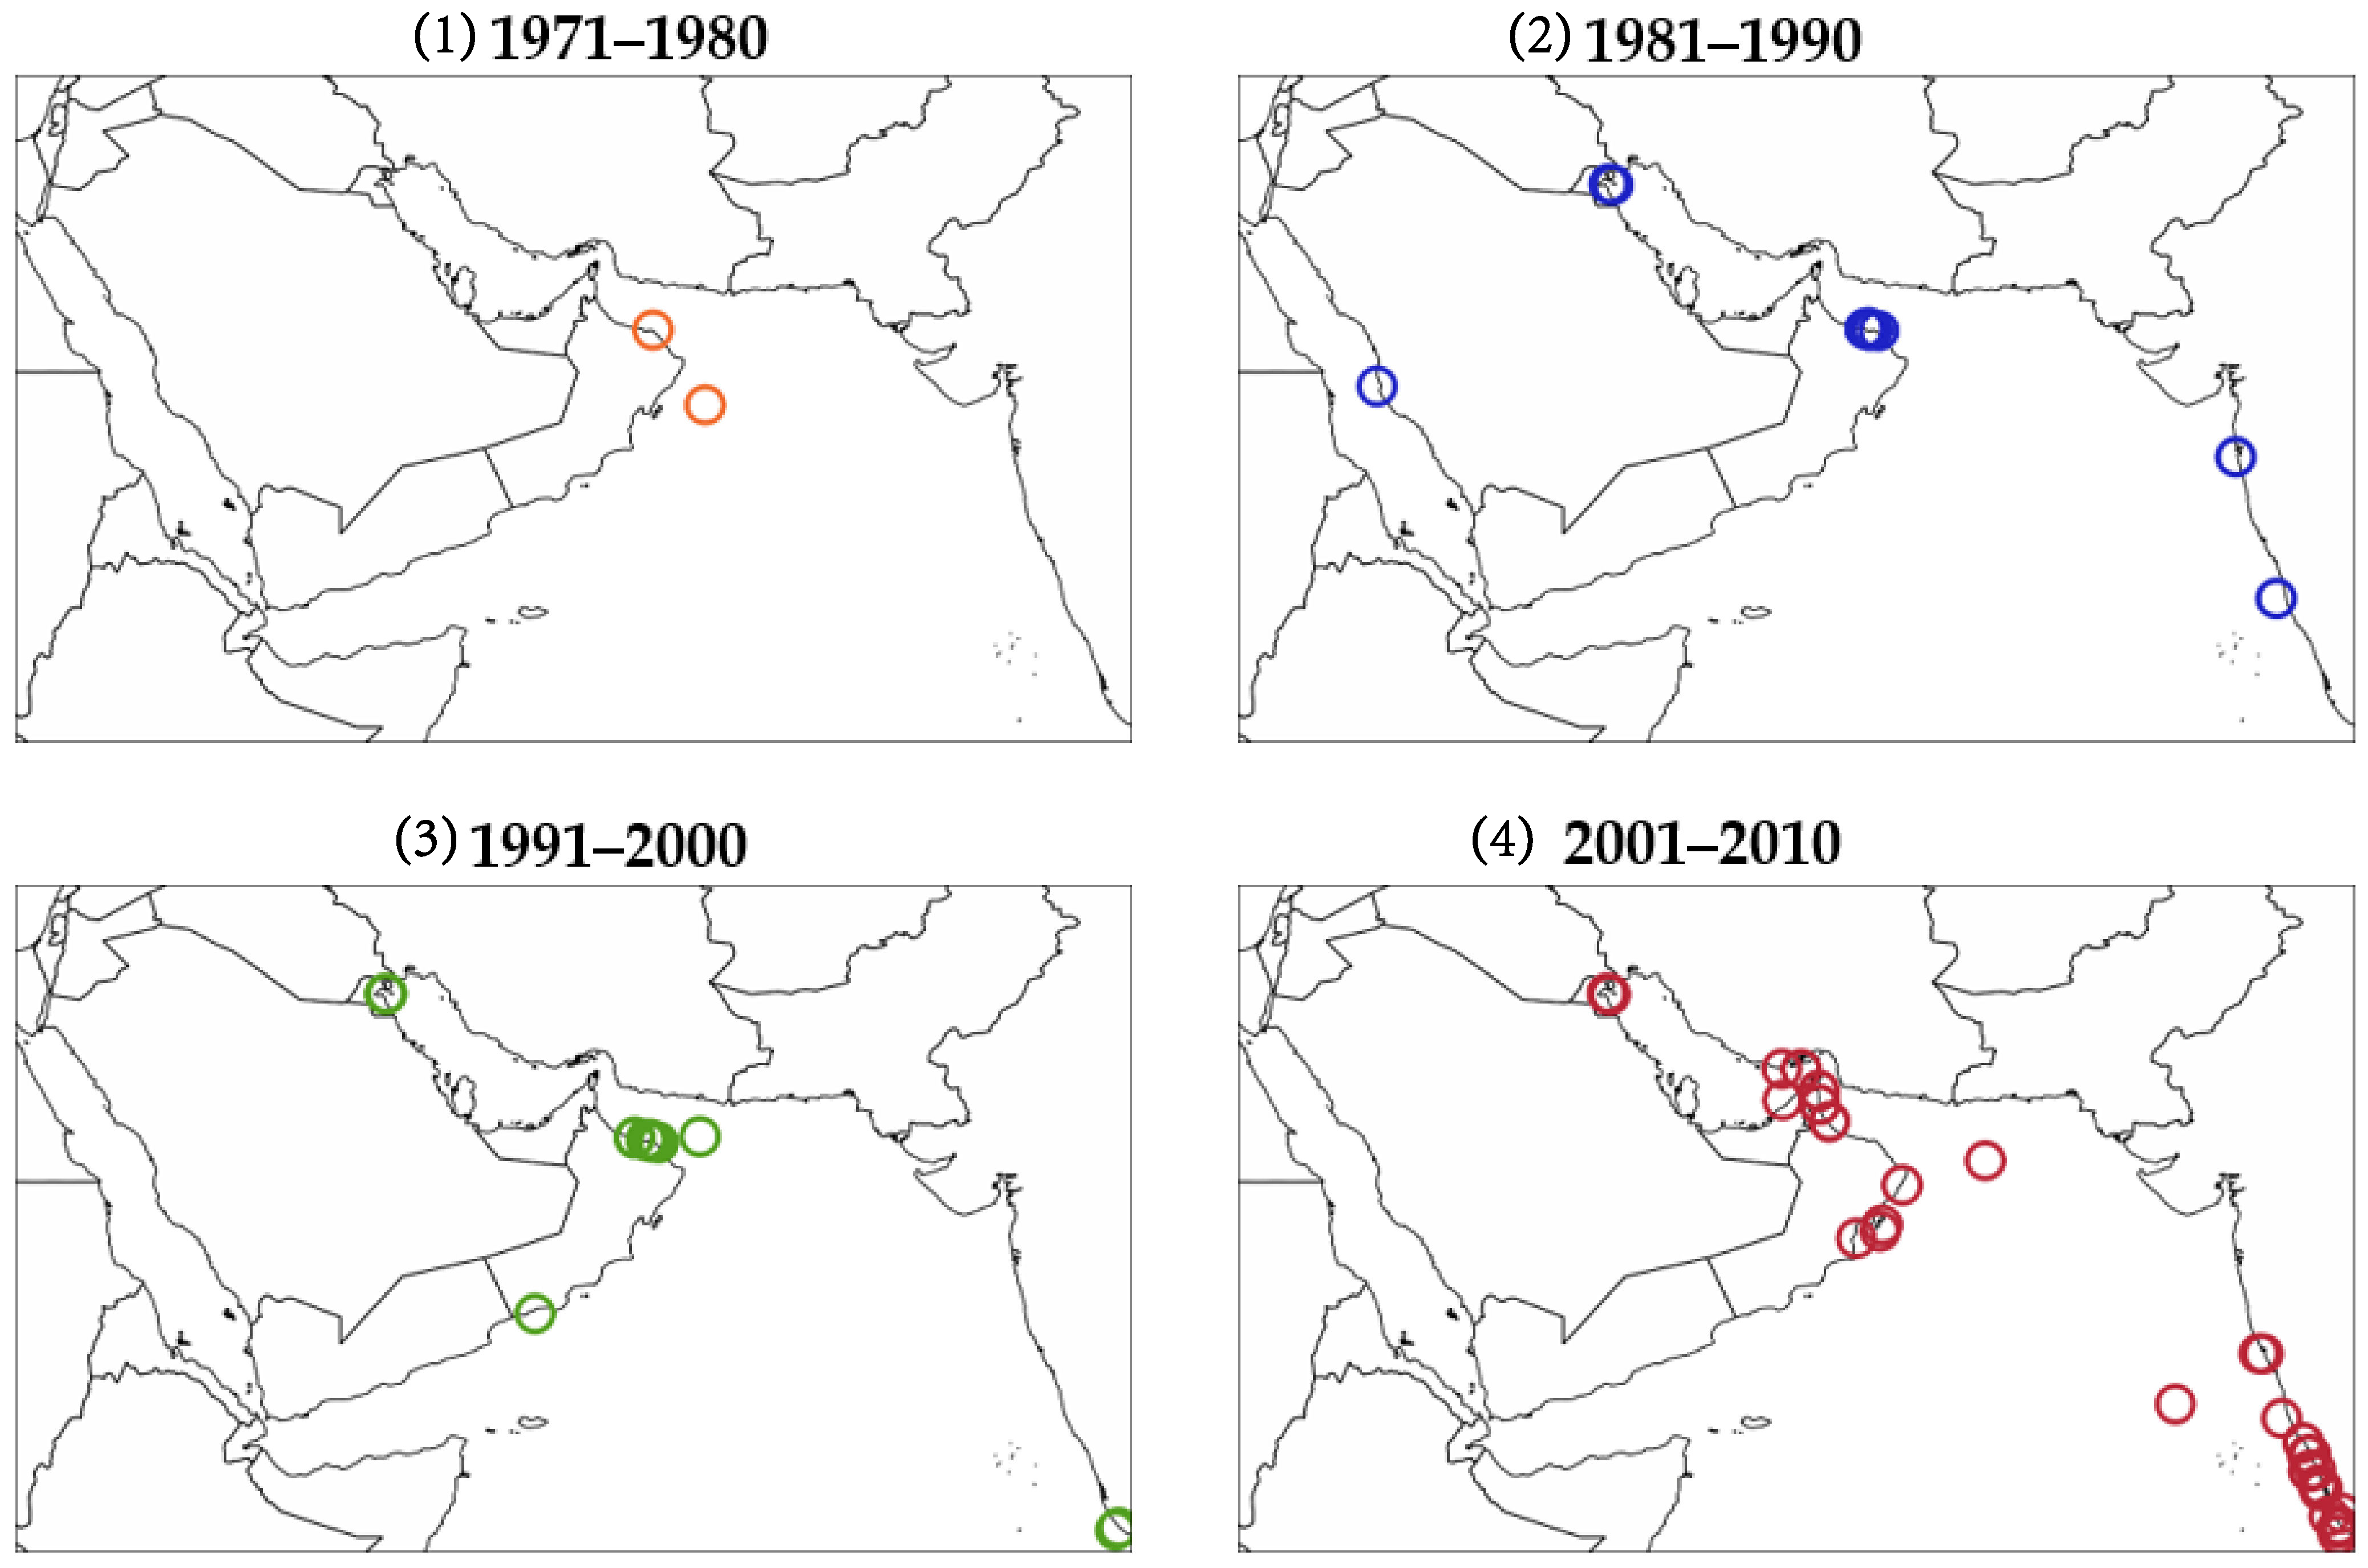
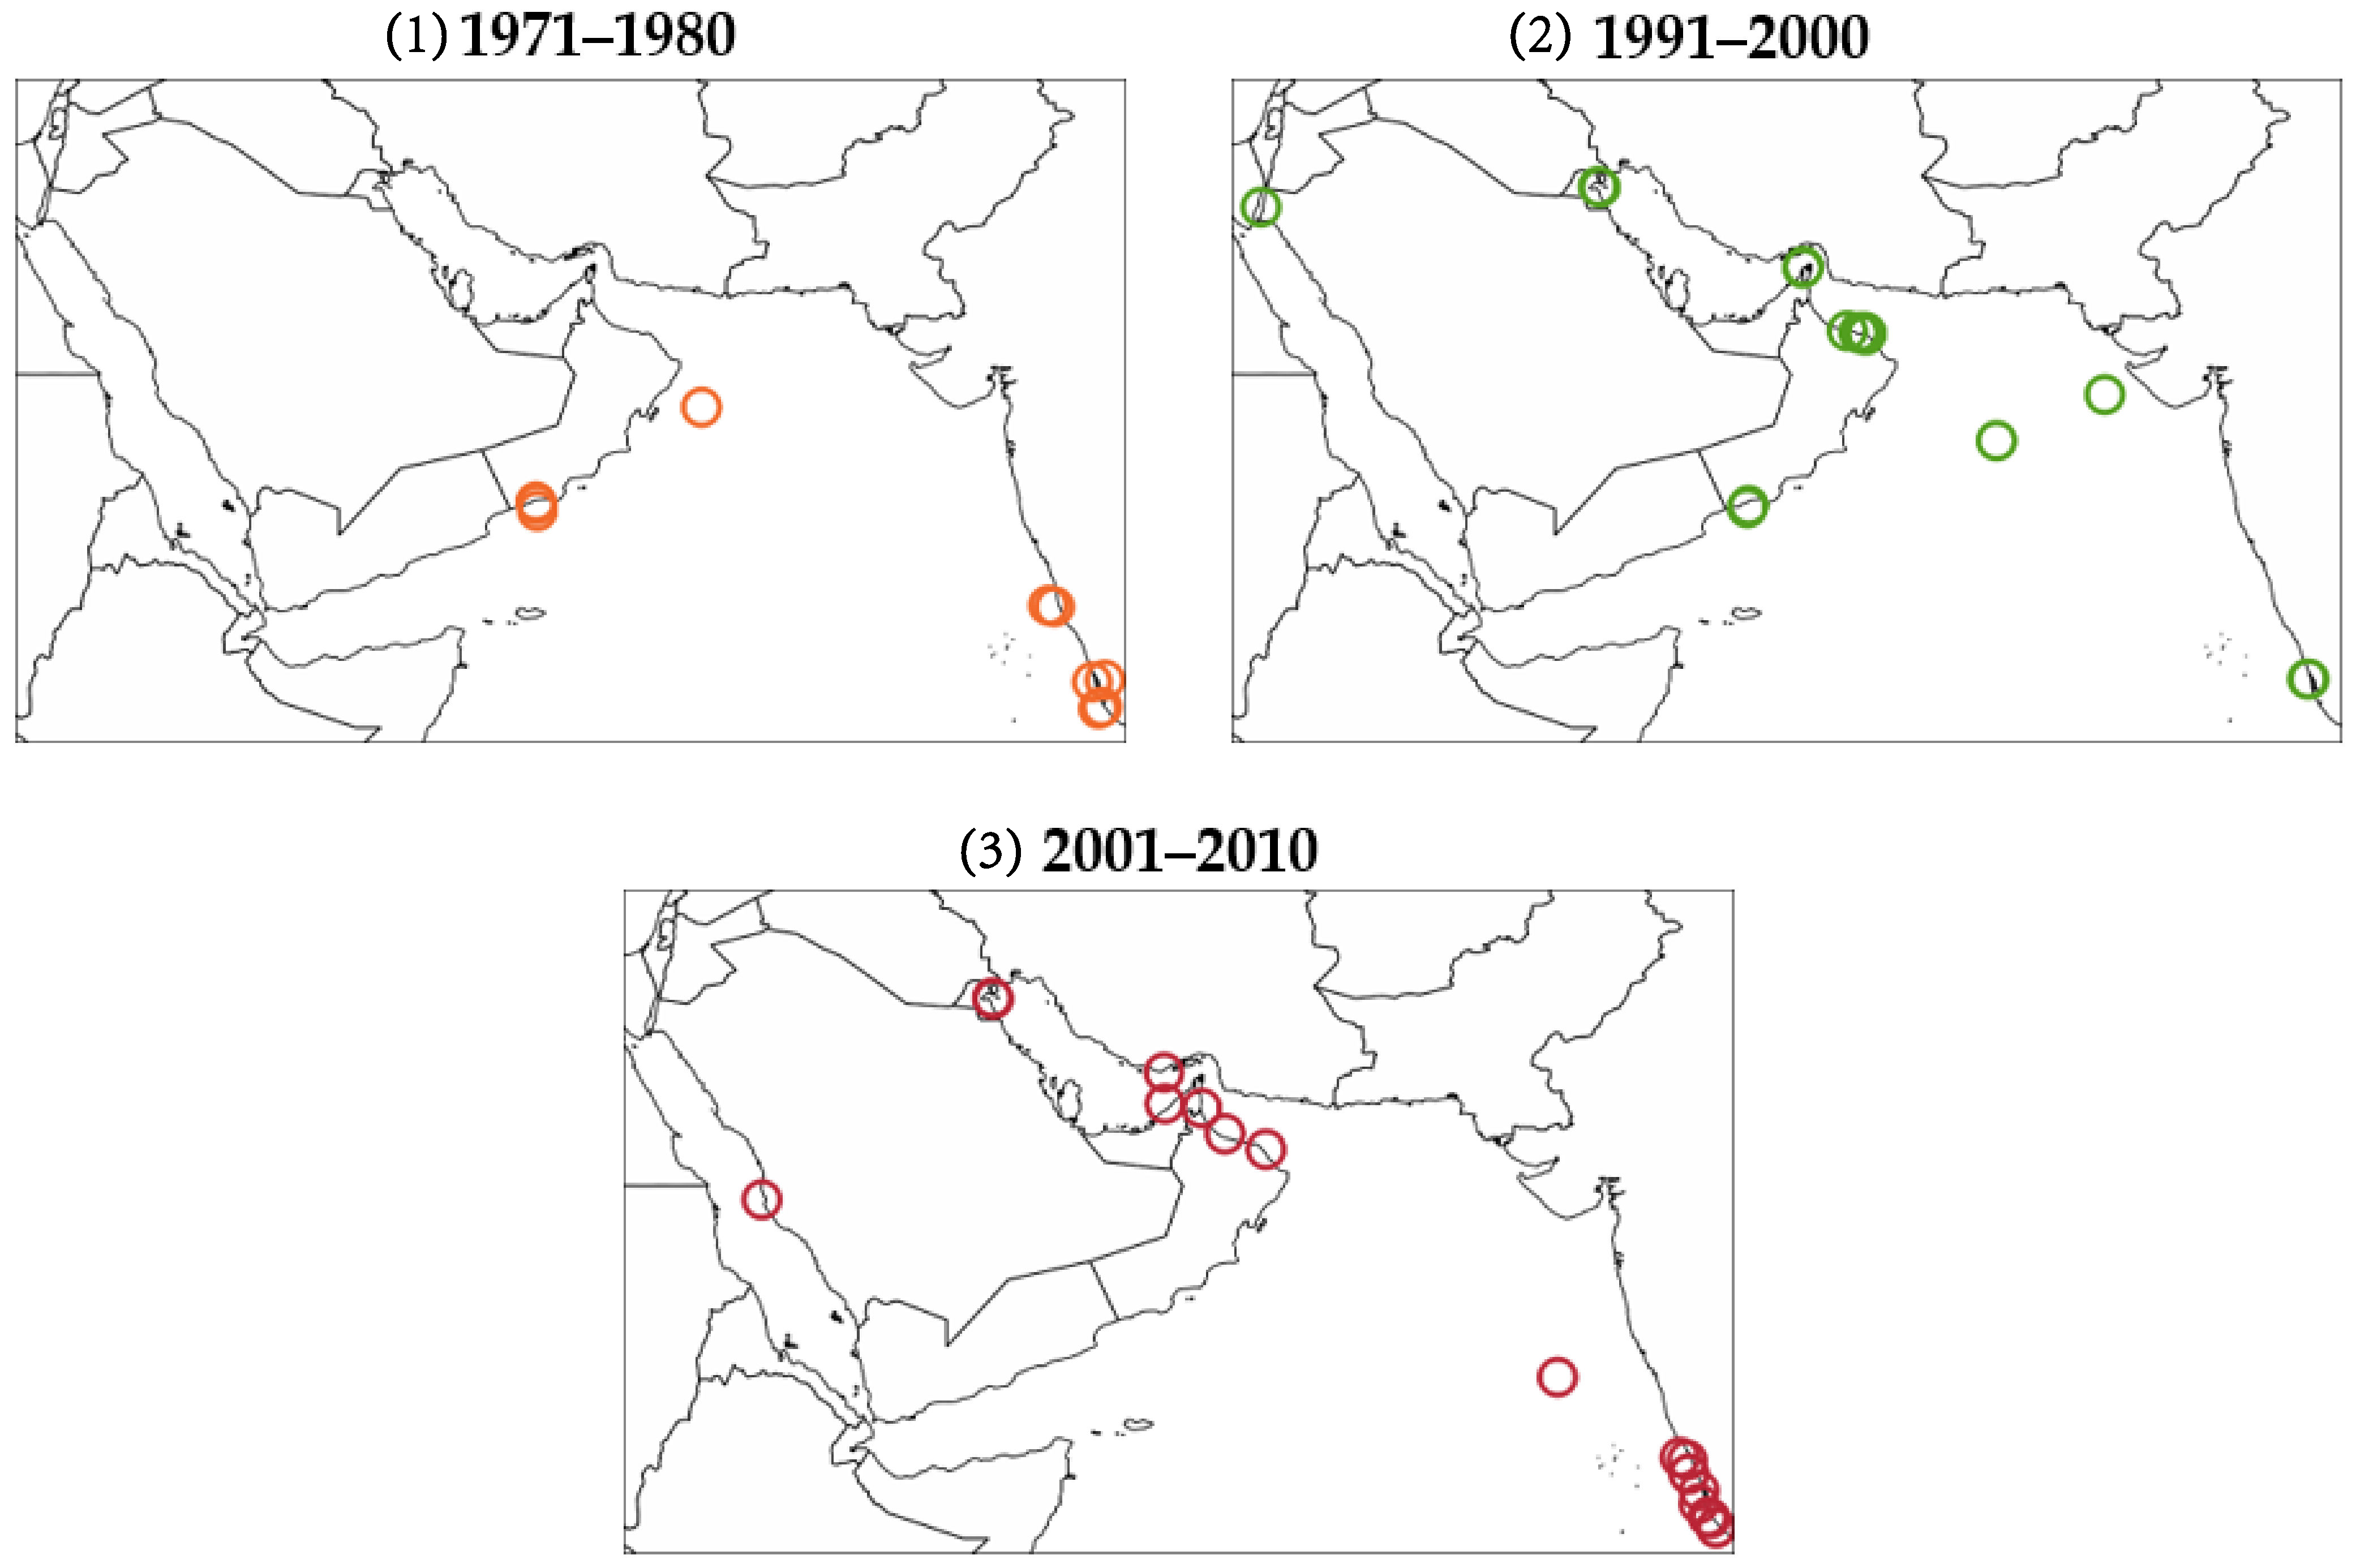
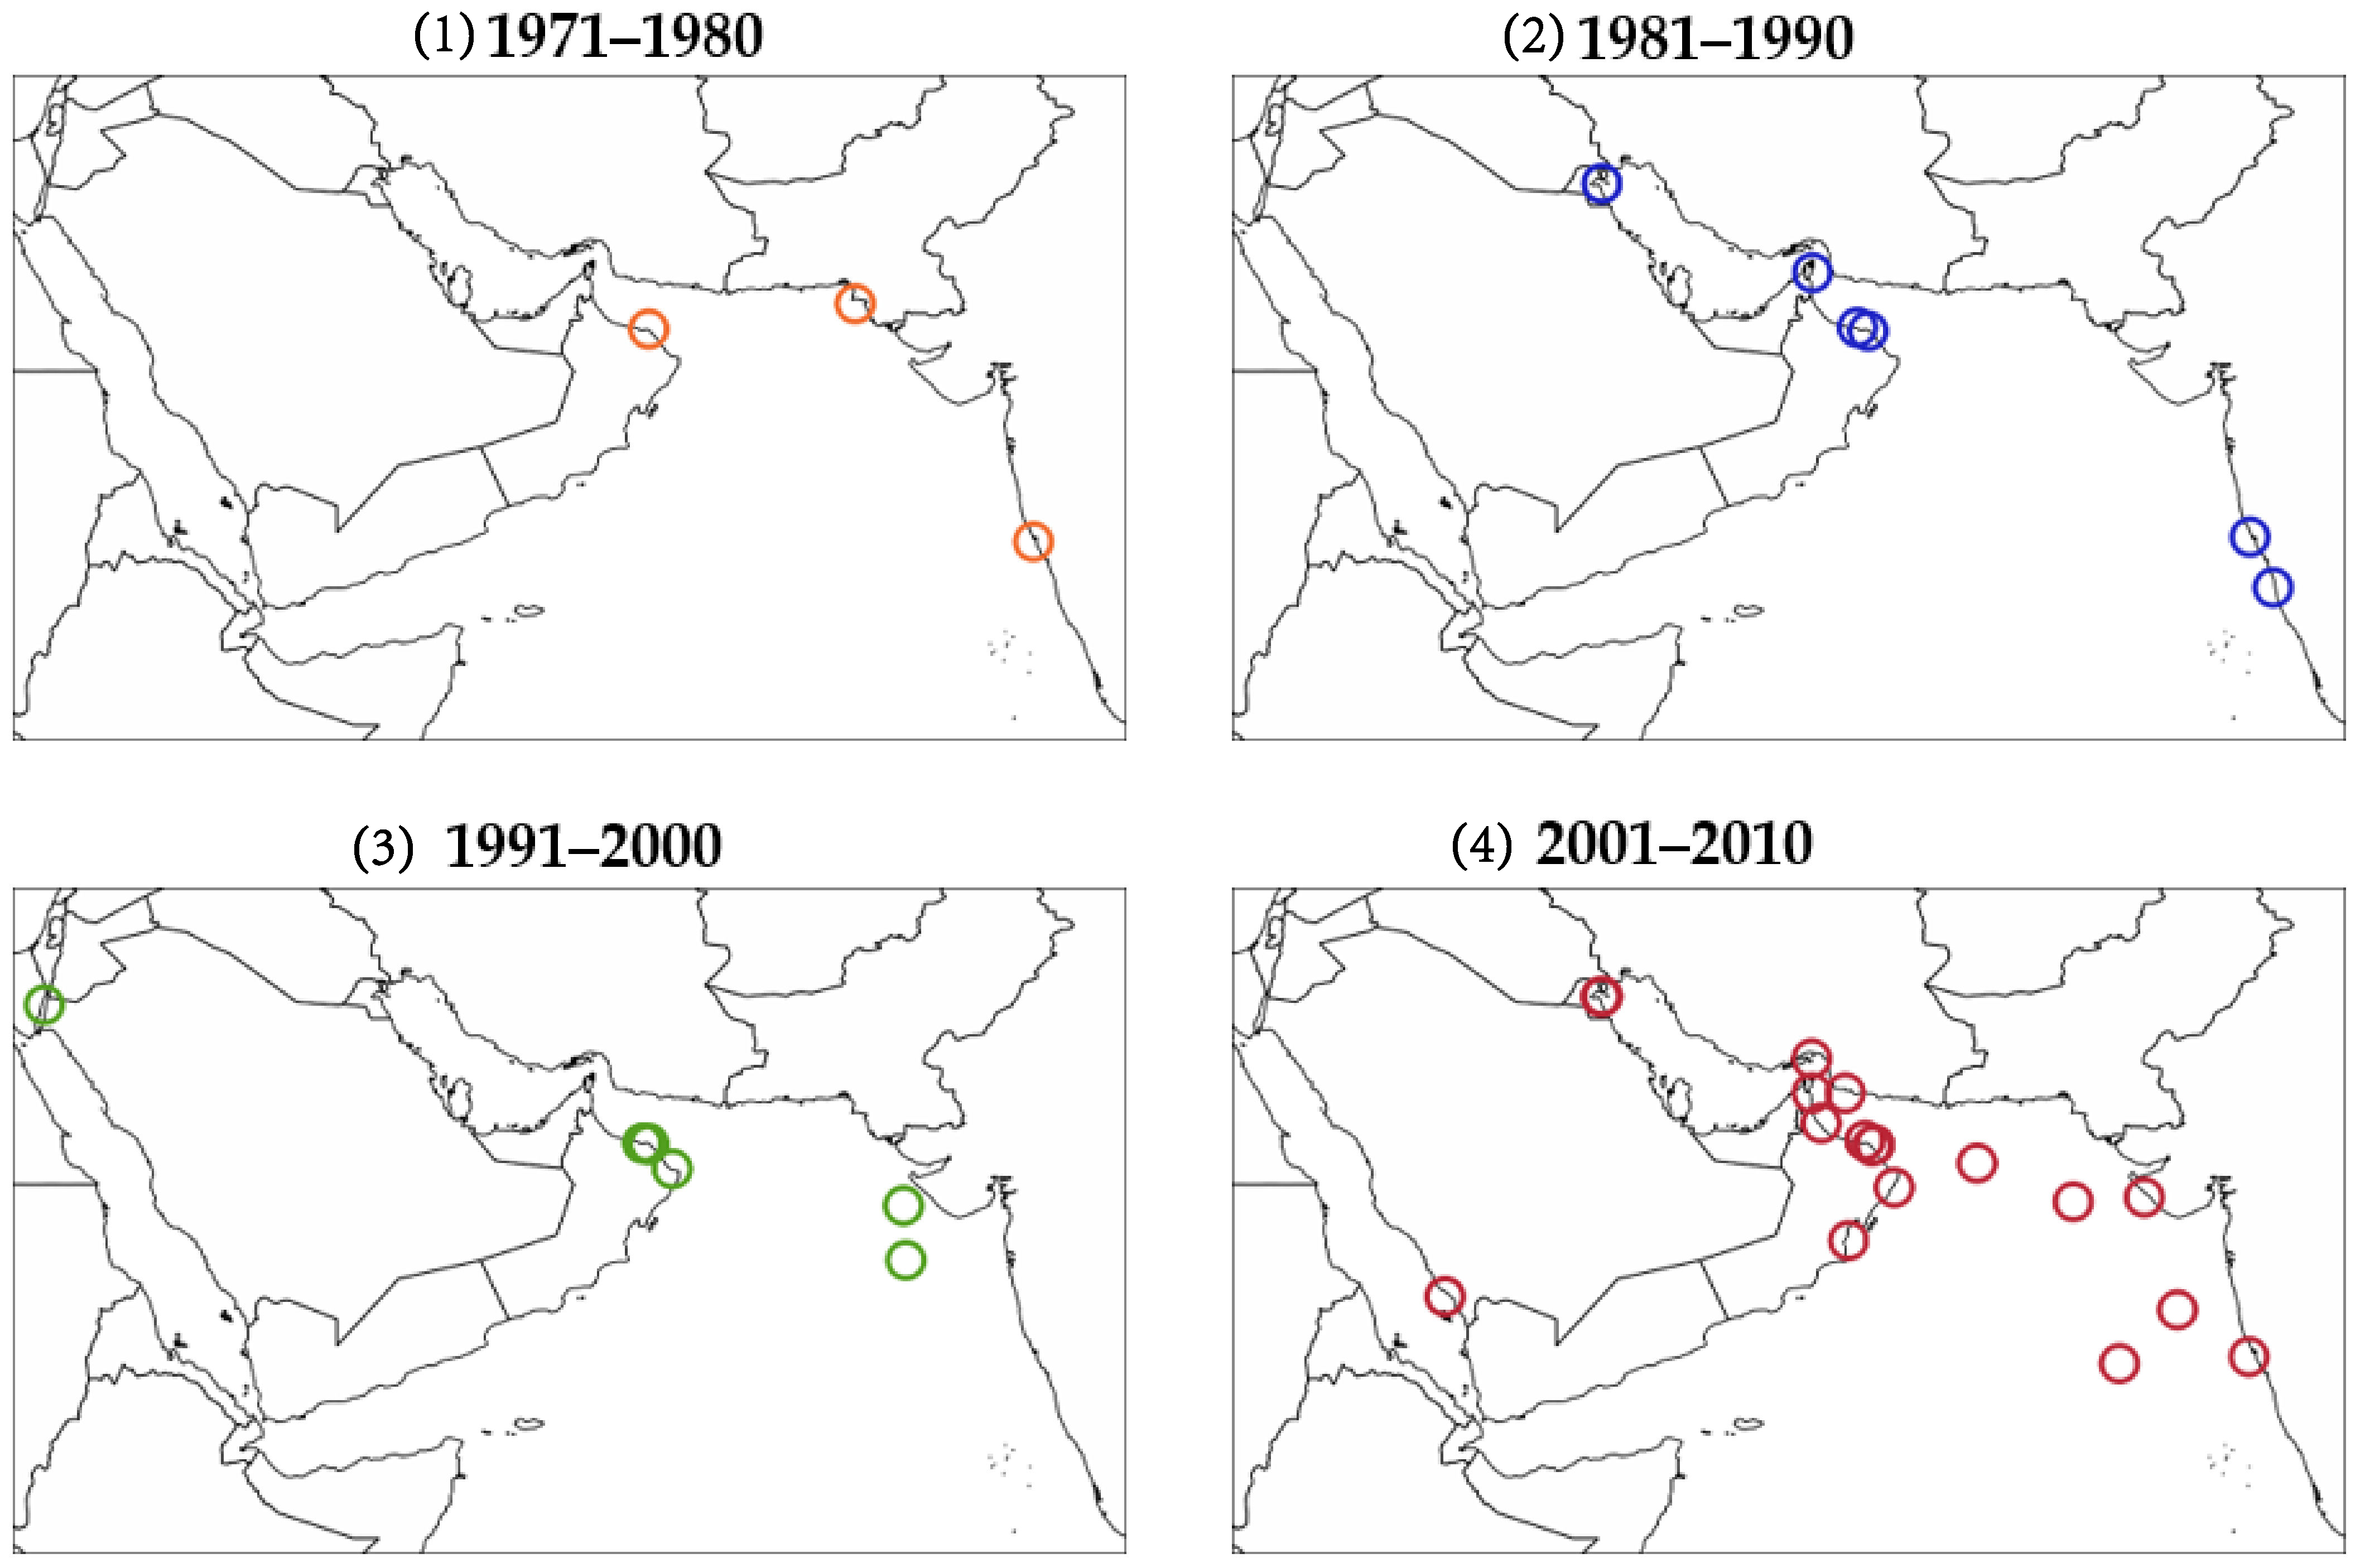
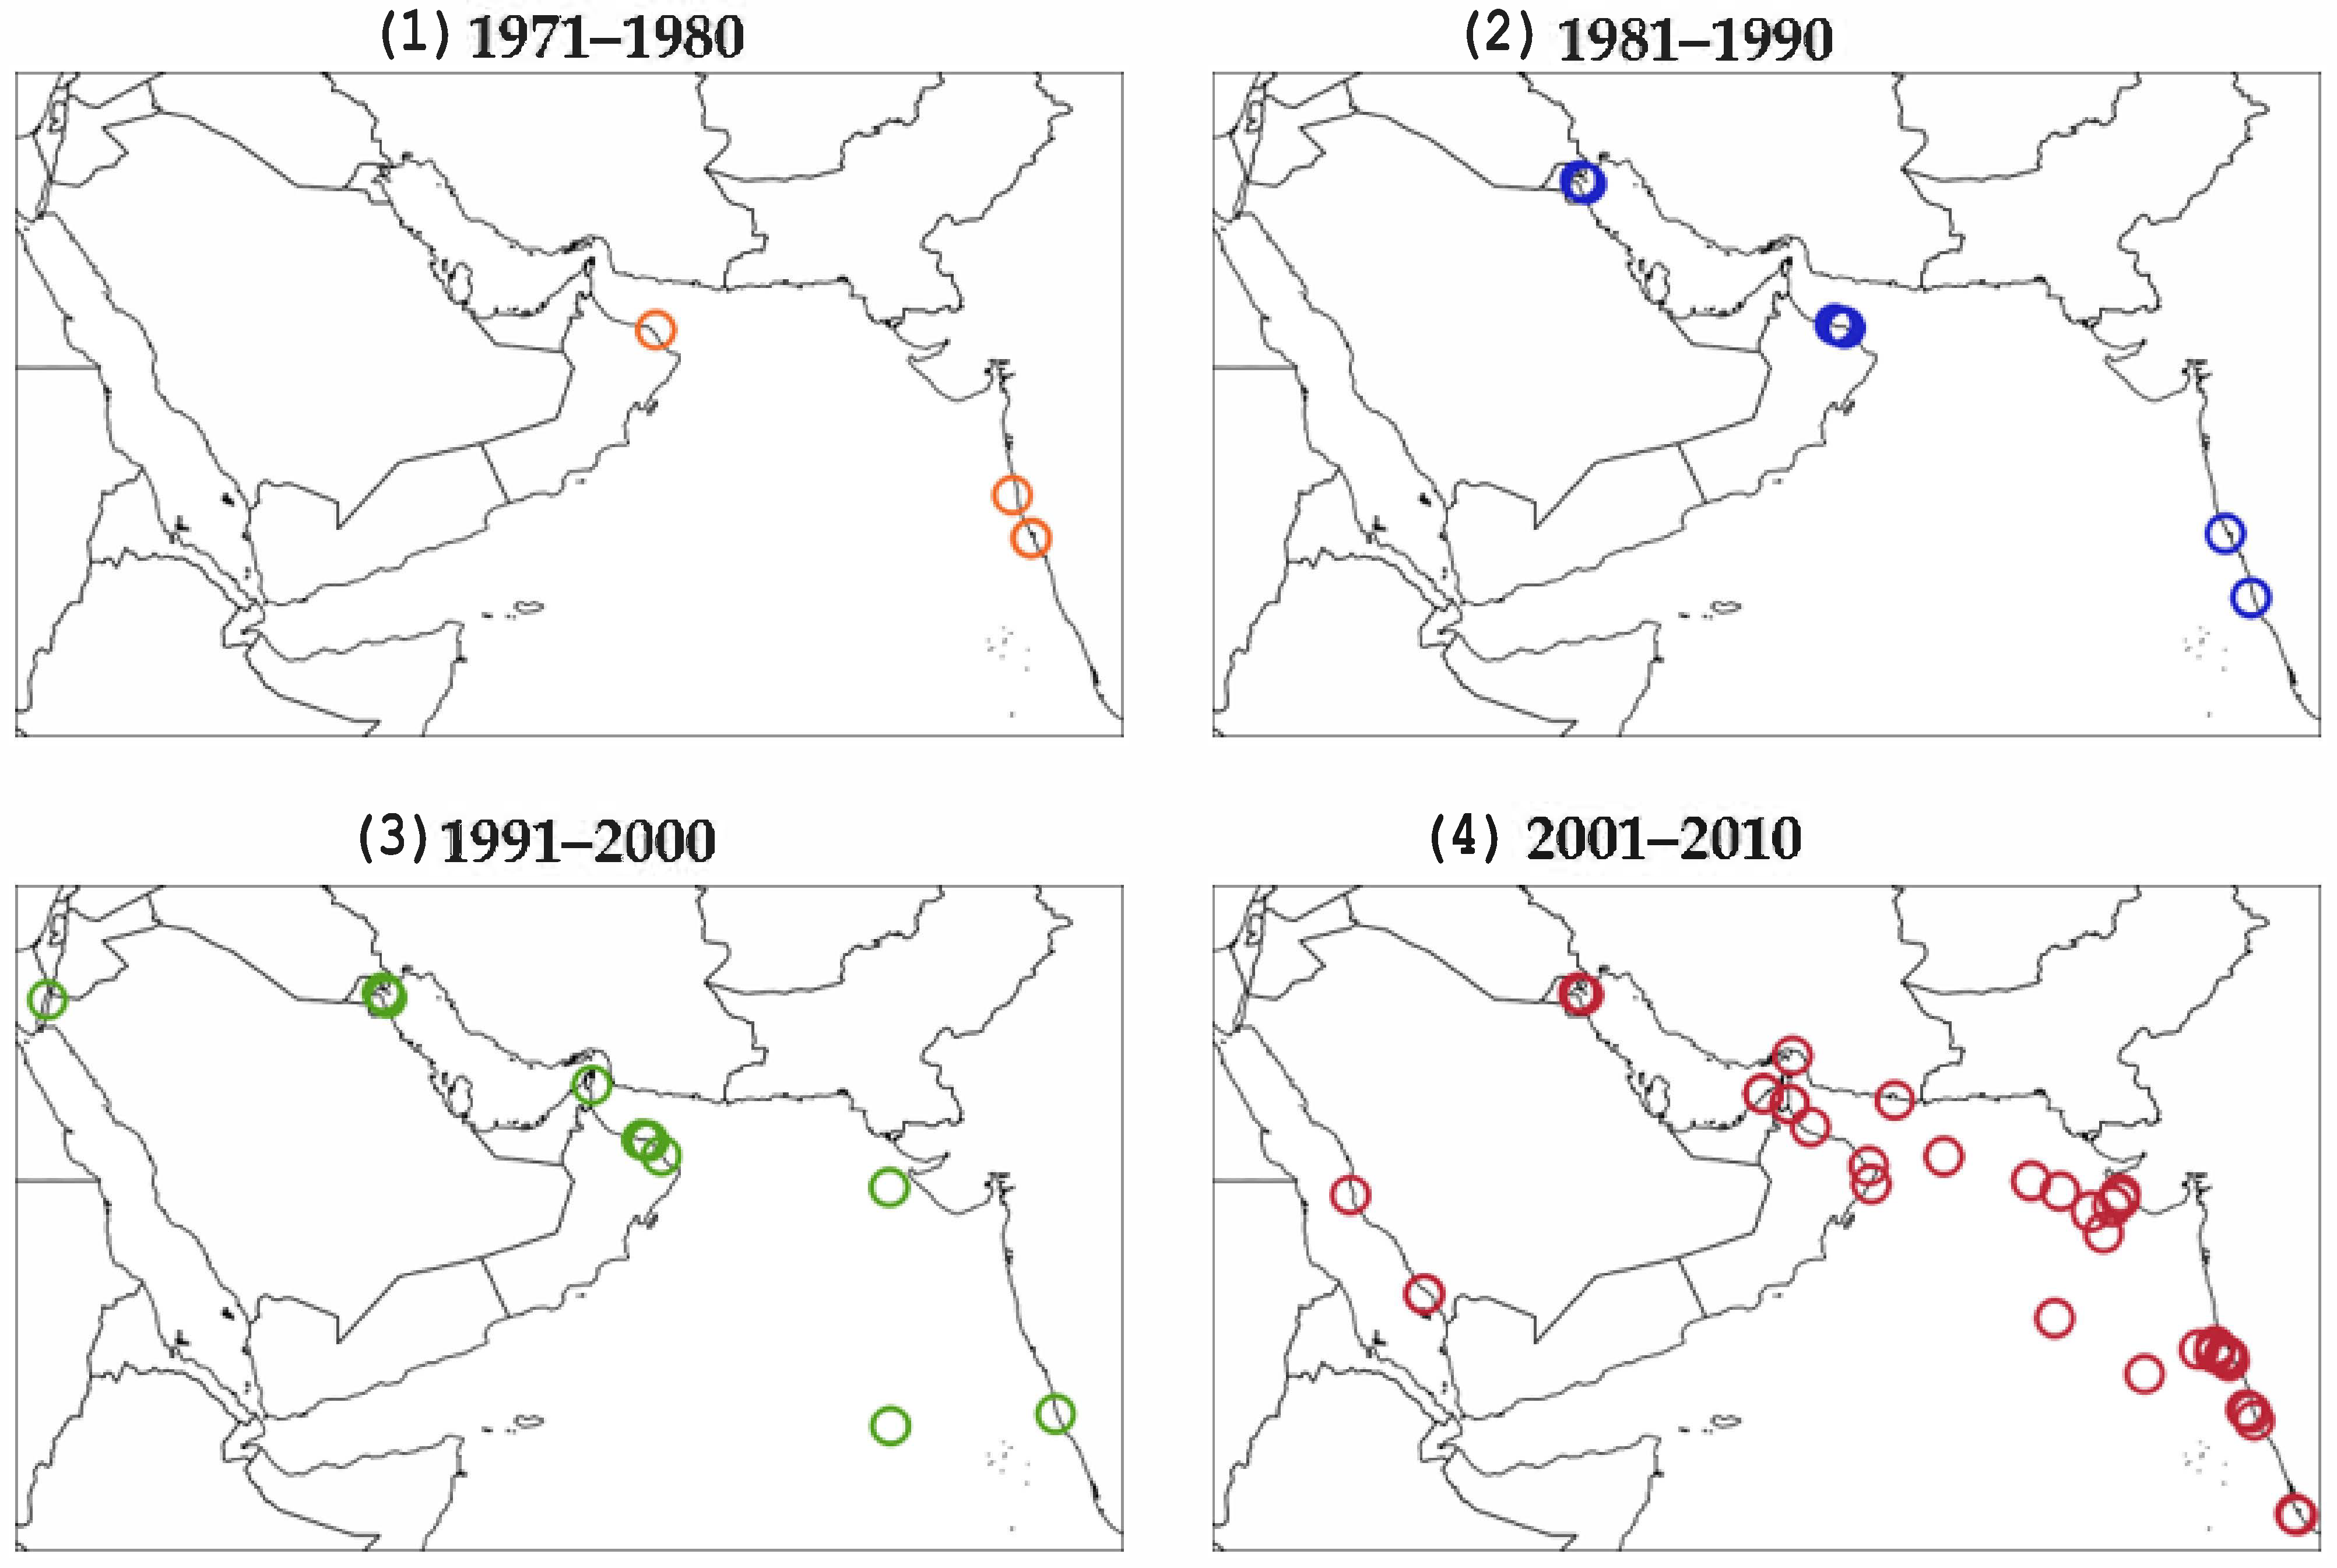
Table 1.
Atmospheric and oceanic features associated with algal bloom events in each of the ten hotspots.
Table 1.
Atmospheric and oceanic features associated with algal bloom events in each of the ten hotspots.
| Region | Location | SWM | NEM | ||
|---|---|---|---|---|---|
| Months | Cause | Months | Cause | ||
| Arabian Sea | 1 | August–November | Upwelling and advection | ||
| 4 | August–September October November | Upwelling and weak winds Upwelling Mixing | May | Northward advection of blooms | |
| 5 | June | Mixing (entrainment nutrients) | May November December | Advection of nutrients from Oman and solar radiation Mixing (entrainment nutrients) Mixing and advection of nutrients from Arabian coast | |
| 2 | October | Southward advection of nutrients | February–May | Highest solar radiation, southward advection of nutrients, and strong wind | |
| 3 | October–Dec | Upwelling and effects of the Indus river | February–May | Wind, northward advection, and effect of Indus river | |
| Sea of Oman | 6 | Aug–October | Advection from Arabian Sea and upwelling | January–April | Upwelling, solar radiation, northward advection, and dust storms |
| Arabian Gulf | 7 | October–November | Solar radiation, wind and dust storms, and warm air temperatures | January–May | Advection from Sea of Oman, dust storms, and warm air temperatures |
| 8 | June–August | Dust storms and organic nutrients | March–May | Low wind, stable water column, and discharge of Shatt Al-Arab | |
| Red Sea | 9 | June–August | Northward advection of nutrients, upwelling, and solar radiation | February–Mar | Upwelling, wind, and dust storms |
| 10 | February–Mar | Upwelling, wind, and dust storms | |||
Table 2.
Anthropogenic influences on the NIO.
| Anthropogenic Activities | Examples | Ref. |
|---|---|---|
| Industrial effluents |
| [50,51] |
| [52,53] | |
| [4,42,43,46,54,55,56,57] | |
| Ship waste |
| [3,43,53,58] |
| Reclamation and urban coastal projects |
| [46,48] |
Table 3.
The effect of sunlight on NIO waters.
| Sunlight Effect | Influence | Ref. |
|---|---|---|
| Photosynthetic fixation |
| [59,60] |
| Surface mixed-layer depth |
| [61] |
| Temperature profile |
| [59,62] |
Table 4.
Upwelling effects on NIO waters.
| Upwelling Effect | Season | Region | Ref. |
|---|---|---|---|
| Decrease in mixed-layer depth | SWM |
| [25,30,75,82] |
| NEM |
| [25,82] | |
| Supply of nutrients (phosphate, nitrate, and silicate) to the mixed layer | SWM |
| [28,30,75,76,78,83] |
| NEM |
| [28,54,84,85] | |
| Cooling seawater | SWM |
| [28,76,85] |
| NEM |
| [30] |
Table 5.
Circulation forms in NIO.
| Flow Patterns | Season | Region | Ref. |
|---|---|---|---|
| Mesoscale eddies | SWM | ||
| NEM |
| [27,28,89,96] | |
| Cyclonic and anti-cyclonic large eddies | SWM |
| [25,28,58,74] |
| NEM | |||
| Local cyclonic eddies | SWM | ||
| NEM |
| [90,92,94] | |
| Water currents | SWM |
| [3,25,28,37,55,90,95] |
Publisher’s Note: MDPI stays neutral with regard to jurisdictional claims in published maps and institutional affiliations. |
© 2022 by the authors. Licensee MDPI, Basel, Switzerland. This article is an open access article distributed under the terms and conditions of the Creative Commons Attribution (CC BY) license (https://creativecommons.org/licenses/by/4.0/).
Share and Cite
MDPI and ACS Style
Al-Shehhi, M.R.; Abdul Samad, Y. Identifying Algal Bloom ‘Hotspots’ in Marginal Productive Seas: A Review and Geospatial Analysis. Remote Sens. 2022, 14, 2457. https://0-doi-org.brum.beds.ac.uk/10.3390/rs14102457
AMA Style
Al-Shehhi MR, Abdul Samad Y. Identifying Algal Bloom ‘Hotspots’ in Marginal Productive Seas: A Review and Geospatial Analysis. Remote Sensing. 2022; 14(10):2457. https://0-doi-org.brum.beds.ac.uk/10.3390/rs14102457
Chicago/Turabian StyleAl-Shehhi, Maryam R., and Yarjan Abdul Samad. 2022. "Identifying Algal Bloom ‘Hotspots’ in Marginal Productive Seas: A Review and Geospatial Analysis" Remote Sensing 14, no. 10: 2457. https://0-doi-org.brum.beds.ac.uk/10.3390/rs14102457
Note that from the first issue of 2016, this journal uses article numbers instead of page numbers. See further details here.