1. Introduction
One of the essential aspects of agricultural production is soil. Soil properties and management influence crop yield and quality [
1,
2]. Information related to soil quality such as soil type, layer thickness, mechanical structure, solid moisture, slope, and rock outcrops have been used by planters for centuries of activities relating to agricultural production.
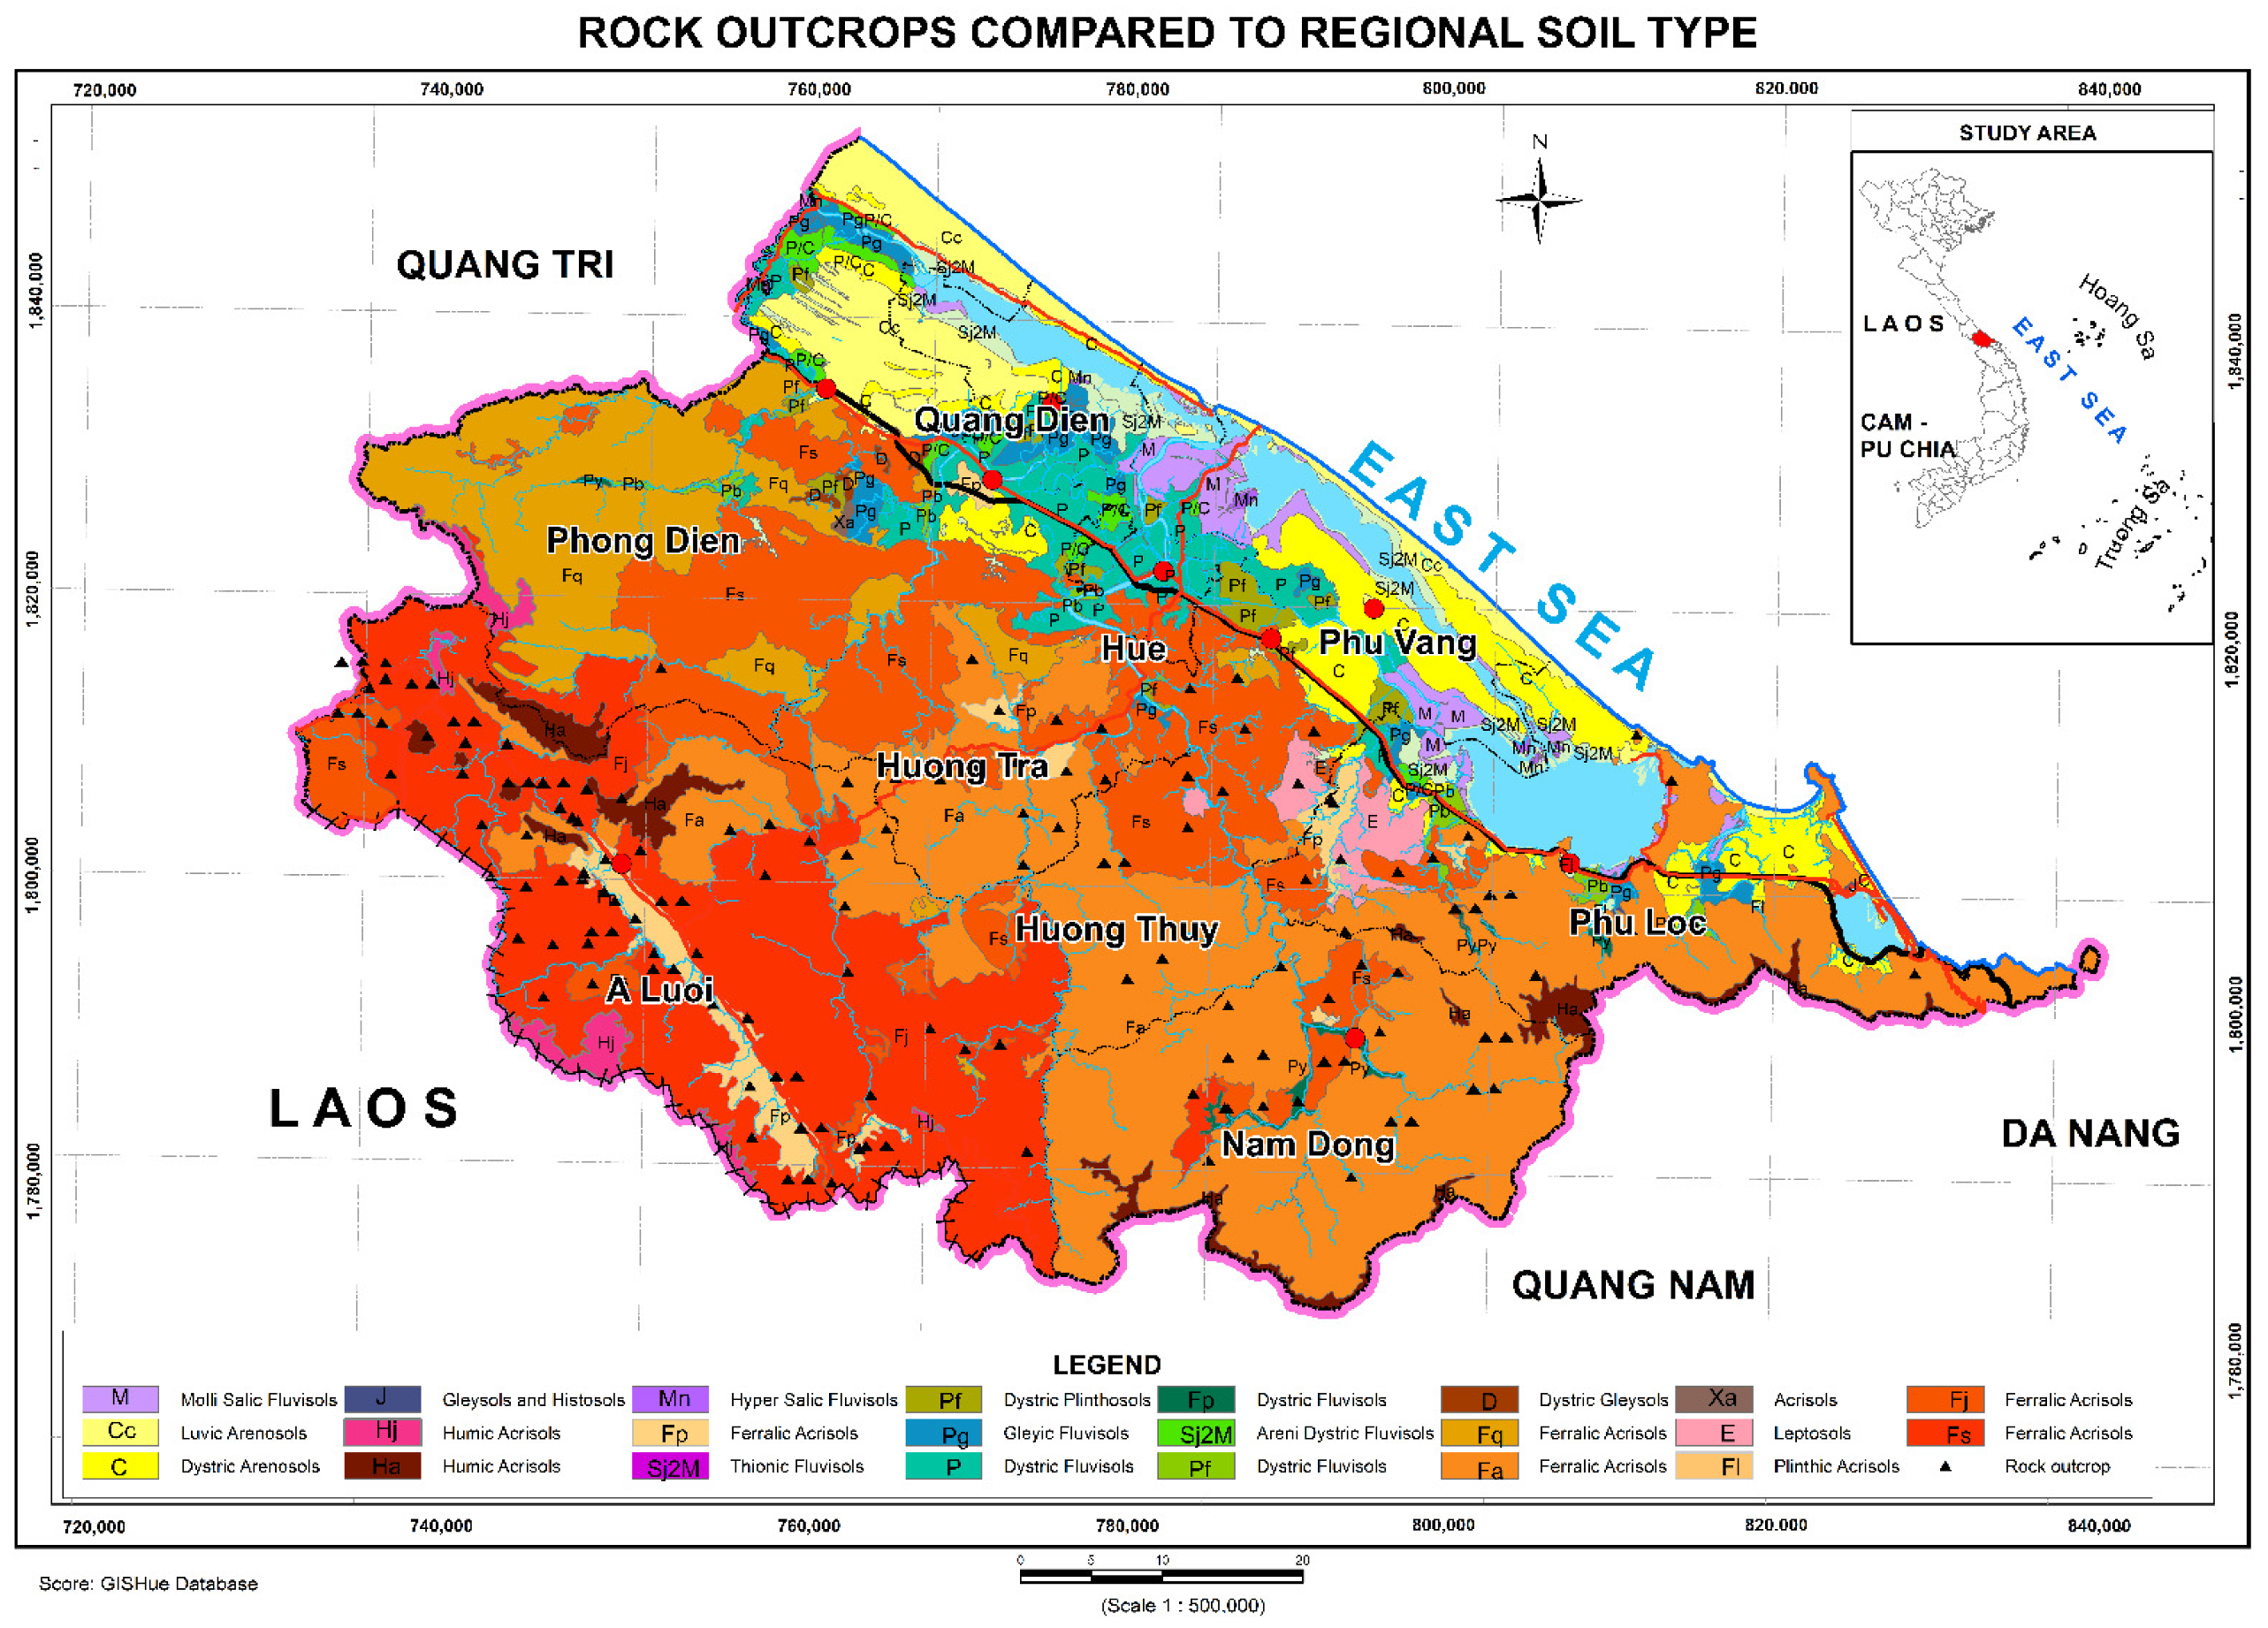
Many natural socio-economic factors affect the Thua Thien Hue province in terms of generation, development, and degradation processes, so the mantle has a very diverse and complex differentiation. Rock outcrops are concentrated in areas with relatively high terrain, such as the A Luoi district and Nam Dong. Additionally, the land cover and appearance of rock outcrops have an effect on the development and expansion of agricultural and cultivated forestry areas. With the intention of determining the soil characteristics in Thua Thien Hue province in order to assist land use planning, authors have analyzed remote sensing data using typical interpretation methods combined with Object-Based Oriented Classification to obtain the necessary details for solving this issue [
3].
In Vietnam, traditional methods such as geodesy, inspection, and laboratory analysis are frequently used to establish and build soil maps. Such tasks, however, are often expensive and time-consuming to perform. The use of remote sensing image data and GIS technologies will aid in limiting/resolving the mentioned problems. Many countries are currently performing a great deal of research using remote sensing images and GIS technologies to extract land cover and soil moisture information, including from remote sensing materials such as Landsat, Sentinal, SPOT5, MODIS, and VN-REDSAT [
4,
5,
6,
7].
However, the extraction of rock outcrop information has attracted little attention, and little study has been devoted to the topic. Rock outcrop research is often grouped with dissolution without cover (landscape cover) or areas with unique topography, such as deserts and karsts. According to Christopher D.E. and Ronald J.P.L., the vegetative indices can be affected by changes in the spectral characteristics of soil and rock, which will have a negative effect [
8]. Yuemin and Kai-Lung Wang (2012) extracted photosynthetic vegetation information and a photosynthetic vegetation layer by means of the NDVI index and plant index Analysis NDVI-SMA (Spectral Mixture Analysis) [
9]. Because the land cover in Thua Thien Hue province is diverse, bare rock items must be extracted and removed from vegetative covers such as construction land, fine southern sand, and bare soil.
This paper performs the extraction of soil characteristics and information from remote sensing images on the basis of observation and the necessities of the study field, including land cover, rock outcrops, and surface moisture. The research results will provide more information on the use of remote sensing images for the purpose of mapping soil and building databases for scientists around the world, including in Vietnam.
2. Material and Methods
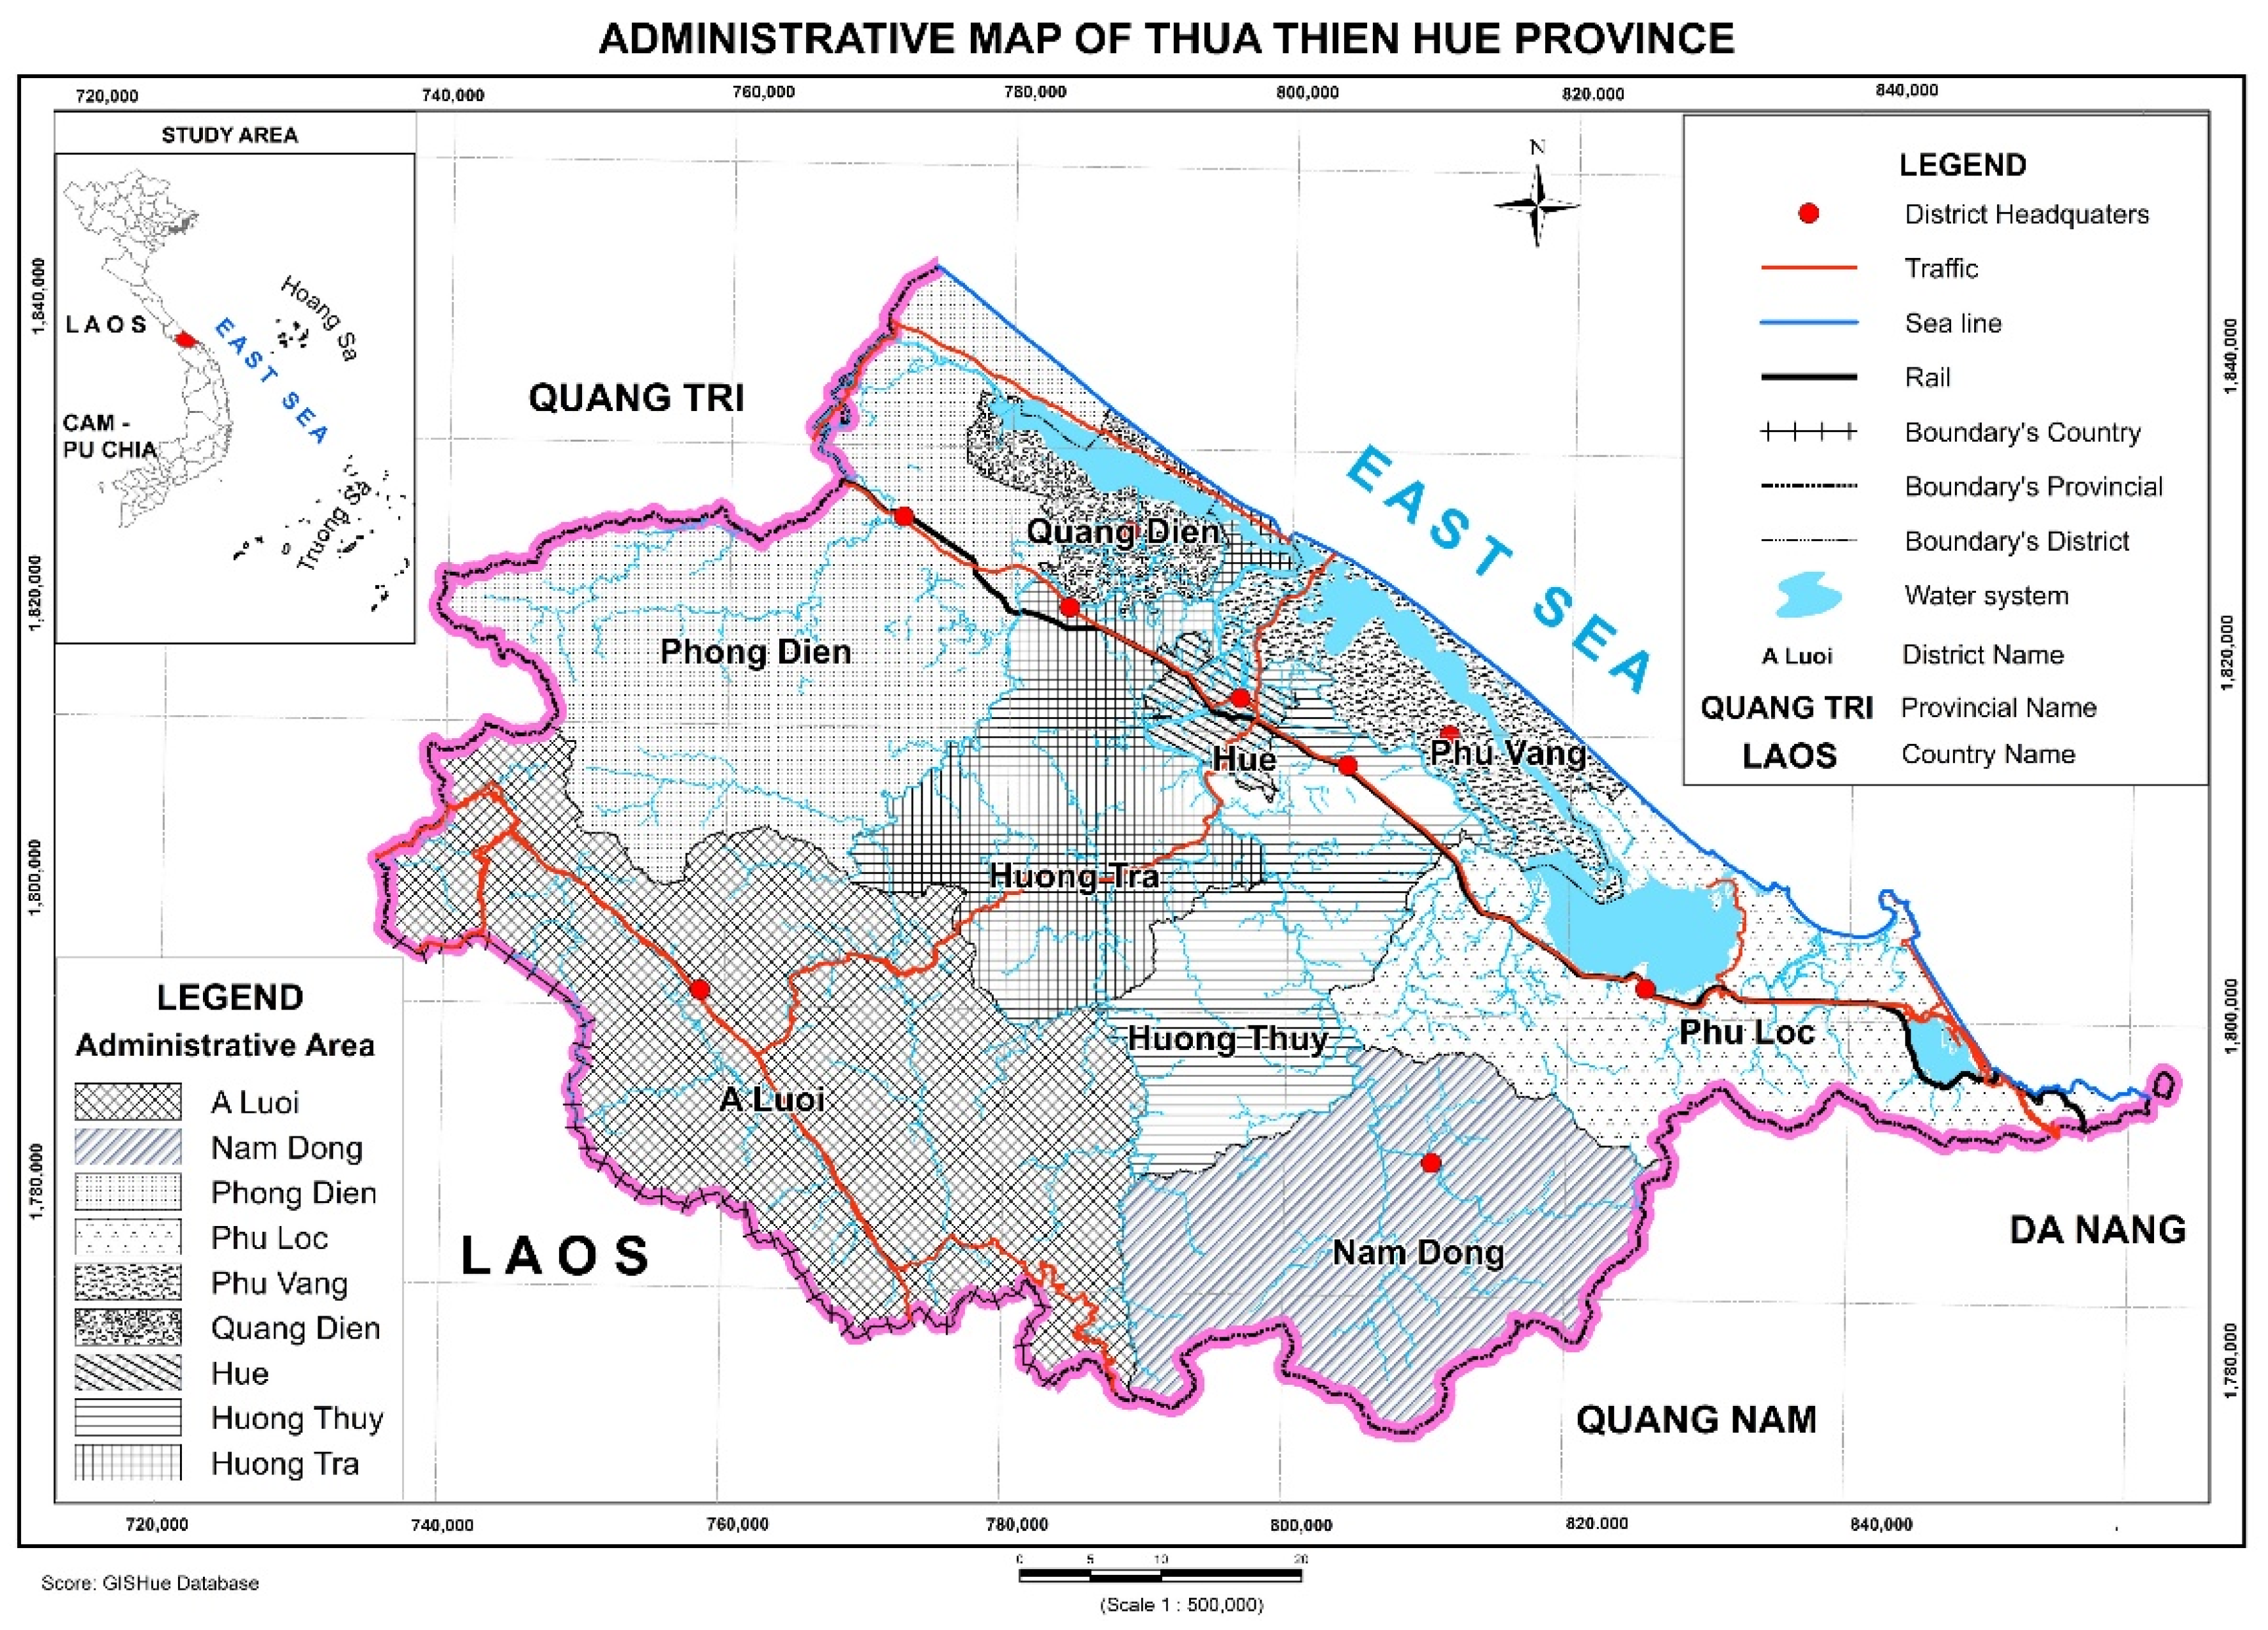
2.1. Study Area
This research covers the entire Province of Thua Thien Hue (
Figure 1), which has a natural area of 503,320.53 hectares, accounting for 1.5% of Vietnam’s total land area. Complex geography, with terrain types ranging from medium mountain to low mountain to hilly, account for for 75% of the overall area (with a slope > 8°), with coastal plains, lagoons, and sand dunes accounting for 24.9%. The population is 1,128,620, with a density of 224 people/km
2.
2.2. Data
This study takes an object-oriented approach to isolating rock outcrop objects from Landsat by using image ratio data from 8 OLI/TIRS.
The Landsat 8 OLI/TIRS scene with free cloud covering the study area collected on 25 April 2019 provides optical imagery with 30 m spatial resolution on eight spectral bands via the Operational Land Imager sensor and two bands via the Thermal Infrared Sensor.
In addition, base maps and existing soil datasets from the province were also supplemented for analysis.
2.3. Methodologies
The Object-Based Oriented Classification approach is used because it has many advantages over traditional classification methods. This method uses information such as composition, scale, shape, and the reflection spectra characteristics of classified objects [
10].
Most/many researchers have used the ratio image approach to extract objects from remote sensing image data around the world [
11,
12,
13].
In this study, the object-oriented approach was used in this analysis in the following way: the test specimens were fragmented to extract the rock outcrop; at the same time, NDVI and LST were extracted from the remote sensing image data. Remote sensing images were mixed, image resolution was improved, geographical borders were sliced through, and the coordinate reference system was rectified to the VN-2000 coordinate reference system before classification.
Table 1 shows the data that were used in the analysis.
2.3.1. Land Use/Land Cover
Landsat-8 OLI/TIRS images were pre-processed before classification, including layer stacking bands, improving image quality, creating subsets of test site regions, geo-referencing, and projection transformation into the VN-2000 coordinate reference system. Finally, from the GISHue baseline data, the administrative unit of the Thua Thien Hue province was cut to obtain an overview of the study area.
Object-Based Oriented Classification can be divided into two main stages: segmentation and image classification based on a set rule set, including algorithms, indices, and threshold classification. Image fragmentation combines specific pixels into objects, which are then classified on the basis of the objects rather than the actual pixels. Scale specifies the presence or absence of certain object classes during the development process, and the object’s size may influence the classification performance. This method has been shown to produce better classification results than pixel classification, especially for data with high spatial resolution [
14].
This research extracted objects according to each level, such as level 1: land, water; level 2: vegetable and non-vegetable; level 3: sand land and non-sand land; level 4: built-up and bare land; and level 5: rock outcrops and non-rock outcrops with different segmentation parameters in terms of shape and scale (
Table 2).
On the basis of image channel metrics, eCognition software can be used to provide a suitable collection of indicators. The amplitude (brightness), the mean RED, the near-infrared mean NIR, and Max.diff were used to distinguish the subjects in this analysis. In addition, additional computational indicators from Landsat 8 OLI/TIRS images, such as the plant difference indexes NDVI, NDBI, NDWI, and NDDI were also set up to increase the performance of object detection and differentiation on images,. The indexes used to disaggregate the subjects in this study are presented in
Table 3.
2.3.2. Extraction of Moisture Information from Remote Sensing Images from Landsat 8 OLI/TIRS
A surface soil moisture map was established in this study using Landsat remote sensing data by the triangular NDVI/LST method. The surface soil moisture index [
15,
16] is dependent on experimental parameters for the relationship between LST and NDVI:
LST
max and LST
min were calculated using the formula:
In this research, NDVI and LST were calculated on the basis of the reflected data in the short-wave, thermal infrared, orange, red, and sub-infrared bands using pre-processed Landsat 8 OLI/TIRS images.
- −
The formula for extracting LST information is as follows:
where T
b: is At-satellite brightness temperature; λ is wavelength of emitted radiance; C
2 = 1.4388 × 10
−2 m ε is emissivity (typically 0.95).
where [
17] h is Planck’s constant = 6.626 × 10
−34 J s; c is the velocity of light = 2.998 × 10
8 m/s; and s is the Boltzmann constant = 1.38 × 10
−23 J/K [
13].
- −
The ratio of the reflectivity differences for the NIR and the red band to their sum (NDVI) was calculated using the following equation:
After extracting the necessary parameters, NDVI was used to conduct a linear regression analysis with LSTmax and LSTmin. Linear regression values close to 0 indicate that the dry is drier, and the wet is more humid.
2.3.3. Accuracy Assessment
This research used the indicators Overall Accuracy and Kappa statistics to assess image classification accuracy. Once the overall accuracy had been measured as a percentage of the number of correctly classified scores, it was divided by the total control score of the control sample. The overall accuracy was calculated as a percentage of the number of correctly classified scores divided by the total control score of the control sample, which was calculated as the sum of the exact classification pixels and the total number of sample pixels. The formula for calculating the Kappa coefficient is as follows:
where r is the number of columns in the matrix, n
ij is the number of pixels observed in row i and column j, n
i is the total number of pixels observed in row i, n
j is total number of pixels observed in column j, N is total number of pixels observed in the matrix.
The Kappa coefficient value is usually between 0 and 1, where
≥ 0.8 is highly accurate, 0.4 <
< 0.8 is medium precision, and
≤ 0.4 is low precision [
1].
According to the object-oriented method, image classification accuracy was assessed using a grid of actual ground data sample points, “ground truth”, obtained from Google Earth at the time of image acquisition (30 April 2019). A grid of sample points with a grid distance of 3 km was created and converted to *.kml, with a total of 300 sample points, inputting actual surface overlay information visually interpreted from Google Earth combined with the resulting interpretation results.
In addition, to compare the results of the extraction of rock outcrop information from remote sensing images with micro-clones from GISHue Database (according to the traditional method. This is an essential basis for supplementing and correcting exposed rock information for the soil database in the study area.
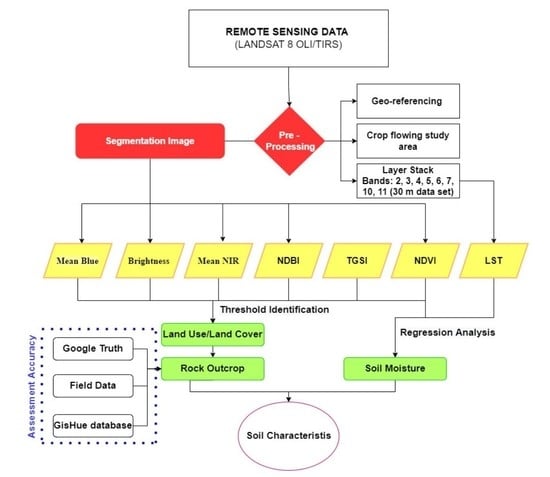
The process of identifying soil characteristics from Landsat 8 OLI/TIRS images is depicted in
Figure 2.
3. Results
3.1. Land Use and Land Cover Classification
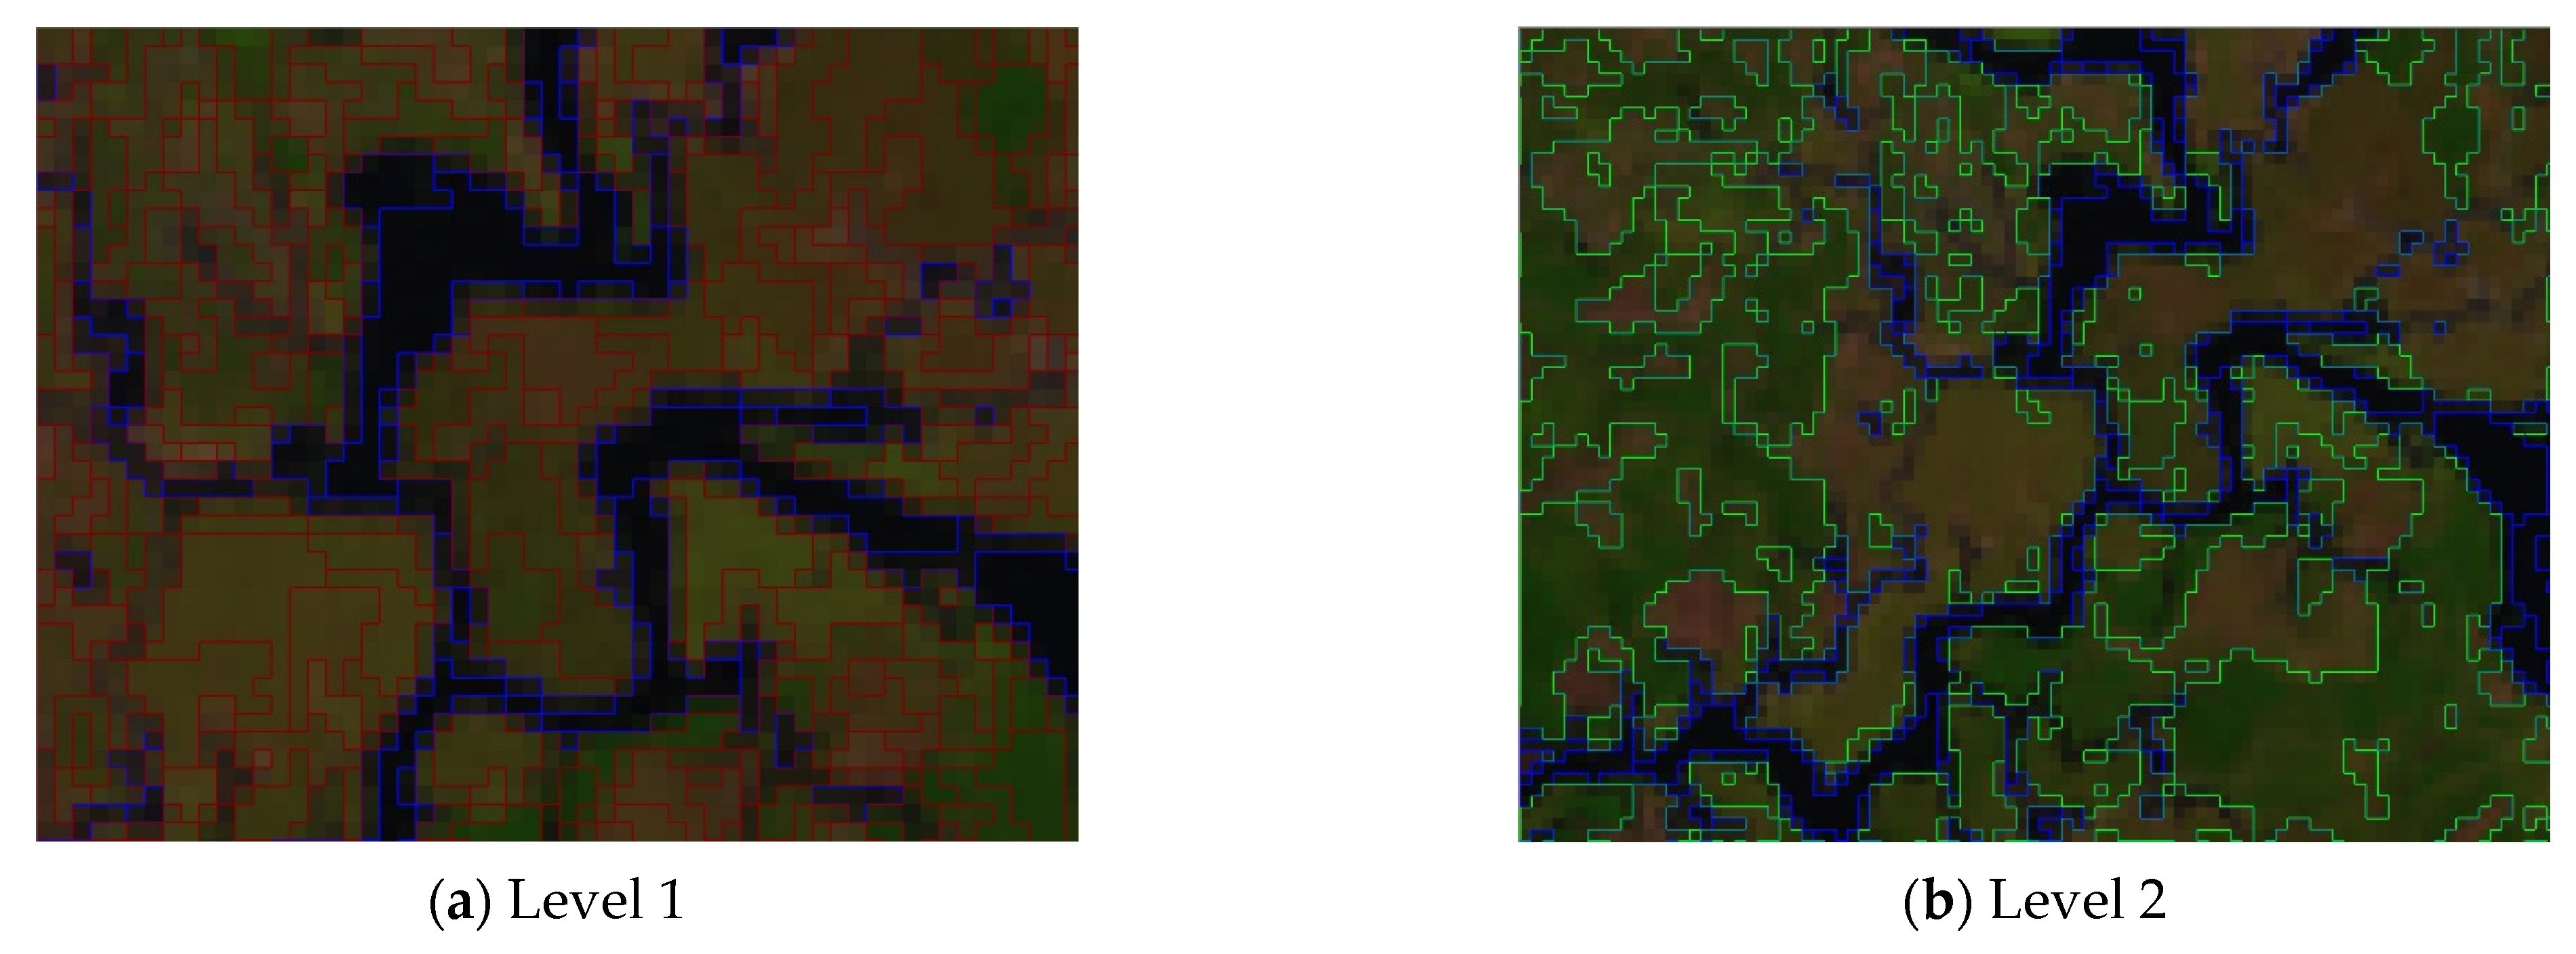
The results of the segmentation of the research objects show that the objects are clearly differentiated and easy to recognize, making it possible to identify and circle them in a straightforward manner, as shown in
Figure 3.
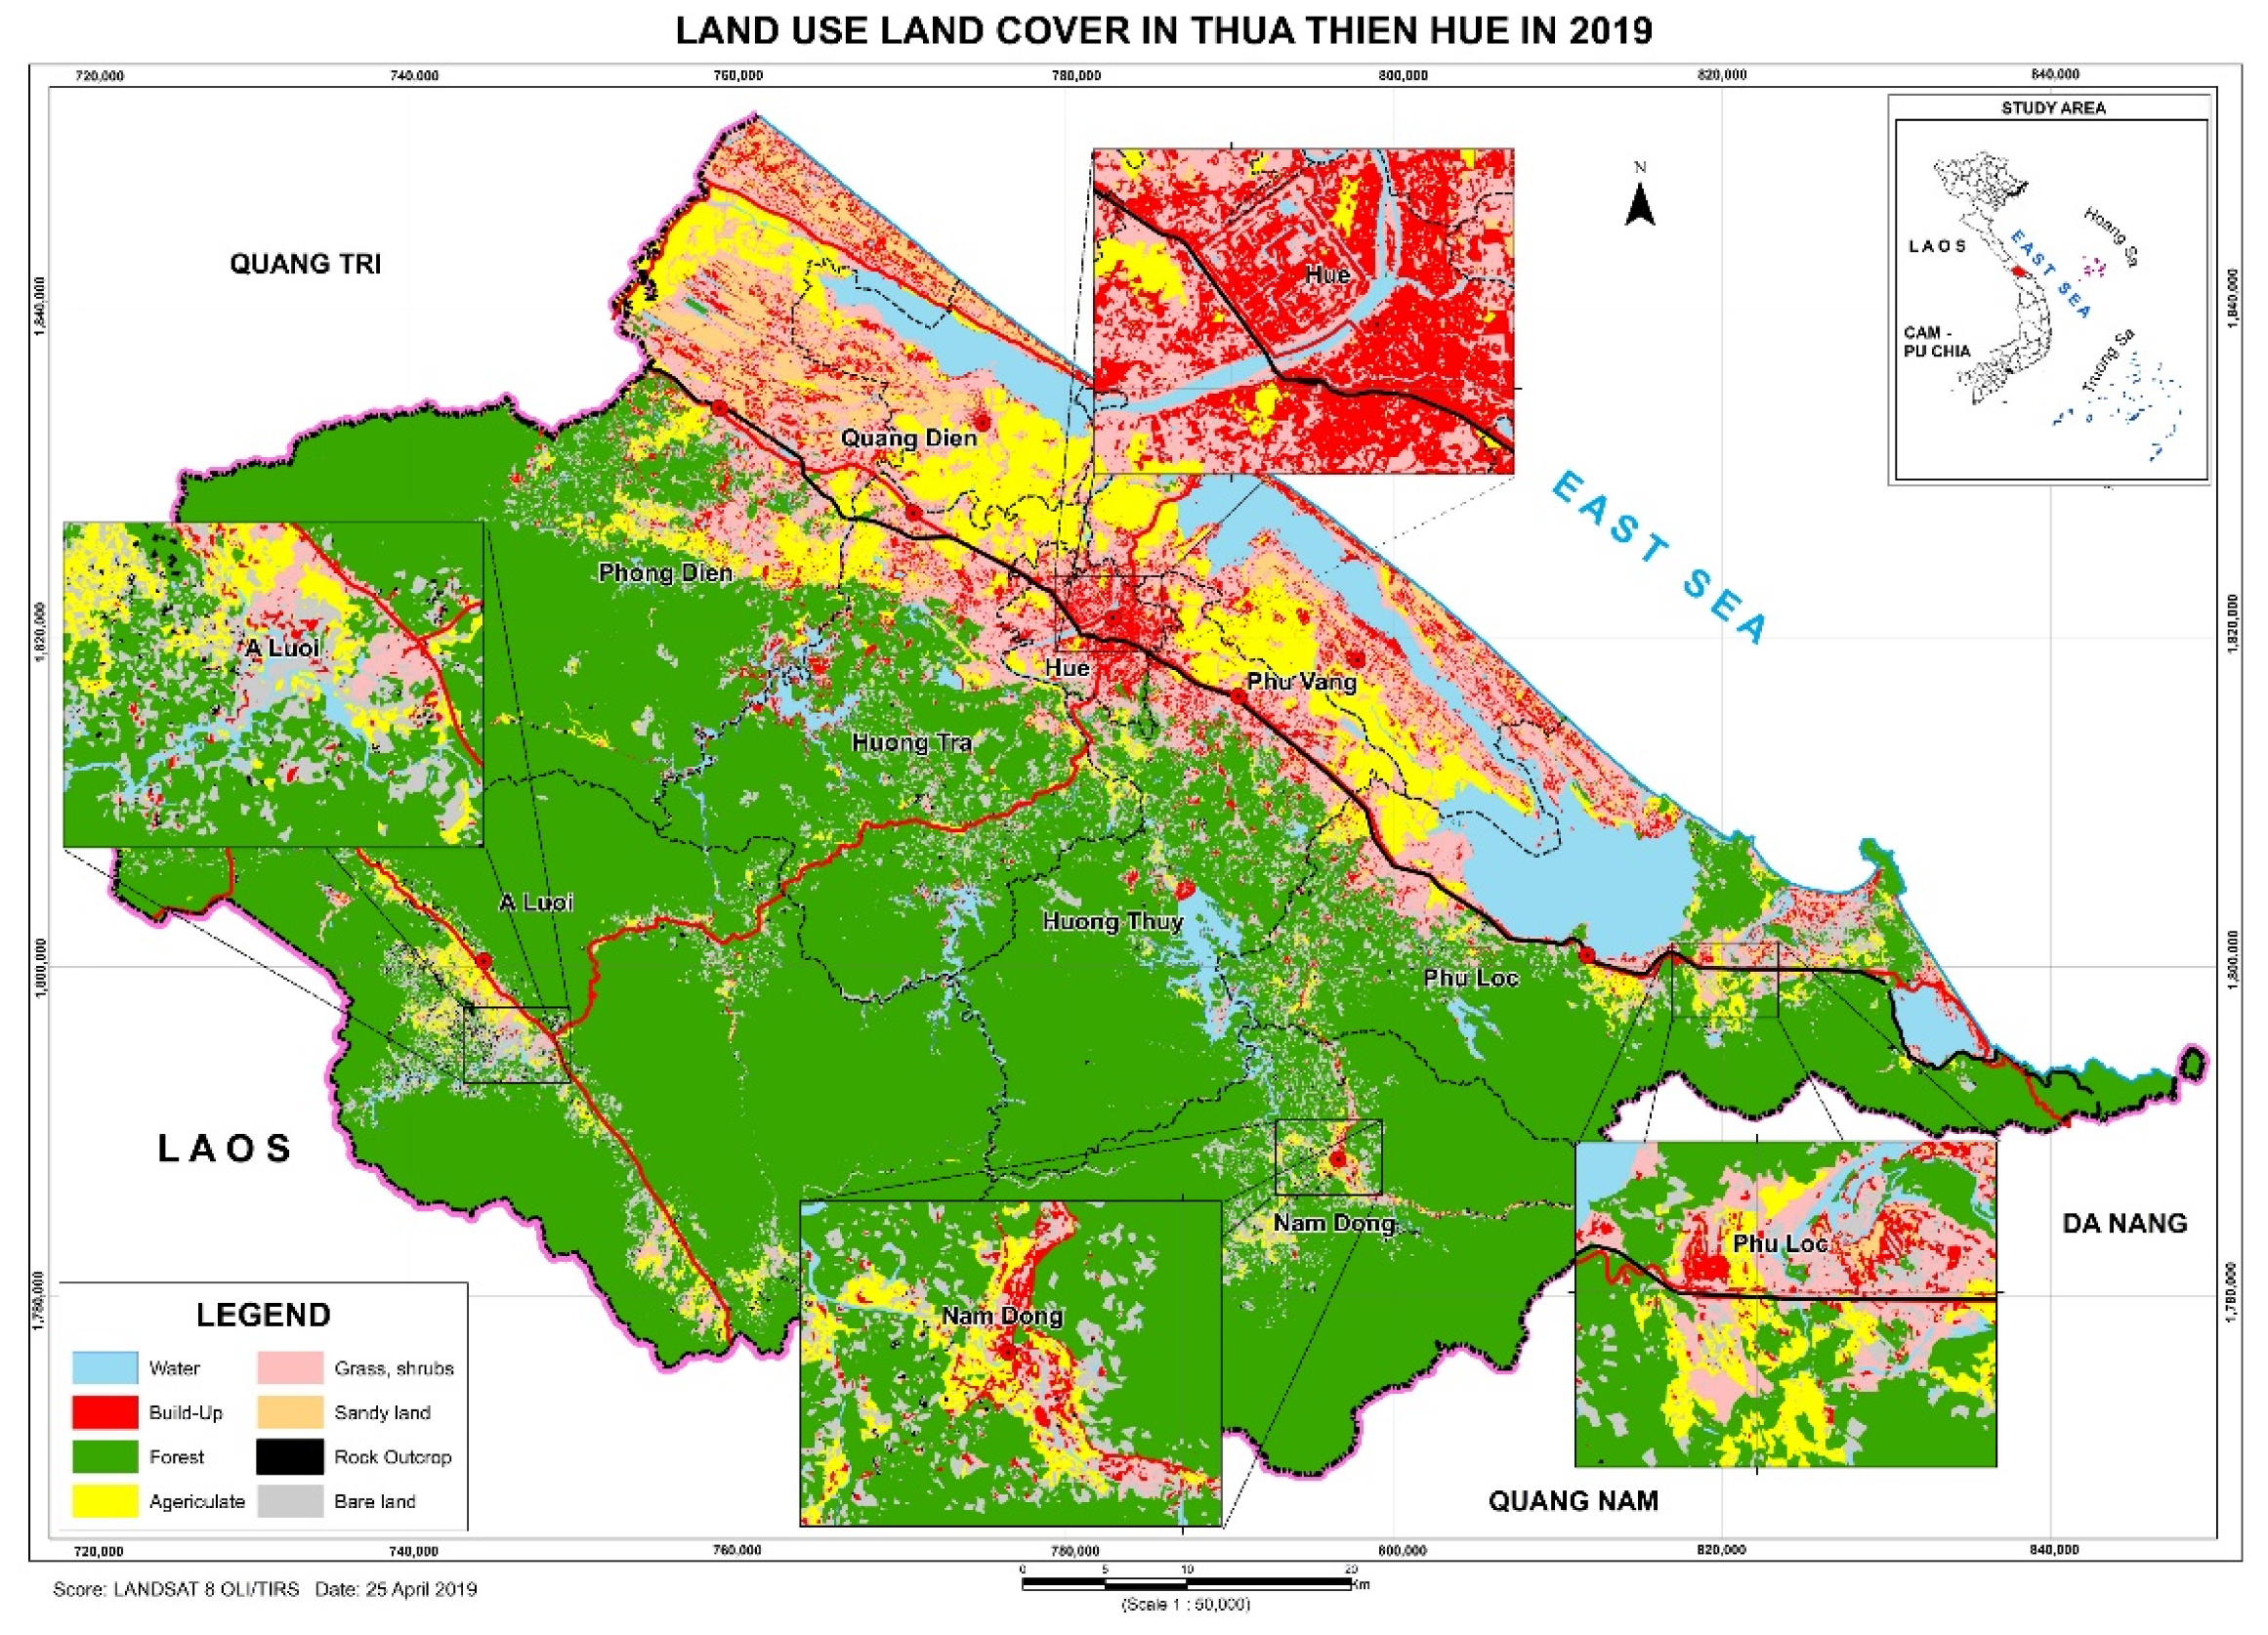
Following the research, object segmentation and extraction was performed according to the thresholds in the ratio images. The results of the interpretation of the land cover are shown in
Figure 4.
After extracting the land cover and obtaining information about the soil containing rock outcrops, the authors conducted a sampling survey and calculated the Kappa coefficient in order to evaluate the accuracy of the image interpretation results.
The classification was calculated to have an accuracy of 87%, and a Kappa coefficient = 0.85 was determined. On the basis of these results, the accuracy of the classification results were deemed to be satisfactory (defined as being not less than 75%), and the ability to classify reached a high approval level (Kappa ≥ 0.80).
Table 4 and the Kappa coefficient show that the object interpretation was correct when compared to current land use data in 2019 [
6] in terms of area and spatial distribution, which was as follows: built-up are of 33,485.66 hectares in Hue city and six nearby satellite cities, as well as 10,303.46 hectares of sandy land in Phong Dien district to Phu Loc district.
In Thua Thien Hue province, the land cover includes objects denoted as sandy land, bare land (open rock area planned for construction, deforestation land), mixed rocks, and rock outcrops. The extraction of this information is based only on NDVI, NDBI, Mean Red, Mean Blue, and Brightness. The results are a mixture of sandy and bare soil. Therefore, the decomposition of sandy and barren land objects is more clearly differentiated when using the Brightness index under different sandy and bare land property conditions.
3.2. Rock Outcrop Extraction
The results were interpreted using Ecognition software, and the accuracy was assessed by the Kappa method. The research group extracted and overlapped the rock outcrop objects. In addition, exposed rock information also appeared in areas that had not been recorded, such as the eastern area of the Phu Loc district and scattered locations throughout the province.
On the basis of the land cover interpretation results, the exposed rock layer was extracted and superimposed onto the soil map layer from the Hue GIS database, built according to the traditional method (transmission map) [
18].
The results after comparison and verification show that, out of a total of 16 cross-sectional points with rock outcrops on the traditional map, 15 points were in the interpretation image (concentrated in the A Luoi district, south east). Only one point did not interpret the rock outcrop from the remote sensing image (AL-AR 05).
The results of field verification showed that the reason for which the algebraic point AL-AR 05 did not appear as exposed rock on the interpretation results image was that the traditional soil map was developed in 2005. In agricultural cultivation, the villagers leveled and changed the surface structure in this area. Compared with database GISHue [
19], these points have exposed rocks, but they have not been added to the database, and the rate is 80.64%.
However, there are exposed rock spots in reality that cannot be extracted by the interpretation results because cover containing other objects occupies a greater area.
3.3. Soil Moisture Characteristics
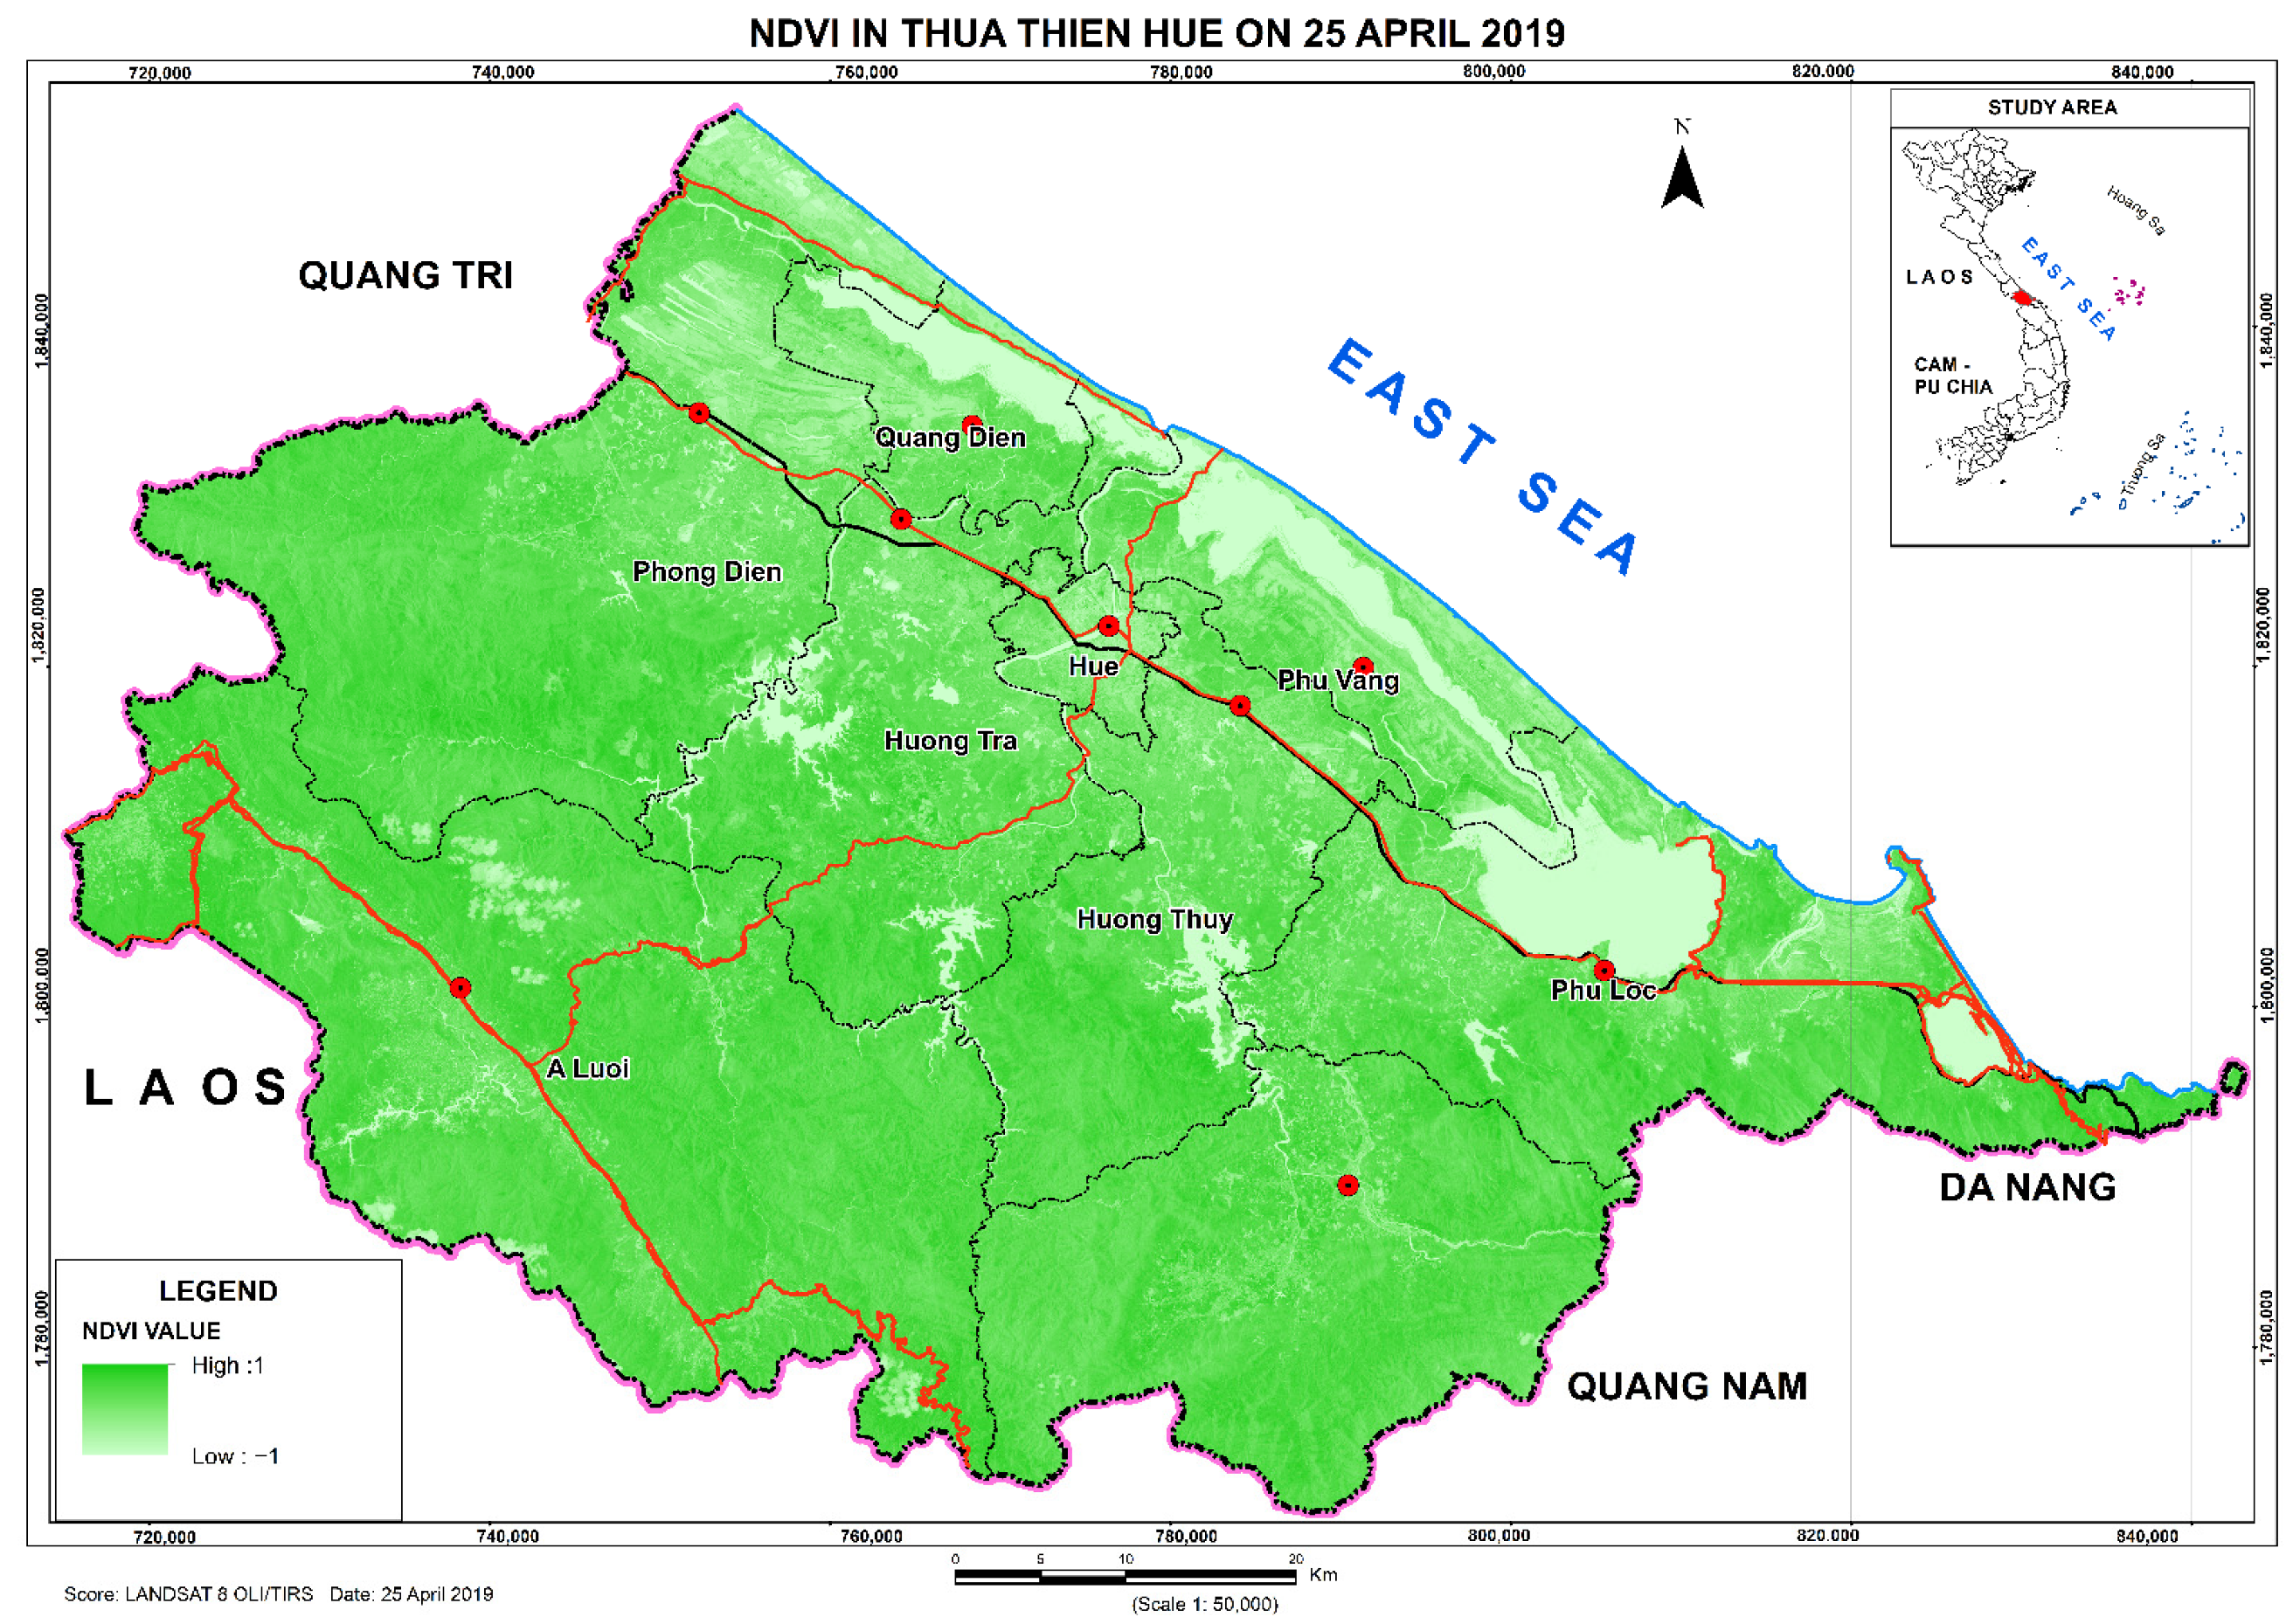
The study applied a calculation method based on the bands NIR and Red from Landsat 8 OLI/TIRS images after treatment for radiation and solar projection angle error. The results of the province’s NDVI value as of April 2019 are shown in
Figure 5.
The NDVI results had a maximum value of 0.59, concentrated in the districts Nam Dong and A Luoi. The lowest was −0.23, concentrated in the lagoon area of Tam Giang-Cau Hai.
In general, areas with high NDVI are usually areas related to agriculture; park grassland, or forestry land such as agricultural land is concentrated in plain areas or valleys such as district Quang Dien, Phu Vang; green tree land and grass cover are distributed in sand dunes stretching from Phong Dien to Phu Loc, and scattered in urban areas; forest land is concentrated in the western region of Thua Thien Hue province, in the area of Bach Ma National Park.
However, areas with low NDVI are concentrated in areas with a high density of urban facilities, especially in Hue city and the surrounding satellite towns.
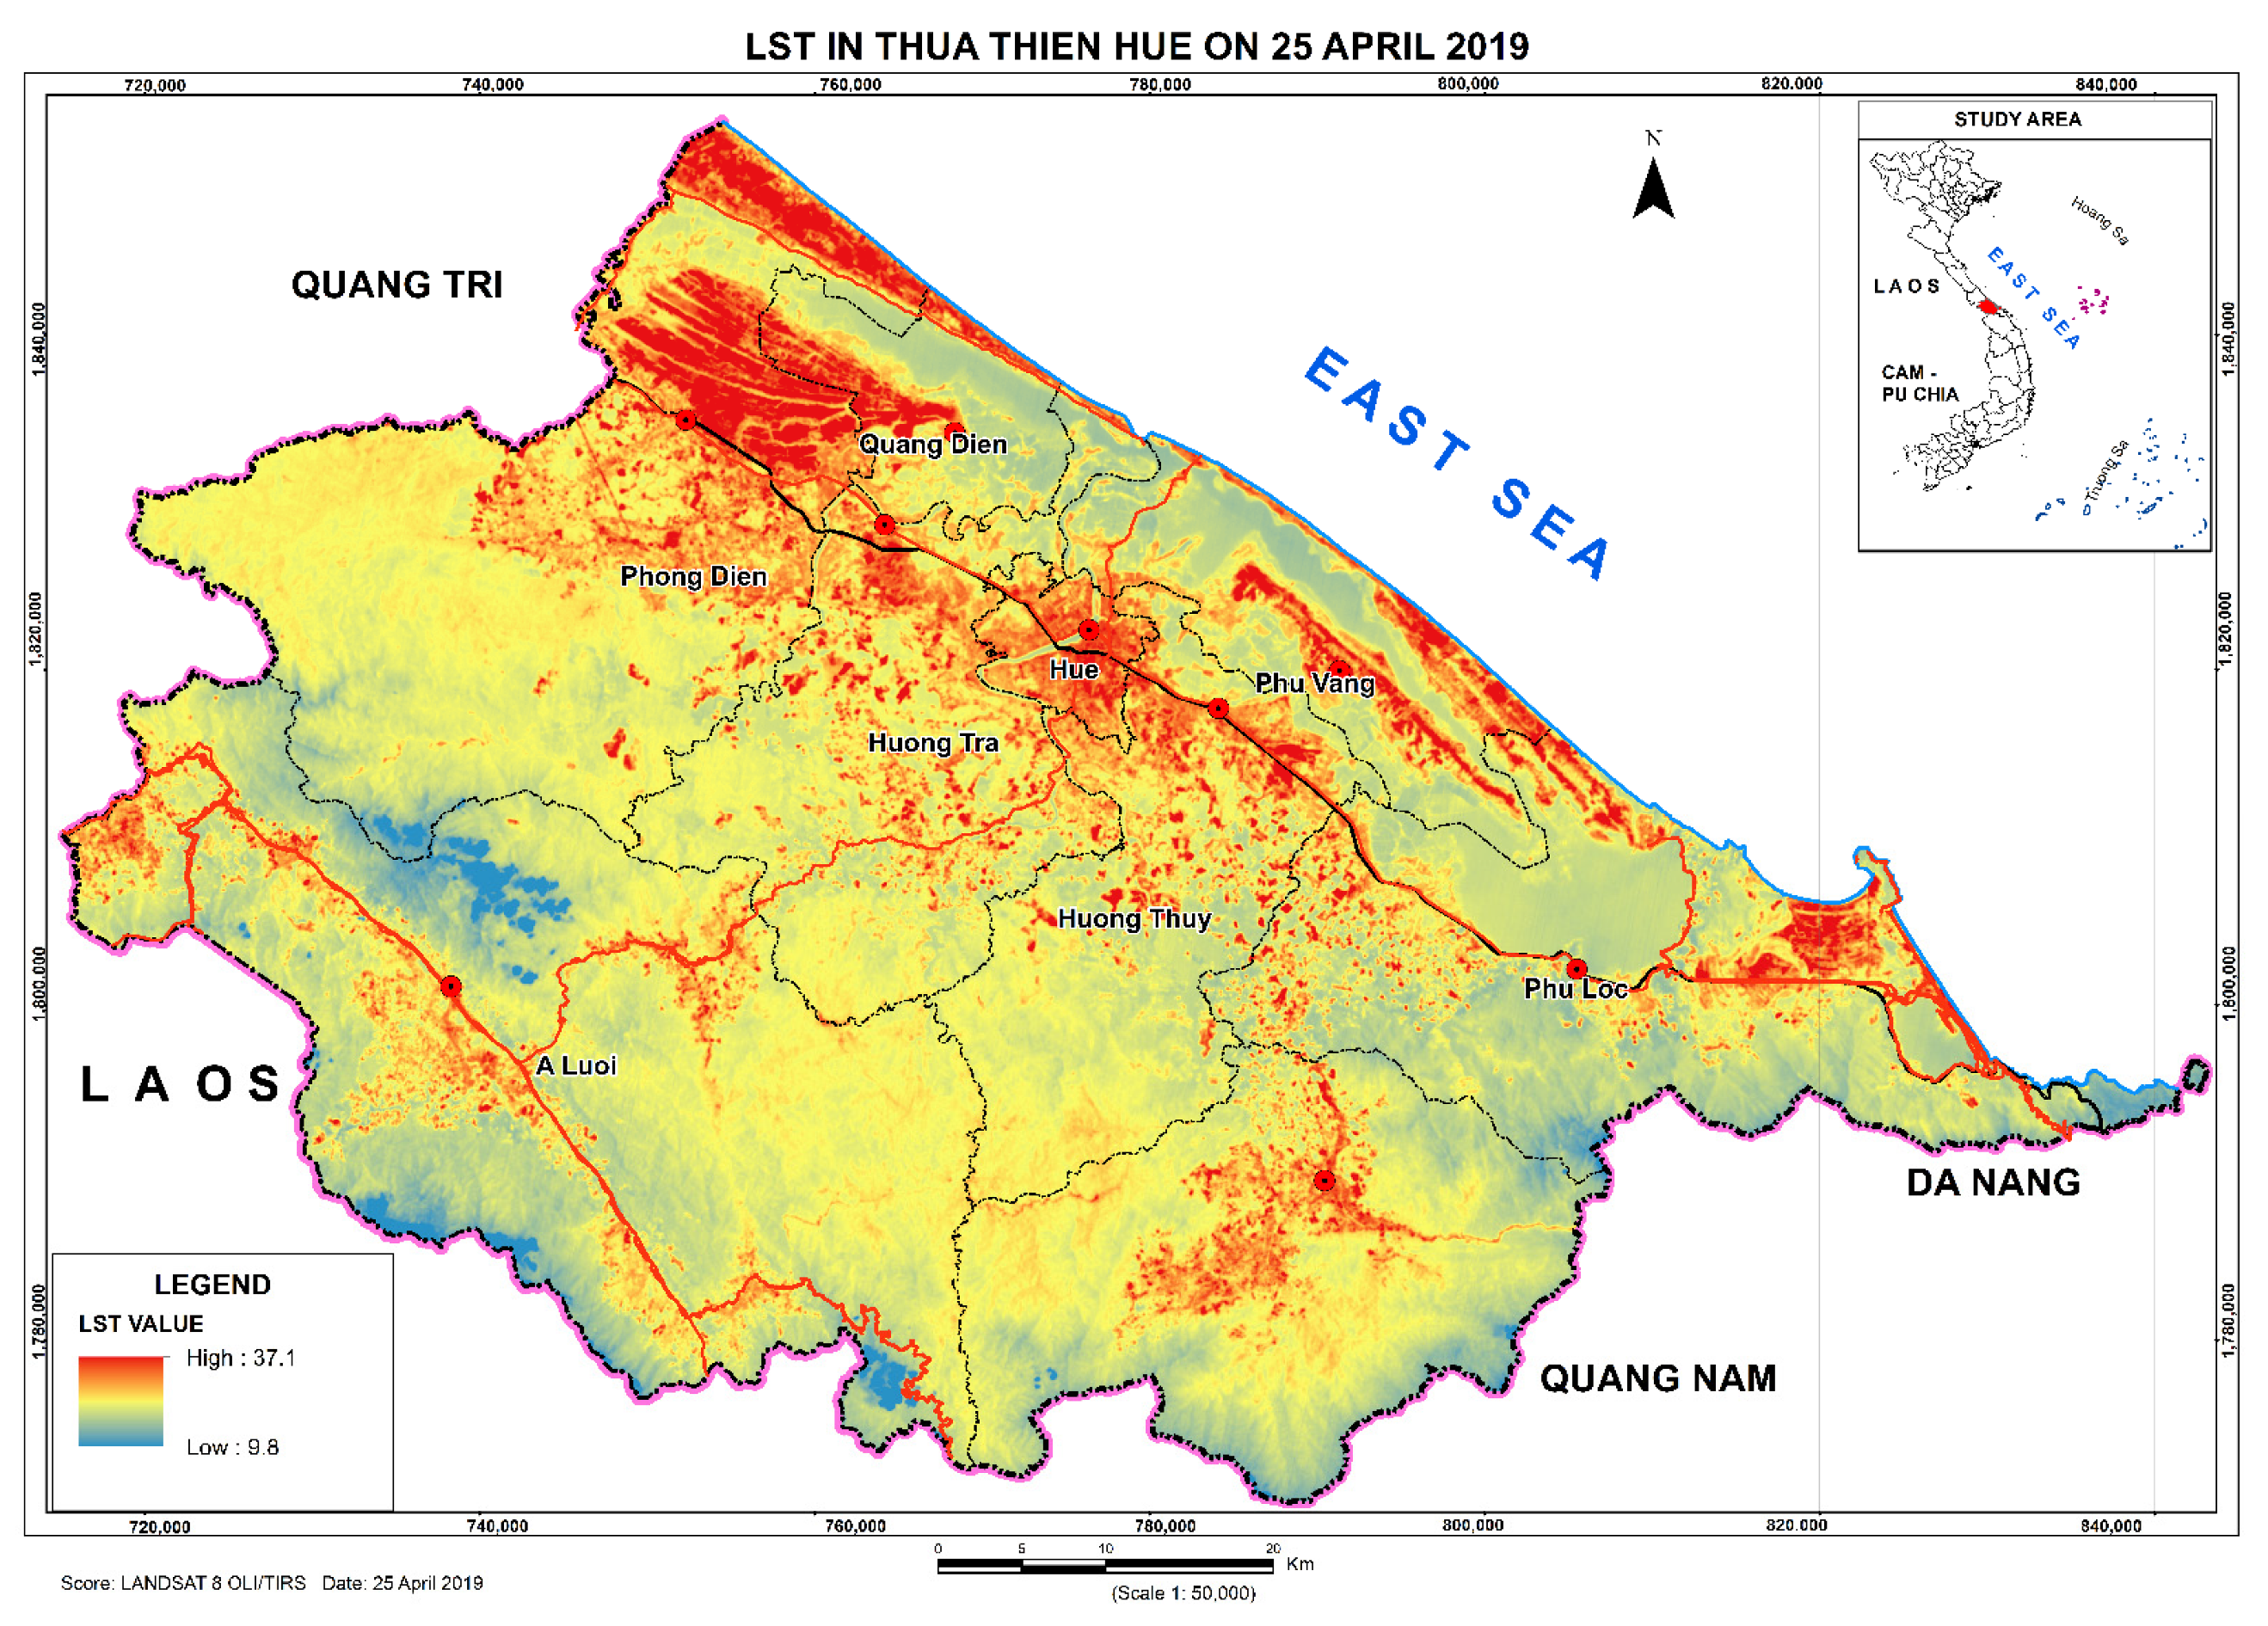
The calculated surface temperature of the province during the dry season corresponds to the time of the photo taken on 25 April 2019. The two thermal channels in Landsat 8 TIRS are bands 10 and 11, with a resolution of 30 m.
Digital pixel value DN (digital number) is the value of pixels stored in a digital format. The Lλ value is the energy value absorbed by surface objects and then absorbed into the atmosphere. The calculation process converts the DN value to the Lλ value for Landsat 8 OLI/TIRS data, calculated on the basis of the standard spectral radiation values LMINλ, LMAXλ, QCALMAX, obtained from the metadata of the Landsat 8 OLI/TIRS image. Radiation correction parameters on the Landsat 8 image were used to convert the formulas.
The spectral radiated energy values of image bands 10 and 11 (
Table 5) were calculated using the Raster Calculator tool using two expressions:
Then, radiation correction was performed, with the correction constants K1 and K2 being looked up in the Landsat 8 OLI/TIRS metadata file to calculate the surface temperature at the sensor (TB) (
Table 6).
Calculation results show that the surface temperature extracted for Thua Thien Hue province was in the lowest range of 10 °C to 17 °C, while the highest was in the range 30 °C to 37 °C.
After extracting the NDVI (
Figure 6) data and LST (
Figure 7), a linear NDVI/LST line analysis was performed to evaluate the association between moisture and NDVI and LST. The following are the results of the correlation analysis for the system of equations:
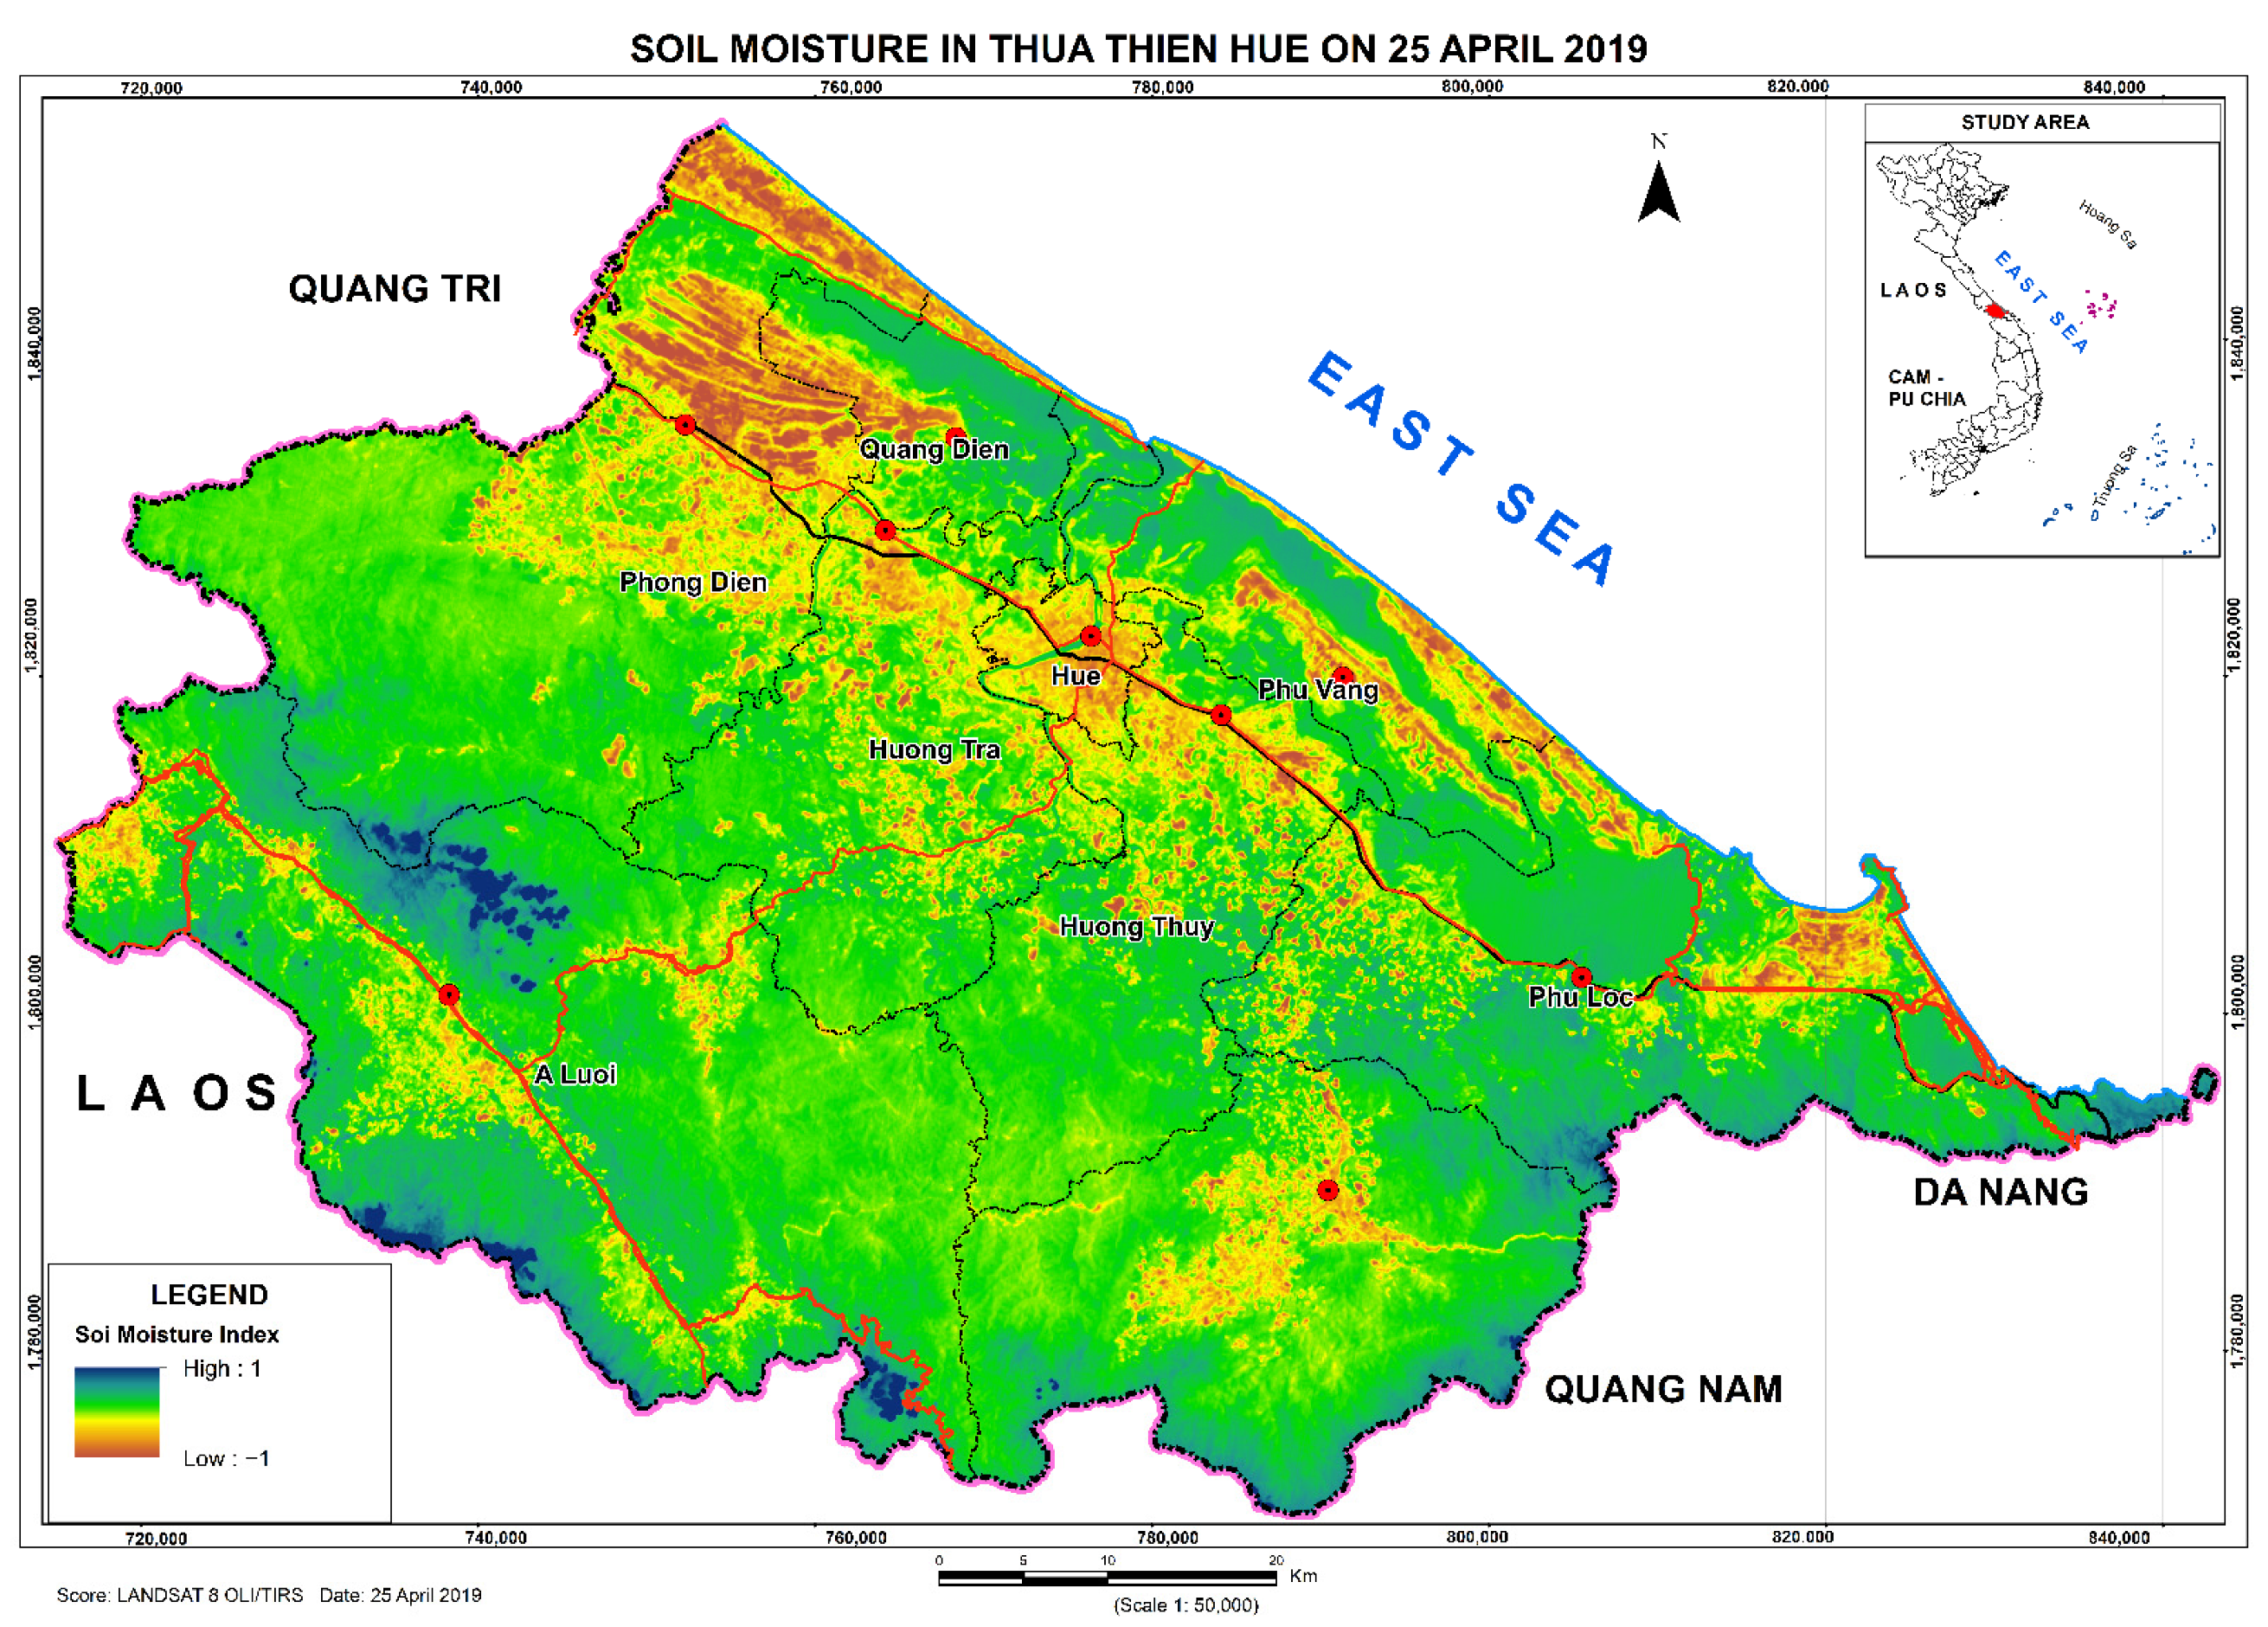
From the above equation, combined with the Formulas (9) and (10), we calculated the SMI index. The calculated moisture values clearly differentiated each of the areas in Thua Thien Hue province. Low humidity indexes appeared in coastal sandy areas, urban areas, and concentrated populations. Areas with high vegetation density or relative altitude had high moisture values, such as the Bach Ma mountain area and the A Luoi region (
Figure 8).
4. Discussion
The object-oriented classification approach resulted in high accuracy; the interpretation results were very informative and precise for each object when automatically retrieved. The results obtained using this method had an accuracy of 87%.
It is clear from this study that the interpretation of rock outcrops involves difficult-to-extract material, which was studied and tested in the present study. The kappa index of 0.85 and the overlap of 15/18 profiles measured using conventional processes, as well as the individual survey points, confirmed the effectiveness of the proposed method for interpreting the distribution of exposed rock regions (
Table 7).
The researchers analyzed 47 points containing exposed rock in Thua Thien Hue province to achieve the results, which were checked, obtaining a kappa index of 88.87%. The field surveys were able to verify 40/47 points, with a precise percentage of 85.10% (
Table 8).
Information on soil surface moisture was calculated using a −1–1 scale; the nearer the highest value is to one, the higher the humidity. Additionally, vacant land is low in humidity in Hue city, Phu Loc district, Huong Tra city, and coastal sandy areas.
Through the research process, the authors drew the following conclusions:
The object-oriented classification approach has high accuracy; the interpretation results are very informative and precise for each object when automatically retrieved with a significant accuracy of 87%.
It is clear from this study that the interpretation of rock outcrops involves difficult-to-extract material, as studied and tested in this research. The kappa index of 0.85, the overlap of 15/18 profiles measured using the conventional process, and the individual survey points confirmed the effectiveness of the proposed method for interpreting the distribution of exposed rock regions. The researchers analyzed 47 points containing exposed rock around Thua Thien Hue province to achieve the results, which were validated a kappa index of 88.87%. The field surveys verified 40/47 points, and the precise percentage was 85.10%.
In terms of analysis methods, data retrieval must be paired with other metrics to distinguish the subjects covered, such as:
- +
Mean Brightness boosts the spectral value’s luminosity, making it suitable for eliminating sandy topsoil, particularly in coastal areas like Thua Thien Hue province.
- +
Using only NDBI and Mean Blue, the spectral reflectance ratios of floating sediment and water surfaces are evident. They are more visible in building works and empty land areas. Using the Mean Brightness and Mean Blue channels to distinguish building ground and bare land excludes exposed rock resulting from ongoing construction.
- +
Since Hue city has a high density of green trees combined with urban facilities, the NDBI index distinguished between building sites and barren ground.
- +
The data obtained above, such as the soil moisture data studied and presented, can be applied for a variety of other helpful measurement issues.
5. Conclusions
The use of Landsat-8 imagery to extract rock outcrops using the OBOC method and index images was examined. The analysis found that the accessibility of remote sensing data sources makes it easier to conduct preliminary studies to analyze surface objects.
The overall accuracy of rock outcrop objects from Landsat-8 images was >87%. The information extraction of built-up land, bare ground, and specifically exposed rocks differed substantially from the image bands and index image values.
One of the essential aspects in retrieving outcrop information from remote sensing data in this paper is the TGSI index. TGSI is recommended for bare land identification, particularly for cases in which rock outcrops are tiny objects that are difficult to detect with other ratio pictures in mountainous areas.
Furthermore, Mean Brightness boosts the spectral value’s luminosity, making it ideal for removing sandy topsoil, particularly in coastal areas like Thua Thien Hue province. Using only NDBI and Mean Blue, the spectral reflectance ratios of floating sediment and water surfaces are evident. It is more visible in building works and empty land areas. Using the Luminosity, Mean Brightness and Mean Blue channels to distinguish building ground and bare land excludes exposed rock resulting from ongoing construction.
Since Hue city has a high density of green trees combined with urban facilities, the NDBI index distinguishes between building sites and barren ground. The data obtained above, such as the soil moisture data studied and presented here, can be applied to various other helpful measurement issues.
Author Contributions
Conceptualization, T.-V.H.; Data curation, T.-V.H. and Y.-M.F.; Formal analysis, T.-V.H., C.-T.W. and H.V.H.; Funding acquisition, T.-Y.C., T.-V.H. and C.-Y.M.; Investigation, Y.-M.F. and C.-Y.M.; Methodology, T.-V.H., C.-T.W., N.Q.T. and D.T.V.H.; Project administration, N.Q.T.; Resources, T.-V.H. and D.T.V.H.; Software, T.-V.H., C.-T.W. and H.V.H.; Supervision, T.-V.H. and T.-Y.C.; Validation, T.-V.H., D.T.V.H. and D.N.N.P.; Visualization, T.-V.H., H.V.H. and D.N.N.P.; Writing—original draft, T.-V.H. and N.Q.T.; Writing—review and editing, T.-V.H. and T.-Y.C. All authors have read and agreed to the published version of the manuscript.
Funding
This research received no external funding.
Acknowledgments
We acknowledge the Geographic Information Research Center for their valuable comments and support.
Conflicts of Interest
The authors confirm that there is no conflict of interest.
References
- Cataldo, E.; Fucile, M.; Mattii, G.B. A Review: Soil Management, Sustainable Strategies and Approaches to Improve the Quality of Modern Viticulture. Agronomy 2021, 11, 2359. [Google Scholar] [CrossRef]
- Furey, G.N.; Tilman, D. Plant biodiversity and the regeneration of soil fertility. Proc. Natl. Acad. Sci. USA 2021, 118, e2111321118. [Google Scholar] [CrossRef] [PubMed]
- People’s Committee of Thua Thien Hue Province. Socio-Economic Situation of Thua Thien Hue Province in 2019; Report No. 368/BC-UBND; Signed on 31 December 2019; People’s Committee of Thua Thien Hue Province: Hue, Vietnam, 2019. (In Vietnamese)
- Djenaliev, A.; Hellwich, O. Extraction of built-up areas from Landsat imagery using the object-oriented classification method. In Proceedings of the 9th International Symposium on Applied Informatics and Related Areas, Székesfehérvár, Hungary, 3–26 November 2014; pp. 156–161. [Google Scholar] [CrossRef] [Green Version]
- Pham, L.T.; Nguyen, S.P.; Nguyen, N.V.; Van Dao, H.; Doan, L.D.; Vo, N.H.T.; Nguyen, T.T.T.; Van Tran, H. Establishment of land cover map using object-oriented classification method for VNREDSat-1 data. J. Min. Earth Sci. 2020, 61, 134–144. [Google Scholar] [CrossRef]
- Suryawanshi, S.L.; Abuj, M.D.; Bhandare, S.B. Generation of soil map using remote sensing and geographic information system for Malegaon watershed in Maharastra. Int. J. Agric. Eng. 2008, 1, 38–40. Available online: www.researchjournal.co.in/online (accessed on 14 May 2022).
- Zha, Y.; Gao, J.; Ni, S. Use of Normalized Difference Built-Up Index in Automatically Mapping Urban Areas from TM Imagery. Int. J. Remote Sens. 2003, 24, 583–594. [Google Scholar] [CrossRef]
- Christopher, D.E.; Ronald, J.P.L. Influence of Rock-Soil spectral variantion on the assessment of green biomass. J. Remote Sens. Environ. 1985, 17, 265–279. [Google Scholar] [CrossRef]
- Yue, Y.; Wang, K.; Liu, B.; Li, R.; Zhang, B.; Chen, H.; Zhang, M. Development of new remote sensing methods for mapping green vegetation and exposed bedrock fractions within heterogeneous landscapes. Int. J. Remote Sens. 2013, 34, 5136–5153. [Google Scholar] [CrossRef]
- Barredo, C.J.I. Sistemas de Informacio’ Fica y Evaluation Multicriaterio en la Ordenacio’ n Delterritorio; Editorial RA-MA: Madrid, Spain, 1996; 310p. [Google Scholar]
- Lamchin, M.; Lee, J.-Y.; Lee, W.-K.; Lee, E.J.; Kim, M.; Lim, C.-H.; Choi, H.-A.; Kim, S.-R. Assessment of Land Cover change and Desertification using Remote Sensing Technology in a local region of Mongolia. Adv. Space Res. 2016, 57, 64–77. [Google Scholar] [CrossRef]
- Xiao, J.; Shen, Y.; Tateishi, R. Mapping Topsoil Texture in the Arid and Semiarid Region of Asia using Remote Sensing Data. In Proceedings of the 2006 IEEE International Symposium on Geoscience and Remote Sensing, Denver, CO, USA, 31 July–4 August 2006; pp. 2428–2431. [Google Scholar] [CrossRef]
- Weng, Q.; Lu, D.; Schubring, J. Estimation of land surface temperature–vegetation abundance relationship for urban heat island studies. Remote Sens. Environ. 2004, 89, 467–483. [Google Scholar] [CrossRef]
- Chung, D.M. Application of Ultra-High-Frequency Spectrometer to Study the Natural Emission Spectrum According to the Biological Development Cycle of Wet Rice Fields, as a Basis for Evaluating the Yield of Some Popular Rice Varieties in the Northern Delta; Kim Dong: Hanoi City, Vietnam, 2011. (In Vietnamese) [Google Scholar]
- Rouse, J.W.; Haas, R.H.; Schell, J.A.; Deering, D.W. Monitoring Vegetation Systems in the Great Plains with ERTS. In Proceedings of the Third ERTS Symposium, Washington, DC, USA, 10–14 December 1973; pp. 309–317. [Google Scholar]
- Parida, B.R.; Collado, W.B.; Borah, R.; Hazarika, M.K.; Samarakoon, L. Drought-Prone Areas of Rice Agriculture Using a MODIS-Derived Soil Moisture Index. GIsci. Remote Sens. 2008, 45, 109–129. [Google Scholar] [CrossRef]
- Zheng, W.; Zeng, Z.Y. A Review on Methods of Atmospheric Correction for Remote Sensing Images. J. Remote Sens. Inf. 2004, 4, 66–70. [Google Scholar]
- Van Cu, N. Report on the Results of the Project: Basic Investigation and Synthesis of Orientation Reports on Natural Conditions and Natural Resources in Districts of Thua Thien Hue Province; Institute of Geography: Hanoi, Vietnam, 2003. (In Vietnamese) [Google Scholar]
- Potić, I.; Bugarski, M.; Matić-Varenica, J. Soil Moisture Determination Using Remote Sensing Data for the Property Protection and Increase of Agriculture Production. In Proceedings of the 2017 Annual World Bank Conference on Land and Poverty, Washington, DC, USA, 20–24 March 2017. [Google Scholar] [CrossRef]
| Publisher’s Note: MDPI stays neutral with regard to jurisdictional claims in published maps and institutional affiliations. |
© 2022 by the authors. Licensee MDPI, Basel, Switzerland. This article is an open access article distributed under the terms and conditions of the Creative Commons Attribution (CC BY) license (https://creativecommons.org/licenses/by/4.0/).


 ,
, 


