
Spatiotemporal Dynamics of Terrestrial Vegetation and Its Driver Analysis over Southwest China from 1982 to 2015

 , ,
, ,
Abstract
:
1. Introduction
2. Materials and Methods
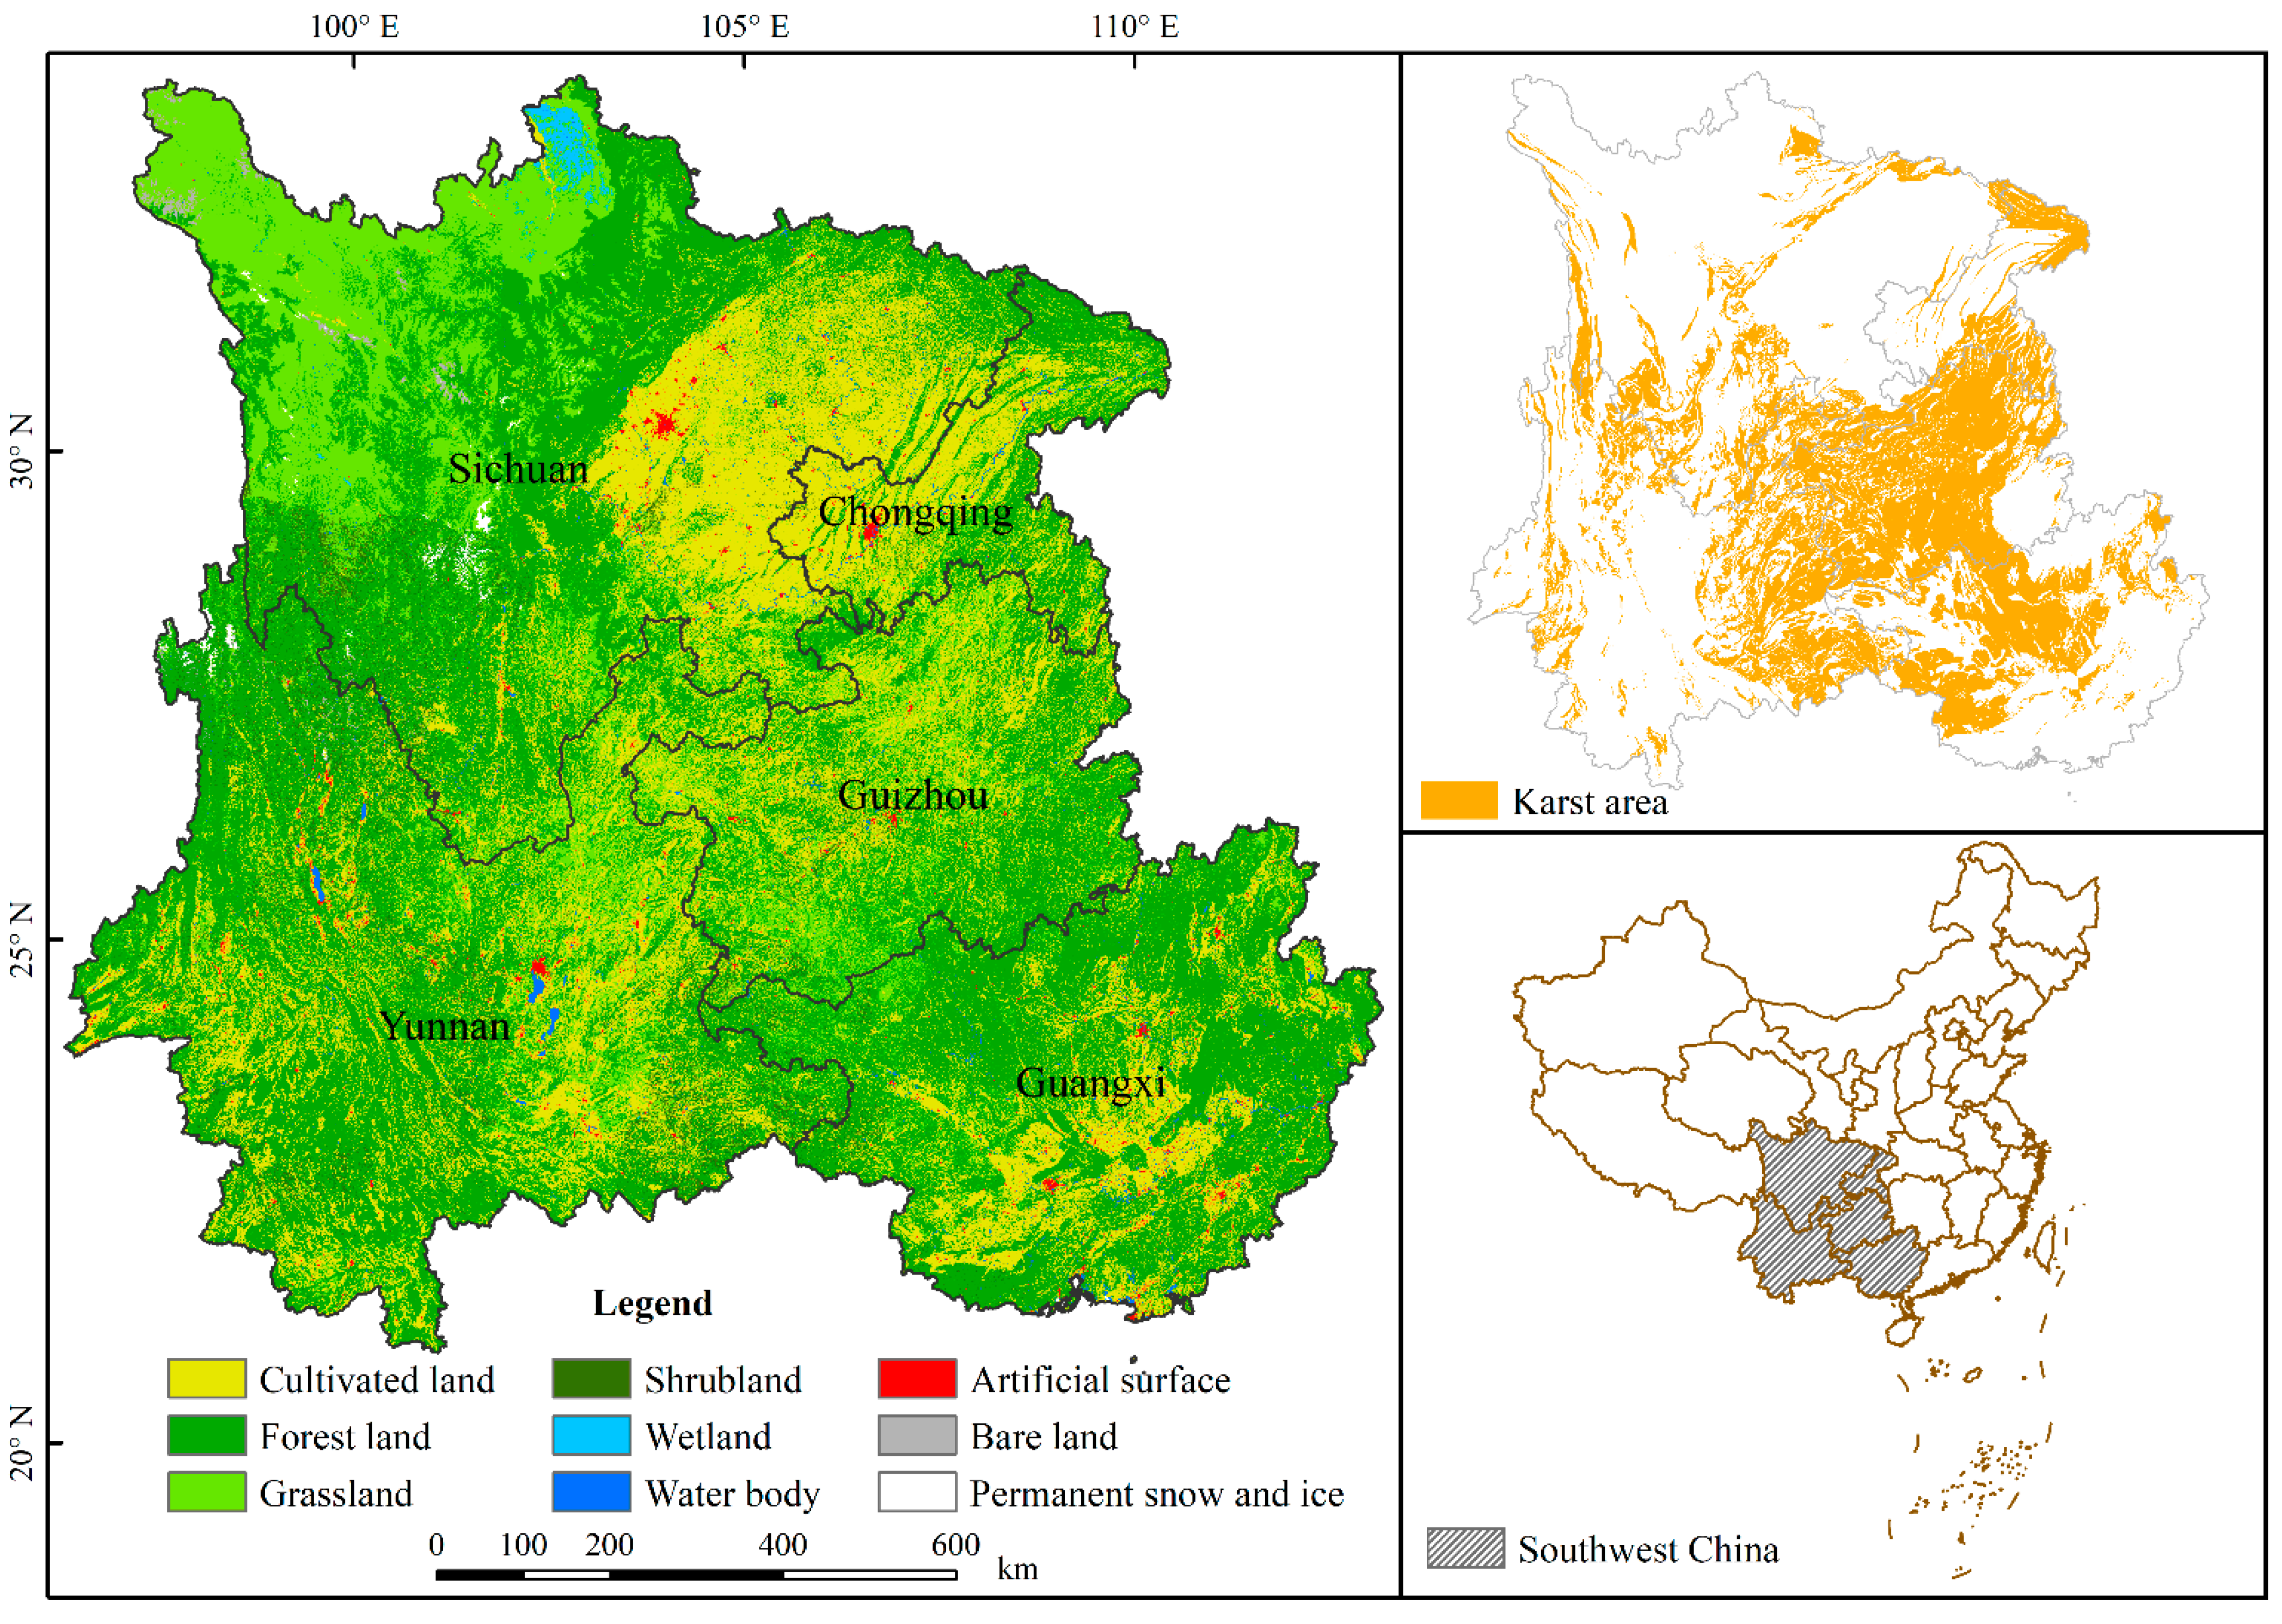
2.1. Study Area
2.2. Data Sets
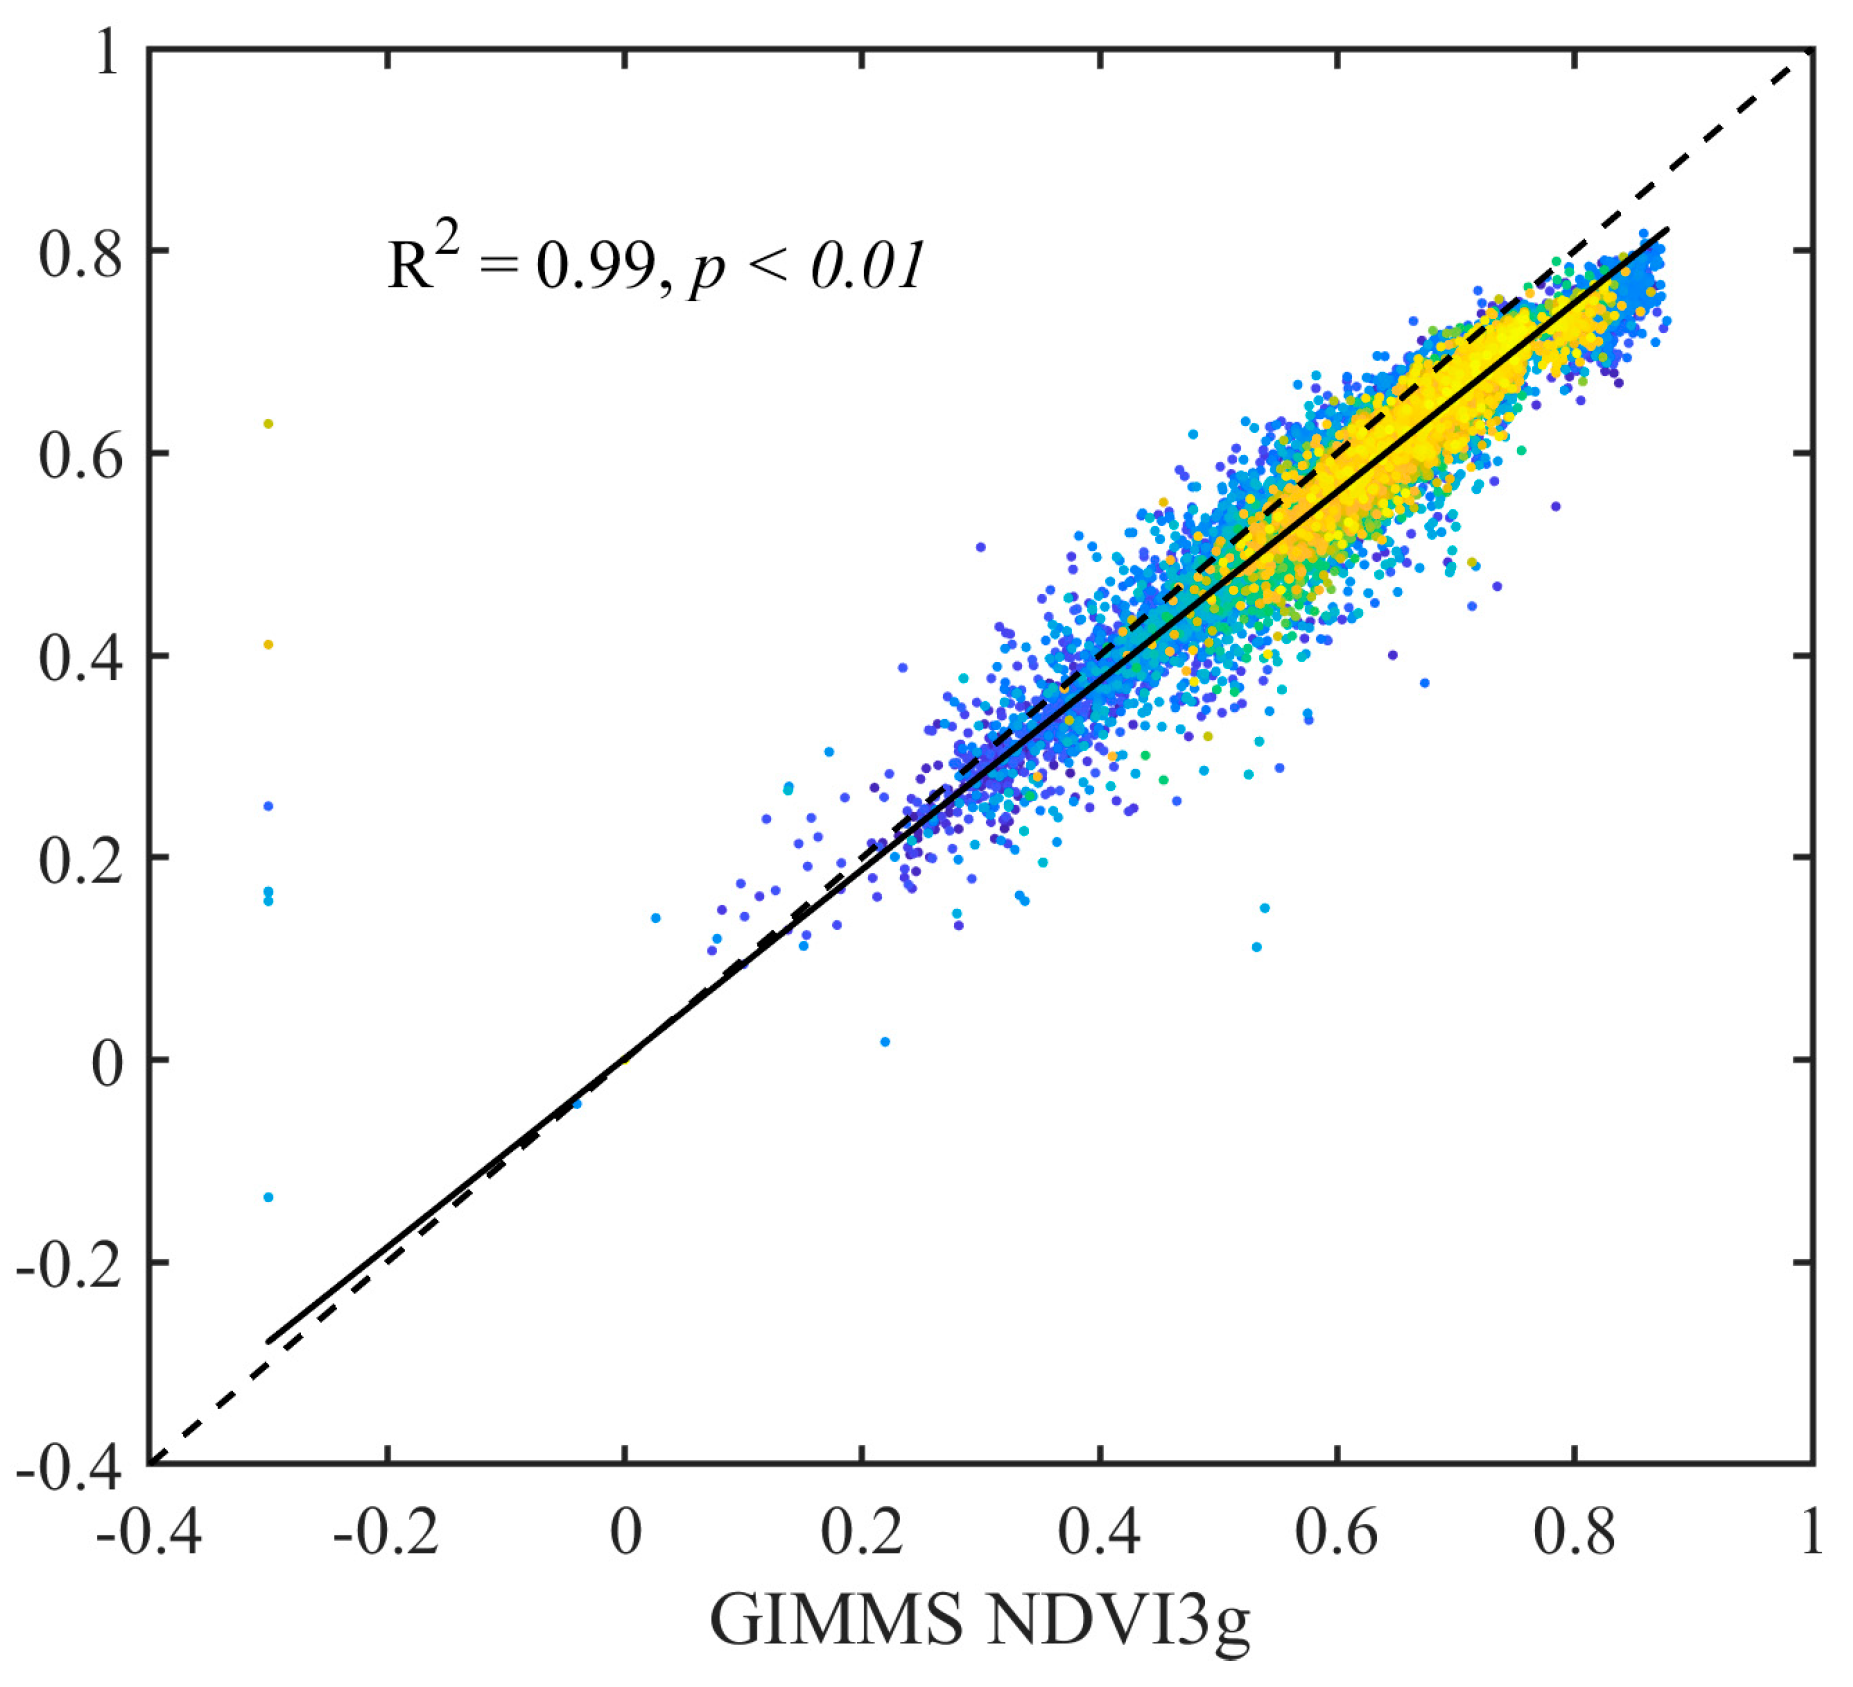
2.2.1. AVHRR GIMMS NDVI3g Data
2.2.2. Meteorological Data
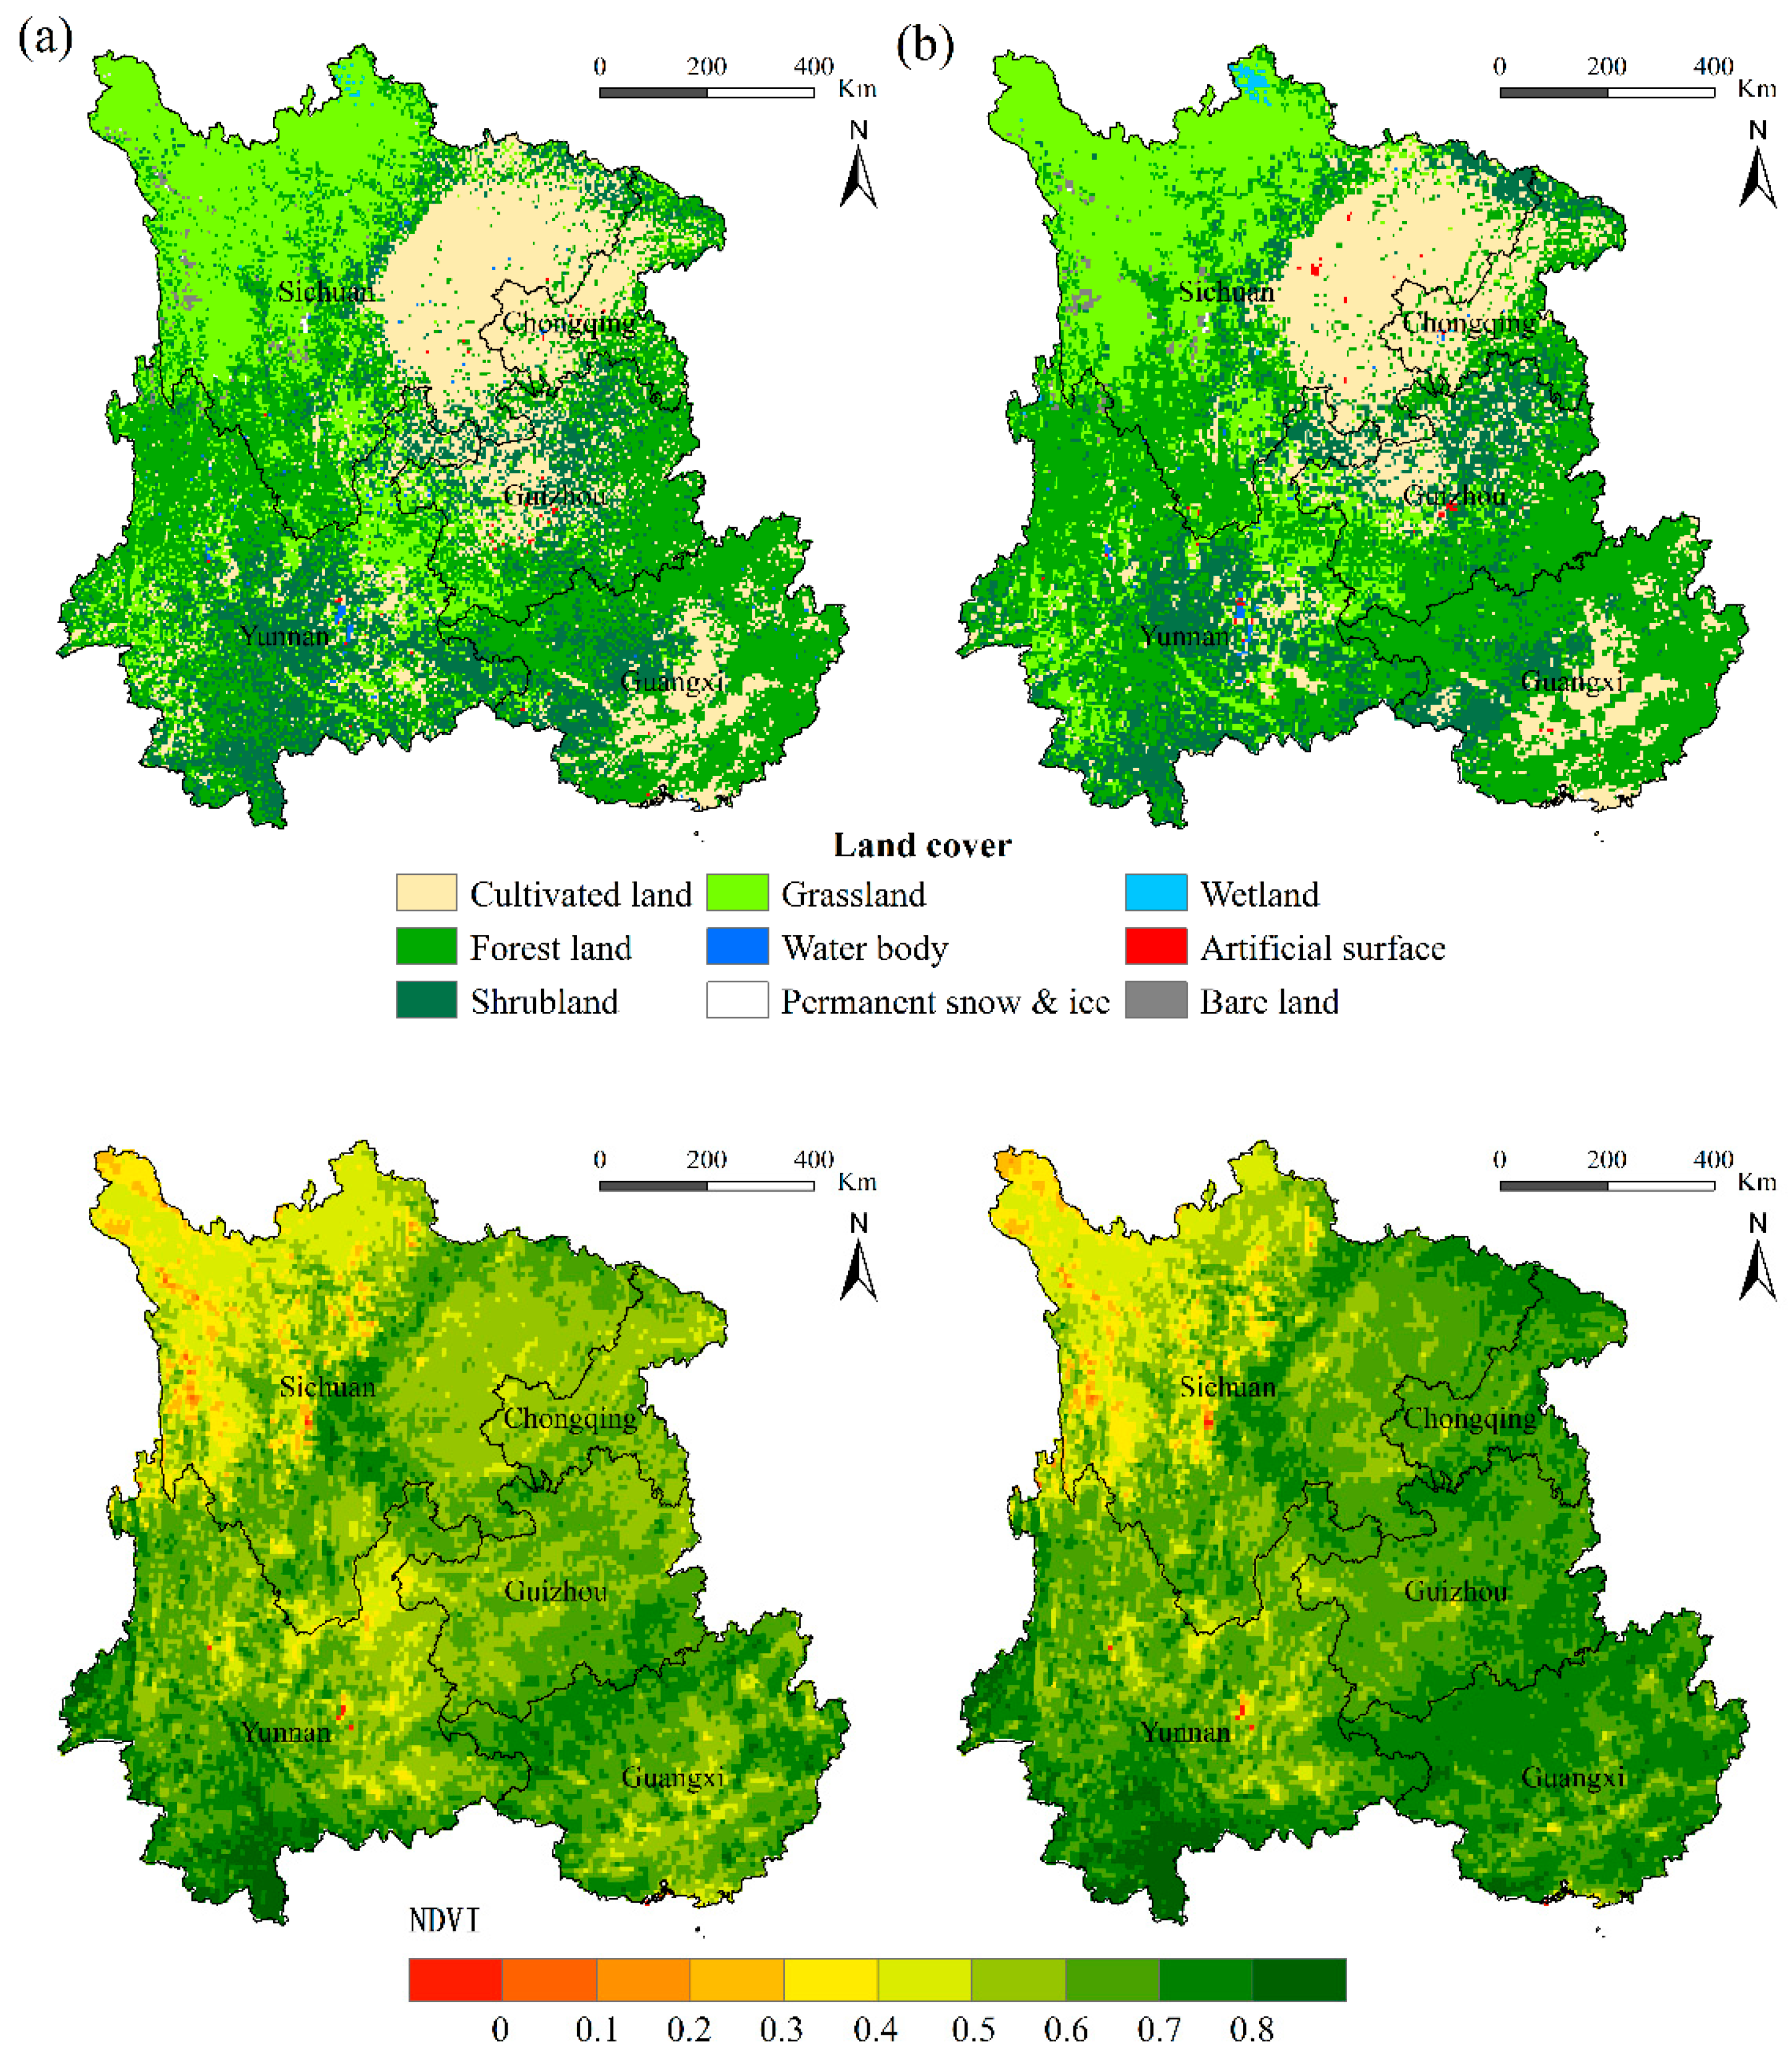
2.2.3. Land Cover Data
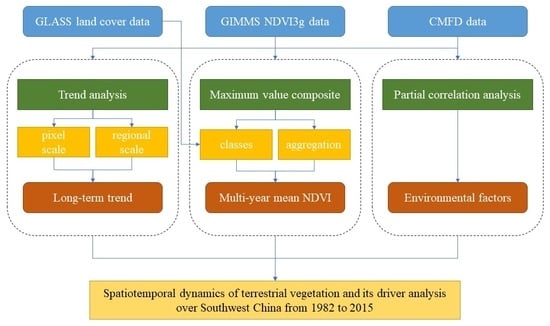
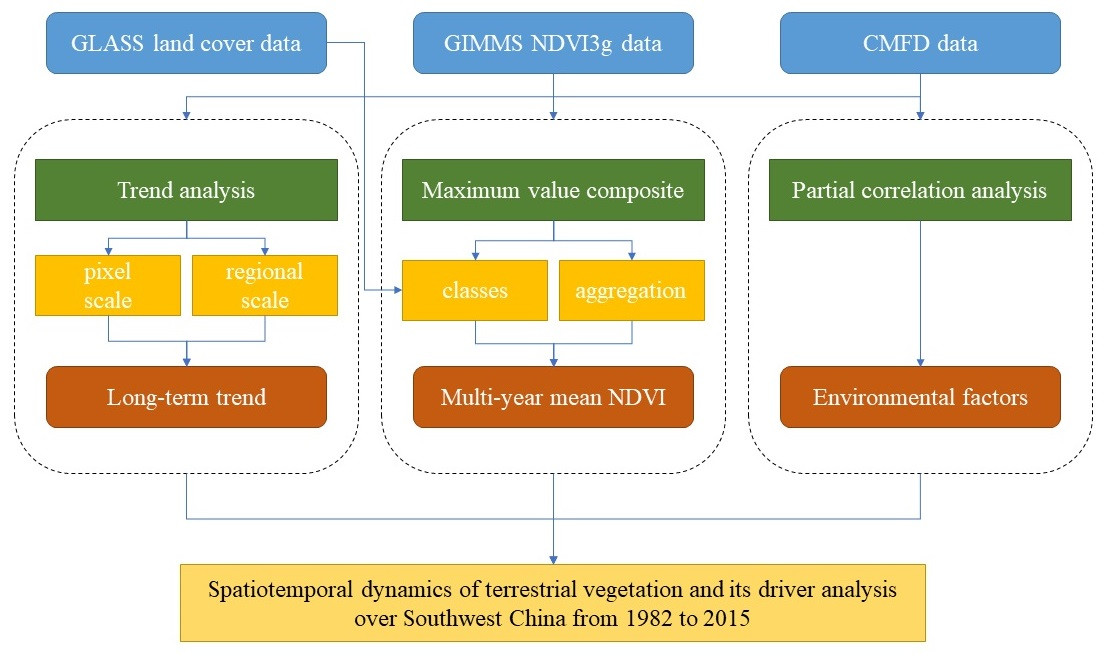
2.3. Analysis
2.3.1. Data Preprocess
2.3.2. Trend Analysis
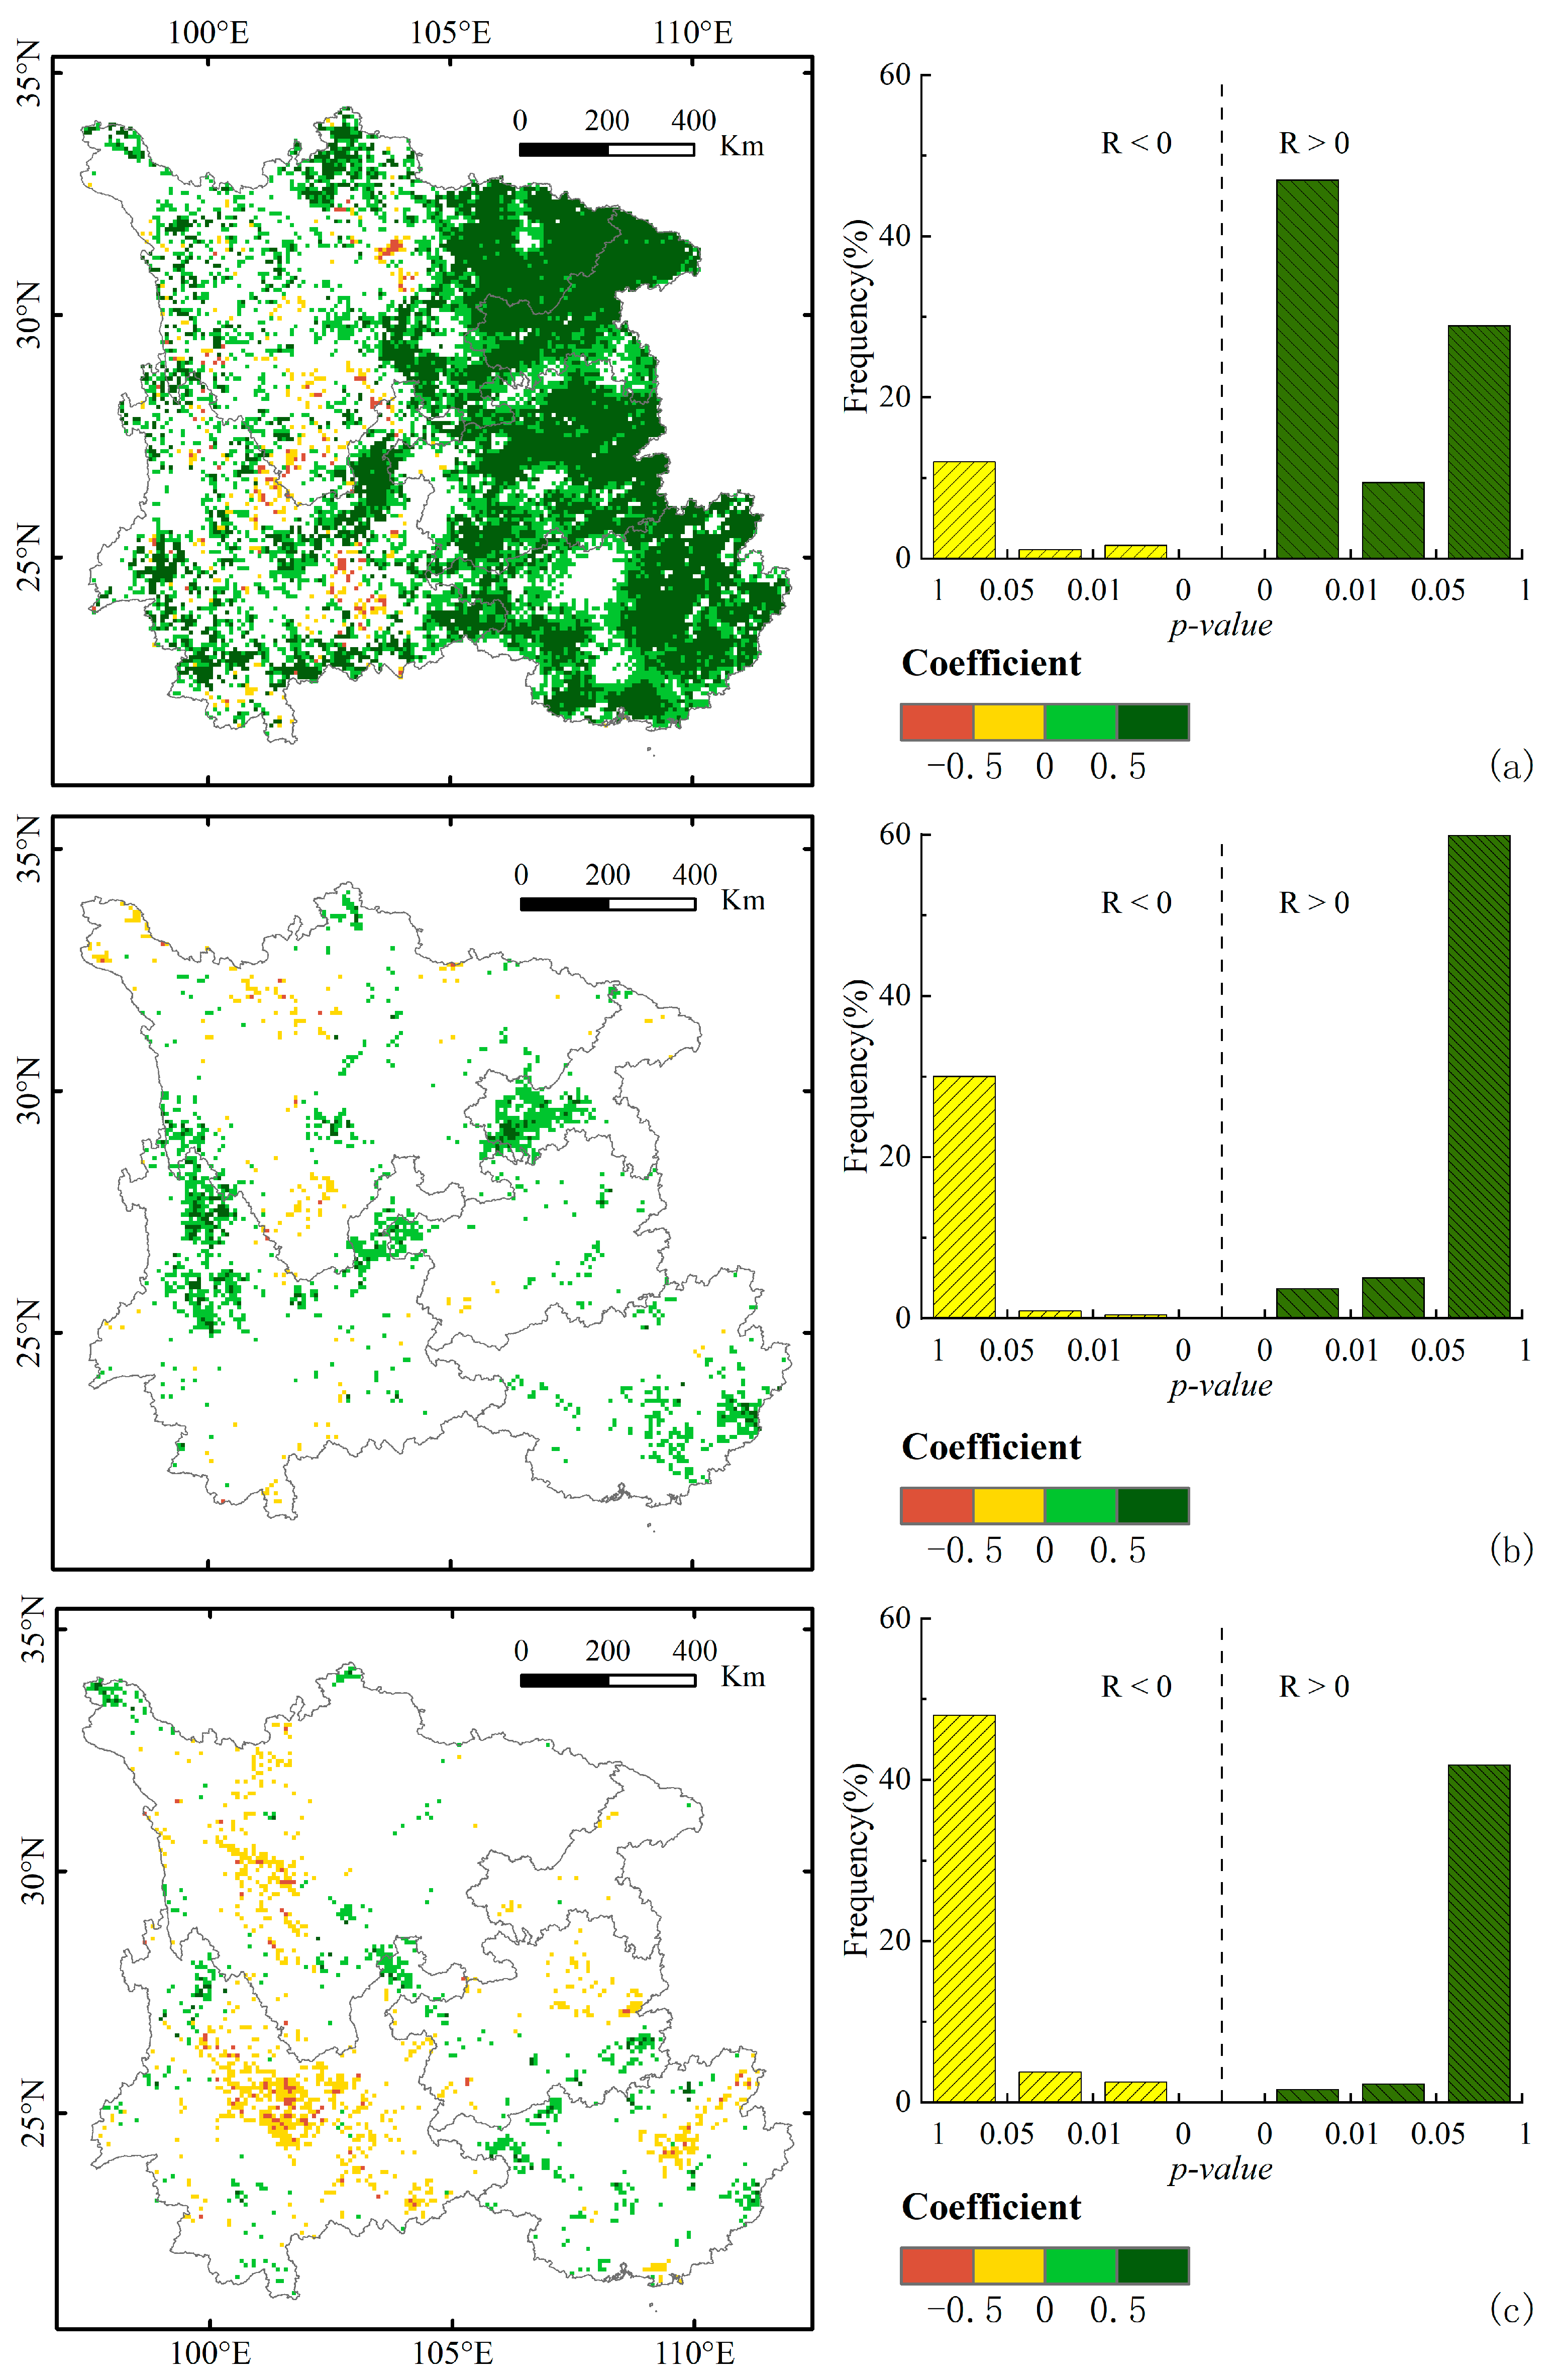
2.3.3. Partial Correlation Analysis
3. Results
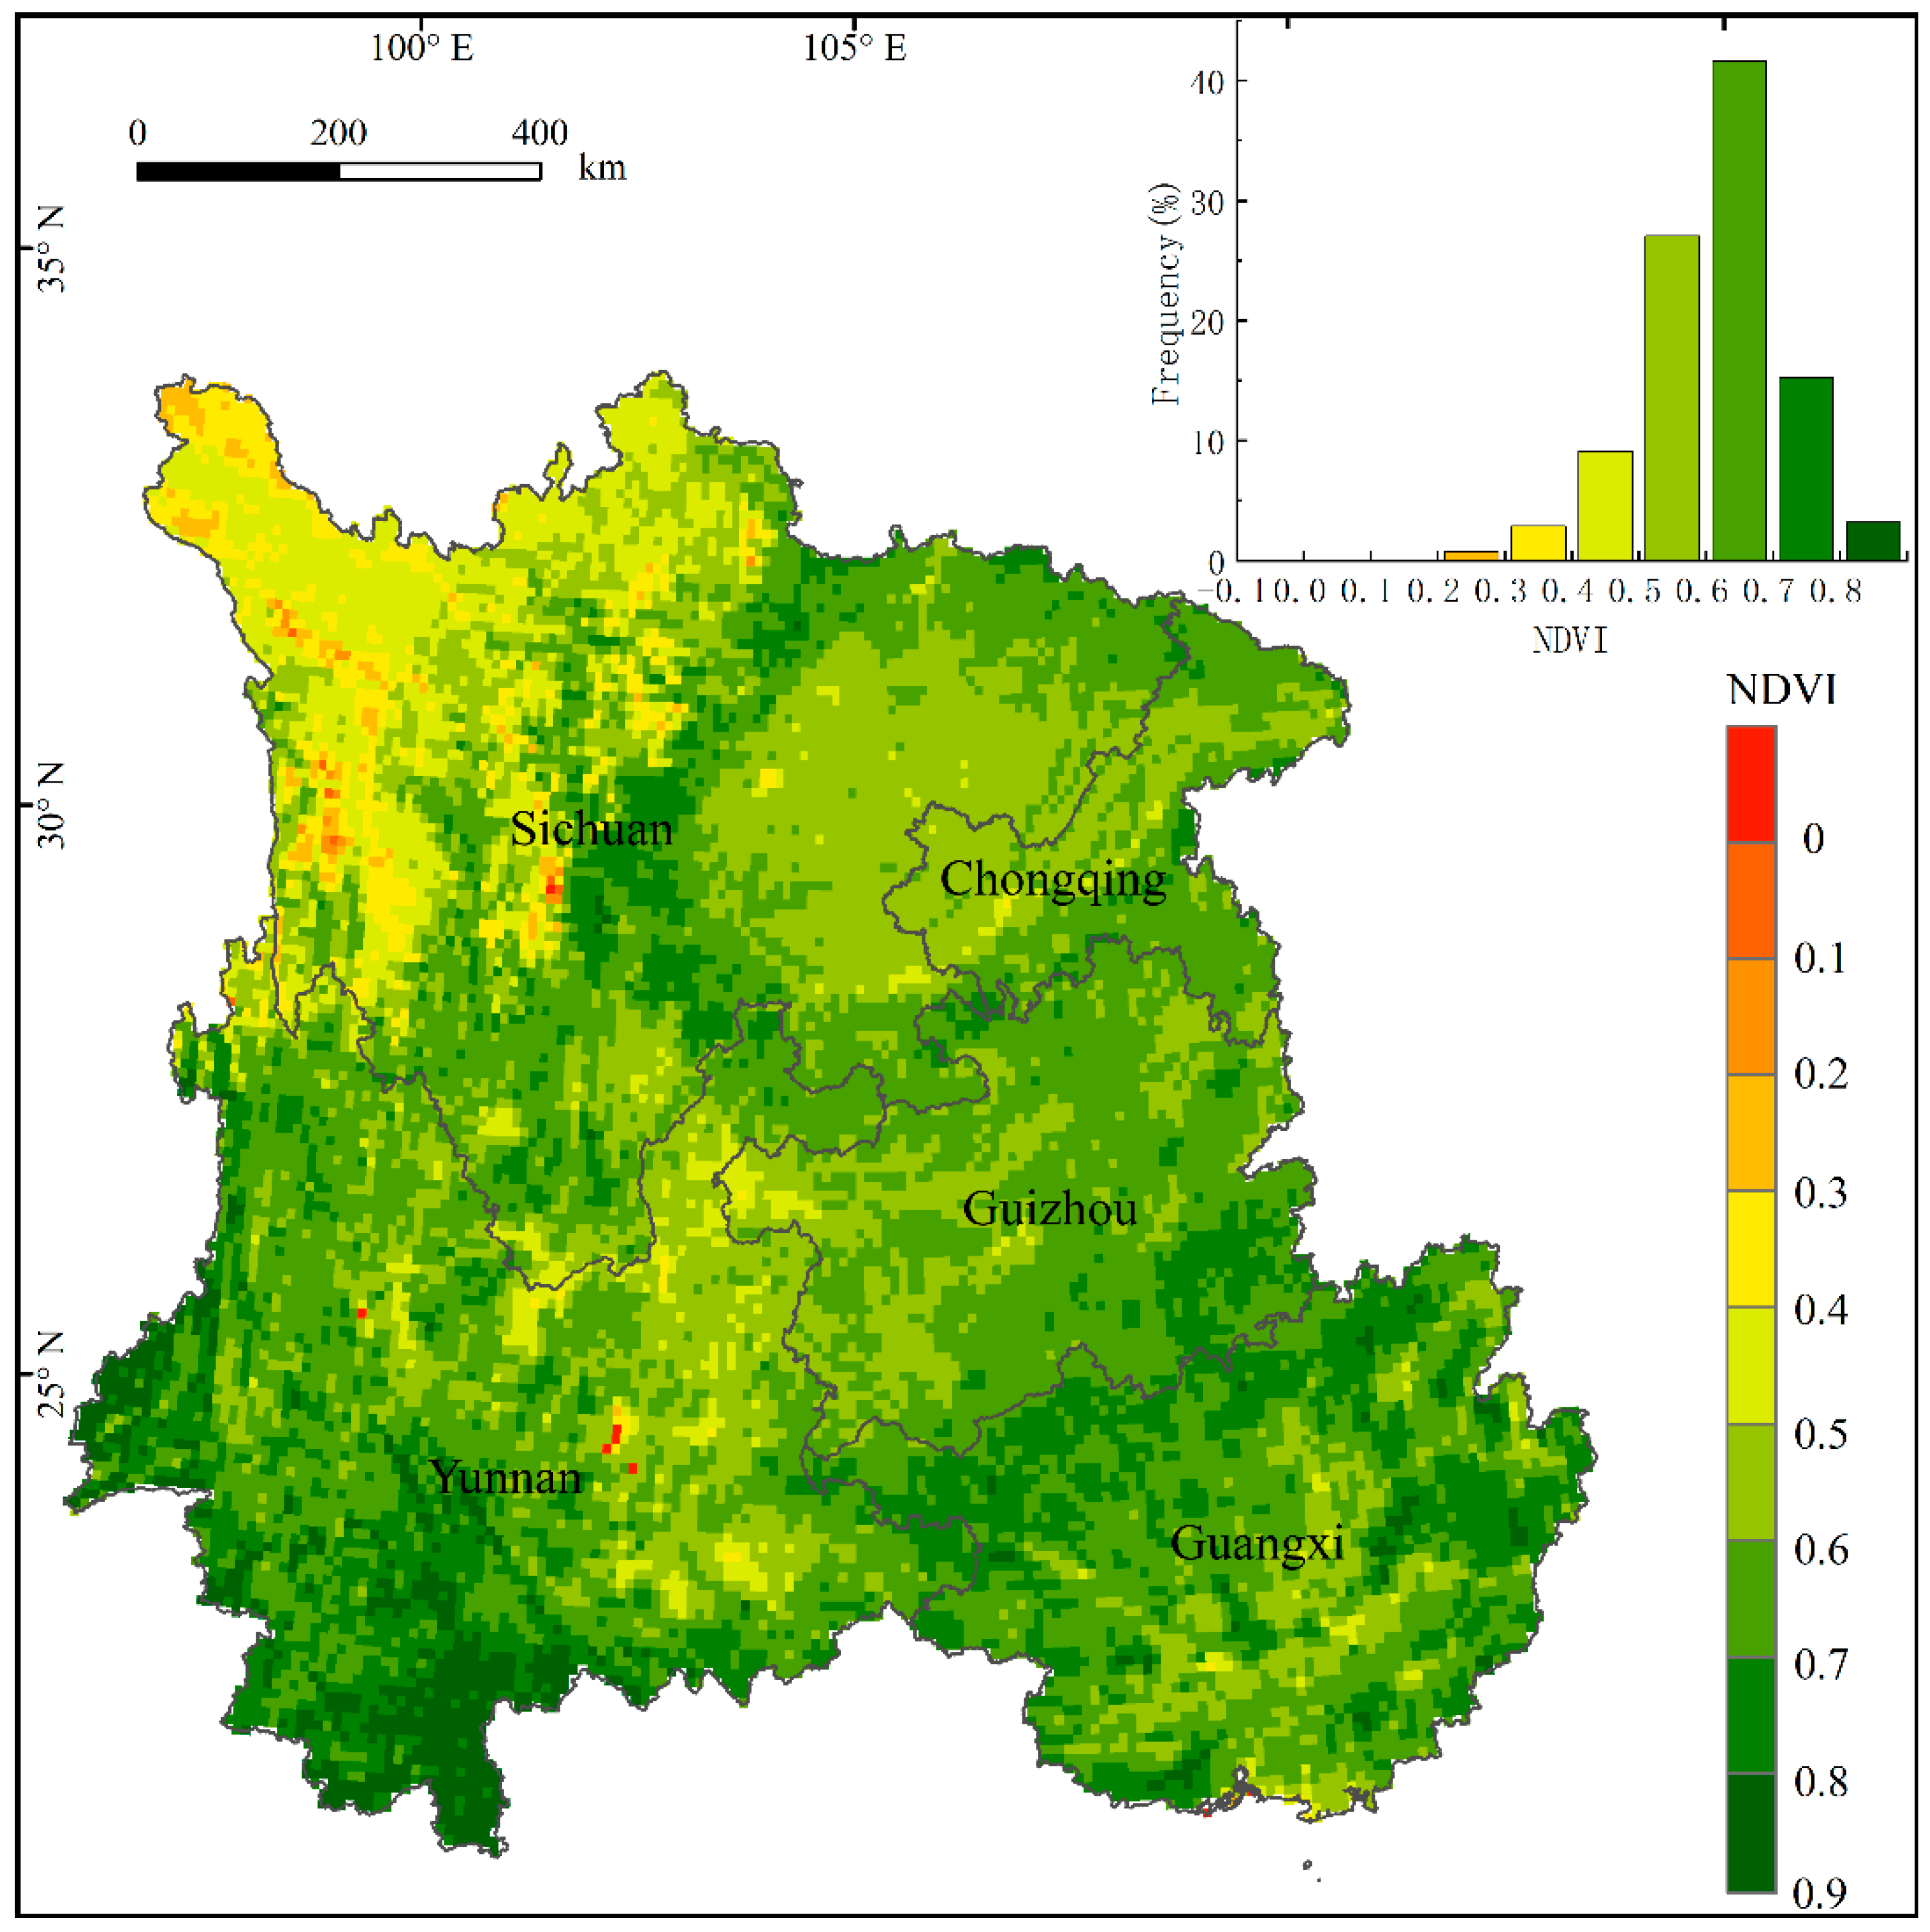
3.1. Spatial Pattern
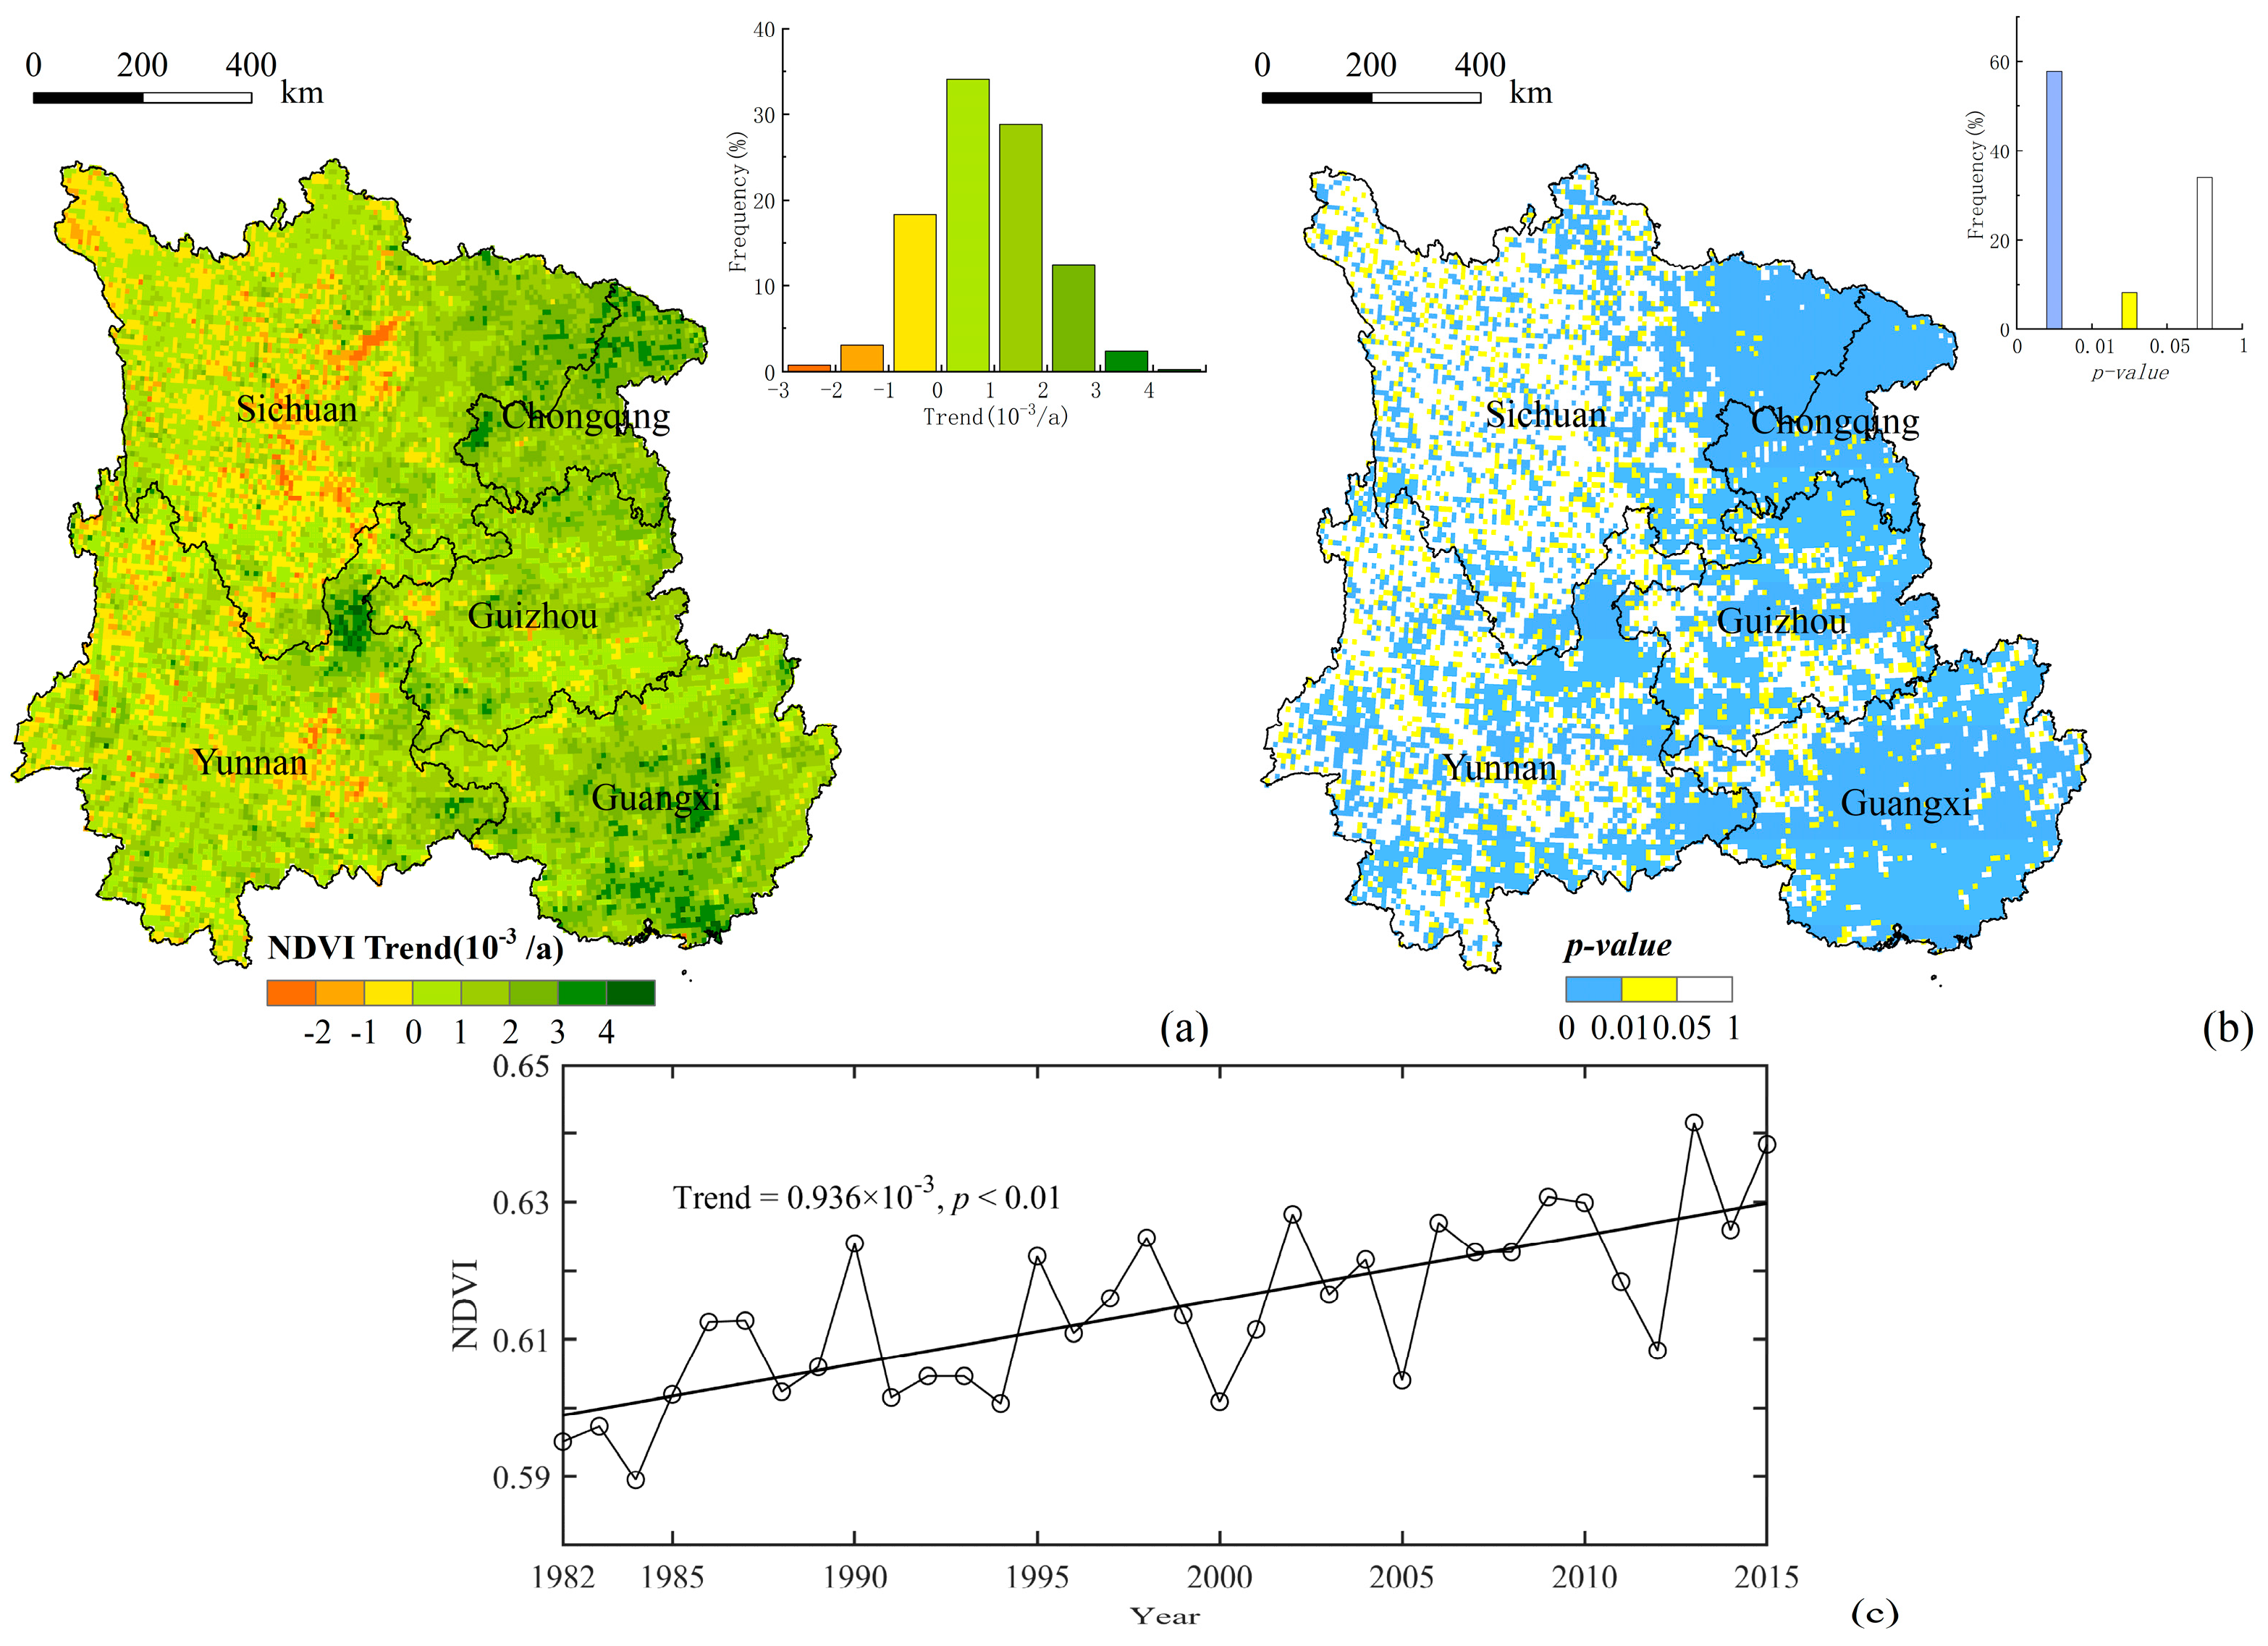
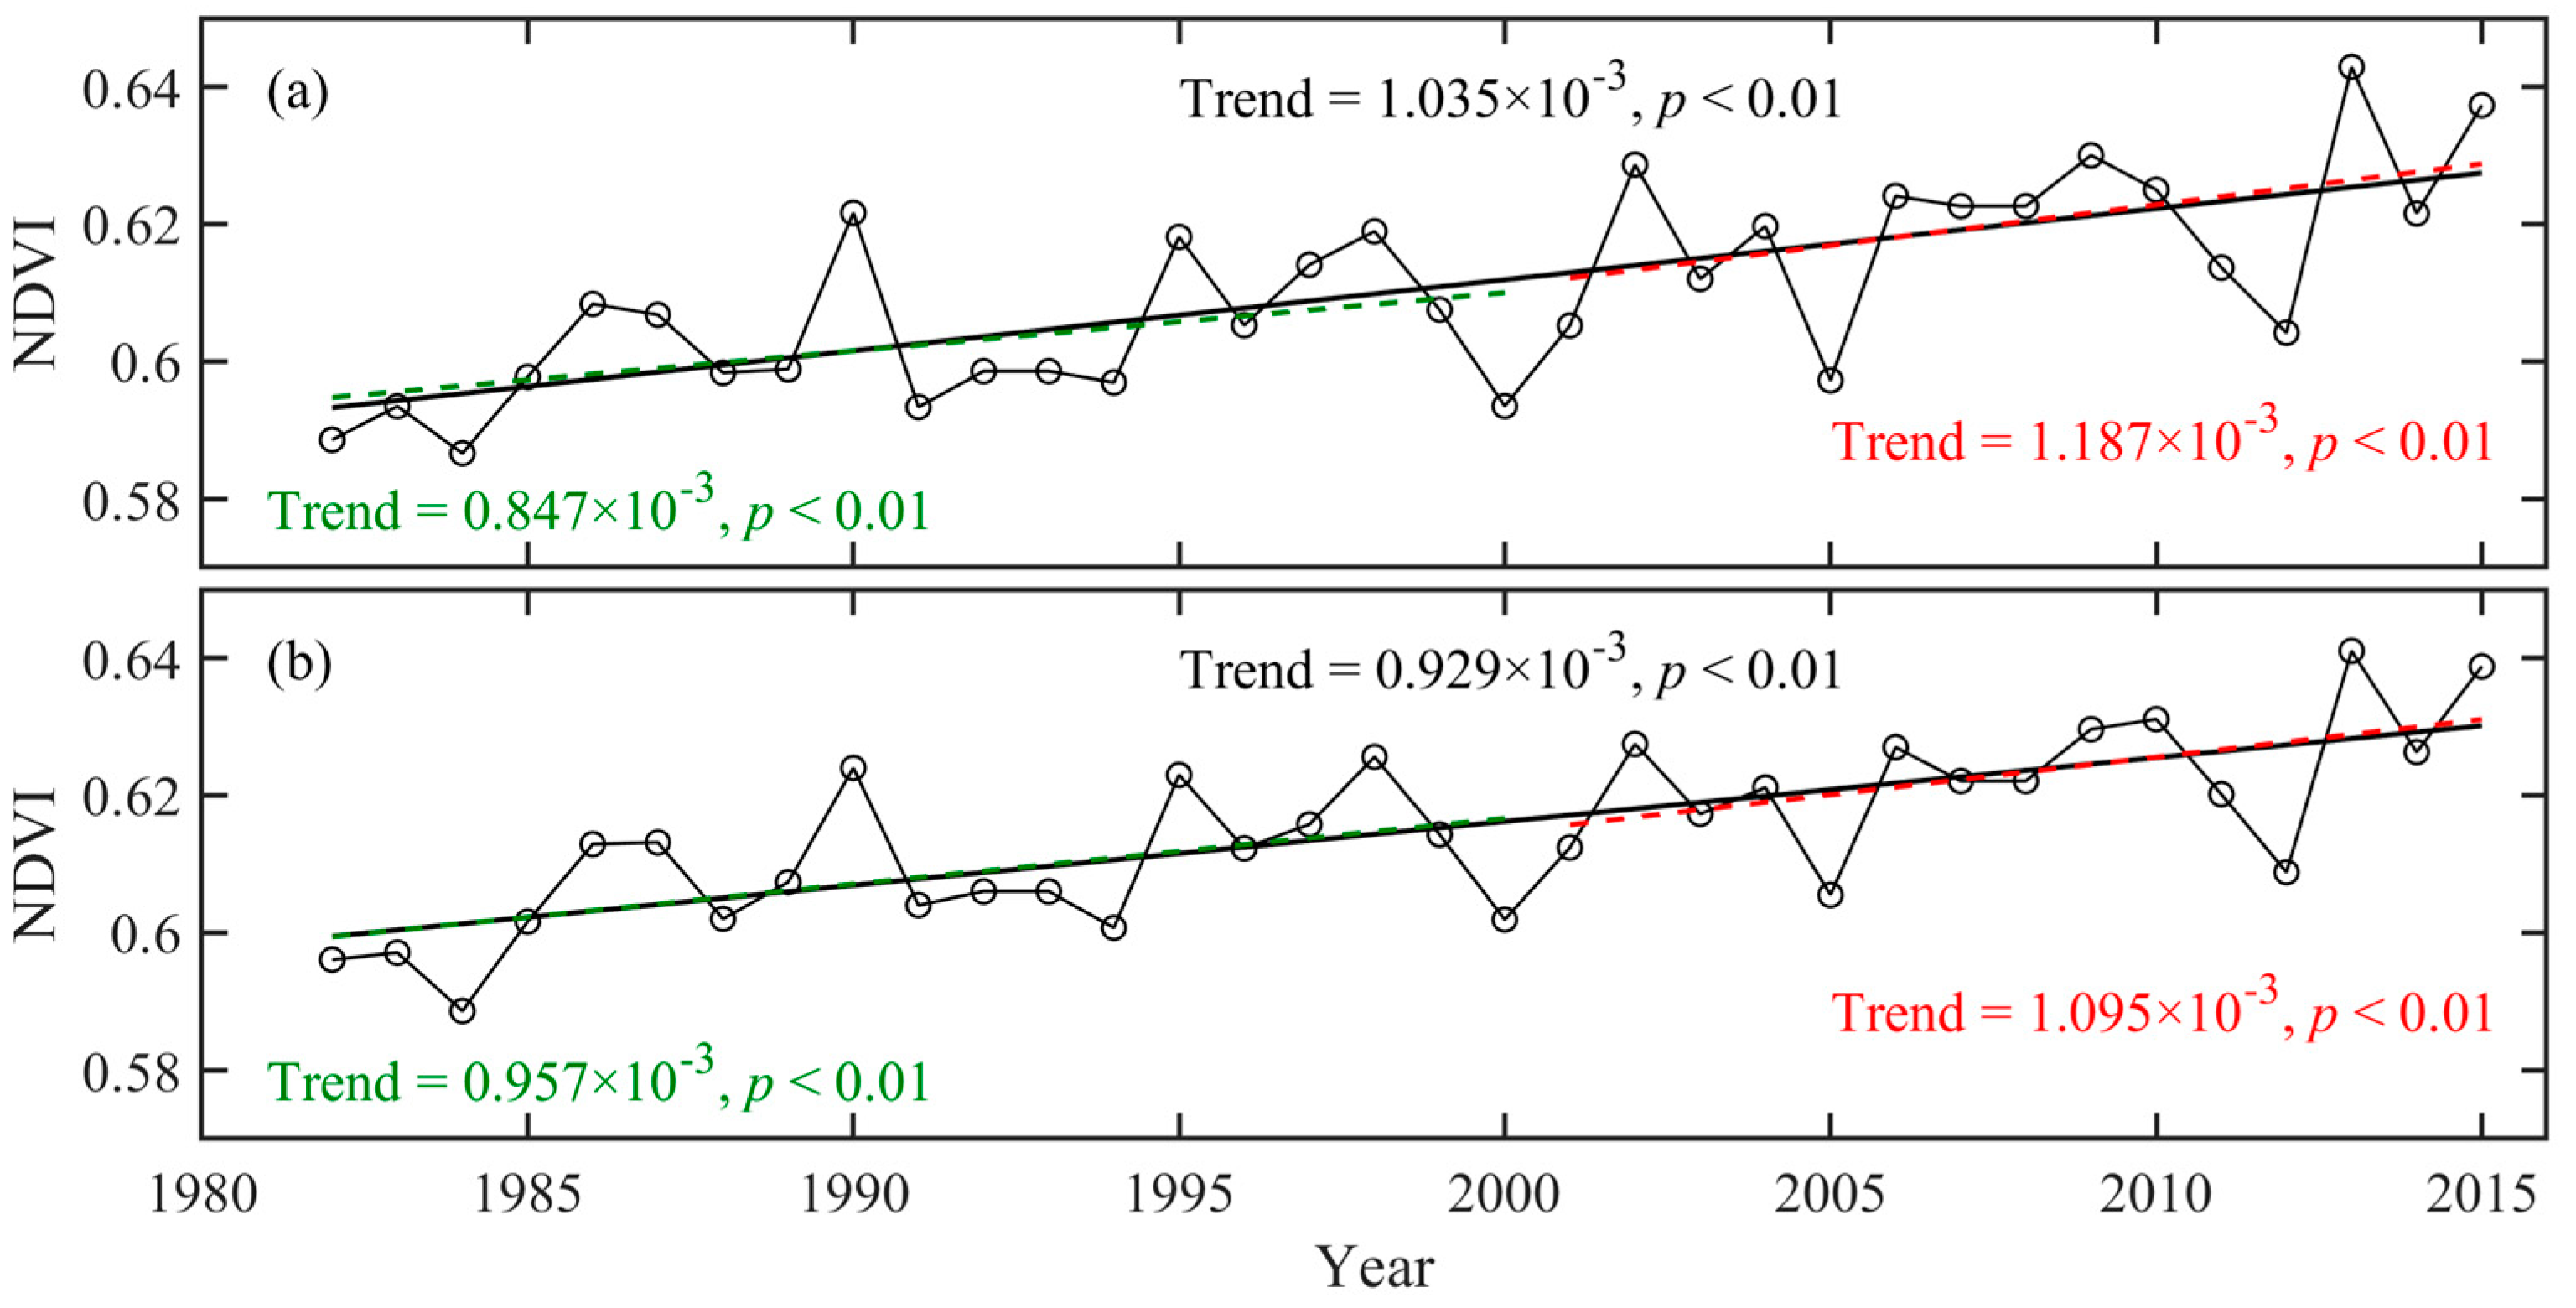
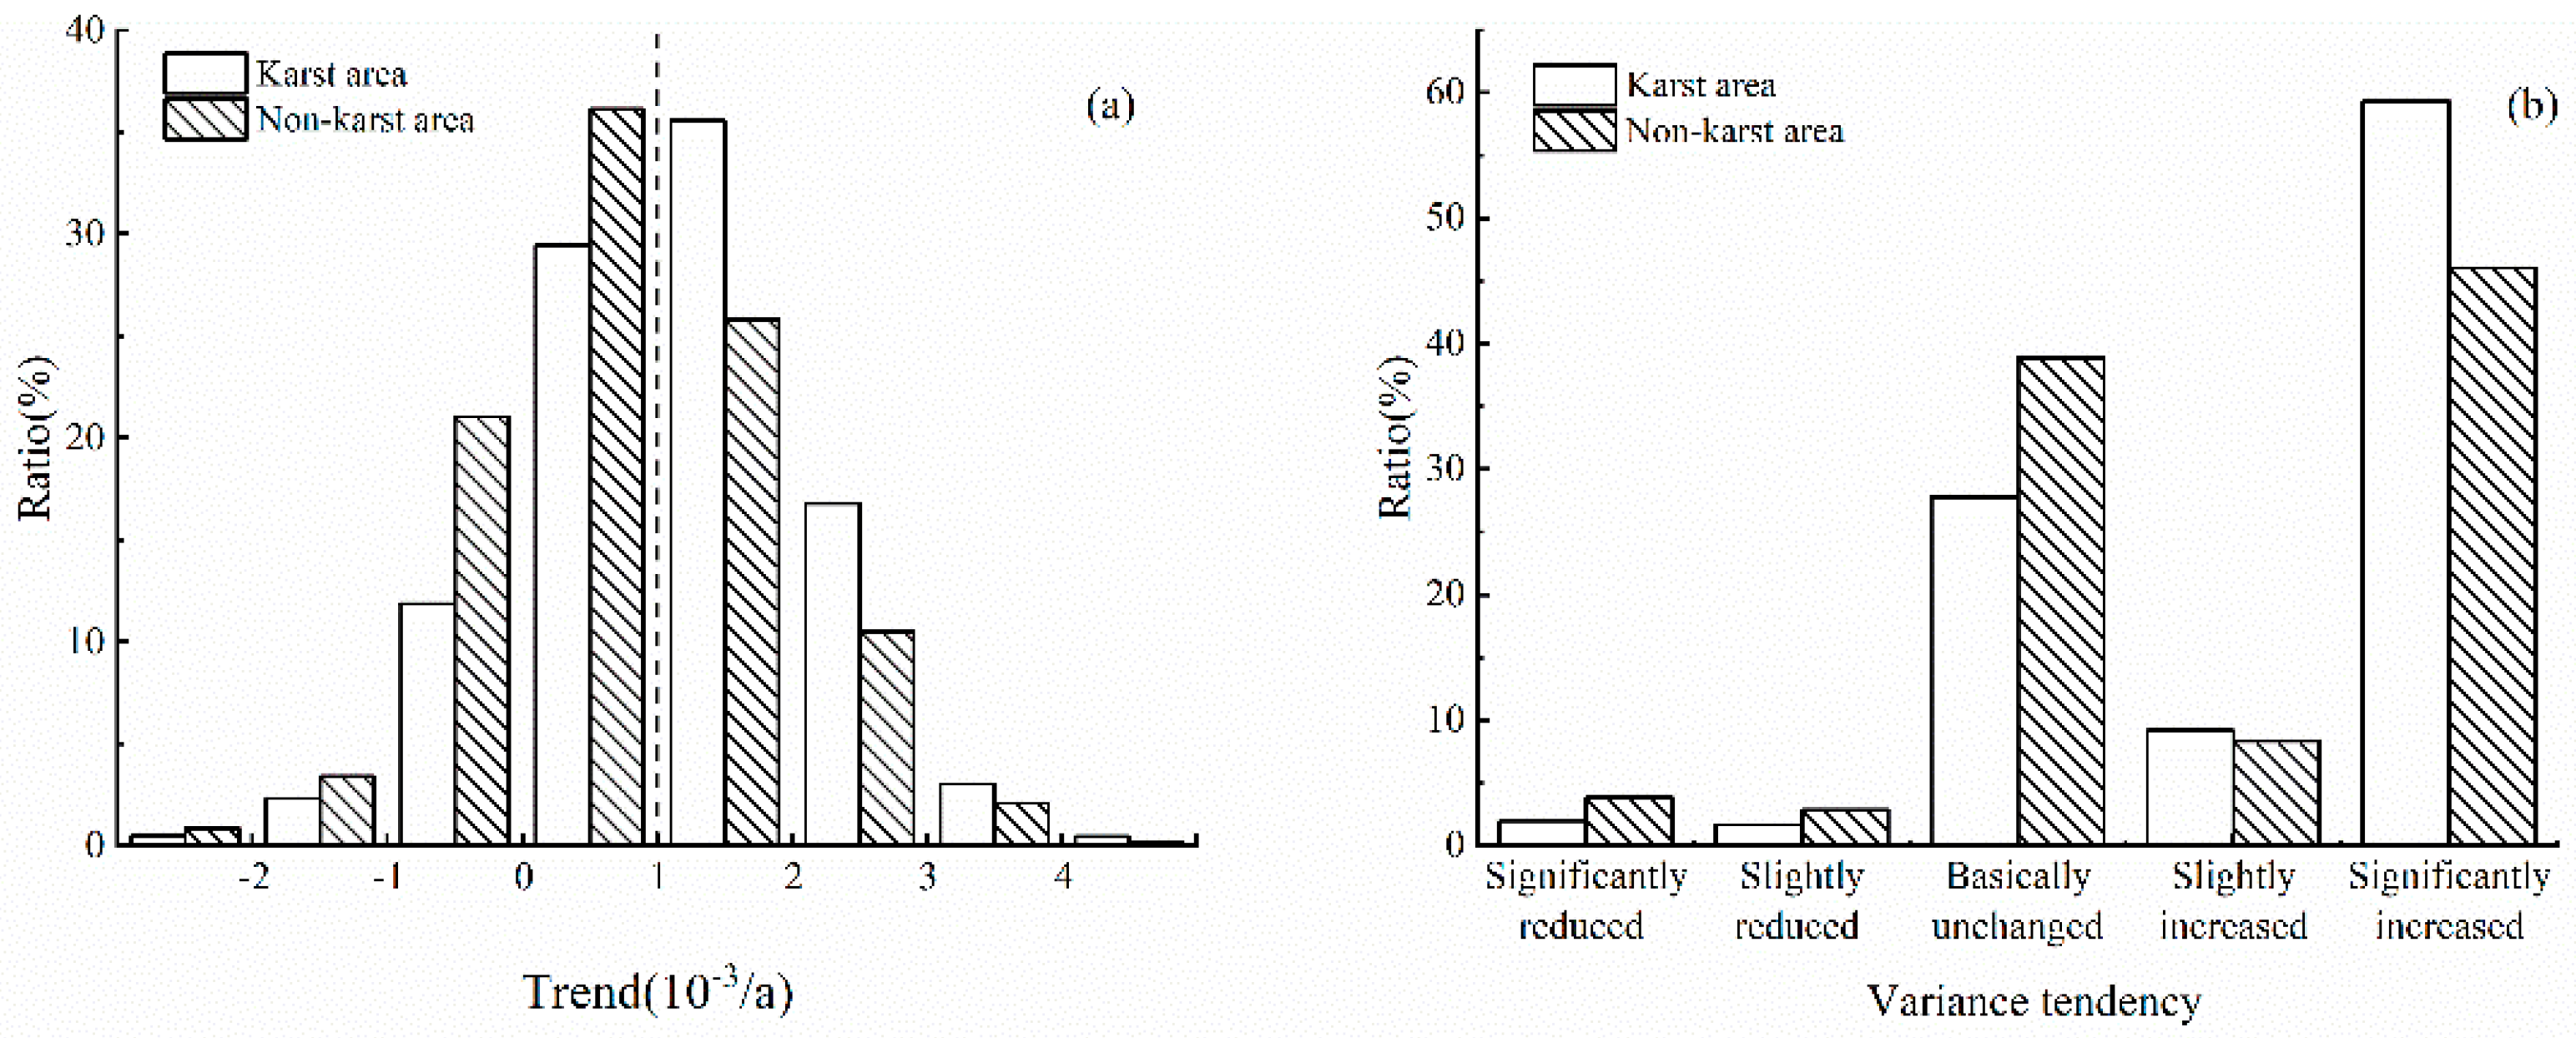
3.2. Long-Term Trend
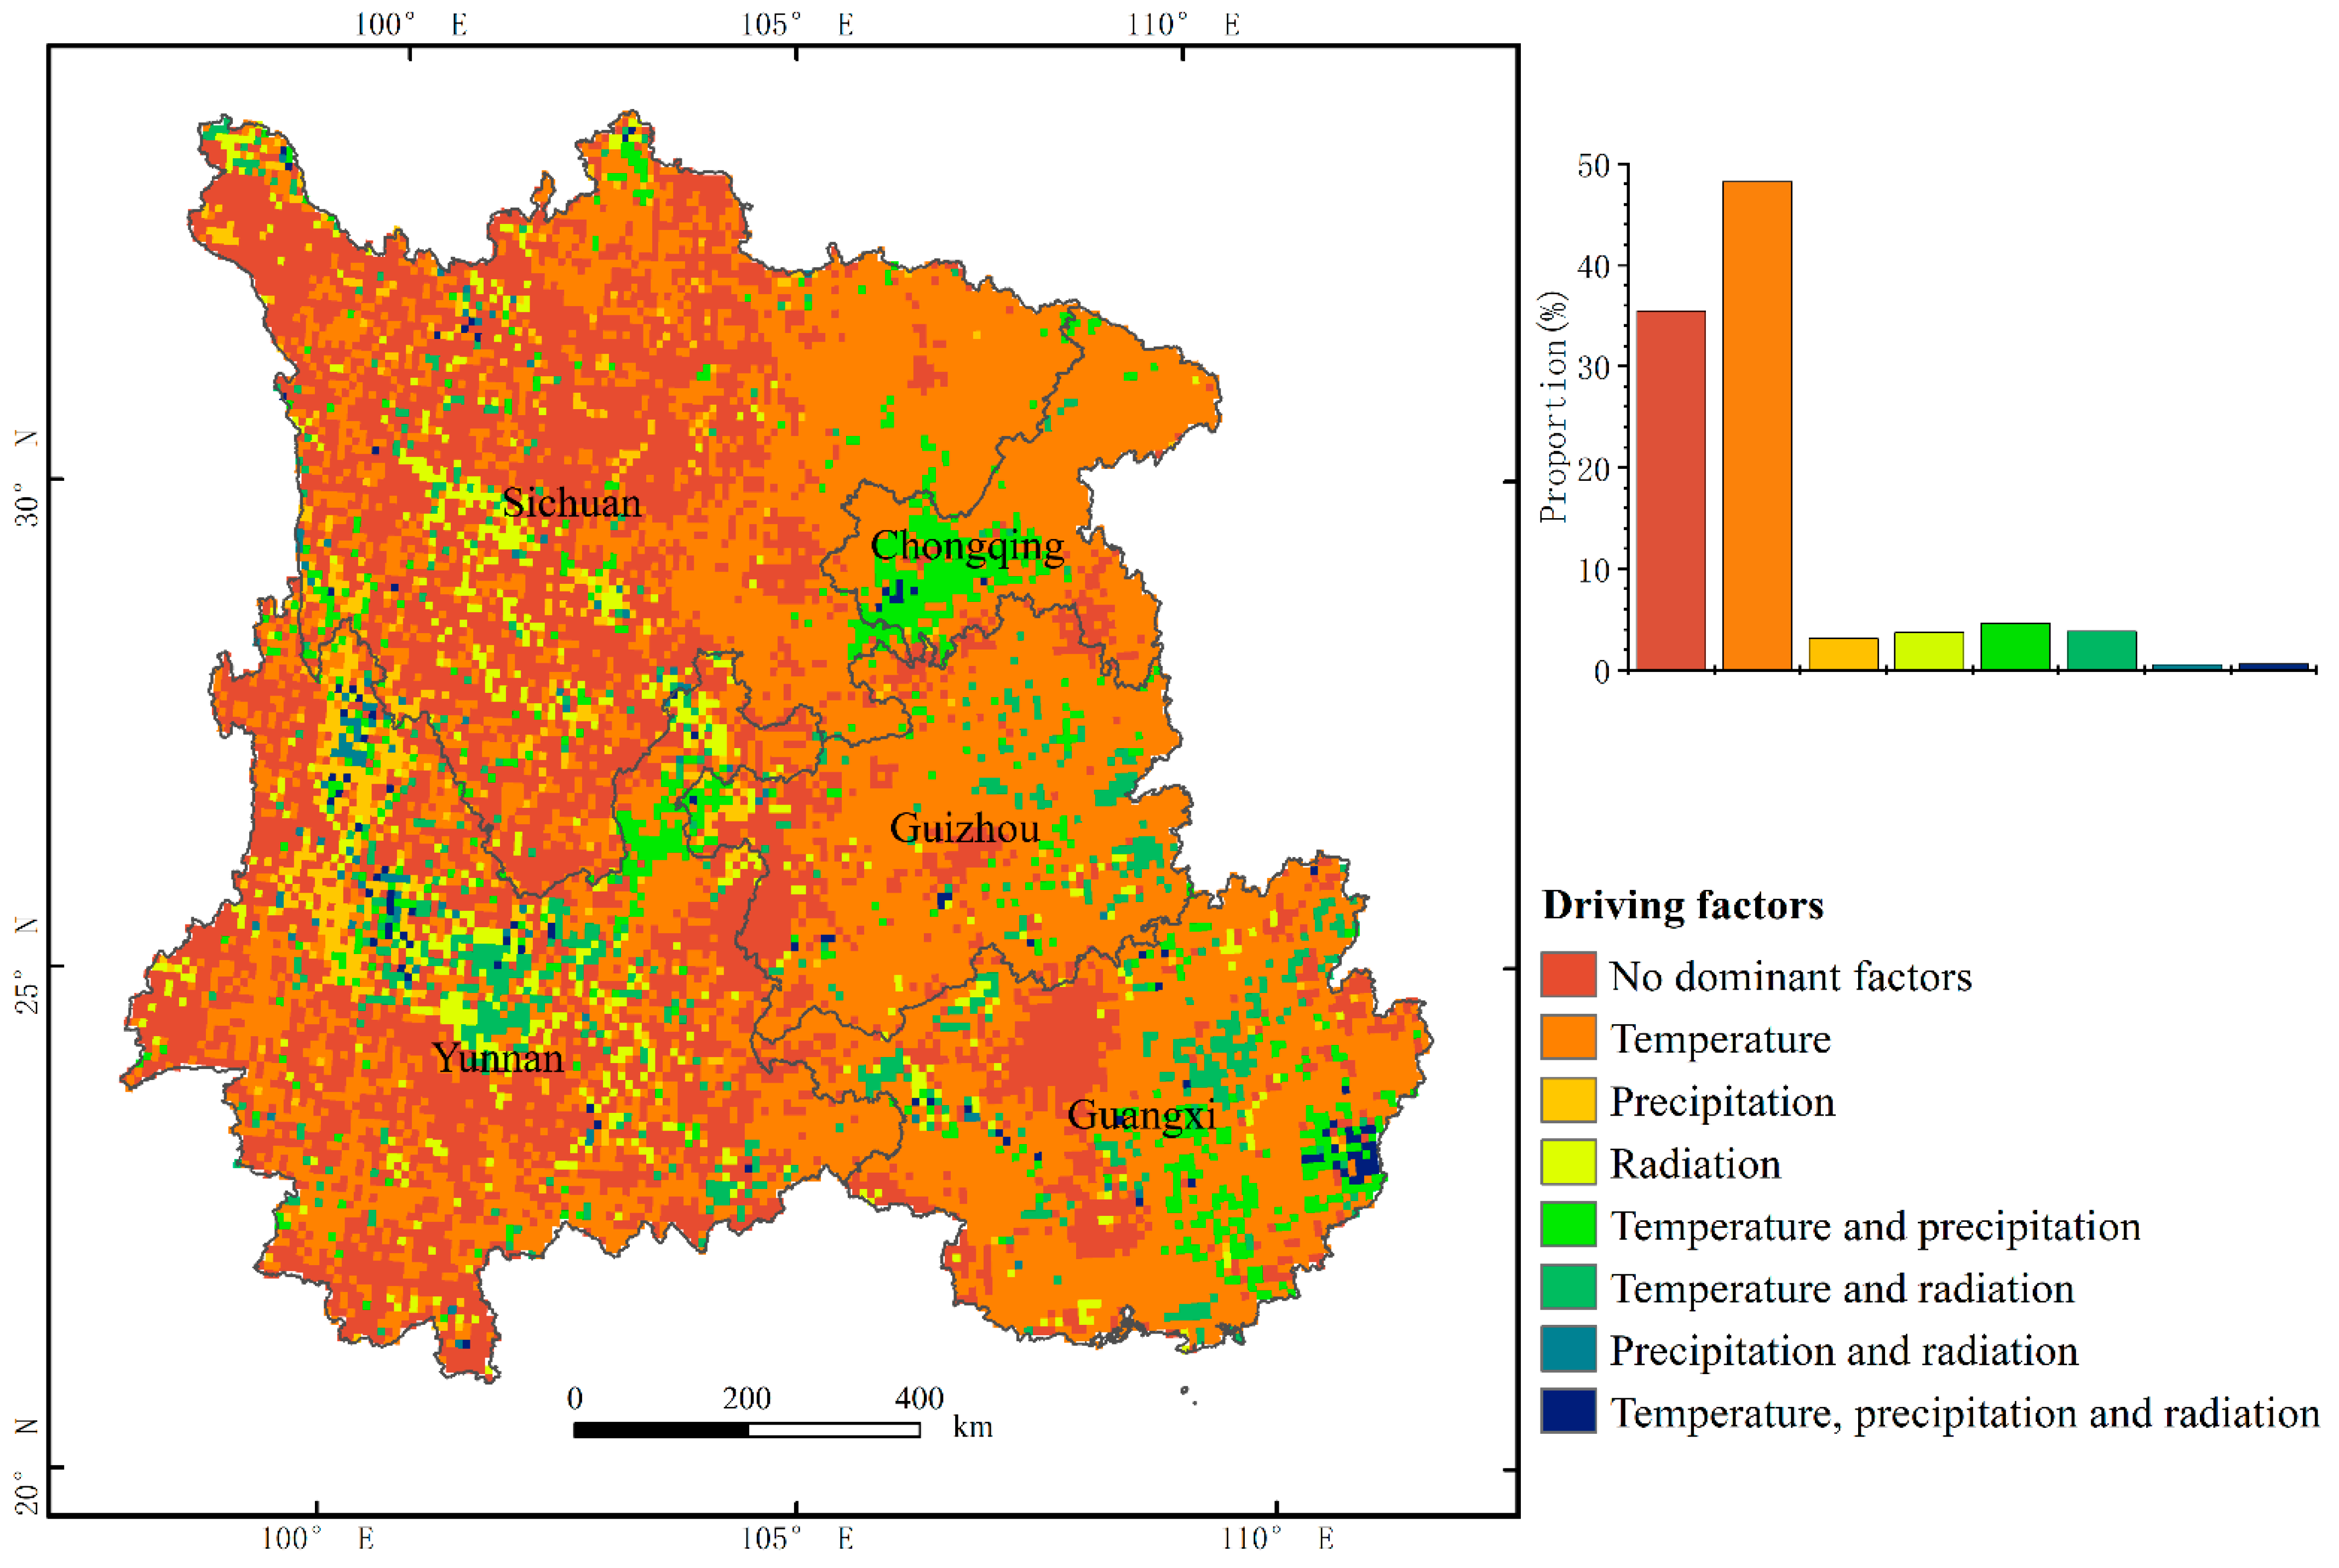
3.3. Driving Factor Analysis
4. Discussion
4.1. Effects of Climate Factors
4.2. Differences in Vegetation NDVI between Karst and Non-Karst Areas
4.3. Impact of Human Activities
5. Conclusions
Author Contributions
Funding
Data Availability Statement
Acknowledgments
Conflicts of Interest
References
- Li, D.; Pan, M.; Cong, Z.; Zhang, L.; Wood, E. Vegetation control on water and energy balance within the Budyko framework. Water Resour. Res. 2013, 49, 969–976. [Google Scholar] [CrossRef]
- Nemani, R.R.; Keeling, C.D.; Hashimoto, H.; Jolly, W.M.; Piper, S.C.; Tucker, C.J.; Myneni, R.B.; Running, S.W. Climate-Driven Increases in Global Terrestrial Net Primary Production from 1982 to 1999. Science 2003, 300, 1560–1563. [Google Scholar] [CrossRef] [PubMed] [Green Version]
- Piao, S.; Wang, X.; Ciais, P.; Ciais, P.; Zhu, B.; Wang, T.; Liu, J. Changes in satellite-derived vegetation growth trend in temperate and boreal Eurasia from 1982 to 2006. Glob. Chang. Biol. 2011, 17, 3228–3239. [Google Scholar] [CrossRef]
- Chen, B.; Xu, G.; Coops, N.C.; Ciais, P.; Myneni, R.B. Satellite-observed changes in terrestrial vegetation growth trends across the Asia Pacific region associated with land cover and climate from 1982 to 2011. Int. J. Digit. Earth 2016, 9, 1055–1076. [Google Scholar] [CrossRef]
- Wu, D.; Zhao, X.; Liang, S.; Zhou, T.; Huang, K.; Tang, B.; Zhao, W. Time-lag effects of global vegetation responses to climate change. Glob. Chang. Biol. 2015, 21, 3520–3531. [Google Scholar] [CrossRef]
- Zhang, Y.; Ye, A. Spatial and temporal variations in vegetation coverage observed using AVHRR GIMMS and Terra MODIS data in the mainland of China. Int. J. Remote Sens. 2020, 41, 4238–4268. [Google Scholar] [CrossRef]
- Anyamba, A.; Tucker, C.J. Analysis of Sahelian vegetation dynamics using NOAA-AVHRR NDVI data from 1981–2003. J. Arid Environ. 2005, 63, 596–614. [Google Scholar] [CrossRef]
- Jiang, W.; Yuan, L.; Wang, W.; Wang, W.; Cao, R.; Zhang, Y.; Shen, W. Spatio-temporal analysis of vegetation variation in the Yellow River Basin. Ecol. Indic. 2015, 51, 117–126. [Google Scholar] [CrossRef]
- Beck, H.E.; McVicar, T.R.; Dijk, A.I.J.M.; Schellekens, J.; de Jeu, R.A.M.; Bruijinzeel, L.A. Global evaluation of four AVHRR–NDVI data sets; Intercomparison and assessment against Landsat imagery. Remote Sens. Environ. 2011, 115, 2547–2563. [Google Scholar] [CrossRef]
- Tucker, C.J.; Townshend, J.R.G.; Goff, T.E. African land-cover classification using satellite data. Science 1985, 227, 369–375. [Google Scholar] [CrossRef]
- Hunt, E.R. Relationship between woody biomass and PAR conversion efficiency for estimating net primary production from NDVI. Int. J. Remote Sens. 1994, 15, 1725–1729. [Google Scholar]
- Fensholt, R.; Langanke, T.; Rasmussen, K.; Reenberg, A.; Prince, S.D.; Tucker, C.J.; Scholes, R.J.; Quang, B.; Bondeau, A.; Eastman, R.; et al. Greenness in semi-arid areas across the globe 1981–2007—An Earth Observing Satellite based analysis of trends and drivers. Remote Sens. Environ. 2012, 121, 144–158. [Google Scholar] [CrossRef]
- Scheftic, W.; Zeng, X.; Broxton, P.; Brunke, M. Intercomparison of seven NDVI products over the United States and Mexico. Remote Sens. 2014, 6, 1057–1084. [Google Scholar] [CrossRef] [Green Version]
- Chang, Q.; Zhang, J.; Jiao, W.; Yao, F. A comparative analysis of the NDVIg and NDVI3g in monitoring vegetation phenology changes in the Northern Hemisphere. Geocarto Int. 2018, 33, 1–20. [Google Scholar] [CrossRef]
- Jiang, N.; Zhu, W.; Zheng, Z.; Chen, G.; Fan, D. A Comparative Analysis between GIMSS NDVIg and NDVI3g for Monitoring Vegetation Activity Change in the Northern Hemisphere during 1982–2008. Remote Sens. 2013, 05, 4031–4044. [Google Scholar] [CrossRef] [Green Version]
- Du, J.; Shu, J.; Zhao, C.; Ahati, J.; Wang, L.; Xiang, B.; Fang, G.; Liu, W.; He, P. Comparison of GIMMS NDVI3g and GIMMS NDVIg for monitoring vegetation activity and its responses to climate changes in Xinjiang during 1982-2006. Acta Ecol. Sin. 2016, 36, 6738–6749. [Google Scholar]
- Vicente-Serrano, S.M.; Gouveia, C.; Camarero, J.J.; Beguería, S.; Trigo, R.; López-Moreno, J.I.; Azorín-Molina, C.; Pasho, E.; Lorenzo-Lacruz, J. Response of vegetation to drought time-scales across global land biomes. Proc. Natl. Acad. Sci. USA 2013, 110, 52–57. [Google Scholar] [CrossRef] [Green Version]
- Zhang, Y.; Zhang, C.; Wang, Z.; Chen, Y.; Gang, C.; An, R.; Li, J. Vegetation dynamics and its driving forces from climate change and human activities in the Three-River Source Region, China from 1982 to 2012. Sci. Total Environ. 2016, 563, 210–220. [Google Scholar] [CrossRef]
- Jiang, L.; Jiapaer, G.; Bao, A.; Guo, H.; Ndayisaba, F. Vegetation dynamics and responses to climate change and human activities in Central Asia. Sci. Total Environ. 2017, 599, 967–980. [Google Scholar] [CrossRef]
- Wang, S.; Li, R.; Wu, Y.; Zhao, S. Vegetation dynamics and their response to hydrothermal conditions in Inner Mongolia, China. Glob. Ecol. Conserv. 2022, 34, e02034. [Google Scholar] [CrossRef]
- Su, W. Controlling Model for Rocky Desertification of Karst Mountainous Region and Its Preventing Strategy in Southwest China. J. Soil Water Conserv. 2002, 16, 29–32, 79. [Google Scholar]
- Ding, Z.; Zheng, H.; Liu, Y.; Zeng, S.; Yu, P.; Shi, W.; Tang, X. Spatiotemporal Patterns of Ecosystem Restoration Activities and Their Effects on Changes in Terrestrial Gross Primary Production in Southwest China. Remote Sens. 2021, 13, 1209. [Google Scholar] [CrossRef]
- Tang, X.; Xiao, J.; Ma, M.; Yang, H.; Li, X.; Ding, Z.; Yu, P.; Zhang, Y.; Wu, C.; Jing, H.; et al. Satellite evidence for China’s leading role in restoring vegetation productivity over global karst ecosystems. For. Ecol. Manag. 2022, 507, 120000. [Google Scholar] [CrossRef]
- Wang, M.; Ding, Z.; Wu, C.; Song, L.; Ma, M.; Yu, P.; Lu, B.; Tang, X. Divergent responses of ecosystem water-use efficiency to extreme seasonal droughts in Southwest China. Sci. Total Environ. 2021, 760, 143427. [Google Scholar] [CrossRef]
- Nie, Y.; Chen, H.; Wang, K.; Yang, J. Water source utilization by woody plants growing on dolomite outcrops and nearby soils during dry seasons in karst region of Southwest China. J. Hydrol. 2012, 420, 263–274. [Google Scholar] [CrossRef]
- Pinzon, J.E.; Tucker, C.J. A Non-Stationary 1981-2012 AVHRR NDVI3g Time Series. Remote Sens. 2014, 06, 6929–6960. [Google Scholar] [CrossRef] [Green Version]
- Tucker, C.J.; Pinzon, J.E.; Brown, M.; Slayback, D.A.; Pak, E.W.; Mahoney, R.; Vermote, E.F.; Saleous, N.E. An extended AVHRR 8-km NDVI dataset compatible with MODIS and SPOT vegetation NDVI data. Int. J. Remote Sens. 2005, 26, 4485–4498. [Google Scholar] [CrossRef]
- Fensholt, R.; Proud, S.R. Evaluation of Earth Observation based global long term vegetation trends—Comparing GIMMS and MODIS global NDVI time series. Remote Sens. Environ. 2012, 119, 131–147. [Google Scholar] [CrossRef]
- Huete, A.; Didan, K.; Miura, T.; Rodriguez, E.P.; Gap, X.; Ferreira, L.G. Overview of the radiometric and biophysical performance of the MODIS vegetation indices. Remote Sens. Environ. 2002, 83, 195–213. [Google Scholar] [CrossRef]
- Zeng, F.; Collatz, G.J.; Pinzon, J.E.; Ivanoff, A. Evaluating and Quantifying the Climate-Driven Interannual Variability in Global Inventory Modeling and Mapping Studies (GIMMS) Normalized Difference Vegetation Index (NDVI3g) at Global Scales. Remote Sens. 2013, 5, 3918–3950. [Google Scholar] [CrossRef] [Green Version]
- Yang, K.; He, J.; Tang, W.; Qin, J.; Cheng, C. On downward shortwave and longwave radiations over high altitude regions; Observation and modeling in the Tibetan Plateau. Agric. For. Meteorol. 2010, 150, 38–46. [Google Scholar] [CrossRef]
- He, J.; Yang, K.; Tang, W.; Lu, H.; Qin, J.; Chen, Y.; Li, X. The first high-resolution meteorological forcing dataset for land process studies over China. Sci. Data 2020, 7, 25. [Google Scholar] [CrossRef] [PubMed] [Green Version]
- Wang, H.; Zhao, X.; Zhang, X.; Wu, D.; Du, X. Long Time Series Land Cover Classification in China from 1982 to 2015 Based on Bi-LSTM Deep Learning. Remote Sens. 2019, 11, 1639. [Google Scholar] [CrossRef] [Green Version]
- Carreiras, J.M.B.; Pereira, J.M.C.; Shimabukuro, Y.E.; Stroppiana, D. Evaluation of compositing algorithms over the Brazilian Amazon using SPOT-4 VEGETATION data. Int. J. Remote Sens. 2003, 24, 3427–3440. [Google Scholar] [CrossRef]
- Holben, B.N. Characteristics of maximum-value composite images from temporal AVHRR data. Int. J. Remote Sens. 1986, 7, 1417–1434. [Google Scholar] [CrossRef]
- Sobrino, J.; Julien, Y. Global trends in NDVI-derived parameters obtained from GIMMS data. Int. J. Remote Sens. 2011, 32, 4267–4279. [Google Scholar] [CrossRef]
- Xu, G.; Zhang, H.; Chen, B.; Zhang, H.; Innes, J.L.; Wang, G.; Yan, J.; Zheng, Y.; Zhu, Z.; Myneni, R.B. Changes in Vegetation Growth Dynamics and Relations with Climate over China’s Landmass from 1982 to 2011. Remote Sens. 2014, 6, 3263–3283. [Google Scholar] [CrossRef] [Green Version]
- Li, S.; Yang, S.; Liu, X.; Liu, Y.; Shi, M. NDVI-Based Analysis on the Influence of Climate Change and Human Activities on Vegetation Restoration in the Shaanxi-Gansu-Ningxia Region, Central China. Remote Sens. 2015, 7, 11163–11182. [Google Scholar] [CrossRef] [Green Version]
- Lü, Y.; Zhang, L.; Yan, H.; Ren, X.; Wang, J.; Niu, Z.; Gu, F.; He, H. Spatial and temporal patterns of changing vegetation and the influence of environmental factors in the karst region of Southwest China. Acta Ecol. Sin. 2018, 38, 8774–8786. [Google Scholar]
- Yang, Y.; Hou, Z.; Zhang, Z. NDVI Changes and Driving Factors in Southwest China from 2001 to 2018. Bull. Soil Water Conserv. 2021, 41, 337–344. [Google Scholar]
- Chen, W.; Bai, S.; Zhao, H.; Han, X.; Li, L. Spatiotemporal analysis and potential impact factors of vegetation variation in the karst region of Southwest China. Environ. Sci. Pollut. Res. 2021, 28, 61258–61273. [Google Scholar] [CrossRef] [PubMed]
- Qiao, Y.; Jiang, Y.; Zhang, C. Contribution of karst ecological restoration engineering to vegetation greening in southwest China during recent decade. Ecol. Indic. 2021, 121, 107081. [Google Scholar] [CrossRef]
- Wang, J.; Meng, J.; Cai, Y. Assessing vegetation dynamics impacted by climate change in the southwestern karst region of China with AVHRR NDVI and AVHRR NPP time-series. Environ. Geol. 2008, 54, 1185–1195. [Google Scholar] [CrossRef]
- Zhou, J.; Ma, M.; Xiao, Q.; Wem, J. Vegetation Dynamics and Its Relationship with Climatic Factors in Southwest China. Remote Sens. Technol. Appl. 2017, 32, 966–972. [Google Scholar]
- Xiao, J.; Wang, S.; Bai, X.; Zhou, D.; Tian, Y.; Li, Q.; Wu, L.; Qian, Q.; Chen, F.; Zeng, C. Determinants and spatial-temporal evolution of vegetation coverage in the karst critical zone of South China. Acta Ecol. Sin. 2018, 38, 8799–8812. [Google Scholar]
- Mao, Y.; Jiang, Y.; Zhang, C.; Qiao, Y.; Lü, T.; Qiu, J. Spatio-temporal Changes and Influencing Factors of Vegetation Net Primary Productivity in Southwest China in the Past 20 years and Its Response to Ecological Engineering. Acta Ecol. Sin. 2022, 42, 2878–2890. [Google Scholar]
- Tao, J.; Xu, T.; Dong, J.; Yu, X.; Jiang, Y.; Zhang, Y.; Huang, K.; Zhu, J.; Dong, J.; Xu, Y. Elevation-dependent effects of climate change on vegetation greenness in the high mountains of southwest China during 1982–2013. Int. J. Climatol. 2018, 38, 2029–2038. [Google Scholar] [CrossRef]
- Cao. Impact of China’s Large-Scale Ecological Restoration Program on the Environment and Society in Arid and Semiarid Areas of China; Achievements, Problems, Synthesis, and Applications. Crit. Rev. Environ. Sci. Technol. 2011, 41, 317–335. [Google Scholar] [CrossRef]
- Zhang, X.; Yue, Y.; Tong, X.; Wang, K.; Qi, X.; Deng, C.; Brandt, M. Eco-engineering controls vegetation trends in southwest China karst. Sci. Total Environ. 2021, 770, 145160. [Google Scholar] [CrossRef]
- Wu, L.; Wang, S.; Bai, X.; Tian, Y.; Luo, G.; Wang, J.; Li, Q.; Chen, F.; Deng, Y.; Yang, Y. Climate change weakens the positive effect of human activities on karst vegetation productivity restoration in southern China. Ecol. Indic. 2020, 115, 106392. [Google Scholar] [CrossRef]
- Zheng, Z.; Zeng, Y.; Zhao, Y.; Gao, W.; Zhao, D.; Wu, B. Analysis of land cover changes in southwestern China since the 1990s. Acta Ecol. Sin. 2016, 36, 7858–7869. [Google Scholar]
- Zhao, H.; Wu, R.; Yang, F.; Hu, J.; Wang, J.; Guo, Y.; Feng, Z.; Zhang, C.; Wang, Y.; Zhou, J. Spatiotemporal patterns of vegetation conversion under the Grain for Green Program in southwest China. Conserv. Sci. Pract. 2021, 4, e604. [Google Scholar] [CrossRef]
- Wang, M.; Wang, W.; Li, J.; Wu, H.; Cu, C.; Liu, T. The Impact of Sustained Drought on Vegetation Ecosystem in Southwest China Based on Remote Sensing. In Proceedings of the International Conference on Ecological Informatics and Ecosystem Conservation (ISEIS 2010), Beijing, China, 27–29 August 2010; Volume 2, pp. 1679–1691. [Google Scholar]
- Liu, B.; Li, Y.; Chen, J.; Chen, X. Long-term change in precipitation structure over the karst area of southwest China. Int. J. Climatol. 2016, 36, 2417–2434. [Google Scholar] [CrossRef] [Green Version]
- Li, X.; He, B.; Quan, X.; Liao, Z.; Bai, X. Use of the Standardized Precipitation Evapotranspiration Index (SPEI) to Characterize the Drying Trend in Southwest China from 1982–2012. Remote Sens. 2015, 7, 10917–10937. [Google Scholar] [CrossRef] [Green Version]
- Chen, X.; Chen, T.; Yan, Q.; Cai, J.; Guo, R.; Gao, M.; Wei, X.; Zhou, S.; Li, C.; Xie, Y. The Ongoing Greening in Southwest China despite Severe Droughts and Drying Trends. Remote Sens. 2021, 13, 3374. [Google Scholar] [CrossRef]
- Brandt, M.; Yue, Y.; Wigneron, J.; Tong, X.; Tian, F.; Jesper, M.R.; Xiao, X.; Verger, A.; Mialon, A.; Al-Yaani, A. Satellite-observed major greening and biomass increase in South China karst during recent decade. Earth’s Future 2018, 6, 1017–1028. [Google Scholar] [CrossRef]
- Jin, K.; Wang, F.; Han, J.; Shi, S.; Ding, W. Contribution of climatic change and human activities to vegetation NDVI change over China during 1982-2015. Acta Geogr. Sin. 2020, 75, 961–974. [Google Scholar]
- Zhang, Y.; Peng, C.; Li, W.; Tian, L.; Zhu, Q.; Chen, H.; Fang, X.; Zhang, G.; Liu, G.; Mu, X. Multiple afforestation programs accelerate the greenness in the ‘Three North’ region of China from 1982 to 2013. Ecol. Indic. 2016, 61, 404–412. [Google Scholar] [CrossRef]
- Peng, J.; Jiang, H.; Liu, Q.; Green, S.M.; Quine, T.A.; Liu, H.; Qiu, S.; Liu, Y.; Meersmans, J. Human activity vs. climate change; Distinguishing dominant drivers on LAI dynamics in karst region of southwest China. Sci. Total Environ. 2021, 769, 144297. [Google Scholar] [CrossRef]


| Land Cover | 1982 (×104 km) | 2015 (×104 km) | Rate of Change (%) |
|---|---|---|---|
| Cultivated land | 29.68 | 27.35 | −7.84 |
| Forest land | 48.47 | 55.37 | 14.19 |
| Shrubland | 24.19 | 21.52 | −11.07 |
| Grassland | 32.37 | 30.40 | −6.09 |
| Water body | 0.35 | 0.22 | −38.46 |
| Permanent snow and ice | 0.10 | 0.05 | −42.86 |
| Wetland | 0.08 | 0.26 | 216.67 |
| Artificial surface | 0.14 | 0.18 | 30.00 |
| Bare land | 0.63 | 0.67 | 6.52 |
| NDVI | 1982 (×104 km) | 2015 (×104 km) | Rate of Change (%) |
|---|---|---|---|
| <0 | 0.05 | 0.07 | 25.00 |
| 0–0.1 | 0.07 | 0.04 | −40.00 |
| 0.1–0.2 | 0.16 | 0.18 | 8.33 |
| 0.2–0.3 | 1.37 | 1.16 | −15.84 |
| 0.3–0.4 | 4.84 | 3.97 | −17.98 |
| 0.4–0.5 | 16.96 | 11.49 | −32.24 |
| 0.5–0.6 | 44.28 | 21.03 | −52.49 |
| 0.6–0.7 | 48.40 | 55.24 | 14.17 |
| 0.7–0.8 | 16.70 | 38.52 | 130.62 |
| >0.8 | 3.16 | 4.31 | 36.64 |
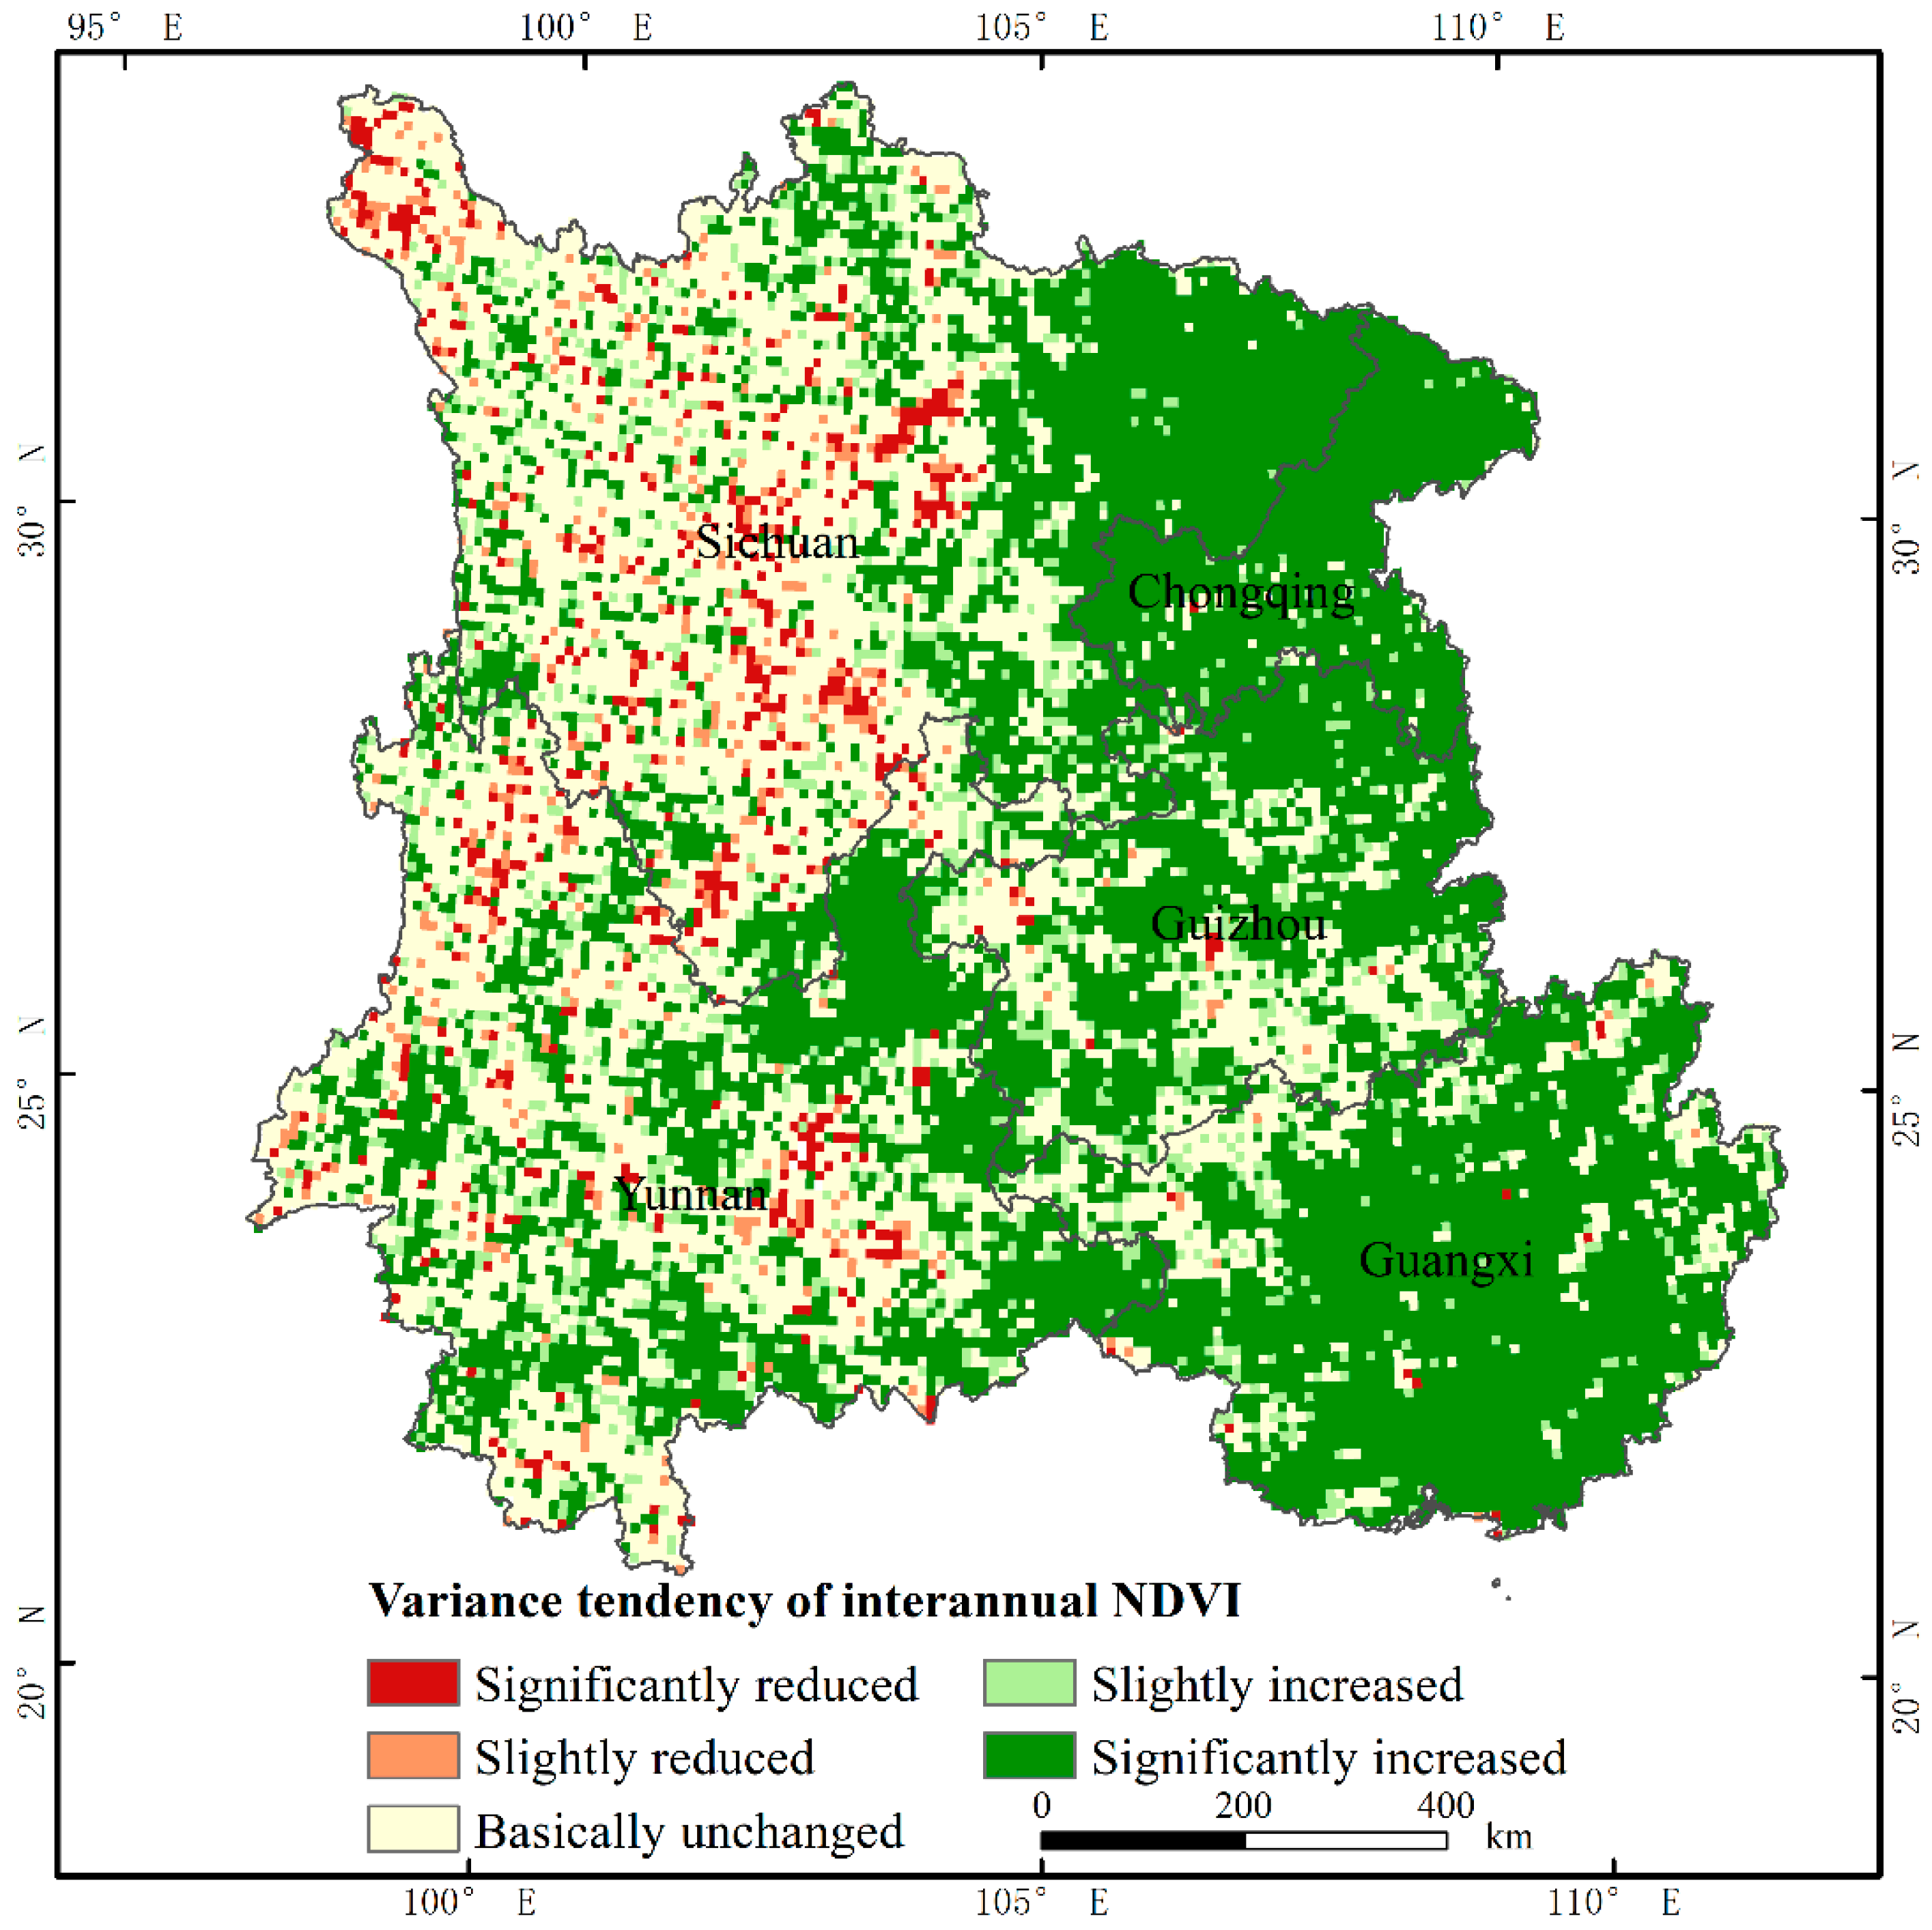
| Variance Tendency | p-Value | Ratio (%) |
|---|---|---|
| Significantly reduced | p < 0.01 | 3.29 |
| Slightly reduced | 0.01 ≤ p < 0.05 | 2.49 |
| Basically unchanged | p ≥ 0.05 | 35.48 |
| Slightly increased | 0.01 ≤ p < 0.05 | 8.61 |
| Significantly increased | p < 0.01 | 50.14 |
| Environmental Factors | Karst Area | Non-Karst Area |
|---|---|---|
| No dominant factors | 29.59 | 38.08 |
| Temperature | 55.99 | 44.70 |
| Precipitation | 2.79 | 3.23 |
| Radiation | 2.39 | 4.30 |
| Temperature and Precipitation | 4.42 | 4.70 |
| Temperature and Radiation | 4.02 | 3.70 |
| Precipitation and Radiation | 0.46 | 0.57 |
| Temperature, Precipitation and Radiation | 0.35 | 0.71 |
Publisher’s Note: MDPI stays neutral with regard to jurisdictional claims in published maps and institutional affiliations. |
© 2022 by the authors. Licensee MDPI, Basel, Switzerland. This article is an open access article distributed under the terms and conditions of the Creative Commons Attribution (CC BY) license (https://creativecommons.org/licenses/by/4.0/).
Share and Cite
Duan, C.; Li, J.; Chen, Y.; Ding, Z.; Ma, M.; Xie, J.; Yao, L.; Tang, X. Spatiotemporal Dynamics of Terrestrial Vegetation and Its Driver Analysis over Southwest China from 1982 to 2015. Remote Sens. 2022, 14, 2497. https://0-doi-org.brum.beds.ac.uk/10.3390/rs14102497
Duan C, Li J, Chen Y, Ding Z, Ma M, Xie J, Yao L, Tang X. Spatiotemporal Dynamics of Terrestrial Vegetation and Its Driver Analysis over Southwest China from 1982 to 2015. Remote Sensing. 2022; 14(10):2497. https://0-doi-org.brum.beds.ac.uk/10.3390/rs14102497
Chicago/Turabian StyleDuan, Chunhui, Jinghao Li, Yanan Chen, Zhi Ding, Mingguo Ma, Jing Xie, Li Yao, and Xuguang Tang. 2022. "Spatiotemporal Dynamics of Terrestrial Vegetation and Its Driver Analysis over Southwest China from 1982 to 2015" Remote Sensing 14, no. 10: 2497. https://0-doi-org.brum.beds.ac.uk/10.3390/rs14102497