
The Survey of Lava Tube Distribution in Jeju Island by Multi-Source Data Fusion


1
Department of Geoinformatics, University of Seoul, Seoulsiripdaero 163, Dongdaemum-gu, Seoul 08826, Korea
2
Department of Land Economics, National Chengchi University, No. 64, Section 2, Zhinan Road, Wenshan District, Taipei City 11605, Taiwan
3
Korea Information System Consulting & Auditing Co., Ltd., Gwacheon-si 13814, Korea
*
Author to whom correspondence should be addressed.
Remote Sens. 2022, 14(3), 443; https://0-doi-org.brum.beds.ac.uk/10.3390/rs14030443
Submission received: 10 December 2021
/
Revised: 12 January 2022
/
Accepted: 14 January 2022
/
Published: 18 January 2022
(This article belongs to the Special Issue Multi-Sensor Fusion Technology in Remote Sensing: Datasets, Algorithms and Applications)
Abstract
:Lava tubes, a major geomorphic element over volcanic terrain, have recently been highlighted as testbeds of the habitable environments and natural threats to unpredictable collapse. In our case study, we detected and monitored the risk of lava tube collapse on Jeju, an island off the Korean peninsula’s southern tip with more than 200 lava tubes, by conducting Interferometric Synthetic Aperture Radar (InSAR) time series analysis and a synthesized analysis of its outputs fused with spatial clues. We identified deformations up to 10 mm/year over InSAR Persistent Scatterers (PSs) obtained with Sentinel-1 time series processing in 3-year periods along with a specific geological unit. Using machine learning algorithms trained on time series deformations of samples along with clues from the spatial background, we classified candidates of potential lava tube networks primarily over coastal lava flows. What we detected in our analyses was validated via comparison with geophysical and ground surveys. Given that cavities in the lava tubes could pose serious risks, a detailed physical exploration and threat assessment of potential cave groups are required before the planned intensive construction of infrastructure on Jeju Island. We also recommend using the approach established in our study to detect undiscovered potential risks of collapse in the cavities, especially over lava tube networks, and to explore lava tubes on planetary surfaces using proposed terrestrial and planetary InSAR sensors.
1. Introduction
Lava tubes, a major consequence of lava flow formation, are among the most representative geomorphic features in volcanic landscapes. Pioneering works have been accomplished to confirm the origin of lava tubes in Hawaiian volcanoes [1,2,3], Mt. Etna, [4], and elsewhere. Along with geomorphic interpretation [5,6], numerical modeling of strain [7] and thermal erosion [8,9] have been used to establish the outline of lava tube development. Based on the studies listed above, two scenarios have been proposed to understand lava tube development. First, a solidified lava roof blocked the liquid lava flow, and a single structured lava tube was created. Second, the repetitive contraction of lava evolved into a multi-structured lava tube [10,11]. Recent research of lava tubes has focused on comparative analysis, as the lava tubes of solid planets and satellites have been identified by the spotting of skylights [12,13] and are being proposed as critical habitable environments.
Jeju Island, located on the southern coast of the Korean Peninsula, provides a valuable testbed for the geological/geomorphic studies of lava tubes due to their high spatial density, the unique diversity of cave morphology [14], and easy accessibility [15].
The more than 200 lava tubes, which extend up to 4–11 km and are distributed over an area of 1850 km2, show a large variety of cave structures formed at all sorts of developmental stages [16]. The key element of the Jeju lava tubes is that they occurred in shallow lava flows and there is a tendency toward cave deformation and collapse [17]. Lava tubes are distributed along the gentle slopes of Jeju Island in some instances close to dense human settlements. Furthermore, it is estimated that a large number of lava tubes that have never been identified have already collapsed. This can be confirmed in the investigations conducted over decades by [18]. Ref. [19] also observed the risks involving potential lava tubes in Jeju Island, especially the cases of road-cave crossings. The risk of lava tube collapse is not a concern for Jeju Island alone, as pit craters induced by lava tube collapse have been identified in Hawaiian and Icelandic lava tubes as well [20,21]. However, lava tube collapse in Jeju Island is especially significant due to the proximity to high-density settlements and the shallow depth of the Jeju lava tube system, as reported in [16]. Despite requirements to regulate risk and geological interests, studies of Jeju lava tube collapse have been limited to conceptual interpretations [19], in-situ explorations [16,18], and research using geophysical surveys of potential locations [22]. That is, quantitative analysis is still lacking.
Based on the observations mentioned above, ground stability should be inspected before recent urban extension and infrastructure construction. For instance, during the ongoing construction of the second international airport in western Jeju Island, identifying potential lava tubes is critical to avoid the risk induced by undiscovered cavities. However, such tasks cannot be achieved with conventional ground exploration and geophysical data mining approaches that are limited in their coverages and that produce unacceptably ambiguous data.
Therefore, we tackled the challenge of assessing potential deformation risks caused by undiscovered lava tube networks through synthesized data interpretation employing Interferometric Synthetic Aperture Radar (InSAR) techniques [23,24,25] and other spatial/contextual analyses. Various technical approaches were used to improve the interpretation of line-of-sight (LOS) measurements of InSAR time series analysis at specific critical points. After combining machine learning techniques, an integrated approach was proposed to classify the actual deformed signal caused by lava tube instability, referred to as lava tube induced deformation point (LTDP). Deformation signals derived from InSAR observation of LTDPs were analyzed with the models constructed by Terrestrial Laser Scanning (TLS) and the survey results from the geophysical survey. Thus, we aim to develop a synthesized methodological framework to define subtle clues that will help identify the most plausible target instability induced by an underground cavity. We expect that the application of this study is not limited to assessing the risks provoked by lava tube instability but is of potential use in identifying lava tube development, which has become of significant interest in the planetary habitat environments. As the planetary lava tubes of the Moon [26], Mars [27], and Io [28] are proven or proposed, the method has huge potential combined with proposed planetary InSAR missions [29,30,31,32].
Based on the context, we first introduce the characteristics of the target area together with data sets in Section 2. The methodology details were introduced in Section 3. The outputs from spatial analysis of lava tubes and InSAR deformation analyses were reported in Section 4. Further interpretation, discussion, and conclusions were presented in Section 5 and Section 6.
2. Test Site and Data Sets
2.1. Geological Background of Lava Caves
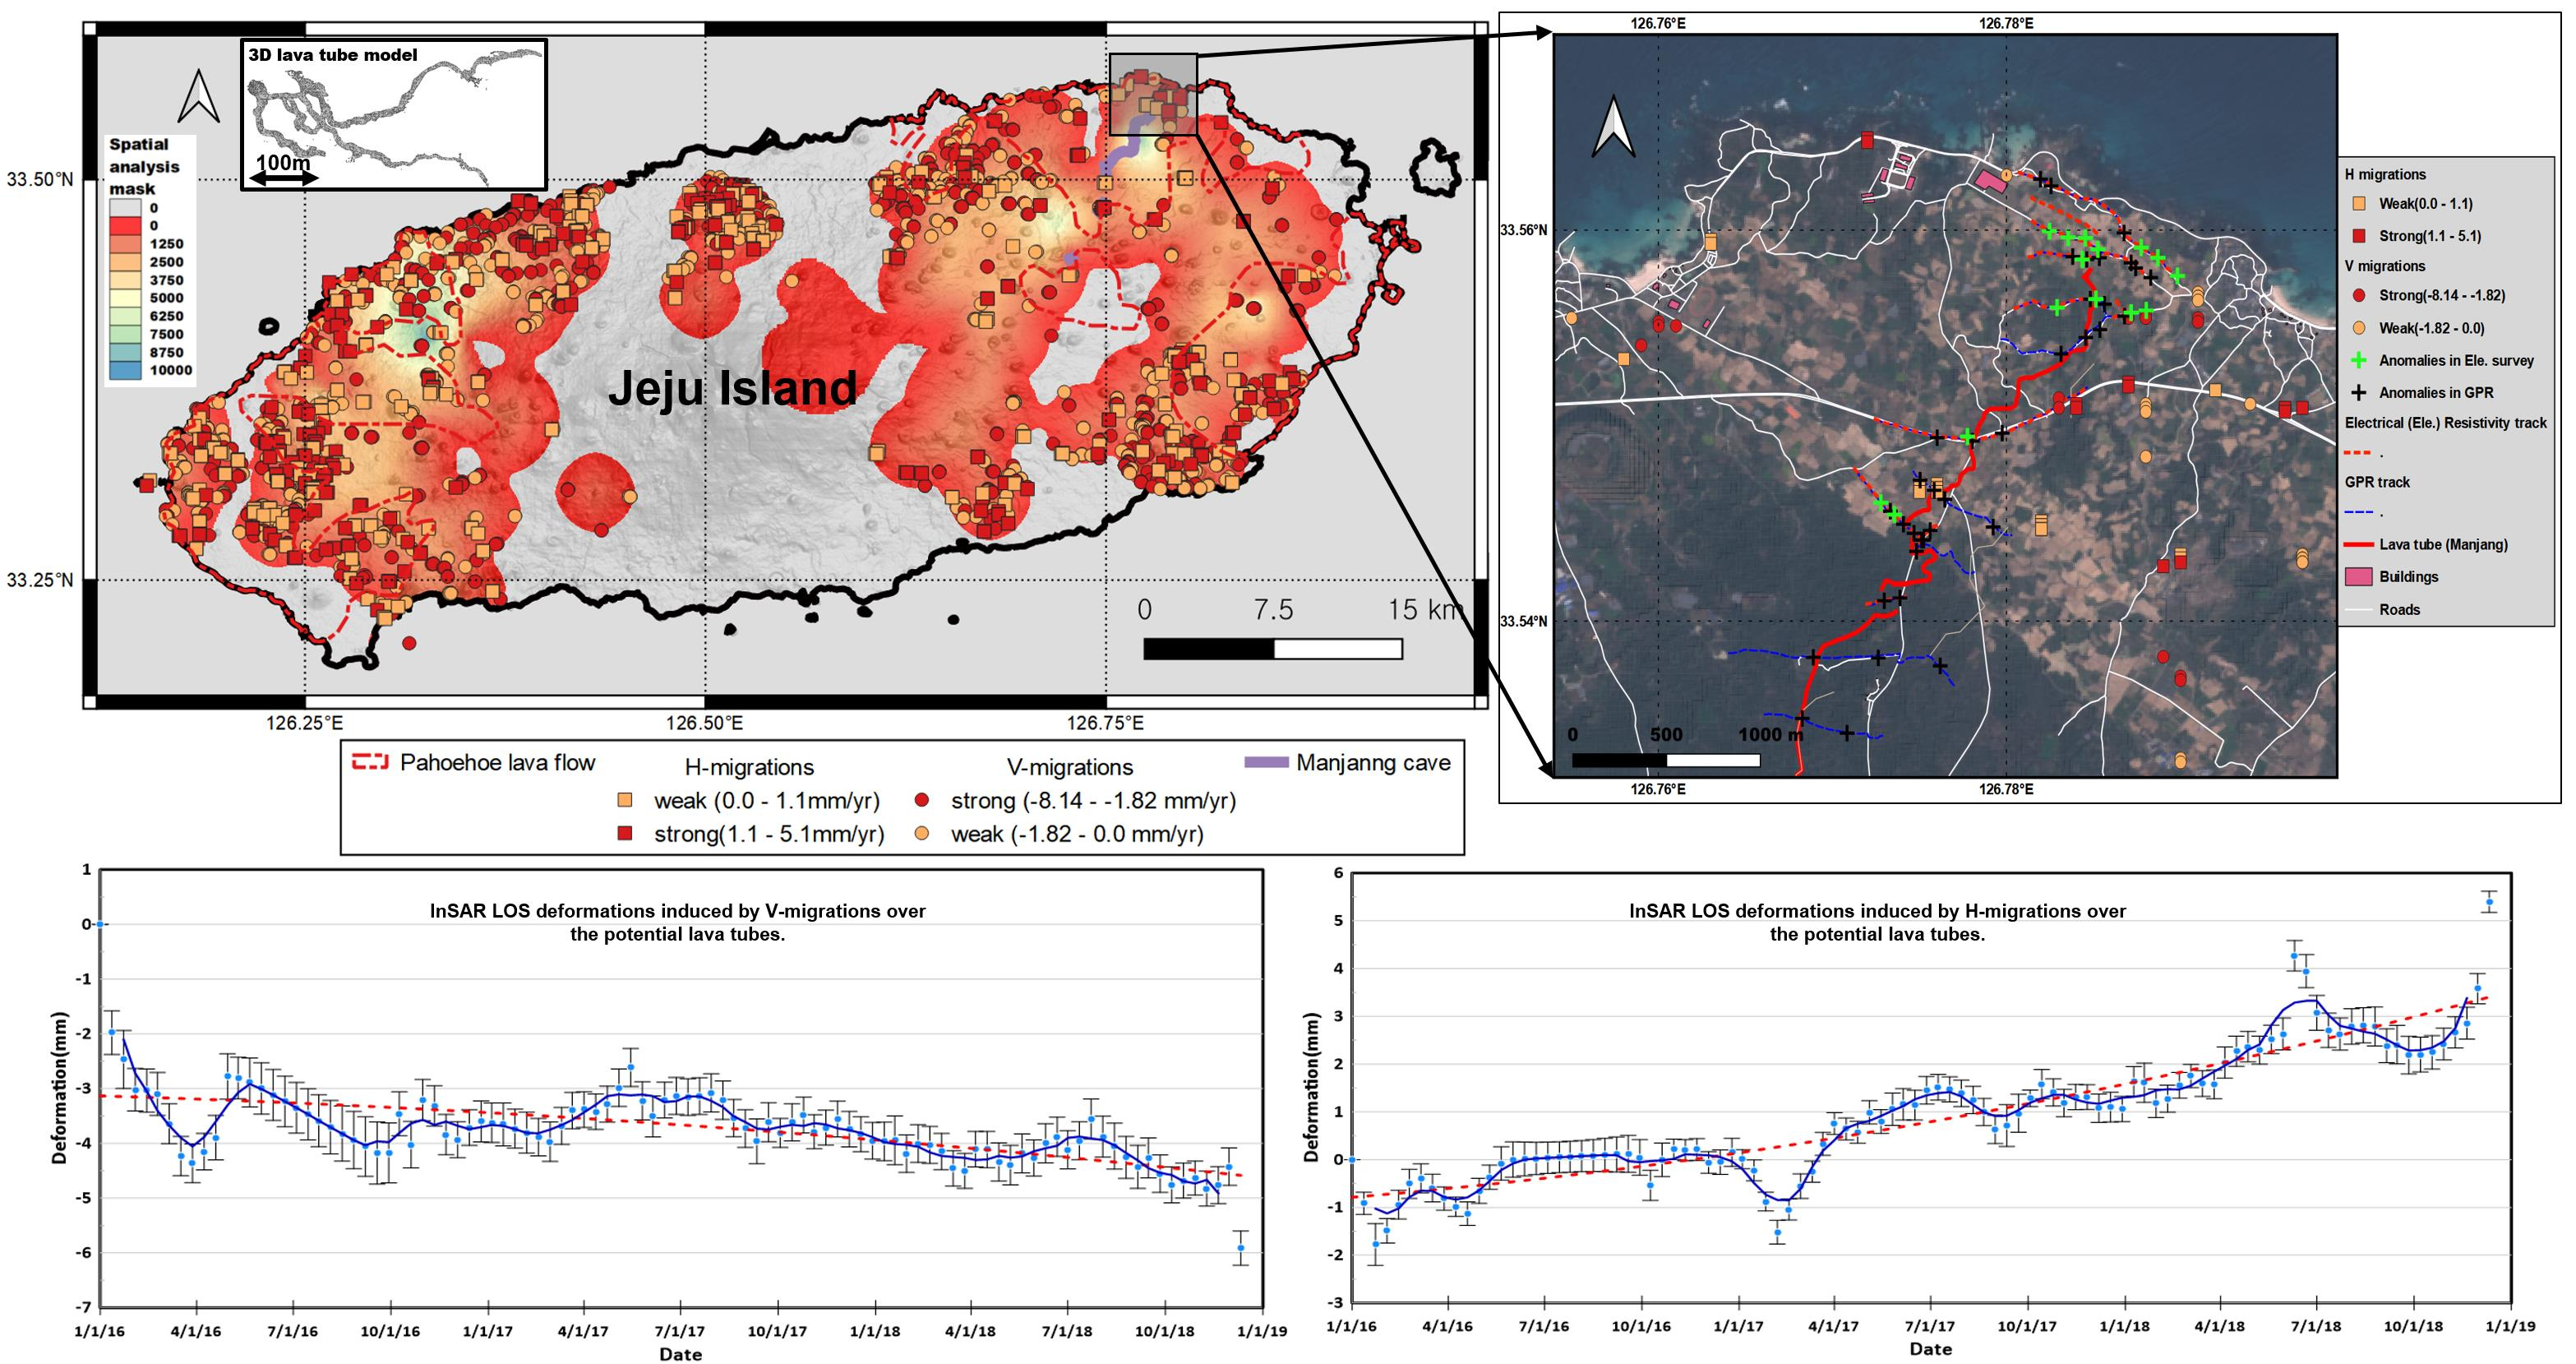
Jeju Island was overall investigated in this study, where lava tubes distributed throughout the island are shown in Figure 1. The United Nations Educational, Scientific, and Cultural Organization (UNESCO) evaluated the unique geological landscape and designated nine geological attractions in 2010 and three more in 2014. The presence of lava tubes and involved volcanic cones are highly distinguished among them.
It is worth noting that there are conflicting theories about the origin of volcanism on Jeju Island. One theory interprets the entire island as a shield volcano [33], while another suggests that it is a composite volcano [34,35,36]. Also, according to a study conducted by [37], Jeju Island was formed based on the accumulation of outpoured lava flows and pyroclastic rocks erupting from a polygenetic composite volcano. The materials were intercalated or underlain by the Seogwipo Formation [38].
According to the extensive fieldwork and interpretation of stratigraphy, the alkali-basalts lava effusion on land started about 1 Ma years ago and continued until the Holocene [37,39,40,41]. Furthermore, [37] demonstrated that there have been extensive post-depositional volcanic activities on land after the termination of sedimentation of the Seogwipo Formation since about 0.5 Ma. Such studies conclusively proposed that volcanic eruptions from 0.3 Ma to 0.1 Ma must have shaped the body of Jeju Island. Also, volcanic eruptions from 0.1 Ma to the Holocene constructed the present topography of Jeju Island and its various types of lava tubes. The rocks distributed at lower land areas in the eastern and western regions are predominantly transitional basalts, tholeiitic basalts, and andesite in composition, compared with those in the northern and southern regions. This petrological evidence proposed that lava tubes were primarily formed due to volcanic activities in 1.88~0.5 Ma and the post-depositional period (0.5 Ma~Holocene) [37,42,43], which implies that the lava tubes might have originated from the numerous lava events in the Quaternary (see Figure 1a). Although the number of lava tubes is different and has gradually increased according to survey works, Jeju volcanic Island exhibited more than 179 well-documented lava tubes, including 144 lava tubes and 35 sea caves since February 2016 [18]. Among these 179 caves, 122 caves were scattered in the eastern (22%) and western areas (51%) of Jeju City and the eastern areas of Seogwipo (19%). A total of 200 lava tubes have been identified in Jeju Island in the recent research conducted by [16].
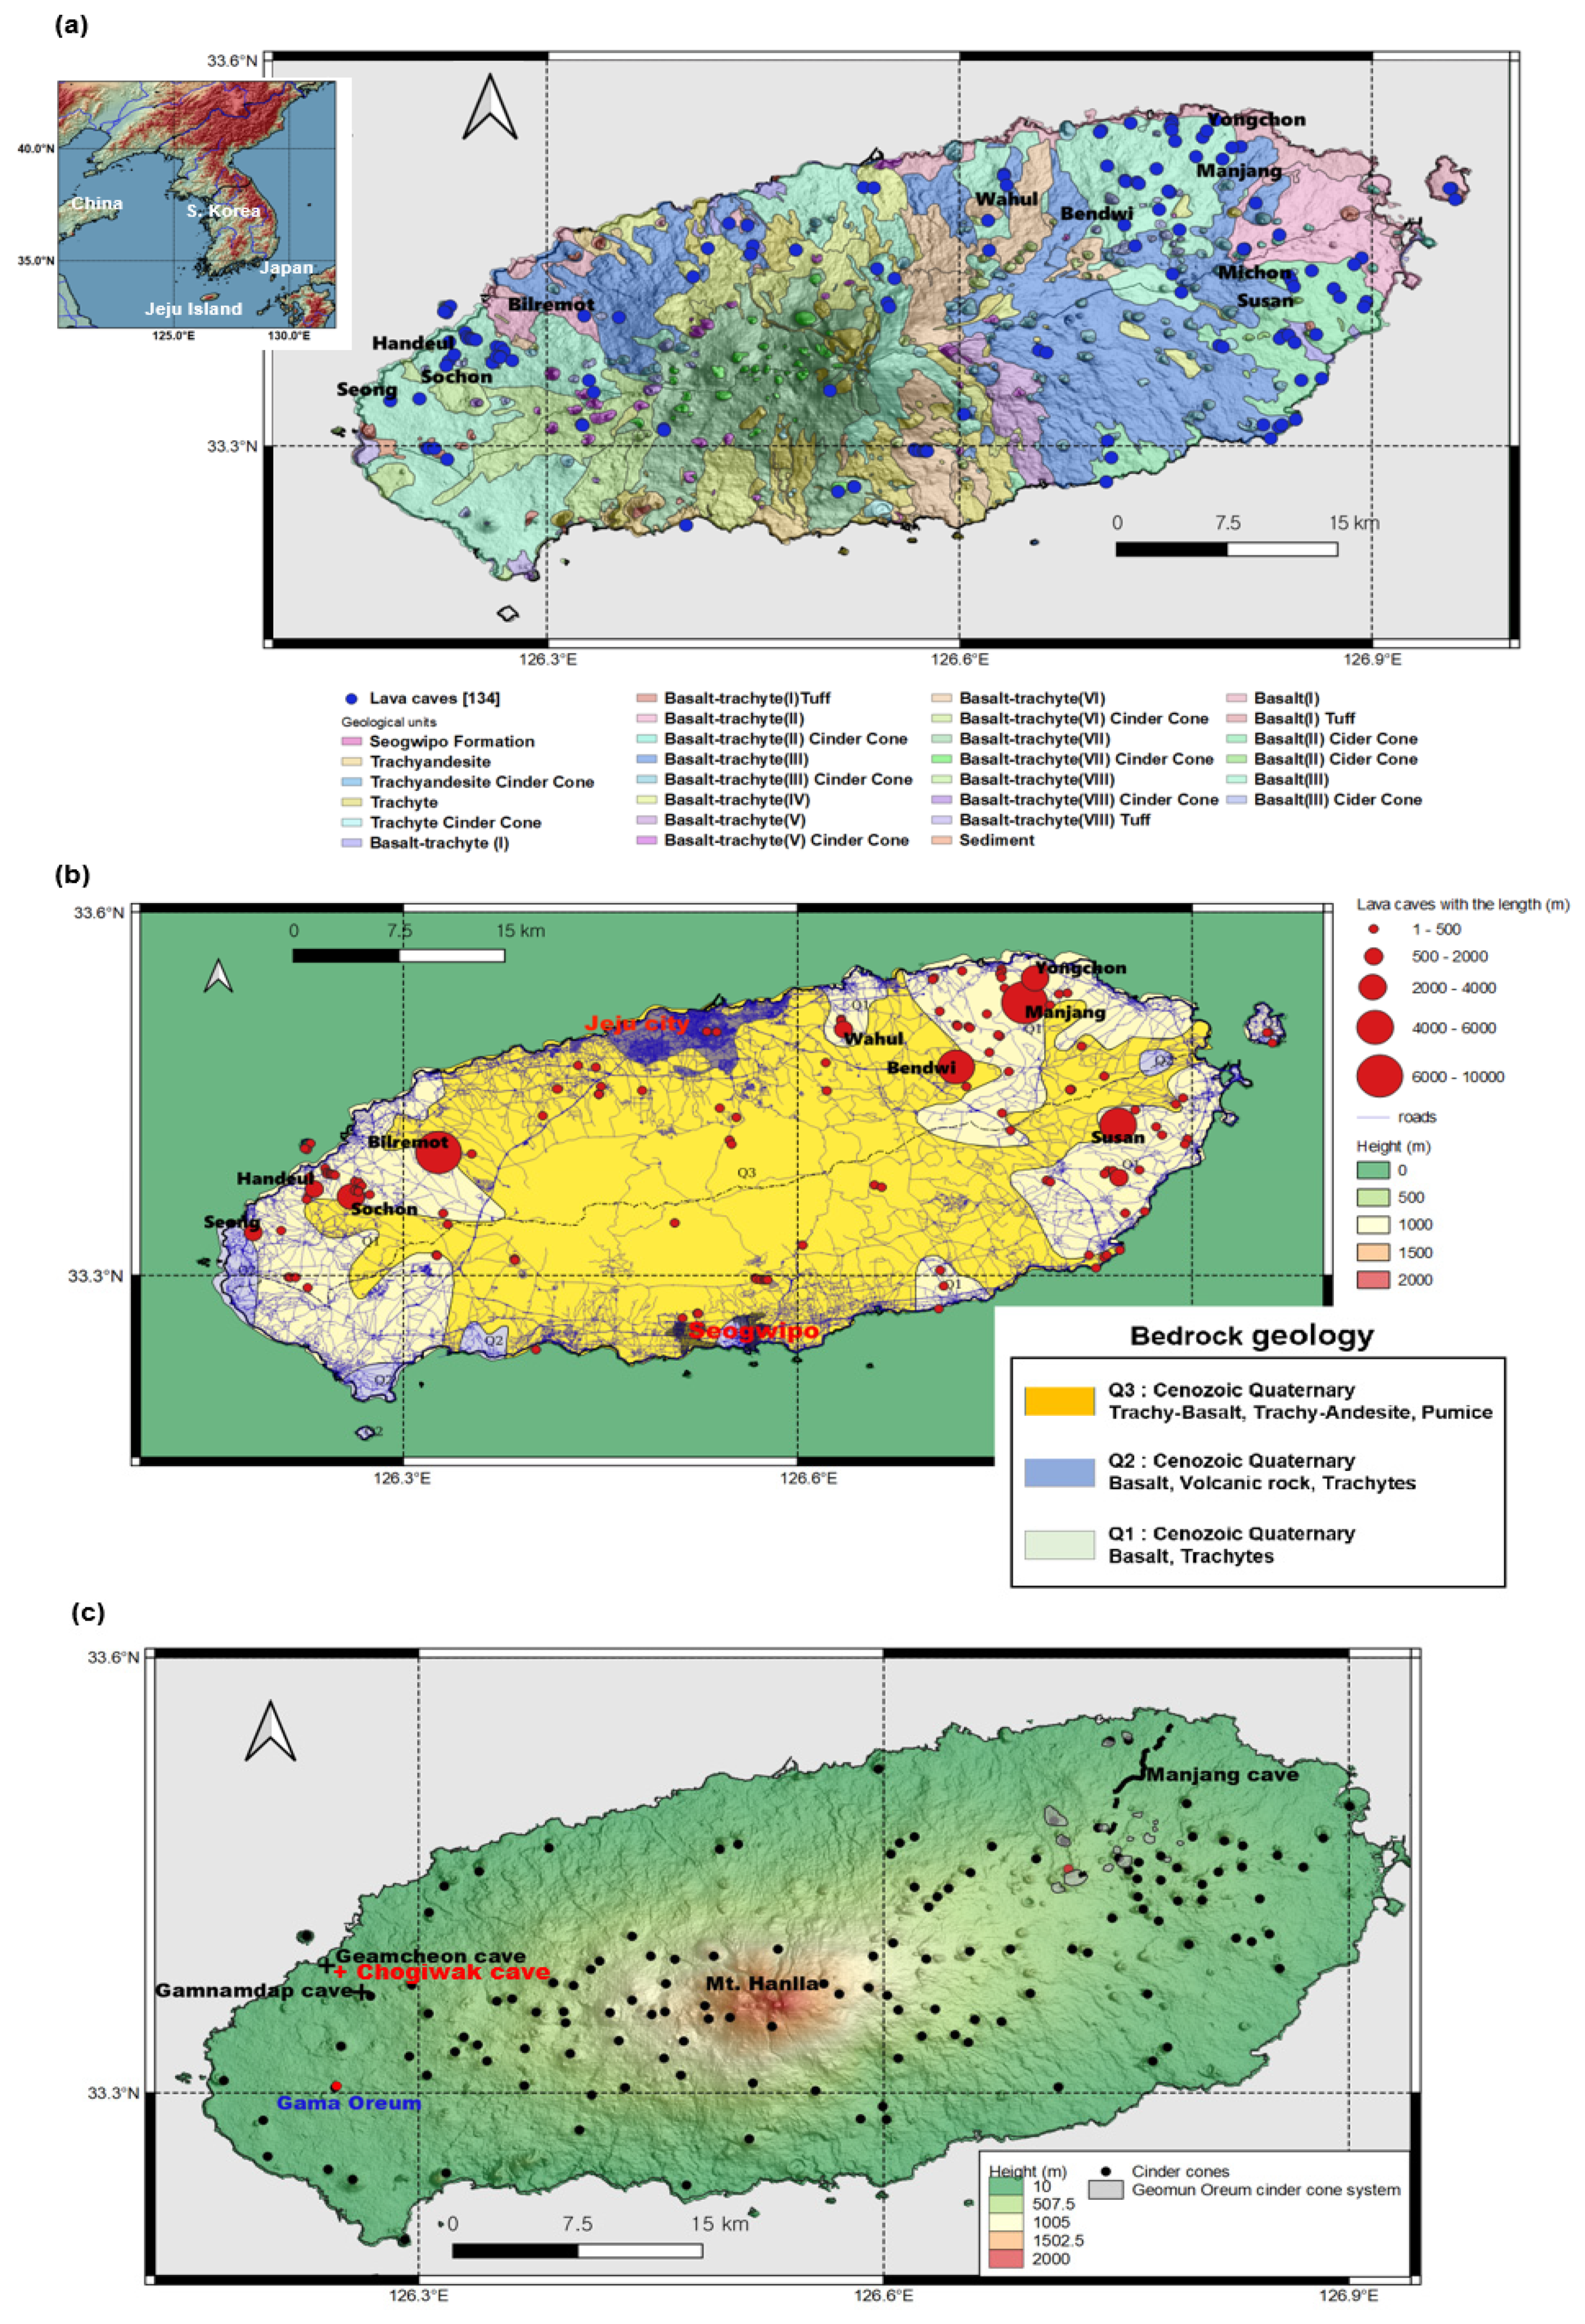
It has been proven that lava tubes only exist with basalt low-viscosity lava flow, known as pahoehoe lava (see Q1 unit in Figure 1b). However, the progressive discovery of lava tubes since 1990 somehow conflicted with such findings. Some major lava tubes cross the basaltic andesite lava flow, known as ʻaʻā lava, presented as Q2 in Figure 1b, and have far higher viscosity (refer to [5,14,44] for a detailed explanation of the evolution processes of Jeju lava tubes). Lava tubes are usually connected to cinder cones, as shown in Manjang cave and Geomun Orum cinder cones systems illustrated in Figure 1c. Photos and TLS results in Figure 1d present a few lava tubes morphologies, including shallow caves populated in ʻaʻā lava flows (in Geamcheon and Chogiwak caves) and other ordinary cave developments in pahoehoe lava flow (in Gamnamdap and Manjang cave, see following sections).
Research conducted by [44] showed that 27 of the 37 examined lava tubes faced severe collapse and destruction problems. Most lava tubes in Jeju Island show that internal and/or external failure and destruction problems resulted from disconnected lava tubes. The investigation was conducted on 27 out of 179 roads over the lava tube. Results showed that 37% (e.g., Sunggul, Cheamchongul, Chogiwatgul, Jungryugul, Bangdyi cave, Manjang cave Yongchun cave, Susan cave, Michun cave, Bilraemot cave, Bullalit cave) of the 27 examined lava tubes faced serious collapse and destruction problems. Moreover, 55 crossroads located over six natural monument caves out of 27 caves already had problems that required urgent actions to protect citizens in the cave tours. Thus, a series of practices is required to address the issue regarding the collapsed and destroyed lava tubes, including (1) safe policy for roads over tubes; (2) a geophysical engineering survey of 27 lava tubes on mega-sized construction sites; (3) Cave Geographic Information Systems (CGIS) implementation for systematic operation and management, and (4) a safe guide panel on the dangerous sites in Jeju Island.
Figure 1.
Geological context and lava caves of Jeju Island. (a) Lava tubes in detailed geological units associated with cinder cones and lava flows. (b) Lava tube distribution, bedrock geology, and road networks. (c) The topography of Jeju Island is shown and locations of major study sites are labeled. Hereafter, a map projection is WGS 84 geographic coordinate system unless otherwise noted. (d) TLS point distributions demonstrating internal structures and on-site photos collected in Geamcheon, Chogiwak caves. Geological units and background geology, together with cone volcanoes distribution, are based on [38]. The lava tube distribution is taken from [16]. Photos in Chogiwak cave were taken from the Korean Cultural Heritage Administration.


2.2. Data Sets
The technology of space geodesy, such as InSAR data analysis, is widely used to observe minor surface migration over a long period. This has been successfully exploited to detect underground stability caused by depressurization, cavity creations, and subtle surface creep [45,46,47,48]. Thus, we expected the surface deformation on shallow lava tubes and cavities in Jeju Island are in the scope of InSAR observation accuracy estimated to be a few millimeters. In terms of data availability and spatiotemporal coverages for reliable InSAR processing, the only feasible data set is Sentinel-1 SAR imagery [49]. Sentinel-1 SAR imagery acquired by two SAR-satellite constellations, Sentinel-1A and 1B operating from 2015 and 2016 respectively, is freely available on the public domain, Sentinel data hub (https://scihub.copernicus.eu/, accessed on 7 January 2022). Therefore, the Sentinel-1 constellation provided six days of revisit time, which is enough to construct the InSAR time series network. Their Interferometric Wide-swath mode (IW) operation with Terrain Observation and Progressive Scans SAR (TOPSAR) imaging makes available precise monitoring of the target area with a moderate spatial resolution (20 m in azimuth and 4 m in range) and 250 km wide swath coverage [49]. Its C-band wavelength especially guarantees relatively minor ionospheric errors carrying long-wavelength artifacts compared to L-band SAR data. Since the estimated surface deformation over lava tubes is insignificant compared to the external error components, we were obliged to use InSAR time series analysis to obtain the displacement velocity. Detailed specifications of SAR images associated with time-series InSAR analyses were introduced in Section 4.
Terrestrial Laser Scanning was applied to observe the cave in this study. A number of subsurface morphologies in lava tubes were established by TLS to demonstrate their stability as shown in Figure 1d. Laser scanning was conducted using FARO Focus3D X330 laser scanner and GPS receiver. The point density of laser scanning was set as 15 mm. Targets were pre-installed to be used as a joint point for data merging and as an inspection point. The targets were installed without interfering with the point cloud acquisition inside the cave. Once the scan was finished, the scanned point cloud models collected in multiple stations were registered to form one complete model in the FARO SCENE 5.4 data post-processing software. Given the parameters such as the number of points, the number of repetitions, and the search range, the registration error value was calculated within ±2 mm. After that, noise removal and geo-referencing were performed based on ground control points to construct a fully co-registered 3D cave model for three lava caves. TLS missions in those lava caves were conducted as part of the Jeju lava tube exploration project led by the Jeju provincial government in collaboration with the nomination committee of UNESCO geological attractions. However, due to the absence of height data fields over some parts and inaccurate co-registration with ground coordinate caused by a difficult observation environment (it was totally dark at some sections of the tube), the TLS data sets are limited for accurate measurement. Therefore, we only employed TLS as auxiliary data for the 2D shaping of cave morphology rather than as base data for the numerical brittle deformation model.
3. Methods
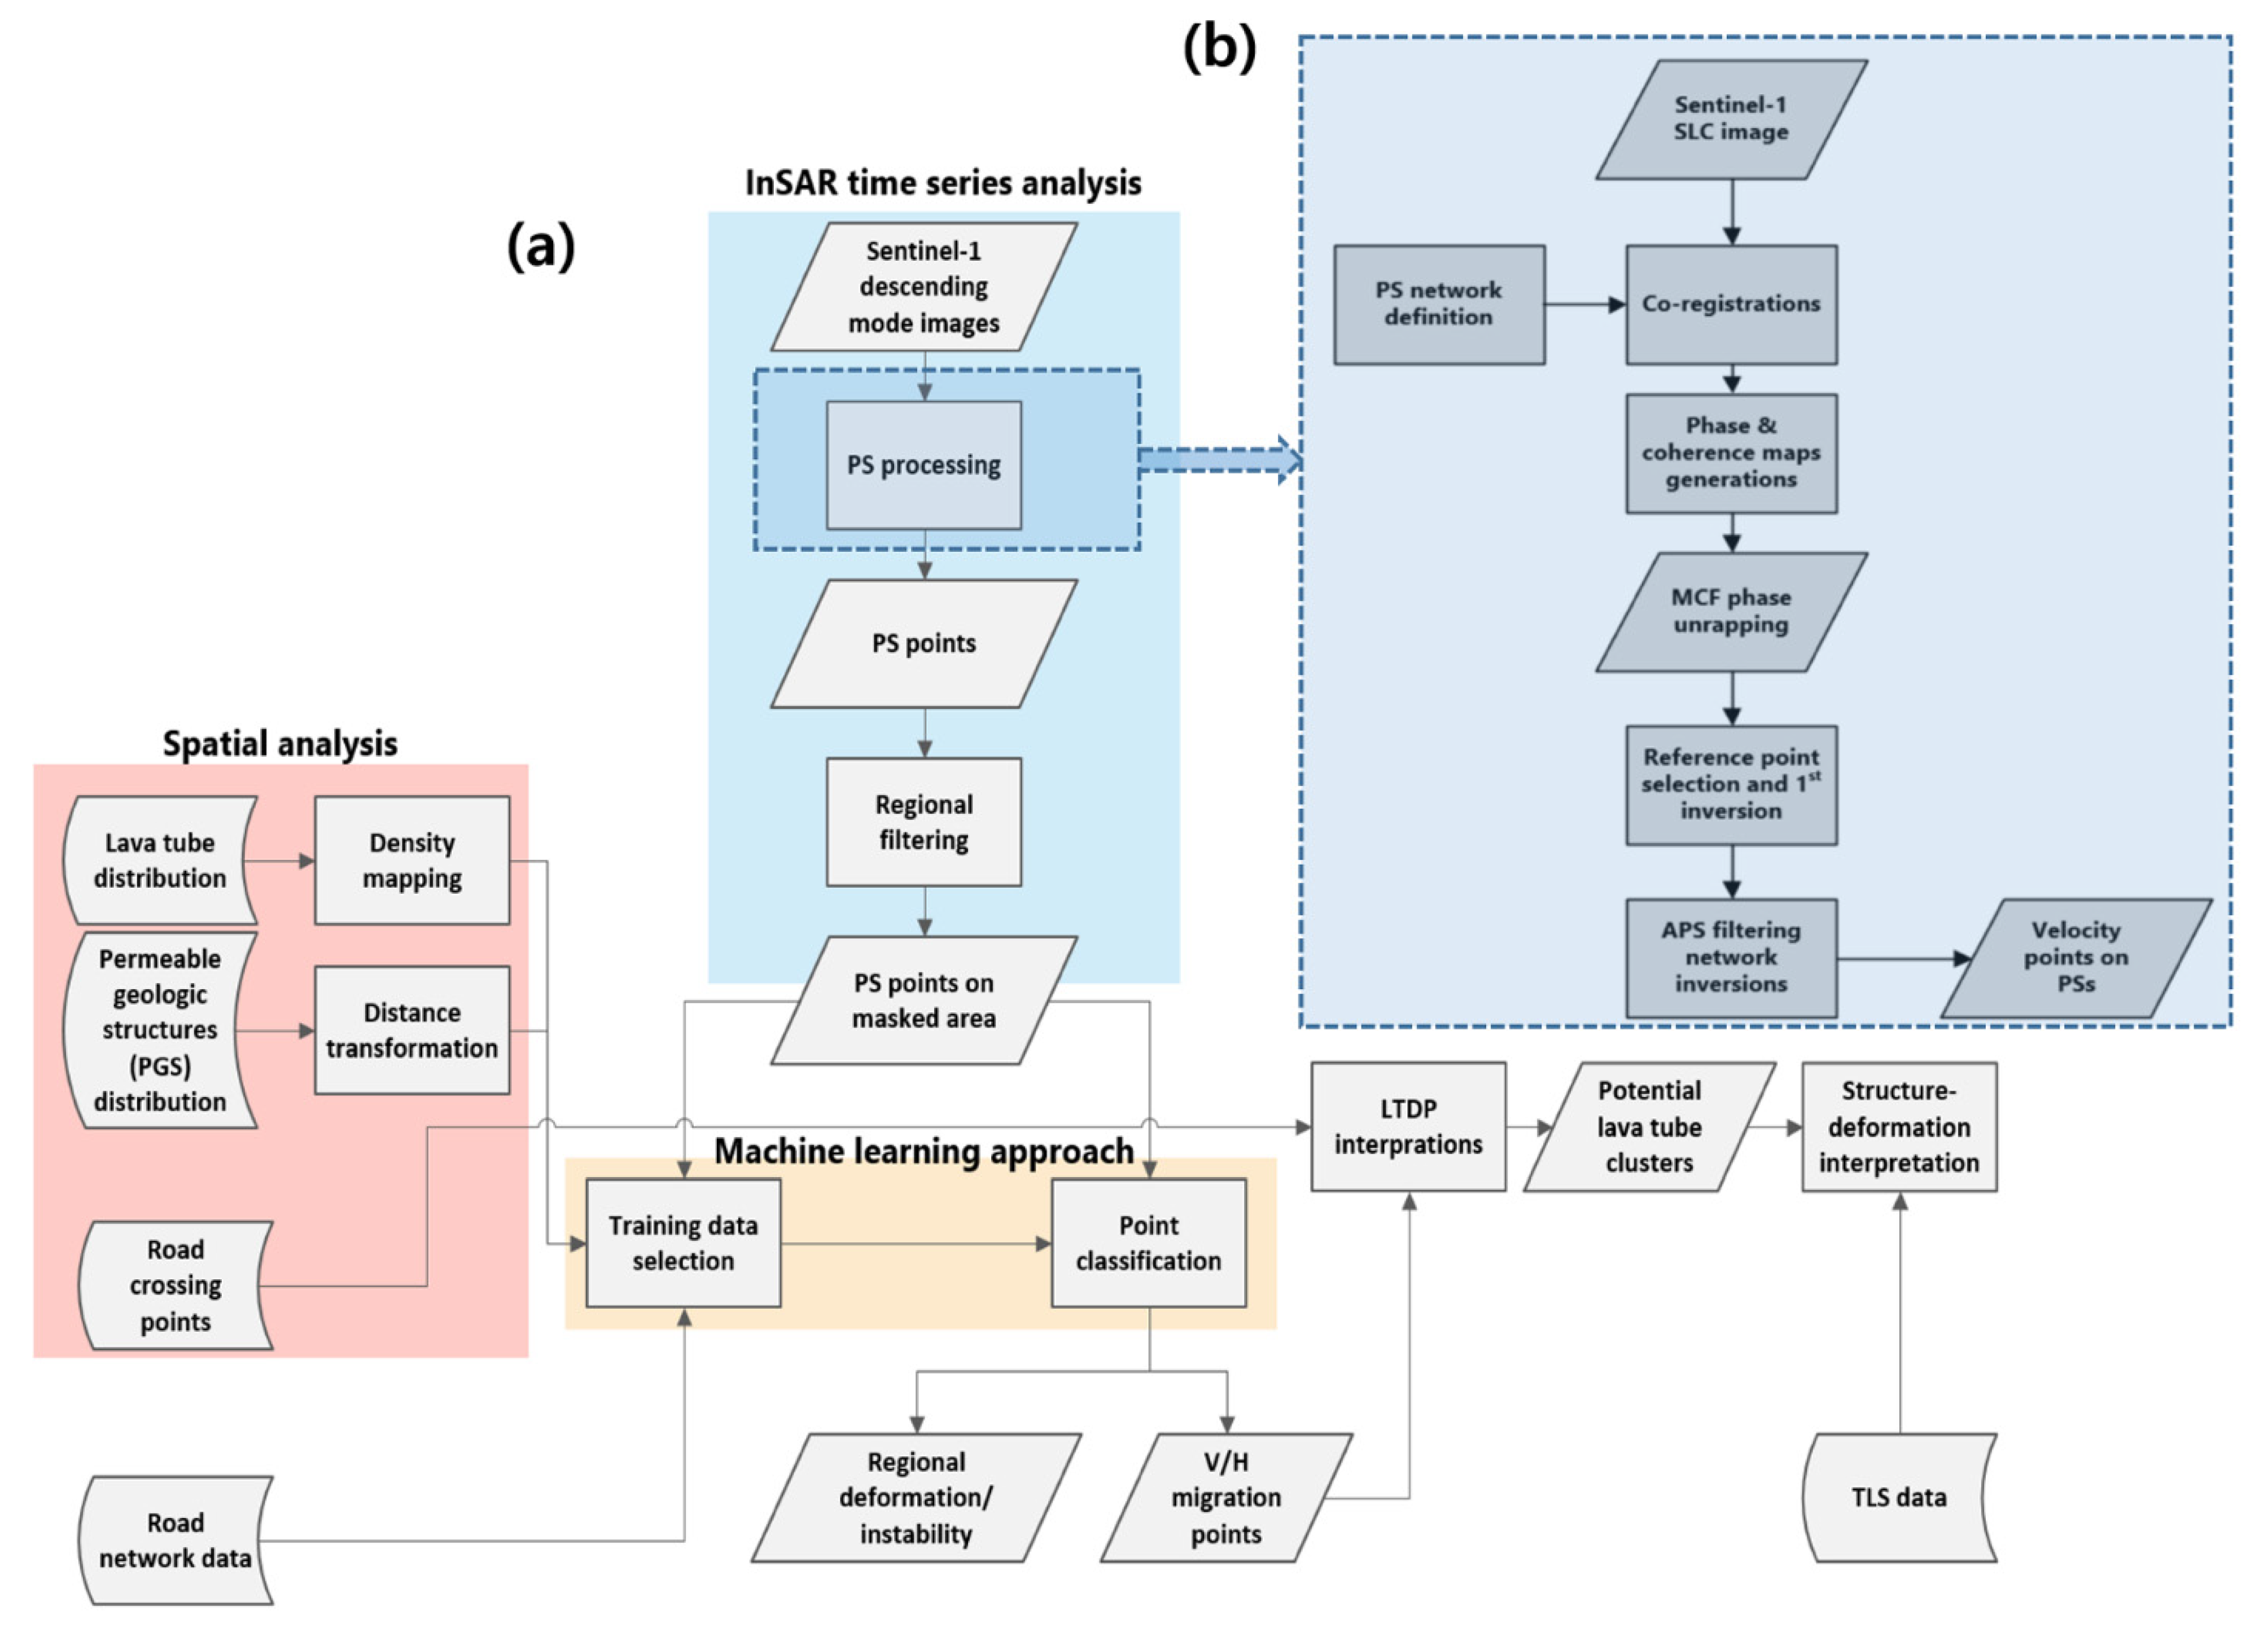
Figure 2 shows the data processing flow to detect LTDPs combining InSAR time series analysis, spatial analysis, and machine learning methods with subsequent interpretation. Since expected deformation caused by undiscovered lava tubes is supposedly small and highly localized among the large InSAR observational coverage, the strategy in this study was to perform investigations based on multiple clues. InSAR time-series analysis, so-called Persistent Scatterers (PS), was the core component in the strategy. Persistent Scatterers were used to monitor the temporal migration on specific scatterers, such as crossing points of roads and lava tubes [50,51].
Regarding the implementation, PS analysis first extracted all pointwise deformations. Then the PS observation points were pre-filtered by the extracted mask through spatial analysis. Classification by machine learning algorithms was then employed to classify all pre-filtered PS points into several categories. The results were interpreted to identify LTDP candidates over undiscovered lava tubes.
The PS method exploits strong scatterers in time series interferograms, which are paired by a common master image and a sufficient number of slave images. The observations and error component terms of InSAR to be handled in algorithms of time series analyses are expressed as follows:
where is the phase difference of interferogram, is the phase difference by target topography only, is the phase difference by inaccurate orbital information, is the phase difference by inaccurate base topography, is the other phase noise, is the phase difference by atmospheric phase components, and is the phase difference caused by delay in the ionosphere. In different time series InSAR networking methods, for instance, a master to multi-slaves in PS and multi-masters to multi-slaves in small baseline subsets (SBAS) technique [52], the error components were interpolated and canceled accordingly. In this study, we aim to precisely trace individual scatterer’s behavior; thus PS became the primary InSAR time series technique.
The core idea of the PS algorithm is to discriminate Persistent Scatterers with constant responses for amplitude dispersion and to address error estimations using iterative non-linear equations. PS processing was initiated by a master to multi-slave interferogram network construction. Stable PS observations were then taken for the base of network inversion. The network was inverted together with the filter-out of error components, called atmospheric phase screen (APS) in each slave to master pair, which is mainly induced by and components as described in Equation (1). The APS canceling procedure was iteratively applied by an increasing number of PS points up to the final estimation of . Then, the deformations in topography in each PS can be driven on the condition that is negligible. Although PS requires a large number of image stacks, the accuracy of InSAR deformation is up to 1 mm/year [53]. On the contrary, the PS algorithm often suffers from a lack of observation density and PS variants were often introduced. In this study, the target area has quite large areas’ rocky/low vegetation land cover with stable rock scatterers. Therefore, we were able to employ the conventional PS algorithm to observe the temporal migration with high precision. The density of extracted scatterers was also observed to be sufficient for further interpretation. The PS procedure applied in this study is summarized in Figure 2b. The procedure of InSAR time series analysis was conducted by SARscape, a commercial InSAR processor. For InSAR processing, the orbital files were updated by the ESA Precise Orbit Determination (POD) service (https://aux.sentinel1.eo.esa.int/, accessed on 7 January 2022). Shuttle Radar Topography Mission (SRTM) DEM v 3.0 with 30 m resolution was used as the base DEM for InSAR processing. The connection graph of employed interferograms for the PS time series in this study is given in Figure 3.
4. Results
4.1. InSAR Time Series
As mentioned above, Sentinel-1 SAR images are optimal data for this study as the time series of the PS network covered a two-year period with 72 images in descending mode as shown in Figure 3. Unfortunately, Sentinel-1 ascending mode coverage over Jeju Island only has a few pairs, which are not adequate for any time series analysis; thus, ascending mode InSAR time series data is not available in this study. The basic characteristics of Sentinel-1 imagery are summarized in Table 1.
Although InSAR techniques have been effectively used for natural and artificial surface deformation observations, land surface monitoring caused by instability on the subsurface cavity would be a challenge due to the expected low deformation rate as long as the observation does not cover the collapsing phase of the lava tube.
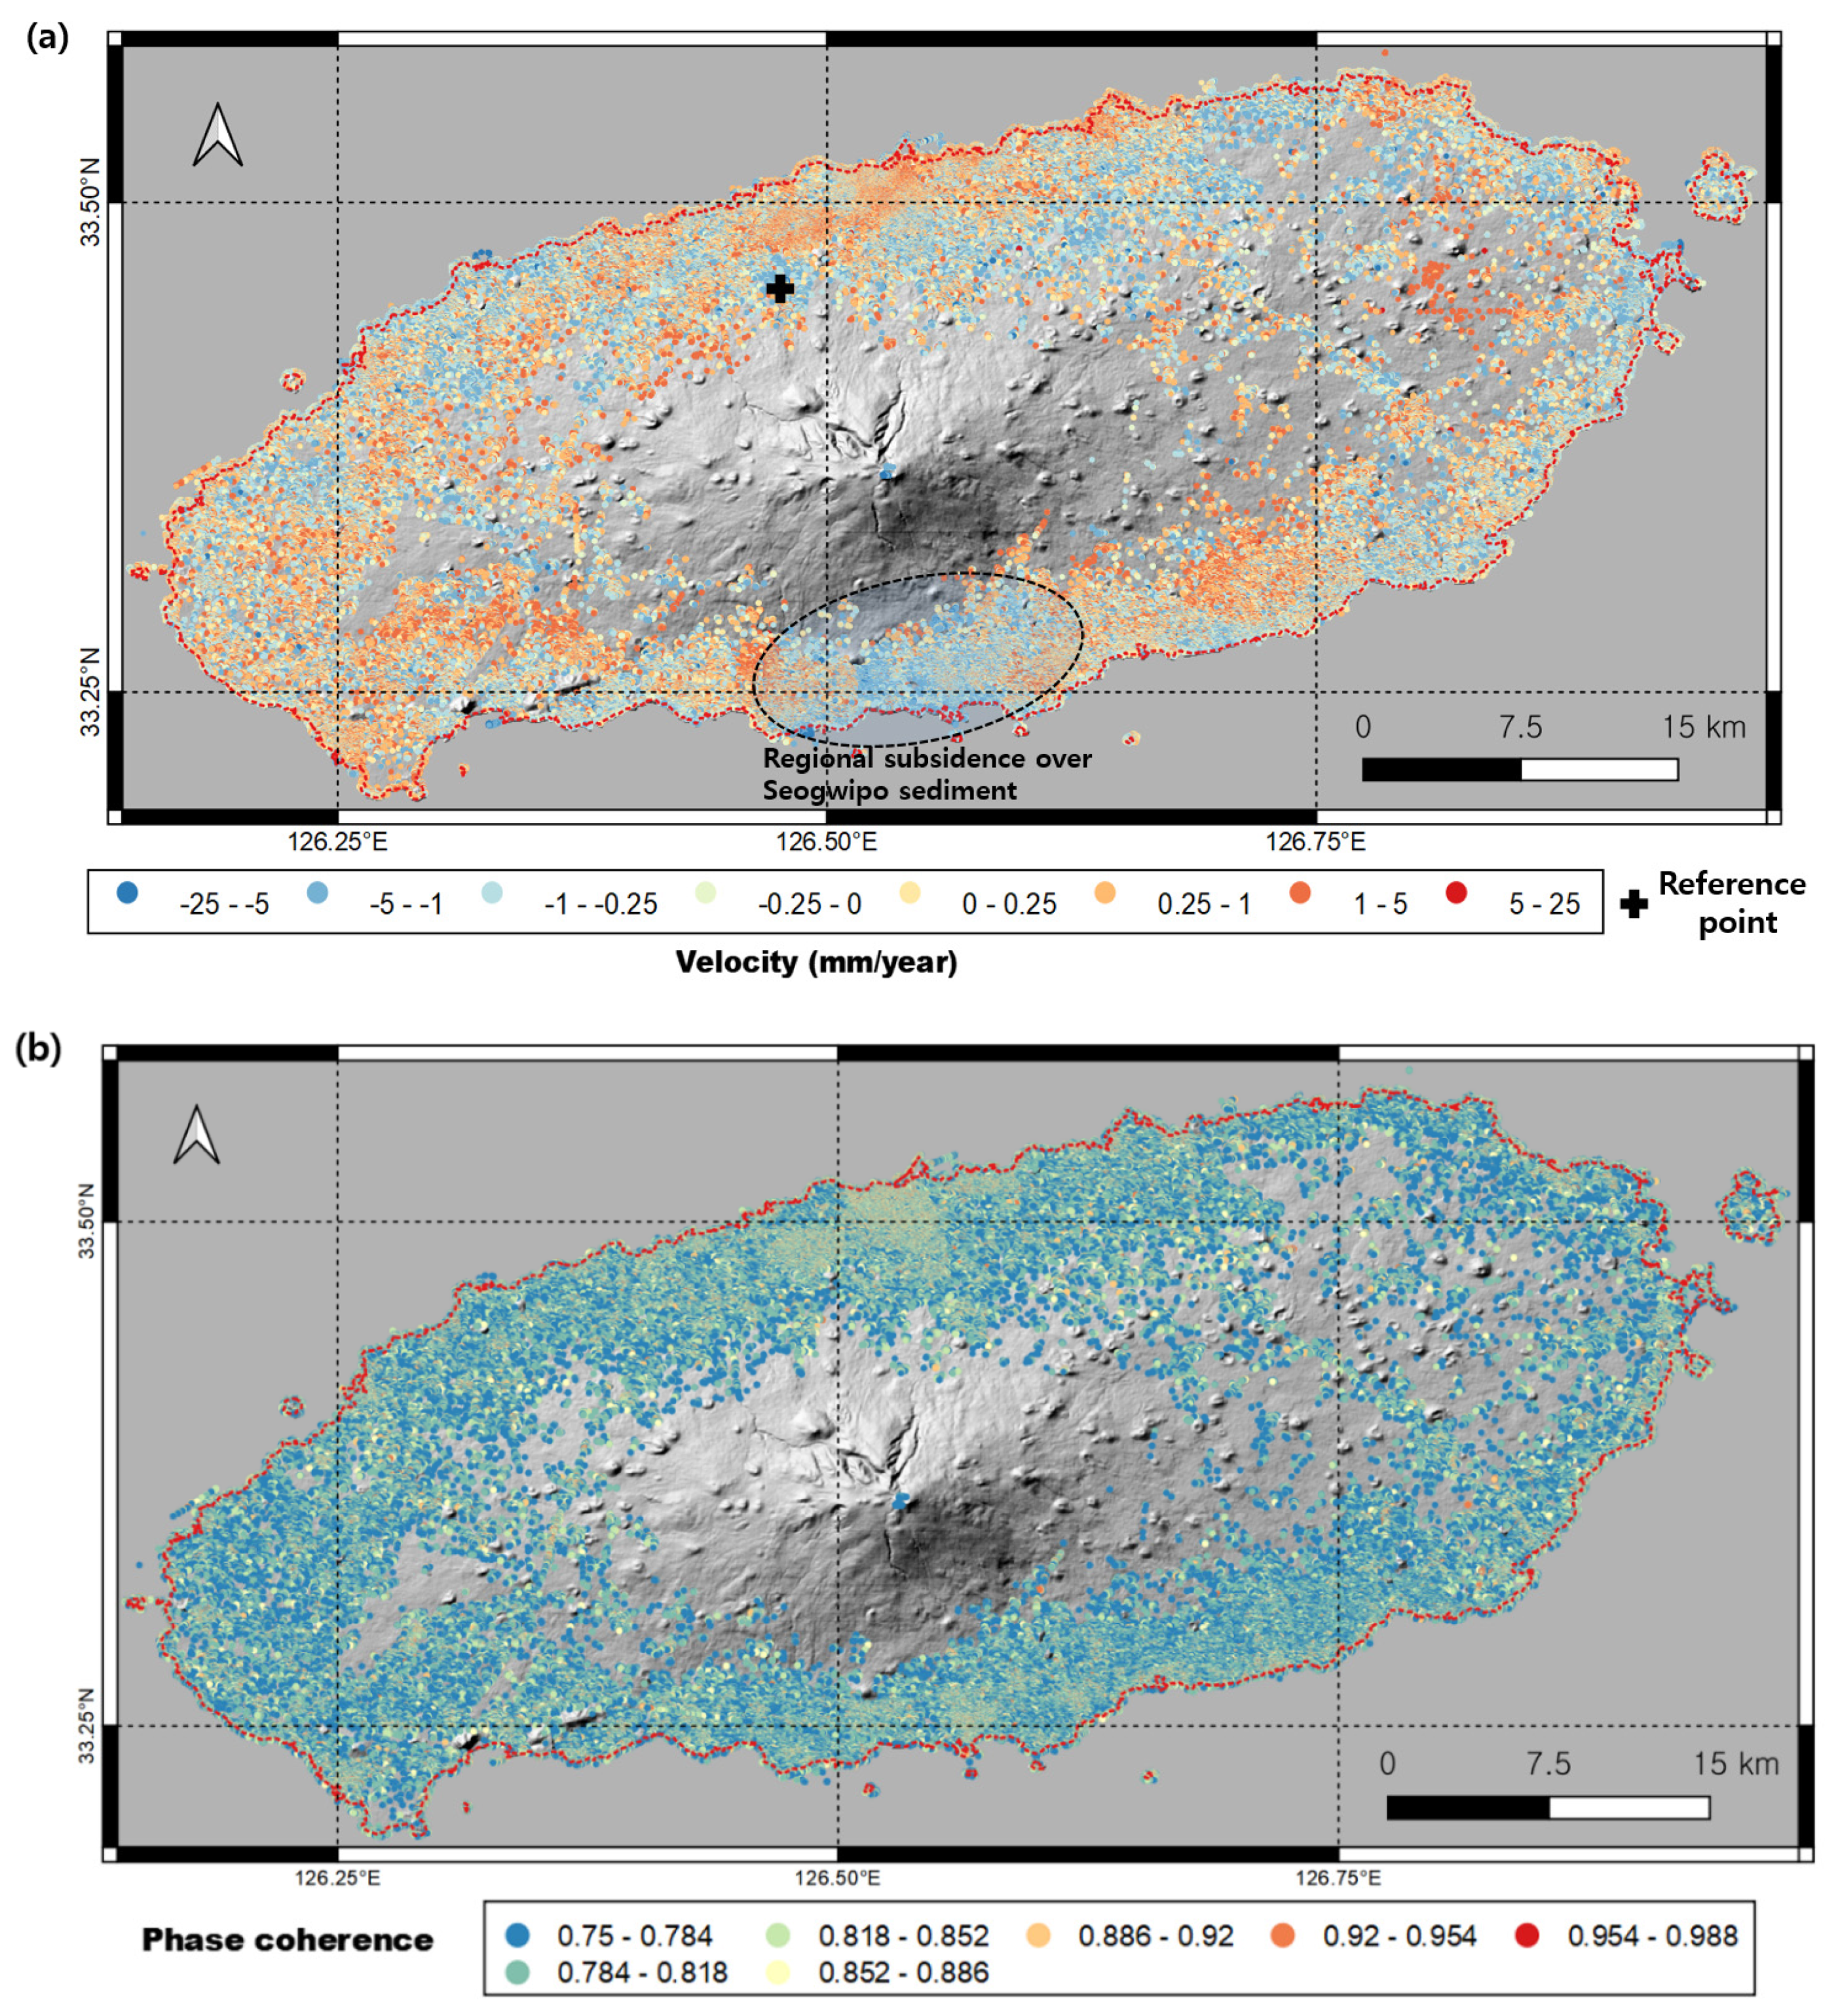
Figure 4a shows the LOS displacements extracted via the PS time series analysis in the target area together with the corresponding average phase coherences (Figure 4b). The stable reference point of InSAR deformations was carefully chosen based on the stability and dispersion of phase coherence and deformation rate. The time series LOS surface deformation demonstrates that the displacements on a large number of PS points are quite tiny (<1 mm/year). However, there are a few obvious strong regional deformations. We may consider such regional LOS migrations as either different thermal dilations of bedrocks induced by weather change or different brittle deformations of bedrocks responding to large-scale dynamic stress [54,55] in geological units. However, the ground subsidence in Seogwipo sediment was interpreted as an effect of loading by ongoing heavy construction projects in Seogwipo. As PS observations certainly come from localized scatterers such as artificial structures or significant rocky objects, it implies that there is plausible surface migration induced by various localized instabilities, including potential LTDPs.
4.2. Machine Learning for Point Classification
Despite long historical research work, the distribution pattern of lava tubes remains unclear. One clue to reveal the pattern is the involvement with low viscosity lava flow, known as pahoehoe lava [56]. However, as shown in Figure 1, the spatial extent of pahoehoe lava flow and distribution of lava tubes are not highly correlated. Therefore, we tried to constrain the potential distribution of lava tubes using other evidence. We created a density map of lava tubes (179 in total) with the weighted values of their lengths and the co-kriging interpolation as shown in Figure 5b. The other useful information to spot the subsurface lava cavity is the existence of a permeable geological structure (PGS) so-called “Sumgol”, which assigns the collapse locations of the lava cavity or the vertical joints or cracks over lava flows [57]. It is presumably related to the distribution of undiscovered lava tubes. We digitized the PGSs and applied the distance transformation with the city block sampling method [58] as shown in Figure 5d. The convolution of two spatial distributions was proposed to represent subsurface cavities by lava flow. The convolution corresponds to the simple additions of the two materials as we do not apply any weighting. The gridded data sets assigned as the distribution of PGS and the footprints of lava tubes were employed to further process InSAR data sets as a constraint. The other data sets extracted from the geospatial information were used for the ground truth and validation. The details are described in Section 5.
Lava tube instability has been also identified by the structural analyses employing Finite Element Method (FEM) in [59,60] and demonstrated in the fieldwork reported in [44]. As surface deformation was evident, InSAR time series analysis capable of observing a wide area was proposed to observe displacement induced by lava tubes. In particular, PS velocities present LOS directional behaviors on localized landscape objects; thus, PS was used to identify the LTDP and associated risks. Meanwhile, the sinkholes detected by InSAR analyses previously performed by [46,47,61] were proposed as comparable study cases as the cavities induced by underground sinkholes and lava tubes would cause similar surface deformations. Although we were able to extract a large number of deformation candidates based on the InSAR analysis results, the technical difficulties in discriminating potential LTDP remain as follows: (1) there are false LTDP caused by other factors such as regional subsidence, thermal dilations, and failures of InSAR algorithms; (2) the behavior of LTDP is not clear, as we do not have precise ground truth; (3) the domains to be tested as target LTDP are enormous because the PS observations included more than 200,000 points all over Jeju Island.
To address these difficulties, we introduced machine learning methods. First, we built the training datasets based on the spatial analyses and the geological/demographic contexts. The established ground truth data sets were then feedforwarded to the training stage of the proposed machine learning methods. Subsequently, we classified all PS target points using trained machine learning platforms. The extracted points as LTDPs were re-analyzed in the comparison of background context and validation data sets.
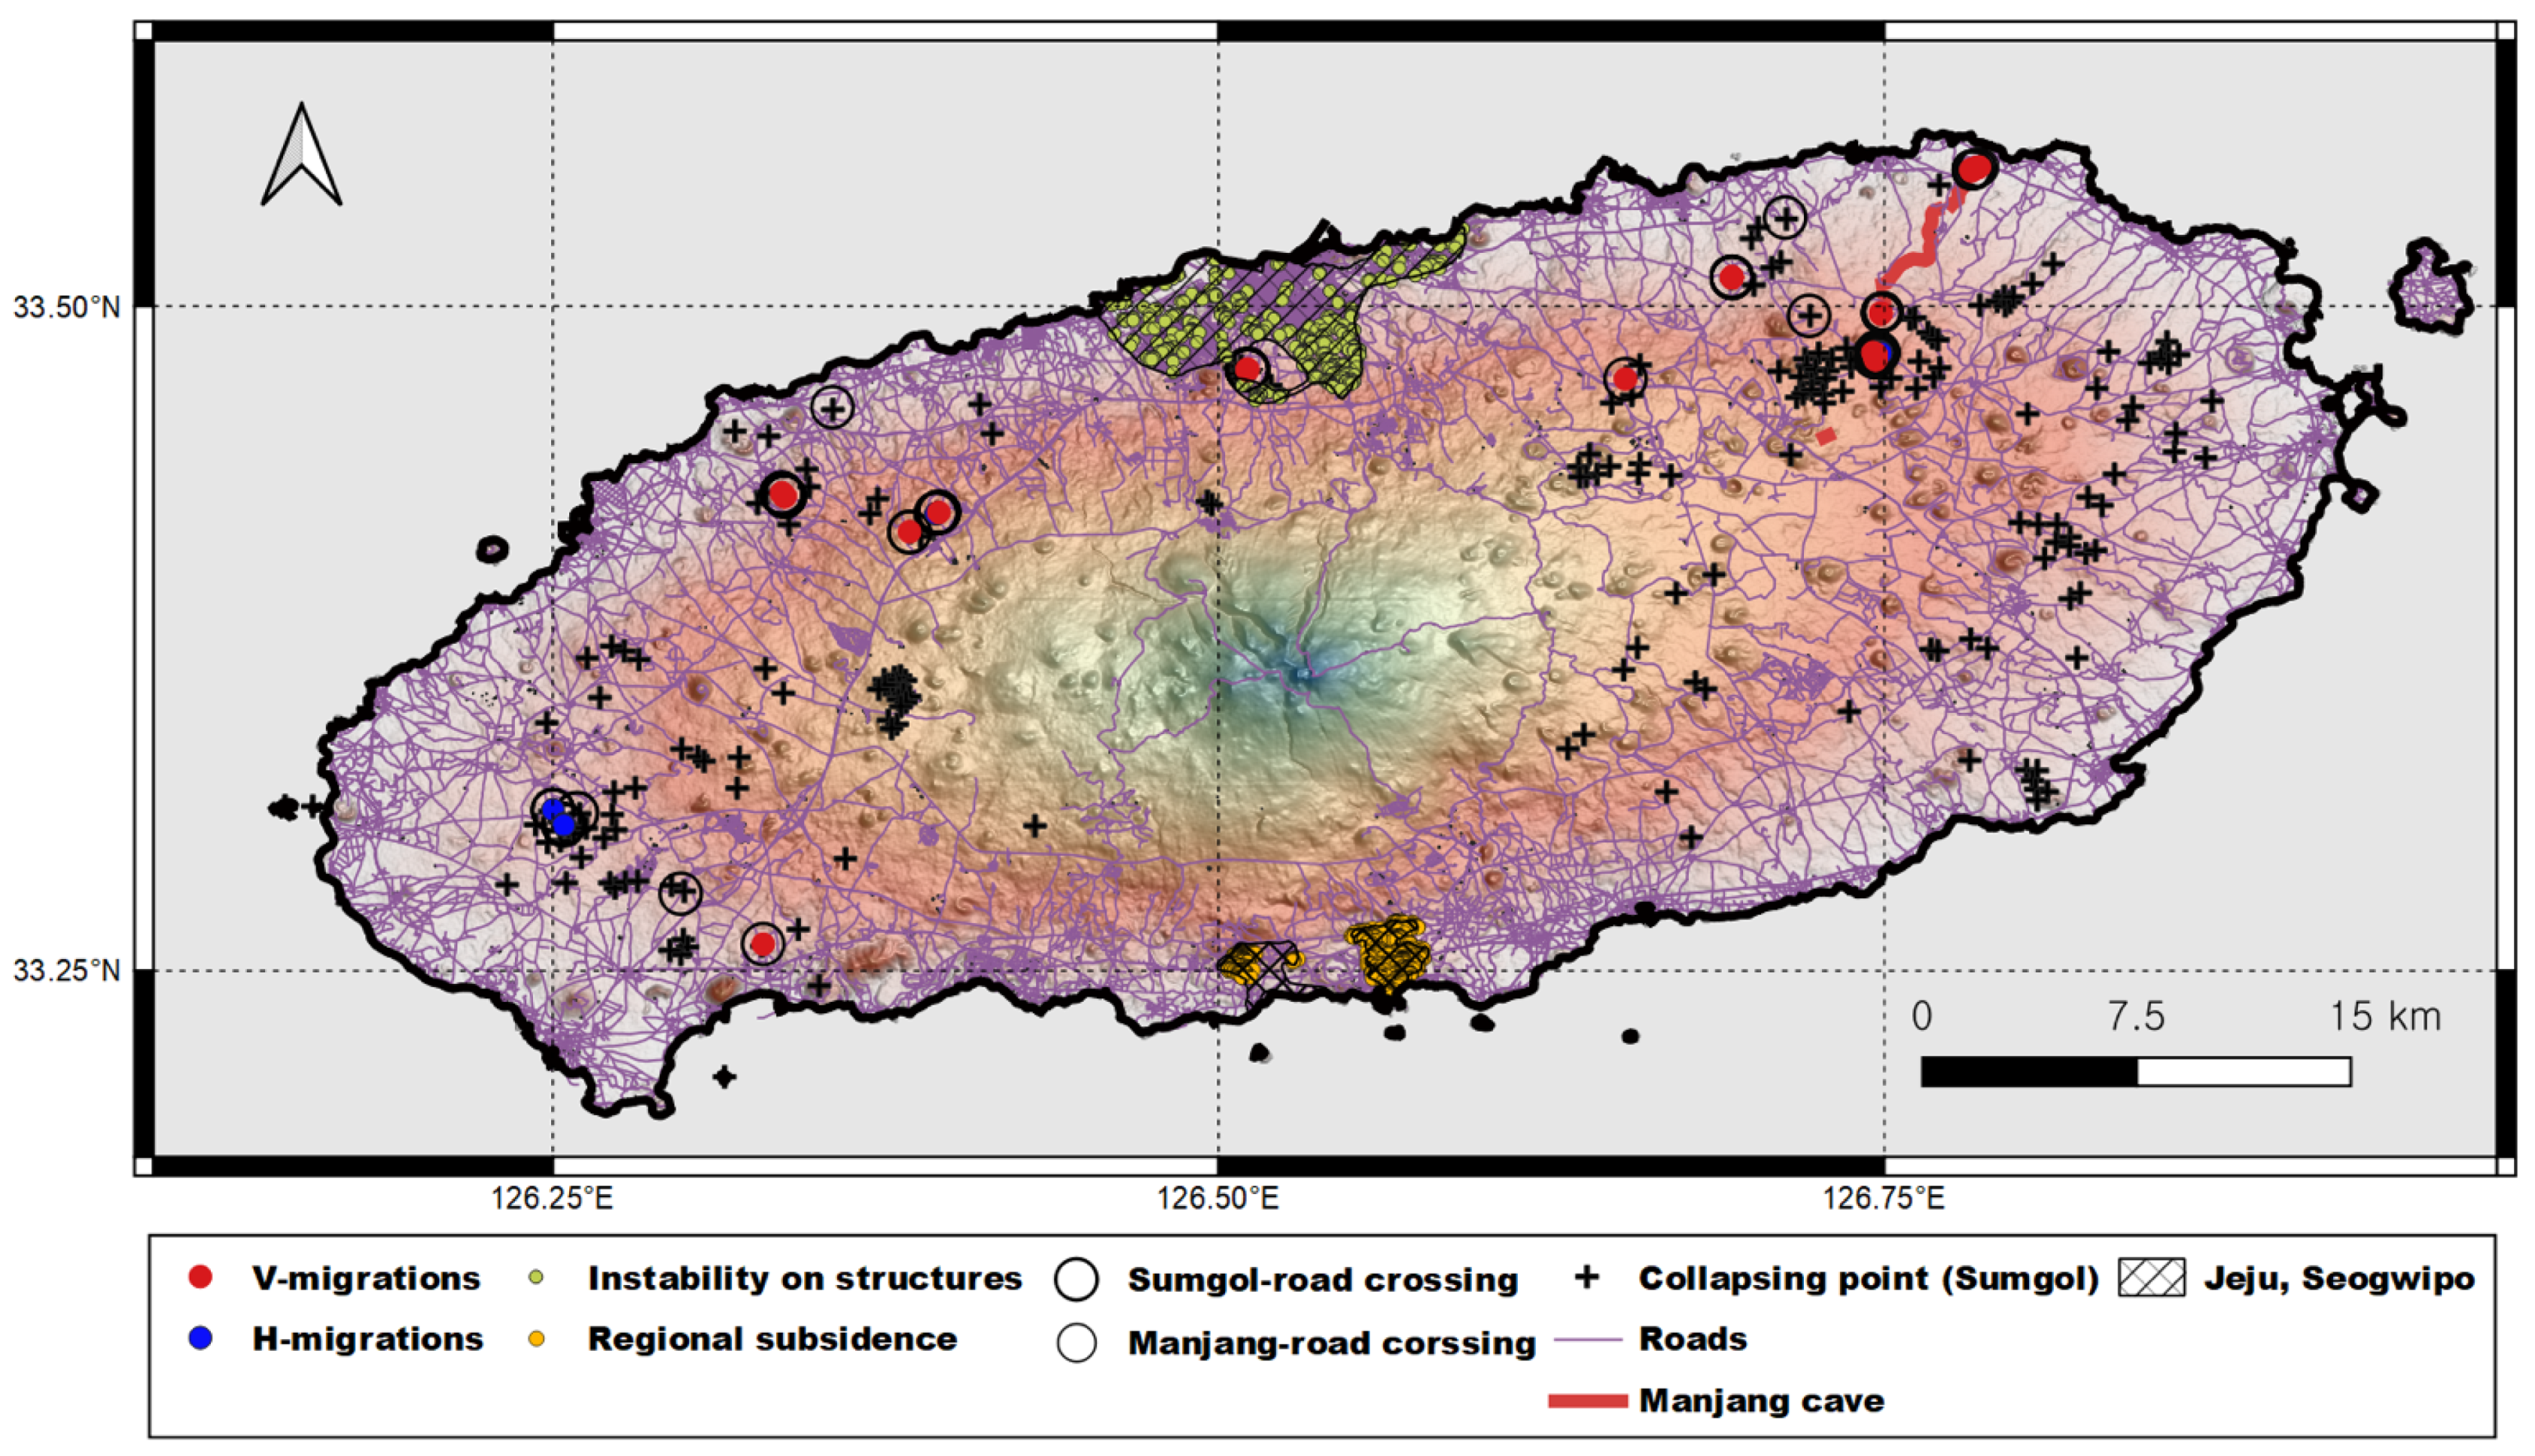
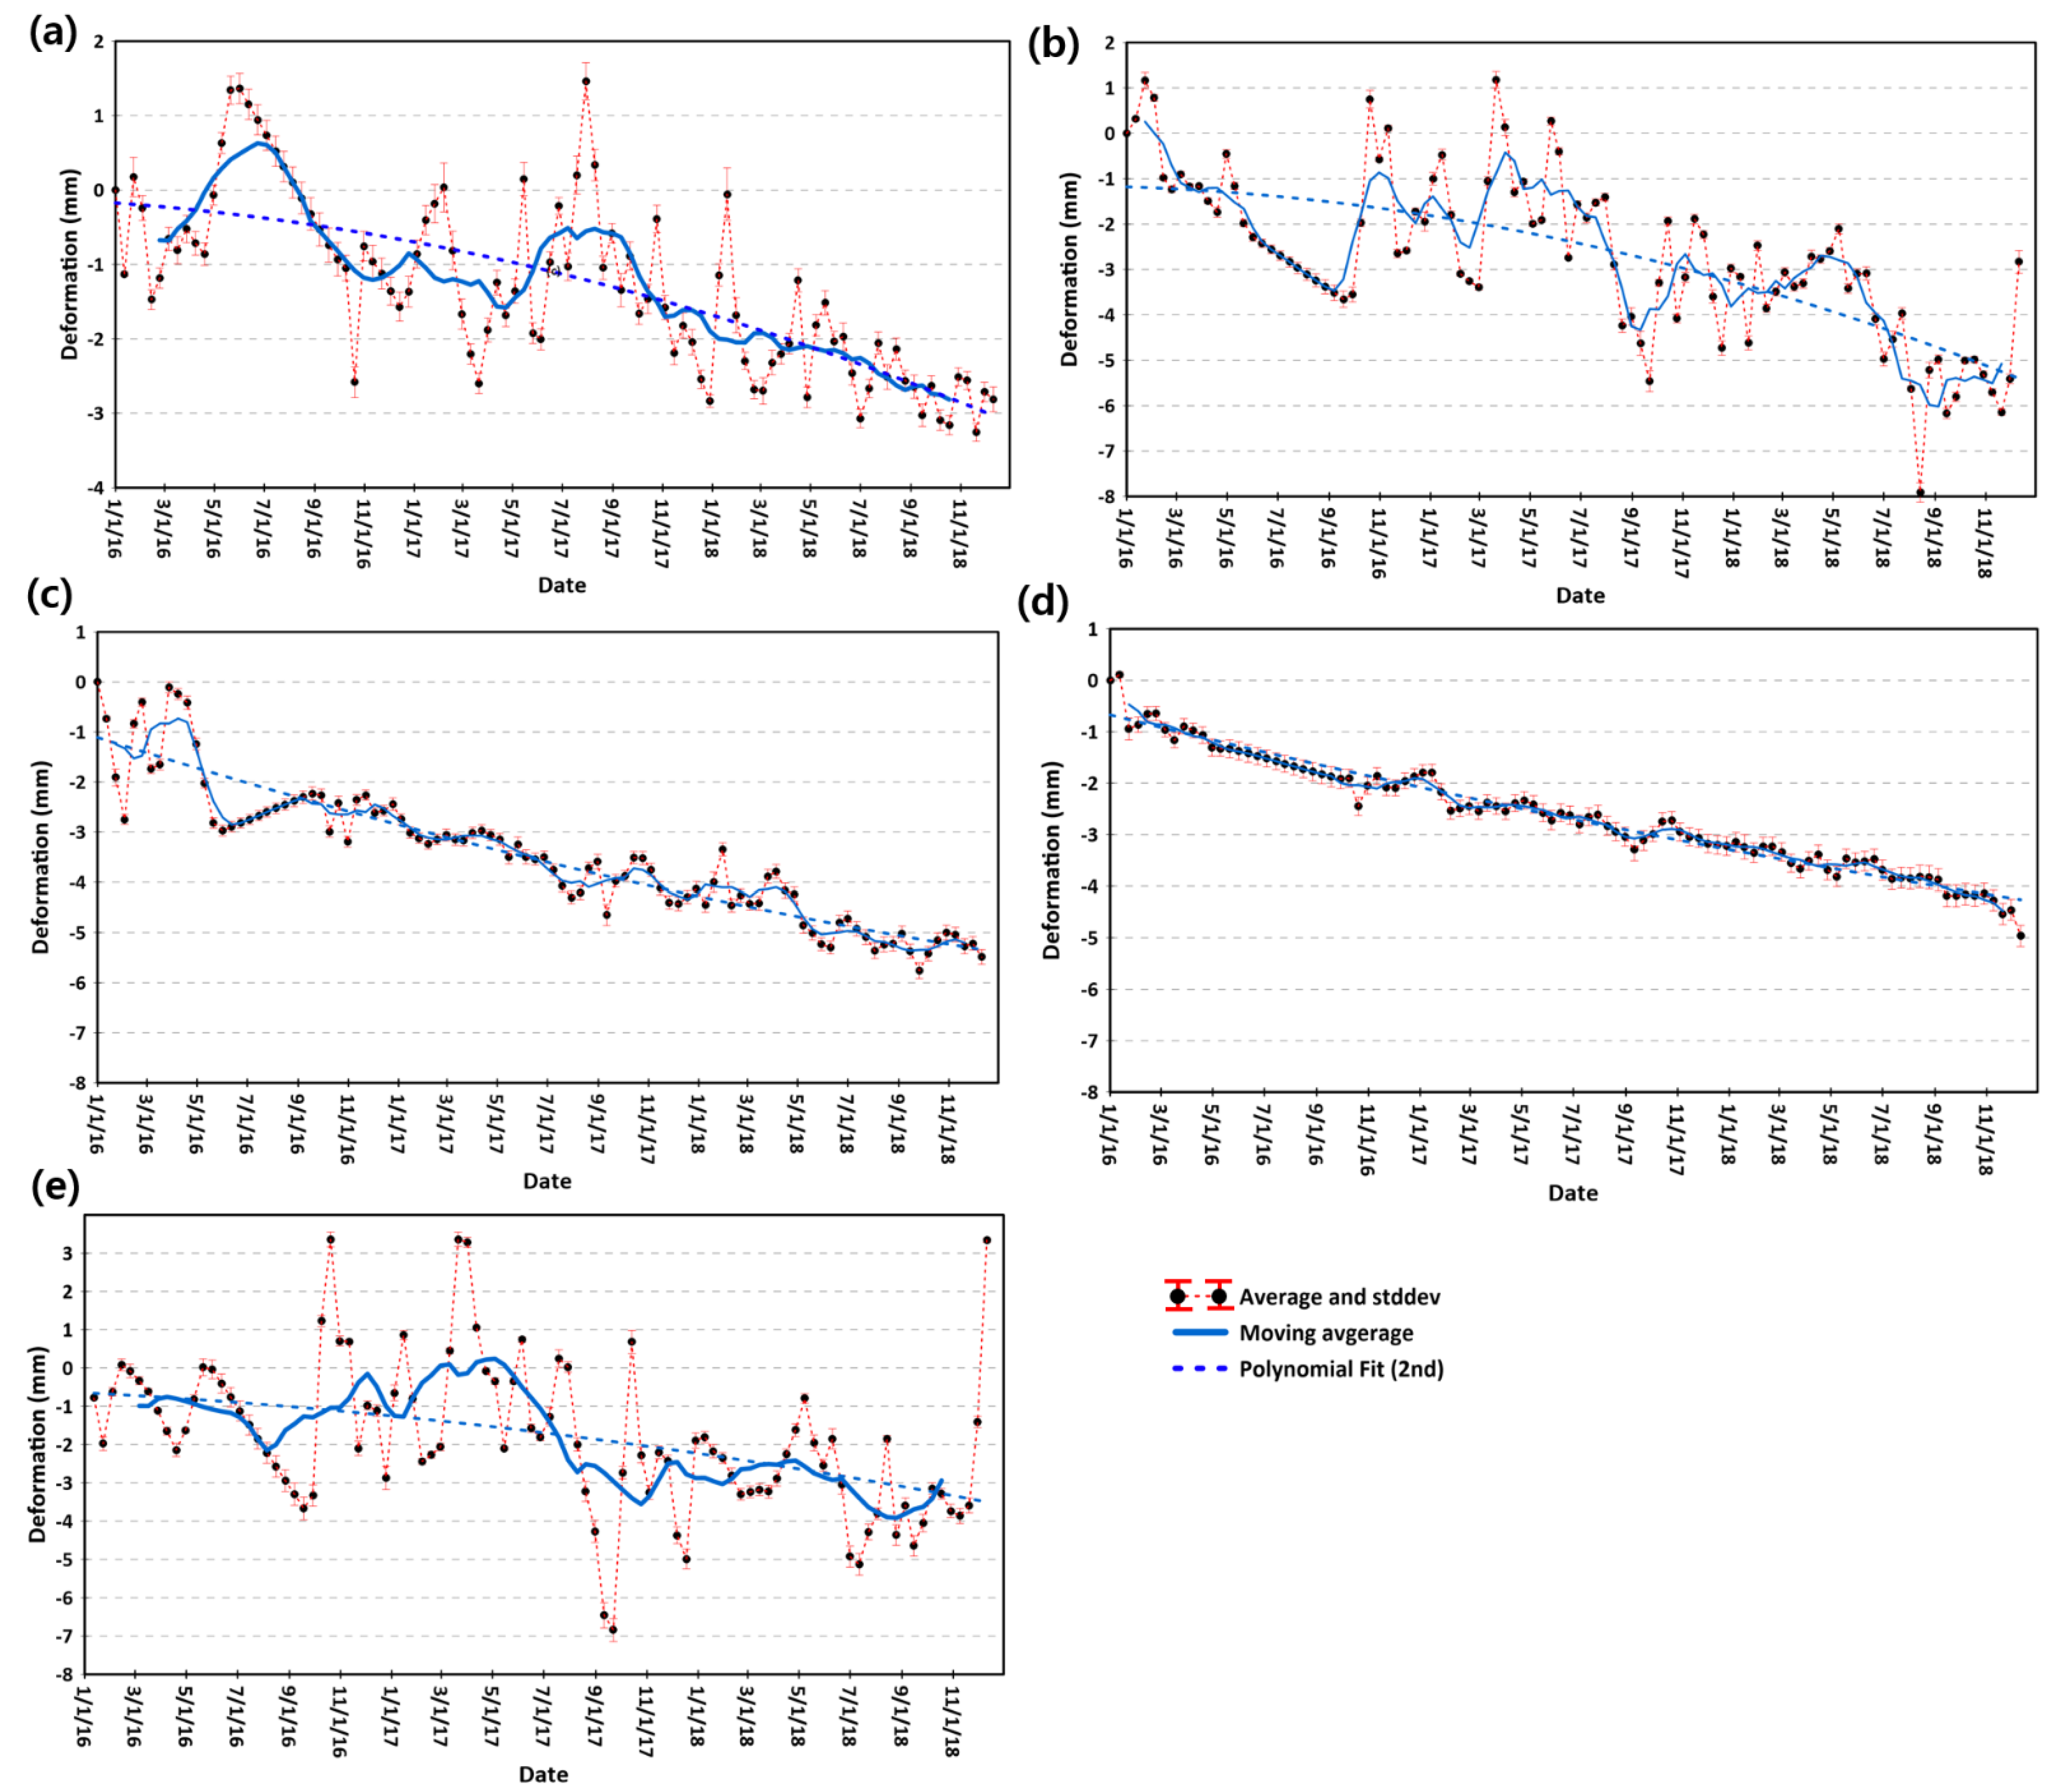
Table 2 and Figure 6 show the standards to define training data sets and their locations. As [44] described, the road crossing with lava tubes or the cavities on lava flows often caused the roof failures of corresponding lava tubes/cavities. We investigated the deformation patterns of PS observations on road-crossing points with Manjang cave and all PGSs. We choose Manjang cave as the most deformation-fragile case because of the shallow structure of the lava cave (see the following discussions), extensive length, and high interaction with tourist activities. On the contrary, PGS was originally created by the vertical failures of lava cavities, and the proximity to roads supposedly indicates instability and deformations. With 177 InSAR observations (77 on Manjang cave and 100 on PGS s) in road crossing areas, we discovered that the deformation patterns could be classified as (1) minus LOS migrations (<−1 mm/year) which imply vertical subsidence, so-called V-migration patterns, and (2) positive LOS migrations (>0.75 mm/year) which are almost impossible as vertical deformations due to the rocky surface of lava flow hence might refer to horizontal deflections, so-called H-migration patterns. Thus, 50 V-migrations and 17 H-migrations were assigned as the training data. It was noted that some minus LOS migrations might be induced by horizontal creep to the LOS direction in the SAR sensor. However, this portion in V-migration should be minor as the major contribution to LOS direction is up- and downward deformation [62]. Interestingly, around PGS, the majority of deformations (>70%) are V-migration, while H-migration occupied 50% of deformation points in Manjang cave. It fits the hypothesis that vertical failures in PGSs mainly induce V-migration patterns, but a large cavity such as Manjang produced the H/V-migration pattern together. Therefore, we constructed the training vectors of potential lava tubes combining two migration patterns together. Their behaviors included highly variable signals perhaps involved with seasonal effects as shown in Figure 7a,b, where changes possibly induced by thermal expansion are noticed in the summertime. H-migration patterns were introduced as the secondary indicator of the potential instability of the lava cavity. The stable PS points with no significant variation were excluded for the input data of machine learning applications. However, we observed that two kinds of deformation patterns might be misrecognized as genuine LTDPs. The first one is the deformation induced by regional subsidence, and the second is the structural deformation, such as newly built buildings. The regional subsidence is clearly observed in Seogwipo sediment, perhaps caused by regional condensations by heavy mass loading (see Figure 1 and Figure 6). Therefore, the strong minus deformations (<−2 mm/year) in Seogwipo sediment were chosen as the training vectors of regional subsidence. The stable behavior is shown in Figure 7c, in which the variation is quite different from the PGS-road-crossing or tube-road-crossing regions. The instability of individual structures was chosen on the opposite side of Jeju City areas where large buildings are populated. Since there are many deformations with random changing patterns, the average behavior is uniform and is shown in Figure 7d. Because there are not enough training points, the pattern of H-movement varies (Figure 7e).
Once the training vectors were established, point classification was conducted. We employed two algorithms—random forest (RF) [63,64] and gradient boosting (GB) [65,66] methods. RF uses multiple decision tree construction in the training stage and bootstrap aggregation of their outputs as an ensemble method. Thus, it is effective to prevent overfitting and upgrading modeling accuracy. Since [67] presented its applications for classification, it has been widely used, and the capability for manipulating spatial data sets has been demonstrated. GB is an algorithm to exploit residual fitting of the model as a boosting approach; it is known as a classifier with high precision. We applied both algorithms on PS points screened by the mask through the spatial analyses. As a result, it was observed that the RF outputs have significant problems detecting H-migrations, as only 1% of instability points were classified as H-migrations. Therefore, we excluded RF results for further analyses. The detected H/V-migrations in potential LTDPs using the GB algorithm are presented and discussed in Section 5.
5. Discussions
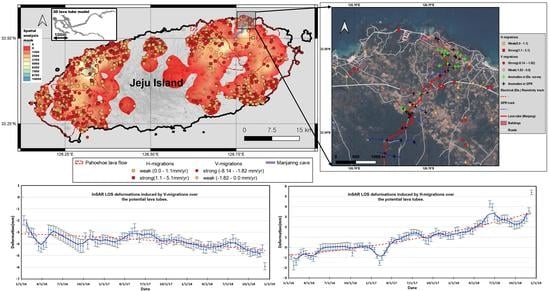
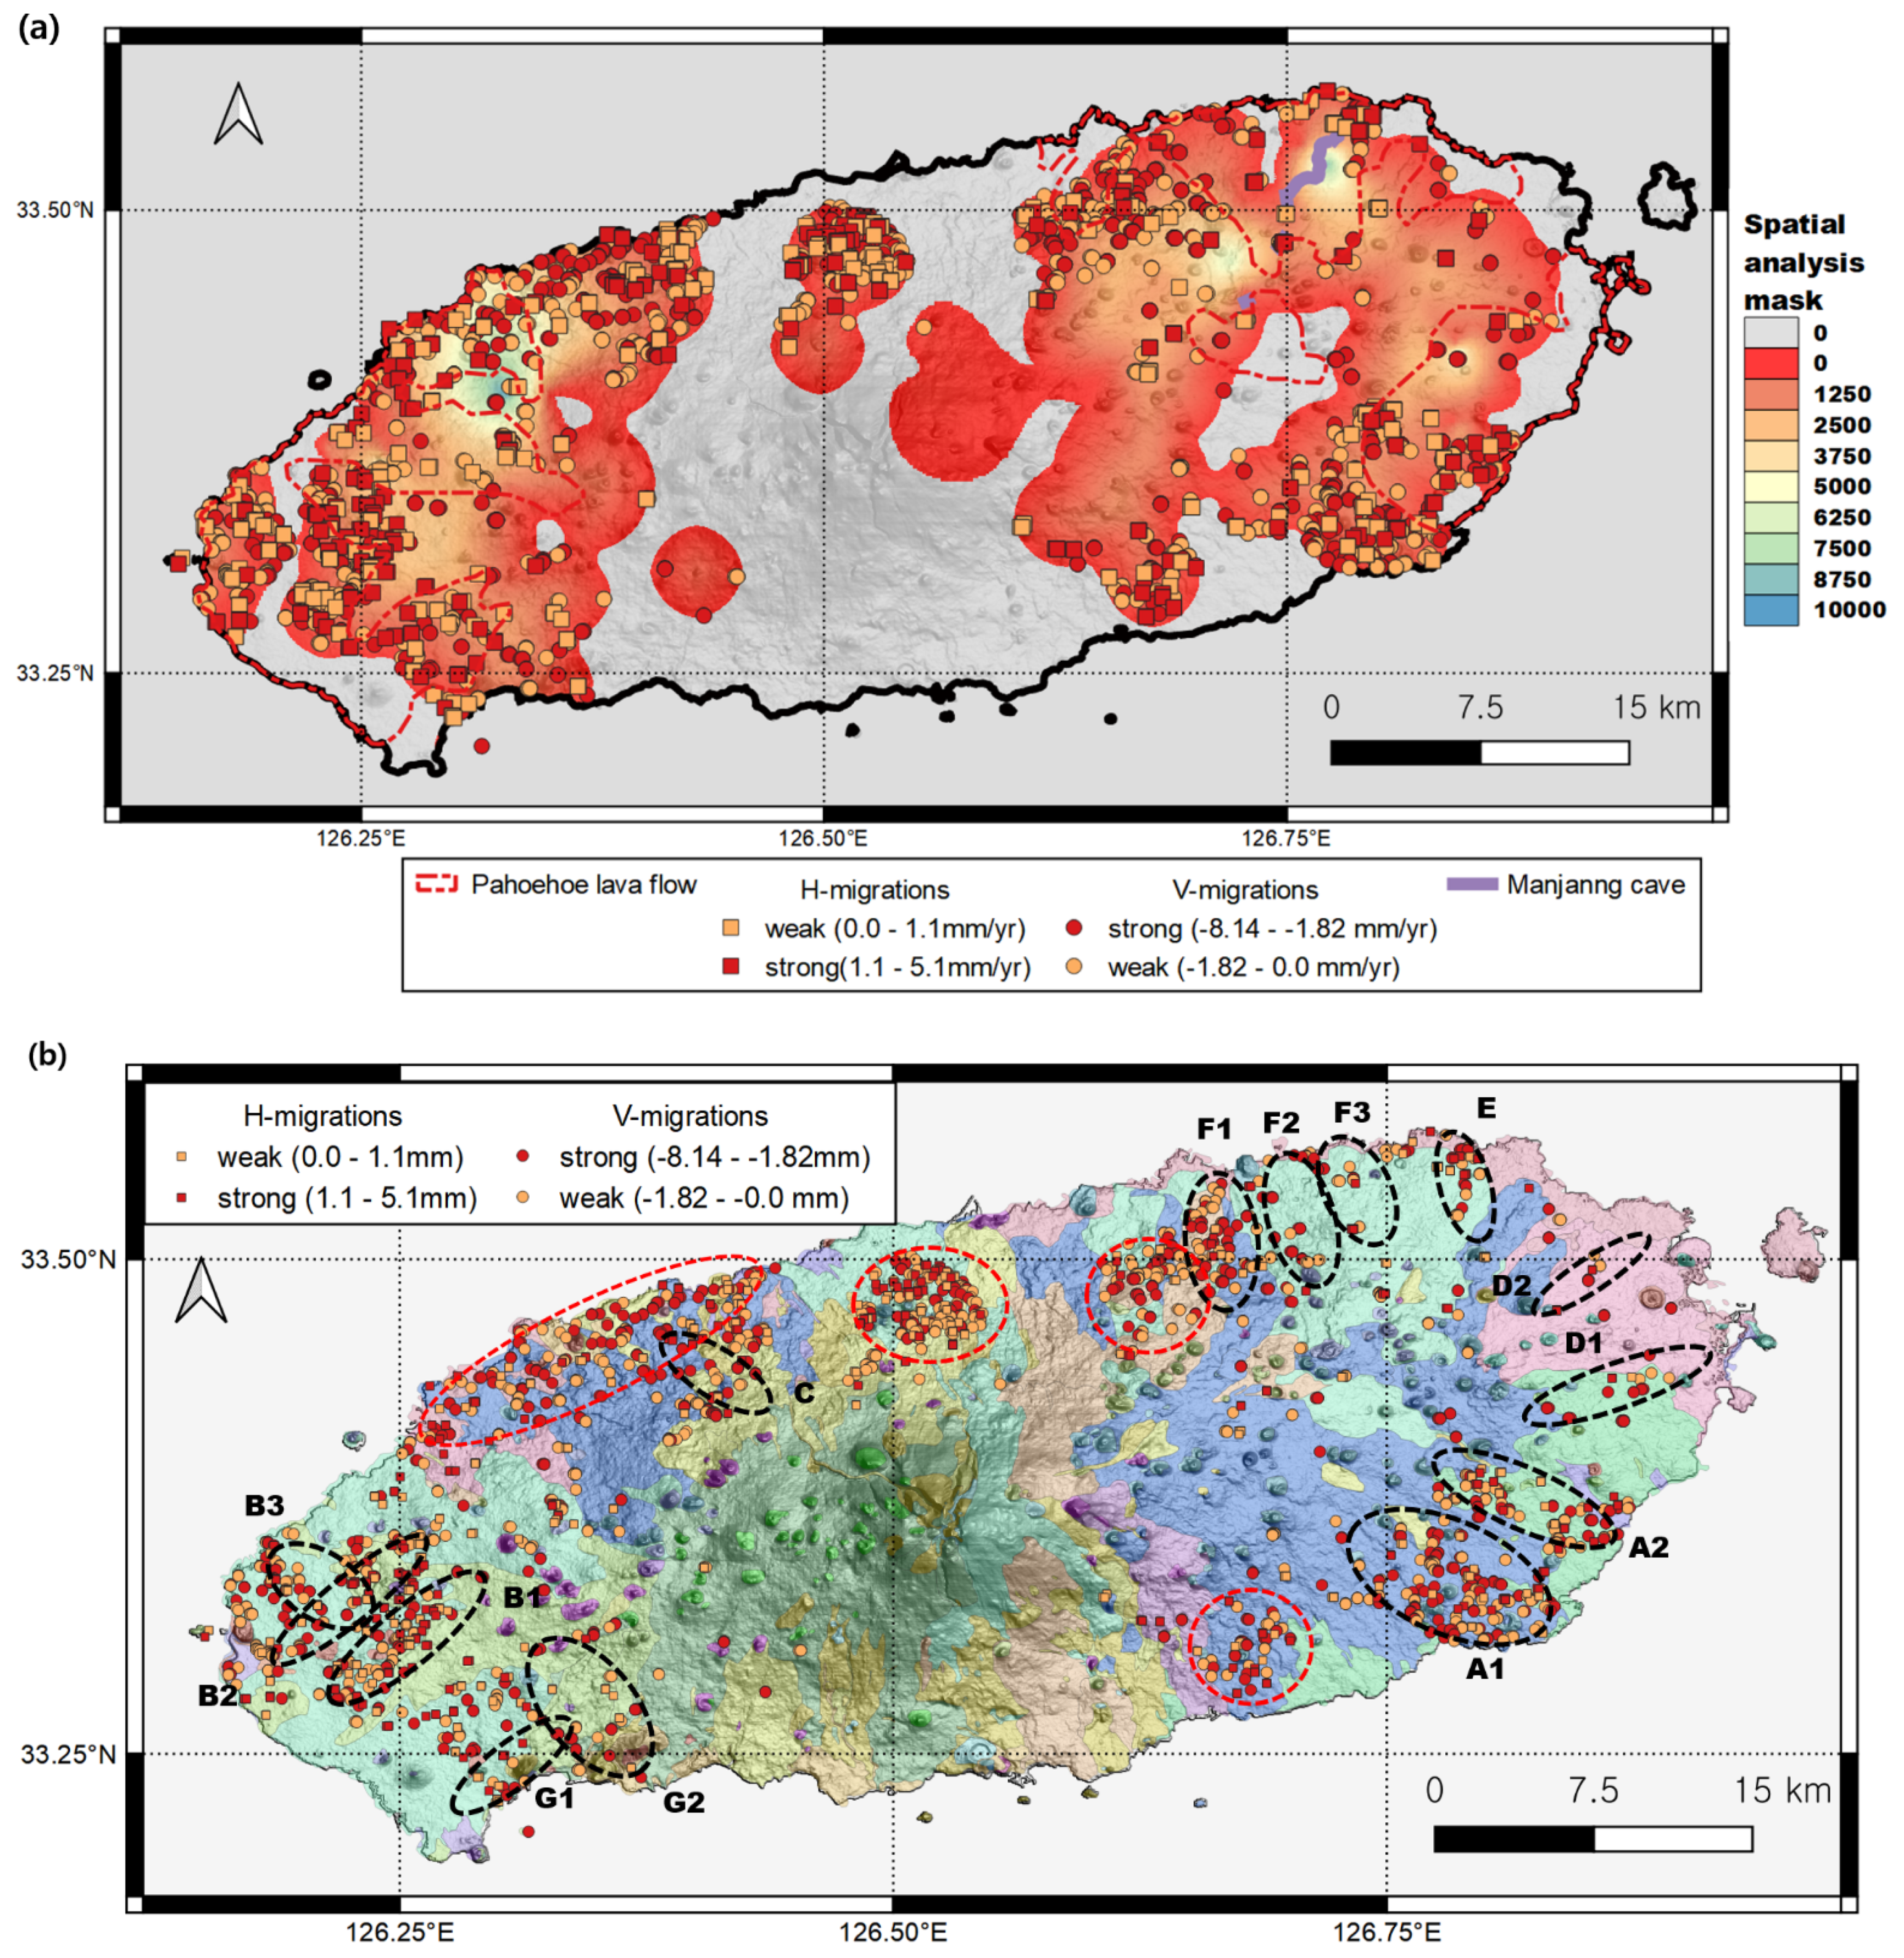
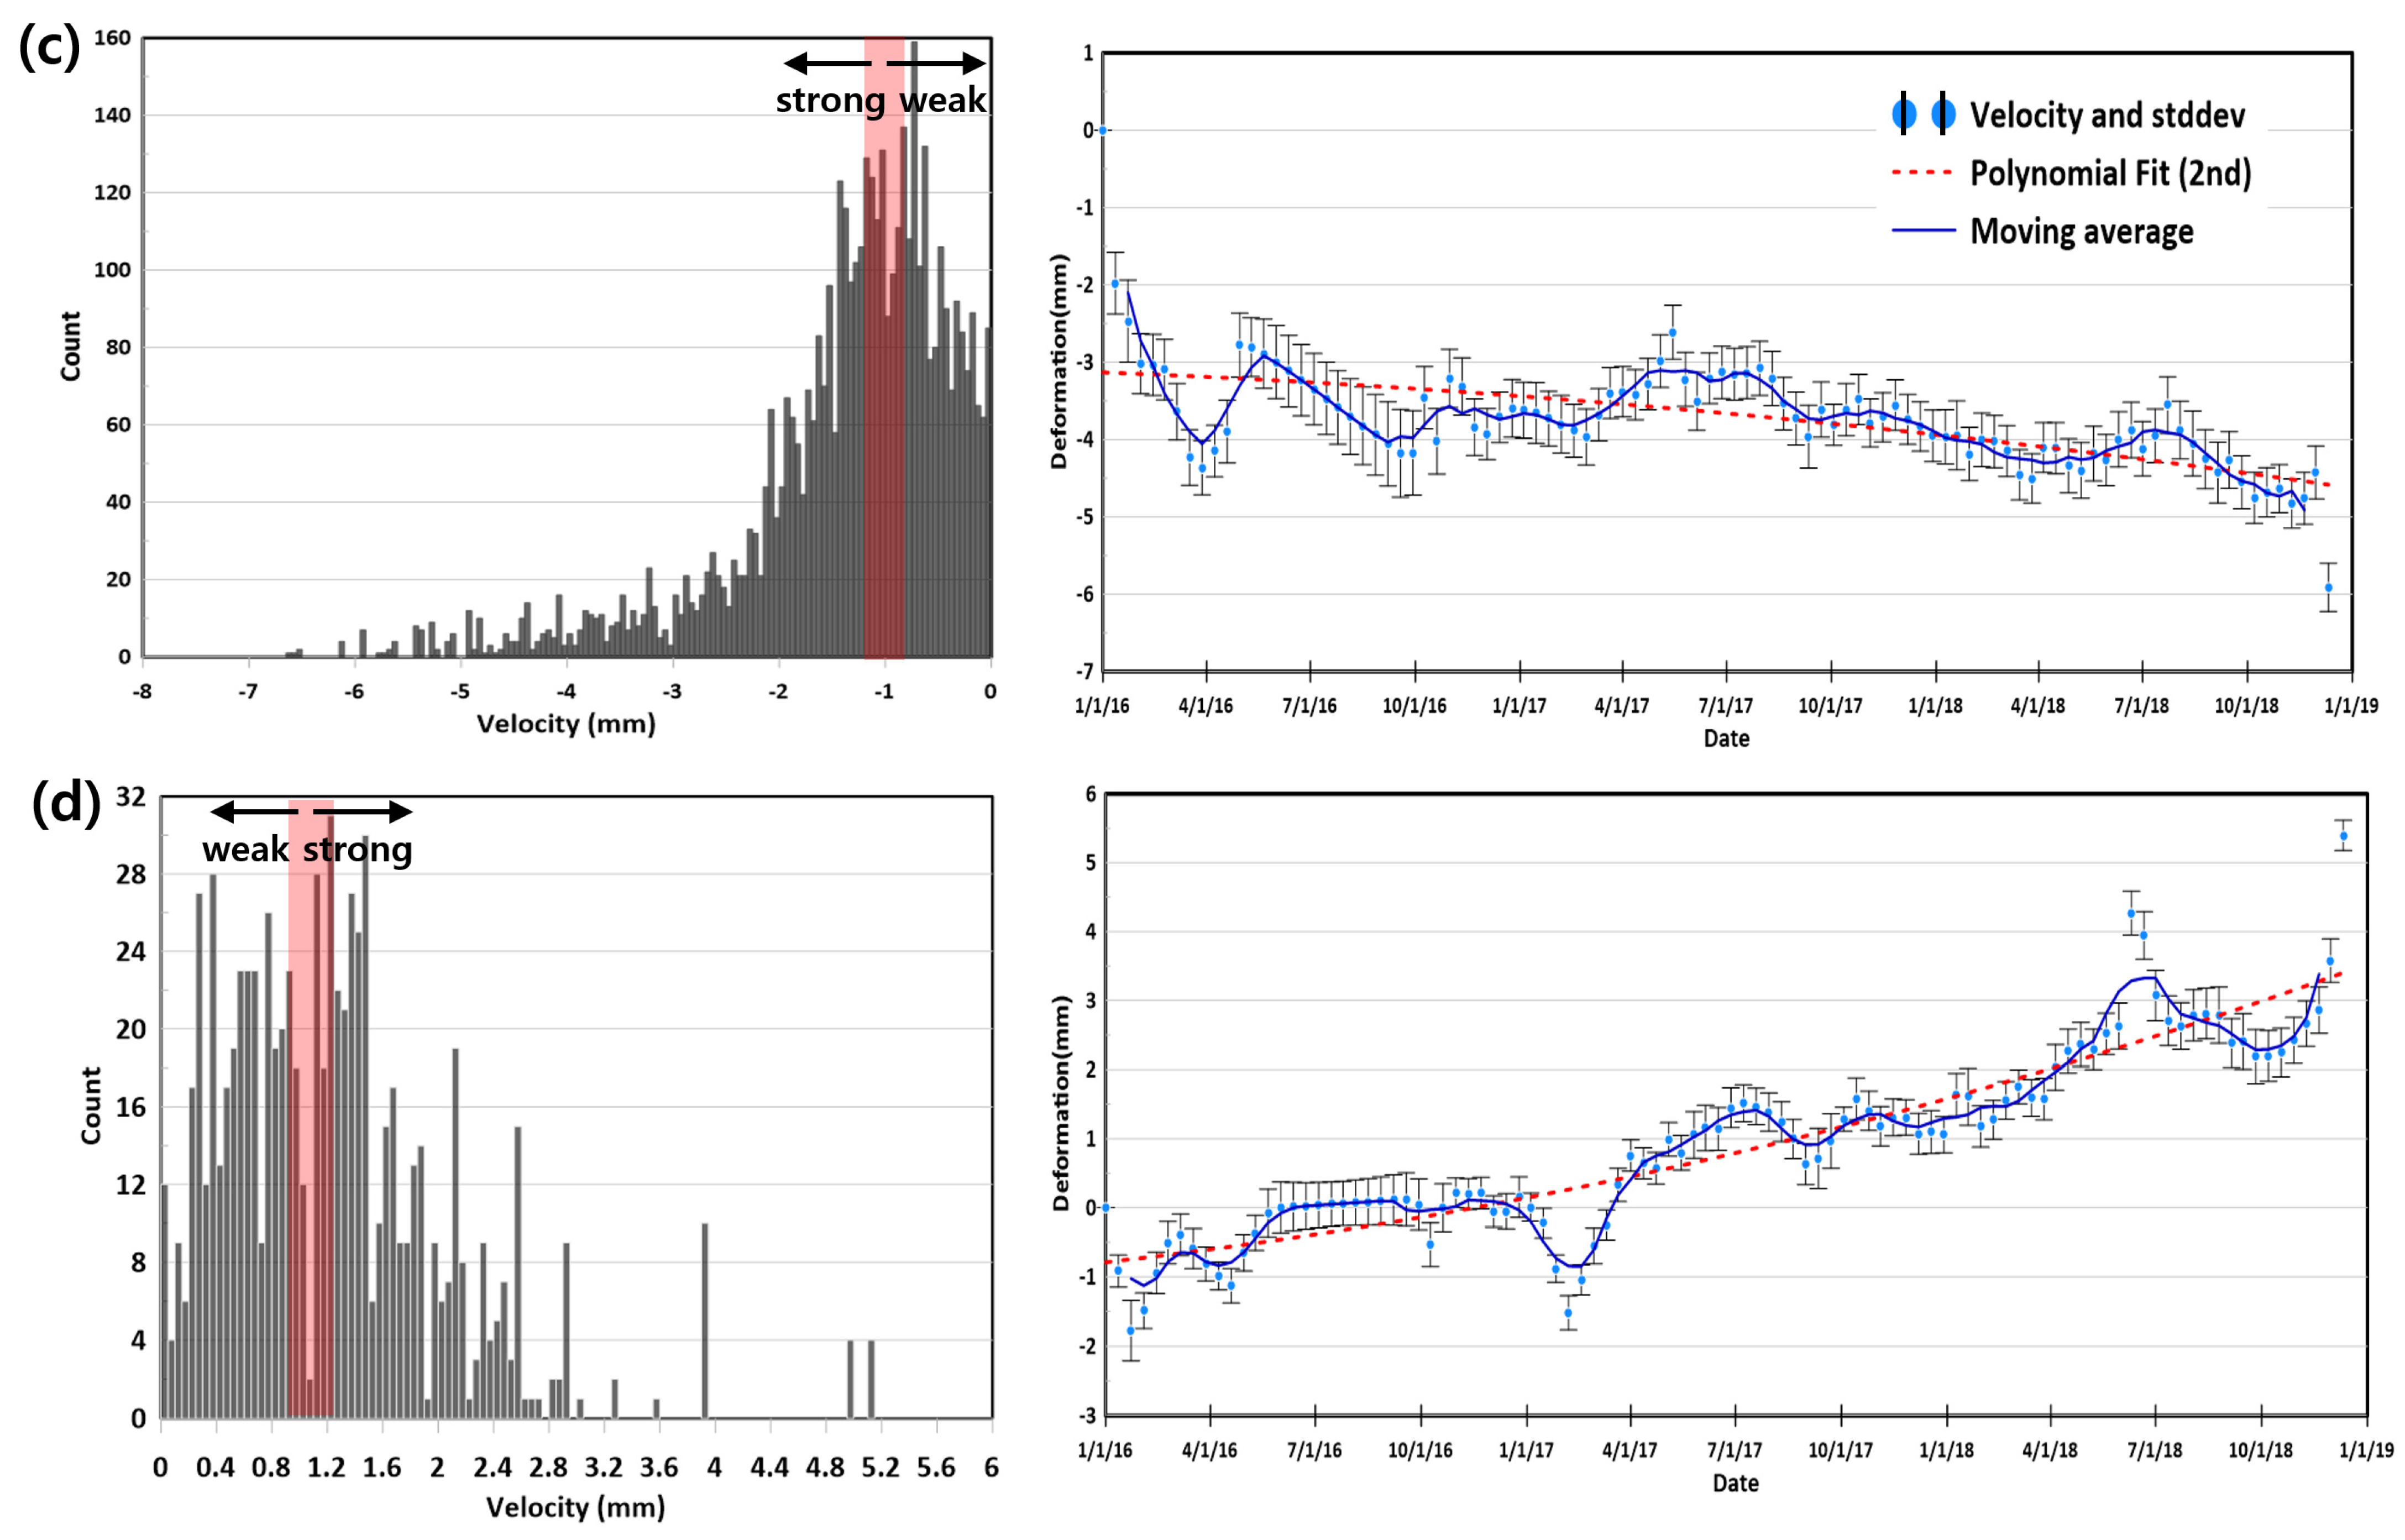
By overlaying the potential LTDPs on the strength of the spatial analysis mask, some insight into undiscovered lava tubes was revealed and shown in Figure 8a in which, 1034 V-migrations and 245 H-migrations were detected. The small portions of H-migrations (<0.0 mm/year) and V-migrations (>0.0 mm/year) were first cut off from LTDP to simplify analysis. Then, we split strong and weak migration points (Figure 8c,d) from the histogram distribution of V/H migrations.
First, potential LTDPs around the Jeju City area might include lots of instability induced by individual building structures rather than the potential lava tubes. The constraints identifying LTDPs on the undiscovered lava tubes are: (1) LTDPs should be distributed as a linear form in the direction of the lava flow, which is mostly from the cinder cone as the source of lava flows to the coastline; (2) V/H-migrations must be distributed together; (3) the lava tube networks producing LTDPs might cause regional linear deformation.
Overlaying the H/V-migrations and the geological units is shown in Figure 8b. We defined the locations of potential lava networks from group A to G as assigned ellipses. The major axis of the ellipse is the estimated direction of the involved lava flow. The most interesting and distinguished group is B1, which originated from the Gama cinder cone to the coastal area. It has a well-distinguished V/H-migrations along a pahoehoe lava flow. Around the Gama cinder cone, there is a 2 km length underground tunnel built by the Japanese army during World War II (WWII) and that becomes unstable. Although the military tunnel might cause unstable points, the spatial extent of group B1 is too large to be considered as the consequence of the WWII military tunnel. However, it is worth noting that more than 700 WWII military tunnels are widely distributed in Jeju Island, and a large number of them are in structural failure and/or not discovered. This is the reason we classified the points only within the spatial analysis mask defined in Section 4.1. Group B2 has a similar context, directed from a cinder cone to the coastline. The other obvious potential LTDP group is A1, which certainly fits the direction of a Basalt-Trachyte unit (see Figure 1b) and follows the terminus of a lava flow. Since only a few lava tubes are identified there, we proposed an extensive and undisclosed lava tube network over A1. Group A2 is proposed as a lava tube trail, as it fits very well with an independent Basalt-Trachyte lava flow unit starting a cinder cone, as shown in Figure 1b. Although the trail of potential LTDPs is unclear, groups D1 and D2 should be noticed, as the area will soon be reconstructed for the international airport. Groups E and C coincided with the trails of the two biggest lava tubes, the Manjang (length > 7.4 km)-Yunchen (length > 2.4 km) cluster and Bilremot (length > 11.7 km) cave, respectively. The average deformation pattern of detected V-migration (“strong” part < −1.82 mm/year) shown in Figure 8c is more similar to that of the cave-road-crossing points in Figure 7a than other training data. The average H-migration pattern (“strong” part > 1.1 mm/year) in Figure 8d is quite different from H-migration training vectors but has a steady increase as expected. The geophysical exploration employing ground penetration radar (GPR) and electrical resistivity surveys reveal plausible underground caves which were presumably collapsing or being inundated by seawater around coastlines in area E [68].
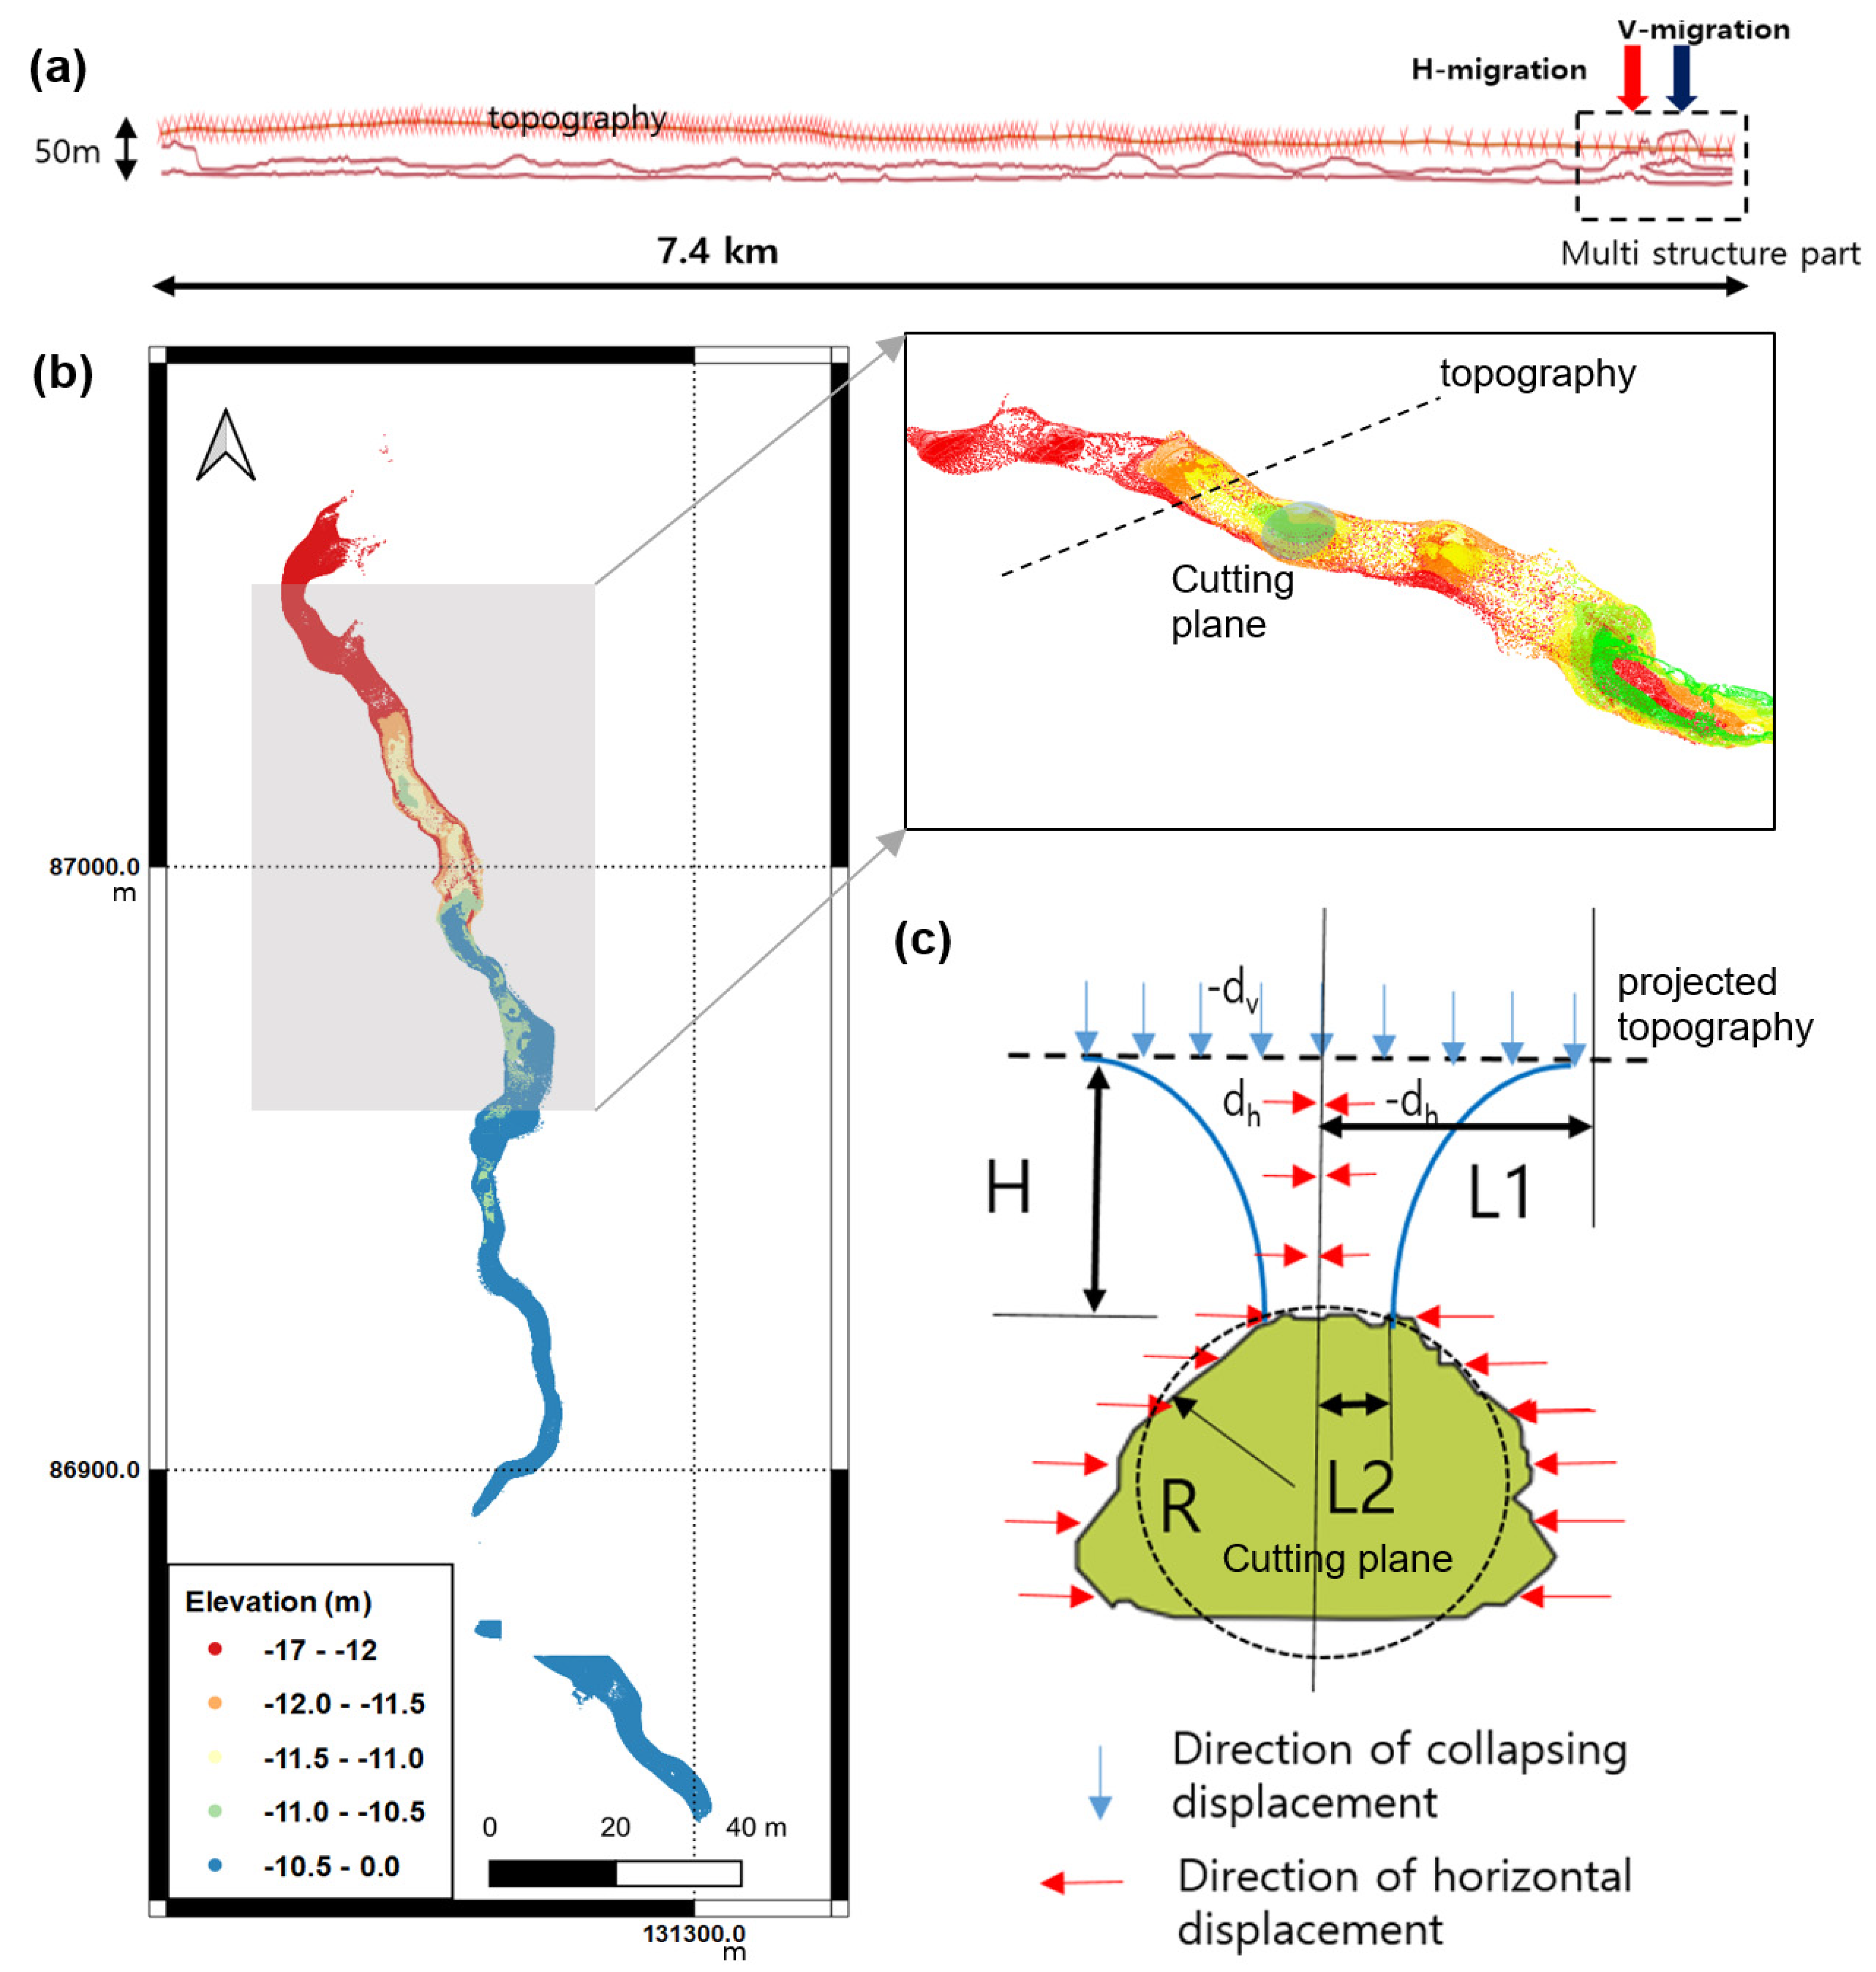
Regarding the instability points around Manjang cave (E), it corresponds to the exit of Manjang cave which has shallow a double cave structure as shown in Figure 9a. Groups F1–F3 demonstrate the potential LTDPs and alignment with lava flow directions from cinder cones to the coastline. Groups G1 and G2 are ambiguous as their alignments do not fit with lava flow directions in that area. Although subsidence and/or alignment with corresponding lava flow was not observed, constant attention to the potential LTDP distribution in the south-western side is still required. Along the northern coastline, some lava tubes are at the risk of collapsing due to their shallow cavity and proximity to road-crossing (see the Geamcheon and Gamnamdap caves shown in the laser scanned data given in Figure 9b together with Figure 9a 2D profile of the Manjang cave). The potential LTDP distributions in the northwestern coastline, Jeju city areas, and Seogwipo tourist complex (red dotted ellipses in Figure 8b) are irregularly distributed along the coastline and ongoing construction places; thus are not likely genuine signals of lava tubes.
The issue is whether these 3D cave structures create deformations as observed in InSAR analyses. Since numerical modeling, for instance, the FEM using 3D cave data and estimated tensile stress, is beyond the scope of this study, clues can be found in precedent studies regarding tunnel stability. In particular, [69] established the relationship between the dimensions of collapsing parts, which are defined with L1, L2, and radius R on the approximated circular cavity as shown in Figure 9c, stresses, and material properties. The cave shape of Figure 9c was extracted from the TLS of Gamnamdap cave, and it fits well to the known cave geometry in Jeju Island. Thus, the displacement induced by collapse will be dominated by the vertical way but mixed with the horizontal deformations which are applied symmetrically at the center of the approximated circular shape as shown in [70]. Therefore, H-migrations detected by PS InSAR mainly contained part of horizontal deformations directed toward the SAR sensor. In contrast, the detected V-migrations represented mainly vertical and horizontal deformations away from the SAR sensor position. The magnitude of deformations around circular tunnels is very different, according to the applied tensile stress, materials properties (hard/soft rocks and soil), and the dimension of the tunnel. If the tunnel depths are limited to very shallow (<10–20 m), the deformation values calculated in the case studies vary from sub-millimeter depending on the scenarios [70,71,72]. However, the fractures in the weathering wall of the lava tubes and the relatively weak brittle strength of basaltic rocks, combined with anthropogenic or structural stresses certainly cause sufficiently high deformations, which can be detected by InSAR observations.
InSAR LOS migrations can be expressed using the quantities in Figure 9c and the relationship by [73] as
where displos is LOS displacement, disph, and dispv are horizontal and vertical displacements, θ represents the incidence angles and α is the heading angle.
Thus, the observed displos can be estimated using the angles in Table 1 and Equation (3) in the case of Figure 9c.
H-migration = 0.694dh − 0.719dv
V-migration = −0.694dh − 0.719dv
Equation (4) explains the relatively small H-migrations compared to the V-migrations even on the same cavities as well as mixed V/H migrations over a potential cave as stated.
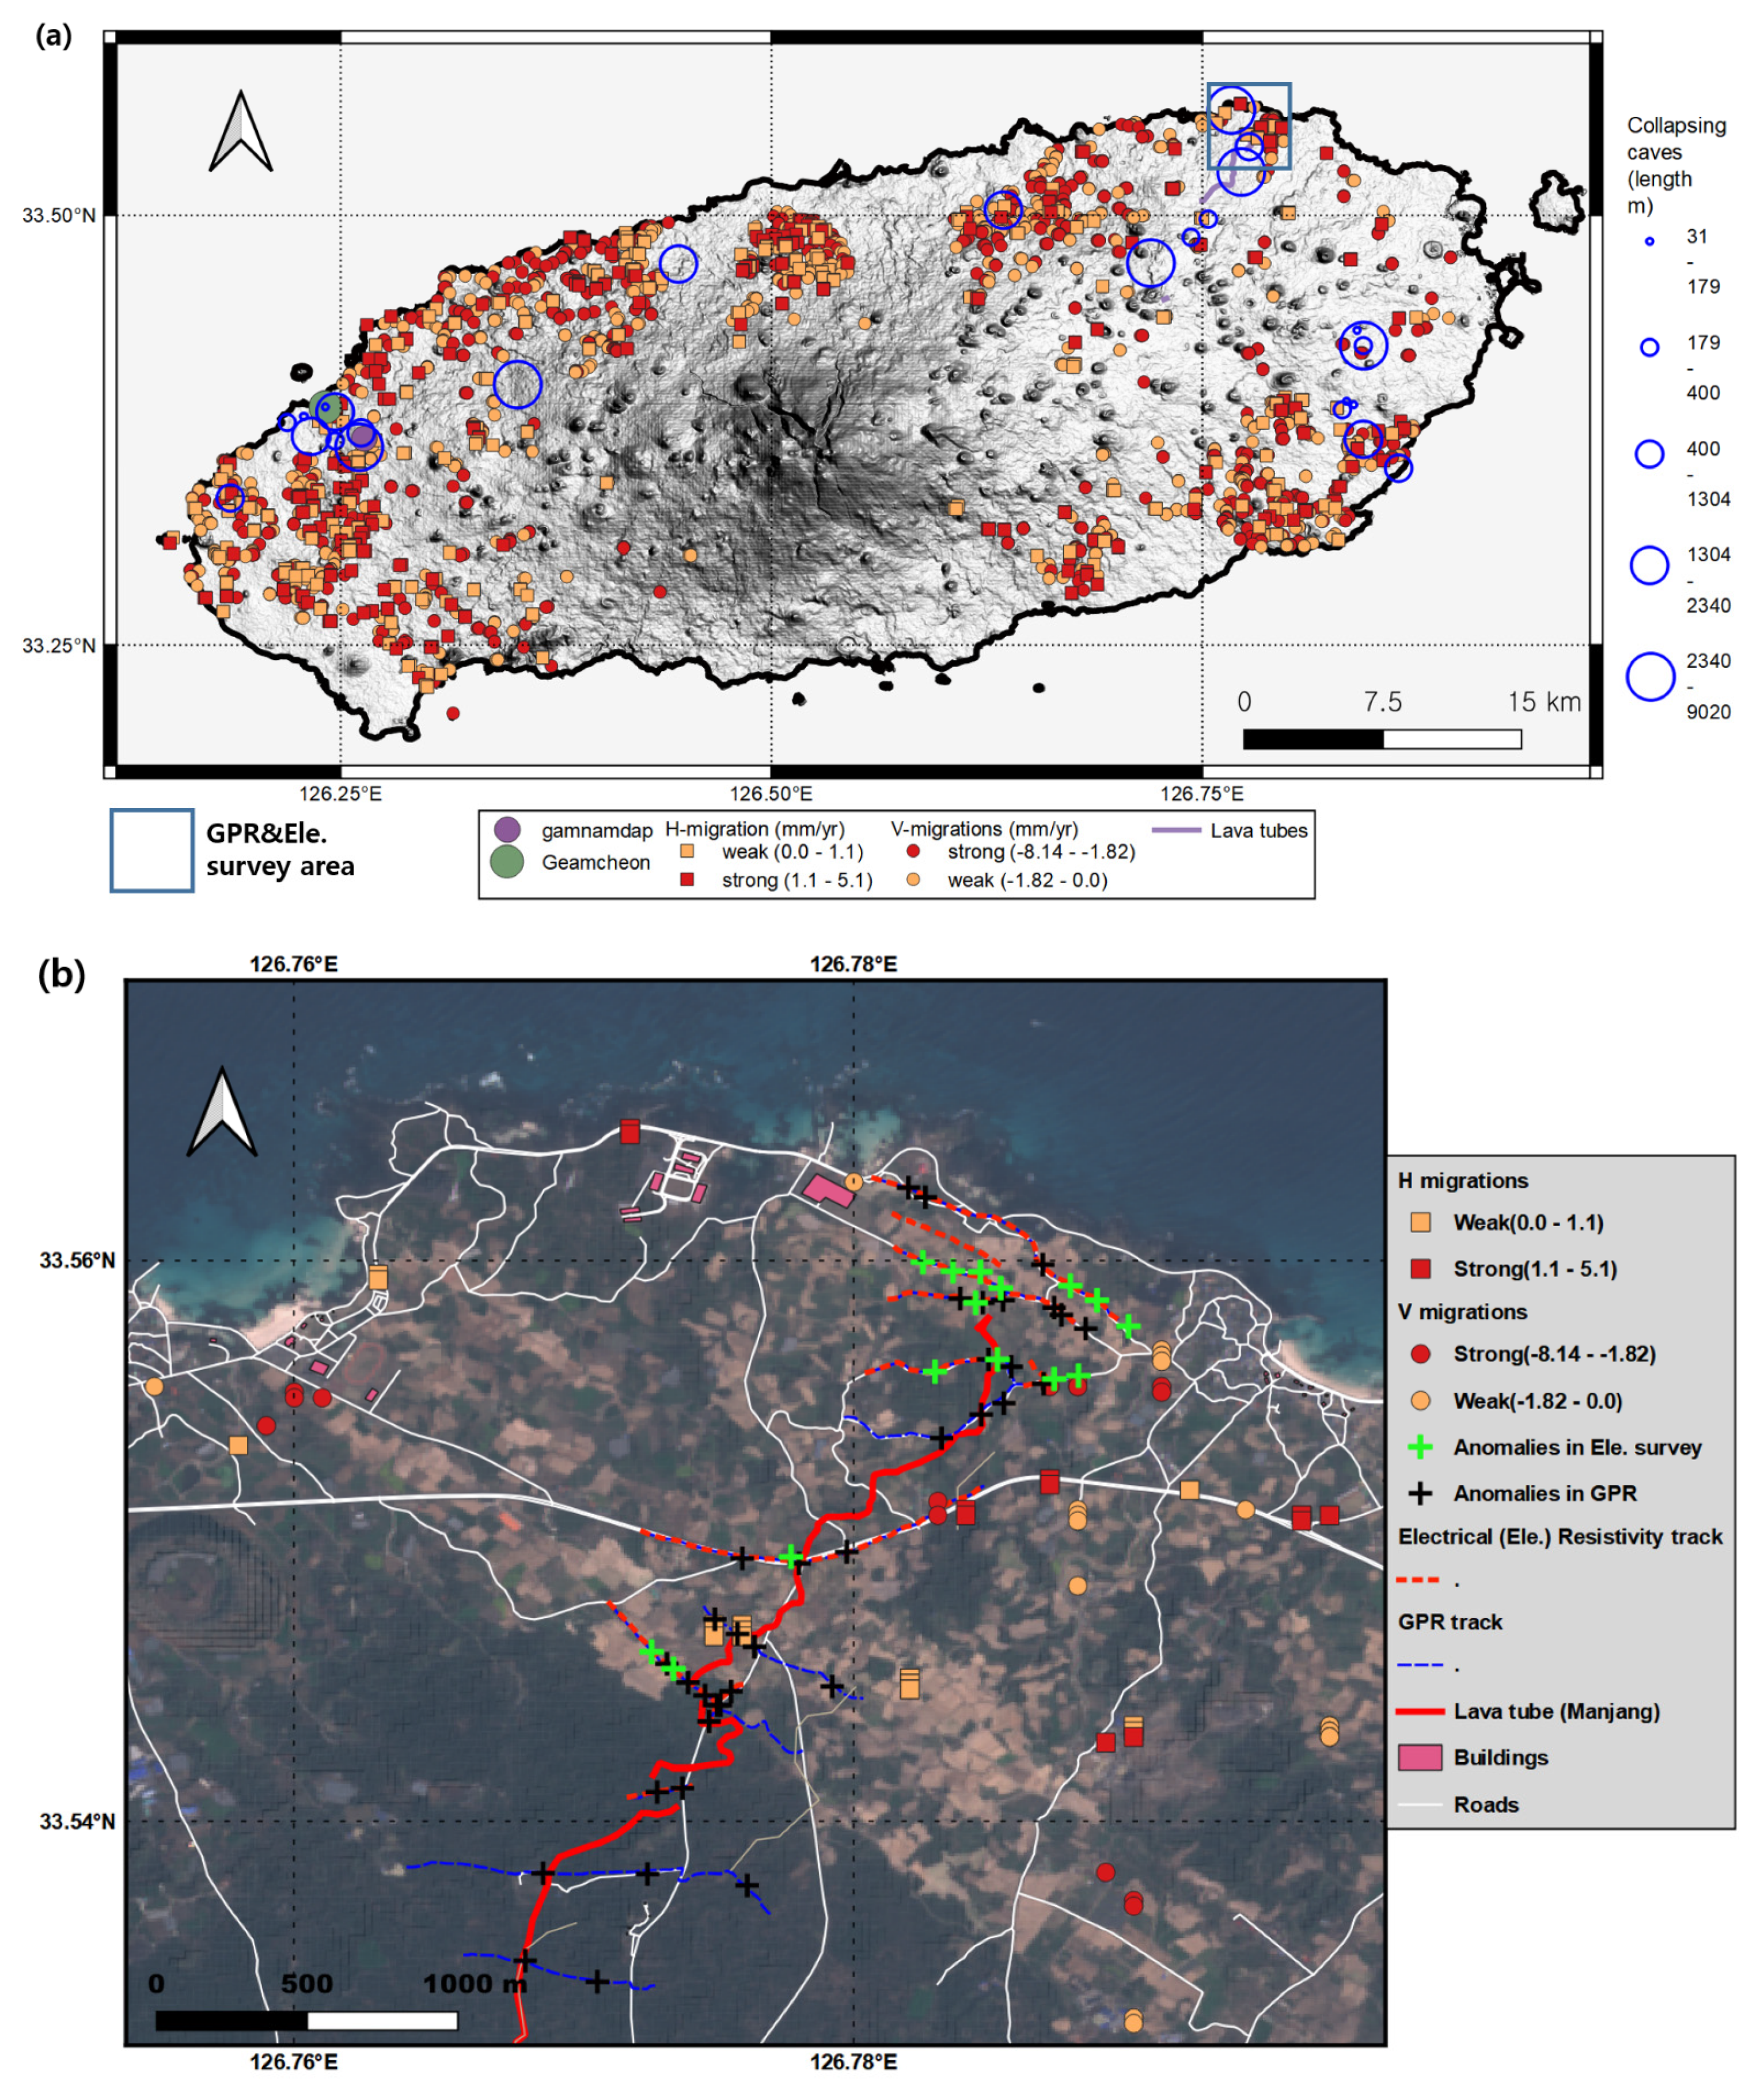
In the end, we identified a group of potential LTDPs using InSAR observation and spatial analyses. To prove the reliability of this approach, we employed the road-crossing survey by [18] to measure the known collapses of lava tubes. Among 27 ongoing collapses of lava tubes in this survey, 14 caves have H or V migrations within the buffer zones built by their length, and seven caves have both H-V migrations (refer to Figure 10a). However, adequate validation of detected H-V migrations as LTDPs should be conducted based on the ground truth if possible. Reliable ground truth was provided by GPR and the electricity resistivity survey conducted by the [68] around Manjang cave, assigned as ‘E’ in Figure 8). A total of 23 GPR and electricity resistivity survey tracks together with detected anomalies that were presumably part of undetected lava tube trails were presented compared to the H-V migration points by PS analysis (Figure 10b). The coincidence of H-V migration points and geophysical anomalies is not strong, but there are a few detections of geophysical anomalies within H-V migrations by PS analysis. Considering that spatial overlap between PS coverage hindered by vegetation and the small number of geophysical tracks are intrinsically limited, such detection of geophysical anomalies by spaceborne data demonstrated the potential of the InSAR approach for LTDP detections.
Even though some deep instabilities would not be revealed as the surface topographic deformations, the estimated PS measurement in this study is capable of discriminating LTDP with considerable accuracy. However, the concern that remained unresolved in this study is eradicating the false/pseudo-LTDPs, which can lead to incorrect conclusions regarding the spatial distribution of lava tube networks. In future studies, a detailed validation is necessary using a planned GPS/electricity resistivity survey together with InSAR analysis or perhaps employing a corner reflector for synchronized observation. Near future SAR/InSAR missions, such as the L-band NASA-ISRO Synthetic Aperture Radar (NiSAR) [74] and P-band BIOMASS missions [75], will be particularly interested, in terms of coverage and penetrating powers to replace or enhance existing approaches, such as gravitation data sets [76], ground-penetrating radar [26], morphological analyses and spotting of skylight [13,77].
6. Conclusions
The geological importance of lava tubes in Jeju Island has been noted with the discovery of extraterrestrial lava tubes and their habitable environments. Since the risk caused by such a geological environment is not regularly monitored, both the known and the undisclosed lava tube networks in Jeju Island should be investigated. Moreover, with the construction of the second international airport in western Jeju, significant concern has been raised regarding the risk imposed by the instability of the hidden lava tube network. To address this issue, the present study conducted an InSAR campaign and subsequent machine learning applications, together with spatial analyses of geological clues. By employing a data fusion approach of InSAR and machine learning, we detected a number of potential LTDPs, demonstrating a plausible distribution of what would be classified as instabilities of the undiscovered lava tube networks, based on their peculiar patterns confined in thin corridors and on their deformation behaviors. In particular, the LTDP groups on the eastern coast showed the best-fit observation of the existence of unknown cave networks, a finding that was supported by the results of the geophysical surveys. However, some false/pseudo-LTDPs remained due to instabilities from other artificial structures and regional condensations.
This study yielded two main lessons. First, the study elucidates a procedure to spot shallow lava tube networks and identify their risks by integrating various data sources. However, the outcomes also demonstrated the need to fuse groundworks such as GPS and corner reflector over suspected deformations to clarify InSAR results. Future InSAR missions with better penetration will be useful, as they will be able to detect subsurface deformation signals. Combining structural analyses to classify InSAR signals using estimated instability is a highly useful approach and will be the aim of future iterations of this study. Second, adding to the existing methods of discovering terrestrial/extraterrestrial lava tubes, we proved that an InSAR survey is an effective tool for detecting lava tube networks. Considering proposed planetary InSAR missions, this tool may potentially be applied to lava tubes on planetary surfaces.
Author Contributions
Conceptualization, J.-R.K.; methodology, J.-R.K. and S.-Y.L.; processing, J.-R.K. and S.-Y.L.; validation, J.-R.K., S.-Y.L. and J.-W.O.; analyses, J.-R.K. and S.-Y.L.; writing, J.-R.K., S.-Y.L. and J.-W.O.; writing—review and editing, J.-R.K. and S.-Y.L.; visualization, J.-R.K. All authors have read and agreed to the published version of the manuscript.
Funding
The second author was supported by the Ministry of Science and Technology, Taiwan (Grant number: MOST 106-2420-H-004-015-MY3 and MOST 109-2625-M-004-002).
Data Availability Statement
Data underlying the results presented in this paper are not publicly available at this time but may be obtained from the authors upon reasonable request.
Acknowledgments
The authors would like to thank anonymous reviewers and editor for their useful comments on this paper.
Conflicts of Interest
The authors declare that they have no conflict of interest.
References
- Greeley, R. Observations of Actively Forming Lava Tubes and Associated Structures, Hawaii; NASA Ames Research Center: Mountain View, CA, USA, 1971.
- Greeley, R. The Role of Lava Tubes in Hawaiian Volcanoes; U.S. Geological Survey Professional Paper; USGS: Reston, VA, USA, 1987; Volume 1350, pp. 1589–1602.
- Greeley, R. Additional observations of actively forming lava tubes and associated structures, Hawaii. Mordern Geol. 1972, 3, 157–160. [Google Scholar]
- Calvari, S.; Pinkerton, H. Formation of lava tubes and extensive flow field during the 1991–1993 eruption of Mount Etna. J. Geophys. Res. Solid Earth 1998, 103, 27291–27301. [Google Scholar] [CrossRef]
- Hwang, S.; Ahn, U.; Lee, M.; Yun, S. Formation and internal structures of the Geomunorm Lava Tube System in the northeastern Jeju Island. J. Geol. Soc. Korea 2005, 41, 385–400. [Google Scholar]
- Valerio, A.; Tallarico, A.; Dragoni, M. A model for the formation of lava tubes by the growth of the crust from the levees. J. Geophys. Res. 2010, 115. [Google Scholar] [CrossRef] [Green Version]
- Merle, O. Numerical modelling of strain in lava tubes. Bull. Volcanol. 2000, 62, 53–58. [Google Scholar] [CrossRef]
- Bussey, D.; Guest, J.; Sørensen, S.A. On the role of thermal conductivity on thermal erosion by lava. J. Geophys. Res. Planets 1997, 102, 10905–10908. [Google Scholar] [CrossRef]
- Kerr, R.C. Thermal erosion by laminar lava flows. J. Geophys. Res. Solid Earth 2001, 106, 26453–26465. [Google Scholar] [CrossRef] [Green Version]
- Kempe, S. Principles of pyroduct (lava tunnel) formation. In Proceedings of the 15th International Congress of Speleology, Kerrville, TX, USA, 19–26 July 2009; pp. 668–674. [Google Scholar]
- Kempe, S.; Bauer, I.; Bosted, P.; Coons, D.; Elhard, R. Inflationary versus crusted-over roofs of pyroducts (lava tunnels). In Proceedings of the 14th International Symposium on Vulcanospeleology, Conjuboy, Australia, 12–17 August 2010; p. 93. [Google Scholar]
- Witter, J.B.; Harris, A.J.L. Field measurements of heat loss from skylights and lava tube systems. J. Geophys. Res. 2007, 112. [Google Scholar] [CrossRef] [Green Version]
- Whittaker, W. Technologies enabling exploration of skylights, lava tubes and caves. In NASA Innovative Advanced Concepts (NIAC) Phase I; NASA: Washington, DC, USA, 2012. [Google Scholar]
- Kempe, S.; Woo, K.S. Geological observations in pyroducts of Jeju Island. In Proceedings of the 17th Symposium of Vulcanospeleology, Ocean View, HI, USA, 6–12 February 2016. [Google Scholar]
- Woo, K.; Kim, L.; Ji, H.; Jeon, Y.; Ryu, C.G.; Wood, C. Geological Heritage Values of the Yongcheon Cave (Lava Tube Cave), Jeju Island, Korea. Geoheritage 2019, 11, 615–628. [Google Scholar] [CrossRef]
- Son, I. Jeju Cave Final Report 2019; KICT: Seoul, Korea, 2019; pp. 5–12. [Google Scholar]
- Kim, J.-H. Creation Process and Specialty of Volcanic Caves in Jeju. J. Speleol. Soc. Korea 2006, 71, 45–46. [Google Scholar]
- Son, I.-s. A Study on the Stability of Lava Cave in Jeju Island. J. Korean Speleol. 2016, 108, 1. [Google Scholar]
- Waltham, A.; Park, H. Roads over lava tubes in Cheju Island, South Korea. Eng. Geol. 2002, 66, 53–64. [Google Scholar] [CrossRef]
- Favre, G. Some observations on Hawaiian pit craters and relations with lava tubes. In Proceedings of the 3rd International Symposium on Vulcanospeleology, Bend, OR, USA, 30 July–1 August 1982; pp. 37–41. [Google Scholar]
- Ferrill, D.A.; Wyrick, D.Y.; Smart, K.J. Coseismic, dilational-fault and extension-fracture related pit chain formation in Iceland: Analog for pit chains on Mars. Lithosphere 2011, 3, 133–142. [Google Scholar] [CrossRef] [Green Version]
- Jeon, Y.; Ki, J.S.; Koh, S.Y.; Kim, L.; Ryu, C.K. Characteristics and Implications of Lava Tubes from Geophysical Exploration in Jeju Island. J. Eng. Geol. 2015, 25, 473–484. [Google Scholar] [CrossRef]
- Beccaro, L.; Tolomei, C.; Gianardi, R.; Sepe, V.; Bisson, M.; Colini, L.; De Ritis, R.; Spinetti, C. Multitemporal and Multisensor InSAR Analysis for Ground Displacement Field Assessment at Ischia Volcanic Island (Italy). Remote Sens. 2021, 13, 4253. [Google Scholar] [CrossRef]
- Harvey, M. Sentinel-1 InSAR captures 2019 catastrophic White Island eruption. J. Volcanol. Geotherm. Res. 2021, 411, 107124. [Google Scholar] [CrossRef]
- Di Traglia, F.; Nolesini, T.; Solari, L.; Ciampalini, A.; Frodella, W.; Steri, D.; Allotta, B.; Rindi, A.; Marini, L.; Monni, N. Lava delta deformation as a proxy for submarine slope instability. Earth Planet. Sci. Lett. 2018, 488, 46–58. [Google Scholar] [CrossRef]
- Kaku, T.; Haruyama, J.; Miyake, W.; Kumamoto, A.; Ishiyama, K.; Nishibori, T.; Yamamoto, K.; Crites, S.T.; Michikami, T.; Yokota, Y.; et al. Detection of Intact Lava Tubes at Marius Hills on the Moon by SELENE (Kaguya) Lunar Radar Sounder. Geophys. Res. Lett. 2017, 44, 10155–10161. [Google Scholar] [CrossRef]
- McGown, R.D.; York, C.L.; Billings, T.L.; Walden, B. Lavatube Entrance Amelioration on the Moon and Mars. In Space 2002 and Robotics 2002; ASCE Library: Reston, VA, USA, 2002; pp. 155–161. [Google Scholar] [CrossRef] [Green Version]
- Schenk, P.M.; Williams, D.A. A potential thermal erosion lava channel on Io. Geophys. Res. Lett. 2004, 31. [Google Scholar] [CrossRef] [Green Version]
- Carrer, L.; Gerekos, C.; Bruzzone, L. A multi-frequency radar sounder for lava tubes detection on the Moon: Design, performance assessment and simulations. Planet. Space Sci. 2018, 152, 1–17. [Google Scholar] [CrossRef]
- Rosen, P.; Paillou, P.; Hensley, S.; Massonnet, D.; Thompson, T. Imaging Radar Interferometry for the Exploration of Mars; American Geophysical Union: Washington, DC, USA, 2001; p. P52A-0571. [Google Scholar]
- Ghail, R.; Wilson, C.F.; Widemann, T. EnVision M5 venus orbiter proposal: Opportunities and challenges. In Proceedings of the DPS, Pasadena, CA, USA, 16–21 October 2016; pp. 208–216. [Google Scholar]
- Kim, J.-R.; Sumantyo, J.; Lin, S.-Y. Preliminary Study for the Long Wavelength Planetary SAR Sensor Design and Applications; EGUGA: Vienna, Austria, 2015; p. 8446. [Google Scholar]
- Kim, Y.S.; Choi, S.H. Plagioclase-rich nodules in Taeheungri basalt from Namwon, Jeju Island and its implications for tholeiite magmatism. J. Geol. Soc. Korea 2012, 48, 313–324. [Google Scholar]
- Brenna, M.; Cronin, S.J.; Nemeth, K.; Smith, I.E.; Sohn, Y.K. The influence of magma plumbing complexity on monogenetic eruptions, Jeju Island, Korea. Terra Nova 2011, 23, 70–75. [Google Scholar] [CrossRef]
- Brenna, M.; Cronin, S.J.; Smith, I.E.; Maas, R.; Sohn, Y.K. How small-volume basaltic magmatic systems develop: A case study from the Jeju Island Volcanic Field, Korea. J. Petrol. 2012, 53, 985–1018. [Google Scholar] [CrossRef] [Green Version]
- Brenna, M.; Cronin, S.J.; Smith, I.E.; Sohn, Y.K.; Maas, R. Spatio-temporal evolution of a dispersed magmatic system and its implications for volcano growth, Jeju Island Volcanic Field, Korea. Lithos 2012, 148, 337–352. [Google Scholar] [CrossRef]
- Koh, G.W.; Park, J.B.; Kang, B.-R.; Kim, G.-P.; Moon, D.C. Volcanism in Jeju Island. J. Geol. Soc. Korea 2013, 49, 209–230. [Google Scholar]
- KIGAM. Explanatory Note of Jeju Geological Map; KIGAM: Deajoon, Korea, 2000. [Google Scholar]
- Koh, G.-W.; Park, J.-B. The Study on Geology and Volcanism in Jeju Island (III): Early Lava Effusion Records in Jeju Island on the Basis of 40Ar/39Ar Absolute Ages of Lava Samples. Econ. Environ. Geol. 2010, 43, 163–176. [Google Scholar]
- Koh, G.-W.; Park, J.-B. The Study on geology and volcanism in Jeju Island (II): Petrochemistry and 40Ar/40Ar absolute ages of the volcanic rocks in Gapado-Marado, Jeju Island. Econ. Environ. Geol. 2010, 43, 53–66. [Google Scholar]
- Koh, G.-W.; Park, J.-B.; Park, Y.-S. The Study on Geology and Volcanism in Jeju Island (I): Petrochemistry and 40Ar/39Ar Absolute ages of the Subsurface Volcanic Rock Cores from Boreholes in the Eastern Lowland of Jeiu Island. Econ. Environ. Geol. 2008, 41, 93–113. [Google Scholar]
- Kim, I.; Lee, D. Magnetostratigraphy and AMS of the Seoguipo Formation and Seoguipo Trachyte of Jeju Island. J. Geol. Soc. Korea 2000, 36, 163–180. [Google Scholar]
- Sohn, Y.K.; Park, K.H. Early-stage volcanism and sedimentation of Jeju Island revealed by the Sagye borehole, SW Jeju Island, Korea. Geosci. J. 2004, 8, 73. [Google Scholar] [CrossRef]
- Son, H. Geophysical Exploration Report Around Manjanggul Cave; Pai Chai University: Daejeon, Korea, 2009. [Google Scholar]
- Hooper, A.; Zebker, H.; Segall, P.; Kampes, B. A new method for measuring deformation on volcanoes and other natural terrains using InSAR persistent scatterers. Geophys. Res. Lett. 2004, 31. [Google Scholar] [CrossRef]
- Intrieri, E.; Gigli, G.; Nocentini, M.; Lombardi, L.; Mugnai, F.; Fidolini, F.; Casagli, N. Sinkhole monitoring and early warning: An experimental and successful GB-InSAR application. Geomorphology 2015, 241, 304–314. [Google Scholar] [CrossRef] [Green Version]
- Baer, G.; Magen, Y.; Nof, R.; Raz, E.; Lyakhovsky, V.; Shalev, E. InSAR measurements and viscoelastic modeling of sinkhole precursory subsidence: Implications for sinkhole formation, early warning, and sediment properties. J. Geophys. Res. Earth Surf. 2018, 123, 678–693. [Google Scholar] [CrossRef]
- Yun, H.-W.; Kim, J.-R.; Yoon, H.; Choi, Y.; Yu, J. Seismic Surface Deformation Risks in Industrial Hubs: A Case Study from Ulsan, Korea, Using DInSAR Time Series Analysis. Remote Sens. 2019, 11, 1199. [Google Scholar] [CrossRef] [Green Version]
- Geudtner, D.; Torres, R.; Snoeij, P.; Davidson, M.; Rommen, B. Sentinel-1 system capabilities and applications. In Proceedings of the 2014 IEEE Geoscience and Remote Sensing Symposium, Quebec City, QC, Canada, 13–18 July 2014; pp. 1457–1460. [Google Scholar] [CrossRef]
- Ferretti, A.; Prati, C.; Rocca, F. Nonlinear subsidence rate estimation using permanent scatterers in differential SAR interferometry. IEEE Trans. Geosci. Remote Sens. 2000, 38, 2202–2212. [Google Scholar] [CrossRef] [Green Version]
- Ferretti, A.; Prati, C.; Rocca, F. Permanent scatterers in SAR interferometry. IEEE Trans. Geosci. Remote Sens. 2001, 39, 8–20. [Google Scholar] [CrossRef]
- Berardino, P.; Fornaro, G.; Lanari, R.; Sansosti, E. A new algorithm for surface deformation monitoring based on small baseline differential SAR interferograms. IEEE Trans. Geosci. Remote Sens. 2002, 40, 2375–2383. [Google Scholar] [CrossRef] [Green Version]
- Crosetto, M.; Monserrat, O.; Cuevas-González, M.; Devanthéry, N.; Crippa, B. Persistent scatterer interferometry: A review. Int. J. Photogramm. Remote Sens. 2016, 115, 78–89. [Google Scholar] [CrossRef] [Green Version]
- Houng, S.E.; Lee, J.; Hong, T.-K. Dynamic seismic response of a stable intraplate region to a megathrust earthquake. Tectonophysics 2016, 689, 67–78. [Google Scholar] [CrossRef]
- Hong, T.-K.; Lee, J.; Park, S.; Kim, W. Time-advanced occurrence of moderate-size earthquakes in a stable intraplate region after a megathrust earthquake and their seismic properties. Sci. Rep. 2018, 8, 13331. [Google Scholar] [CrossRef]
- Ahn, U.-S.; Hwang, S.-K. Study on source of lava flows forming the Manjanggul lava tube. J. Petrol. Soc. Korea 2009, 18, 237–253. [Google Scholar]
- Hamm, S.-Y.; Cheong, J.-Y.; Jang, S.; Jung, C.-Y.; Kim, B.-S. Relationship between transmissivity and specific capacity in the volcanic aquifers of Jeju Island, Korea. J. Hydrol. 2005, 310, 111–121. [Google Scholar] [CrossRef]
- Huang, C.T.; Mitchell, O.R. A Euclidean distance transform using grayscale morphology decomposition. IEEE Trans. Pattern Anal. Mach. Intell. 1994, 16, 443–448. [Google Scholar] [CrossRef]
- Blair, D.M.; Chappaz, L.; Sood, R.; Milbury, C.; Bobet, A.; Melosh, H.J.; Howell, K.C.; Freed, A.M. The structural stability of lunar lava tubes. Icarus 2017, 282, 47–55. [Google Scholar] [CrossRef]
- Theinat, A.K.; Modiriasari, A.; Bobet, A.; Melosh, H.J.; Dyke, S.J.; Ramirez, J.; Maghareh, A.; Gomez, D. Lunar lava tubes: Morphology to structural stability. Icarus 2020, 338, 113442. [Google Scholar] [CrossRef]
- Atzori, S.; Baer, G.; Antonioli, A.; Salvi, S. InSAR-based modeling and analysis of sinkholes along the Dead Sea coastline. Geophys. Res. Lett. 2015, 42, 8383–8390. [Google Scholar] [CrossRef] [Green Version]
- Hu, J.; Li, Z.; Ding, X.; Zhu, J.; Zhang, L.; Sun, Q. Resolving three-dimensional surface displacements from InSAR measurements: A review. Earth-Sci. Rev. 2014, 133, 1–17. [Google Scholar] [CrossRef]
- Ho, T.K. The random subspace method for constructing decision forests. IEEE Trans. Pattern Anal. Mach. Intell. 1998, 20, 832–844. [Google Scholar]
- Breiman, L. Random forests. Mach. Learn. 2001, 45, 5–32. [Google Scholar] [CrossRef] [Green Version]
- Friedman, J.H. Stochastic gradient boosting. Comput. Stat. Data Anal. 2002, 38, 367–378. [Google Scholar] [CrossRef]
- Mason, L.; Baxter, J.; Bartlett, P.L.; Frean, M.R. Boosting algorithms as gradient descent. In Proceedings of the Advances in Neural Information Processing Systems, Denver, CO, USA, 29 November–4 December 1999; pp. 512–518. [Google Scholar]
- Liaw, A.; Wiener, M. Classification and regression by randomForest. R News 2002, 2, 18–22. [Google Scholar]
- The Government of Japan. Geophysical Exploration Report around Manjanggul Cave; The Government of Japan: Tokyo, Japan, 2009.
- Yang, X.-l.; Long, Z.-X. Roof collapse of shallow tunnels with limit analysis method. J. Cent. South Univ. 2015, 22, 1929–1936. [Google Scholar] [CrossRef]
- Abdellah, W.R.; Ali, M.A.; Yang, H.-S. Studying the effect of some parameters on the stability of shallow tunnels. J. Sustain. Min. 2018, 17, 20–33. [Google Scholar] [CrossRef]
- Paternesi, A.; Schweiger, H.F.; Scarpelli, G. Numerical analyses of stability and deformation behavior of reinforced and unreinforced tunnel faces. Comput. Geotech. 2017, 88, 256–266. [Google Scholar] [CrossRef]
- Zhang, Y.; Li, X. Finite element analysis of the stability of tunnel surrounding rock with weak rock layer. Mod. Appl. Sci. 2009, 3, 22–27. [Google Scholar] [CrossRef] [Green Version]
- Fialko, Y.; Simons, M.; Agnew, D. The complete (3-D) surface displacement field in the epicentral area of the 1999 Mw7. 1 Hector Mine earthquake, California, from space geodetic observations. Geophys. Res. Lett. 2001, 28, 3063–3066. [Google Scholar] [CrossRef] [Green Version]
- Alvarez-Salazar, O.; Hatch, S.; Rocca, J.; Rosen, P.; Shaffer, S.; Shen, Y.; Sweetser, T.; Xaypraseuth, P. Mission design for NISAR repeat-pass Interferometric SAR. In Proceedings of the Sensors, Systems, and Next-Generation Satellites XVIII, Amsterdam, The Netherlands, 14 November 2014; p. 92410C. [Google Scholar]
- Scipal, K.; Arcioni, M.; Chave, J.; Dall, J.; Fois, F.; LeToan, T.; Lin, C.-C.; Papathanassiou, K.; Quegan, S.; Rocca, F. The BIOMASS mission—An ESA Earth Explorer candidate to measure the BIOMASS of the earth’s forests. In Proceedings of the 2010 IEEE International Geoscience and Remote Sensing Symposium, Honolulu, HI, USA, 25–30 July 2010; pp. 52–55. [Google Scholar]
- Chappaz, L.; Sood, R.; Melosh, H.J.; Howell, K.C.; Blair, D.M.; Milbury, C.; Zuber, M.T. Evidence of large empty lava tubes on the Moon using GRAIL gravity. Geophys. Res. Lett. 2017, 44, 105–112. [Google Scholar] [CrossRef] [Green Version]
- Cushing, G.; Titus, T.N.; Wynne, J.J.; Christensen, P. THEMIS observes possible cave skylights on Mars. Geophys. Res. Lett. 2007, 34. [Google Scholar] [CrossRef] [Green Version]
Figure 2.
(a) Overall processing flow to define LTDP and (b) PS processor.

Figure 3.
Connection graphs of employed Sentinel-1 InSAR pair as shown in 72 descending images employed for PS time series analysis.
Figure 3.
Connection graphs of employed Sentinel-1 InSAR pair as shown in 72 descending images employed for PS time series analysis.

Figure 4.
PS processing results over Jeju Island. (a) LOS deformation velocity and (b) average phase coherence.
Figure 4.
PS processing results over Jeju Island. (a) LOS deformation velocity and (b) average phase coherence.

Figure 5.
Spatial analyses to create processing mask. (a) Lava tube distributions and (b) density map of lava tubes calculated with the weighted tube length. (c) PGS distributions and (d) distance transformation map of PGS.
Figure 5.
Spatial analyses to create processing mask. (a) Lava tube distributions and (b) density map of lava tubes calculated with the weighted tube length. (c) PGS distributions and (d) distance transformation map of PGS.

Figure 6.
Training point locations of V-migration, H-migration, regional subsidence, and instability points by artificial structures for machine learning. The training vectors for regional subsidence were chosen in Seogwipo City, where Jeju Island’s only sediment unit exists. Training vectors for instability caused by artificial structures were built in the Jeju City area, where the largest buildings are concentrated.

Figure 7.
Deformations and standard deviations for training vectors on (a) collapse (PGS)-road crossing points, (b) Manjang cave-road crossing points, (c) deformation points in Seogwipo sediments, (d) deformation points in Jeju City urban area, and (e) deformations points on H-migrations. A five-window-sized moving average filter was applied to the original data set to observe the trend in the time domain.

Figure 8.
Distribution of LTDPs on (a) spatial analysis mask and pahoehoe lava flow and (b) geological units together with estimated clusters implying potential lava tube networks. (c) Histogram of V-migration points and average deformation/standard deviation/2nd polynomial regression of strong V-migration points and (d) Histogram of H-migration points and average deformation/standard deviation/2nd order polynomial regression of strong H-migration points.


Figure 9.
Examples of 2D/3D cave models and instability check. (a) The 2D profile of Manjang caves and the location of detected LTDPs on the terminus of the tube, which are digitized from [56]. (b) 3D LiDAR map in Gamnamdap cave with thin topography. (c) Diagram of expected deformations on cross-sectional lava tube (H: depth of cave, R: radius of approximated circular shape on lava tube, L1 and L2: the lengths of upper and lower parts of collapsing part, dh and dv: hypothesized H/V deformations at certain collapsing points). Refer to Figure 1 to identify cave locations. The map projection system of (b) is Korea 2000/Central Belt 2010.

Figure 10.
(a) The distribution of detected deformations and buffer zones around collapsing lava tubes. Buffer zone was given by the cave length. (b) H-V migration points around Manjang cave compared to the GPR and electricity resistivity survey results.
Figure 10.
(a) The distribution of detected deformations and buffer zones around collapsing lava tubes. Buffer zone was given by the cave length. (b) H-V migration points around Manjang cave compared to the GPR and electricity resistivity survey results.


Table 1.
Characteristics of employed Sentinel-1 images.
| SAR Image Parameters | |
|---|---|
| Image number | 72 |
| Time coverage | 1 January 2016–22 December 2018 |
| Heading angle (deg) | −167.107 |
| Incidence angle (deg) | 44.0 |
| Relative Orbit | 134 |
| Acquisition time | 06:32 KST (GMT + 9) |
Table 2.
The number and standard of training data.
| Number of Points | Selection Standard (Velocity (mm/Year) and Standard Deviation (Std.dev.)) | Constraints | |
|---|---|---|---|
| V-migrations | 50 | Velocity < −1.0 Std.dev. > 0.5 | Soumgol and Manjang cave around road crossing |
| H-migration | 17 | Velocity > −0.75 Std.dev. > 0.5 | Soumgol and Manjang cave around road crossing |
| Regional subsidence | 483 | Velocity < −2 Std.dev. > 1.0 | Seogwipo sediment unit |
| Instability points by artificial structures | 433 | Velocity < 4.5 Std.dev. > 1.0 | Jeju City area |
Publisher’s Note: MDPI stays neutral with regard to jurisdictional claims in published maps and institutional affiliations. |
© 2022 by the authors. Licensee MDPI, Basel, Switzerland. This article is an open access article distributed under the terms and conditions of the Creative Commons Attribution (CC BY) license (https://creativecommons.org/licenses/by/4.0/).
Share and Cite
MDPI and ACS Style
Kim, J.-R.; Lin, S.-Y.; Oh, J.-W. The Survey of Lava Tube Distribution in Jeju Island by Multi-Source Data Fusion. Remote Sens. 2022, 14, 443. https://0-doi-org.brum.beds.ac.uk/10.3390/rs14030443
AMA Style
Kim J-R, Lin S-Y, Oh J-W. The Survey of Lava Tube Distribution in Jeju Island by Multi-Source Data Fusion. Remote Sensing. 2022; 14(3):443. https://0-doi-org.brum.beds.ac.uk/10.3390/rs14030443
Chicago/Turabian StyleKim, Jung-Rack, Shih-Yuan Lin, and Jong-Woo Oh. 2022. "The Survey of Lava Tube Distribution in Jeju Island by Multi-Source Data Fusion" Remote Sensing 14, no. 3: 443. https://0-doi-org.brum.beds.ac.uk/10.3390/rs14030443
Note that from the first issue of 2016, this journal uses article numbers instead of page numbers. See further details here.