
Comparative Study of the 60 GHz and 118 GHz Oxygen Absorption Bands for Sounding Sea Surface Barometric Pressure


1
School of Information Technology, Luoyang Normal University, Luoyang 471934, China
2
Key Laboratory of Microwave Remote Sensing, National Space Science Center, Chinese Academy of Sciences, Beijing 100190, China
3
Department of Electrical and Computer Engineering, Michigan State University, East Lansing, MI 48824, USA
4
School of Information and Communication Engineering, Beijing Information Science and Technology University, Beijing 100101, China
*
Author to whom correspondence should be addressed.
†
These authors contributed equally to this work.
Remote Sens. 2022, 14(9), 2260; https://0-doi-org.brum.beds.ac.uk/10.3390/rs14092260
Submission received: 12 March 2022
/
Revised: 30 April 2022
/
Accepted: 5 May 2022
/
Published: 8 May 2022
Abstract
:The 60 GHz and 118 GHz oxygen absorption bands are prominent in the passive microwave remote sensing of atmospheric temperature, and also can be used for sounding sea surface barometric pressure (SSP). Microwave Temperature Sounder II (MWTS-II) has 13 channels in the 60 GHz band, and Microwave Humidity and Temperature Sounder (MWHTS) has 8 channels in the 118 GHz band. They are both carried on Fengyun-3C Satellite (FY-3C) and Fengyun-3D Satellite (FY-3D), which provide measurements for comparing the retrieval accuracies of SSP using 60 GHz and 118 GHz bands. In this study, based on the weighting functions for MWHTS and MWTS-II, the 60 GHz and 118 GHz channel combinations representing 60 GHz and 118 GHz are established, respectively, and the retrieval accuracies of SSP from these two channel combinations are compared in different weather conditions. The experimental results show that the retrieval accuracy of SSP at 60 GHz is higher than that of 118 GHz in clear, cloudy, and rainy sky conditions. In addition, the retrieval experiments of SSP from MWTS-II and MWHTS are also carried out, and the experimental results show that the retrieval accuracy of SSP from MWTS-II is higher. The comparative study of the 60 GHz and 118 GHz for sounding SSP can provide support for the theoretical study of microwave remote sensing of SSP with practical measurements, and further contribute to understand the performance of 60 GHz and 118 GHz in atmospheric sounding.
1. Introduction
Sea surface barometric pressure (SSP) is an essential atmospheric parameter that is closely related to the activities of cold and warm air, atmospheric circulation, and solar activity, etc. [1,2]. SSP plays an important role in atmospheric science, such as numerical weather prediction (NWP), climatological studies, and tropical cyclone analysis and forecasting [3,4,5,6]. The measured SSP with an accuracy of 1–2 hPa in clear sky conditions and 3 hPa in cloudy sky conditions can be useful for meteorological applications [7]. Zhang et al. [8,9] proposed the concept of passive microwave remote sensing of SSP for the first time in 2018, and retrieved SSP data with high accuracy (2.0 hPa in the clear sky condition and about 3.0 hPa in the cloudy sky condition) from the Advanced Technology Microwave Sounder (ATMS) onboard Suomi-National Polar-Orbiting Operational Environmental satellite system Preparatory Project (SNPP) satellite and Microwave Humidity and Temperature Sounder (MWHTS) onboard Fengyun-3C (FY-3C) satellite, respectively. Zhang et al. [9] also demonstrated that the SSP retrievals based on passive microwave observations can meet the accuracy requirements of SSP for meteorological applications.
Compared with in situ platforms, such as meteorological stations, floating buoys, dropsondes, and direct detection schemes (including raster spectrometers, differential absorption radars, and GPS radio occultation detections), the satellite-based passive microwave remote sensing can provide high spatial and temporal resolution and intensive and continuous detection of SSP globally [10,11]. In addition, compared with the satellite-based microwave scatterometer, the satellite-based microwave radiometer can independently obtain the SSP data itself, without relying on revisions of atmospheric parameters, such as temperature profiles, humidity profiles, and surface temperatures [12]. At present, satellite-based microwave radiometers, such as the Advanced Microwave Sounding Unit (AMSU), ATMS, MWHTS, and the Microwave Temperature Sounder-II (MWTS-II), whose channels are in the 60 GHz oxygen resonance absorption band or near the 118.75 GHz oxygen absorption line or near the 183.31 GHz water vapor absorption line, can be used for sounding SSP [9].
Satellite-based microwave remote sensing technology has been using 60 GHz and 118 GHz to detect atmospheric temperature for more than 60 years [13]. At present, 60 GHz and 118 GHz are still the main frequency bands used for atmospheric temperature profiling [14,15]. In 1971, Croom compared the performance of 60 GHz and 118 GHz in detecting atmospheric temperature, whose mainly contributions are summarized as follows: (1) For a specific antenna diameter, the spatial resolution length at 60 GHz is twice that of 118 GHz; (2) Since the 118 GHz oxygen line is an isolated line, the superheterodyne radiometer design based on it is much simpler; (3) The 118 GHz line has a simpler Zeeman splitting pattern and with the smaller pressure broadening compared to the 60 GHz spectrum, and is more advantageous in detecting temperature profiles at altitudes of 50–150 km; (4) 118 GHz is more sensitive to clouds and water vapor than 60 GHz, and is more likely to be adversely affected by clouds and water vapor in retrieving the atmospheric temperature profiles [16]. Since the 118 GHz observations include the information about clouds and water vapor, they can be applied to retrieve atmospheric water vapor, clouds, and precipitation.
Due to the limitations of the satellite platform, a large number of studies have been conducted to compare the performance of 60 GHz and 118 GHz for detecting atmospheric temperature using the simulated brightness temperatures or the observed brightness temperatures from airborne platforms [17,18,19]. Based on the observations from the airborne platform, Gasiewski et al. [17] validated that the comparable detection accuracy of temperature can be obtained at 118 GHz and 60 GHz in non-precipitation conditions. He et al. validated the advantages of using the 118 GHz line for detecting the atmospheric temperature profiles in the upper atmosphere [20,21]. At present, the method of measuring atmospheric temperature using the 60 GHz oxygen absorption band or the 118 GHz oxygen absorption band is relatively mature, which plays an important role in various meteorological applications [15,21,22].
For passive microwave remote sensing of SSP, both the 60 GHz and 118 GHz oxygen absorption bands can be used for sounding SSP by satellite-based microwave radiometers [9]. However, the differences in the sensitivity of the 60 GHz and 118 GHz bands to atmospheric water vapor or cloud parameters will lead to the differences of the performance of the 60 GHz and 118 GHz bands in retrieving SSP in different weather conditions. For the developments of the theory and application of passive microwave remote sensing of SSP, it is necessary to understand the performance of these two frequency bands for detecting SSP more deeply and systematically study the retrieval of SSP using the 60 GHz and 118 GHz bands under different atmospheric situations. However, to the best of authors’ knowledge, no study has been performed and reported on this subject.
Zhang et al. [8,9] carried out a study on the retrieval of SSP based on ATMS measurements and MWHTS measurements, and obtained the SSP retrievals that can meet the requirements of meteorological applications, and also verified that the retrieval accuracies of SSP from ATMS and MWHTS are comparable. However, ATMS is involved in the 22.235 GHz water vapor absorption band, 60 GHz oxygen absorption band, and 183.31 GHz water vapor absorption band, while MWHTS is involved in the 118 GHz oxygen absorption band and 183.31 GHz water vapor absorption band for retrieving SSP. Zhang’s work does not involve the comparison study of the 60 GHz and 118 GHz for the sounding of SSP. In addition, the comparative study of the retrieval accuracies of SSP from ATMS and MWHTS is not conducted for the same observation scenarios and observation conditions in Zhang’s work.
MWHTS and MWTS-II are essential payloads onboard FY-3C and FY-3D Satellites, both of which are operating normally in orbit and have accumulated abundant data for atmospheric sounding. MWHTS consists of 8 sounding channels near the 118.75 GHz oxygen absorption line, and MWTS-II consists of 13 sounding channels in the 60 GHz oxygen absorption band [23,24]. The comparison of the performance of 60 GHz and 118 GHz in retrieving SSP using observations of MWHTS and MWTS-II are reasonable because these two payloads are onboard the same satellite platform. In this study, the retrieval experiments of SSP are carried out using the MWTS-II and MWTS-II observations in clear, cloudy, and rainy sky conditions. Based on the SSP retrieval results, the retrieval accuracies of SSP using 60 GHz and 118 GHz bands in different weather conditions are compared and analyzed. This contributes to a more comprehensive understanding of the performance of these two oxygen absorption bands in sounding atmospheric parameters, and provides a reference for the design of the SSP sounders and the retrieval of SSP using passive microwave observations.
This paper is organized as follows. Section 2 describes the instrument characteristics of MWHTS and MWTS-II and data classification according to different weather conditions. Section 3 focuses on the principle of the satellite-based passive microwave remote sensing of SSP. The SSP retrieval algorithm based on a deep neural network (DNN) and the experimental design are contained in Section 4. Section 5 presents the experimental results and analyses. Section 6 concludes this study.
2. Data Description and Classification
2.1. Instruments Characteristics and Satellite Data Description
FY-3C and FY-3D Satellites, launched in 23 September 2013 and 15 November 2017, respectively, are China’s new generation of polar-orbiting satellites dedicated to operational meteorology. FY-3C/D Satellites carry two important passive microwave sounders, MWHTS and MWTS-II, both of which are the total power microwave radiometers. MWHTS provides measurements around the 118.75 GHz oxygen absorption line (eight sounding channels) and the 183.31 GHz water vapor absorption line (five sounding channels), plus two window channels at 89 and 150 GHz that enable deeper penetration of the microwave through the atmosphere down to the surface. MWHTS is designed to detect surface and atmospheric variables, including temperature, water vapor, cloud liquid water, precipitation, surface pressure, and surface temperature. MWTS-II is dedicated to the retrieval of atmospheric temperature profiles, with 13 sounding channels in the 60 GHz oxygen absorption band. Both MWHTS and MWTS-II perform the cross-track viewing geometry to measure atmospheric microwave radiation. MWHTS with 98 pixels per scan line from nadir to ±53.35° provides a nominal spatial resolution of 16 km at nadir and MWTS-II with 90 pixels per scan line from nadir to ±49.5° provides a nominal spatial resolution of 33 km at nadir [20,21,25].
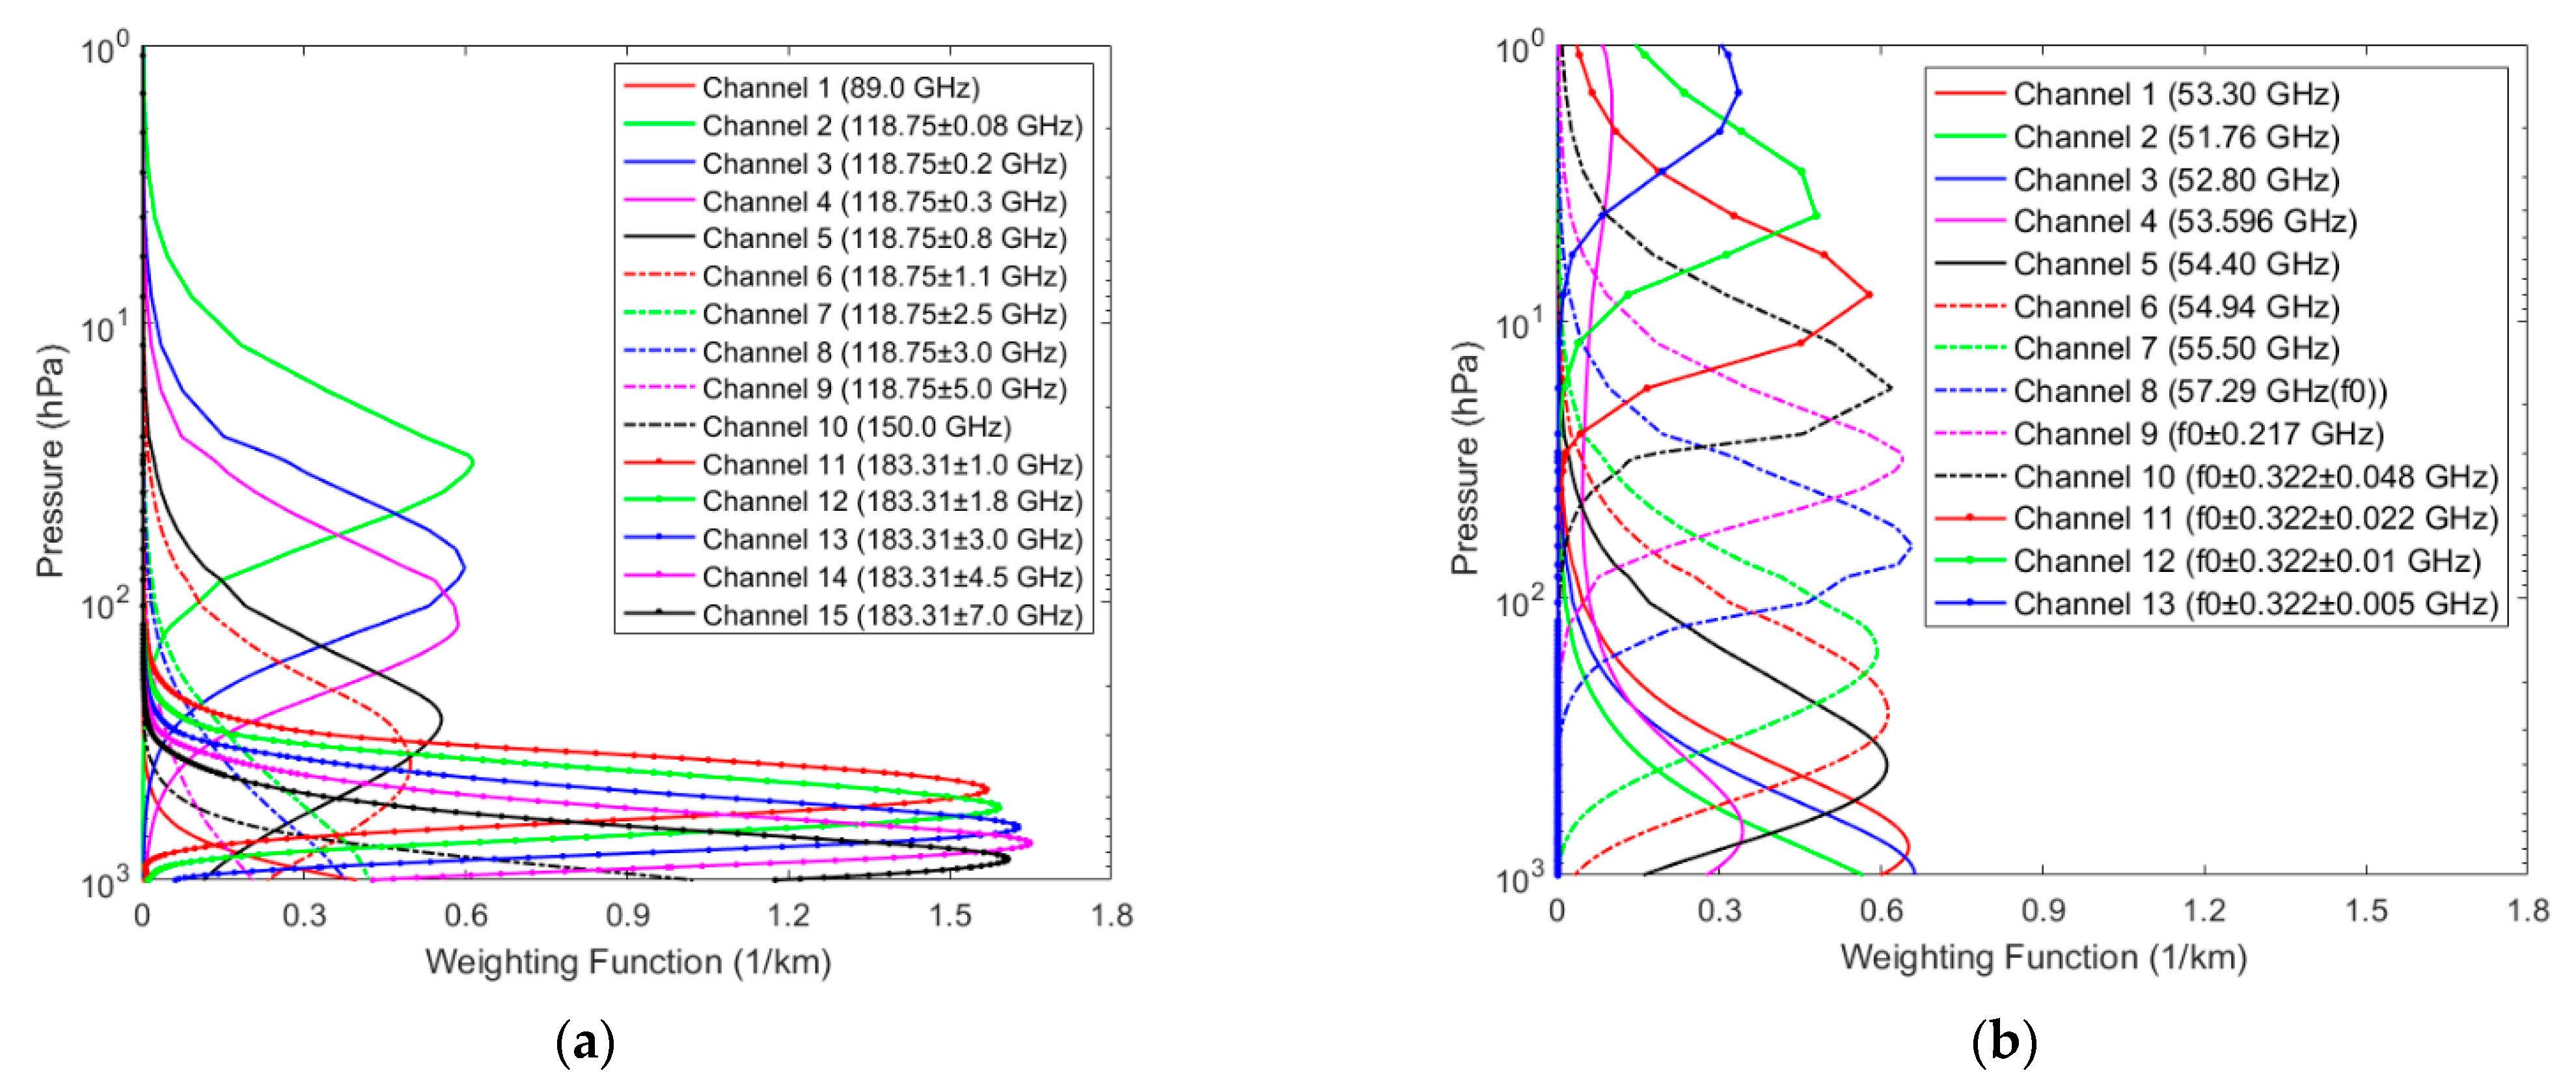
Each channel of MWHTS and MWTS-II corresponds to a channel weighting function (WF), which is used to describe the sensitivity of the channel to different atmospheric layers. The atmospheric layer in which the peak WF height of the sensing channel is distributed indicates that the channel is most sensitive to that atmospheric layer, in other words, the majority of the atmospheric radiation measured by the channel comes from that atmospheric layer [26]. The WF distributions of MWHTS and MWTS-II calculated from the standard U.S. atmosphere profile at nadir by Millimeter wave Propagation Model-93 (MPM-93) [27] when the surface emissivity is set to 0.5, are shown in Figure 1, where the channel frequencies of MWHTS and MWTS-II are also presented.
As can be seen from Figure 1, MWHTS channels 2–9 in the 118 GHz band mainly measure the temperature information of the stratosphere (from 350 to 30 hPa pressure level) and Earth’s surface, and MWHTS channels 11–15 with frequencies in the 183.31 GHz band mainly detect the humidity information of the troposphere (from about 800 to 300 hPa pressure level). MWHTS window channels 1 and 10 at 89 GHz and 150 GHz, respectively, with the peak WF heights close to the surface can be used to obtain the surface information. MWTS-II channels 11–13 with the peak WF heights are distributed in the upper atmosphere above 10 hPa pressure level, and MWTS-II channels 1–13 with frequencies in the 60 GHz band, whose peak WF heights are unevenly distributed throughout the atmosphere, can provide the temperature information from the surface to about 3 hPa pressure level. In addition, the microwave radiation of the same atmospheric layer can be measured by multiple sounding channels, meaning that there are correlations between the observations of MWHTS or MWTS-II channels [22].
MWHTS and MWTS-II observations used in this study are Level 1b brightness temperatures of MWHTS and MWTS-II onboard FY-3D Satellite provided by the National Satellite Meteorological Center (NSMC) (http://satellite.nsmc.org.cn, accessed on 19 August 2020). Lawrence et al. [15] and Carminati et al. [28] have evaluated MWHTS and MWTS-II observations by assimilating them in the operational model and have reported a positive impact on the forecast accuracy and improvement of the background.
2.2. Climatological Data Description
The ERA-Interim reanalysis and ERA5 reanalysis are different versions of the reanalysis data provided by European Centre for Medium-Range Weather Forecasts (ECMWF), both of which can provide the SSP data for the establishment and validation of the retrieval model in the SSP retrieval experiments. As the successor of ERA-Interim, although ERA5 has been improved in various aspects, such as higher spatial and temporal resolution, better representation of tropical cyclones, better global balance of precipitation and evaporation, and better soil moisture, the data product of ERA5 needs further assessed. ERA-Interim is selected in this study considering that it has been successfully applied in thousands of research applications since 2006 [29]. ERA-Interim describing the recent history of the surface and atmospheric situations is generated by a 4D variational data assimilation system and forecast models in ECMWF, and can be obtained from the ECMWF data server (http://apps.ecmwf.int/datasets, accessed on 19 August 2020) [30,31]. In addition, for the simulation of MWHTS and MWTS-II observed brightness temperatures, the atmospheric profiles and surface properties on a fixed latitude and longitude grid of 0.5° at standard synoptic times (0000, 0600, 1200, and 1800 UTC) from ERA-Interim are used to develop the atmospheric dataset, which includes the following information: the temperature, humidity, cloud cover, cloud liquid water and cloud ice water profiles on 37 pressure levels ranging from 1000 to 1 hPa pressure level, and surface parameters including 2 m temperature, 2 m dewpoint temperature, surface pressure, skin temperature, 10 m u wind component (the eastward component of the 10 m wind), 10 m v wind component (the northward component of the 10 m wind), and vertical integral of cloud liquid water.
2.3. Data Collocation
In this study, MWHTS and MWTS-II observed brightness temperatures and the atmospheric dataset built from the ERA-Interim reanalysis from the ocean area of 25–45°N and 160–220°E were selected for the SSP retrieval study, covering the period from 1 September 2018 to 31 August 2019. It should be noted that the ocean area was randomly selected. In addition, the time period was chosen to ensure sufficient samples for building the retrieval model of SSP.
In order to compare the retrieval accuracies of SSP using 118 GHz and 60 GHz bands in the same observation scenarios as much as possible, it was required to collocate the MWHTS and MWTS-II observations. The collocated criteria were that their differences in longitude and latitude are both less than 0.1°, and their time difference is less than 2 s. By collocating MWHTS and MWTS-II observations, collocated brightness temperatures were obtained.
In order to build the retrieval model of SSP and simulate the observed brightness temperatures of MWHTS and MWTS-II, it is desirable to collocate the collocated brightness temperatures of MWHTS and MWTS-II with the atmospheric dataset created as described in Section 2.2 with the criteria that their time difference is less than 0.5 h, and their differences in longitude and latitude are both less than 0.1°. In this study, Radiative Transfer for Television and Infrared Observation Satellite Operational Vertical Sounder, Version 11.3 (RTTOV v11.3) was selected to carry out the calculation of the simulated brightness temperatures. RTTOV is a very fast radiative transfer model for passive visible, infrared and microwave downward-viewing satellite radiometers, spectrometers and interferometers, and is widely used in the satellite observation retrieval and data assimilation communities [32]. The atmospheric dataset collocated with the observations of MWHTS and MWTS-II was input to RTTOV to obtain the simulated brightness temperatures of MWHTS and MWTS-II. Therefore, by collocating the observed brightness temperatures and the atmospheric dataset, and calculating the simulated brightness temperatures, the collocated dataset with 386,279 collocated samples can be created containing the atmospheric dataset, the observed brightness temperatures and the simulated brightness temperatures of MWHTS and MWTS-II.
2.4. Data Classification According to the Clear, Cloudy, and Rainy Sky Conditions
The interaction of microwave with atmospheric components, such as absorption and scattering, can be represented by the radiative transfer equation, which is the physical basis of the microwave remote sensing of the atmosphere [33,34]. The radiative transfer model was developed based on the radiative transfer equation. Given an atmospheric profile of temperature, water vapor and, optionally, trace gases, aerosols, and hydrometeors, together with surface parameters and the viewing geometry, the radiative transfer model is able to compute the brightness temperatures in each of the channels of microwave radiometer being simulated [35]. The radiative transfer model plays an important role in both designing microwave radiometers and developing retrieval algorithms. The accuracy of the modeling of microwave transport in the atmosphere directly affects the development of microwave theory and the application of passive microwave observations [35,36].
However, in general, the calculation accuracy of the microwave radiative transfer model differs in different weather conditions. Compared with the clear sky condition, the transmission processes of microwaves in the cloudy and rainy sky conditions are more complex and more difficult to be modeled. Probably due to some non-modeled physical processes or the poor accuracy of parameters such as clouds or precipitation, which participate in radiative transfer calculations, the radiative transfer model is usually less accurate for simulating the microwave radiometer in the cloudy or rainy sky conditions. In addition, it should be noted that clouds and precipitation introduce stronger attenuation, which may reduce the sensitivity of microwave observations to the desired atmospheric parameters in the microwave remote sensing of the atmosphere.
In view of the differences in the calculation accuracy of radiative transfer models in different weather conditions and the effects of clouds and precipitation on the microwave remote sensing of the atmospheric parameters, it is necessary to classify the satellite observations according to the weather conditions before conducting the retrieval of SSP. Normally, the classification of passive microwave observations mainly involves identifying clear and cloudy scenes, as well as determining whether passive microwave observations are affected by precipitation.
Currently, there are three methods commonly used to identify clear and cloudy scenes for passive microwave observations [37,38,39]: (1) using the collocated atmospheric parameters from operational reanalysis datasets, such as humidity, cloud cover, and cloud liquid water, as a priori flag; (2) developing an independent classifier derived from visible or infrared observations onboard geostationary satellites; (3) using the characteristics of satellite observations itself to identify, for example, a dedicated cloud classifier can be developed based on the interrelationship between the observations of the channels of microwave radiometer. For the determination of the precipitation-affected microwave observations, various methods have been developed to create the precipitation flags [40]: (1) using the precipitation estimates of the operational analysis data; (2) using microwave precipitation flags established in the literature, such as [41,42,43,44]; and (3) using the retrieved precipitation from other instruments onboard the same satellite platform.
The purpose of this study is to compare the retrieval accuracies of SSP using 60 GHz and 118 GHz bands, rather than the application of retrieving SSP using satellite observations. Therefore, the vertical integral of cloud liquid water from ERA-Interim was chosen to classify the MWTS-II and MWHTS observations in clear, cloudy, and rainy sky conditions. Meanwhile, the relationship between the calculation accuracy of RTTOV for MWTS-II and MWHTS simulated brightness temperatures and the vertical integral of cloud liquid water is also investigated. It should be noted that due to the lack of accurate information about the cloud-ice and precipitation profiles in ERA-Interim reanalysis, the scatterings of clouds and precipitation are not taken into account when calculating MWTS-II and MWHTS simulated brightness temperatures by RTTOV.
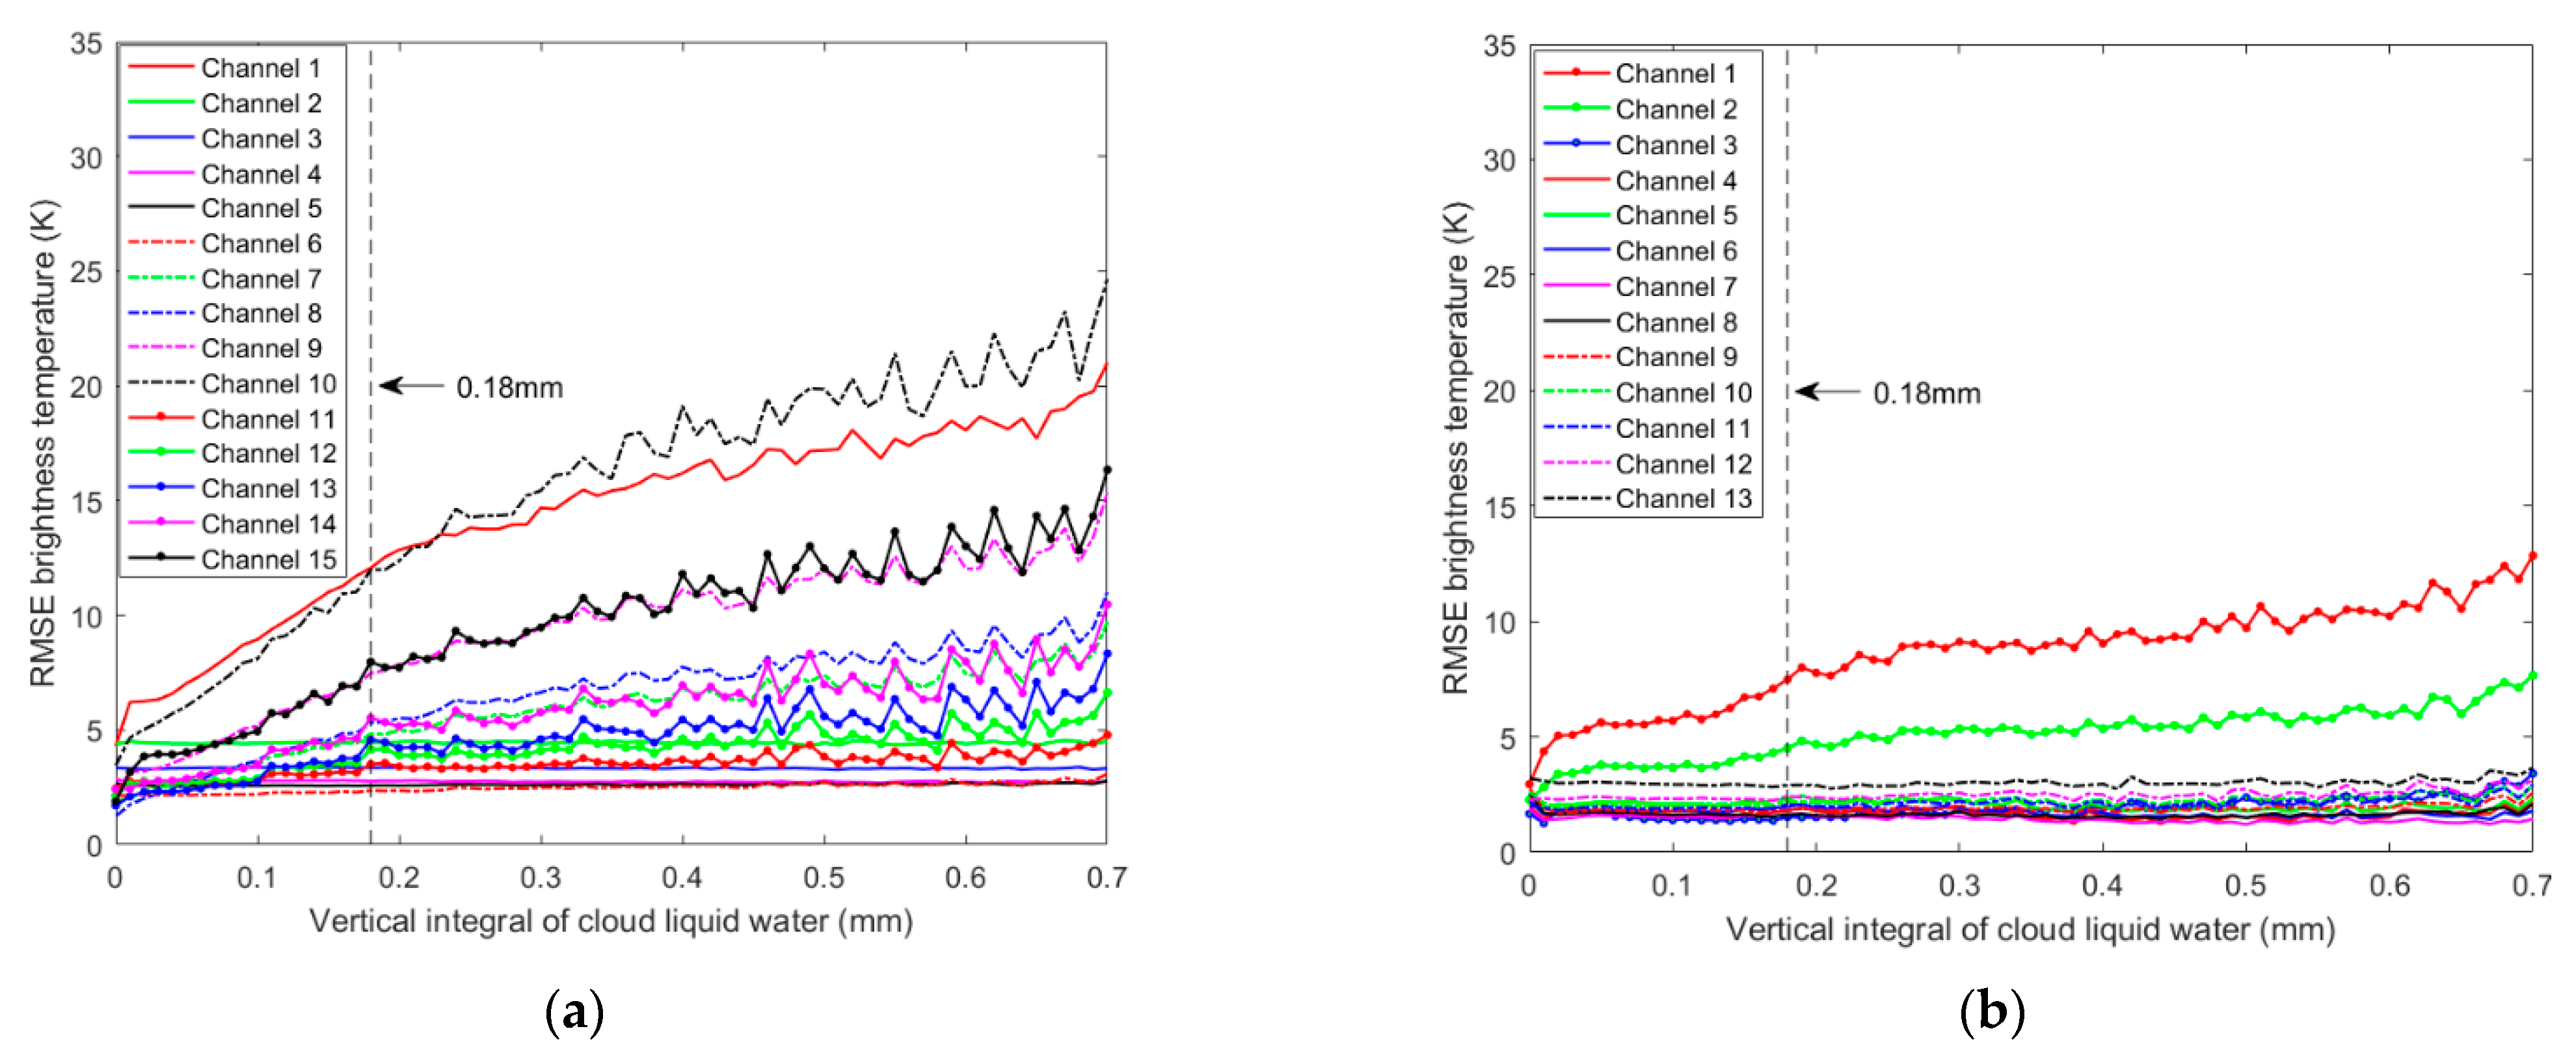
The collocated dataset created as described in Section 2.3 is used to investigate the relationship between the accuracy of the simulated brightness temperature and the vertical integral of cloud liquid water, where the accuracy of the simulated brightness temperature is expressed as the root-mean-square error (RMSE) between the simulated brightness temperature and the observed brightness temperature. The simulated brightness temperature is counted in each interval of the vertical integral of cloud liquid water which starts at 0 mm and increases to 0.69 mm with a step of 0.01 mm. In addition, since the data amount with the vertical integral of cloud liquid water greater than 0.7 mm is small, the vertical integral of cloud liquid water greater than 0.7 m is treated as an interval. RMSEs between the simulated brightness temperatures and the observed brightness temperatures for each channel of MWHTS and MWTS-II in each interval of vertical integral of cloud liquid water are calculated, and then the calculation accuracies of RTTOV for the simulated brightness temperatures vary with the vertical integral of cloud liquid water are obtained, as shown in Figure 2.
It can be observed from Figure 2a that the calculation accuracies of RTTOV in MWHTS temperature sounding channels 2–6 are not affected by the cloud liquid water. The reason for this is that MWHTS channels 2–6, whose peak WF heights are distributed above 350 hPa pressure level, mainly detect the temperature of the middle and upper atmosphere, while the precipitation mostly occurs in the middle and lower atmosphere below 400 hPa pressure level. The increase in cloud liquid water in the detection path or the occurrence of precipitation both affect MWHTS temperature sounding channels 7–9 and window channels 1 and 10 with the peak WF heights close to the surface. Therefore, the greater the cloud liquid water content, the worse the calculation accuracies of RTTOV for the simulated brightness temperatures. Typically, the water vapor is more abundant when the cloud liquid water levels are higher. Due to the sensitivity of MWHTS humidity detection channels 11–15 to water vapor, these channels’ observations are all affected by the cloud liquid water. As the cloud liquid water increases, the calculation accuracies of RTTOV for the simulated brightness temperatures of these channels become worse, where the cloud liquid water has the greatest effect on channel 15, while the least effect on channel 11.
For MWTS-II, since the 60 GHz oxygen absorption band is less sensitive to water vapor, the cloud liquid water and precipitation only affect the observed brightness temperatures of channels 1–3 with the peak WF heights close to the surface. MWTS-II channel 1 is more sensitive to the cloud liquid water compared to MWTS-II channels 2 and 3. However, MWTS-II channels 4–13 are almost unaffected by the cloud liquid water.
According to the above analysis, it can be found that the nonlinearity of the radiative transfer equation increases with the increase in cloud liquid water, which in turn leads to a deterioration in the calculation accuracy of the radiative transfer model. Therefore, the calculation accuracy of RTTOV for the simulated brightness temperature is used as an aid to determine whether the microwave observations are affected by clouds and precipitation in this study, although the scattering of cloud ice water and precipitation are not included in the simulation.
As shown in Figure 2, for MWHTS channel 1 and channels 7–15 and MWTS-II channels 1–3, which are affected by cloud liquid water, the calculation accuracies of RTTOV for the simulated brightness temperatures of these channels are the highest when the vertical integral of cloud liquid water approaches 0 mm. Therefore, the vertical integral of cloud liquid water of 0 mm was used as the data classification criterion for the clear sky condition. Additionally, as shown in Figure 2a, for MWHTS channels 11–15, there are significant decreasing trends in the calculation accuracies of RTTOV for the simulated brightness temperatures of these channels around the vertical integral of cloud liquid water of 0.18 mm. Therefore, the microwave precipitation flag with the vertical integral of cloud liquid water of 0.18 mm developed by Wentz [44] was chosen, which means that the vertical integral of cloud liquid water greater than 0.18 mm was considered as the flag for the rainy sky condition. In addition, the sky condition was considered to be cloudy when the vertical integral of cloud liquid water was greater than 0 mm and up to 0.18 mm.
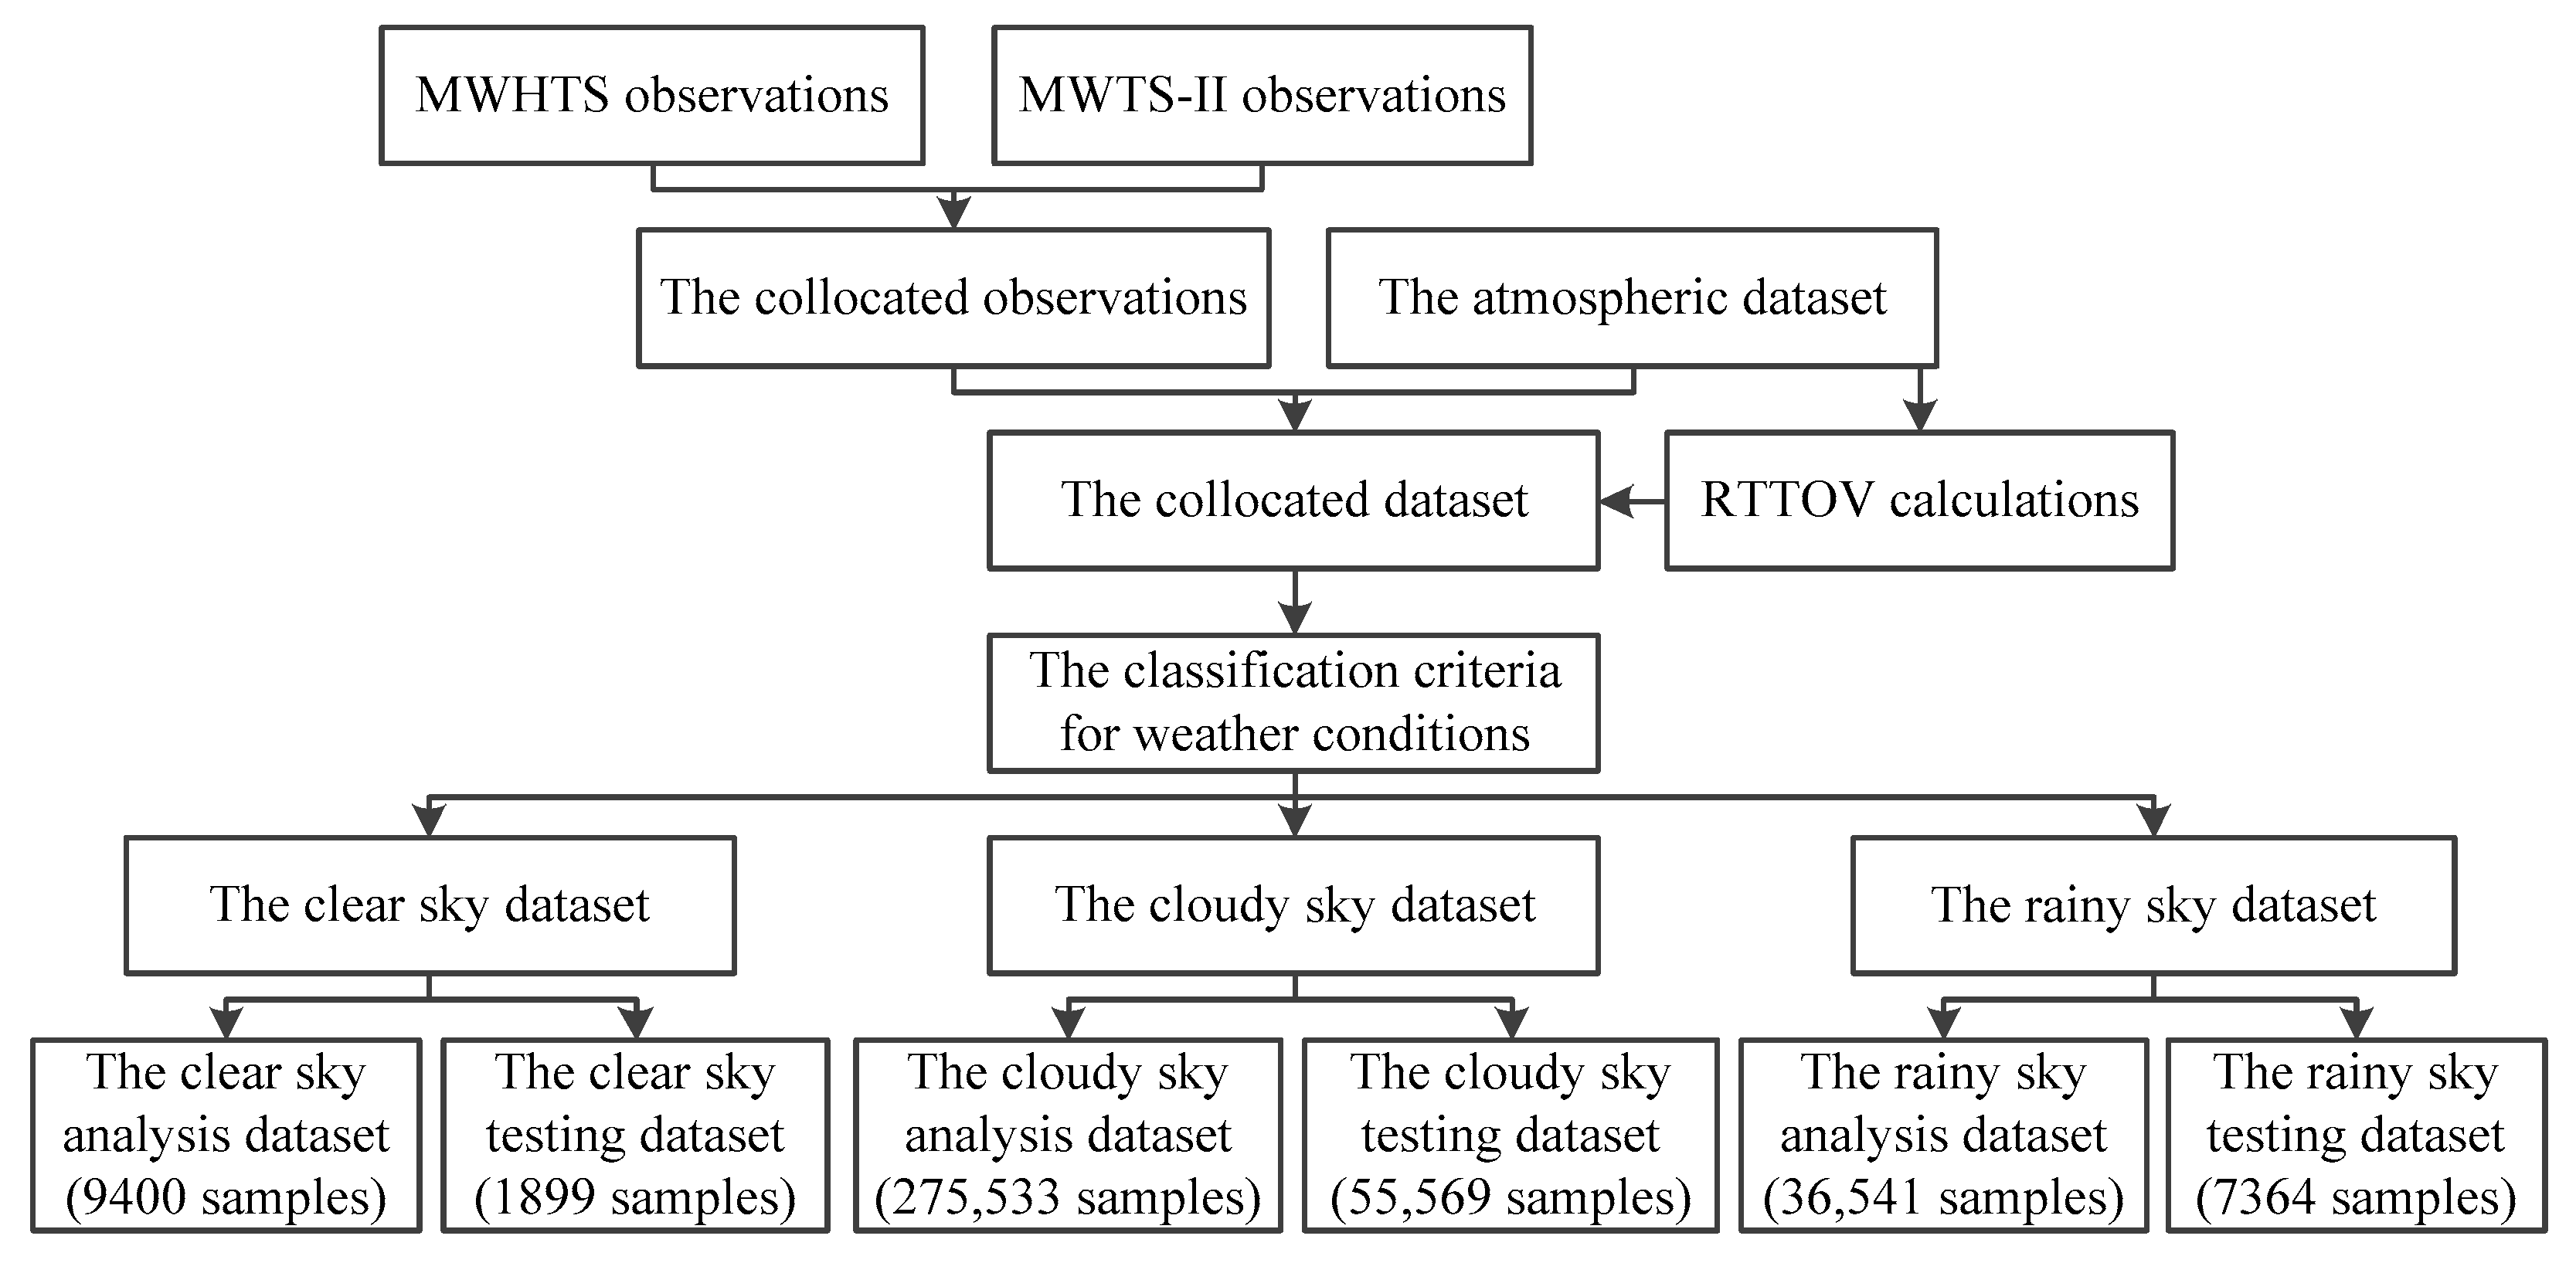
Following the data classification criteria for the clear and rainy sky conditions established above, the collocated dataset established as described in Section 2.3 can be classified into the clear sky dataset, the cloudy sky dataset, and the rainy sky dataset. In this study, since the retrieval experiments of SSP are to be carried out in different weather conditions, the collocated samples from 1 September 2018 to 30 June 2019 in the clear sky dataset were selected to form the clear sky analysis dataset with 9400 collocated samples, and the remaining 1899 collocated samples in the clear sky dataset from 1 July 2019 to 31 August 2019 were set as the clear sky testing dataset. The same data grouping operation was performed on the cloudy sky dataset and the rainy sky dataset. The cloudy sky analysis dataset with 275,533 collocated samples, the cloudy sky testing dataset with 55,569 collocated samples, the rainy sky analysis dataset with 36,514 collocated samples, and the rainy sky testing dataset with 7364 collocated samples were obtained. The overall data preprocessing procedures are summarized in Figure 3.
3. Theory Analysis of the Satellite-Based Passive Microwave Remote Sensing of SSP
The radiation of the Earth–Atmosphere system detected by the satellite-based microwave radiometer consists of three components, which can be expressed as [34]:
where is the brightness temperature of the satellite-based microwave radiometer; is frequency; is satellite viewing angle; and indicate the upwelling and downwelling radiation of the atmosphere, respectively; is the radiation of the surface expressed as brightness temperature; indicates the reflectivity of the surface; and denotes the atmospheric transmissivity. and can be expressed as follows:
where is the total power absorption coefficient, which indicates the atmospheric absorption due to atmospheric components such as oxygen, water vapor, and cloud liquid water; indicates the distribution of atmospheric temperature at height ; indicates the galactic and cosmic radiation; and is the zenith optical thickness, which can be expressed as:
Then, the one-way transmissivity between the surface and the top of the atmosphere along the direction of the satellite viewing angle can be expressed as:
When the height is replaced by the pressure , the brightness temperature of the satellite-based microwave radiometer in (1) can be further simplified as:
where is the surface pressure, is the surface temperature, represents the atmospheric temperature at the pressure level , and is the surface emissivity. It can be observed from (6) that affects the satellite brightness temperature by participating in the calculation of the surface transmissivity . Additionally, is an endpoint of the detection path of the satellite-based microwave radiometer sounding the atmosphere and is involved in the integral calculation of the radiative transfer equation as an upper limit. However, it should be noted that, when the surface transmissivity for a specific channel is zero, the brightness temperature of this channel does not contain the information on SSP.
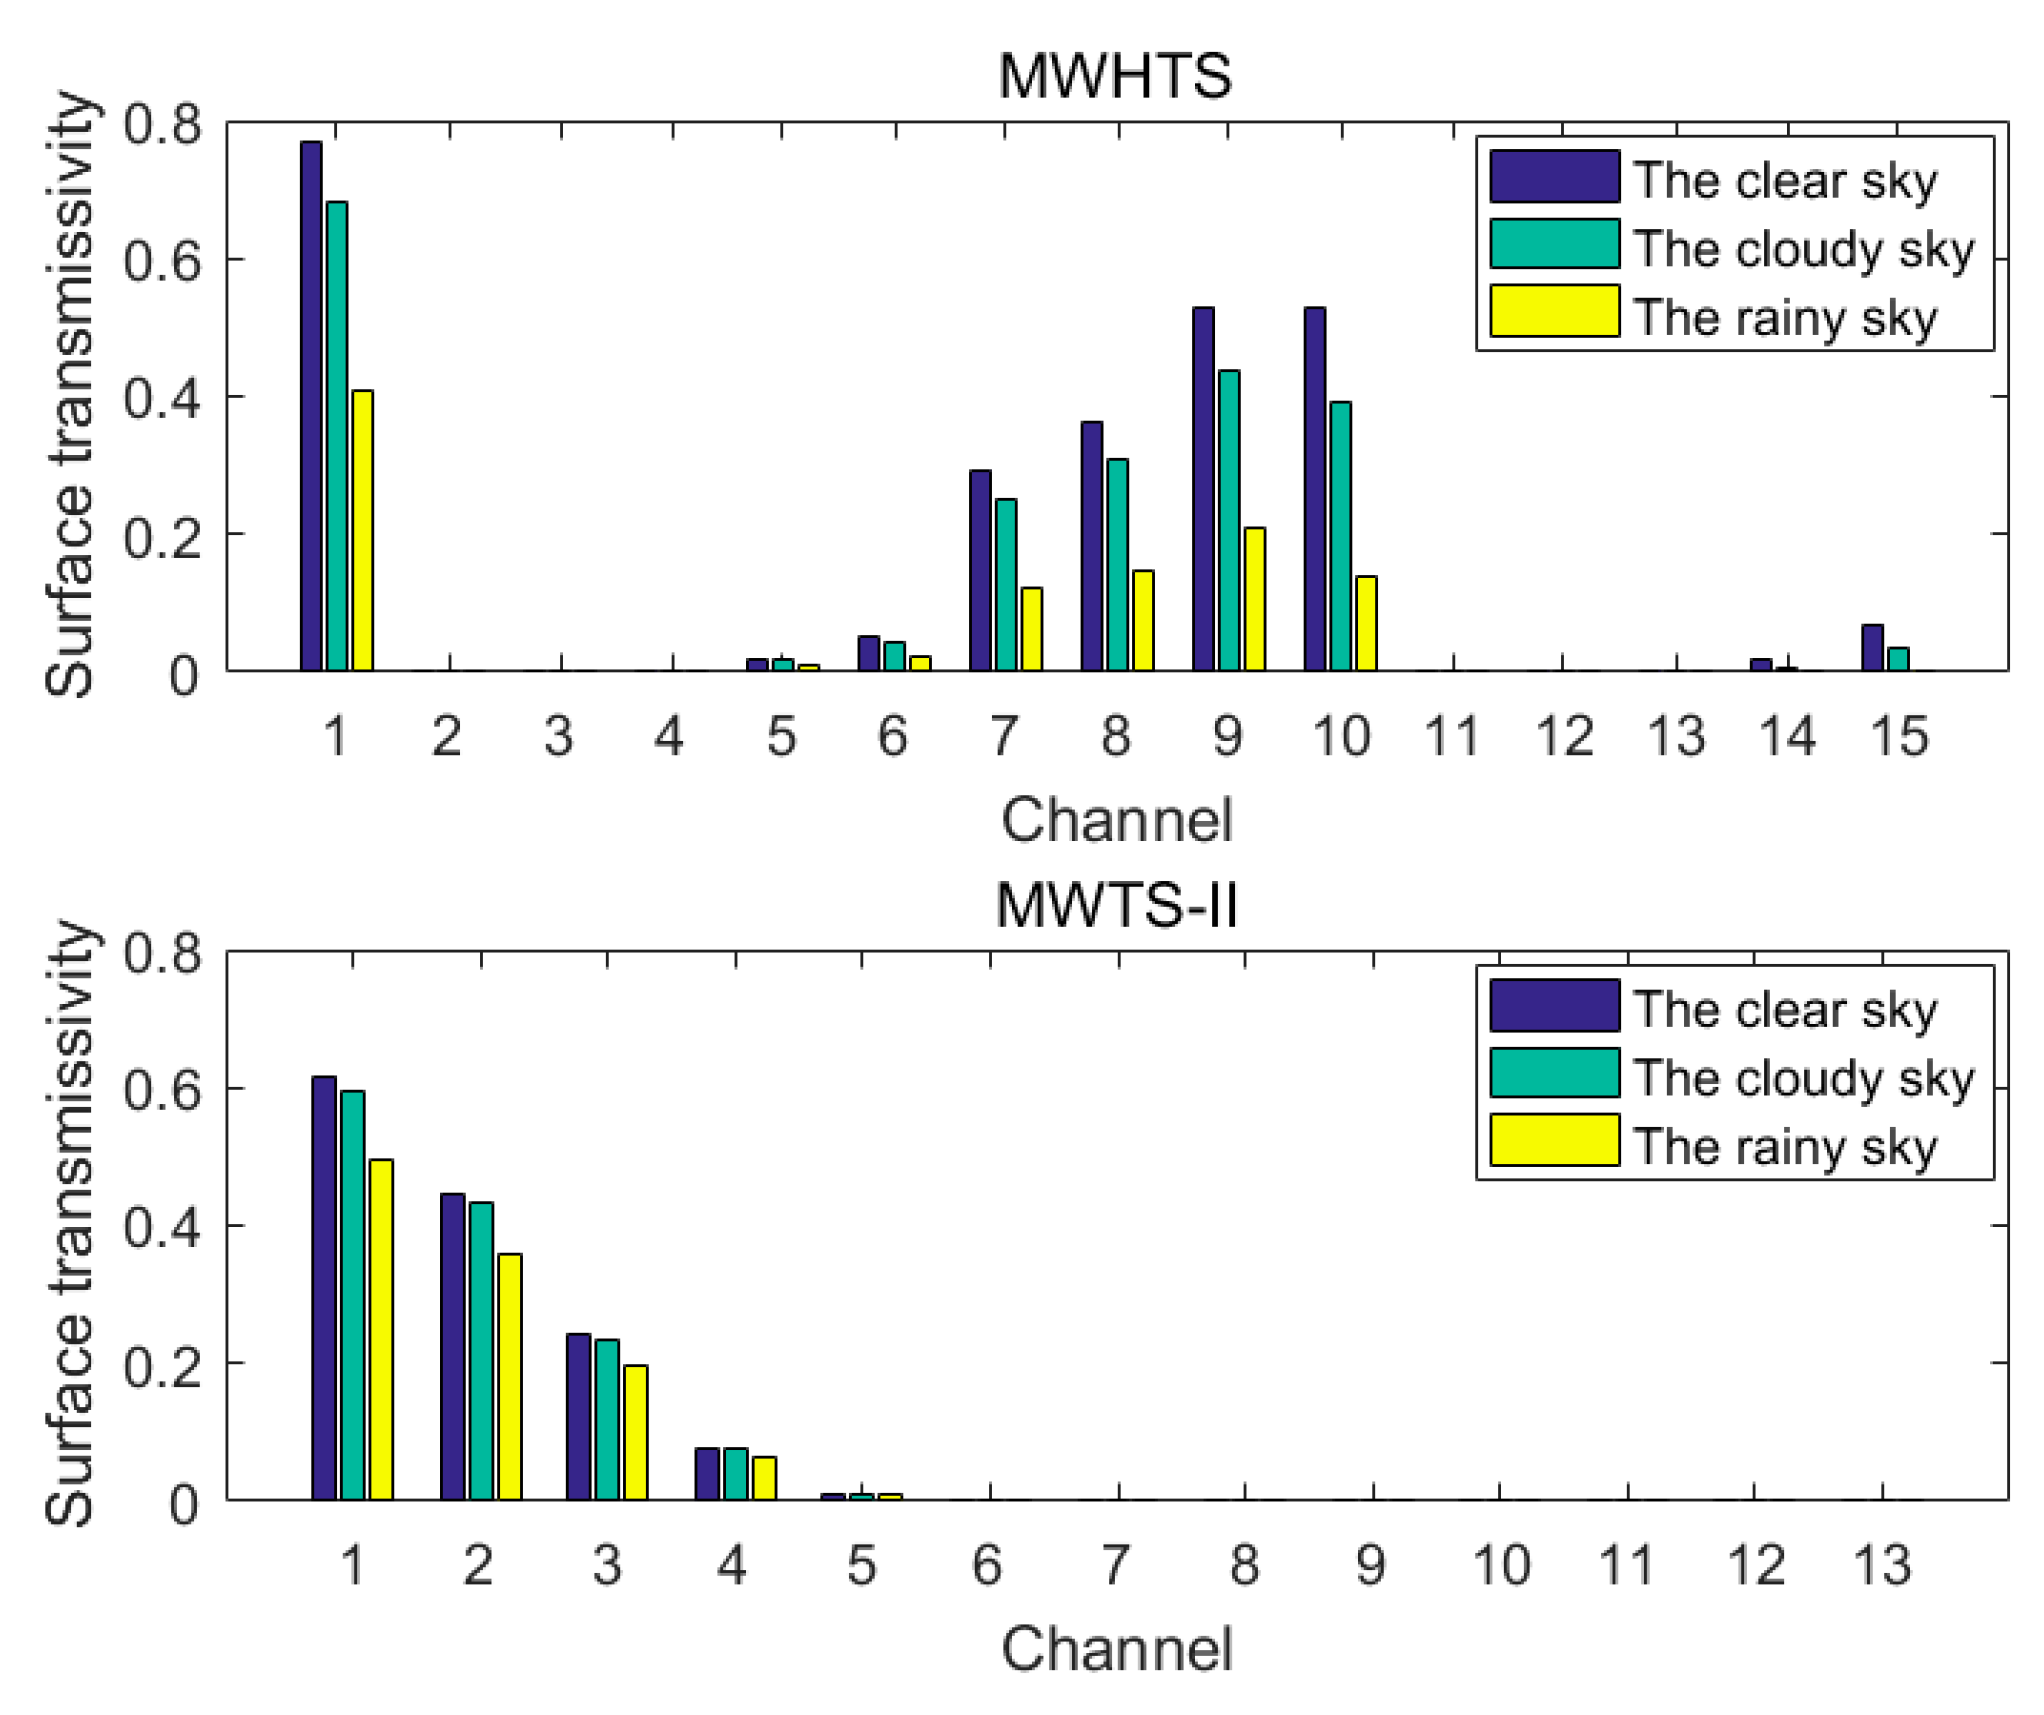
The atmospheric parameters from the clear sky analysis dataset, the cloudy sky analysis dataset, and the rainy sky analysis dataset were input to RTTOV to calculate the average transmissivity for each channel of MWHTS and MWTS-II in clear cloudy and rainy sky conditions, respectively, and the results are shown in Figure 4.
From Figure 4, it can be found that the surface transmissivity for MWHTS channels 1, 5–10 is not zero in all three weather conditions, while the surface transmissivity of MWHTS channels 14 and 15 is not zero in clear and cloudy conditions, but zero in rainy conditions. Therefore, the observations of MWHTS channel 1, channels 5–10, and channels 14–15 are likely to contain the information about SSP and can be used to retrieve SSP. The surface transmissivity for MWTS-II channels 1–5 is not zero in all three weather conditions, thus MWTS-II channels 1–5 can be used for measuring SSP. For the channels of MWHTS and MWTS-II with non-zero surface transmissivity, the surface transmissivity in the clear sky condition is higher than that in the cloudy and rainy sky conditions, and the surface transmissivity in the rainy sky condition is the lowest. Since SSP is involved in the calculation of the surface transmissivity, SSP can influence the satellite brightness temperatures by affecting the surface transmissivity. In addition, the differences in surface transmissivity in different weather conditions result in different detection performance of the channel for SSP.
However, according to the WF analysis of MWHTS and MWTS-II in Figure 1, the large overlap of the WFs leads to the correlation between the observations of the channels. The correlation coefficients between the observations of channels with zero surface transmissivity and with non-zero surface transmissivity for MWHTS and MWTS-II were calculated based on the clear sky analysis dataset, the cloudy analysis dataset, and the rainy analysis dataset, respectively. The calculation results for different weather conditions are shown in Figure 5.
From Figure 5a, it can be seen that MWHTS channels 2–4, which mainly detect the temperature of the upper atmosphere, are all correlated with MWHTS channels with non-zero surface transmissivity. Channel 2 has the highest correlation with channel 1 in the clear sky condition, with a correlation coefficient of 0.36. Channels 3 and 4 have the highest correlation with channel 15 in the clear sky condition, with correlation coefficients of 0.46, and 0.50, respectively. In addition, channels 3 and 4 have certain correlations with channels 7–10 and channel 15 in the cloudy sky condition. MWHTS humidity sounding channels 11–14 have a strong correlation with channel 15 in all three weather conditions, and the highest correlation is found in the rainy sky condition, with correlation coefficients of 0.64, 0.79, 0.91, and 0.97, respectively. In addition, the correlations of humidity sounding channels 11–14 with 118 GHz channels 5–9 in the rainy sky condition are higher than those in the clear and cloudy sky conditions. This also indicates the effect of precipitation on the sensing of 118 GHz channels.
For MWTS-II, it can be seen from Figure 5b that channel 6 has the highest correlation with channel 5 in all three weather conditions, with a correlation coefficient of about 0.92. Channel 7 has the highest correlation with channel 2 in the clear sky condition, with a correlation coefficient of 0.69. Channel 8 has the highest correlation with channel 3 in the cloudy sky condition, with a correlation coefficient of 0.53. Channel 9 has the highest correlation with channel 4 in the cloudy sky condition, with a correlation coefficient of 0.29. Channels 10–12 have the highest correlation with channel 2 in the clear sky condition, with correlation coefficients of about 0.45, 0.52, and 0.48, respectively. Channel 13 has the highest correlation with channel 3 in the cloudy sky condition, with a correlation coefficient of 0.53. The correlation coefficients between channels 10–12 and channel 2 are the highest in the clear sky condition, with correlation coefficients of about 0.45, 0.52, and 0.48, respectively. Channel 13 has the highest correlation coefficient with channel 3 in the clear sky condition, with a correlation coefficient of 0.40.
Although the channels with zero surface transmissivity do not affect the microwave observations according to Equation (6), there is a correlation between these channels and the channels with non-zero surface transmissivity. The factors that may contribute to this correlation are related to a variety of atmospheric parameters, such as atmospheric temperature, humidity, cloud parameters, and surface parameters. However, in the natural climate, there are natural linkages between temperature, humidity, and pressure in the atmosphere [45]. Based on the correlation analysis between channels with non-zero surface transmissivity and channels with zero surface transmissivity in this study, and in order to make full use of the SSP information in the observations, all channels of MWHTS and MWTS-II can be used for the SSP retrieval.
4. Retrieval Algorithm and Experimental Design
4.1. The Deep-Neural-Network-Based Retrieval Algorithm for SSP
The retrieval algorithms of atmospheric parameters based on passive microwave observations can be divided into two categories: statistical retrieval algorithms and physical retrieval algorithms. The physical retrieval algorithm is essentially inversing the radiative transfer equation, and the optimization of the physical retrieval algorithm is an important way to improve the retrieval accuracy [33]. However, the statistical retrieval algorithm does not involve any physical concept, and it performs the retrieval of atmospheric parameters by building a statistical model between passive microwave observations and atmospheric parameters [46,47]. Usually, the statistical retrieval algorithm can obtain the retrieval accuracy comparable to that of the physical retrieval algorithm, and has the advantages of short computational time and low computational effort. Therefore, the statistical retrieval algorithm also has an important position in microwave remote sensing of the atmosphere [46,47,48,49]. The neural network retrieval algorithm is a typical statistical retrieval algorithm that learns the data characteristics of microwave observations and atmospheric parameters from historical data to build the retrieval model for the atmospheric parameters. When new microwave observations are input into the established retrieval model, the predictions of the atmospheric parameters corresponding to the new microwave observations can be obtained [46]. Currently, compared with the shallow neural network, the Deep Neural Network (DNN) has better performance in retrieving atmospheric parameters using passive microwave observations, because of its more powerful learning ability and nonlinear mapping capability [47].
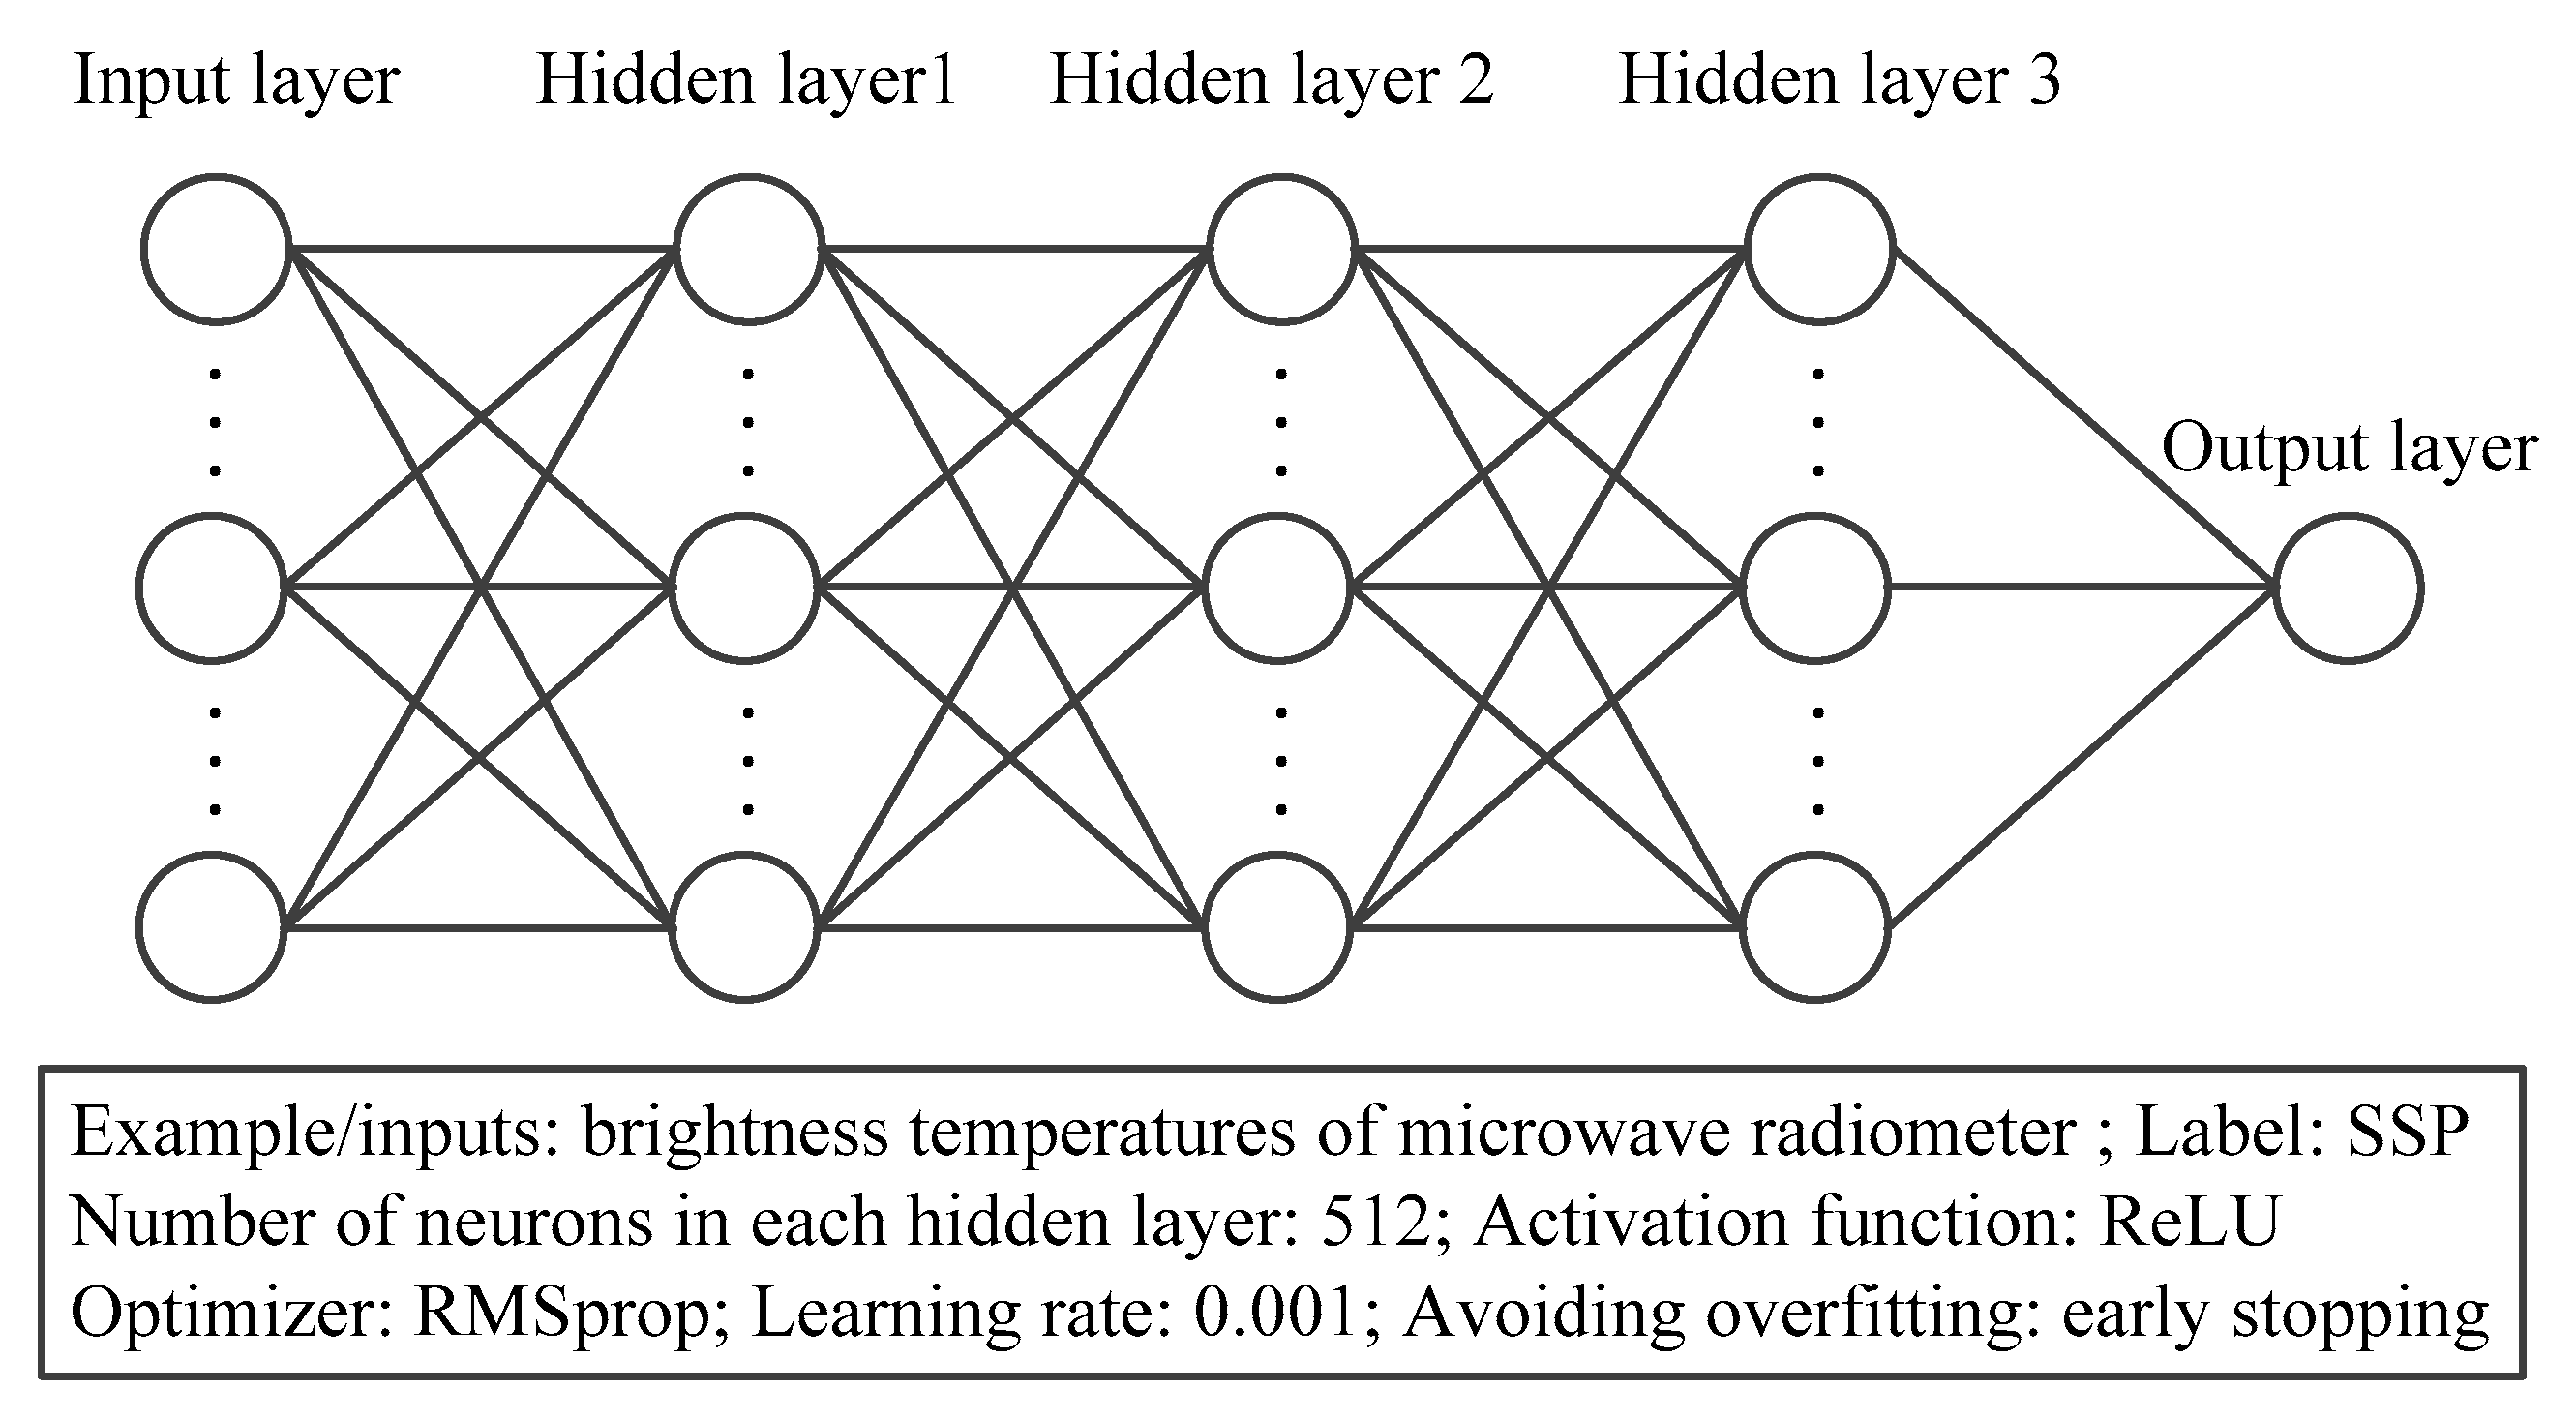
In this study, DNN was selected as the SSP retrieval algorithm to carry out the retrieval experiments of SSP for comparing the retrieval accuracy of SSP. The DNN-based retrieval algorithm for SSP was constructed as follows. First, a five-layer NN structure including one input layer, one output layer, and three hidden layers was constructed. The input layer was used to input the brightness temperatures of microwave channels, and the number of neurons in the input layer was equal to the number of microwave radiometer channels. The output layer was used to output SSP, and the number of neurons in the output layer was 1. The hidden layers describe the nonlinear relationship between the brightness temperatures and SSP by performing nonlinear calculations, and the number of neurons in each hidden layer was set to 512. Then, in the process of building the DNN-based retrieval algorithm for SSP, the parameters of DNN were set for the purpose of optimally predicting SSP. In the training of DNN, RMSprop was chosen as the optimizer, which is an adaptive learning rate algorithm for gradient-based optimization, and the learning rate was set to be 0.001. The Rectified Linear Unit (ReLU) was used as the activation function in the hidden layers, because compared with Leaky ReLU and sigmoid, a DNN with ReLU can obtain the highest prediction accuracies in the SSP retrieval experiments. Moreover, ReLU can overcome the problems of saturation and vanishing gradients [47,50]. Finally, a sufficiently large number of training epochs (i.e., the times that all samples in the training dataset complete the training of DNN) was specified to avoid an underfit model in the training of DNN, which was set to be 2000. In addition, early stopping can terminate training before overfitting occurs, which split the training dataset and uses a subset (20%) as a validation dataset to monitor the performance of DNN in the training. The training is terminated if the loss on the validation dataset does not change over a given number of epochs, which was set to be 100 in this study. The structure and major configuration of the DNN developed in this study can be summarized in Figure 6.
4.2. Design of Retrieval Experiment
The purpose of this study was to compare the performance of 60 GHz and 118 GHz in retrieving SSP using MWTS-II and MWHTS observations. However, MWTS-II sets 13 channels in the 60 GHz band, while MWHTS sets 8 channels in the 118 GHz band, and the differences in the numbers of channels in these two bands and the differences in the WFs distributions are unfavorable for comparing these two bands. Therefore, based on the WFs distributions of MWTS-II and MWHTS shown in Figure 1, the corresponding channels of MWTS-II and MWHTS were established by finding the channel in MWTS-II with peak WF pressure level, which is similar to the peak WF pressure level of the specific channel of MWHTS. Then, according to the corresponding channels of MWTS-II and MWHTS, the 60 GHz channel combination, including MWTS-II channels 1–3 and channels 5–10, and the 118 GHz channel combination, including MWHTS channels 2–9, were established in this study for comparing the performance of 60 GHz and 118 GHz in retrieving SSP. The correspondences of each channel in the 60 GHz channel combination and 118 GHz channel combination regarding the peak WF pressure level are shown in Table 1.
In order to compare the retrieval accuracies of SSP using the 60 GHz and 118 GHz bands in different weather conditions, and to provide a reference for the channel configuration of future microwave instruments and the application of in-orbit satellite microwave observations in retrieving SSP, three retrieval experiments were designed and performed in this study.
Experiment 1: The SSP retrieval experiments using the 60 GHz and 118 GHz observations, separately. In order to compare the retrieval accuracies of SSP using the 60 GHz and 118 GHz bands in different weather conditions, the SSP retrieval experiments were carried out using the observed brightness temperatures of the 60 GHz and 118 GHz channel combinations in clear, cloudy, and rainy sky conditions, respectively. The specific experimental operation, taking the observed brightness temperatures of the 60 GHz channel combination and the 118 GHz channel combination to retrieve SSP in the clear sky condition as an example, was as follows. According to the building of the DNN-based retrieval algorithm for SSP in Section 4.1, firstly, the observed brightness temperatures of the 60 GHz channel combination and 118 GHz channel combination in the clear sky analysis dataset were used as the input of DNN, respectively, and the collocated SSP was used as the output to train DNN. Then, the 60 GHz retrieval model for the clear sky and the 118 GHz retrieval model for the clear sky were built, respectively. The observed brightness temperatures of the 60 GHz channel combination and 118 GHz channel combination in the clear sky testing dataset were input to the 60 GHz retrieval model for the clear sky and the 118 GHz retrieval model for the clear sky, respectively, to obtain the SSP retrievals in the clear sky condition. The SSP retrievals in the cloudy and the rainy sky conditions from the 60 GHz channel combination and the 118 GHz channel combination were obtained by following the same operation.
Experiment 2: Testing the contributions of the sounding channels for the upper atmosphere to the SSP retrieval. In order to test the retrieval accuracies of SSP from MWTS-II channels 11–13 with zero surface transmissivity and with peak WF heights distributed in the upper atmosphere, and then provide a reference for the subsequent development of microwave radiometer, MWTS-II channels 11–13 were added to the 60 GHz channel combination, and then the 60 GHz extended channel combination was established. The operation of the retrieval experiment was as follows: for retrieving SSP in the clear sky condition, the observed brightness temperatures of the 60 GHz extended channel combination in the clear sky analysis dataset were used as the input of DNN, and the corresponding SSP was used as the output to train DNN, and the SSP retrieval model for the clear sky was built. The observed brightness temperatures of the 60 GHz extended channel combination in the clear sky testing dataset were input to the SSP retrieval model for the clear sky to obtain the SSP retrievals in the clear sky condition. Following the same experimental operation, the SSP retrievals in the cloudy and the rainy sky conditions were obtained from the 60 GHz extended channel combination.
Experiment 3: The SSP retrieval experiments using MWTS-II and MWHTS observations, which have been collocated in time and space. In order to compare the retrieval accuracies of SSP from MWHTS and MWTS-II, and then provide a reference for retrieving SSP using in-orbit satellite observations, the SSP retrieval experiments were carried out using the observed brightness temperatures of all 13 channels of MWTS-II and all 15 channels of MWHTS, respectively. The specific experimental operation was the same as that of Experiment 1, while 13 channels of MWTS-II were used instead of the 60 GHz channel combination and 15 channels of MWHTS were used instead of the 118 GHz channel combination in Experiment 1 to build the corresponding SSP retrieval models and retrieve SSP, then the SSP retrievals in clear, cloudy, and rainy sky conditions from MWTS-II and MWHTS were obtained.
5. Experimental Results
This section presents the retrieval results of the experiments designed as described in Section 4.2 in different weather conditions, including the SSP retrieval results from the 60 GHz channel combination and the 118 GHz channel combination, the SSP retrieval results from the 60 GHz extended channel combination, and the SSP retrieval results from MWHTS and MWTS-II. The SSP from ERA-Interim reanalysis in the testing dataset was used as the reference value to evaluate the retrieval results of SSP. In this study, the RMSE, correlation coefficient, and the bias between the reference value and the retrieval value of SSP were used to describe the retrieval results.
5.1. The Comparison of the Retrieval Results of SSP Using the 60 GHz and 118 GHz Observations
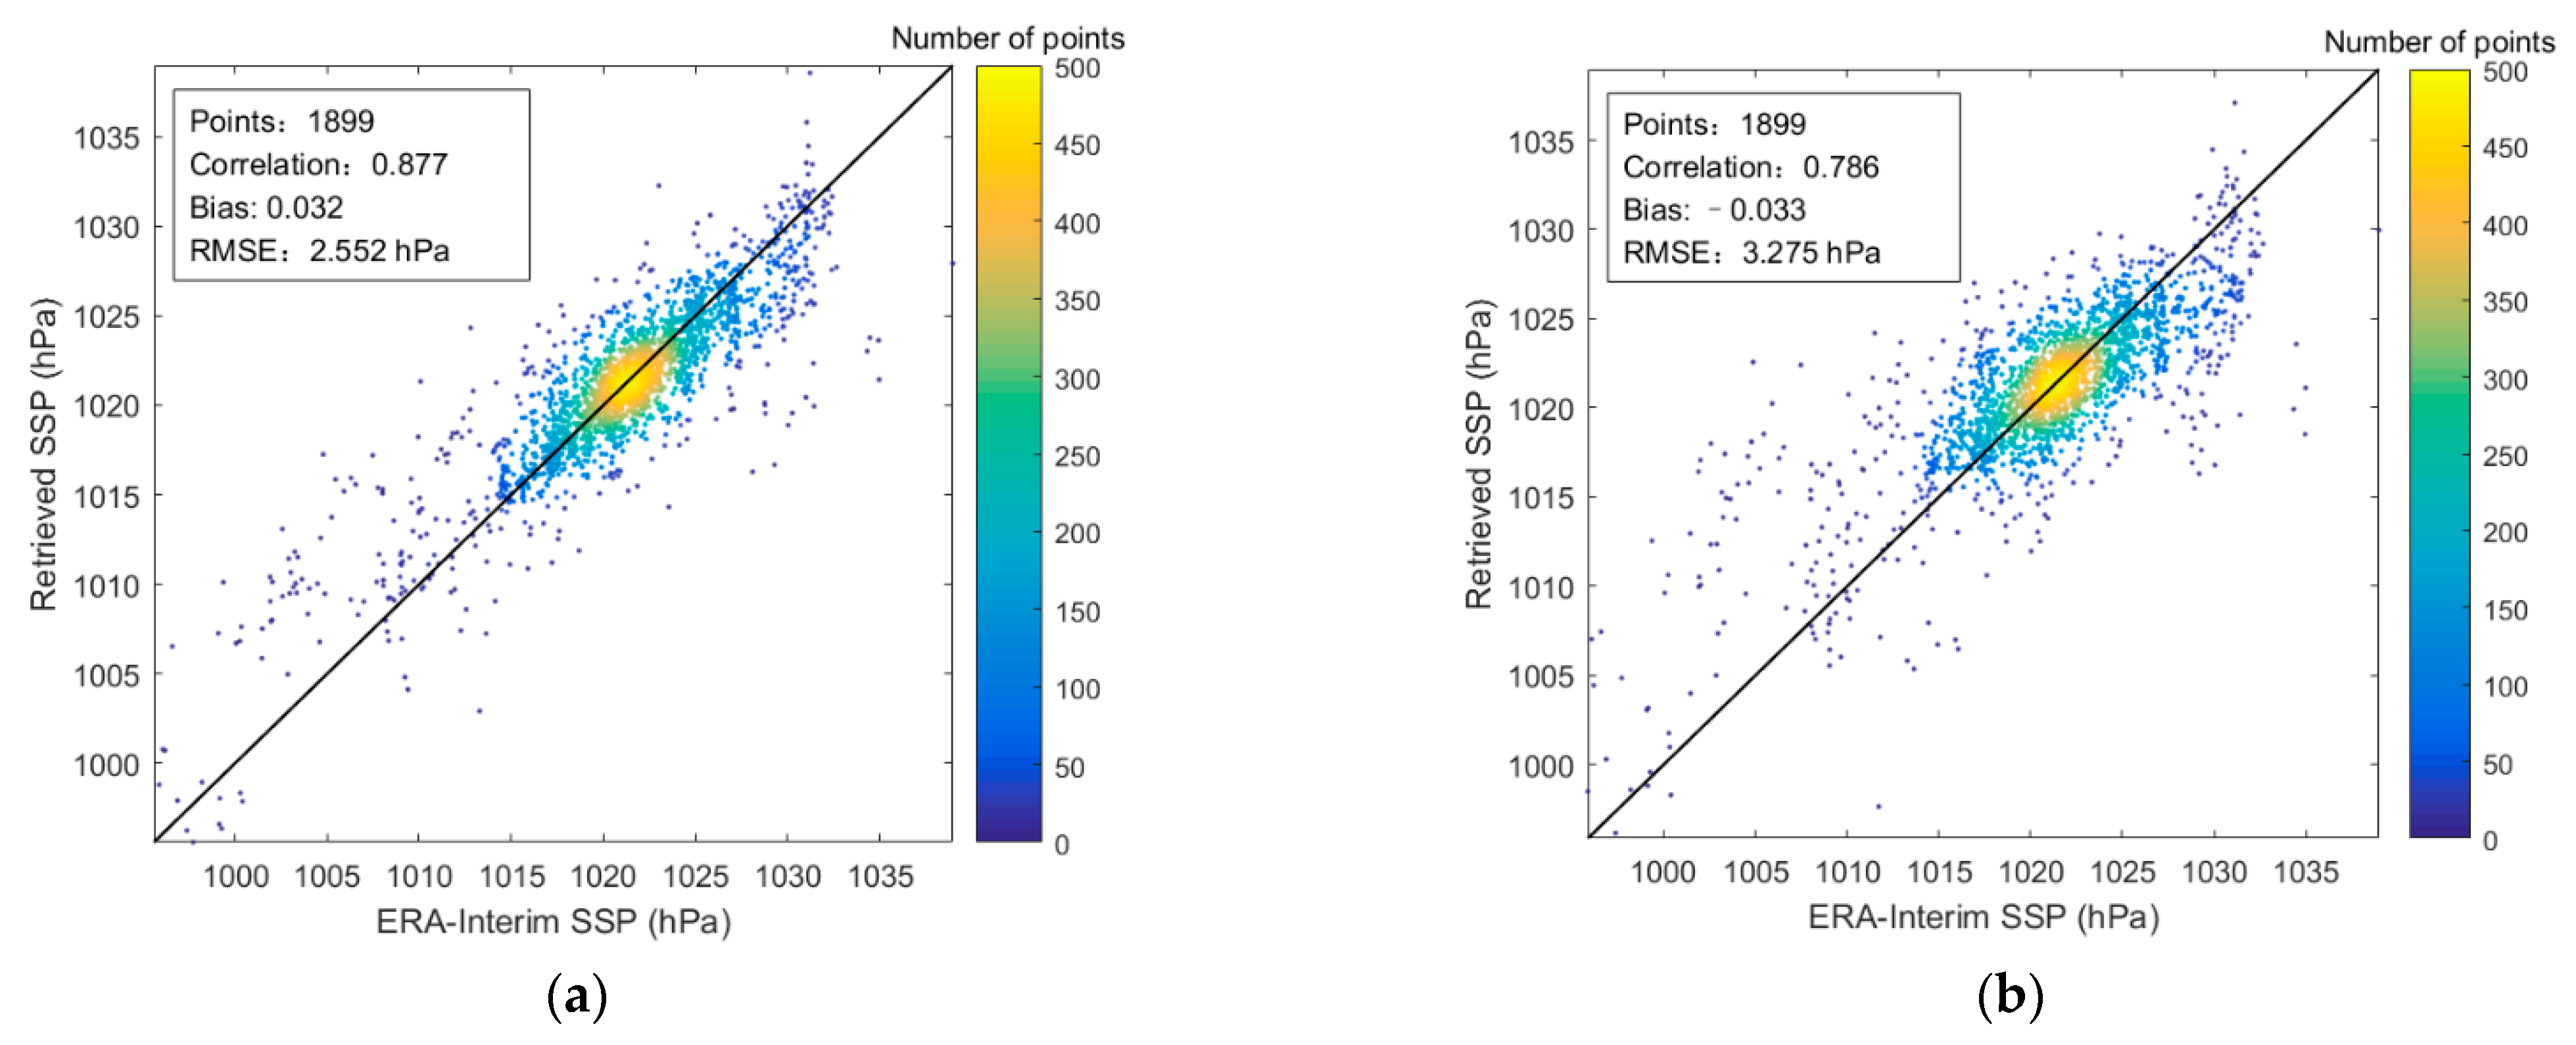
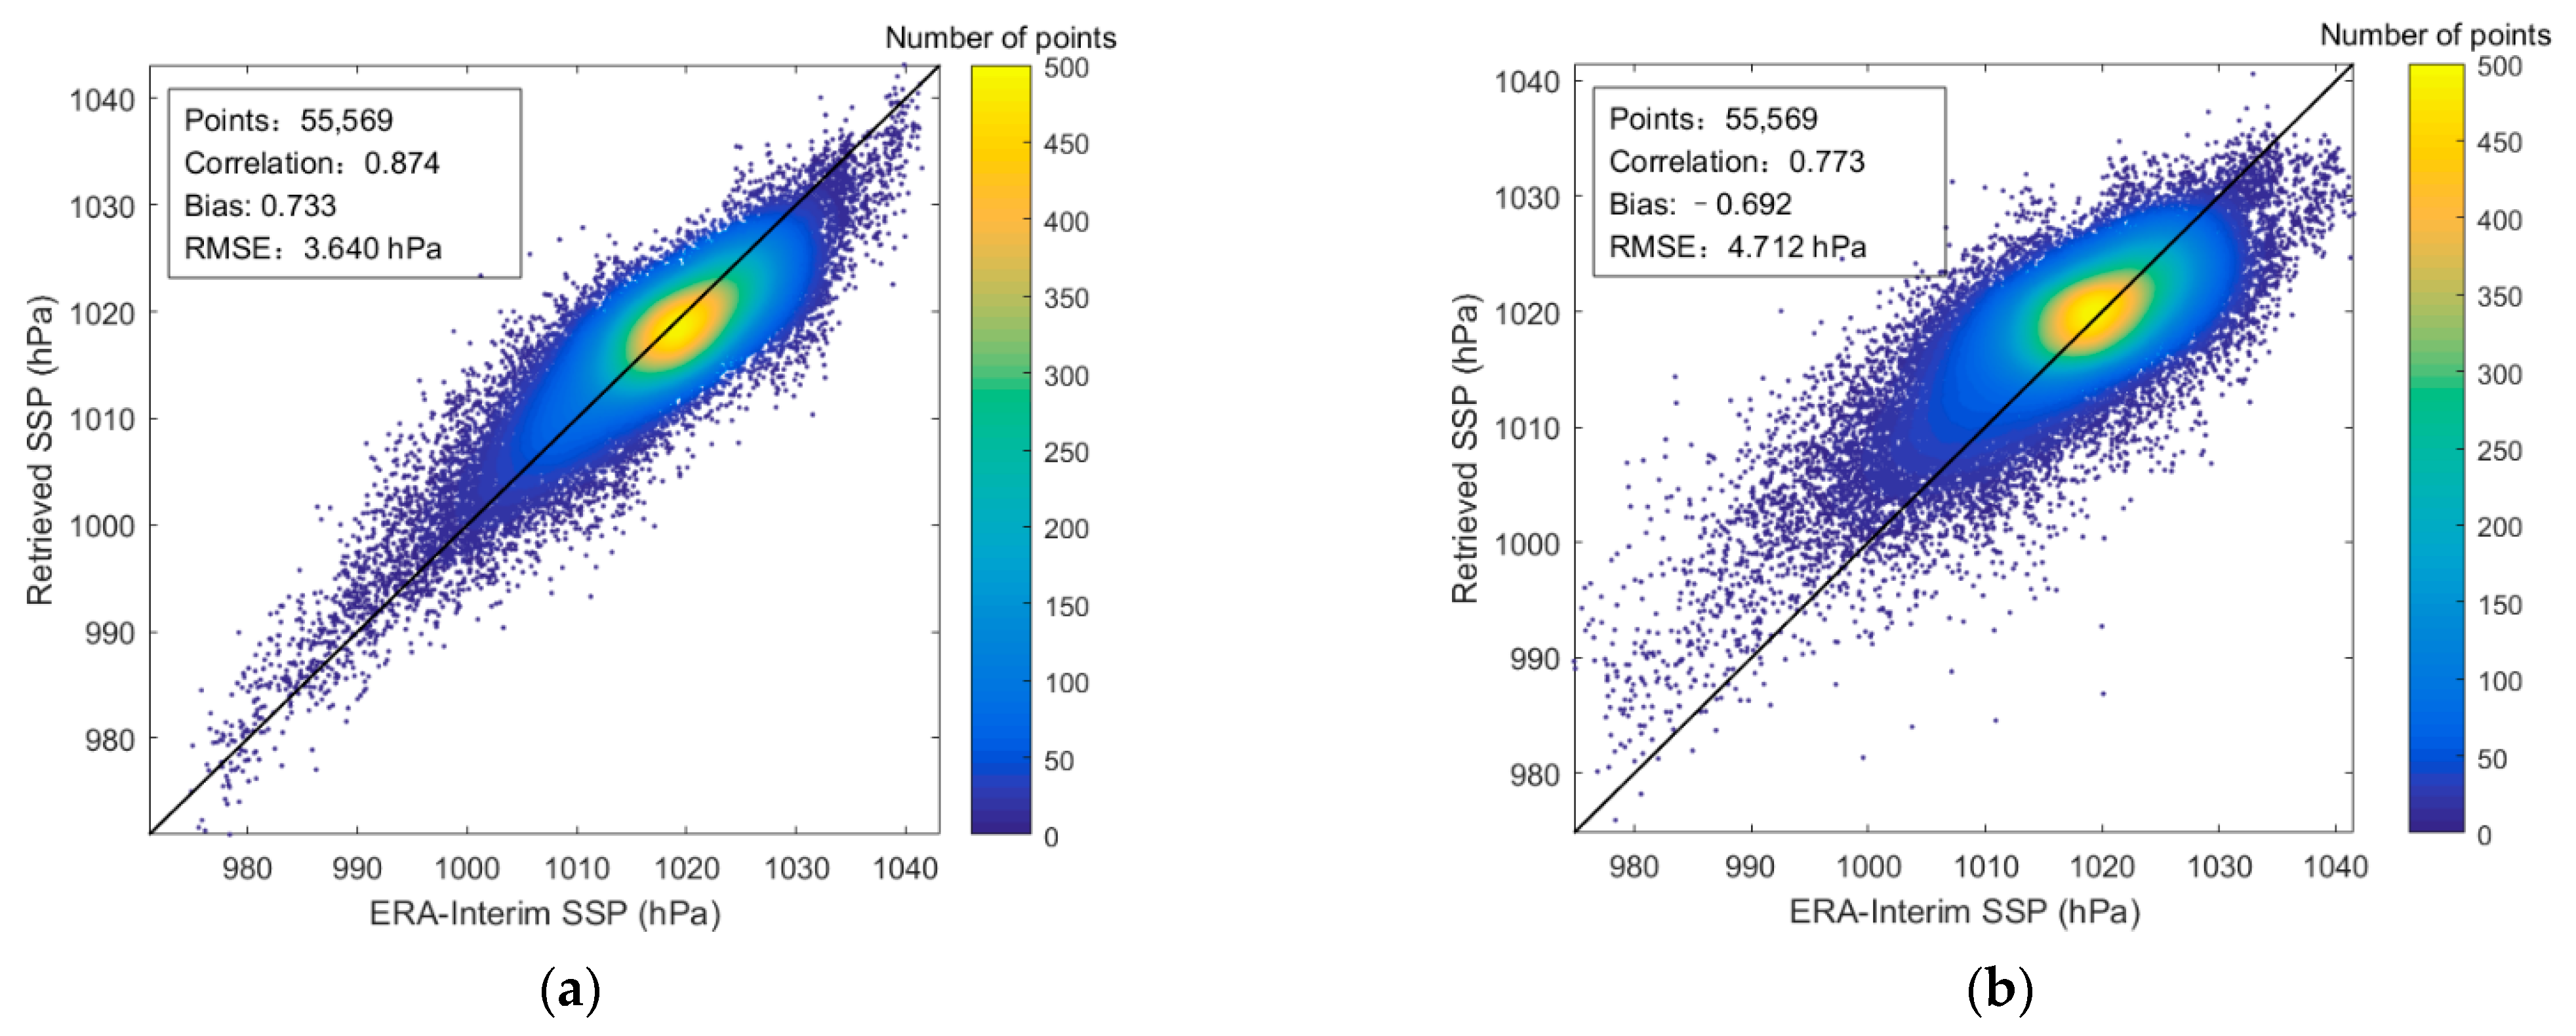
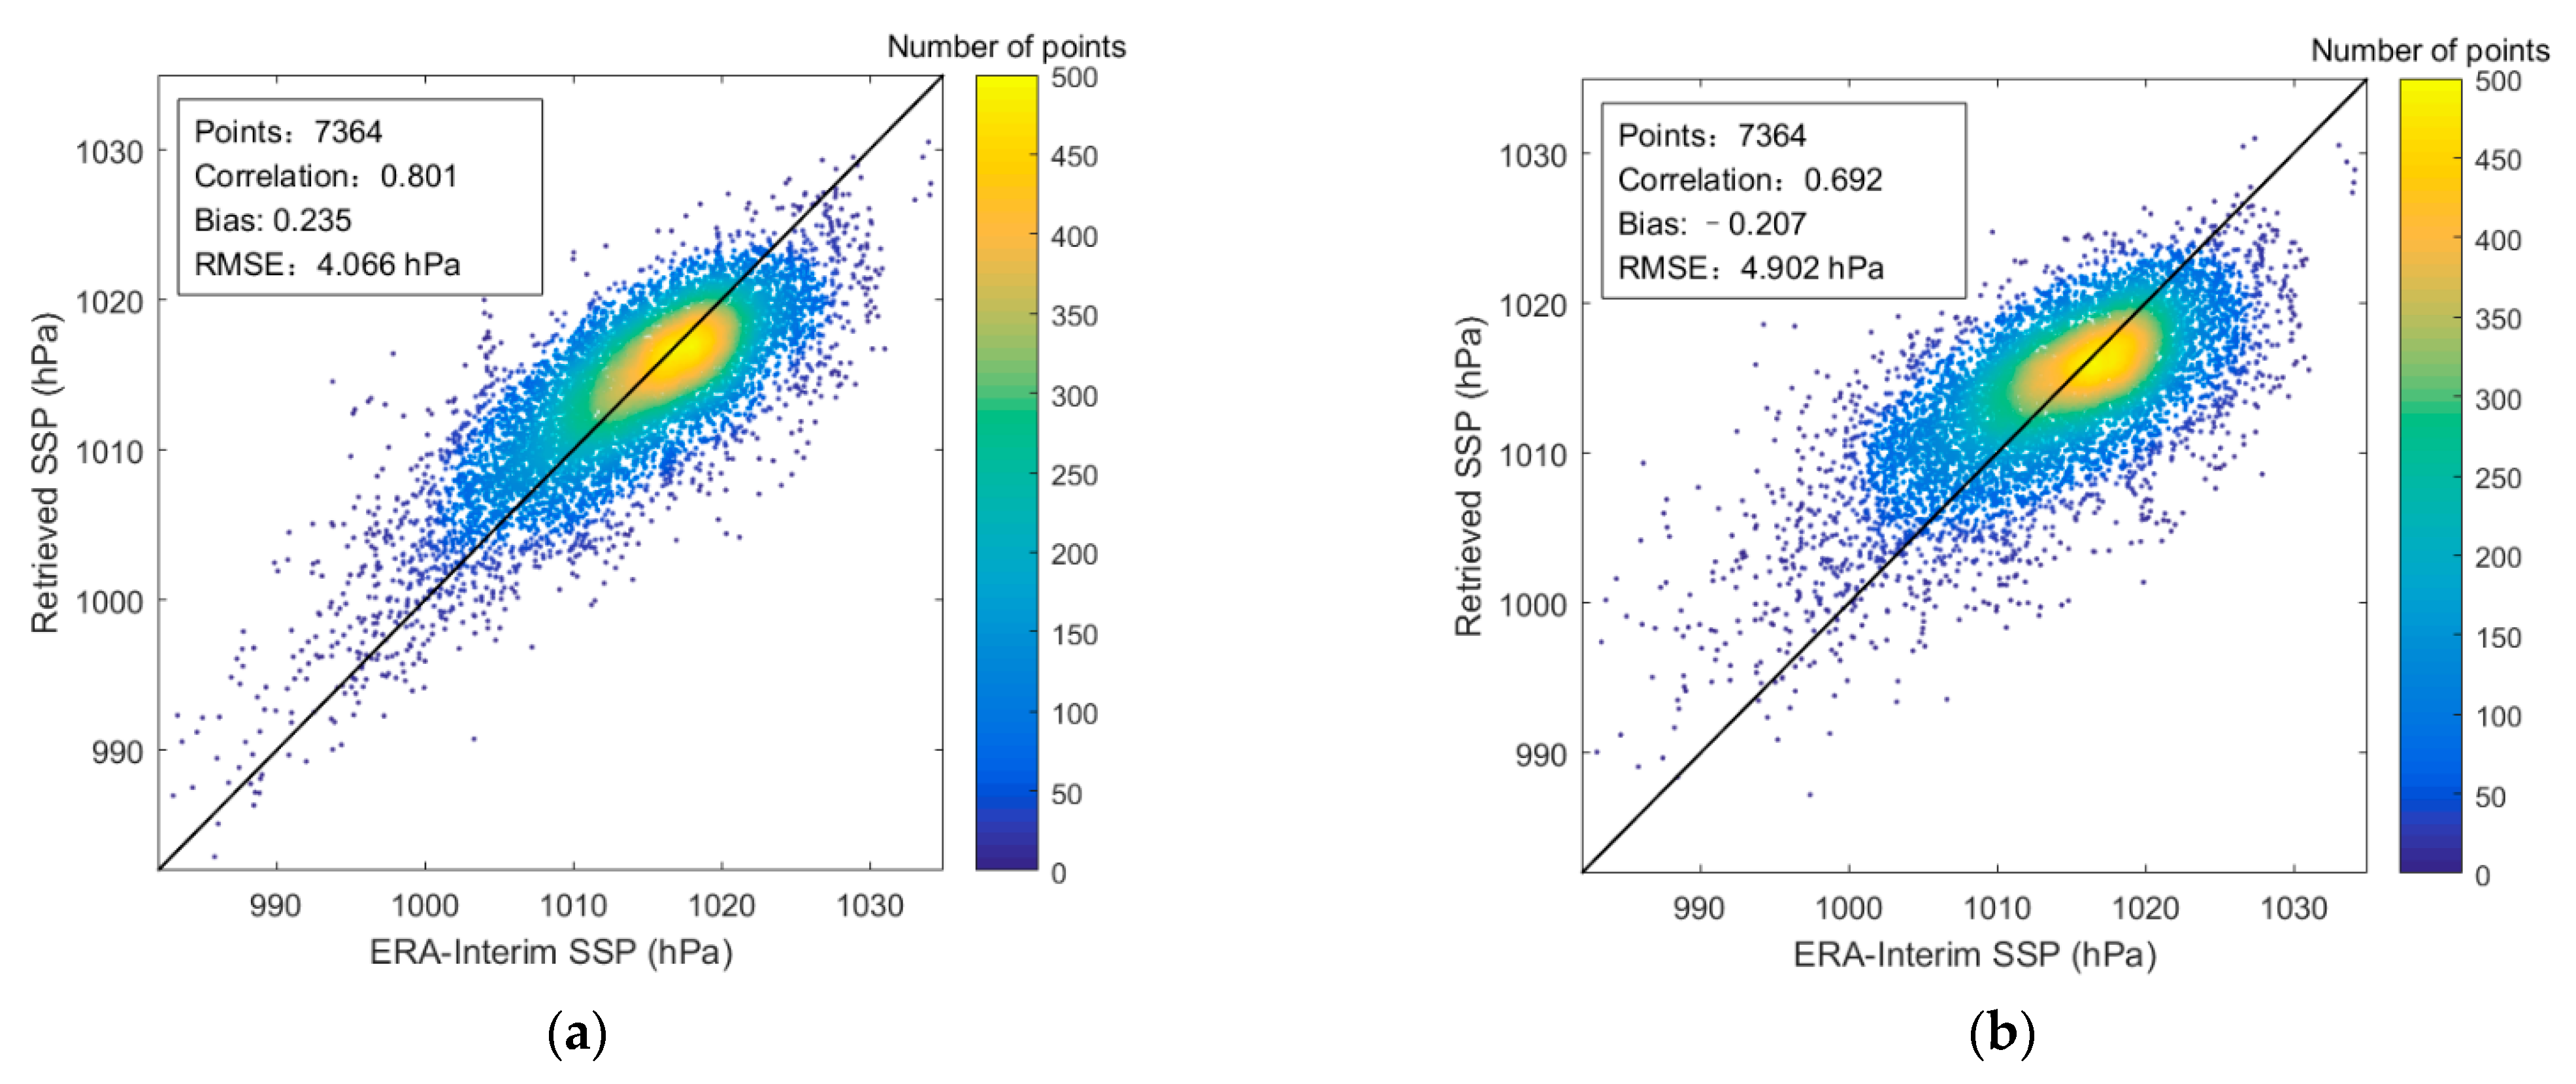
According to the design of the SSP retrieval experiments using the 60 GHz and 118 GHz observations in Section 4.2, 1899 SSP retrievals in the clear sky condition, 55,569 SSP retrievals in the cloudy sky condition, and 7364 SSP retrievals in the rainy sky condition using the observed brightness temperatures of the 60 GHz channel combination and the 118 GHz channel combination can be obtained. The SSP retrieval results from the 60 GHz channel combination and 118 GHz channel combination in the three weather conditions are shown in Figure 7, Figure 8 and Figure 9, respectively, and are also summarized in Table 2.
For the SSP retrieval results in the clear sky condition from the 60 GHz channel combination and the 118 GHz channel combination, it can be seen from Figure 7 that the RMSEs between the retrieval value and the reference value of SSP from the 60 GHz channel combination and the 118 GHz channel combination are 2.552 hPa and 3.275 hPa, respectively. The 60 GHz channel combination can obtain the retrieval accuracy of SSP about 0.7 hPa higher than that of the 118 GHz channel combination in the clear sky condition.
In the cloudy sky condition, it can be seen from Figure 8 that the RMSEs between the retrieval value and the reference value of SSP from the 60 GHz channel combination and the 118 GHz channel combination are 3.640 hPa and 4.712 hPa, respectively. Similar to the retrieval results in the clear sky condition, the retrieval accuracy of the 60 GHz channel combination is higher than that of the 118 GHz channel combination by about 1.1 hPa in the cloudy sky condition.
As can be seen from Figure 9, the RMSEs between the retrieval value and the reference value of SSP from the 60 GHz channel combination and the 118 GHz channel combination in the rainy sky condition are 4.066 hPa and 4.902 hPa, respectively. The 60 GHz channel combination can obtain a higher retrieval accuracy of about 0.8 hPa than that of the 118 GHz channel combination in the rainy sky condition.
By comparing the SSP retrieval results from the 60 GHz channel combination and the 118 GHz channel combination in clear, cloudy, and rainy sky conditions, it is concluded that the retrieval accuracy of SSP using the 60 GHz channel combination is higher in all weather conditions compared with that of the 118 GHz channel combination. In addition, comparing the retrieval results from the 60 GHz channel combination or the 118 GHz channel combination in different weather conditions, it can be found that the more cloud liquid water in the detection path, the worse the SSP retrieval accuracy.
5.2. The SSP Retrieval Results from the 60 GHz Extended Channel Combination
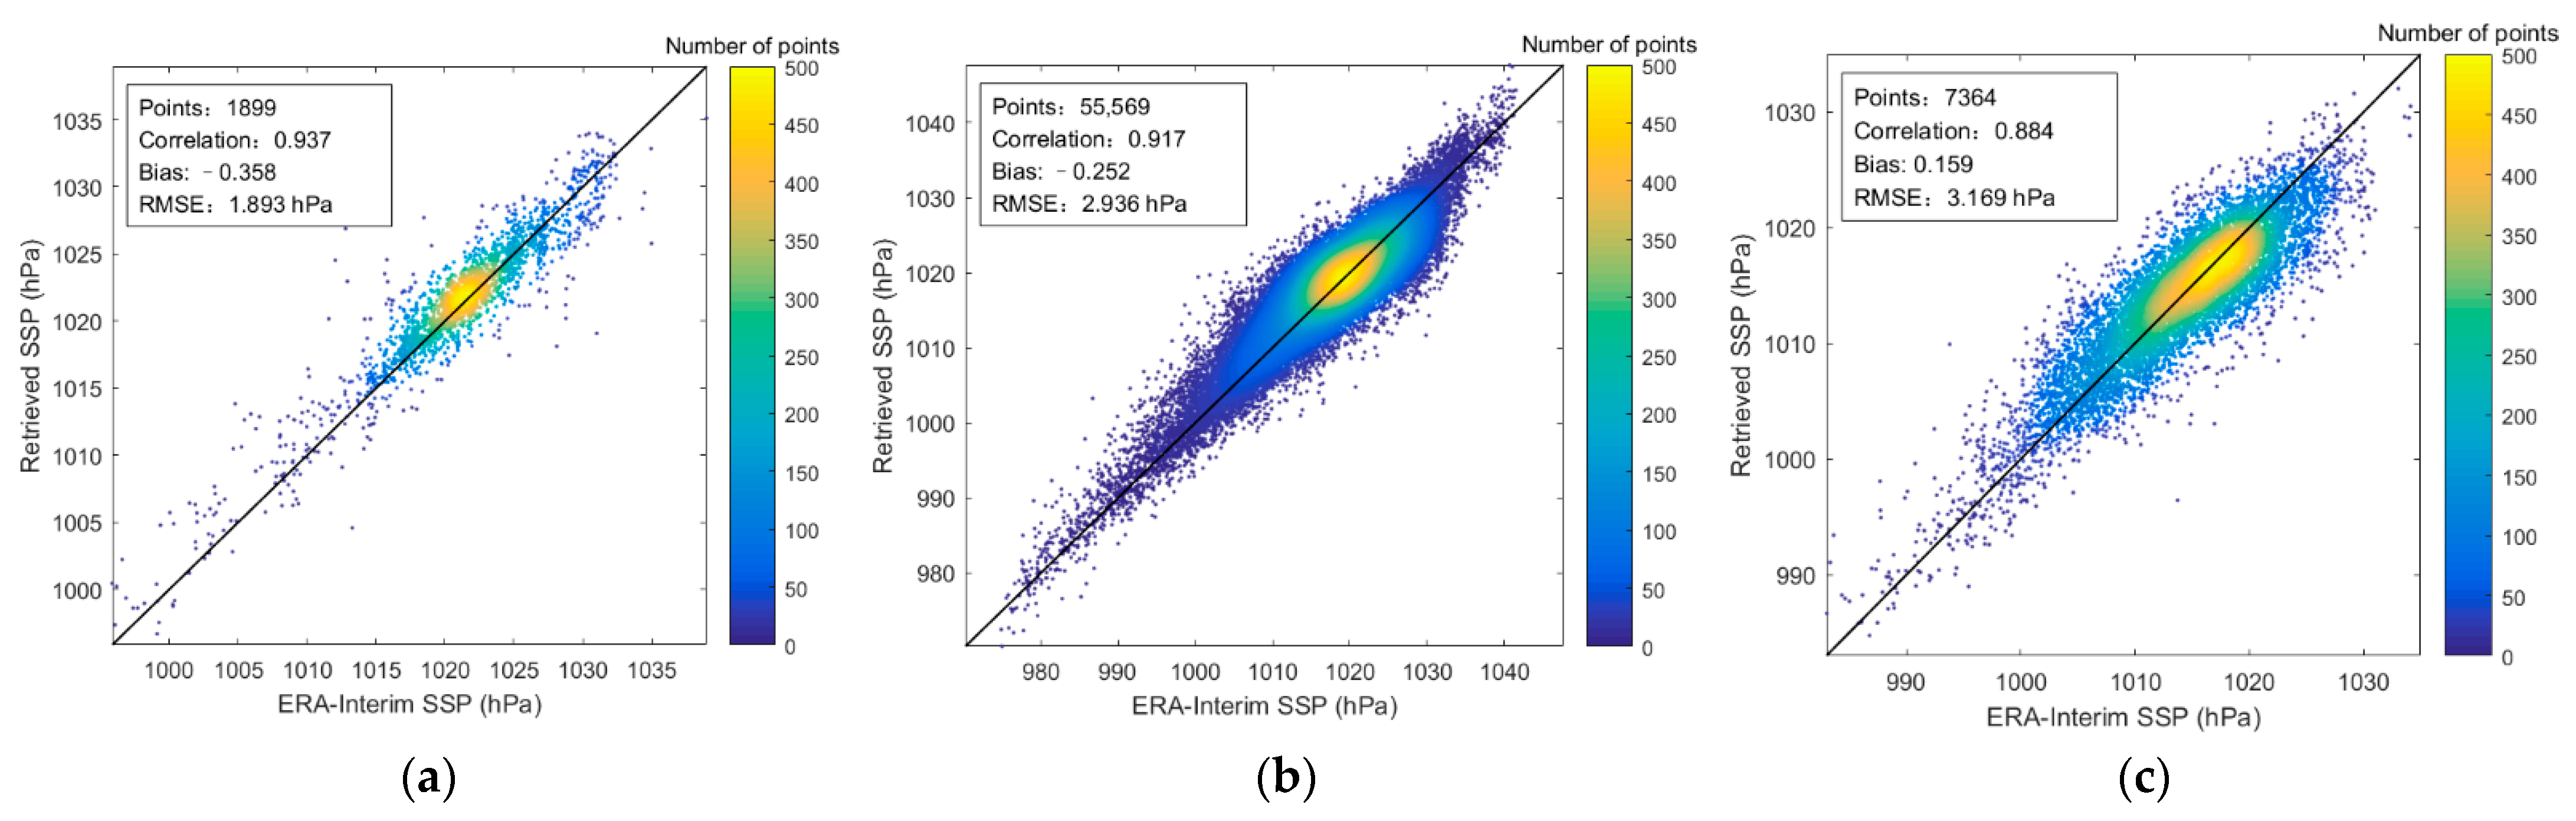
According to the design of the SSP retrieval experiments based on the 60 GHz extended channel combination given in Section 4.2, 1899, 55,569, and 7364 retrievals of SSP were obtained using the observed brightness temperatures of the 60 GHz extended channel combination in clear, cloudy, and rainy sky conditions, respectively, and the retrieval results are shown in Figure 10 and Table 3.
As shown in Figure 10a, the RMSE between the retrieval values and reference values of SSP from the 60 GHz extended channel combination in the clear sky condition is 1.893 hPa. Compared with the retrieval results from the 60 GHz channel combination in the clear sky condition shown in Figure 7a, the retrieval accuracy of SSP from the 60 GHz extended channel combination is improved by about 0.6 hPa. In the cloudy sky condition, the RMSE between the retrieval values and the reference values of SSP from the 60 GHz extended channel combination is 2.936 hPa, as shown in Figure 10b. The retrieval accuracy of SSP is improved by about 0.7 hPa compared with that of the 60 GHz channel combination. It can be seen from Figure 10c that the RMSE between the retrieval values and the reference values of SSP from the 60 GHz extended channel combination in the rainy sky condition is 3.169 hPa. The retrieval accuracy of SSP is improved by about 0.9 hPa compared with that of the 60 GHz channel combination. In addition, by comparing Figure 10b,c, it can be found that the retrieval accuracies of SSP from the 60 GHz extended channel combination in the cloudy and the rainy sky conditions are comparable, which is mainly because that the observations of the added MWTS-II channels 11–13 are almost unaffected by the cloud liquid water.
By comparing the retrieval results of SSP from the 60 GHz extended channel combination and the 60 GHz channel combination, it can be found that the addition of MWTS-II channels 11–13 with peak WF heights distributed in the upper atmosphere has significantly improved the retrieval accuracies of SSP from the 60 GHz channel combination in clear, cloudy, and rainy sky conditions.
5.3. Comparison of the Retrieval Results of SSP from MWTS-II and MWHTS
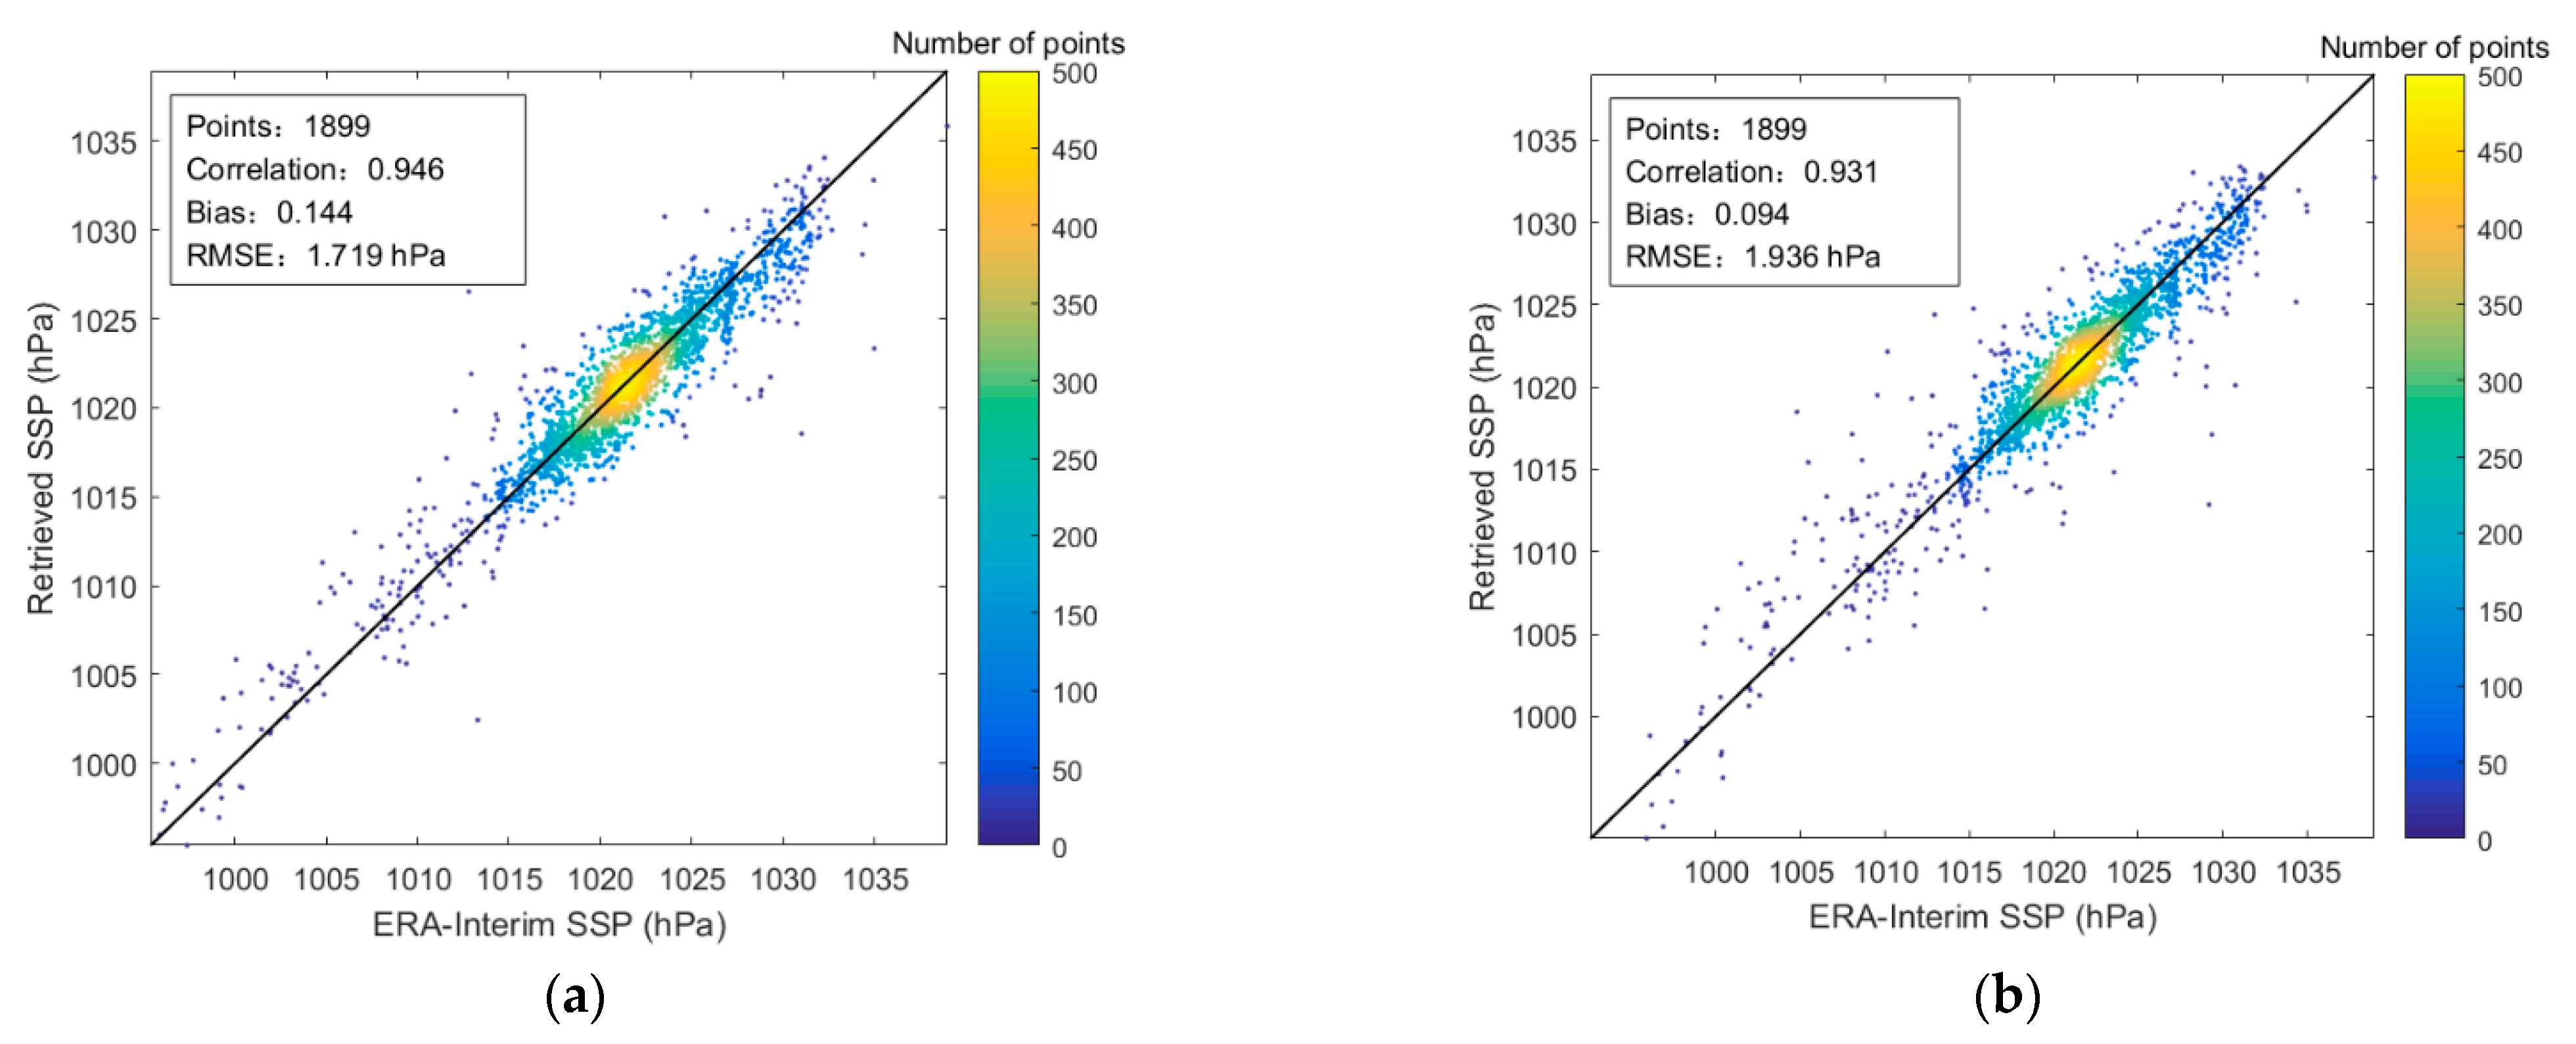
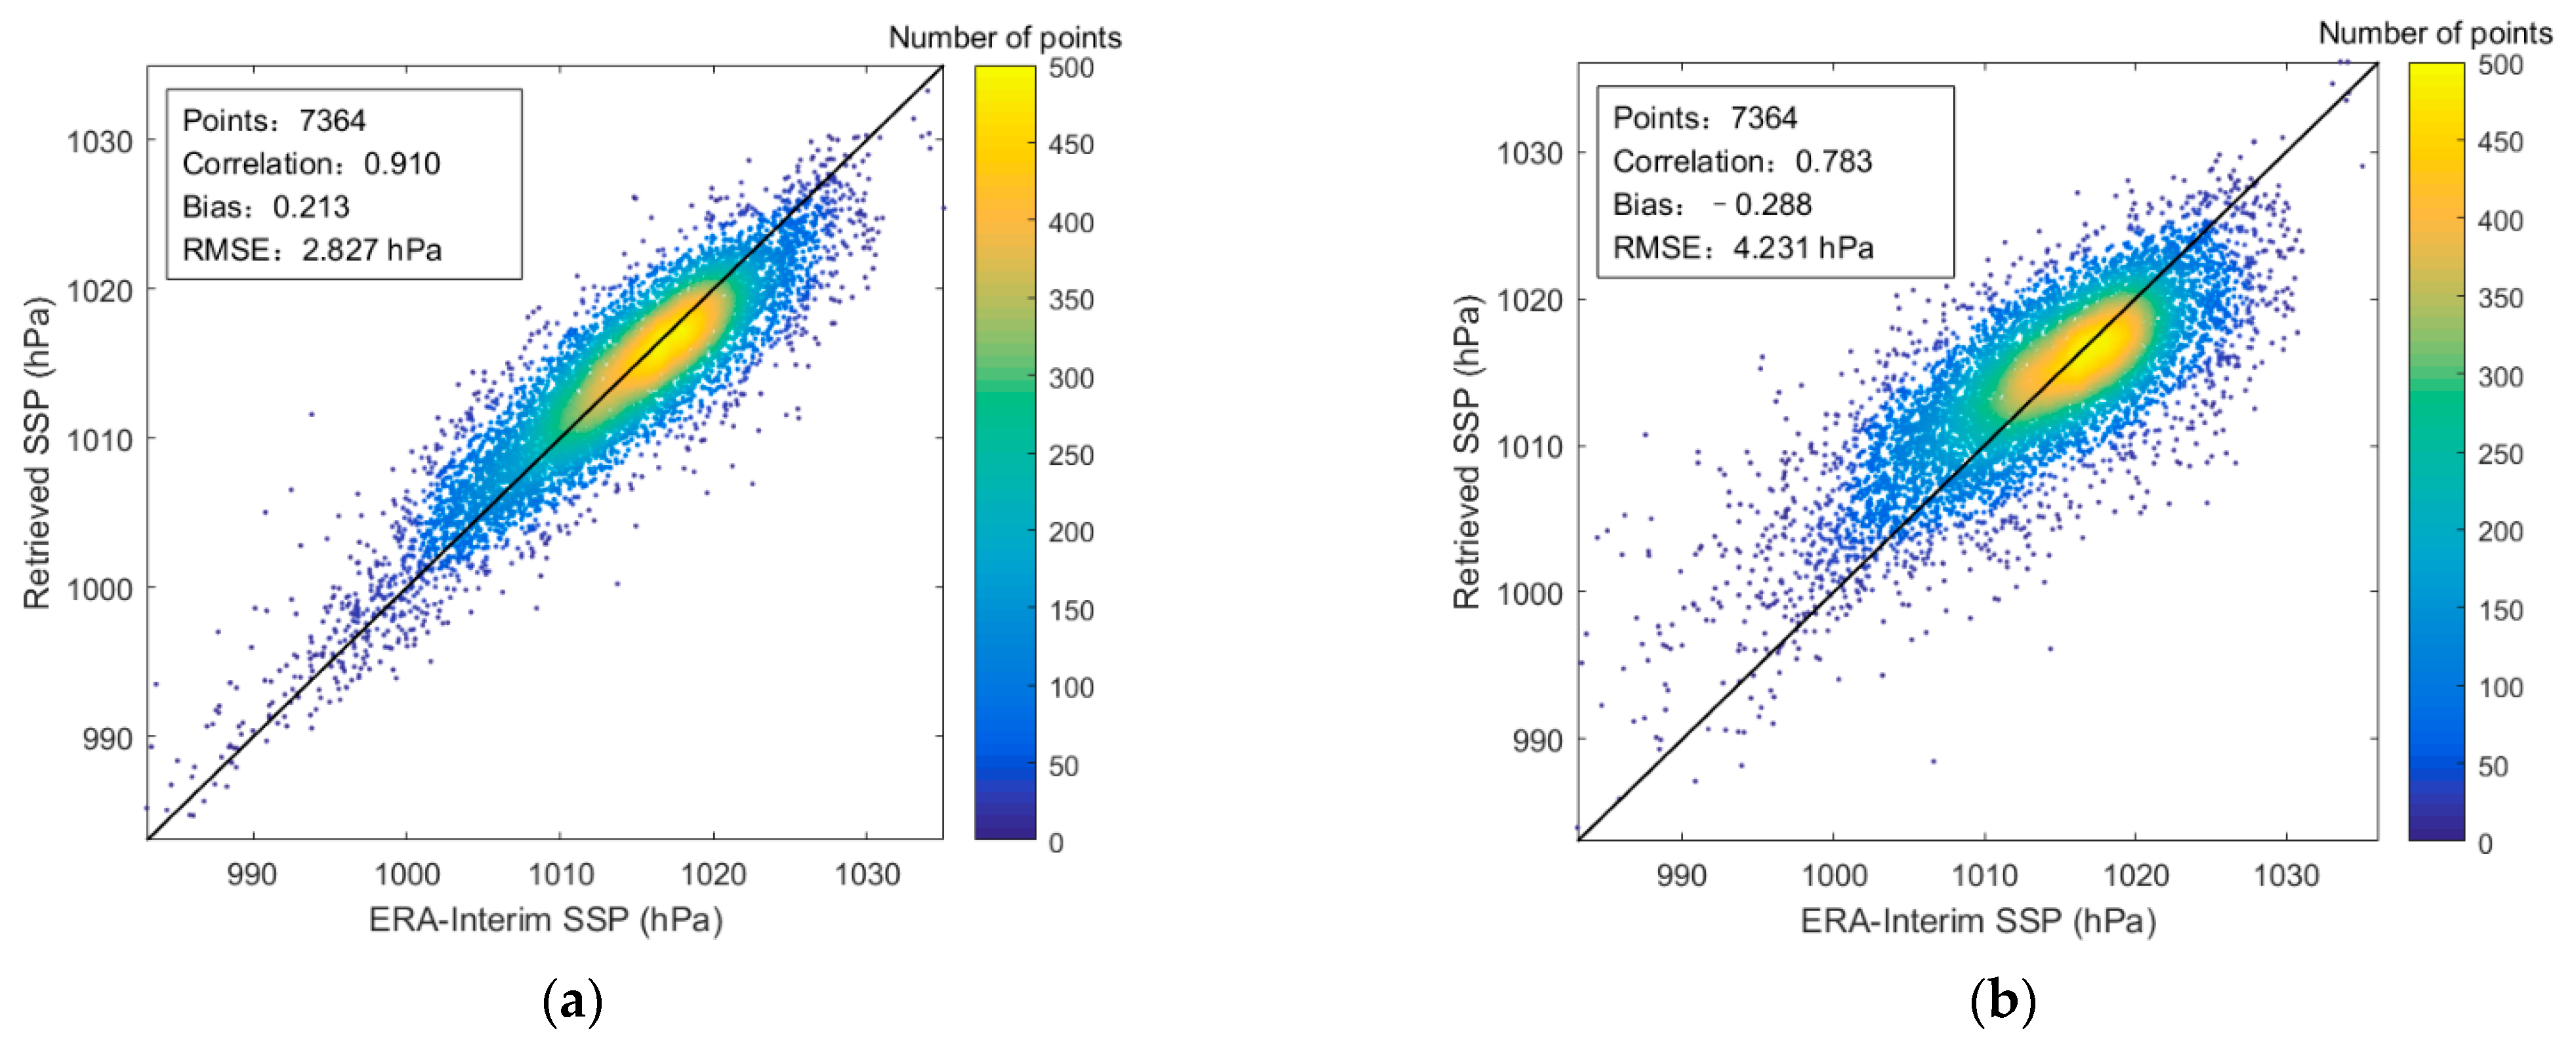
According to the design of the SSP retrieval experiments using MWTS-II and MWHTS observations in Section 4.2, the observed brightness temperatures of all channels of MWHTS and MWTS-II are used to develop the SSP retrieval model and retrieve SSP, then 1899, 55,569, and 7364 retrievals are obtained in clear, cloudy, and rainy sky conditions, respectively, and the retrieval results are shown in Figure 11, Figure 12 and Figure 13, respectively, and are also concluded in Table 4.
The retrieval results in the clear sky condition are shown in Figure 11, the RMSEs between the retrieval values and the reference values of SSP from MWTS-II and MWHTS are 1.719 hPa and 1.936 hPa, respectively. MWTS-II can obtain the retrieval accuracy of SSP about 0.2 hPa higher than MWHTS. For the SSP retrieval results in the cloudy sky condition, the RMSEs between the retrieval values and the reference values of SSP from MWTS-II and MWHTS are 2.734 hPa and 3.878 hPa, respectively. It is obvious that the retrieval accuracy of SSP from MWTS-II is about 1.1 hPa higher than that of MWHTS. As shown in Figure 13, the RMSEs between the retrieval values and the reference values of SSP in the rainy sky condition from MWTS-II are 2.827 hPa and 4.231 hPa, respectively. Similar to the retrieval results in the cloudy sky condition, the retrieval accuracy of SSP from MWTS-II in the rainy sky condition is about 1.4 hPa higher than that of MWHTS. By comparing the retrieval results of SSP from MWTS-II and MWHTS in the three weather conditions, it is concluded that MWTS-II can obtain the higher retrieval accuracies of SSP in clear, cloudy, and rainy sky conditions than MWHTS.
For the application of the observations of MWTS-II and MWHTS to retrieve SSP, although MWHTS contains the observed information about the 183.31 GHz water vapor absorption band and two window bands at 89 GHz and 150 GHz, the retrieval accuracy of SSP from MWHTS in the clear sky condition is still slightly lower than that of MWTS-II. In the cloudy and rainy sky conditions, the retrieval accuracies of SSP from MWHTS is poor, and the retrieval accuracies cannot meet the requirements of meteorological applications. Although MWTS-II only contains the 60 GHz observations, it still can obtain the SSP with high accuracies in the cloudy and rainy sky conditions, and its observations can be applied to retrieve SSP and obtain satisfactory retrieval accuracy of SSP.
In addition, by comparing the retrieval results of SSP in the SSP retrieval experiments using the 60 GHz and 118 GHz observations, it can be found that the cloud liquid water has an important influence on the performance of 118 GHz in retrieving SSP, and the larger the cloud liquid water, the worse the retrieval accuracy, while 60 GHz is less influenced by the cloud liquid water and performs better in retrieving SSP in both the cloudy and the rainy sky conditions.
6. Conclusions
In this paper, the performance of 60 GHz and 118 GHz in retrieving SSP are compared using MWTS-II and MWHTS observations. The 60 GHz channel combination and 118 GHz channel combination were established based on the channel WF distributions of MWTS-II and MWHTS, and the retrieval experiments of SSP were carried out using these channel combinations. The experimental results show that the retrieval accuracies of SSP from the 60 GHz channel combination are higher in clear, cloudy, and rainy sky conditions compared with the 118 GHz. In addition, the 60 GHz extended channel combination was established by adding MWTS-II channels 11–13 to the 60 GHz channel combination, and the SSP retrieval experiments were also carried out based on this channel combination. The retrieval accuracy obtained from the extended channel combination was significantly improved compared with the 60 GHz channel combination, which shows that the channels with the peak WF heights distributed in the upper atmosphere can also make important contributions to retrieve SSP, and can provide a reference for the channel configuration of future passive microwave instruments.
In this study, the retrieval experiments of SSP from MWTS-II and MWHTS in different weather conditions were also carried out. The comparison of the retrieval results of SSP from them show that both MWTS-II and MWHTS can obtain the SSP retrievals with high accuracy in the clear sky condition, and MWTS-II performs better than MWHTS in retrieving SSP. However, in the cloudy and rainy sky, compared with MWHTS, MWTS-II can obtain higher retrieval accuracy of SSP, which can meet the requirements of meteorological applications, while the retrieval accuracy of SSP from MWHTS needs to be further improved. In addition, by comparing the retrieval results of SSP in different weather conditions, it can be found that the performance of 118 GHz in retrieving SSP is more susceptible to the adverse effect of cloud liquid water, while 60 GHz is less affected by cloud liquid water and performs better in all weather conditions.
It should be noted that the complex nonlinearity between microwave observations and SSP is varied in different weather conditions, and it is more beneficial to obtain higher retrieval accuracy of SSP by establishing corresponding SSP retrieval models according to different weather conditions. The purpose of this study was to carry out the comparison of the performances of 60 GHz and 118 GHz in retrieving SSP, rather than the practical retrieval application of SSP using MWTS-II and MWHTS observations. Therefore, the vertical integral of cloud liquid water collocated with satellite observations was directly used in this study to identify the clear, cloudy, and rainy sky conditions. However, in the practical retrieval, the classification of satellite-based passive microwave observations needs to be performed directly based on the characteristics of the observations itself. Therefore, from the perspective of data statistical analysis, it is the future study to research the relationship between microwave observations and cloud parameters, and then apply it to the classification study of passive microwave observations in different weather conditions.
Although the comparison of the performance of 60 GHz and 118 GHz in retrieving SSP based on MWHTS and MWTS-II observations was achieved in this study, it must be noted that the data quality of MWHTS and MWTS-II may affect the comparison results of the retrieval performance of 60 GHz and 118 GHz itself, while a more optimized retrieval algorithm can be helpful to obtain more accurate comparison results of the retrieval performance of 60 GHz and 118 GHz for SSP. Therefore, the continued improvement of the retrieval algorithm for SSP and study of the effect of the data quality of satellite passive microwave observations on the SSP retrieval are also the next working directions.
Author Contributions
Q.H. and Z.W. designed the study; Q.H. and J.L. carried out the experiments; Z.W. presented some conclusions; Q.H. and J.L. wrote the manuscripts; and Q.H., J.L., Z.W. and L.Z. edited the article. All authors have read and agreed to the published version of the manuscript.
Funding
This research was funded by the National Natural Science Foundation of China under Grant No. 41901297, 41806209, the Science and Technology Key Project of Henan Province under Grant No. 202102310017, the Key Research Projects for the Universities of Henan Province under Grant No. 20A170013, and the China Postdoctoral Science Foundation under Grant No. 2021M693201.
Data Availability Statement
Not applicable.
Acknowledgments
The authors would like to thank NSMC for providing the MWHTS and MWTS-II observations, as well as ECMWF for providing the ERA-Interim reanalysis data.
Conflicts of Interest
The authors declare no conflict of interest. The funders had no role in the design of the study; in the collection, analyses, or interpretation of data; in the writing of the manuscript, or in the decision to publish the results.
References
- Min, Q.; Gong, W.; Lin, B.; Hu, Y. Application of surface pressure measurements from O2-band differential absorption radar system in three-dimensional data assimilation on hurricane: Part I. An observing system simulation experiments study. J. Quant. Spectrosc. Radiat. Transf. 2011, 150, 148–165. [Google Scholar] [CrossRef] [Green Version]
- Lin, B.; Min, Q. Optimal frequency selection of multi-channel O2-band different absorption barometric radar for air pressure measurements. J. Quant. Spectrosc. Radiat. Transf. 2017, 188, 188–191. [Google Scholar] [CrossRef] [Green Version]
- Lorenc, A.C. Analysis methods for numerical weather prediction. Q. J. R. Meteorol. Soc. 2010, 112, 1177–1194. [Google Scholar] [CrossRef]
- Simmons, A.J.; Hollingsworth, A. Some aspects of the improvement in skill of numerical weather prediction. Q. J. R. Meteorol. Soc. 2002, 128, 647–677. [Google Scholar] [CrossRef]
- Flasar, F.M.; Baines, K.H.; Bird, M.K.; Tokano, T.; West, R.A. Atmospheric Dynamics and Meteorology; Springer: Dordrecht, The Netherlands, 2009. [Google Scholar] [CrossRef]
- Lin, B.; Hu, Y. Numerical simulations of radar surface air pressure measurements at O2 bands. IEEE Geosci. Remote Sens. Lett. 2005, 2, 324–328. [Google Scholar] [CrossRef]
- Millán, L.; Lebsock, M.; Livesey, N.; Tanelli, S.; Stephens, G. Differential absorption radar techniques: Surface pressure. Atmos. Meas. Tech. 2014, 7, 3959–3970. [Google Scholar] [CrossRef] [Green Version]
- Zhang, Z. Study on the Retrieval Theory and Method of Sea Surface Pressure Basing on Passive Microwave Observations. Ph.D. Thesis, Chinese Academy of Science, Beijing, China, 2019. [Google Scholar]
- Zhang, Z.; Dong, X.; Liu, L.; He, J. Retrieval of barometric pressure from satellite passive microwave observations over the oceans. J. Geophys. Res. 2018, 123, 4360–4372. [Google Scholar] [CrossRef]
- O’Brien, D.M.; Mitchell, R.M.; English, S.A.; da Costa, G.A. Airborne measurements of air mass from O2 A-band absorption spectral. J. Atmos. Ocean Technol. 1998, 15, 1272–1286. [Google Scholar] [CrossRef]
- Healy, S.B. Surface pressure information retrieved from GPS radio occultation measurements. Q. J. R. Meteorol. Soc. 2013, 139, 2108–2118. [Google Scholar] [CrossRef]
- Van Zadelhoff, G.J.; Stoffelen, A.; Vachon, P.W.; Wolfe, J.; Horstmann, J.; Belmonte Rivas, M. Retrieving hurricane wind speeds using C-band measurements. Atmos. Meas. Tech. 2014, 7, 437–449. [Google Scholar] [CrossRef] [Green Version]
- He, Q.; Wang, Z.; Li, J. Application of the deep neural network in retrieving the atmospheric temperature and humidity profiles from the Microwave Humidity and Temperature Sounder onboard the Feng-Yun-3 satellite. Sensors 2021, 21, 4673. [Google Scholar] [CrossRef] [PubMed]
- Guo, Y.; Lu, N.; Qi, C.; Gu, S.; Xu, J. Calibration and validation of microwave humidity and temperature sounder onboard FY-3C satellite. Chin. J. Geophys. Chin. 2015, 58, 20–31. [Google Scholar] [CrossRef]
- Lawrence, H.; Bormann, N.; Lu, Q.F.; Geer, A.; English, S. An Evaluation of FY-3C MWHTS-2 at ECMWF; EUMETSAT/ECMWF Fellowship Programme Research Report No. 37; ECMWF: Reading, UK, 2015. [Google Scholar]
- Croom, D.L. The 2.53 mm molecular rotation line of atmospheric O2. Planet. Space Sci. 1971, 19, 777–789. [Google Scholar] [CrossRef]
- Gasiewski, A.J.; Barrett, J.W.; Bonanni, P.G.; Staelin, D.H. Aircraft-based radiometric imaging of tropospheric temperature and precipitation using the 118.75-GHz oxygen resonance. J. Appl. Meteorol. Climatol. 1990, 29, 620–632. [Google Scholar] [CrossRef] [Green Version]
- Gasiewski, A.J.; Johnson, J.T. Statistical temperature profile retrievals in clear-air using passive 118-GHz O2 observations. IEEE Trans. Geosci. Remote Sens. 1993, 31, 106–115. [Google Scholar] [CrossRef]
- Sahoo, S.; Bosch-Lluis, X.; Reising, S.C.; Vivekanandan, J. Radiometric information content for water vapor and temperature profiling in clear skies between 10 and 200 GHz. IEEE J. Sel. 2014, 8, 859–871. [Google Scholar] [CrossRef]
- He, Q.; Wang, Z.; He, J.; Zhang, L. A comparison of the retrieval of atmospheric temperature profiles using observations of the 60 GHz and 118.75 GHz absorption lines. J. Trop. Meteorol. 2018, 24, 151–163. [Google Scholar] [CrossRef]
- He, Q. Study on Retrieving the Atmospheric Temperature and Humidity Profiles from Measurements of Microwave Humidity and Temperature Sounder on FY-3C Satellite. Ph.D. Thesis, Chinese Academy of Science, Beijing, China, 2017. [Google Scholar]
- Blackwell, W.J.; Chen, F.W. Neural Networks in Atmospheric Remote Sensing; Artech House: Norwood, MA, USA, 2009. [Google Scholar]
- Niu, Z.; Zhang, L.; Dong, P.; Weng, F.; Huang, W. Impact of assimilating FY-3D MWTS-2 upper air sounding data on forecasting typhoon lekima (2019). Remote Sens. 2021, 13, 1841. [Google Scholar] [CrossRef]
- Wang, Z.; Li, J.; He, J.; Zhang, S.; Gu, S.; Li, Y.; Guo, Y.; He, B. Performance analysis of microwave humidity and temperature sounder onboard the FY-3D satellite from prelaunch multiangle calibration data in thermal/vacuum test. IEEE Trans. Geosci. Remote Sens. 2018, 57, 1664–1683. [Google Scholar] [CrossRef]
- Guo, Y.; Lu, N.; Gu, S. Simulation of the radiometric characteristics of 118 GHz and 183 GHz channels for FY-3C new microwave radiometer sounder. J. Infrared Millim. Waves 2014, 33, 481. [Google Scholar] [CrossRef]
- Andronache, C. Remote Sensing of Clouds and Precipitation; Springer: Cham, Switzerland, 2018. [Google Scholar]
- Liebe, H.J.; Hufford, G.A.; Cotton, M.G. Propagation Modeling of Moist Air and Suspended Water/Ice Particles at Frequencies Below 1000 GHz. AGARD. 1993. Available online: https://www.its.bldrdoc.gov/publications/details.aspx?pub=2670 (accessed on 19 August 2021).
- Carminati, F.; Migliorini, S. All-sky data assimilation of MWTS-2 and MWHS-2 in the Met Office global NWP system. Adv. Atmos. Sci. 2021, 38, 1682–1694. [Google Scholar] [CrossRef]
- Hoffmann, L.; Günther, G.; Li, D.; Stein, O.; Wu, X.; Griessbach, S.; Heng, Y.; Konopka, P.; Müller, R.; Vogel, B.; et al. From ERA-Interim to ERA5: The considerable impact of ECMWF’s next-generation reanalysis on Lagrangian transport simulations. Atmos. Chem. Phys. 2019, 19, 3097–3124. [Google Scholar] [CrossRef] [Green Version]
- Berrisford, P.; Dee, D.; Poli, P.; Brugge, R.; Fielding, K.; Fuentes, M.; Kallberg, P.; Kobayashi, S. The ERA-Interim Archive Version 2.0; ERA Report Series 1; ECMWF: Reading, UK, 2011. [Google Scholar]
- Dee, D.P.; Uppala, S.M.; Simmons, A.J.; Berrisford, P.; Poli, P.; Kobayashi, S.; Andrae, U.; Balmaseda, M.A.; Balsamo, G.; Bauer, P.; et al. The ERA-Interim reanalysis: Configuration and performance of the data assimilation system. Q. J. R. Meteorol. Soc. 2011, 137, 553–597. [Google Scholar] [CrossRef]
- Saunders, R.; Hocking, J.; Rundle, D.; Rayer, P.; Matricardi, M.; Geer, A.; Lupu, C.; Brunel, P.; Vidot, J. RTTOV-11 Science and Validation Report; NWP-SAF Report; Met Office: Exeter, UK, 2013; pp. 1–62. [Google Scholar]
- Rodgers, C.D. Retrieval of atmospheric temperature and composition from remote measurements of thermal radiation. Rev. Geophys. 1976, 14, 609–624. [Google Scholar] [CrossRef]
- Ulaby, F.T.; Moore, R.K.; Fung, A.K. Microwave Remote Sensing: Active and Passive; Addison-Wesley: Reading, MA, USA, 1981. [Google Scholar]
- Saunders, R.; Hocking, J.; Turner, E.; Rayer, P.; Rundle, D.; Brunel, P.; Vidot, J.; Roquet, P.; Matricardi, M.; Geer, A.; et al. An update on the RTTOV fast radiative transfer model (currently at version 12). Geosci. Model Dev. 2018, 11, 2717–2737. [Google Scholar] [CrossRef] [Green Version]
- Dee, D.P. Bias and data assimilation. Q. J. R. Meteorol. Soc. 2005, 131, 3323–3343. [Google Scholar] [CrossRef] [Green Version]
- Aires, F.; Marquisseau, F.; Prigent, C.; Seze, G. A land and ocean microwave cloud classification algorithm derived from AMSU-A and-B, trained using MSG-SEVIRI infrared and visible observations. Mon. Weather Rev. 2011, 139, 2347–2366. [Google Scholar] [CrossRef] [Green Version]
- Derrien, M.; Le Gléau, H. MSG/SEVIRI cloud mask and type from SAFNWC. Int. J. Remote Sens. 2005, 26, 4707–4732. [Google Scholar] [CrossRef]
- Derrien, M.; Le Gléau, H. Improvement of cloud detection near sunrise and sunset by temporal-differencing and region-growing techniques with real-time SEVIRI. Int. J. Remote Sens. 2010, 31, 1765–1780. [Google Scholar] [CrossRef]
- Hong, G.; Heygster, G.; Miao, J.; Kunzi, K. Detection of tropical deep convective clouds from AMSU-B water vapor channels measurements. J. Geophys. Res. Atmos. 2005, 110, D05205. [Google Scholar] [CrossRef] [Green Version]
- Alishouse, J.C.; Snyder, S.A.; Vongsathorn, J.; Ferraro, R.R. Determination of oceanic total precipitable water from the SSM/I. IEEE Trans. Geosci. Remote Sens. 1990, 28, 811–816. [Google Scholar] [CrossRef]
- Ferraro, R.R.; Weng, F.; Grody, N.C.; Basist, A. An eight-year (1987–1994) time series of rainfall, clouds, water vapor, snow cover, and sea ice derived from SSM/I measurements. Bull. Am. Meteorol. Soc. 1996, 77, 891–906. [Google Scholar] [CrossRef]
- Weng, F.; Zhao, L.; Ferraro, R.R.; Poe, G.; Li, X.; Grody, N.C. Advanced microwave sounding unit cloud and precipitation algorithms. Radio Sci. 2003, 38, 33. [Google Scholar] [CrossRef]
- Wentz, F.J.; Spencer, R.W. SSM/I rain retrievals within a unified all-weather ocean algorithm. J. Atmos. Sci. 1998, 55, 1613–1627. [Google Scholar] [CrossRef] [Green Version]
- Boukabara, S.A.; Garrett, K.; Chen, W.; Iturbide-Sanchez, F.; Grassotti, C.; Kongoli, C.; Chen, R.; Liu, Q.; Yan, B.; Weng, F.; et al. MiRS: An all-weather 1DVAR satellite data assimilation and retrieval system. IEEE Trans. Geosci. Remote Sens. 2011, 49, 3249–3272. [Google Scholar] [CrossRef]
- Zhou, Y.; Grasstotti, C. Development of a machine learning-based radiometric bias correction for NOAA’s Microwave integrated retrieval system (MIRS). Remote Sens. 2020, 12, 3160. [Google Scholar] [CrossRef]
- Yan, X.; Liang, C.; Jiang, Y.; Luo, N.; Zang, Z.; Li, Z. A deep learning approach to improve the retrieval of temperature and humidity profiles from a ground-based microwave radiometer. IEEE Trans. Geosci. Remote Sens. 2020, 58, 8427–8437. [Google Scholar] [CrossRef]
- Dueben, P.; Modigliani, U.; Geer, A.; Siemen, S.; Pappenberger, F.; Bauer, P.; Brown, A.; Palkovič, M.; Raoult, B.; Wedi, N.; et al. Machine learning at ECMWF: A roadmap for the next 10 years. European Centre for Medium-Range Weather Forecasts. Tech. Rep. 2021, 878. [Google Scholar] [CrossRef]
- Aires, F.; Weston, P.; Rosnay, P.; Fairbairn, D. Statistical approaches to assimilate ASCAT soil moisture information: Part I Methodologies and first assessment. Q. J. R. Meteorol. Soc. 2021, 147, 1823–1825. [Google Scholar] [CrossRef]
- Srivastava, N.; Hinton, G.; Krizhevsky, A.; Sutskever, I.; Salakhutdinov, R. Dropout: A simple way to prevent neural networks from overfitting. J. Mach. Learn. Res. 2014, 15, 1929–1958. [Google Scholar]
Figure 1.
Weighting functions for MWHTS and MWTS-II calculated from the U.S. standard atmospheric profile. (a) MWHTS. (b) MWTS-II.
Figure 1.
Weighting functions for MWHTS and MWTS-II calculated from the U.S. standard atmospheric profile. (a) MWHTS. (b) MWTS-II.

Figure 2.
The calculation accuracies of RTTOV for the simulated brightness temperatures versus the vertical integral of cloud liquid water. (a) MWHTS. (b) MWTS-II.
Figure 2.
The calculation accuracies of RTTOV for the simulated brightness temperatures versus the vertical integral of cloud liquid water. (a) MWHTS. (b) MWTS-II.

Figure 3.
The schematic of the data preprocessing procedure.

Figure 4.
The average transmissivity for each channel of MWHTS and MWTS-II in clear, cloudy, and rainy sky conditions.
Figure 4.
The average transmissivity for each channel of MWHTS and MWTS-II in clear, cloudy, and rainy sky conditions.

Figure 5.
The correlation coefficients between the observations of channels with zero surface transmissivity and with non-zero surface transmissivity. (a) MWHTS. (b) MWTS-II.
Figure 5.
The correlation coefficients between the observations of channels with zero surface transmissivity and with non-zero surface transmissivity. (a) MWHTS. (b) MWTS-II.

Figure 6.
The structure and major configuration of the DNN.

Figure 7.
The SSP retrieval results in the clear sky condition. (a) The 60 GHz channel combination. (b) The 118 GHz channel combination.
Figure 7.
The SSP retrieval results in the clear sky condition. (a) The 60 GHz channel combination. (b) The 118 GHz channel combination.

Figure 8.
The SSP retrieval results in the cloudy sky condition. (a) The 60 GHz channel combination. (b) The 118 GHz channel combination.
Figure 8.
The SSP retrieval results in the cloudy sky condition. (a) The 60 GHz channel combination. (b) The 118 GHz channel combination.

Figure 9.
The SSP retrieval results in the rainy sky condition. (a) The 60 GHz channel combination. (b) The 118 GHz channel combination.
Figure 9.
The SSP retrieval results in the rainy sky condition. (a) The 60 GHz channel combination. (b) The 118 GHz channel combination.

Figure 10.
The SSP retrieval results from the 60 GHz extended channel combination in different weather conditions. (a) The clear sky. (b) The cloudy sky. (c) The rainy sky.
Figure 10.
The SSP retrieval results from the 60 GHz extended channel combination in different weather conditions. (a) The clear sky. (b) The cloudy sky. (c) The rainy sky.

Figure 11.
The SSP retrieval results in the clear sky condition. (a) MWTS-II. (b) MWHTS.

Figure 12.
The SSP retrieval results in the cloudy sky condition. (a) MWTS-II. (b) MWHTS.

Figure 13.
The SSP retrieval results in the rainy sky condition. (a) MWTS-II. (b) MWHTS.


Table 1.
The correspondences of each channel in the 60 GHz channel combination and 118 GHz channel combination.
Table 1.
The correspondences of each channel in the 60 GHz channel combination and 118 GHz channel combination.
| Peak WF Pressure Level (hPa) | 25 | 50 | 100 | 250 | 350 | Surface | Surface | Surface |
|---|---|---|---|---|---|---|---|---|
| MWHTS Channel | 2 | 3 | 4 | 5 | 6 | 7 | 8 | 9 |
| MWTS-II Channel | 10 | 9 | 8 | 6 | 5 | 3 | 2 | 1 |
Table 2.
The SSP retrieval results from the 60 GHz and 118 GHz channel combinations.
| Weather Condition | The 60 GHz Channel Combination | The 118 GHz Channel Combination | ||||
|---|---|---|---|---|---|---|
| Correlation Coefficient | Bias | RMSE | Correlation Coefficient | Bias | RMSE | |
| The clear sky | 0.877 | 0.032 | 2.552 | 0.786 | −0.033 | 3.275 |
| The cloudy sky | 0.874 | 0.733 | 3.640 | 0.773 | −0.692 | 4.712 |
| The rainy sky | 0.801 | 0.235 | 4.066 | 0.692 | −0.207 | 4.902 |
Table 3.
The SSP retrieval results from the 60 GHz extended channel combinations.
| Weather Condition | The 60 GHz Extended Channel Combination | ||
|---|---|---|---|
| Correlation Coefficient | Bias | RMSE | |
| The clear sky | 0.937 | −0.358 | 1.893 |
| The cloudy sky | 0.917 | −0.252 | 2.936 |
| The rainy sky | 0.884 | 0.159 | 3.169 |
Table 4.
The SSP retrieval results from MWTS-II and MWHTS.
| Weather Condition | MWTS-II | MWHTS | ||||
|---|---|---|---|---|---|---|
| Correlation Coefficient | Bias | RMSE | Correlation Coefficient | Bias | RMSE | |
| The clear sky | 0.946 | 0.144 | 1.719 | 0.931 | 0.094 | 1.936 |
| The cloudy sky | 0.928 | −0.065 | 2.734 | 0.850 | −0.314 | 3.878 |
| The rainy sky | 0.910 | 0.213 | 2.827 | 0.783 | −0.288 | 4.231 |
Publisher’s Note: MDPI stays neutral with regard to jurisdictional claims in published maps and institutional affiliations. |
© 2022 by the authors. Licensee MDPI, Basel, Switzerland. This article is an open access article distributed under the terms and conditions of the Creative Commons Attribution (CC BY) license (https://creativecommons.org/licenses/by/4.0/).
Share and Cite
MDPI and ACS Style
He, Q.; Li, J.; Wang, Z.; Zhang, L. Comparative Study of the 60 GHz and 118 GHz Oxygen Absorption Bands for Sounding Sea Surface Barometric Pressure. Remote Sens. 2022, 14, 2260. https://0-doi-org.brum.beds.ac.uk/10.3390/rs14092260
AMA Style
He Q, Li J, Wang Z, Zhang L. Comparative Study of the 60 GHz and 118 GHz Oxygen Absorption Bands for Sounding Sea Surface Barometric Pressure. Remote Sensing. 2022; 14(9):2260. https://0-doi-org.brum.beds.ac.uk/10.3390/rs14092260
Chicago/Turabian StyleHe, Qiurui, Jiaoyang Li, Zhenzhan Wang, and Lanjie Zhang. 2022. "Comparative Study of the 60 GHz and 118 GHz Oxygen Absorption Bands for Sounding Sea Surface Barometric Pressure" Remote Sensing 14, no. 9: 2260. https://0-doi-org.brum.beds.ac.uk/10.3390/rs14092260
Note that from the first issue of 2016, this journal uses article numbers instead of page numbers. See further details here.