
Experimental Study on the Exploration of Camera Scanning Reflective Fourier Ptychography Technology for Far-Field Imaging

Abstract
:
1. Introduction
2. Imaging Theory
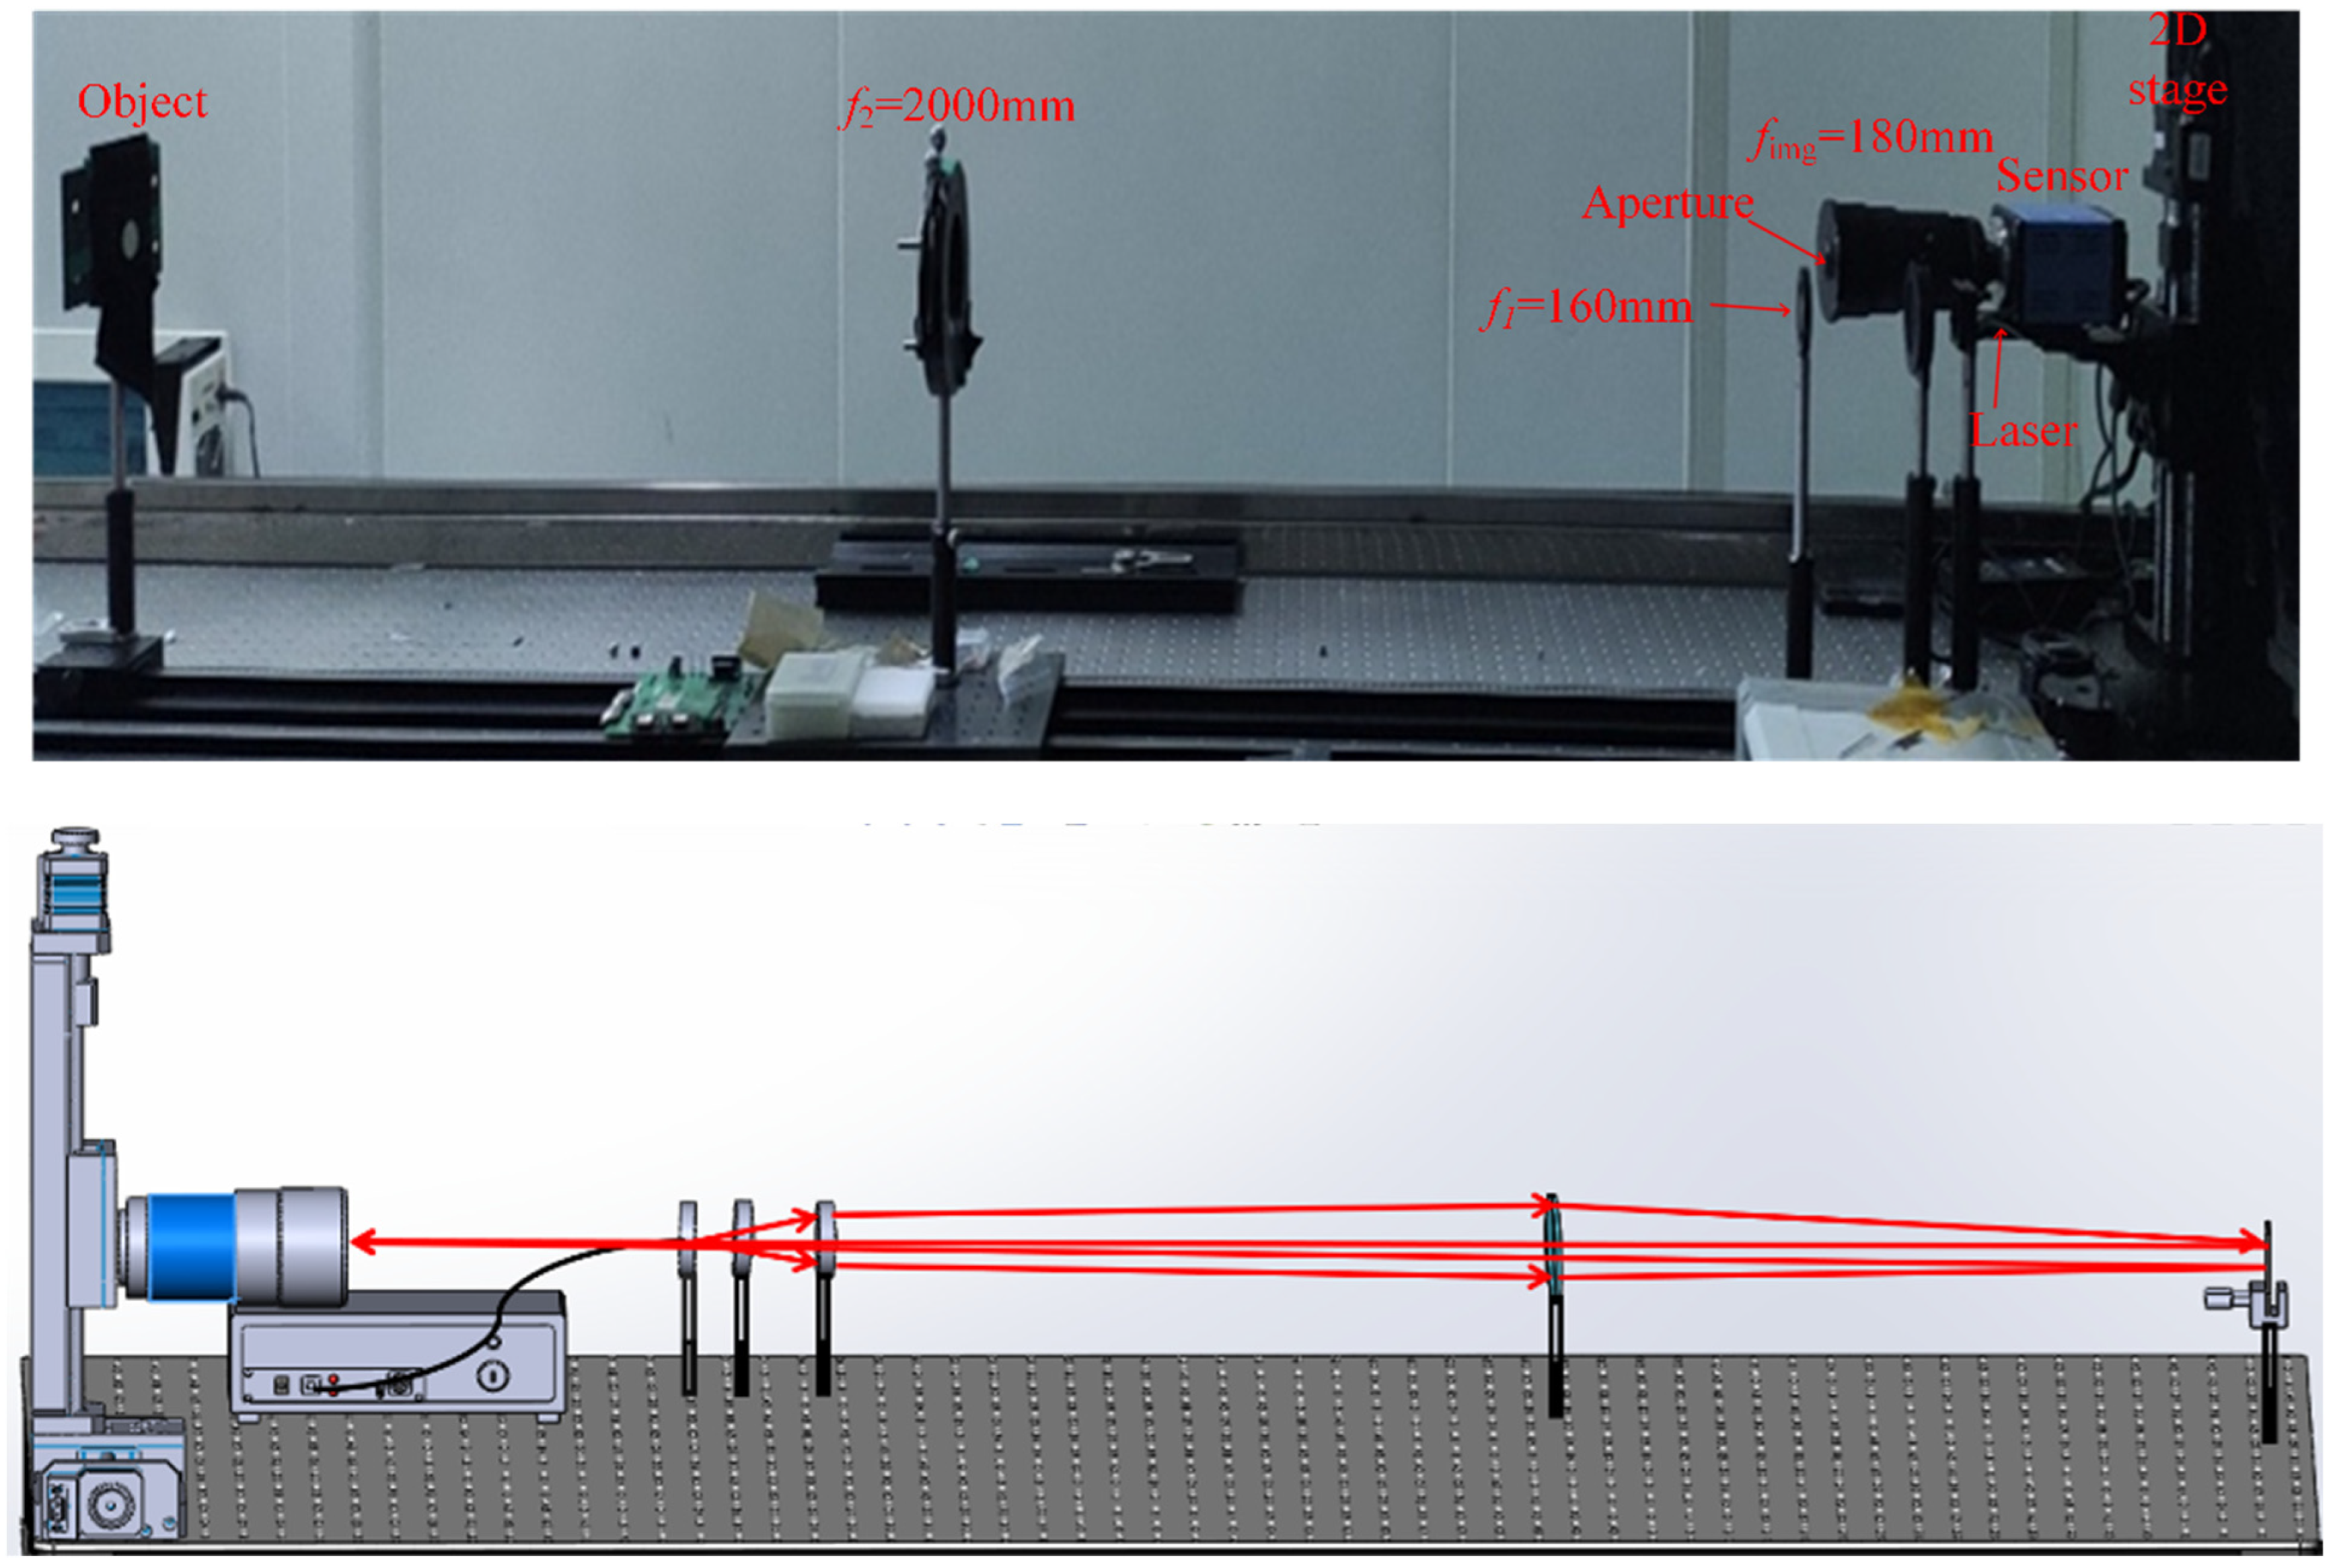
3. Experiment
3.1. Requirements of Laser Light Source
3.1.1. Single-Mode Laser Light
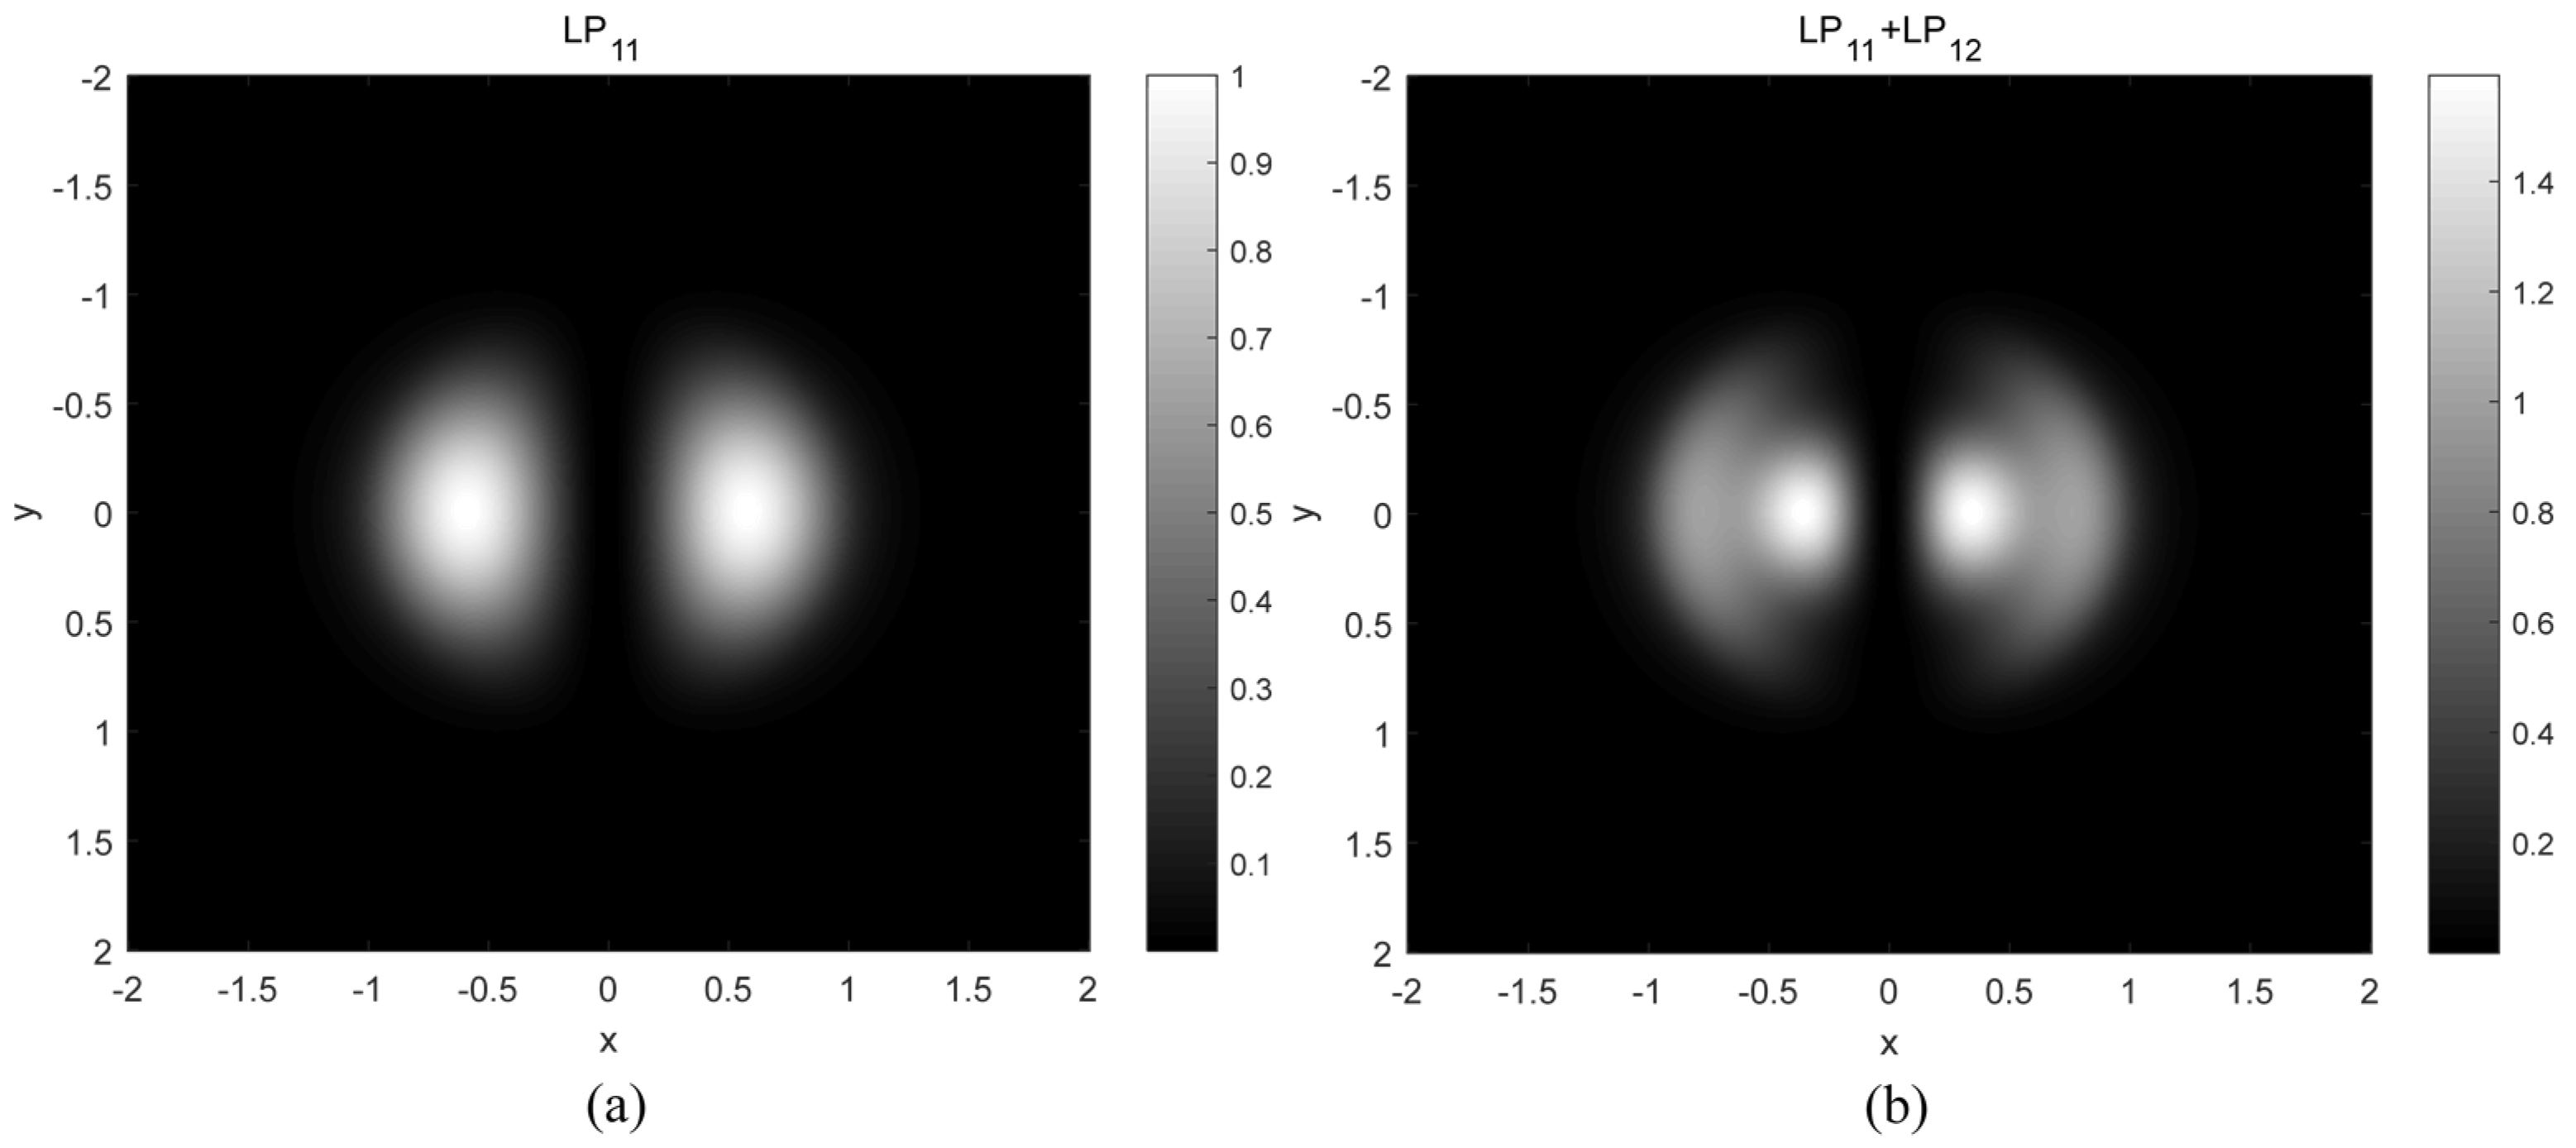
3.1.2. Multimode Laser Light
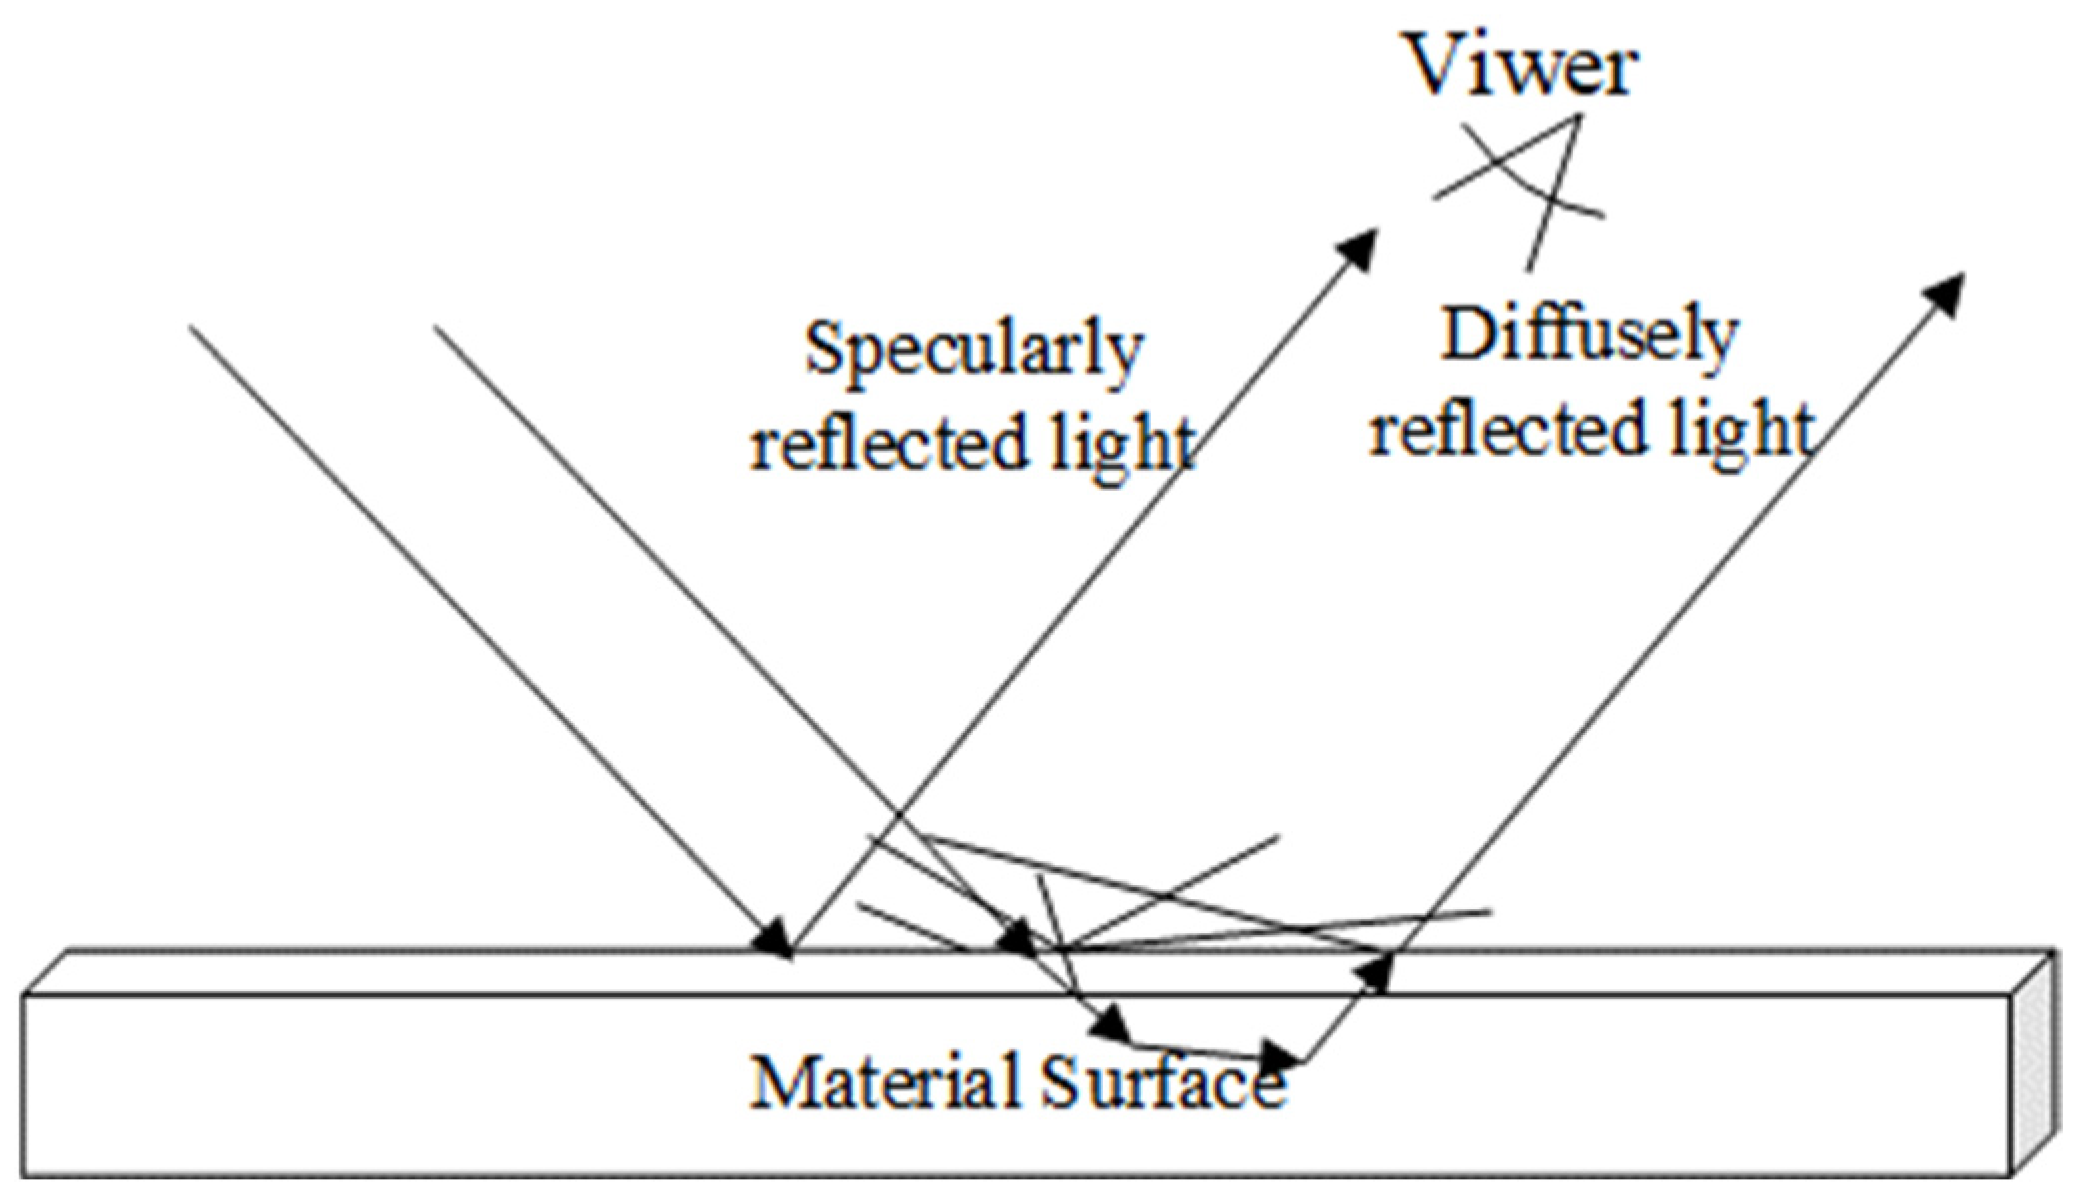
3.2. Qualitative Analysis of the Effect of Target Surface Properties on Laser Coherence
3.3. Experimental Analysis
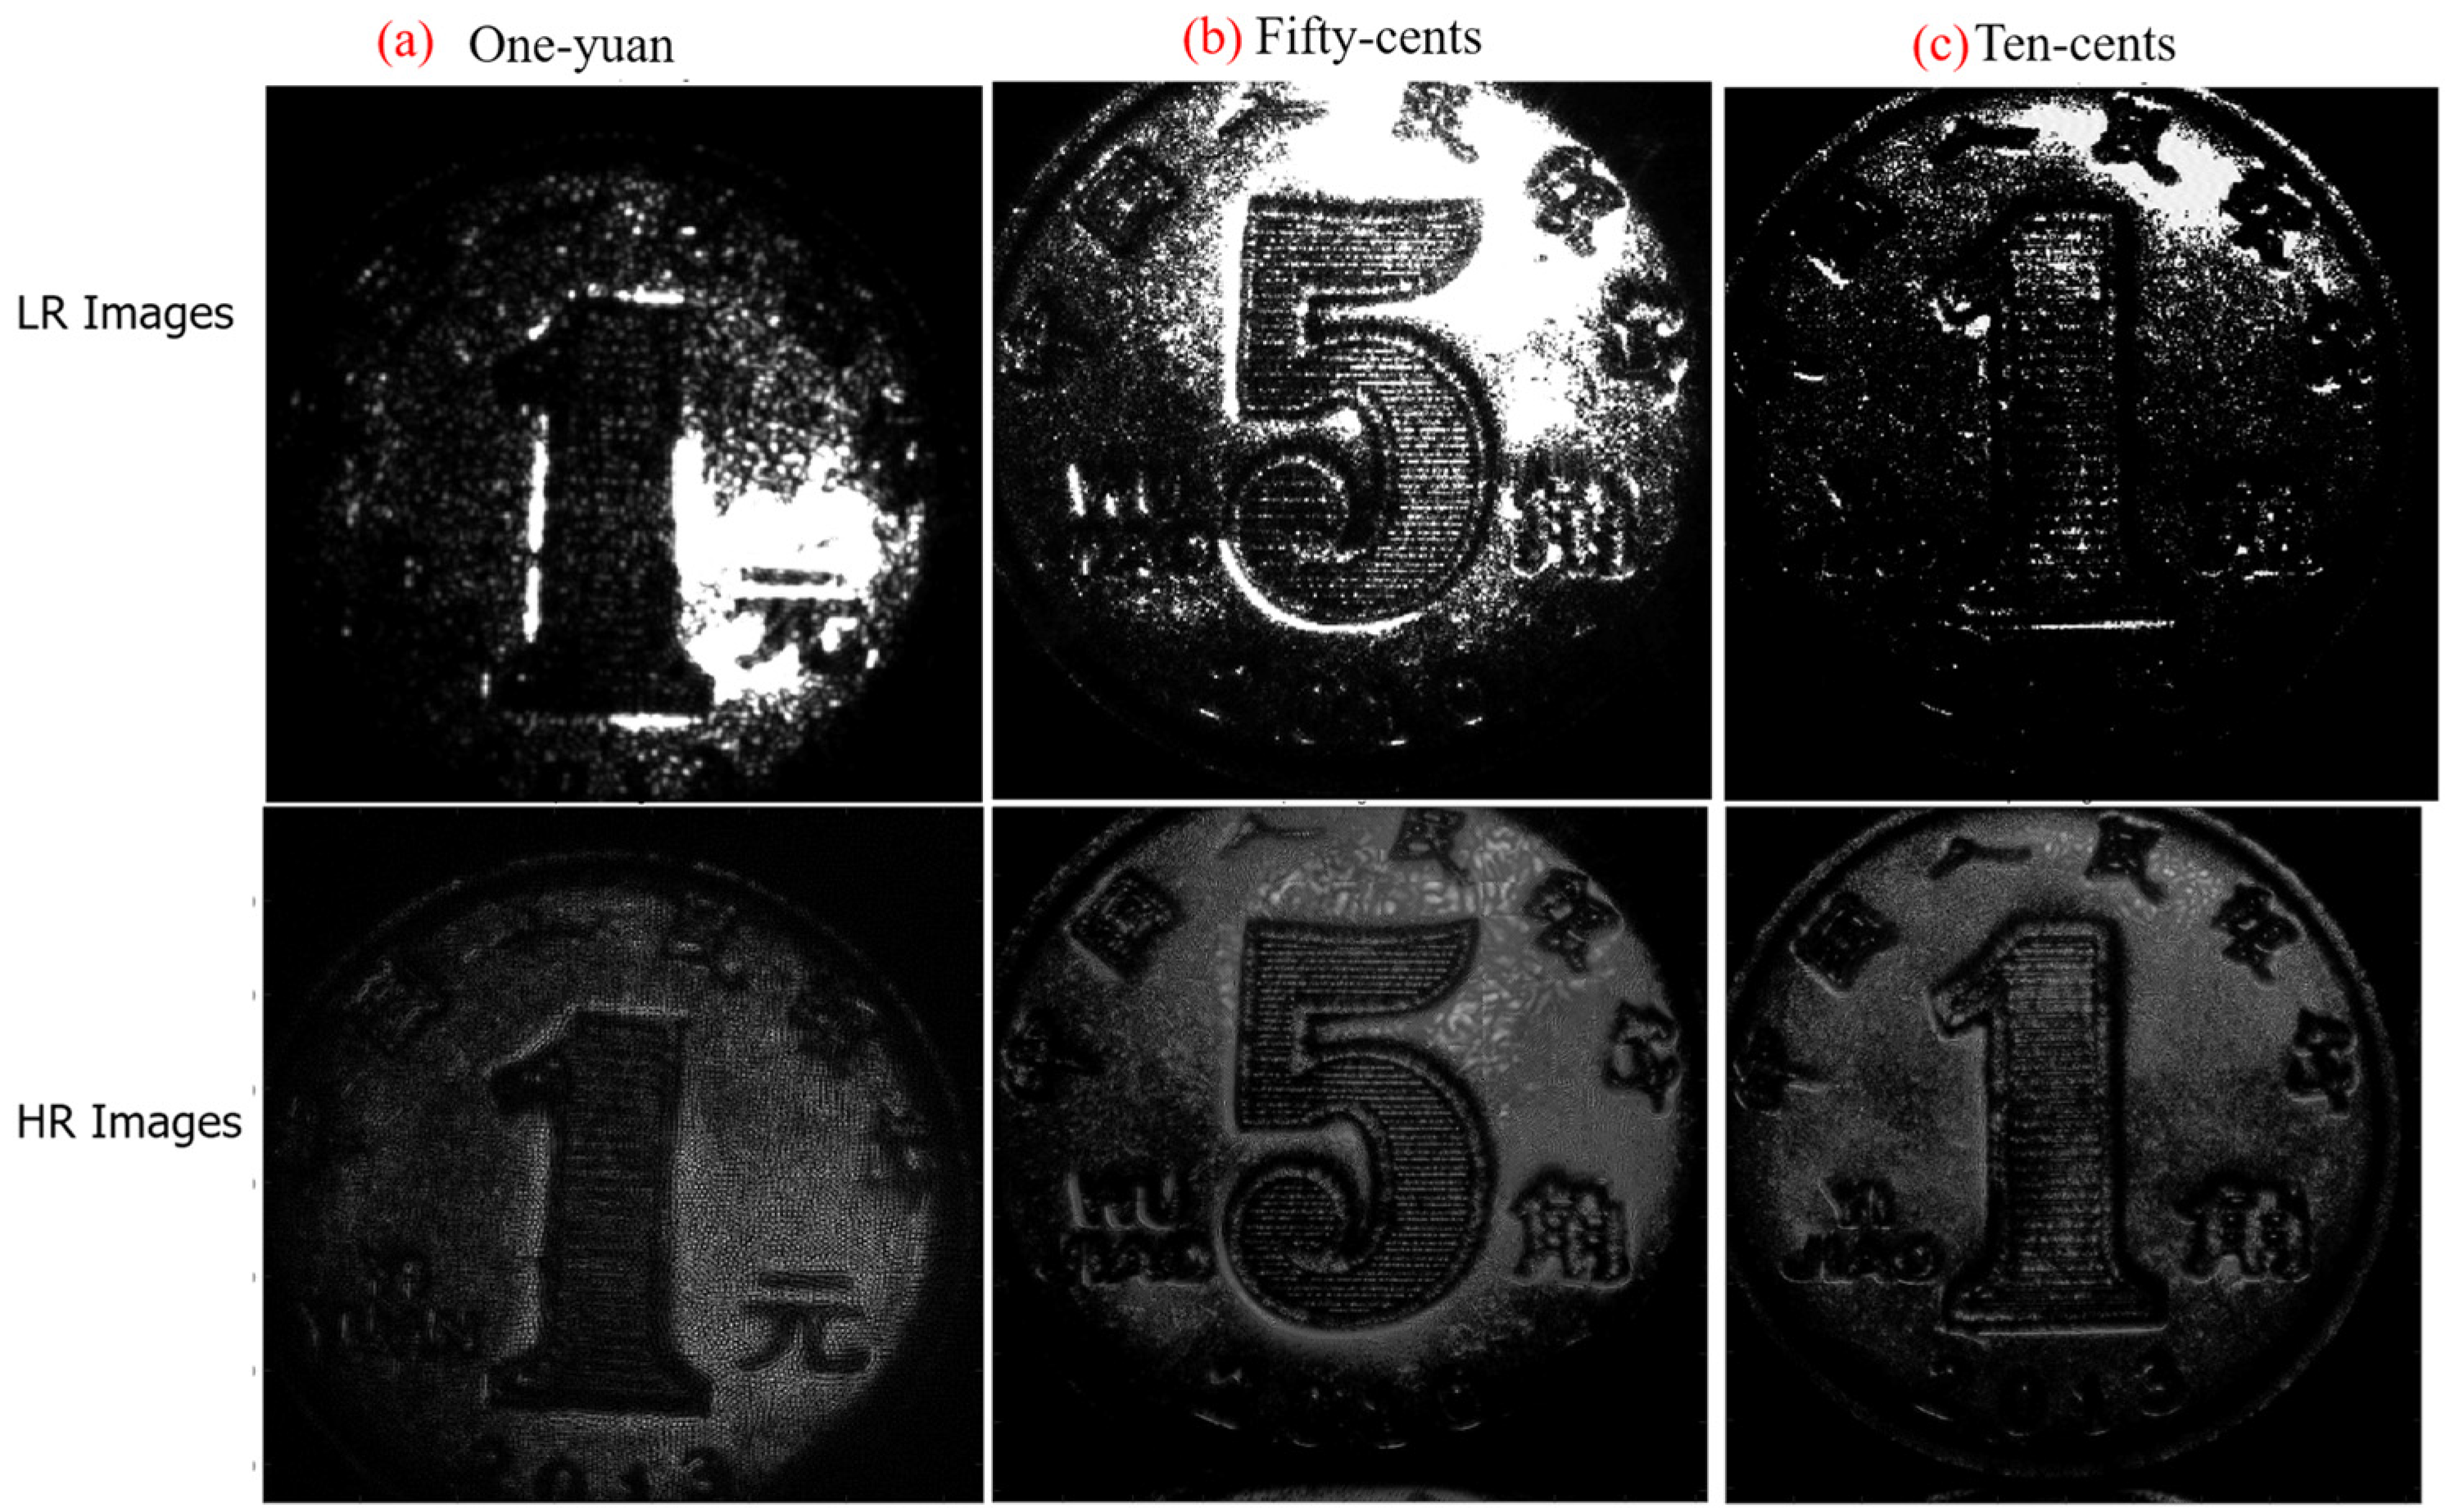
3.3.1. Diffused Object Imaging
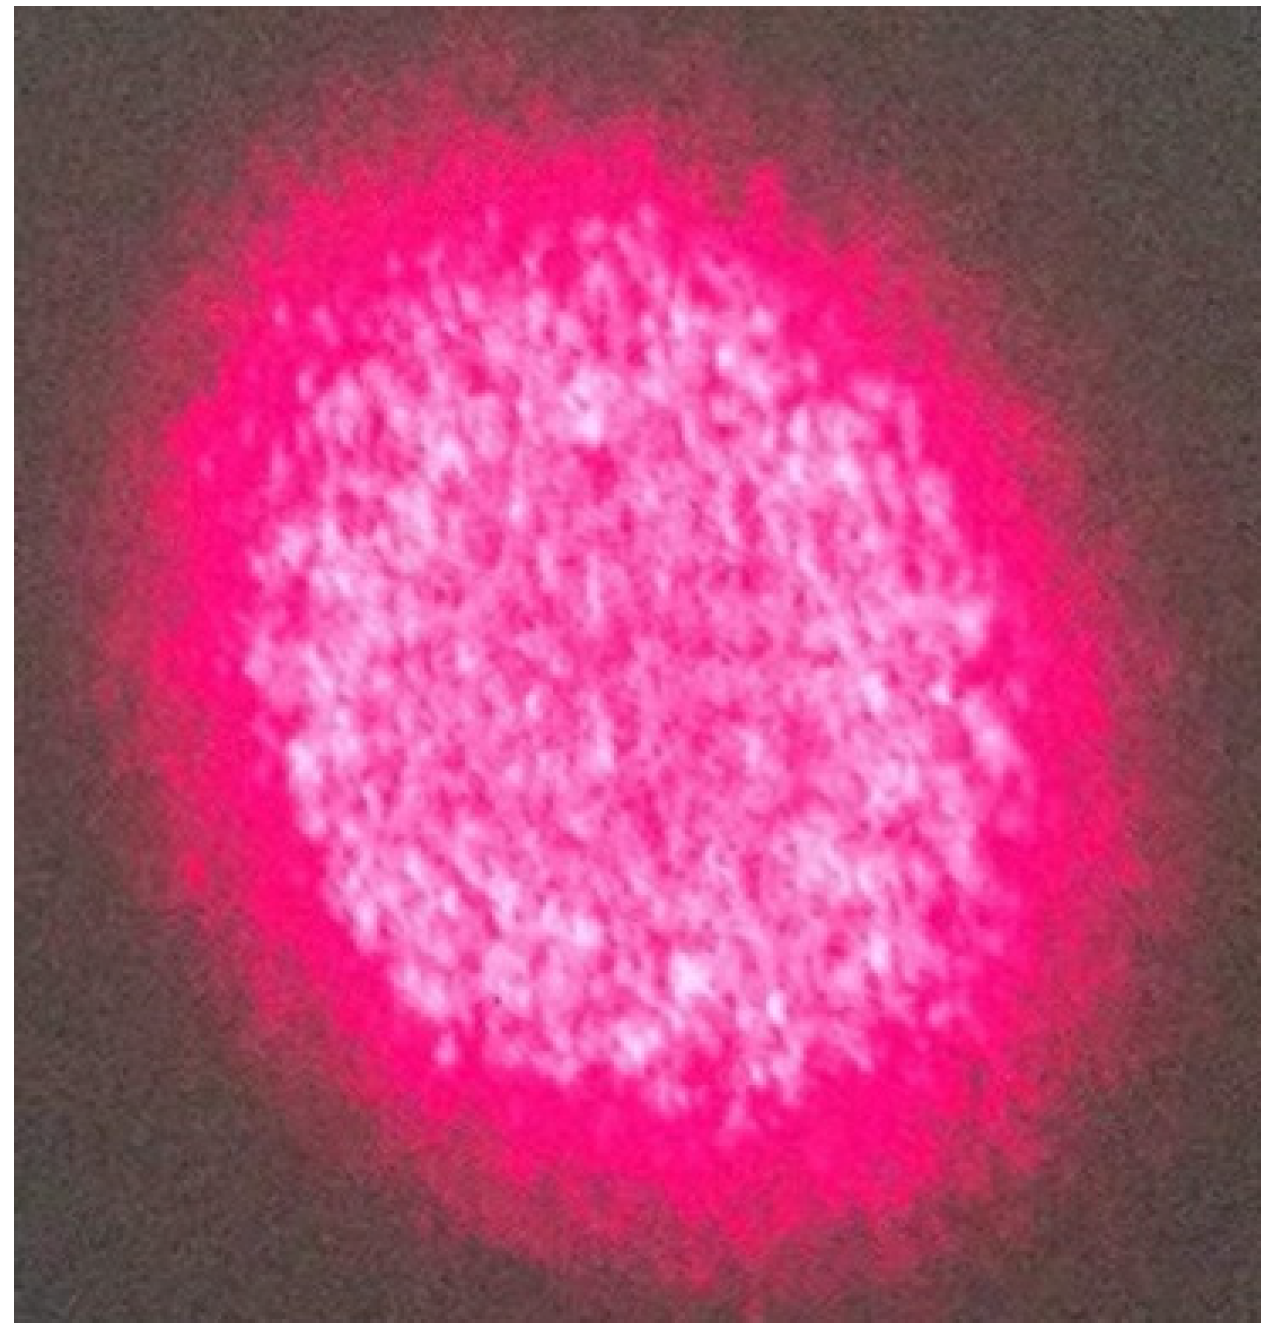
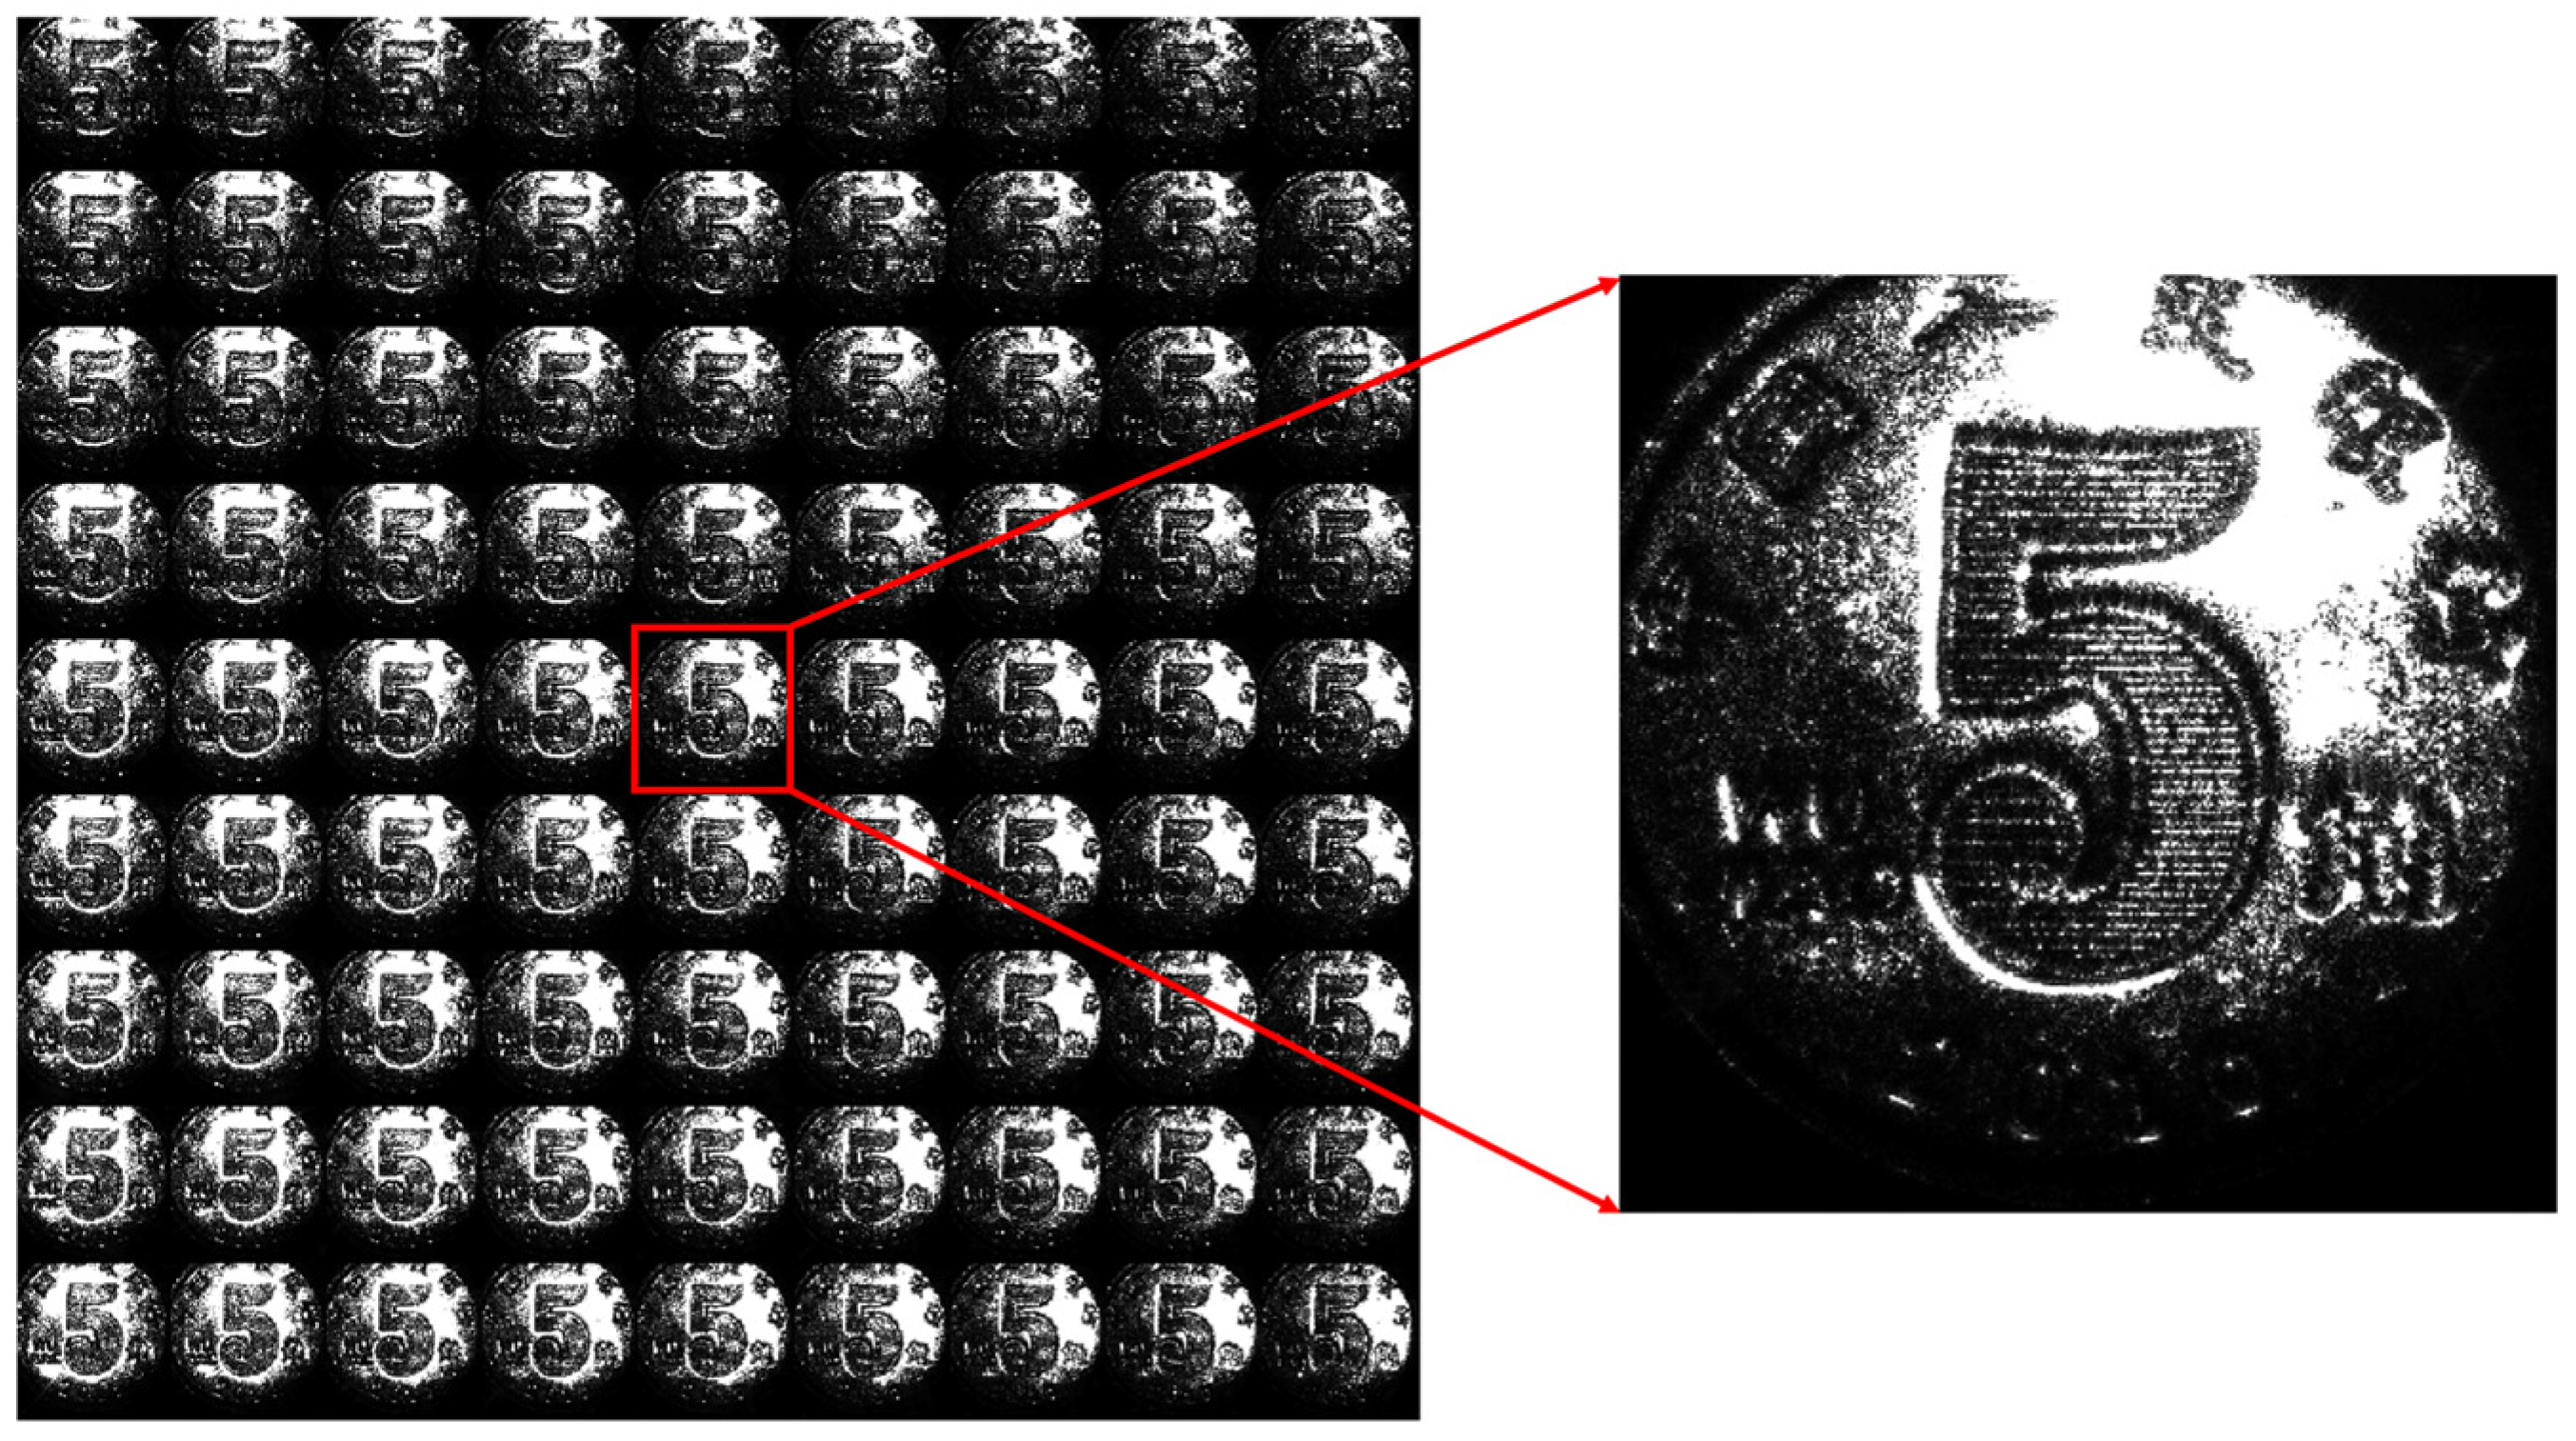
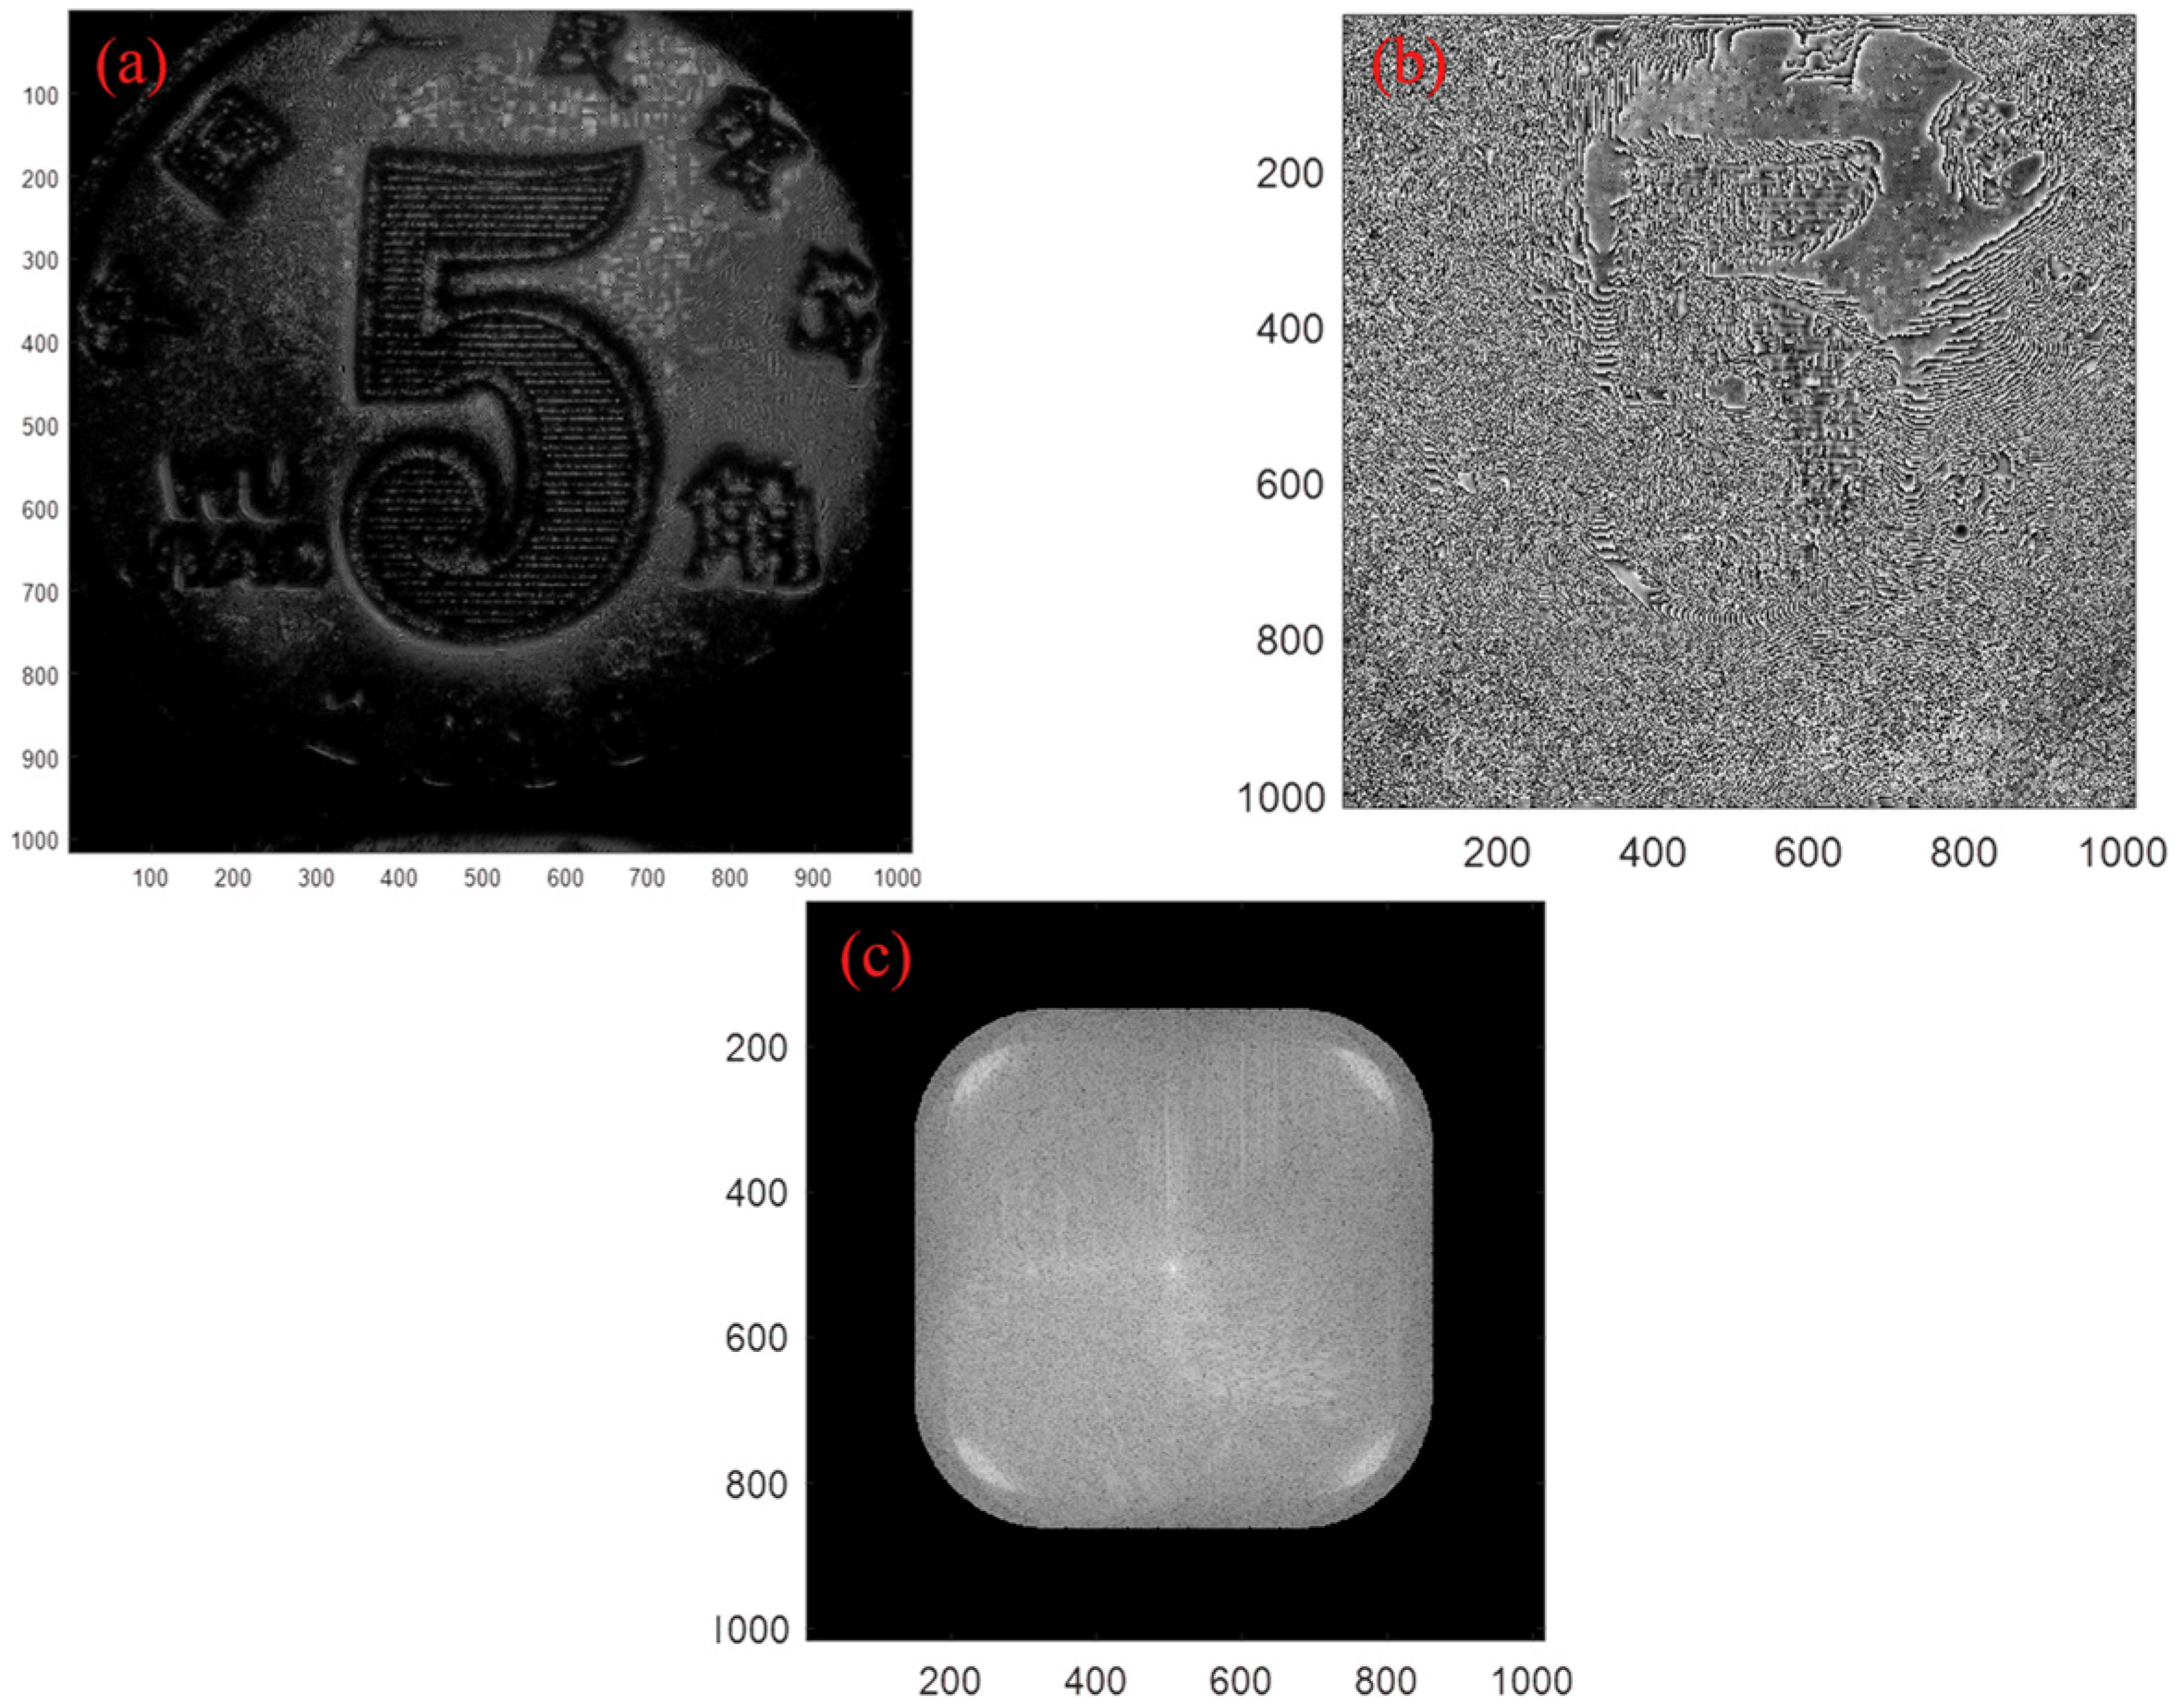
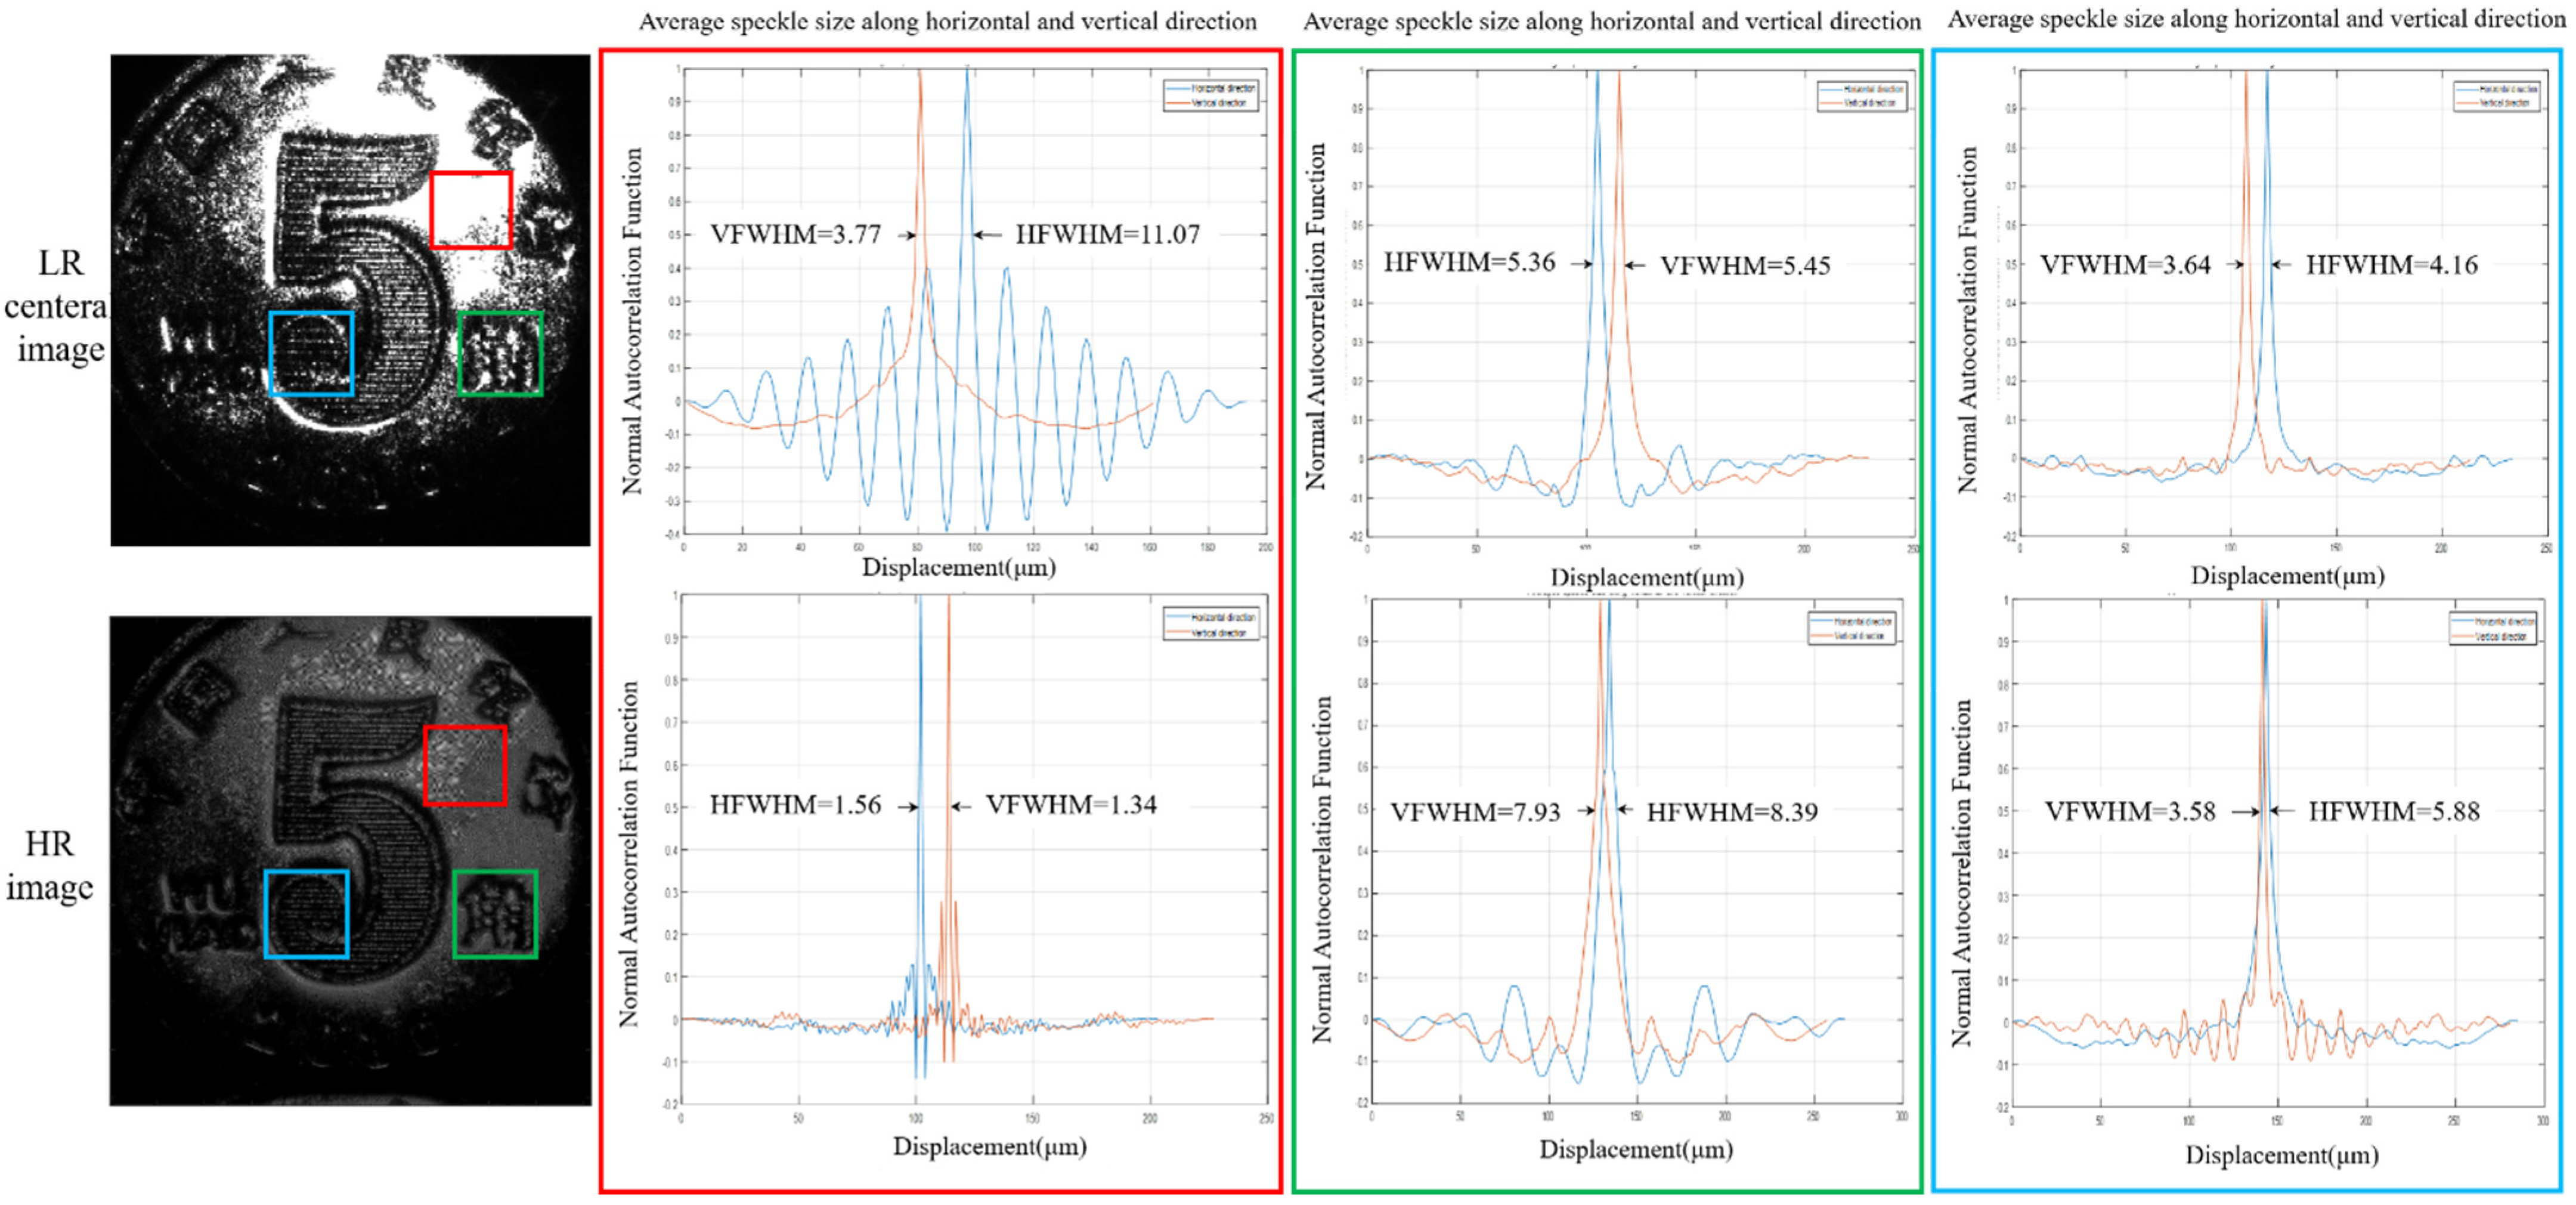
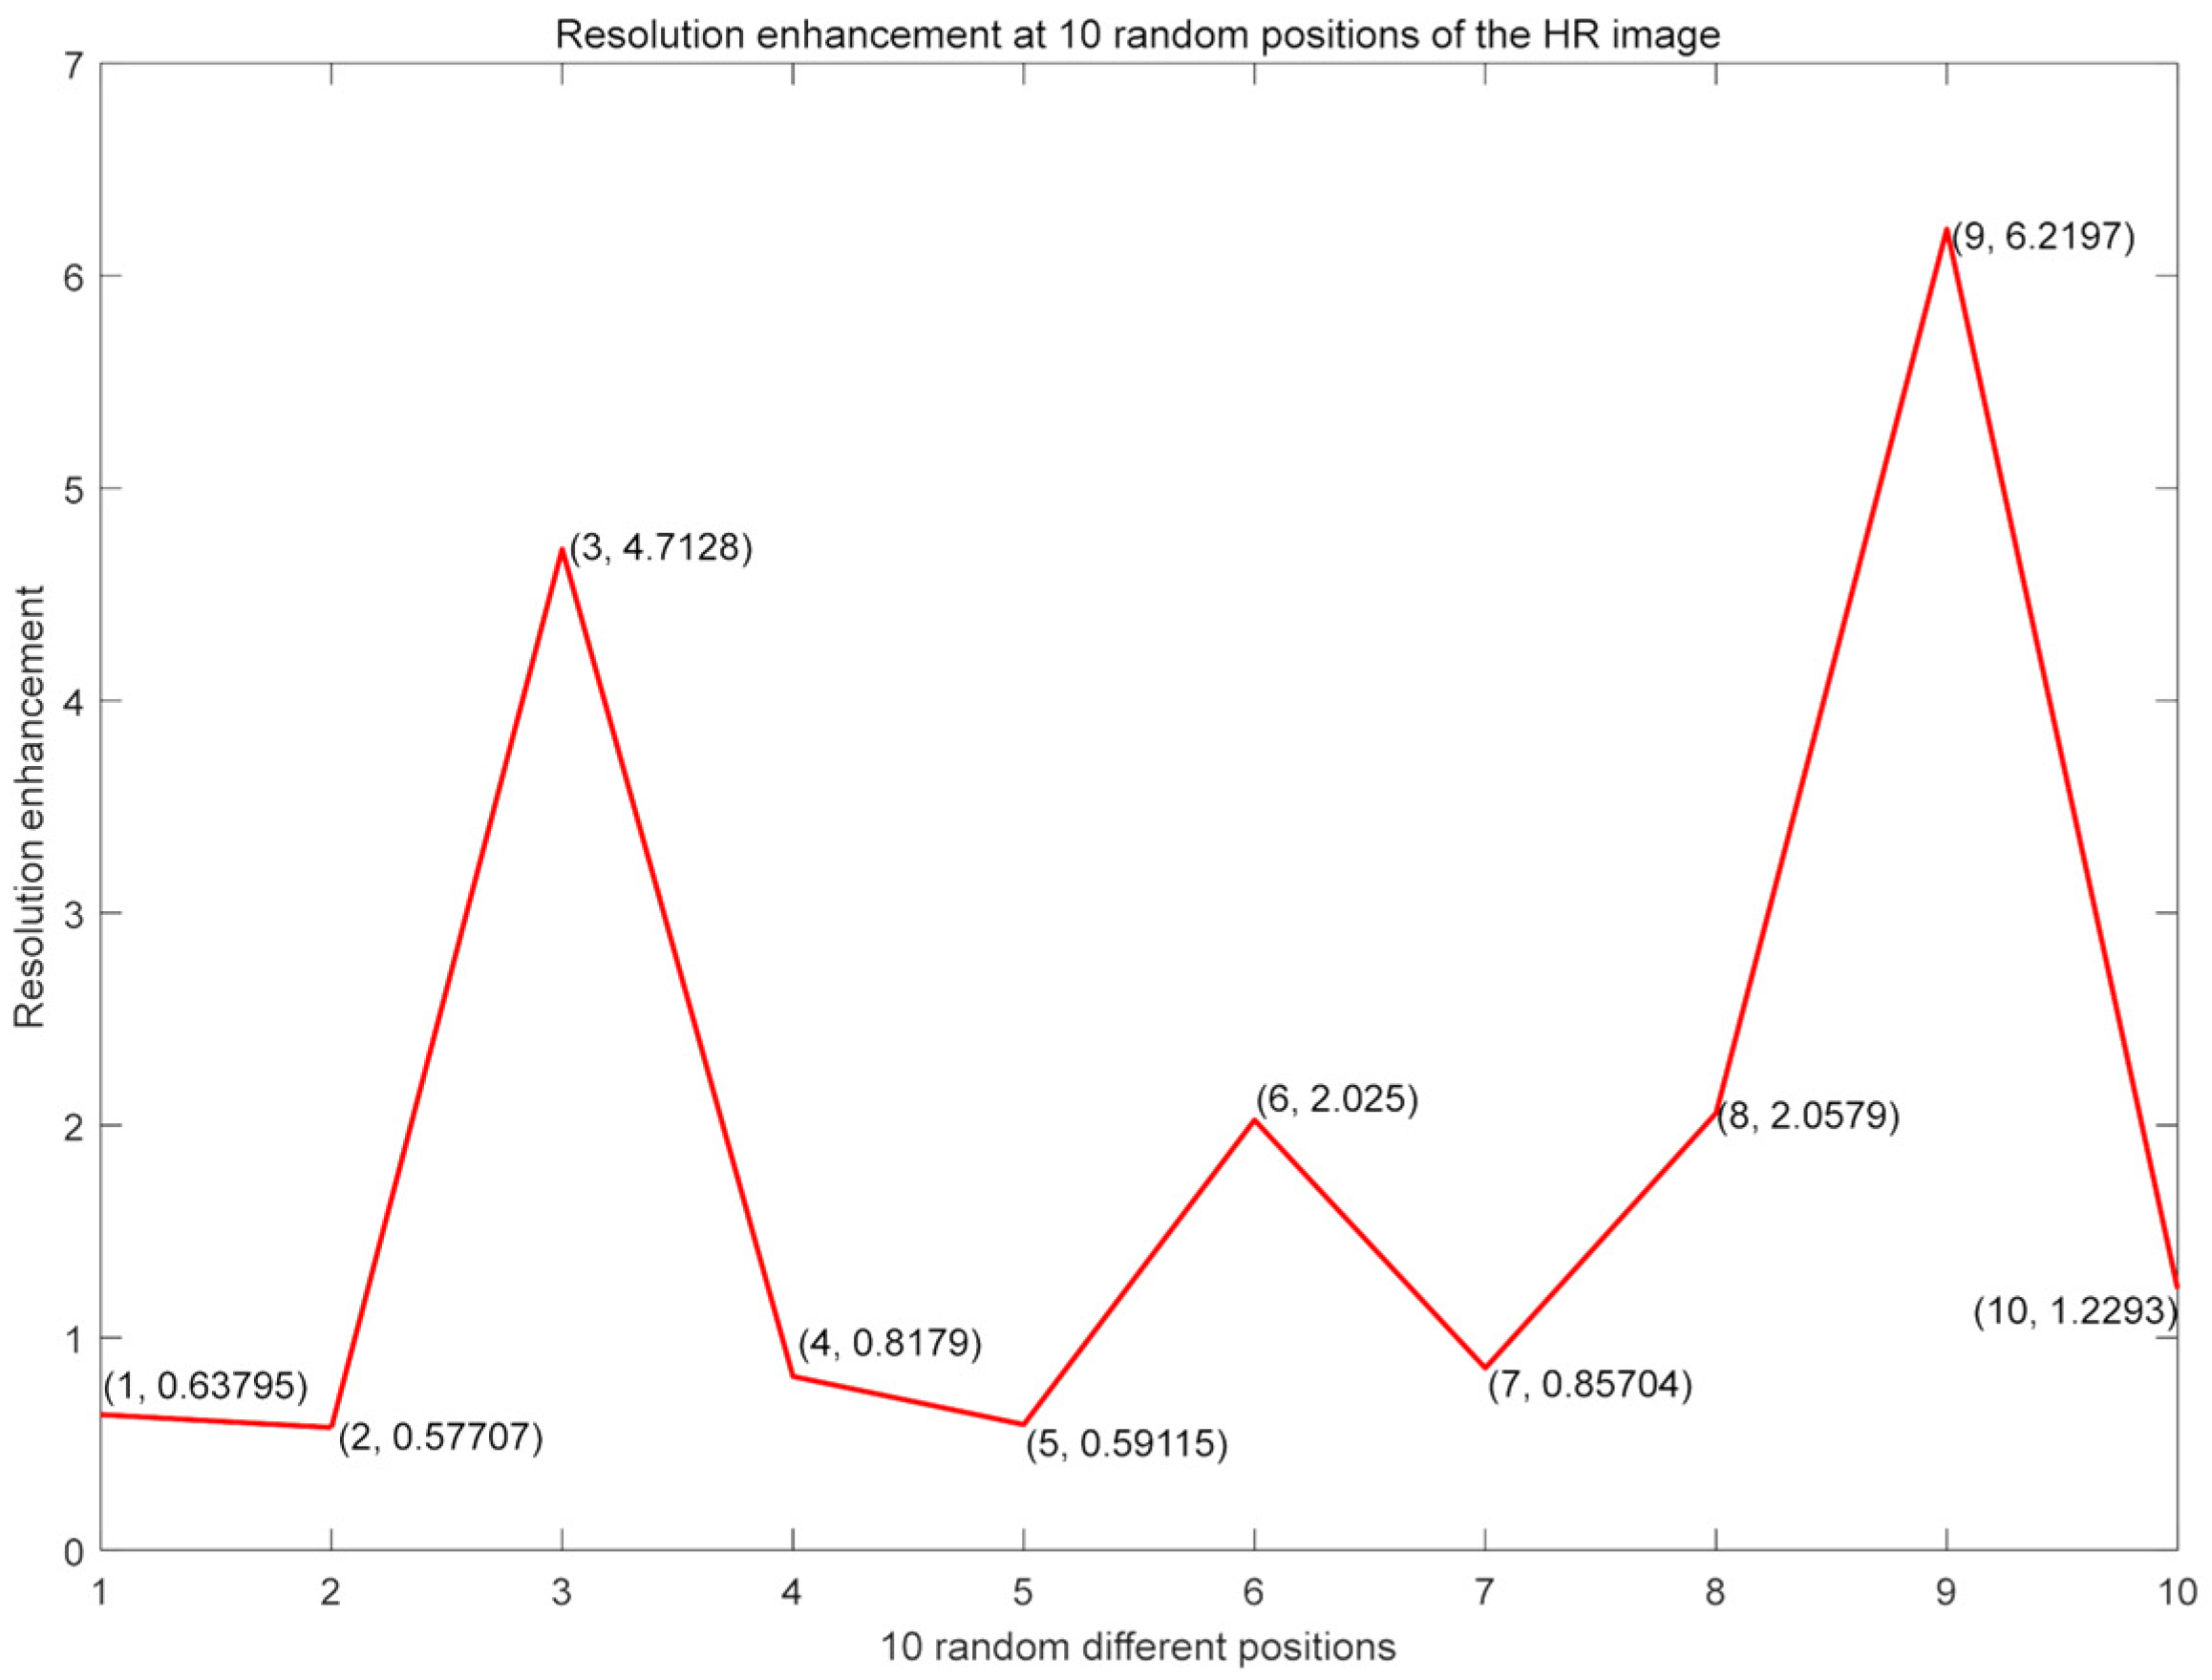
3.3.2. Speckle Imaging Analysis
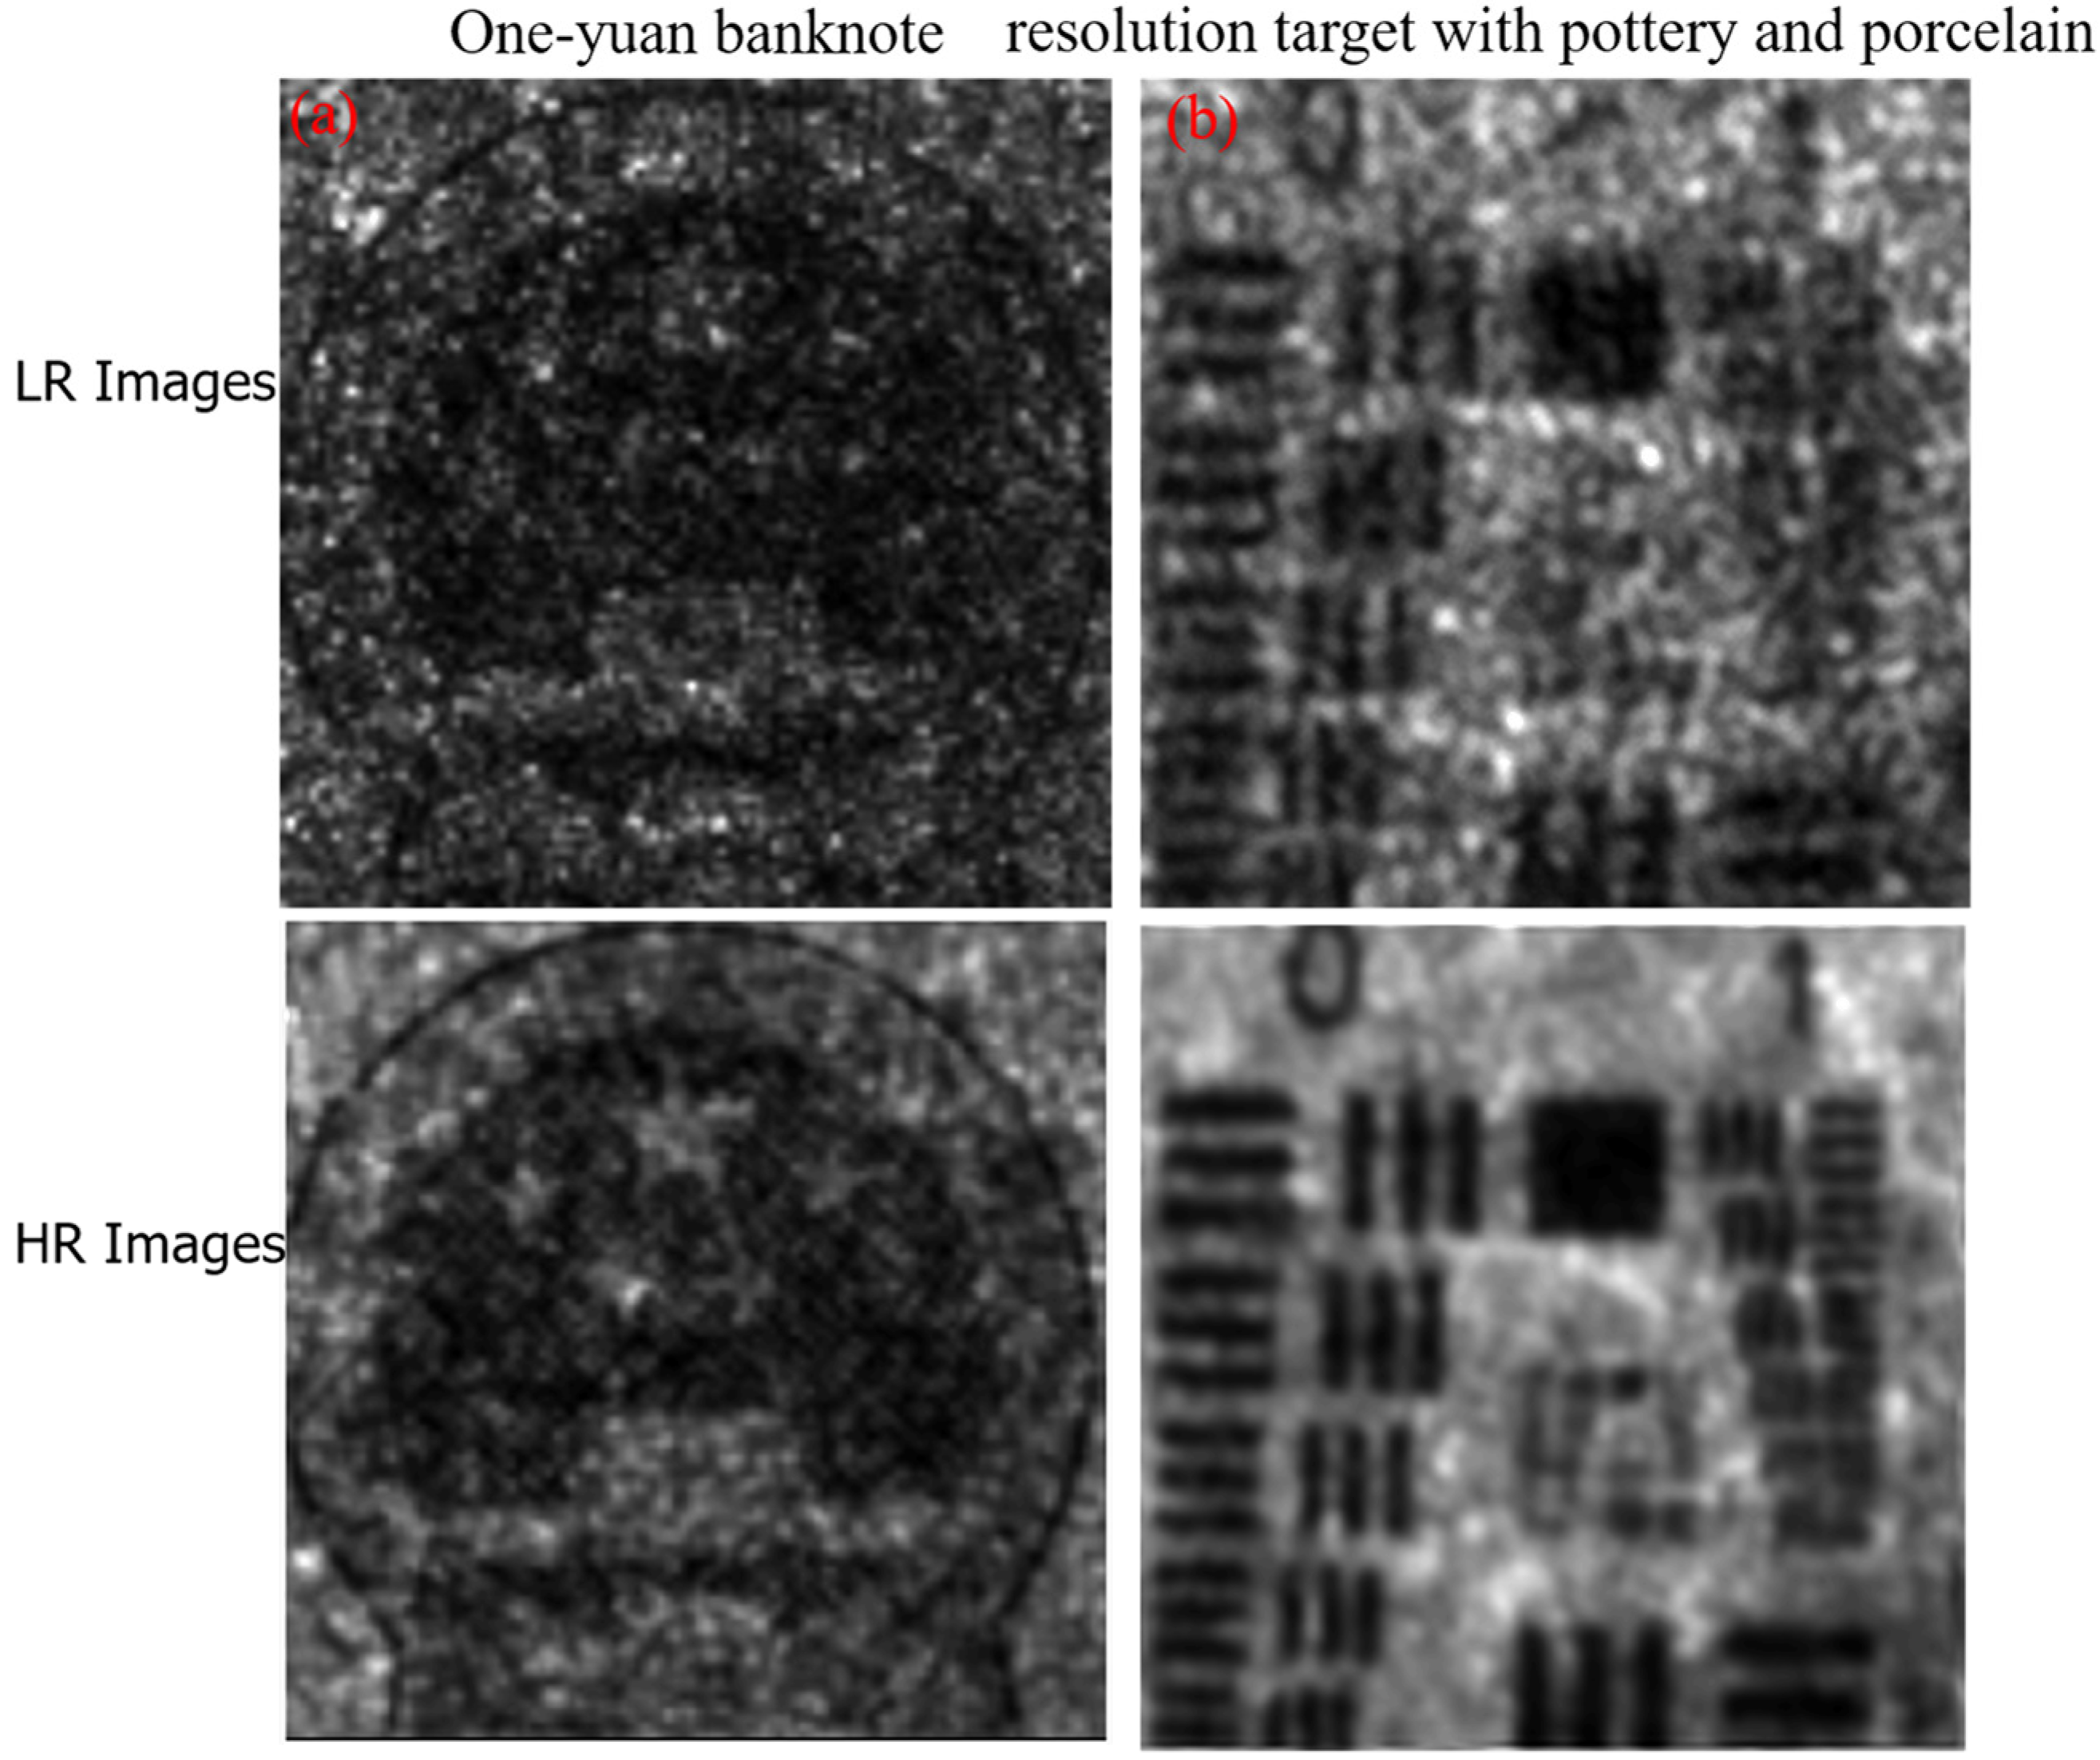
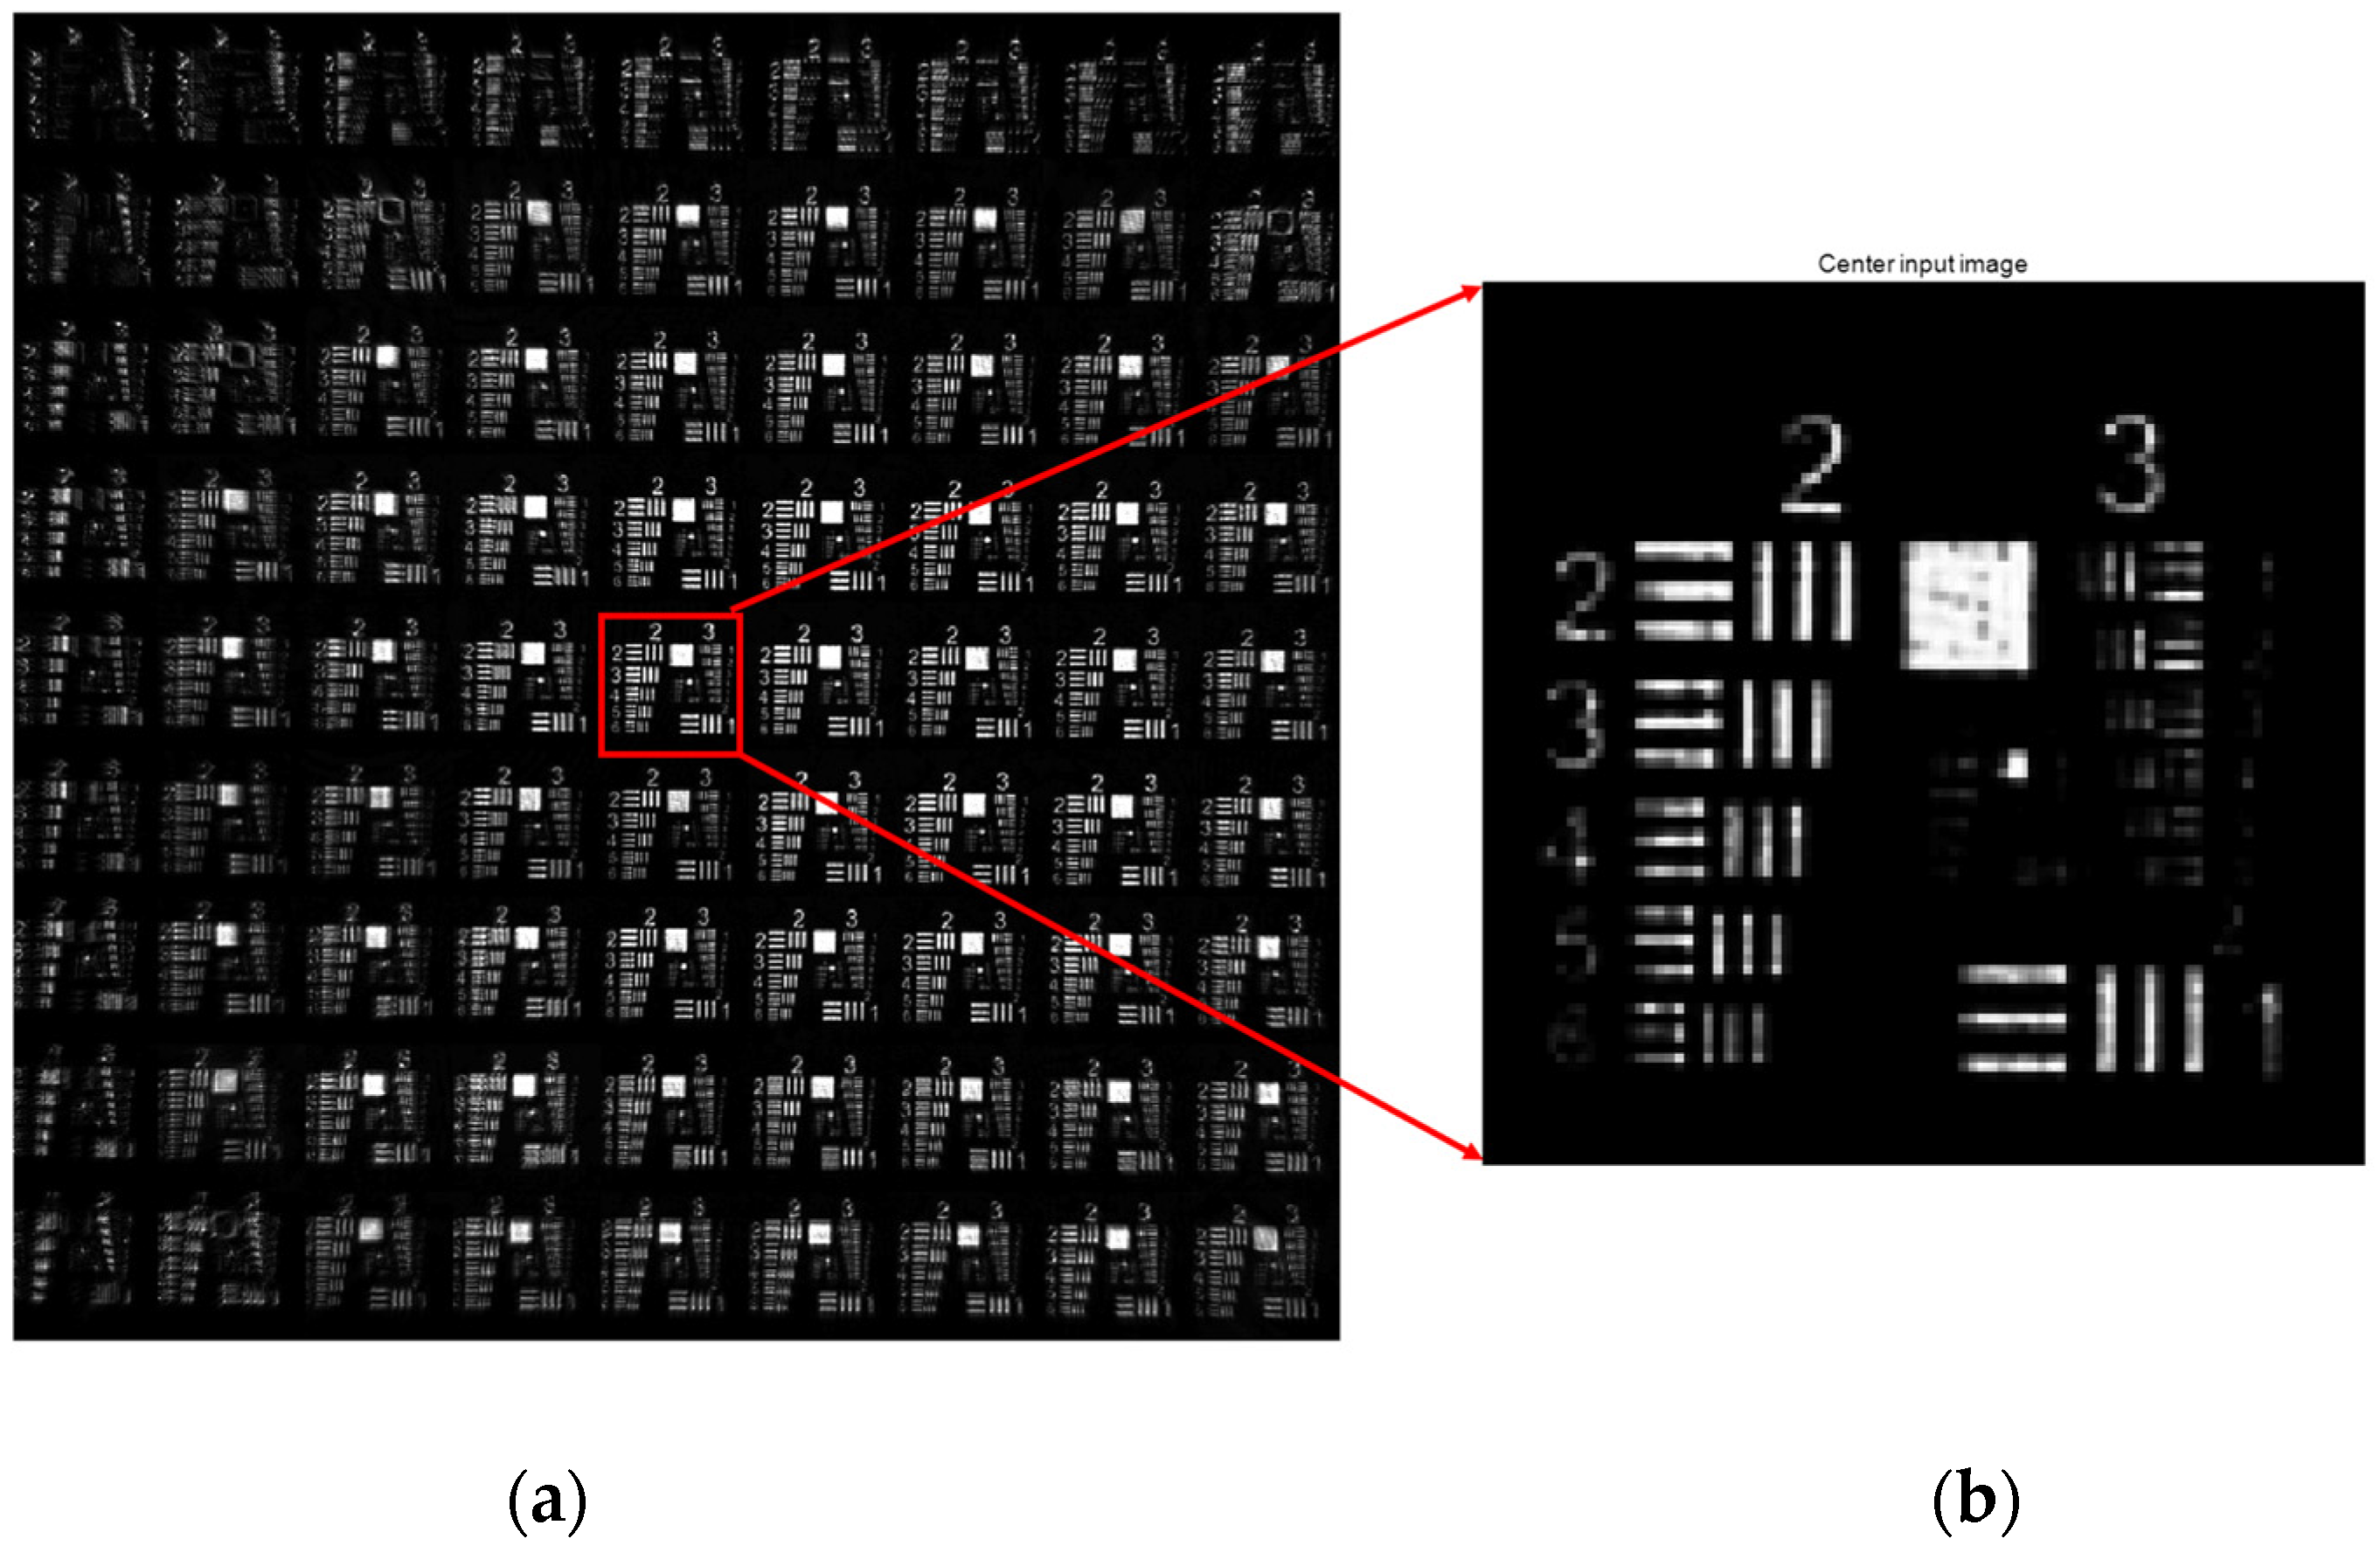
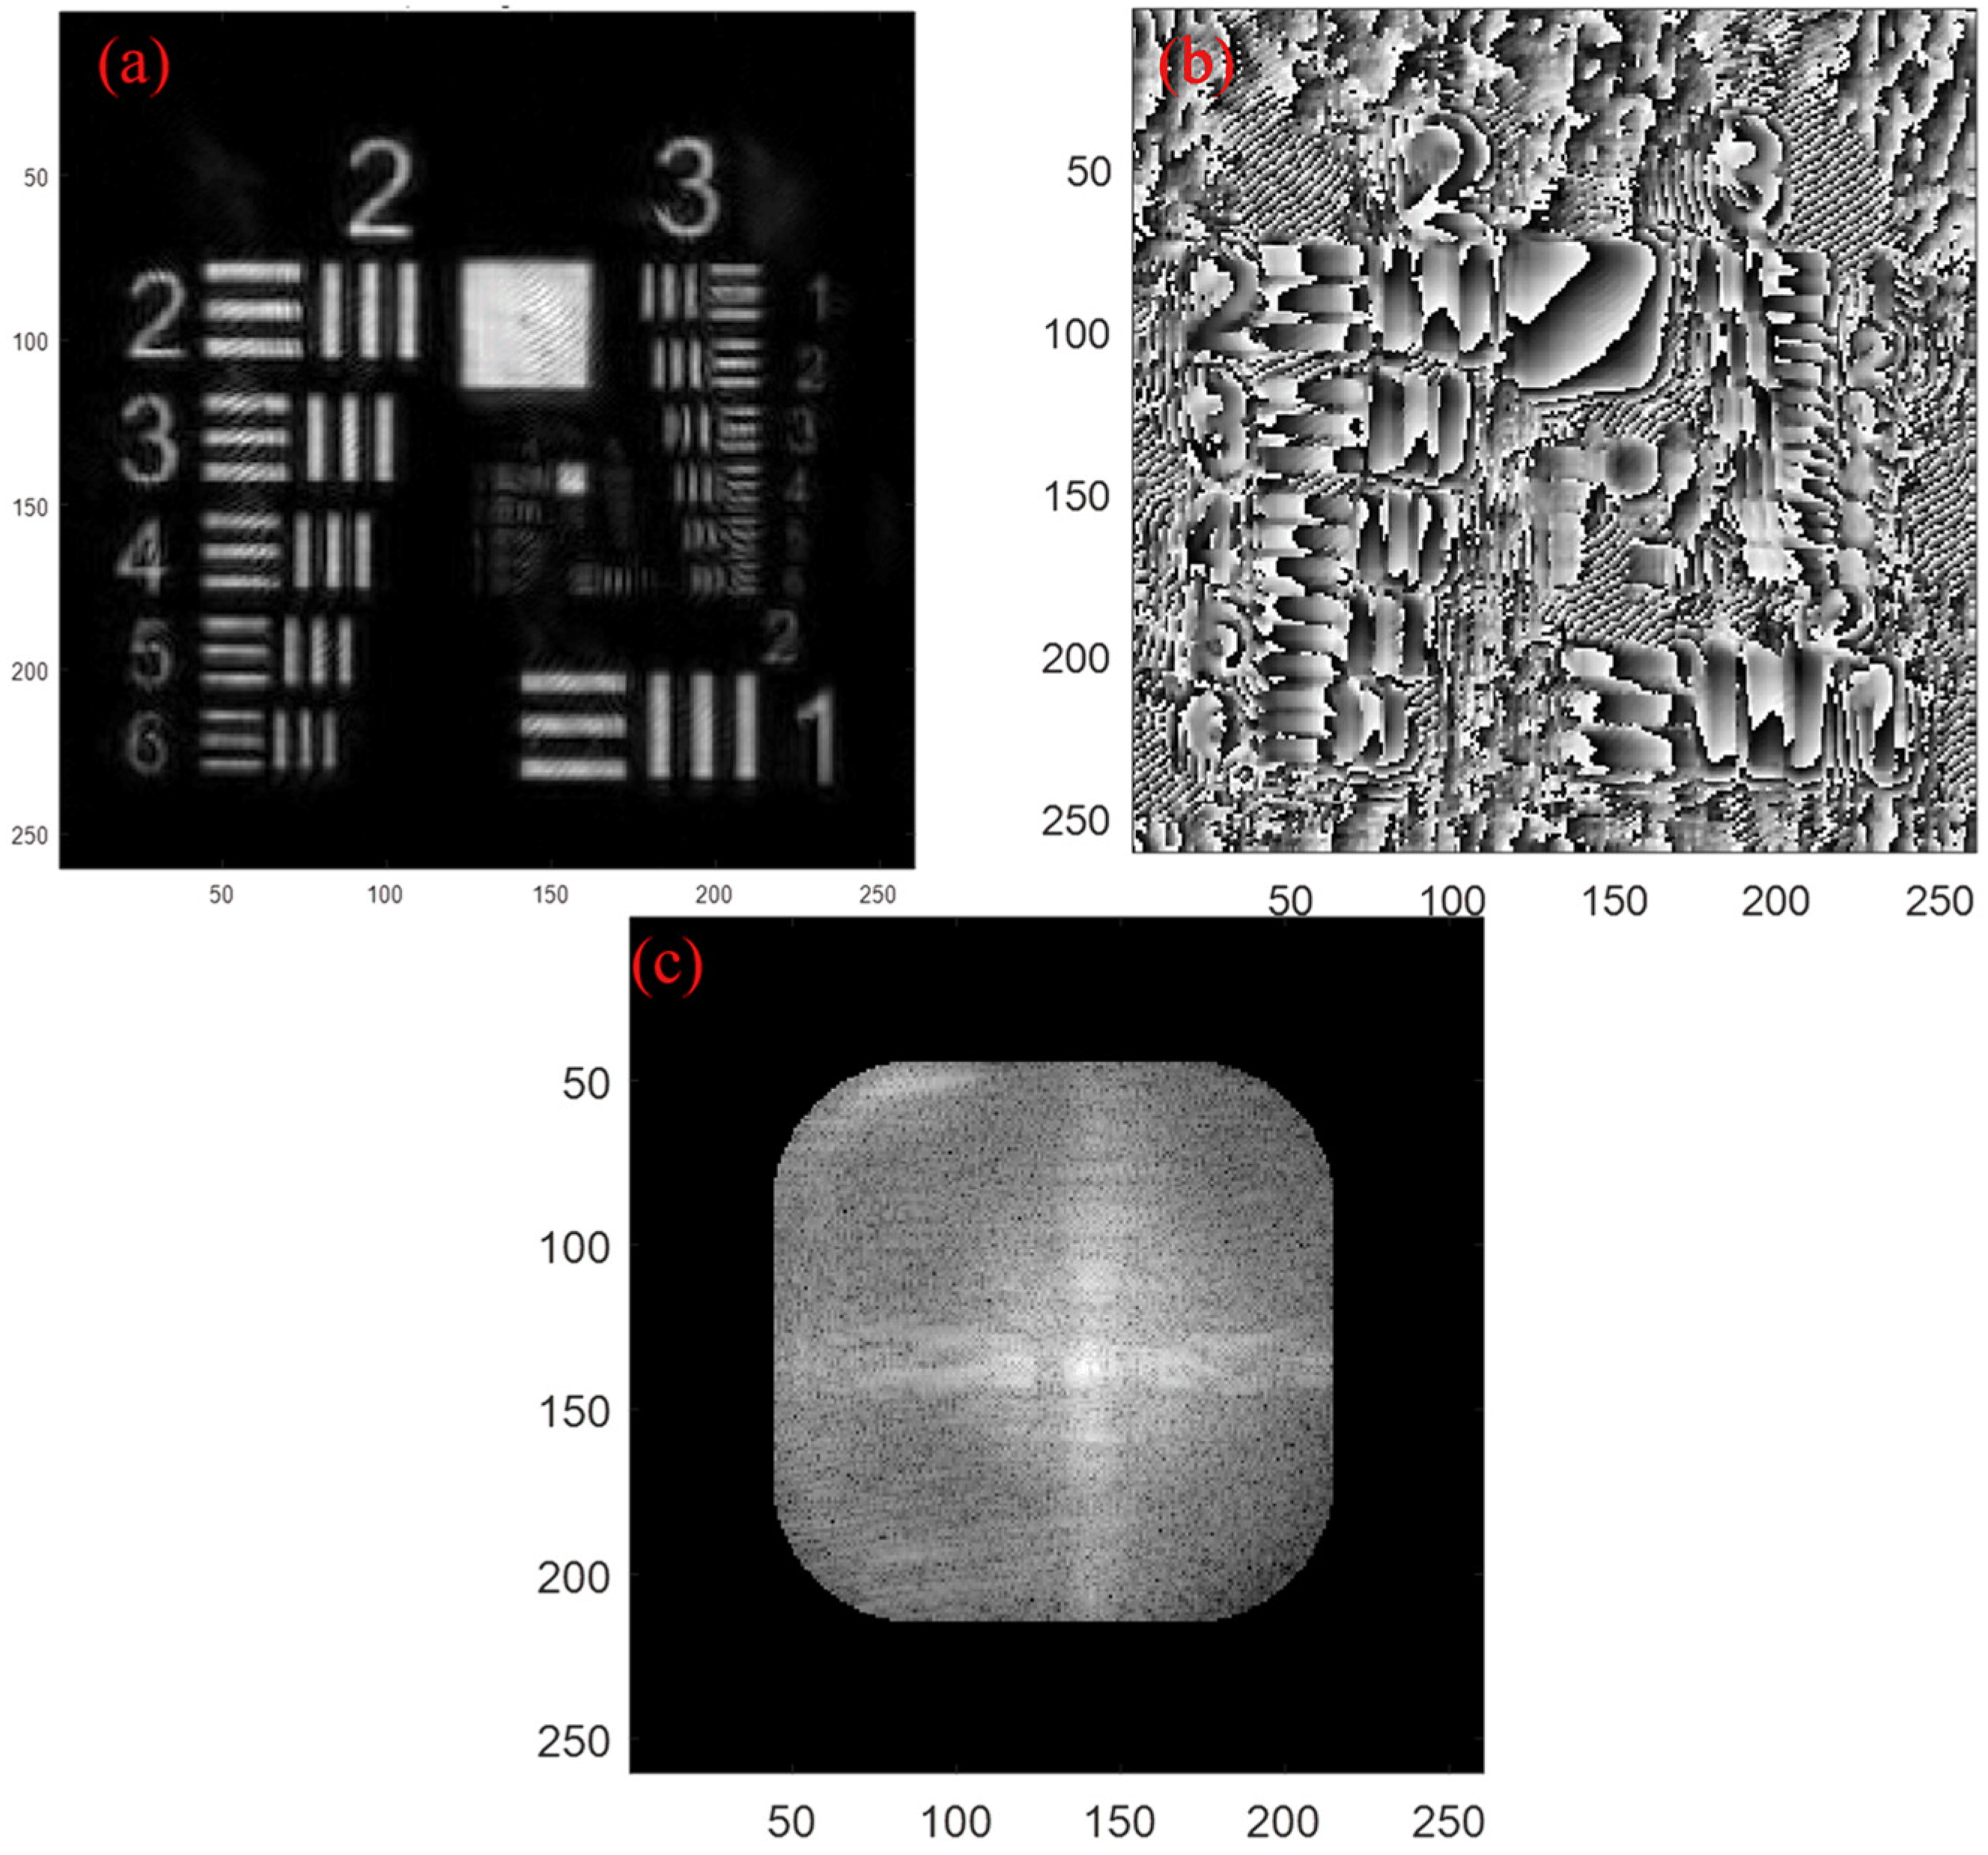
3.3.3. Verification Results with USAF Resolution Target
4. Discussion
4.1. FP and Passive Incoherent Optical Synthetic Aperture Imaging technology
4.2. FP and Other Active Coherent Imaging Technologies
5. Conclusions
Author Contributions
Funding
Acknowledgments
Conflicts of Interest
References
- Meinel, A.B. Aperture Synthesis Using Independent Telescopes. Appl. Opt. 1970, 9, 2501. [Google Scholar] [CrossRef] [PubMed]
- Available online: https://www.tmt.org/ (accessed on 7 November 2021).
- Available online: https://www.jwst.nasa.gov/ (accessed on 7 November 2021).
- Available online: https://instrumentation.tamu.edu/instruments/gmt/ (accessed on 7 November 2021).
- Duncan, A.; Sigler, R.; Kendrick, R.; Paxman, R.G. The Multi Aperture Imaging Array. Opt. IR Interferom. Ground Space 2014, 194, 278–285. [Google Scholar]
- James, C.M., IV. Space Interferometry Mission (SIM): Overview and Current Status’ Interferometry in Space. Proc. SPIE 2003, 4852, 1–15. [Google Scholar] [CrossRef]
- Peters, R.D.; Lawson, P.R.; Lay, O.P. TPF-I Technology Milestone #1 Report: Amplitude and Phase Control Demonstration; Jet Propulsion Laboratory: Pasadena, CA, USA, 2007. [Google Scholar]
- Scharf, D.P.; Lawson, P.R. TPF-I Technology Milestone #2 Report: Amplitude and Phase Control Demonstration; Jet Propulsion Laboratory: Pasadena, CA, USA, 2008. [Google Scholar]
- Peters, R.D.; Gappinger, R.O. TPF-I Technology Milestone #3 Report: Broadband Starlight Suppression Demonstration; Jet Propulsion Laboratory: Pasadena, CA, USA, 2009. [Google Scholar]
- Zheng, G.; Horstmeyer, R.; Yang, C. Wide-field, high-resolution Fourier ptychographic microscopy. Nat. Photonics 2013, 7, 739–745. [Google Scholar] [CrossRef] [PubMed]
- Guo, K.; Bian, Z.; Dong, S.; Nanda, P.; Wang, Y.; Zheng, G. Microscopy illumination engineering using a low-cost liquid crystal display. Biomed. Opt. Express 2015, 6, 574–579. [Google Scholar] [CrossRef]
- Ou, X.; Zheng, G.; Yang, C. Embedded pupil function recovery for Fourier ptychographic microscopy. Opt. Express 2014, 22, 4960–4972. [Google Scholar] [CrossRef]
- Tian, L.; Li, X.; Ramchandran, K.; Waller, L. Multiplexed coded illumination for Fourier ptychography with an LED array microscope. Biomed. Opt. Express 2014, 5, 2376–2389. [Google Scholar] [CrossRef] [Green Version]
- Ou, X.; Chung, J.; Horstmeyer, R.; Yang, C. Aperture scanning Fourier ptychographic microscopy. Biomed. Opt. Express 2016, 7, 3140. [Google Scholar] [CrossRef] [Green Version]
- Bian, L.; Suo, J.; Zheng, G.; Guo, K.; Chen, F.; Dai, Q. Fourier ptychographic reconstruction using Wirtinger flow optimization. Opt. Express 2015, 23, 4856–4866. [Google Scholar] [CrossRef]
- Bian, L.; Suo, J.; Chung, J.; Ou, X.; Yang, C.; Chen, F.; Dai, Q. Fourier ptychographic reconstruction using Poisson maximum likelihood and truncated Wirtinger gradient. Sci. Rep. 2016, 6, 27384. [Google Scholar] [CrossRef] [Green Version]
- Dong, S.; Horstmeyer, R.; Shiradkar, R.; Guo, K.; Ou, X.; Bian, Z.; Xin, H.; Zheng, G. Aperture-scanning Fourier ptychography for 3D refocusing and super-resolution macroscopic imaging. Opt. Express 2014, 22, 13586–13599. [Google Scholar] [CrossRef] [PubMed]
- Holloway, J.; Asif, S.; Sharma, M.; Matsuda, N.; Horstmeyer, R.; Cossairt, O.; Veeraraghavan, A. Toward long-distance subdiffraction imaging using coherent camera arrays. IEEE Trans. Comput. Imaging 2016, 2, 251–265. [Google Scholar] [CrossRef]
- Holloway, J.; Wu, Y.; Sharma, M.; Cossairt, O.; Veeraraghavan, A. SAVI: Synthetic apertures for long-range, subdiffraction-limited visible imaging using Fourier ptychography. Sci. Adv. 2017, 3, e1602564. [Google Scholar] [CrossRef] [PubMed] [Green Version]
- Lin, H.; Yu, P. Speckle mechanism in holographic optical imaging. Opt. Express 2007, 15, 16322–16327. [Google Scholar] [CrossRef]
- Piederrière, Y.; Meur, J.L.; Cariou, J.; Abgrall, J.; Blouch, M. Particle aggregation monitoring by speckle size measurement; application to blood platelets aggregation. Opt. Express 2004, 12, 4596–4601. [Google Scholar] [CrossRef]
- Idell, P.S.; Fienup, J.R.; Goodman, R.S. Image synthesis from nonimaged laser-speckle patterns. Opt. Lett. 1987, 12, 858–860. [Google Scholar] [CrossRef] [Green Version]
- Cederquist, J.N.; Fienup, J.R.; Marron, J.C.; Paxman, R.G. Phase retrieval from experimental far-field speckle data. Opt. Lett. 1988, 13, 619–621. [Google Scholar] [CrossRef]
- Miao, J.; Charalambous, P.; Kirz, J.; Sayre, D. Extending the methodology of X-ray crystallography to allow imaging of micrometre-sized non-crystalline specimens. Nature 1999, 400, 342–344. [Google Scholar] [CrossRef]
- Marchesini, S.; He, H.; Chapman, H.N.; Hau-Riege, S.P.; Noy, A.; Howells, M.R.; Weierstall, U.; Spence, J.C.H. X-ray image reconstruction from a diffraction pattern alone. Phys. Rev. B 2003, 68, 1–5. [Google Scholar] [CrossRef] [Green Version]
- Goodman, J.W. Introduction to Fourier Optics, 3rd ed.; Roberts and Company Publishers: Greenwood, IN, USA, 2005. [Google Scholar]
- Goodman, J.W. Statistical Optics; John Willey & Sons Publishers: New York, NY, USA, 2015. [Google Scholar]
- Chen, P.; Qiu, J. Analysis of spatial coherence between laser modes. Chin. J. Quantum Electron. 1995, 12, 131–136. [Google Scholar]
- Wolff, L.B.; Boult, T.E. Constraining object features using a polarization reflectance model. IEEE Trans. Pattern Anal. Mach. Intell. 1991, 13, 635–657. [Google Scholar] [CrossRef]
- Fienup, J.R. Phase retrieval algorithms: A comparison. Appl. Opt. 1982, 21, 2758–2769. [Google Scholar] [CrossRef] [PubMed] [Green Version]
- Fienup, J.R. Reconstruction of a complex-valued object from the modulus of its Fourier transform using a support constraint. J. Opt. Soc. Am. A 1987, 4, 118–123. [Google Scholar] [CrossRef]


| Parameters | Values |
|---|---|
| Wavelength | 976 nm |
| Aperture diameter | 60 mm |
| Pixel size | 1.67 × 1.67 μm |
| Number of pixels | 3664 × 2748 |
| Working distance | 3310 mm |
| Realization Conditions | Resolution in the Same FOV | Phase Retrieve | Time Resolution | SNR | Working Distance | Effect of Atmospheric Disturbance | |
|---|---|---|---|---|---|---|---|
| SADH | Strict (Need interference) | HR (<5×) | Accurate | High | High | Long-distance | Strong |
| ICIT | Loose | LR | No | Low | Low | Long-distance | weak |
| SCIT | Loose (No interference) | LR | No | Low | Low | Long-distance | weak |
| FP | Loose (No interference) | HR (>5×) | Accurate | High | High | Long-distance | weak |
Publisher’s Note: MDPI stays neutral with regard to jurisdictional claims in published maps and institutional affiliations. |
© 2022 by the authors. Licensee MDPI, Basel, Switzerland. This article is an open access article distributed under the terms and conditions of the Creative Commons Attribution (CC BY) license (https://creativecommons.org/licenses/by/4.0/).
Share and Cite
Yang, M.; Fan, X.; Wang, Y.; Zhao, H. Experimental Study on the Exploration of Camera Scanning Reflective Fourier Ptychography Technology for Far-Field Imaging. Remote Sens. 2022, 14, 2264. https://0-doi-org.brum.beds.ac.uk/10.3390/rs14092264
Yang M, Fan X, Wang Y, Zhao H. Experimental Study on the Exploration of Camera Scanning Reflective Fourier Ptychography Technology for Far-Field Imaging. Remote Sensing. 2022; 14(9):2264. https://0-doi-org.brum.beds.ac.uk/10.3390/rs14092264
Chicago/Turabian StyleYang, Mingyang, Xuewu Fan, Yuming Wang, and Hui Zhao. 2022. "Experimental Study on the Exploration of Camera Scanning Reflective Fourier Ptychography Technology for Far-Field Imaging" Remote Sensing 14, no. 9: 2264. https://0-doi-org.brum.beds.ac.uk/10.3390/rs14092264