Article

Research on Generalized RQD of Rock Mass Based on 3D Slope Model Established by Digital Close-Range Photogrammetry

1
College of Geo-Exploration Science and Technology, Jilin University, Changchun 130026, China
2
State Key Laboratory of Information Engineering in Surveying, Mapping and Remote Sensing, Wuhan University, Wuhan 430079, China
3
College of Construction Engineering, Jilin University, Changchun 130026, China
*
Author to whom correspondence should be addressed.
Submission received: 13 March 2022 / Revised: 1 May 2022 / Accepted: 4 May 2022 / Published: 9 May 2022

Abstract

:
The traditional method of obtaining rock quality designation (RQD) cannot fully reflect the anisotropy of the rock mass and thus cannot accurately reflect its quality. In the method of calculating RQD based on three-dimensional network simulation of discontinuities, due to the limited number of samples and low accuracy of discontinuity data obtained by manual contact measurement, a certain deviation in the network is generated based on the data, which has an impact on the calculation result. Taking a typical slope in Dongsheng quarry in Changchun City as an example, in this study, we obtained the discontinuity data of the slope based on digital close-range photogrammetry, which greatly enlarged the sample size of discontinuity data and improved the data quality. Based on the heterogeneity of the rock mass, the optimum threshold of discontinuity spacing was determined when surveying lines were laid parallel to different coordinate axes to calculate the generalized RQD, and the influence of measuring blank areas on the slope caused by vegetation coverage or gravel accumulation was eliminated. The real generalized RQD of the rock mass after eliminating the influence of blank areas was obtained. Experiments showed that, after eliminating the influence of blank areas, the generalized RQD of the slope rock mass more truly represented the complete quality of rock mass and offers a new idea for the quality evaluation of engineering rock mass.

1. Introduction

After geological processes of different stages and scales, discontinuities are formed and widely distributed in the rock mass. Unlike complete rock blocks, the random distribution of a large number of discontinuities in the rock mass makes it have anisotropy and heterogeneity, and then affects its overall quality. For a long time, based on rock mass outcrop and limited boreholes, some achievements have been made in the research on rock mass quality, such as the RMR rock mass engineering classification system [1,2], the Q classification system [3], and slope mass rating [4,5]. Rock quality designation (RQD), an important scoring parameter in these classification systems, is widely used in the construction of underground, water conservancy, hydropower, transportation, slope, rock mass, and other projects, playing an increasingly important role [6,7,8,9,10].
Deere [11] first proposed RQD, which is defined as the ratio of the cumulative sum of the length of a core segment greater than 100 mm in the core (obtained by drilling with a bit and core tube) to the length of the whole core segment, expressed as a percentage. However, the traditional method of calculating RQD from drilling data has some shortcomings [12,13,14,15,16]:
(1) When the length of each core section in the first rock mass obtained by using a drill bit and core pipe is 99 mm, the RQD value calculated by the traditional method is 0. Similarly, when the length of each core section in the second rock mass is 101 mm, the RQD value calculated by the traditional method is 100%. Through comparison, it can be seen that the integrity of these two rock masses does not differ much, but the RQD calculated by the traditional method is quite different, which is not in line with the actual situation.
(2) Because of the anisotropy and heterogeneity of the rock mass, the RQD value obtained by the traditional method will change with changes in the number, location, and direction of drilling holes, which does not well reflect the overall quality of the rock mass and has certain defects.
The main characteristics, research status, and development trends of RQD have been summarized [17,18], and volume RQD has been defined and corresponding formulas have been deduced [19,20,21]. To solve the problem of inaccurate RQD calculation caused by an insufficient number of boreholes by the traditional method, studies effectively used computers to lay out surveying lines instead of drilling holes, and realized network simulation of discontinuities [22,23]. Based on the method of simulating network discontinuities, Harrison [24] adjusted the spacing threshold of RQD calculation, obtained the generalized RQD of rock mass within different thresholds, and solved the single standard problem of the traditional RQD calculation method. Zheng et al. [25] improved the traditional RQD calculation method by taking into account the joint direction and the degree of rock mass failure, which can accurately describe the quality of rock mass in more detail. The disadvantage of simulating the network is that field data acquisition requires more manpower and material resources.
Based on the traditional manual technique of using tape measure and compass to measure discontinuities in the height of a limited measuring window, the two-dimensional trace length, orientation, and spacing of discontinuities are obtained, and then a simulation of network discontinuities is carried out to calculate the RQD based on this simulation. Because the number of discontinuity samples collected by the manual windowing method is less than that of the slope panoramic outcrop, the sample accuracy is poor, and the network model based on fewer samples has a large deviation [26], which affects the calculation results of RQD to a certain extent.
In view of the shortcomings of obtaining RQD based on simulating network discontinuities, Wang [27] proposed a method of using a field control survey combined with photogrammetry to establish a three-dimensional model of slope, and then obtain detailed information of discontinuities of rock mass. Compared with the traditional method of manual contact measurement, this method has higher efficiency and better accuracy. It can more comprehensively describe the three-dimensional information of discontinuities on a rock mass, and then obtain a more accurate RQD.
In addition, when obtaining the information of rock mass discontinuities, there is the problem of measurement blank areas on the surface of the rock mass due to vegetation coverage or the presence of gravel accumulation. The presence of these measurement blank areas makes the calculation result of RQD deviate to a certain extent, which affects the accuracy of rock mass quality evaluation.
Based on photogrammetry, the discontinuity information of a slope in the Dongsheng quarry of Changchun City was obtained, and a three-dimensional disk model of discontinuities was established. By setting ellipsoids to eliminate the influence of blank areas of discontinuity measurement, the generalized RQD of rock mass, which is based on the measured data of discontinuities and eliminates the influence of blank areas, was obtained with the surveying lines laid parallel to different coordinate axes. Compared with the RQD calculated before eliminating the influence of measurement blank areas, the comprehensive three-dimensional RQD of the rock mass calculated by weighting after eliminating such influence shows an obvious change and describes the complete quality of the rock mass more truthfully. This has important theoretical significance and engineering practicability.
RQD is an important index of rock mass quality classification, and inhomogeneity and anisotropy of rock mass make the RQD calculated by traditional core drilling deviate from the actual value. RQD obtained by three-dimensional network simulation is also affected by the limited information collected manually and the deviation of the network simulation model. Therefore, a three-dimensional model of a high and steep slope was established based on photogrammetry, and the three-dimensional trace and orientation information of discontinuities was measured. Then, the spatial distribution disks of discontinuities were established, and the spatial surveying lines were laid parallel to three coordinate axes. Furthermore, the generalized RQD calculation method of rock mass was proposed to eliminate the influence of measurement blank areas. Compared with the traditional drilling method and the generalized RQD algorithm based on three-dimensional network simulation, the generalized RQD calculation method in this paper greatly improves the quantity and quality of data sources, takes into account the influence of measurement blank areas, and makes the calculation more reliable. The contributions and innovations of this study are as follows:
(1) The three-dimensional model of a high and steep slope was established based on photogrammetry. Based on measuring the three-dimensional trace and orientation of the slope’s panoramic outcrop discontinuities, a spatial disk representation mode of rock mass discontinuity was proposed, laying a basis for generalized RQD calculation. Compared with three-dimensional network simulation based on manual windowing, RQD calculation based on measured three-dimensional photogrammetry data has the following advantages: the calculation is based on measured data, which reduces the accuracy limitation of 3D network simulation; the panoramic outcrop discontinuity data used in the calculation, which are distributed in the whole slope, are more representative; and the sample size is large, which makes the calculation results more reliable.
(2) Based on the spatial disks of high and steep slope discontinuities, and considering the complexity of discontinuity distribution, dense spatial surveying lines were arranged parallel to three coordinate axes to calculate RQD, and the influence of surveying line spacing on RQD was considered to analyze the optimal distance between surveying lines. By doing so, this study avoids the problem that it is difficult for the traditional drilling method to reflect the anisotropy of rock mass due to the direction limitation.
(3) In view of the measurement blank areas caused by vegetation cover or gravel accumulation on the slope, ellipsoids were proposed to fill in the blank areas of discontinuities on the high and steep slope. In addition, the generalized rock mass RQD calculation model was established to eliminate the influence of measurement blank areas, so that the calculated RQD would more truly represent the integrity of rock mass.
The rest of this paper is organized as follows: In Section 2, the general situation of the study area is presented. Then, the discontinuity information acquisition method based on digital close-range photogrammetry is introduced. The method of spatial disk representation of three-dimensional trace and orientation information extracted from rock mass discontinuity is presented. In addition, the ellipsoid filling method is proposed for the measurement blank areas generated by vegetation and gravel accumulation on the slope to reduce their influence on RQD calculation. In Section 3, the research process and results are described, including the representation of discontinuities on the study slope, the filling result of ellipsoids in the measurement blank areas, the analysis of optimal distance between surveying lines and discontinuity spacing threshold, and the calculation results of generalized RQD. In Section 4, the problems of photogrammetric data collection, ellipsoid filling, and surveying line arrangement in this study are discussed. Section 5 concludes this paper.

2. Materials and Methods
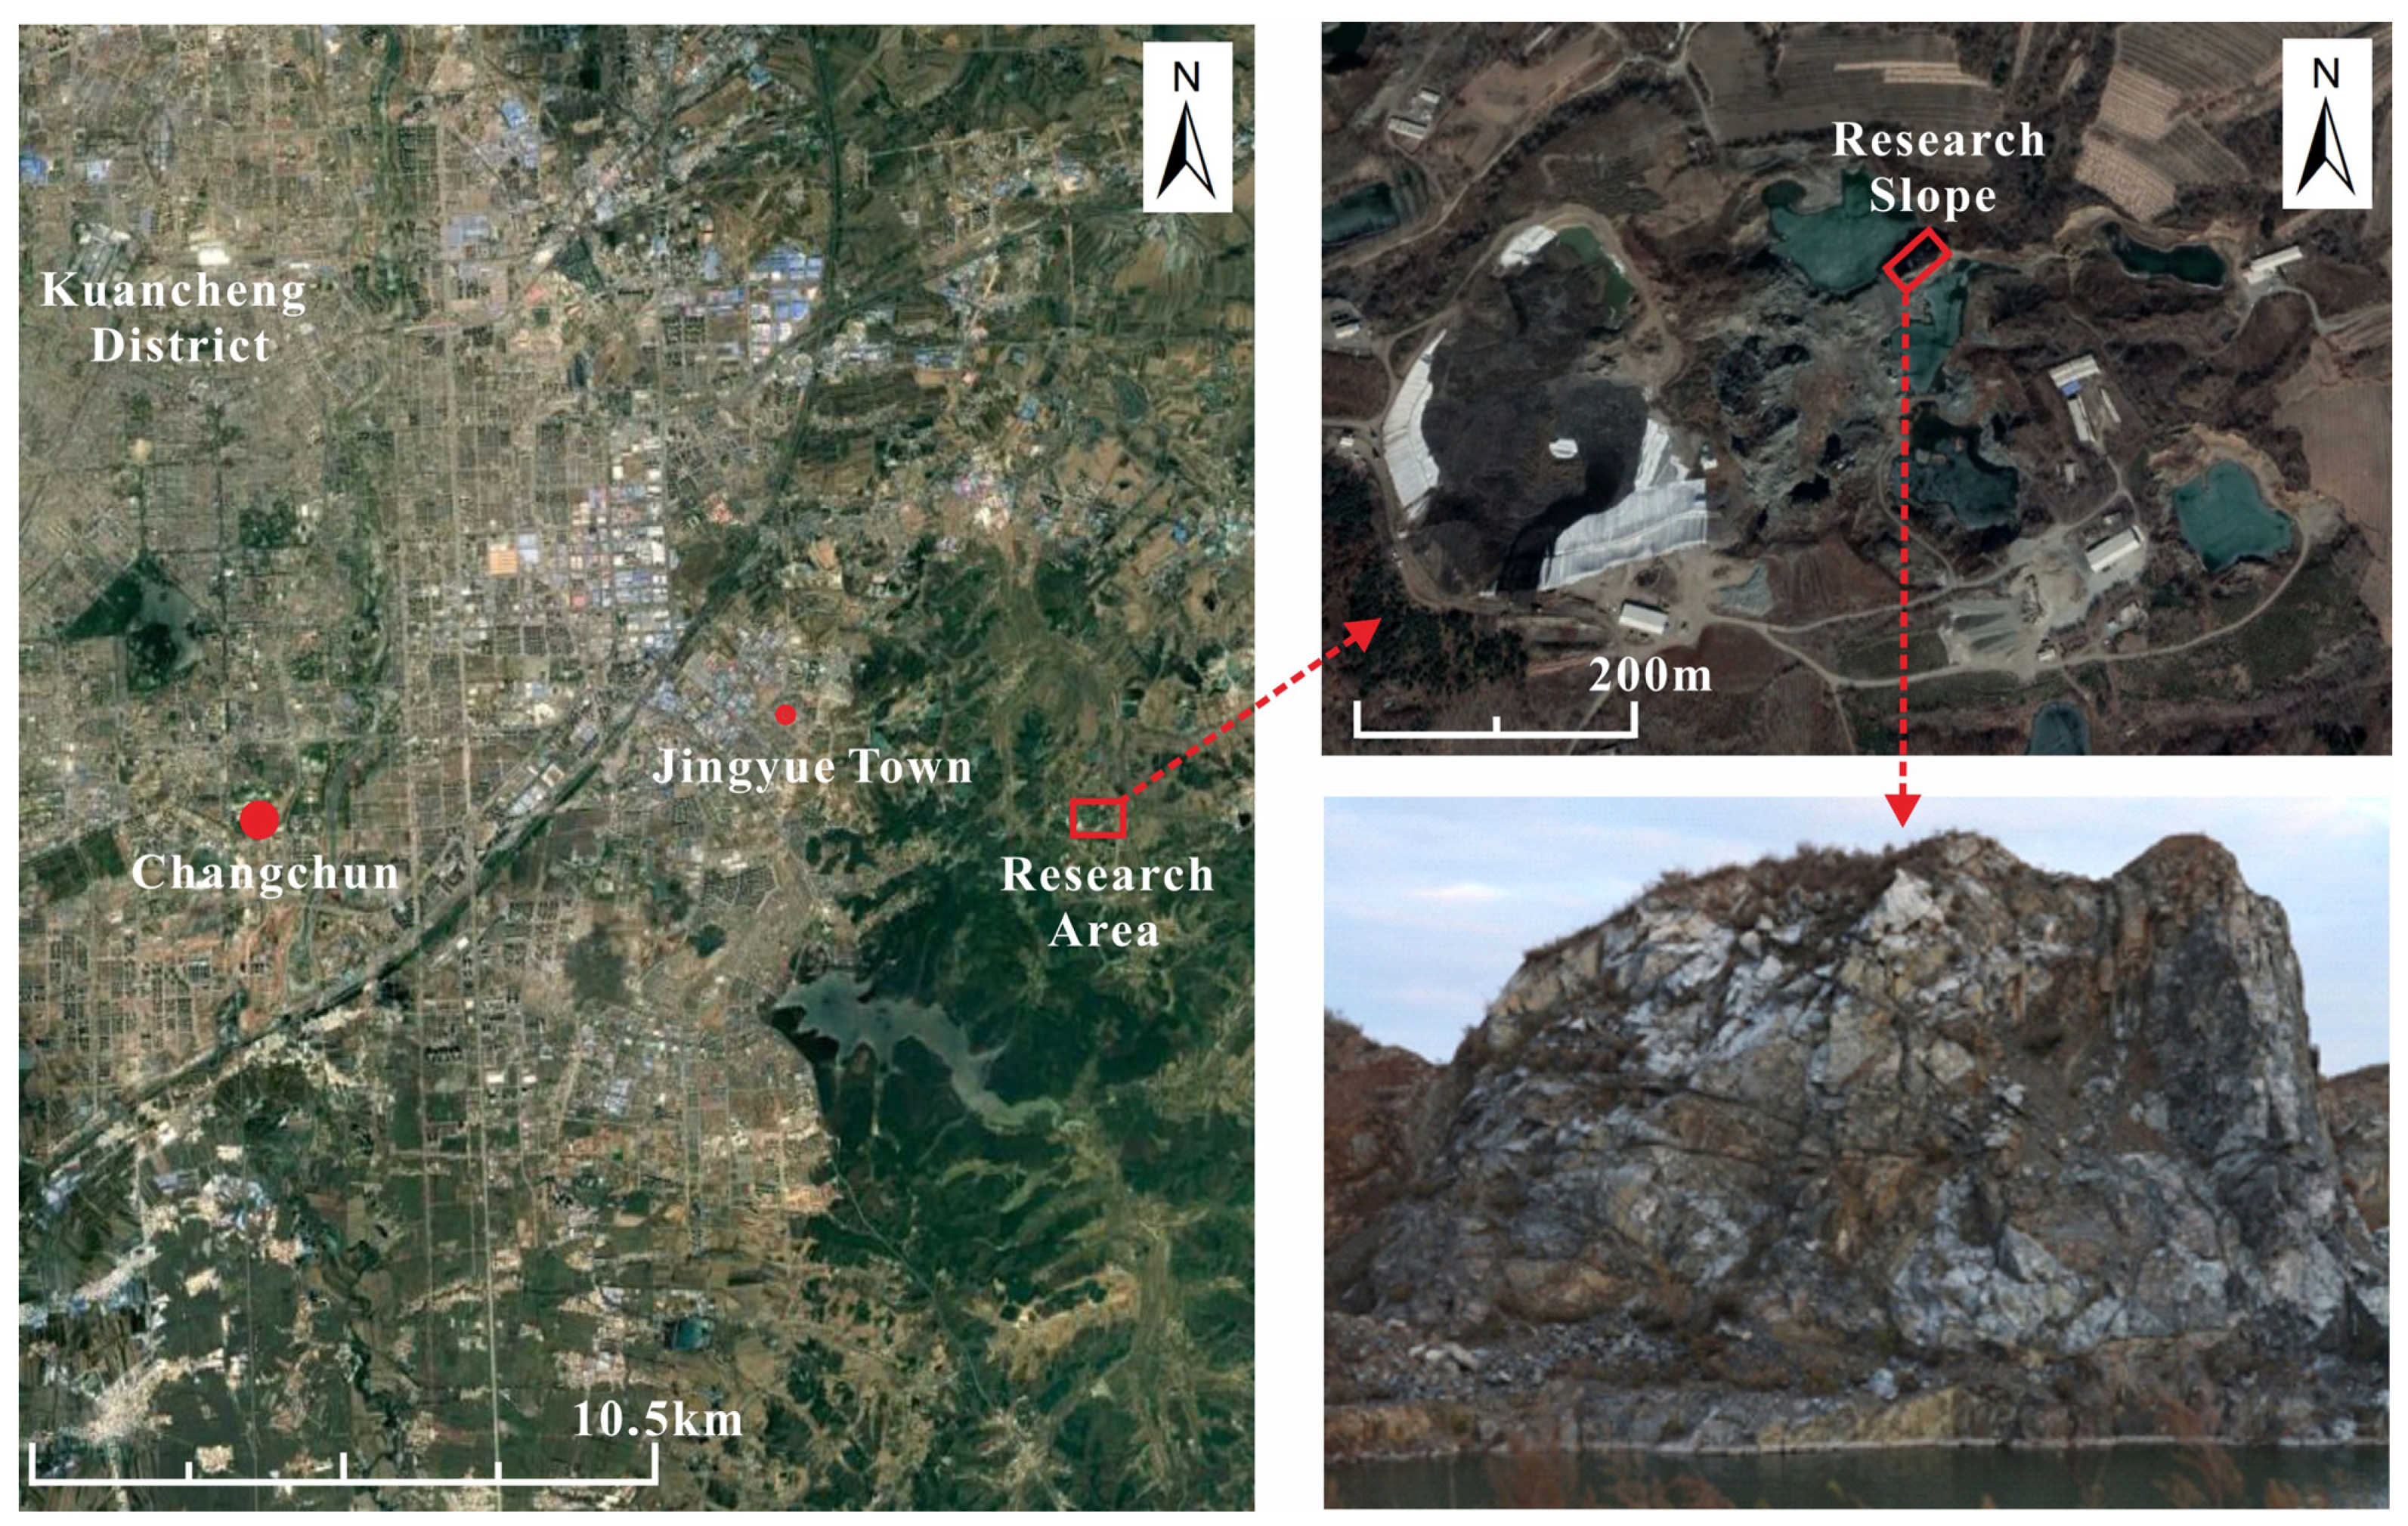
2.1. Study Area

For this study, Dongsheng quarry in Changchun City was selected as the research area (Figure 1). The geographic coordinates of the quarry are 125°30′E, 43°48′N. Dongsheng quarry has steep terrain on a mainly hilly landform, which belongs to the temperate continental climate. The rock mass in the research area is mainly andesite and sandstone, and its lithology belongs to the Permian Yangjiagou Formation (p3y). Fractures in the rock mass are relatively developed, and surface water seeps in along the fractures, so there are some hidden dangers due to geological hazards. Therefore, the evaluation of rock mass quality in this area has certain practical significance for the prevention and control of geological hazards.
A typical slope in the study area with relatively complete outcrop was selected as the experimental object. The slope is about 50 m in length and 30 m in height. Due to the influence of perennial rainfall, the water at the bottom of the slope forms a small pool, which makes it difficult for surveyors to get close to the rock mass. In addition, due to vegetation cover and gravel accumulation, there are some measurement blank areas on the slope surface, and it is impossible to measure all discontinuities.

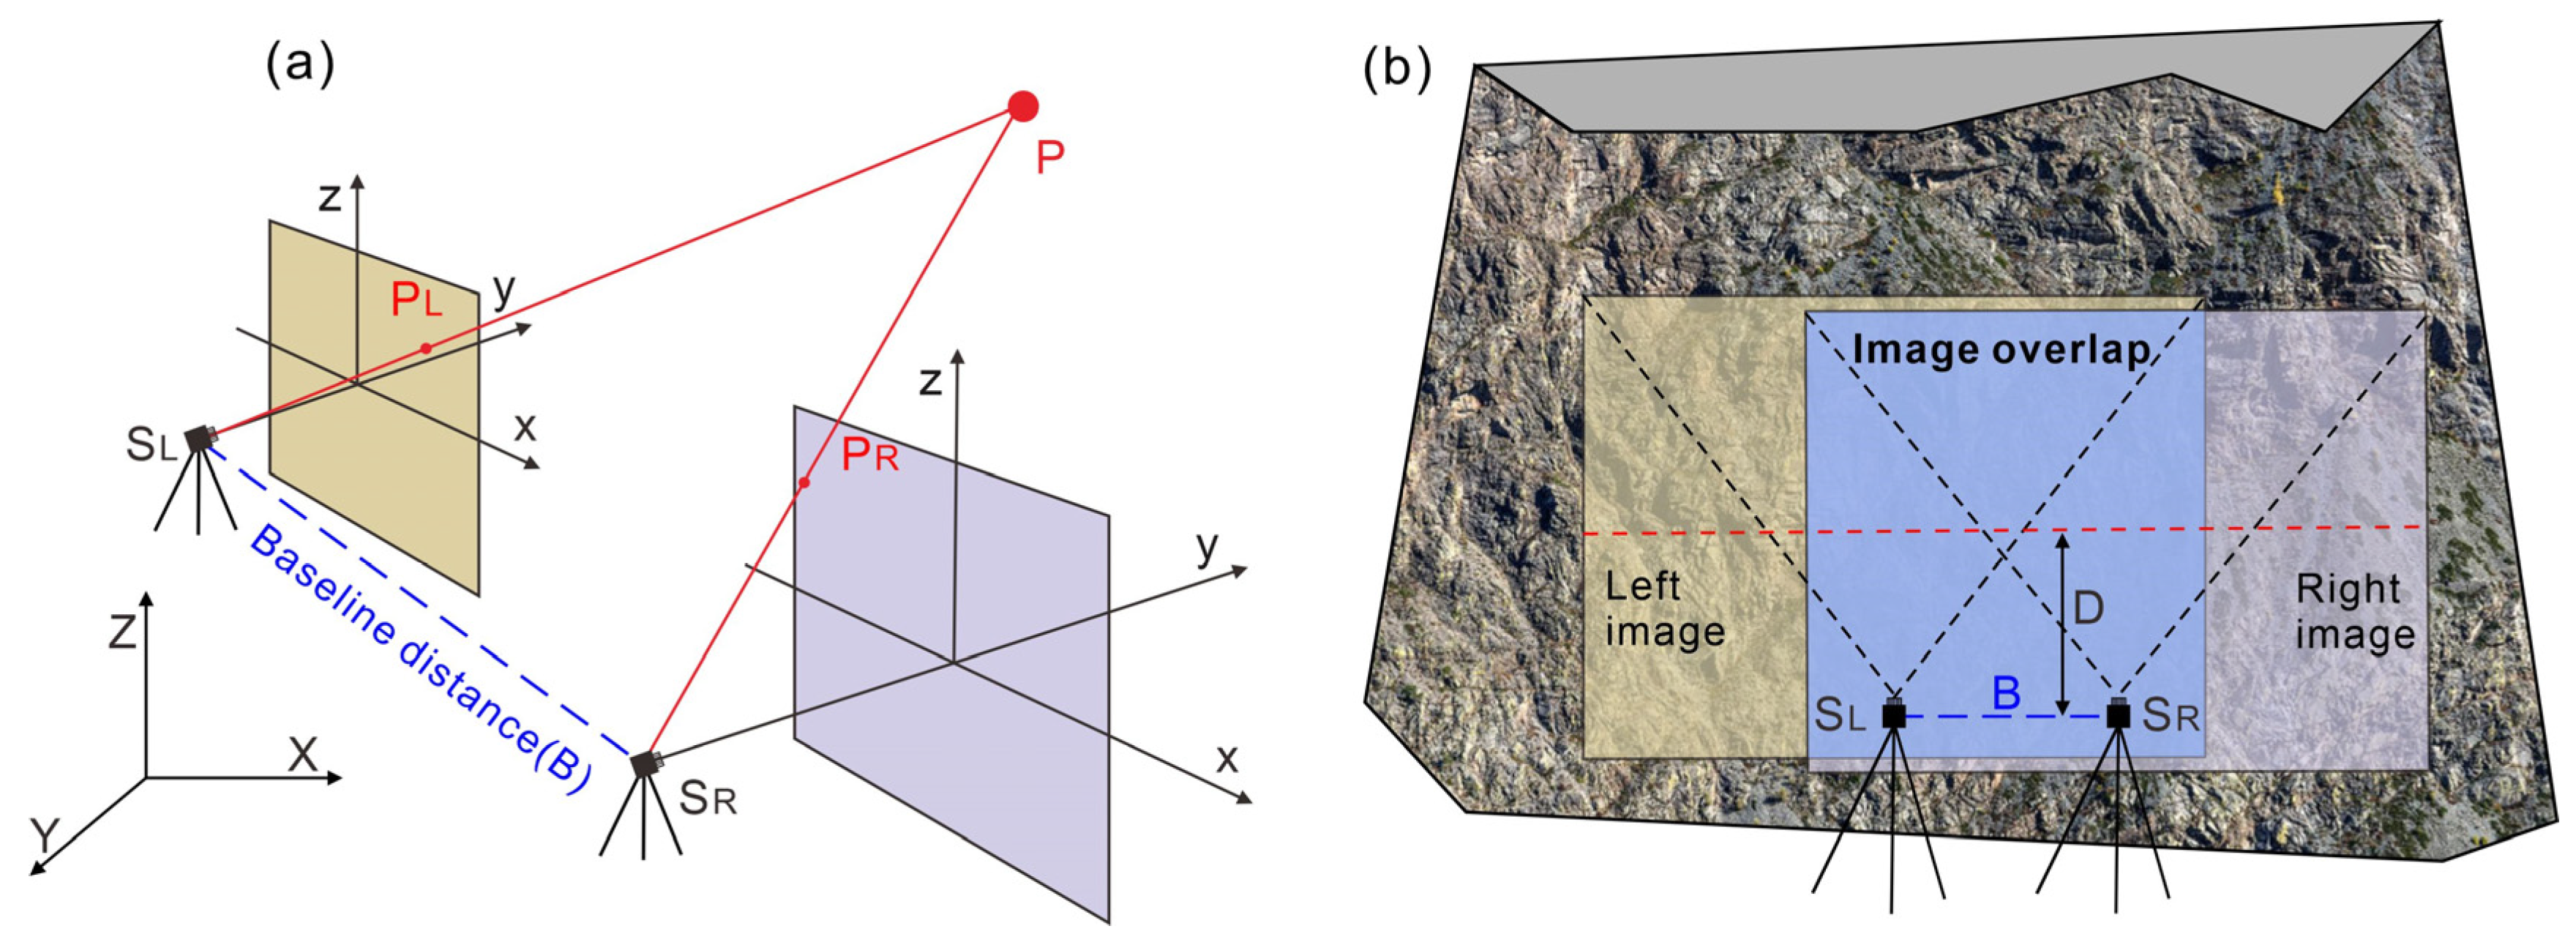
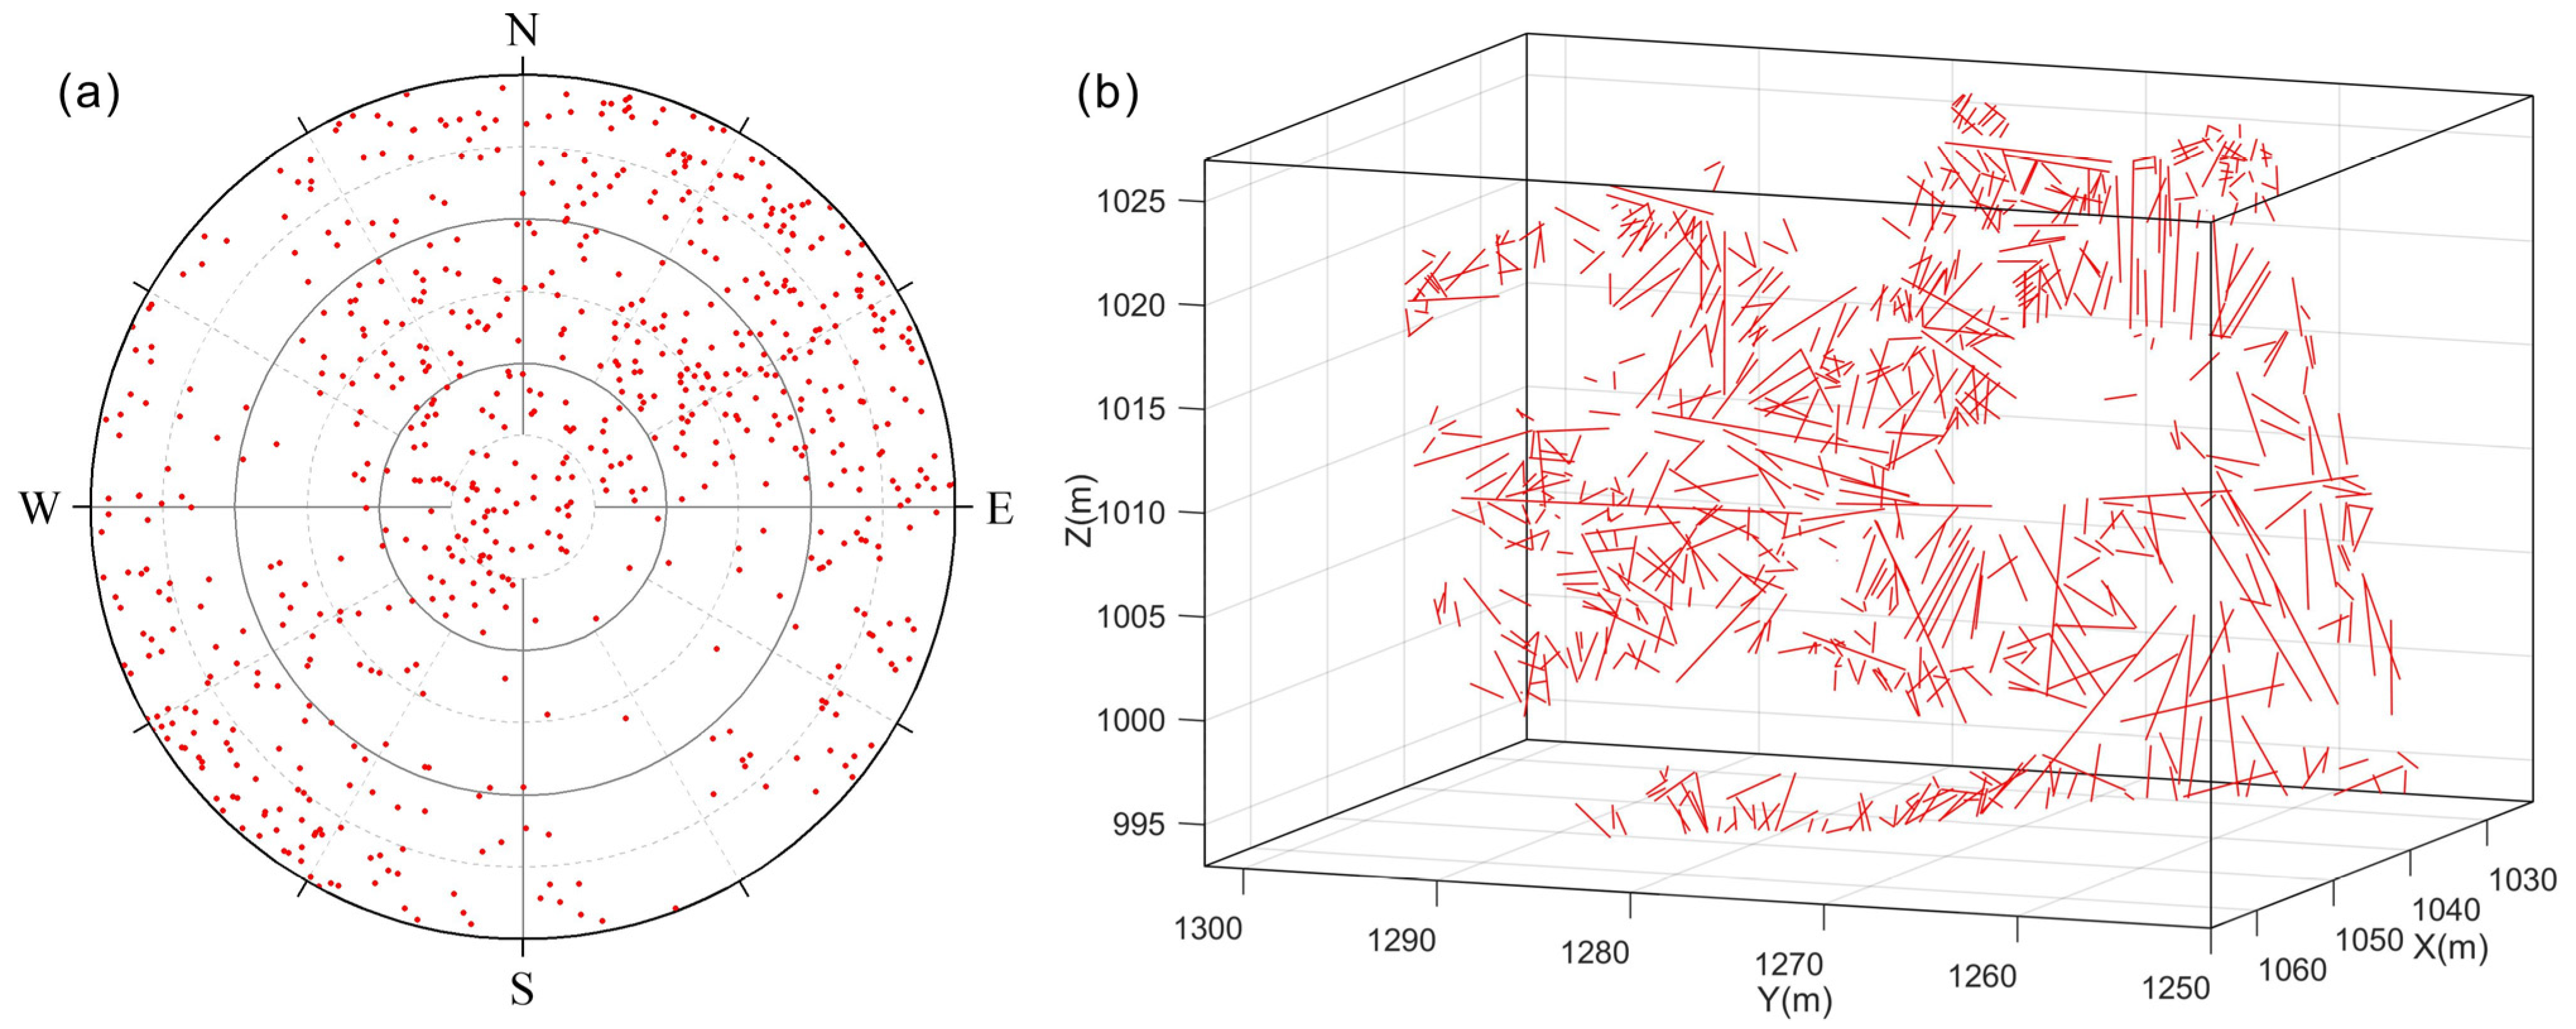
2.2. Discontinuity Information Acquisition by Digital Close-Range Photogrammetry

In this study, we collected information of discontinuities by using digital close-range photogrammetry, which establishes relationships between image coordinates and object space coordinates through collinearity equations; its specific principle is shown in Figure 2a.
x x 0 + Δ x = f a 1 ( X X s ) + b 1 ( Y Y s ) + c 1 ( Z Z s ) a 3 ( X X s ) + b 3 ( Y Y s ) + c 3 ( Z Z s ) z z 0 + Δ z = f a 2 ( X X s ) + b 2 ( Y Y s ) + c 2 ( Z Z s ) a 3 ( X X s ) + b 3 ( Y Y s ) + c 3 ( Z Z s )
where (x, z) are the image point coordinates; (X, Y, Z) are the object space coordinates of the object point; (x0, z0) are the coordinates of the image principal point; f is the focal length; ai, bi, and ci (i = 1, 2, 3) are the rotation matrix elements calculated by the external orientation elements; and (XS, YS, ZS) are the translation parameters in the external orientation elements. x and z are the corrections of the image point coordinate caused by lens distortion and are calculated as follows:
Δ x = ( x x 0 ) ( k 1 r 2 + k 2 r 4 ) + P 1 [ r 2 + 2 ( x x 0 ) 2 ] + 2 P 2 ( x x 0 ) ( z z 0 ) Δ z = ( z z 0 ) ( k 1 r 2 + k 2 r 4 ) + P 1 [ r 2 + 2 ( z z 0 ) 2 ] + 2 P 2 ( x x 0 ) ( z z 0 )
where k1 and k2 are radial distortion coefficients, and P1 and P2 are tangential distortion coefficients; r represents the distance from the image point to the image principal point, which can be expressed as:
r = ( x x 0 ) 2 + ( z z 0 ) 2
In practice, we followed the process of control survey–slope image acquisition and correction–slope modeling–information extraction. In the control survey stage, at least 11 feature points on the slope were first selected as control points [28]. Generally, the control points were arranged around the slope and roughly evenly distributed within the slope. Then, the three-dimensional coordinates of the control points on the slope were measured using spatial polar coordinates with a Non-Prism Total Station instrument. In the process of slope image acquisition and correction, the non-measuring Canon 5D Mark II camera (50 mm focal length, 0.0064 mm physical pixel size) was used to photograph slope images (image resolution 5616 × 3744 pixels) by using approximate straight photogrammetry (Figure 2b). The photography distance was about 90 m. The photographic baseline was parallel to the slope direction at a length of 6.2 m. The original slope images were corrected based on the camera calibration parameters.
In the process of slope modeling, according to the control survey results and corrected slope images, a 3D slope model was established using the VirtuoZo digital photogrammetry workstation, and the point error of the model was 4.7 cm. In the process of information extraction, identification methods such as direct, inference, and analogy identification were used to identify discontinuities. Then, the IGS module of VirtuoZo was used to measure the boundaries of discontinuities. A discontinuity information solution model based on spatial coordinates was established to calculate the trace length and orientation of discontinuities [29]. In this study, a total of 22 representative discontinuities were selected for precision evaluation. Comparing the VirtuoZo interpretation results with the field measurement results, it was found that the standard deviation of dip and dip angle was 5° and 4°, respectively. This shows that the established model was reliable, and the discontinuity information could meet engineering requirements.
Based on digital close-range photogrammetry, the coordinates of the trace endpoints, dip, and dip angle of 683 discontinuities were obtained through identification and measurement with the model, as shown in Table 1.
In order to reflect the spatial orientation of discontinuities on the slope, based on the dip and dip angle of discontinuities in Table 1, a pole diagram of orientation of discontinuities on the slope was drawn (Figure 3a). Three-dimensional traces of discontinuities were then drawn based on the coordinates of the trace endpoints (Figure 3b).

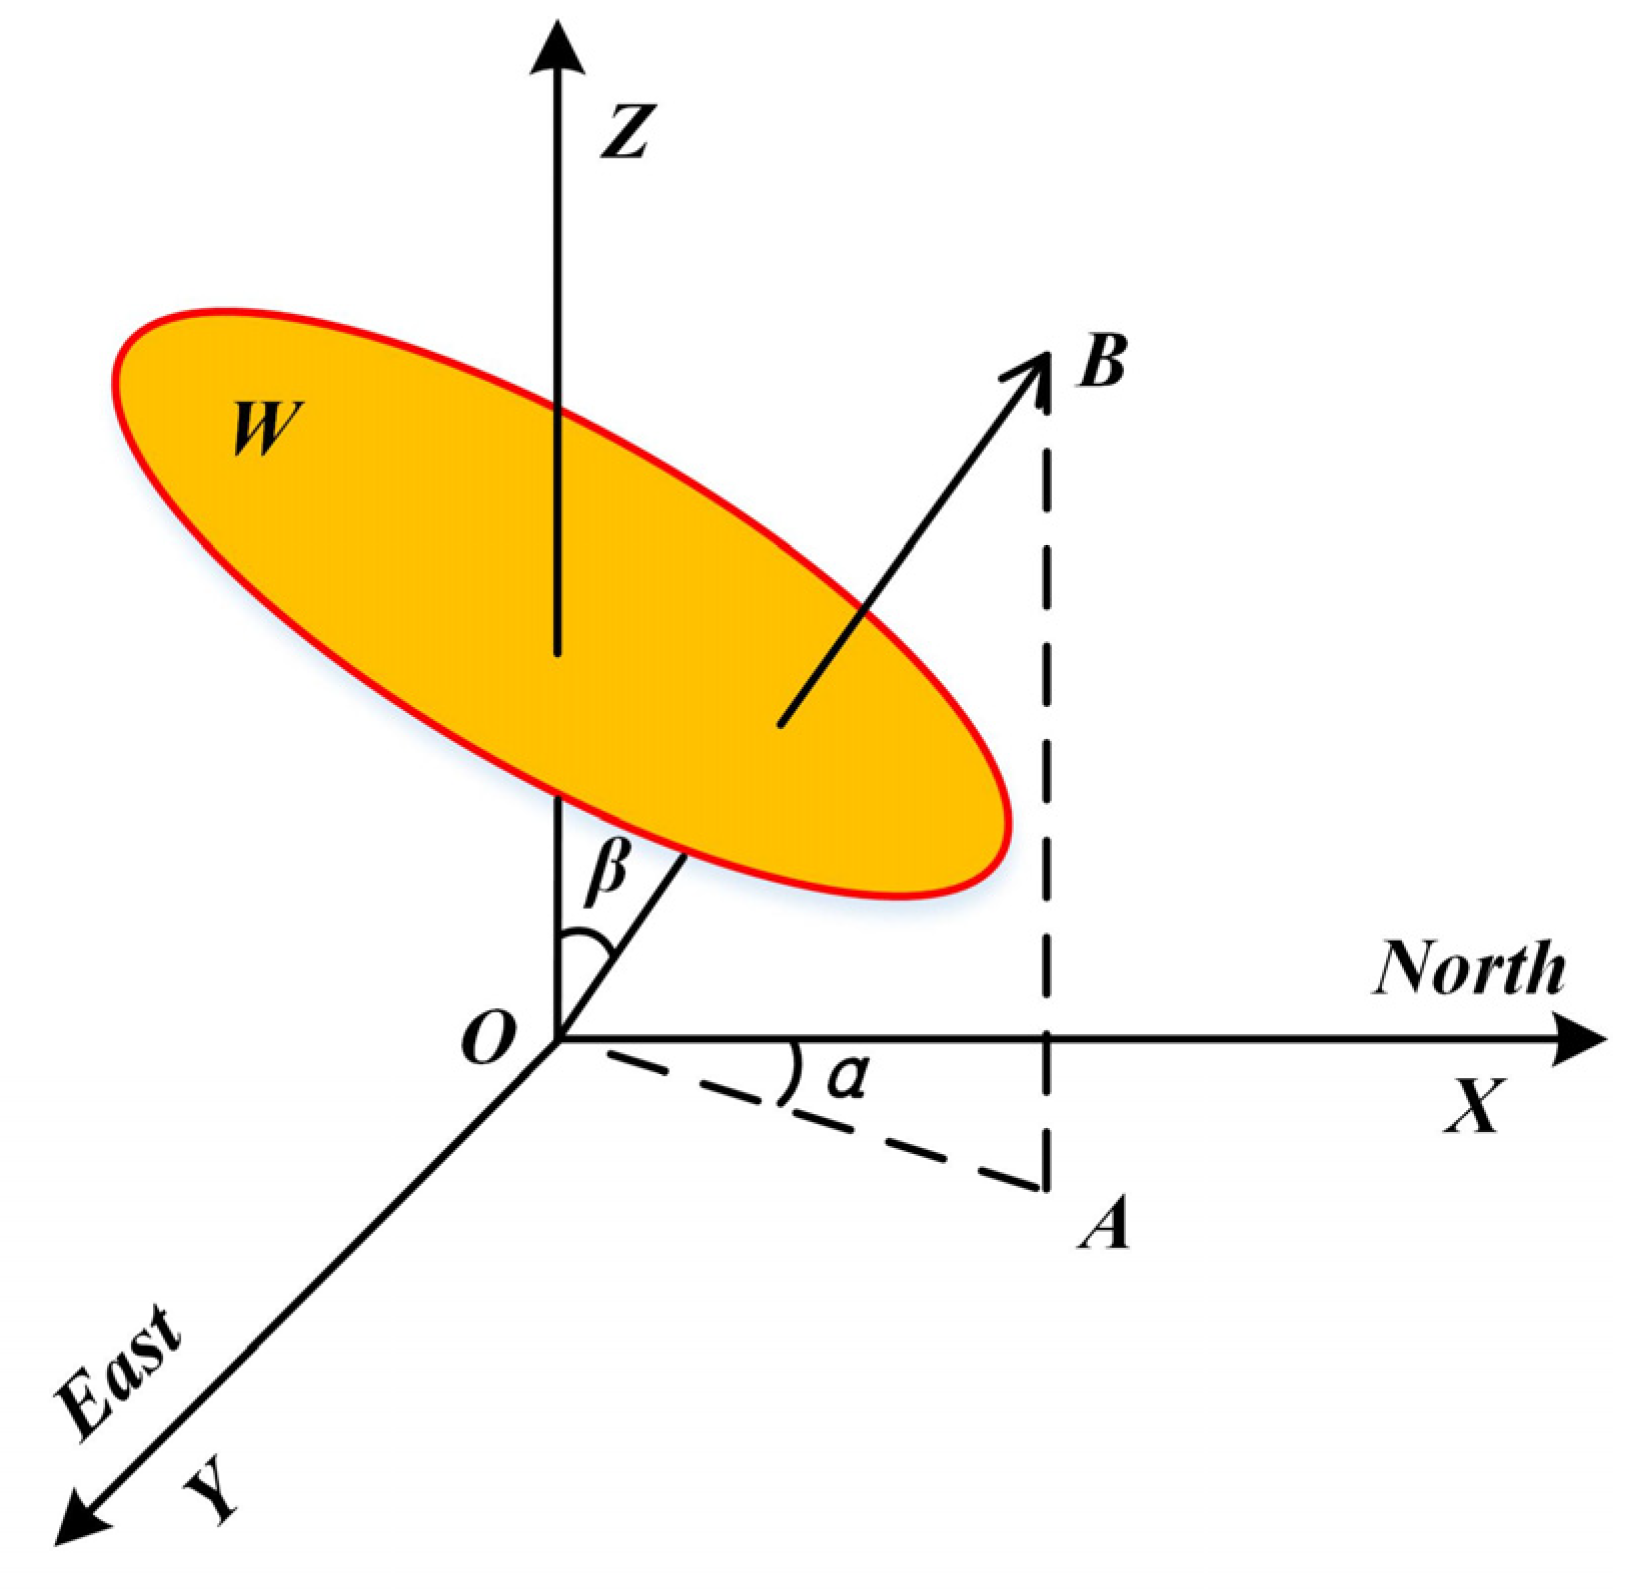
2.3. Three-Dimensional Disk Model of Rock Mass Discontinuities

Based on photogrammetry, a three-dimensional model of the rock slope was established and important information, such as dips, dip angles, coordinates of trace endpoints, was measured. In order to better identify the intersection relationships between discontinuities and surveying lines in space, spatial disks were used to realize the three-dimensional expression of discontinuities.
In the rectangular space coordinate system shown in Figure 4, α and β represent the dip and dip angle of discontinuity W, respectively, and O B represents the normal vector of the plane where discontinuity W is located, denoted as O B = ( a , b , c ) .
{ a = sin β cos α b = sin β sin α c = cos β
On the three-dimensional slope model, the coordinates of the trace endpoints of discontinuity W are measured, and then the coordinates of the trace midpoint (X0, Y0, Z0) were obtained, which are regarded as the center of the spatial disk. The spatial disk can be expressed as the intersection of the plane where discontinuity W is located and the solid sphere with (X0, Y0, Z0) as the center and trace length D of discontinuity W as the diameter.
{ ( X X 0 ) 2 + ( Y Y 0 ) 2 + ( Z Z 0 ) 2 D 2 / 4 a ( X X 0 ) + b ( Y Y 0 ) + c ( Z Z 0 ) = 0

2.4. Generalized RQD Eliminating the Influence of Measurement Blank Areas

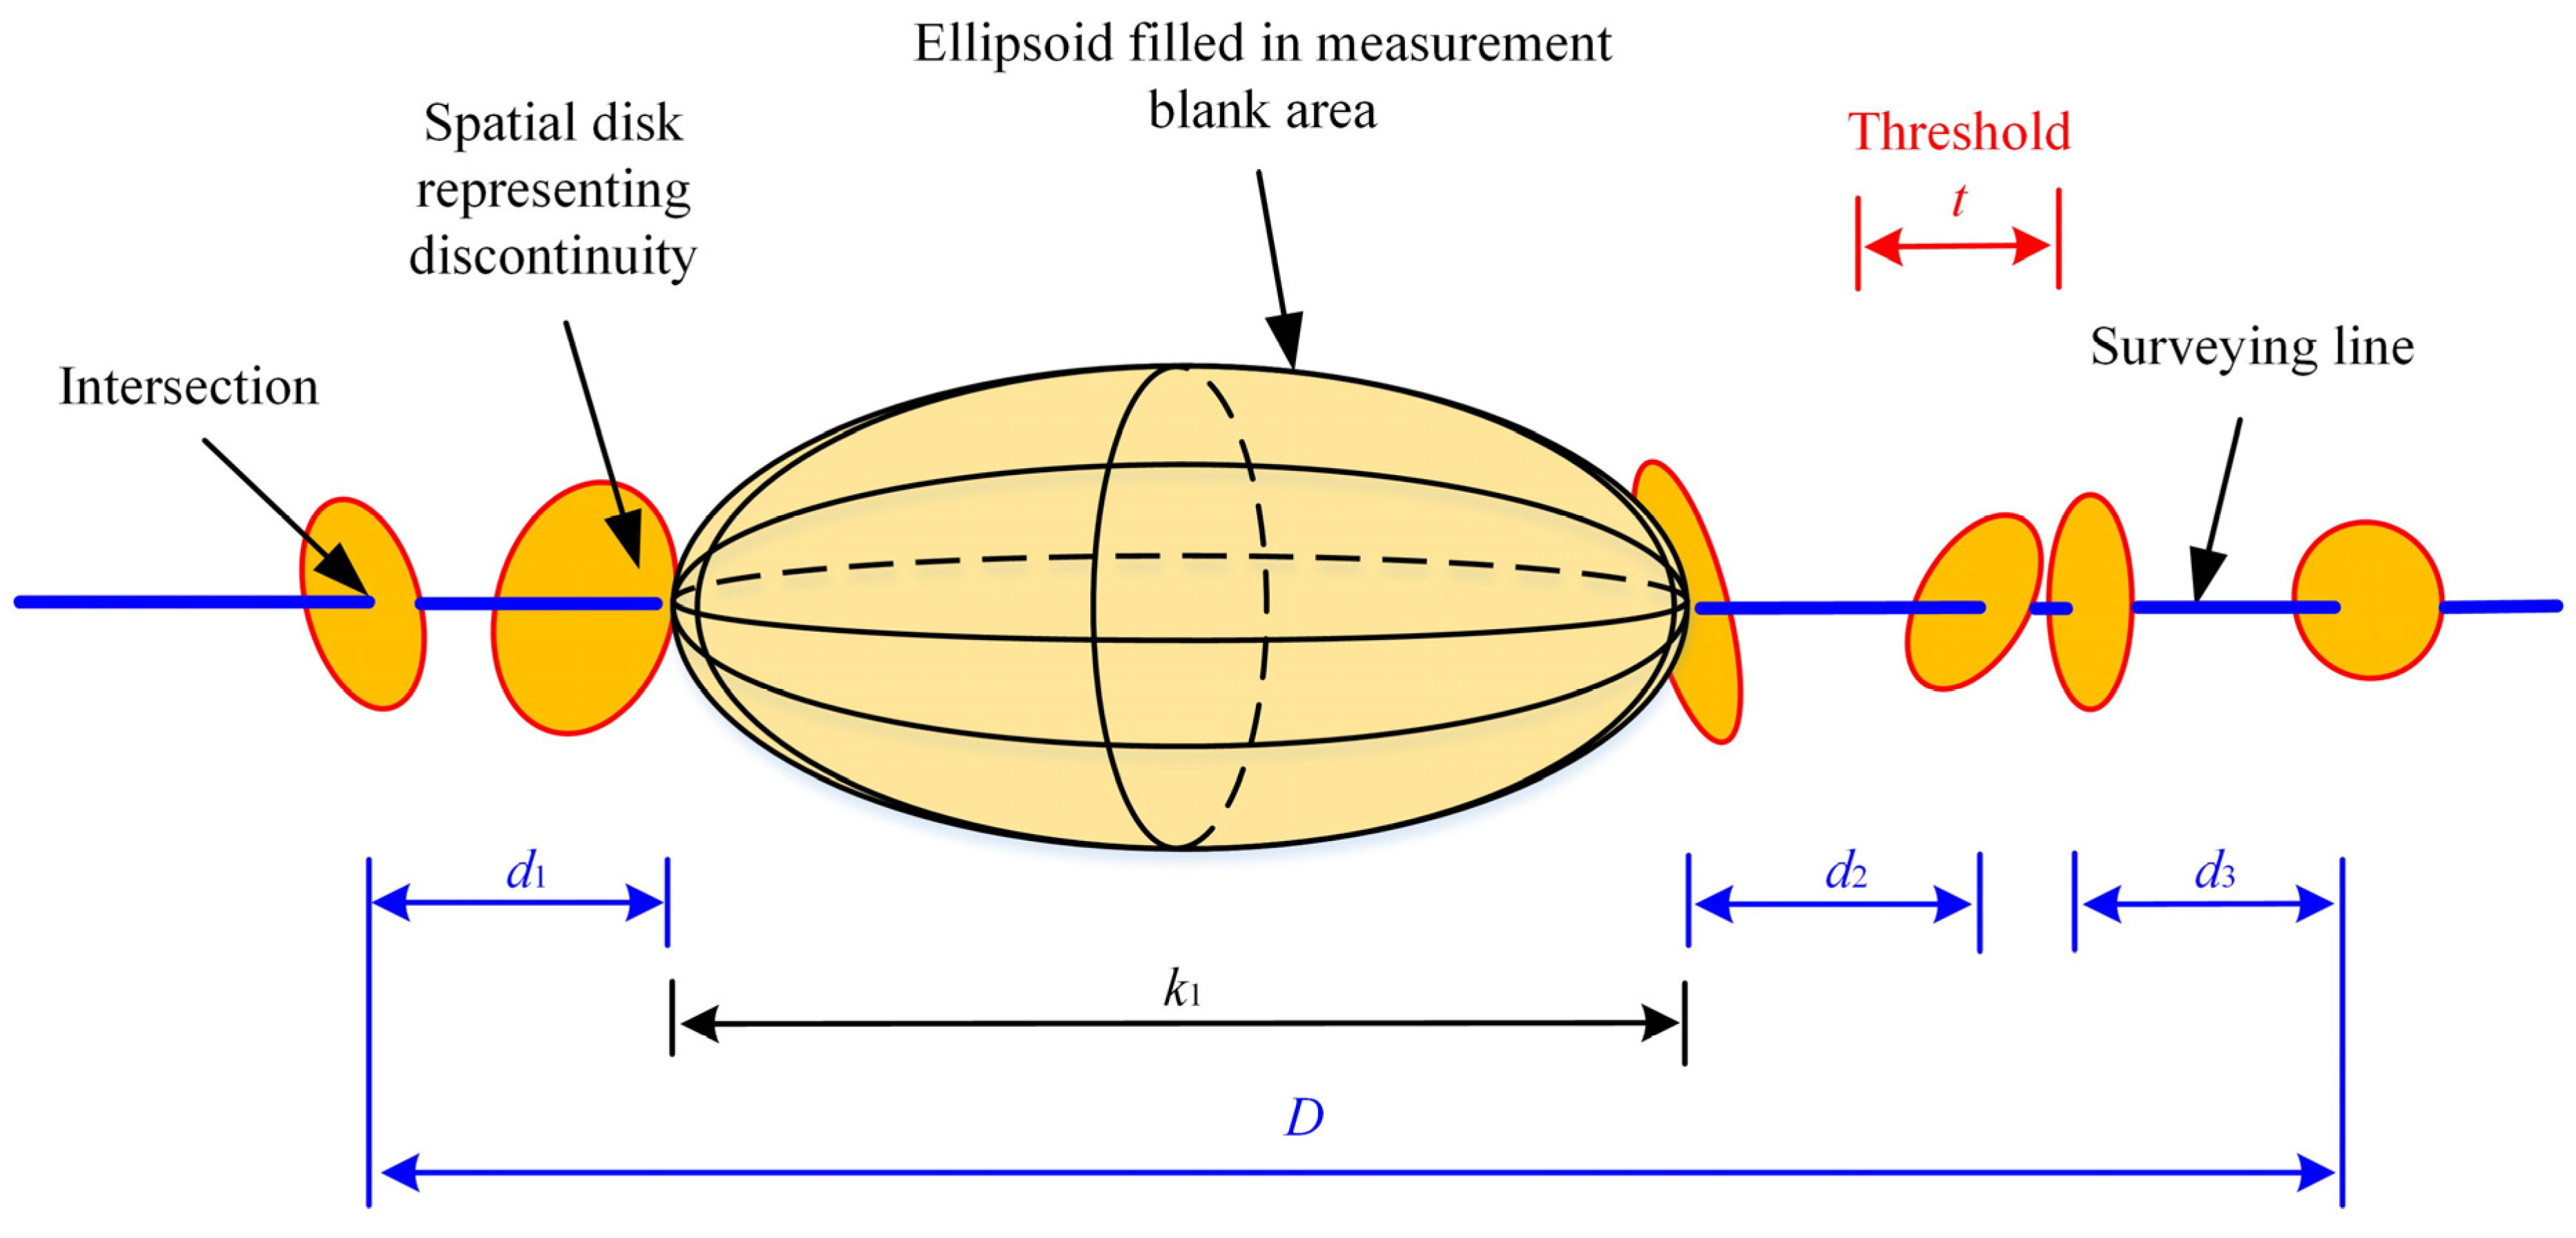
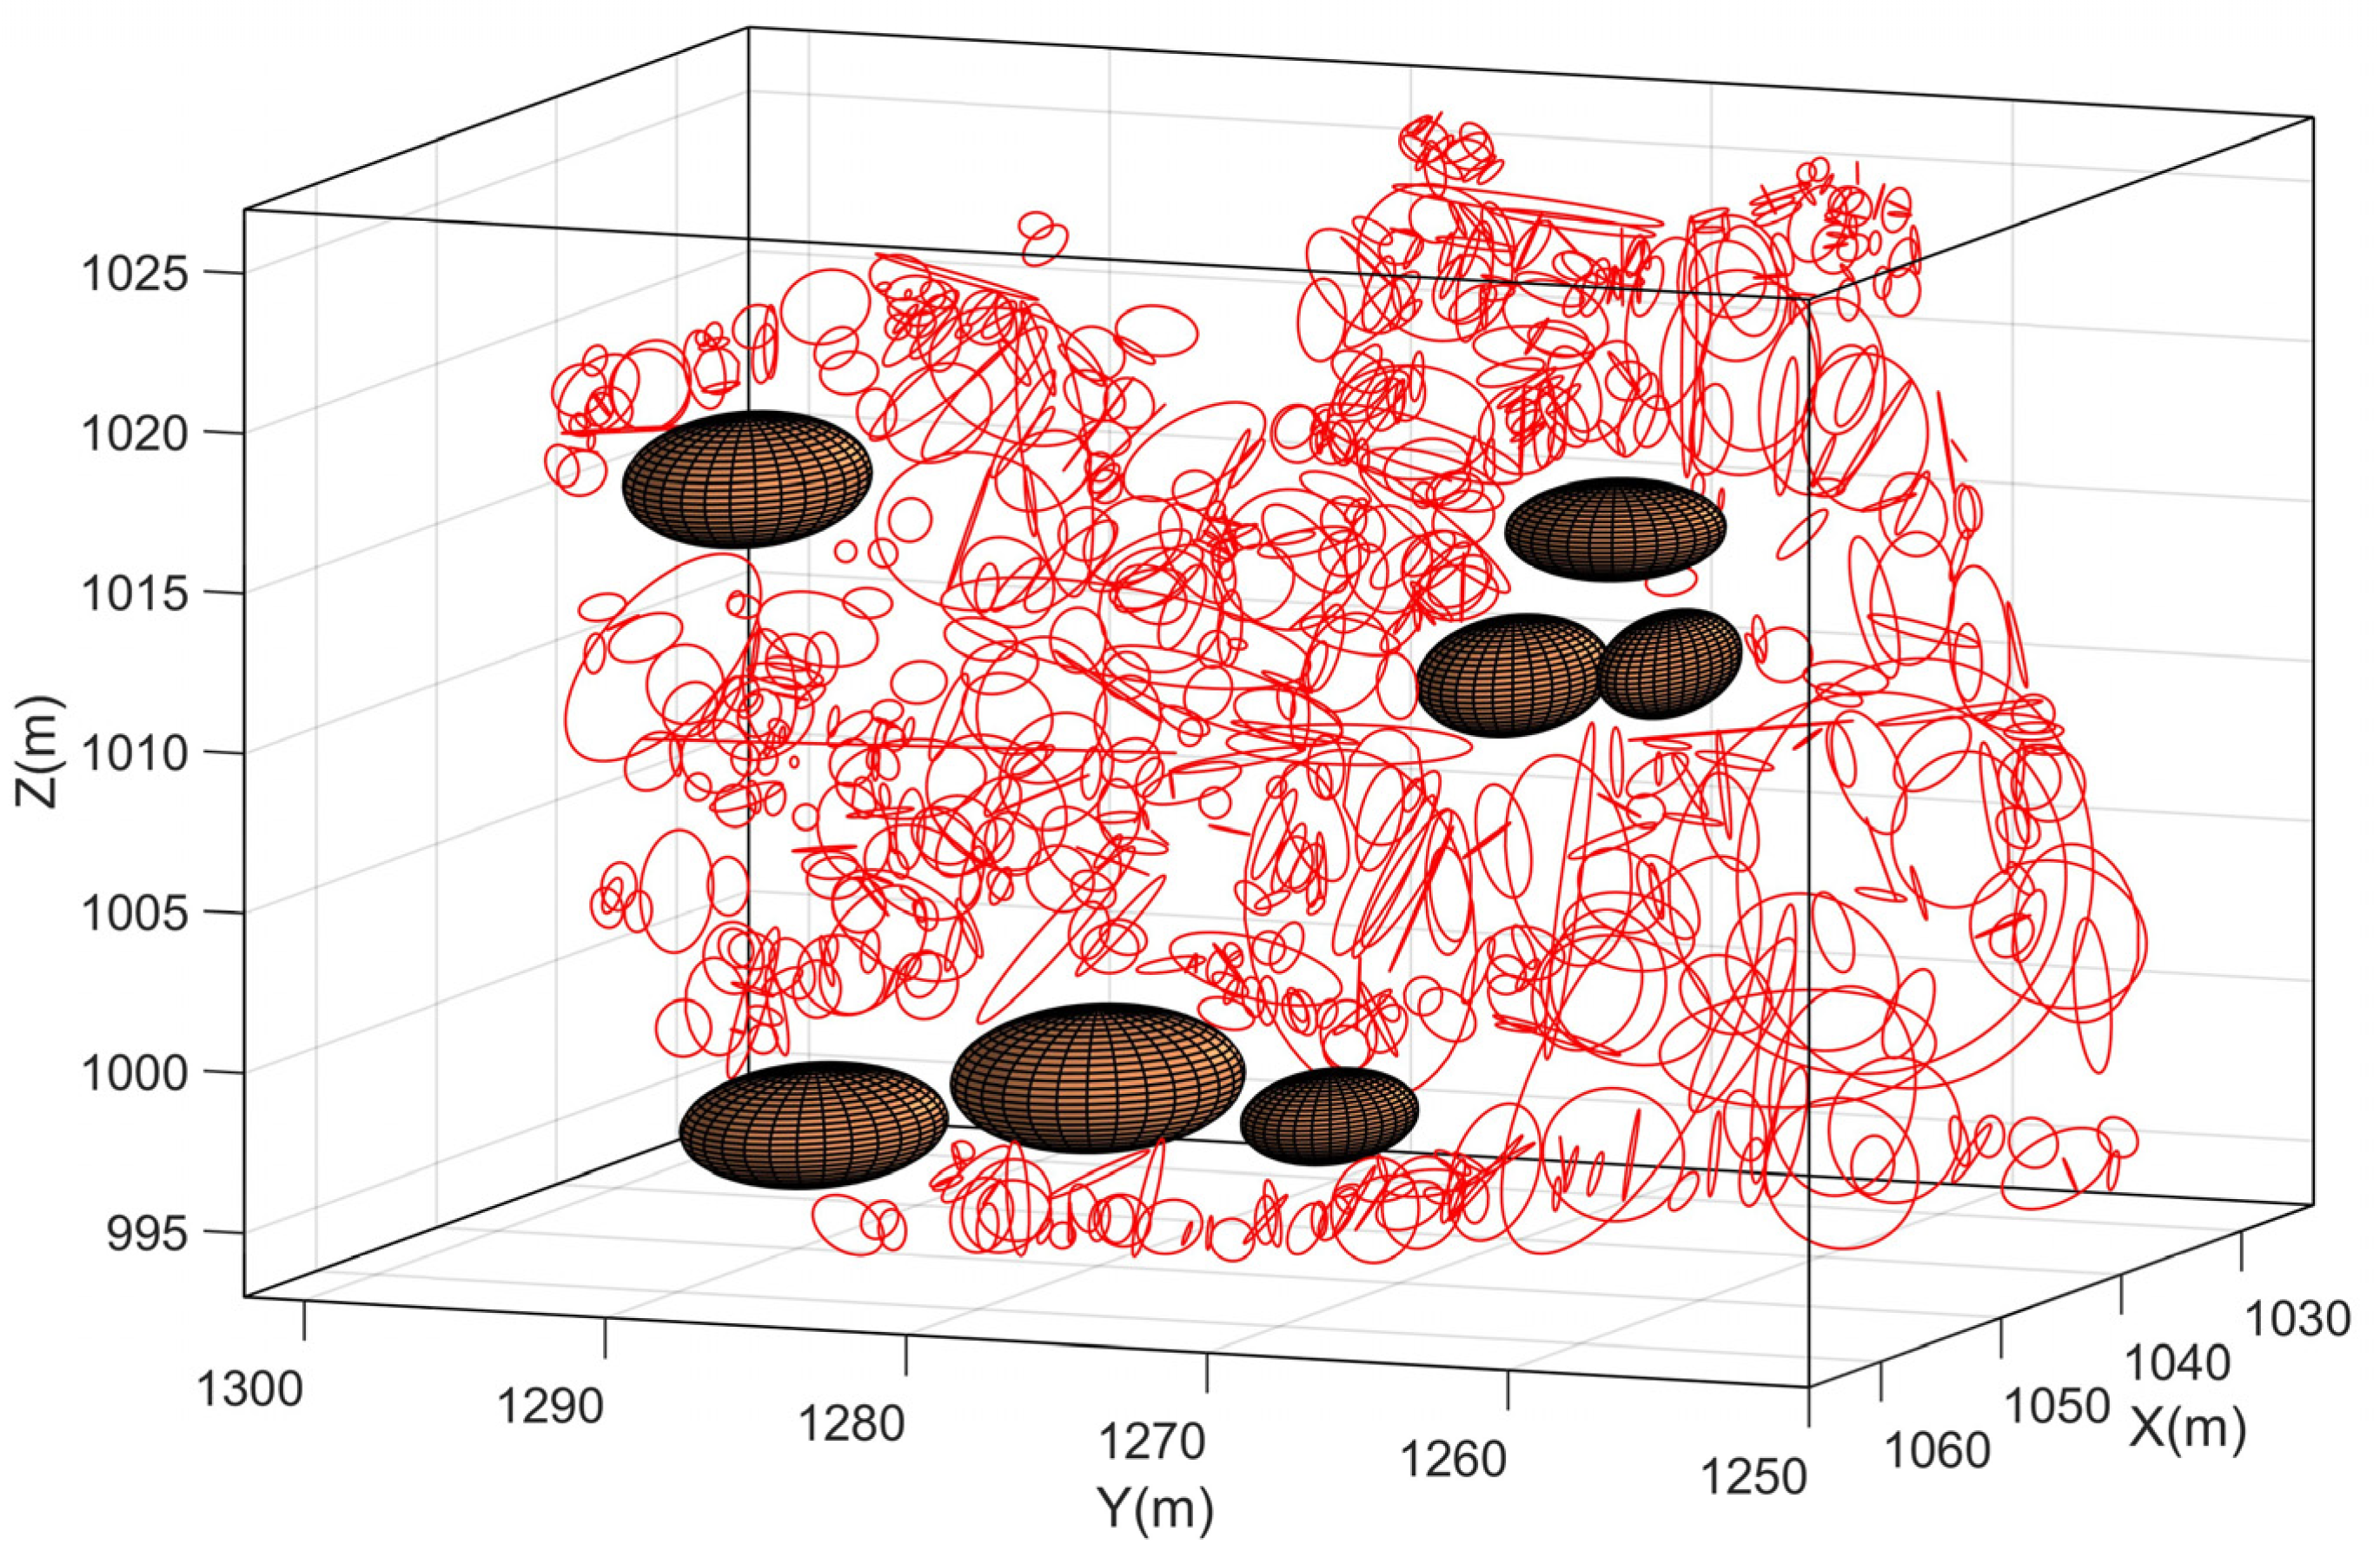
2.4.1. Filling of Measurement Blank Areas

With regard to the problem of vegetation coverage or gravel deposit occlusion on the slope when collecting images of the rock mass, there were some measurement blank areas in the three-dimensional model established by the images, which had an important influence on the calculation of rock mass RQD. Therefore, spatial ellipsoids were used to fill in the measurement blank areas in the three-dimensional slope model in order to eliminate the influence of measurement blank areas on the calculation of rock mass RQD.
( X X e ) 2 / A 2 + ( Y Y e ) 2 / B 2 + ( Z Z e ) 2 / C 2 = 1
In Equation (6), (Xe, Ye, Ze) are the spherical center coordinates of the spatial ellipsoid, and the lengths of the three half axes A, B, and C of the ellipsoid are measured and calculated from the three-dimensional slope model.

2.4.2. Calculation Model of Generalized RQD

  • Calculation of Generalized RQD on a Single Surveying Line
In this paper, the method of laying surveying lines in the three-dimensional disk model of discontinuities was used to overcome the shortcomings of the traditional method of calculating RQD, which is easily affected by the number and direction of boreholes. At the same time, the traditional RQD calculation method takes 0.1 m as the threshold, and its rationale needs to be discussed. It cannot well represent the anisotropy and heterogeneity of rock mass. To overcome this shortcoming, the concept of generalized RQD is introduced, that is, the threshold t used in calculating RQD can be any positive number.
In addition, in this study, we considered the measurement blank areas of discontinuities caused by vegetation cover and gravel accumulation, and calculated the RQD of the rock mass, which eliminates the influence of measurement blank areas and reflects the real quality of the rock mass more truthfully and reliably. Figure 5 shows an example of a single surveying line to illustrate the specific principle of calculating RQD.
As shown in Figure 5, a surveying line with a certain direction is laid in the three-dimensional disk model of discontinuities, which intersects several disks representing discontinuities. At the same time, the line passes through the ellipsoid filling in the measurement blank area and generates two intersections with the ellipsoid surface. The intersection points of the line and the disks are assigned attribute 0, and the intersection points of the line and the ellipsoids are assigned attribute 1. Ellipsoids are set as close to disks as possible, and the distances between ellipsoids and disks are ignored. The equation for calculating the generalized RQD of rock mass eliminating the influence of measurement blank areas on this line is as follows:
RQD = i = 1 n d i D j = 1 m k j
where di is the ith spacing greater than the given threshold t between two adjacent intersections whose attributes are all 0; D is the spacing between the first and last intersection of the line and the disk or ellipsoid; and kj is the jth spacing between two adjacent intersections whose attributes are all 1.
  • Comprehensive Generalized RQD of Rock Mass
In the actual process, the generalized RQD of the rock mass obtained by laying a single surveying line is easily affected by the location and direction of the line and cannot accurately express the complete quality of the rock mass. In order to better reflect the anisotropy of the rock mass, many lines are laid parallel to the three coordinate axes, and the mean values of generalized RQD in each direction are obtained. Taking the number of effective lines (intersecting two or more discontinuities) laid in parallel as the weight, the weighted mean of the generalized RQD, that is, the comprehensive generalized RQD of the rock mass, is obtained.
RQD C = n X RQD X + n Y RQD Y + n Z RQD Z n X + n Y + n Z

3. Results

Because of the influence of flowing water and weathering all year round, many fractures are formed on the surface of and inside the research slope, which seriously affects the stability of rock mass on the slope, and there are potential safety hazards. In order to evaluate the quality of the rock mass of the research slope, 683 pieces of discontinuity data were obtained by photogrammetry, and a three-dimensional disk model of discontinuities on the slope was established. At the same time, considering the existence of measurement blank areas on the surface of the slope due to vegetation coverage and gravel accumulation, ellipsoids were used to fill in the blank areas, so as to obtain the real generalized RQD of the rock mass eliminating the influence of the blank areas.
According to the actual situation of the slope and the three-dimensional disk model of discontinuities, seven ellipsoids were added to fill in the measurement blank areas. The three-dimensional disk model of discontinuities with ellipsoids is shown in Figure 6, and the geometric parameters of the ellipsoids are shown in Table 2.
Compared with the traditional method of obtaining RQD, in this paper we lay out surveying lines in a three-dimensional disk model, which not only saves time and energy in the field work, but also makes full use of the outcrop of rock mass. At the same time, it can effectively avoid the problem that it is difficult for the drilling method to reflect rock anisotropy due to the restricted number and direction of boreholes. By laying enough surveying lines, enough RQD samples of the rock mass can be obtained. The weighted mean value can reflect the complete quality of the rock mass more truthfully and reliably. Figure 7 is a schematic diagram of surveying lines laid in parallel coordinate axes.
When several surveying lines are laid parallel to a coordinate axis, if there are not two or more intersections between a line and discontinuities, the RQD on the line cannot be calculated and the line is invalid. The generalized RQD of rock mass on any effective surveying line can be obtained after eliminating the influence of measurement blank areas, and the average RQD of all effective surveying lines can be obtained to reflect the rock mass quality.
For the same slope, any change in the distance between surveying lines will lead to a change in the number and location of surveying lines, and then will affect the final RQD results and the stability evaluation of the rock mass. In order to explore the optimal distance of surveying lines, taking the research slope in this paper as an example, 0.1, 0.25, 0.5, 0.75, 1, 2, 4, and 8 m were used as the surveying line distances, 0.1 m was used as the threshold of discontinuity spacing for RQD calculation, and the surveying lines were laid parallel to the X-, Y-, and Z-axes. The generalized RQD values of rock mass in all directions after eliminating the influence of measurement blank areas were calculated, and the results are shown in Table 3.
In order to more clearly reflect the influence of the distance between surveying lines on the results of RQD calculation, based on the data obtained in Table 3, a broken line diagram of RQD changing with the distance between surveying lines was drawn, as shown in Figure 8.
When the distance between surveying lines varies from 0.1 to 0.5 m, RQD values obtained parallel to different axes are relatively stable and change within 0.5%. When the distance between surveying lines is greater than 0.5 m, RQD values obtained parallel to different axes have relatively large fluctuations in different forms. When the distance between surveying lines reaches 8 m, the RQD values obtained by the parallel X-axis and Z-axis are very high, while that obtained by the parallel Y-axis is significantly lower than the initial state. This indicates that a too-large line distance leads to over- or under-evaluation of rock mass quality. Therefore, for the research slope in this paper, when the surveying lines are laid parallel to the X-, Y-, and Z-axes, the best distance between surveying lines is 0.5 m, and the RQD obtained can best reflect the real quality of rock mass.
In addition, the generalized RQD is used to describe the quality of rock mass in this paper, and the threshold t of spacing of discontinuities for RQD calculation can be any positive number. Taking the parallel Y-axis as an example, threshold t was set to 0.1, 0.5, 1, 2, 5, 10, 12, and 15 m to study the variation in RQD with discontinuity spacing threshold t. Based on the generalized RQD calculation model of rock mass proposed in this paper, which eliminates the influence of blank areas, taking 0.5 m as the distance between surveying lines, the generalized RQD values calculated under different thresholds on the parallel Y-axis effective lines are shown in Figure 9.
From Figure 9, it can be seen that the dispersion degree of RQD varies with different thresholds. When t is 2 m, the relative dispersion degree of RQD is the greatest. At the same threshold, the RQD obtained from different surveying lines is also significantly different, which reflects the heterogeneity of rock mass. The specific distribution of RQD on the parallel Y-axis effective lines under different thresholds is shown in Figure 10. The relationship between the mean value, standard deviation of RQD, and threshold t is shown in Figure 11.
From Figure 10 and Figure 11, we can see that with an increased discontinuity spacing threshold, the frequency distribution of RQD changes and the average value of RQD decreases continuously, which conforms to the calculation model of generalized RQD. The standard deviation of RQD first increases and then decreases. In order to accurately acquire the true RQD of rock mass and maximize its anisotropy and heterogeneity, in this paper we consider that threshold t corresponding to the maximum standard deviation of RQD between the lines is the best threshold when several lines are laid parallel to the same direction.
The range of the desirable discontinuity spacing threshold t was set to 0.1–15 m, and the test data points were encrypted near the threshold with the maximum standard deviation. The standard deviations of RQD under different thresholds were obtained. According to the principle of maximum standard deviation, the optimal threshold of discontinuity spacing is obtained when surveying lines are laid in parallel coordinate axes to calculate the RQD of the research slope.
When the surveying lines are parallel to the X-, Y-, and Z-axes, the optimal spacing thresholds of discontinuities corresponding to the maximum standard deviation of RQD are 1.2, 2.8, and 2.5 m, respectively, as shown in Figure 12. The generalized RQD of rock mass calculated under these thresholds can reflect the anisotropy of rock mass to the greatest extent and give a more accurate evaluation of rock mass quality.
It should be noted that 1.2, 2.8, and 2.5 m are the optimum discontinuity spacing thresholds for calculating the generalized RQD of the research slope when surveying lines are parallel to the X-, Y-, and Z-axes, respectively, and the distance between lines is 0.5 m. Because discontinuities in different rock masses develop differently, these thresholds may not be applicable to other rock masses. However, the method proposed in this paper to determine the optimal threshold is universal. When evaluating the quality of other rock masses, the optimal discontinuity spacing threshold corresponding to the generalized RQD can be obtained according to this principle.
Under these thresholds, the RQD mean values that eliminate the influence of measurement blank areas were obtained when surveying lines were laid parallel to each coordinate axis. Taking the number of effective lines laid in each direction as the weight, the comprehensive RQD reflecting the real quality of rock mass was obtained by weighted mean. Compared with RQD without eliminating the influence of measurement blank areas, the results are shown in Table 4.
As shown in Table 4, after eliminating the influence of measurement blank areas, the average generalized RQD obtained by laying lines parallel to the Y-axis and Z-axis decreased by 1.74% and 3.47%, respectively. Considering three coordinate axis directions, the comprehensive generalized RQD value of the slope is 46.58% before eliminating the influence of measurement blank areas. In contrast, after eliminating the influence of blank areas, the value of comprehensive generalized RQD is 44.91%, which is decreased by 1.67%. This shows that the measurement blank areas have an important influence on the accuracy of rock mass quality evaluation. Introducing ellipsoids to fill in the measurement blank areas of discontinuities eliminates the influence of blank areas on the calculation result of generalized RQD, and the complete quality of rock mass is described more accurately, which provides more reliable data for engineering construction.

4. Discussion

Using digital close-range photogrammetry technology, three-dimensional trace and orientation information of slope rock mass discontinuity was extracted based on the engineering coordinate system. The engineering coordinate system is the left-hand space coordinate system with true north direction as the X-axis and zenith direction as the Z-axis.
When ellipsoids are used to fill in the measurement blank areas, the filling effect is affected by geometric parameters reflecting both the size and positioning of the ellipsoid. The axial direction of the ellipsoids is consistent with the coordinate axis in the current study. In a follow-up study, the axial orientation of the ellipsoids will be determined by considering the azimuth characteristics of the measurement blank areas. We will also consider using other space bodies to fill in the blank areas more accurately and appropriately.
The calculation of generalized RQD of rock mass is affected by the direction and spacing of the arranged surveying lines. In this study, the influence of surveying line spacing was analyzed under the condition that the lines are arranged parallel to three coordinate axes and the optimal spacing is obtained. Future work will expand the research on the optimal surveying line direction; for example, the surveying line can be arranged perpendicular to the distribution direction of the dominant group according to the division of dominant groups of discontinuity orientation.

5. Conclusions

In the traditional RQD calculation method, there are some shortcomings when using 0.1 m as the threshold for discontinuity spacing. The rationale has not been fully validated and the complete quality of different rock masses cannot be well distinguished. Therefore, the generalized RQD is introduced in this paper. Discontinuity data were obtained using digital close-range photogrammetry. Surveying lines were laid in the slope stereo model instead of boreholes. Vegetation cover and gravel accumulation on the slope were also considered. The generalized RQD of rock mass, which describes the quality of rock mass more accurately and eliminates the influence of measurement blank areas, was obtained. Through the engineering examples and the above analysis, the following conclusions were obtained:
  • The measurement data of discontinuities of a slope were obtained using digital close-range photogrammetry, and the generalized RQD of rock mass was calculated. Compared with the traditional method of using data from manual measurements to build a three-dimensional network model of discontinuities and then obtaining RQD, the proposed method does not need to simulate a three-dimensional network of discontinuities and avoids possible damage to data accuracy in this process. On the other hand, laying surveying lines parallel to three axes effectively avoids the shortcomings of the borehole method, which has difficulty reflecting the anisotropy of rock mass due to the limitations of direction and quantity.
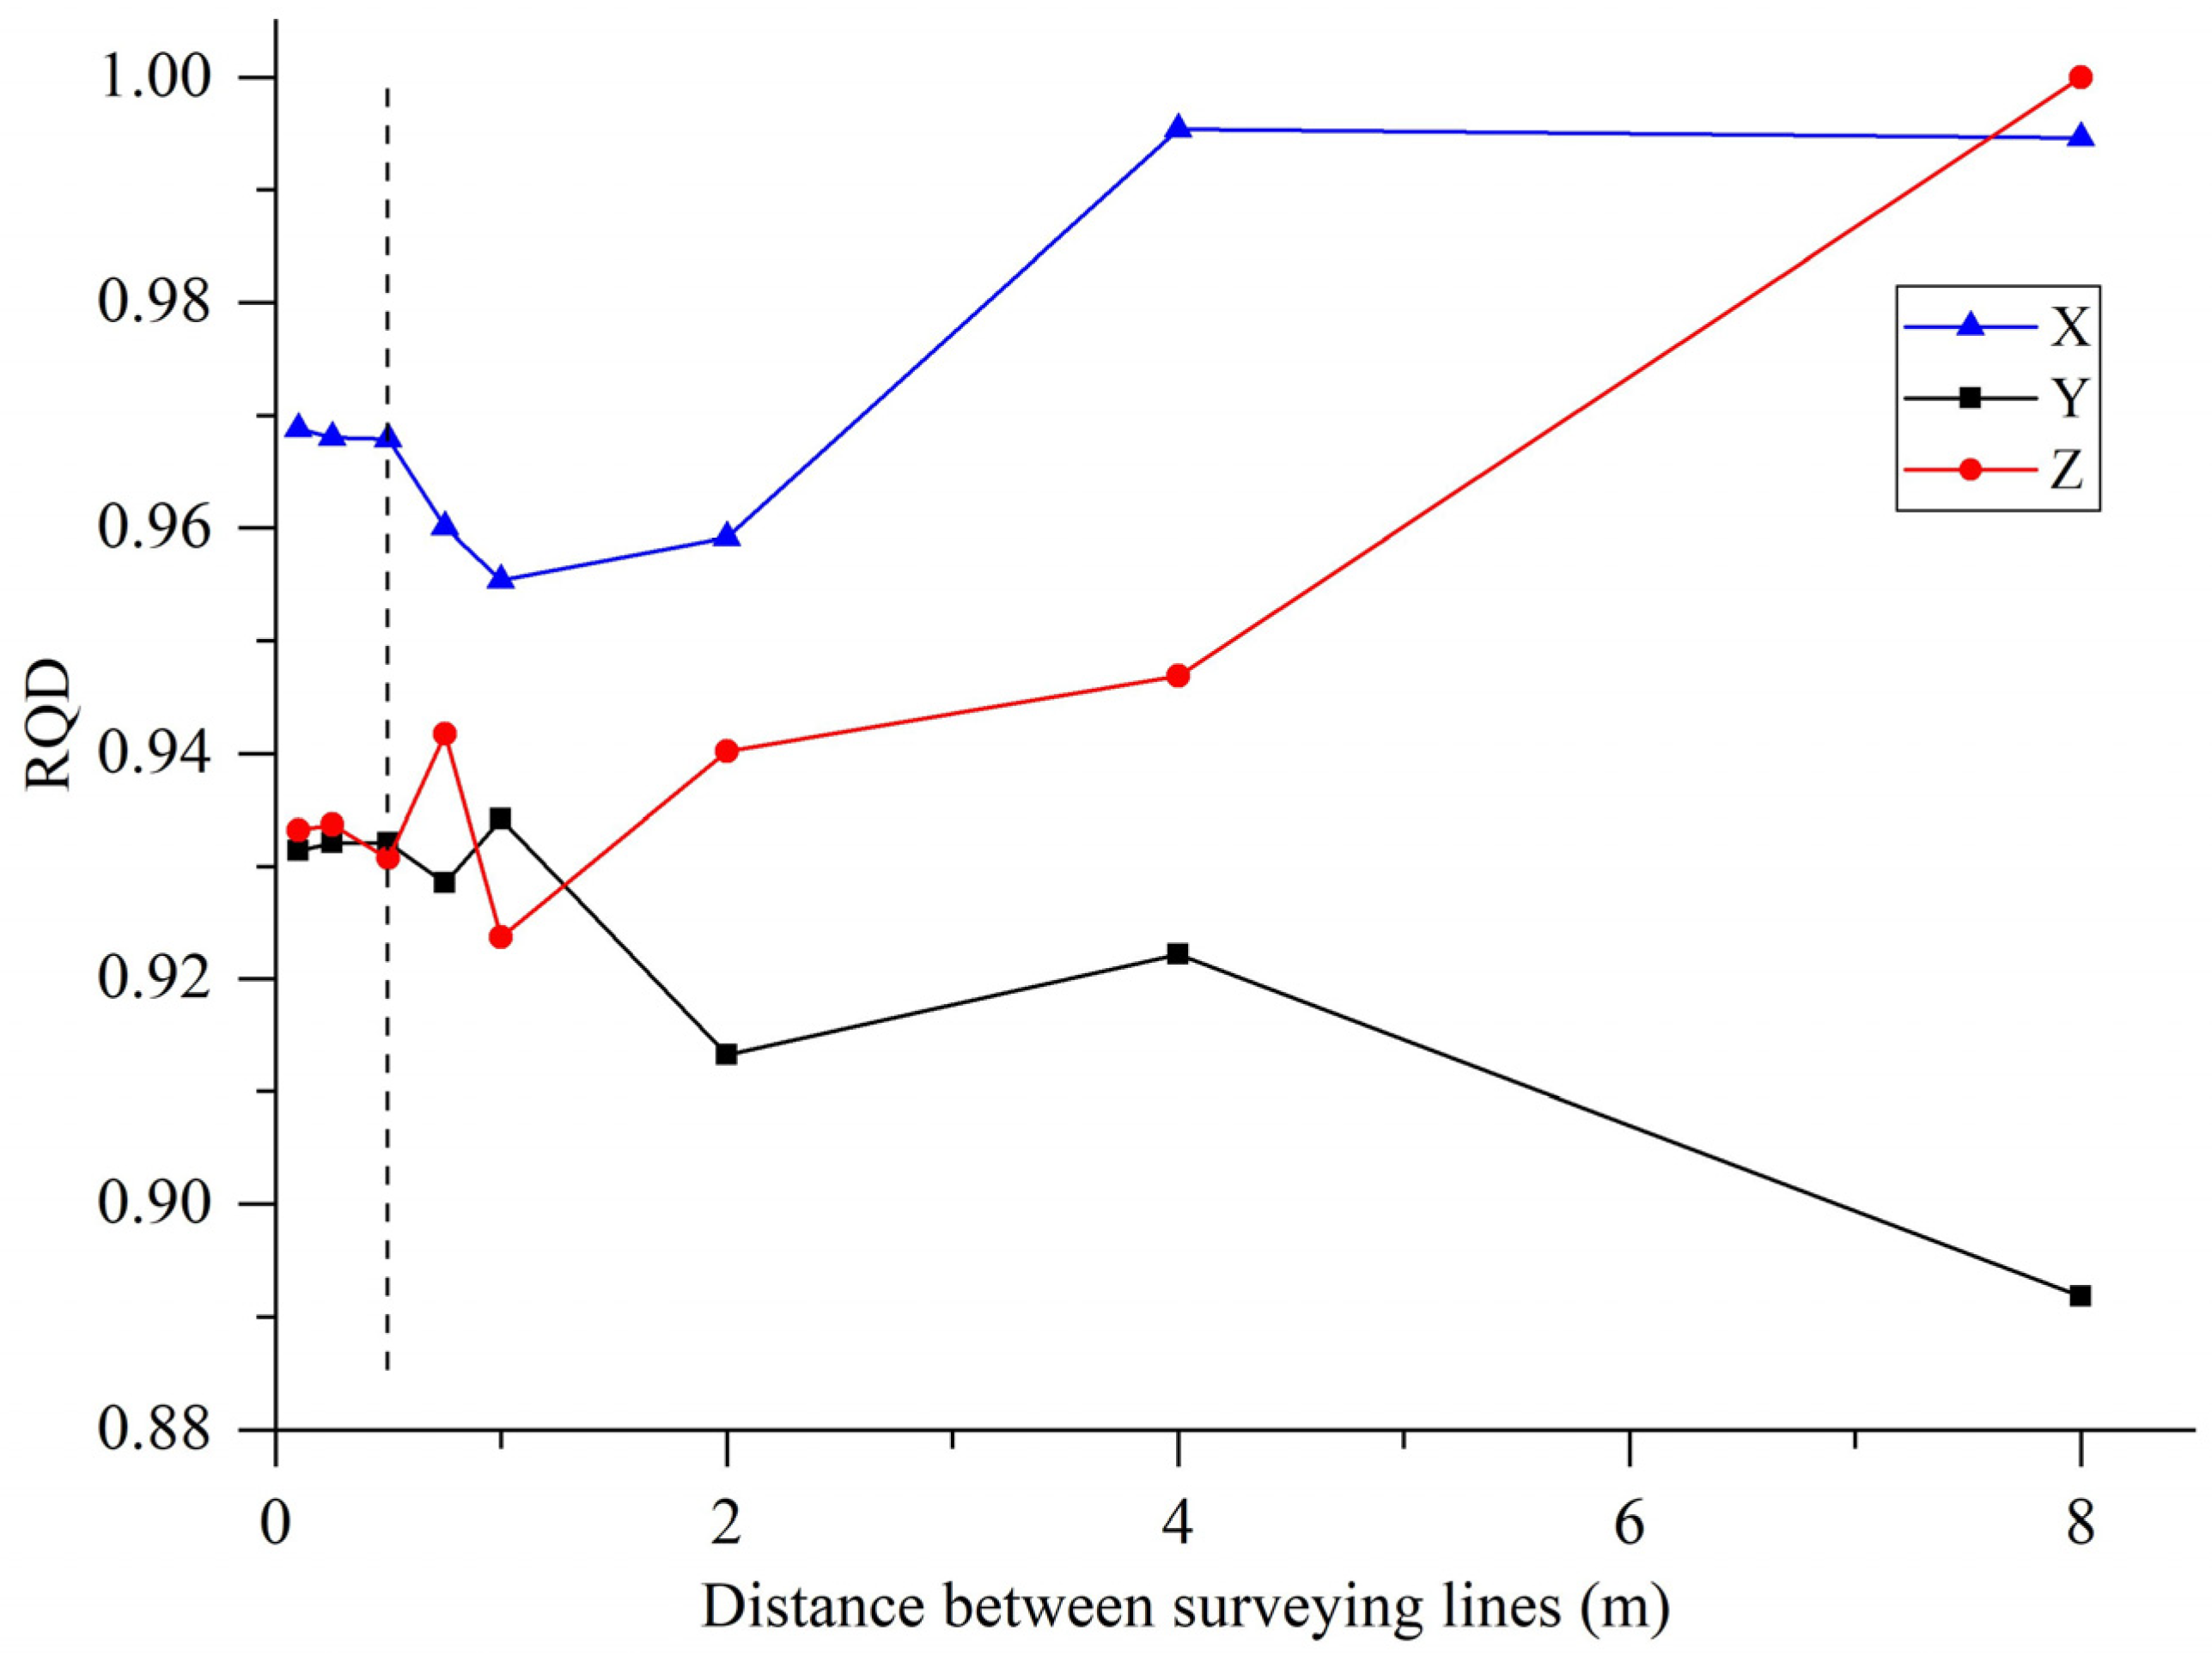
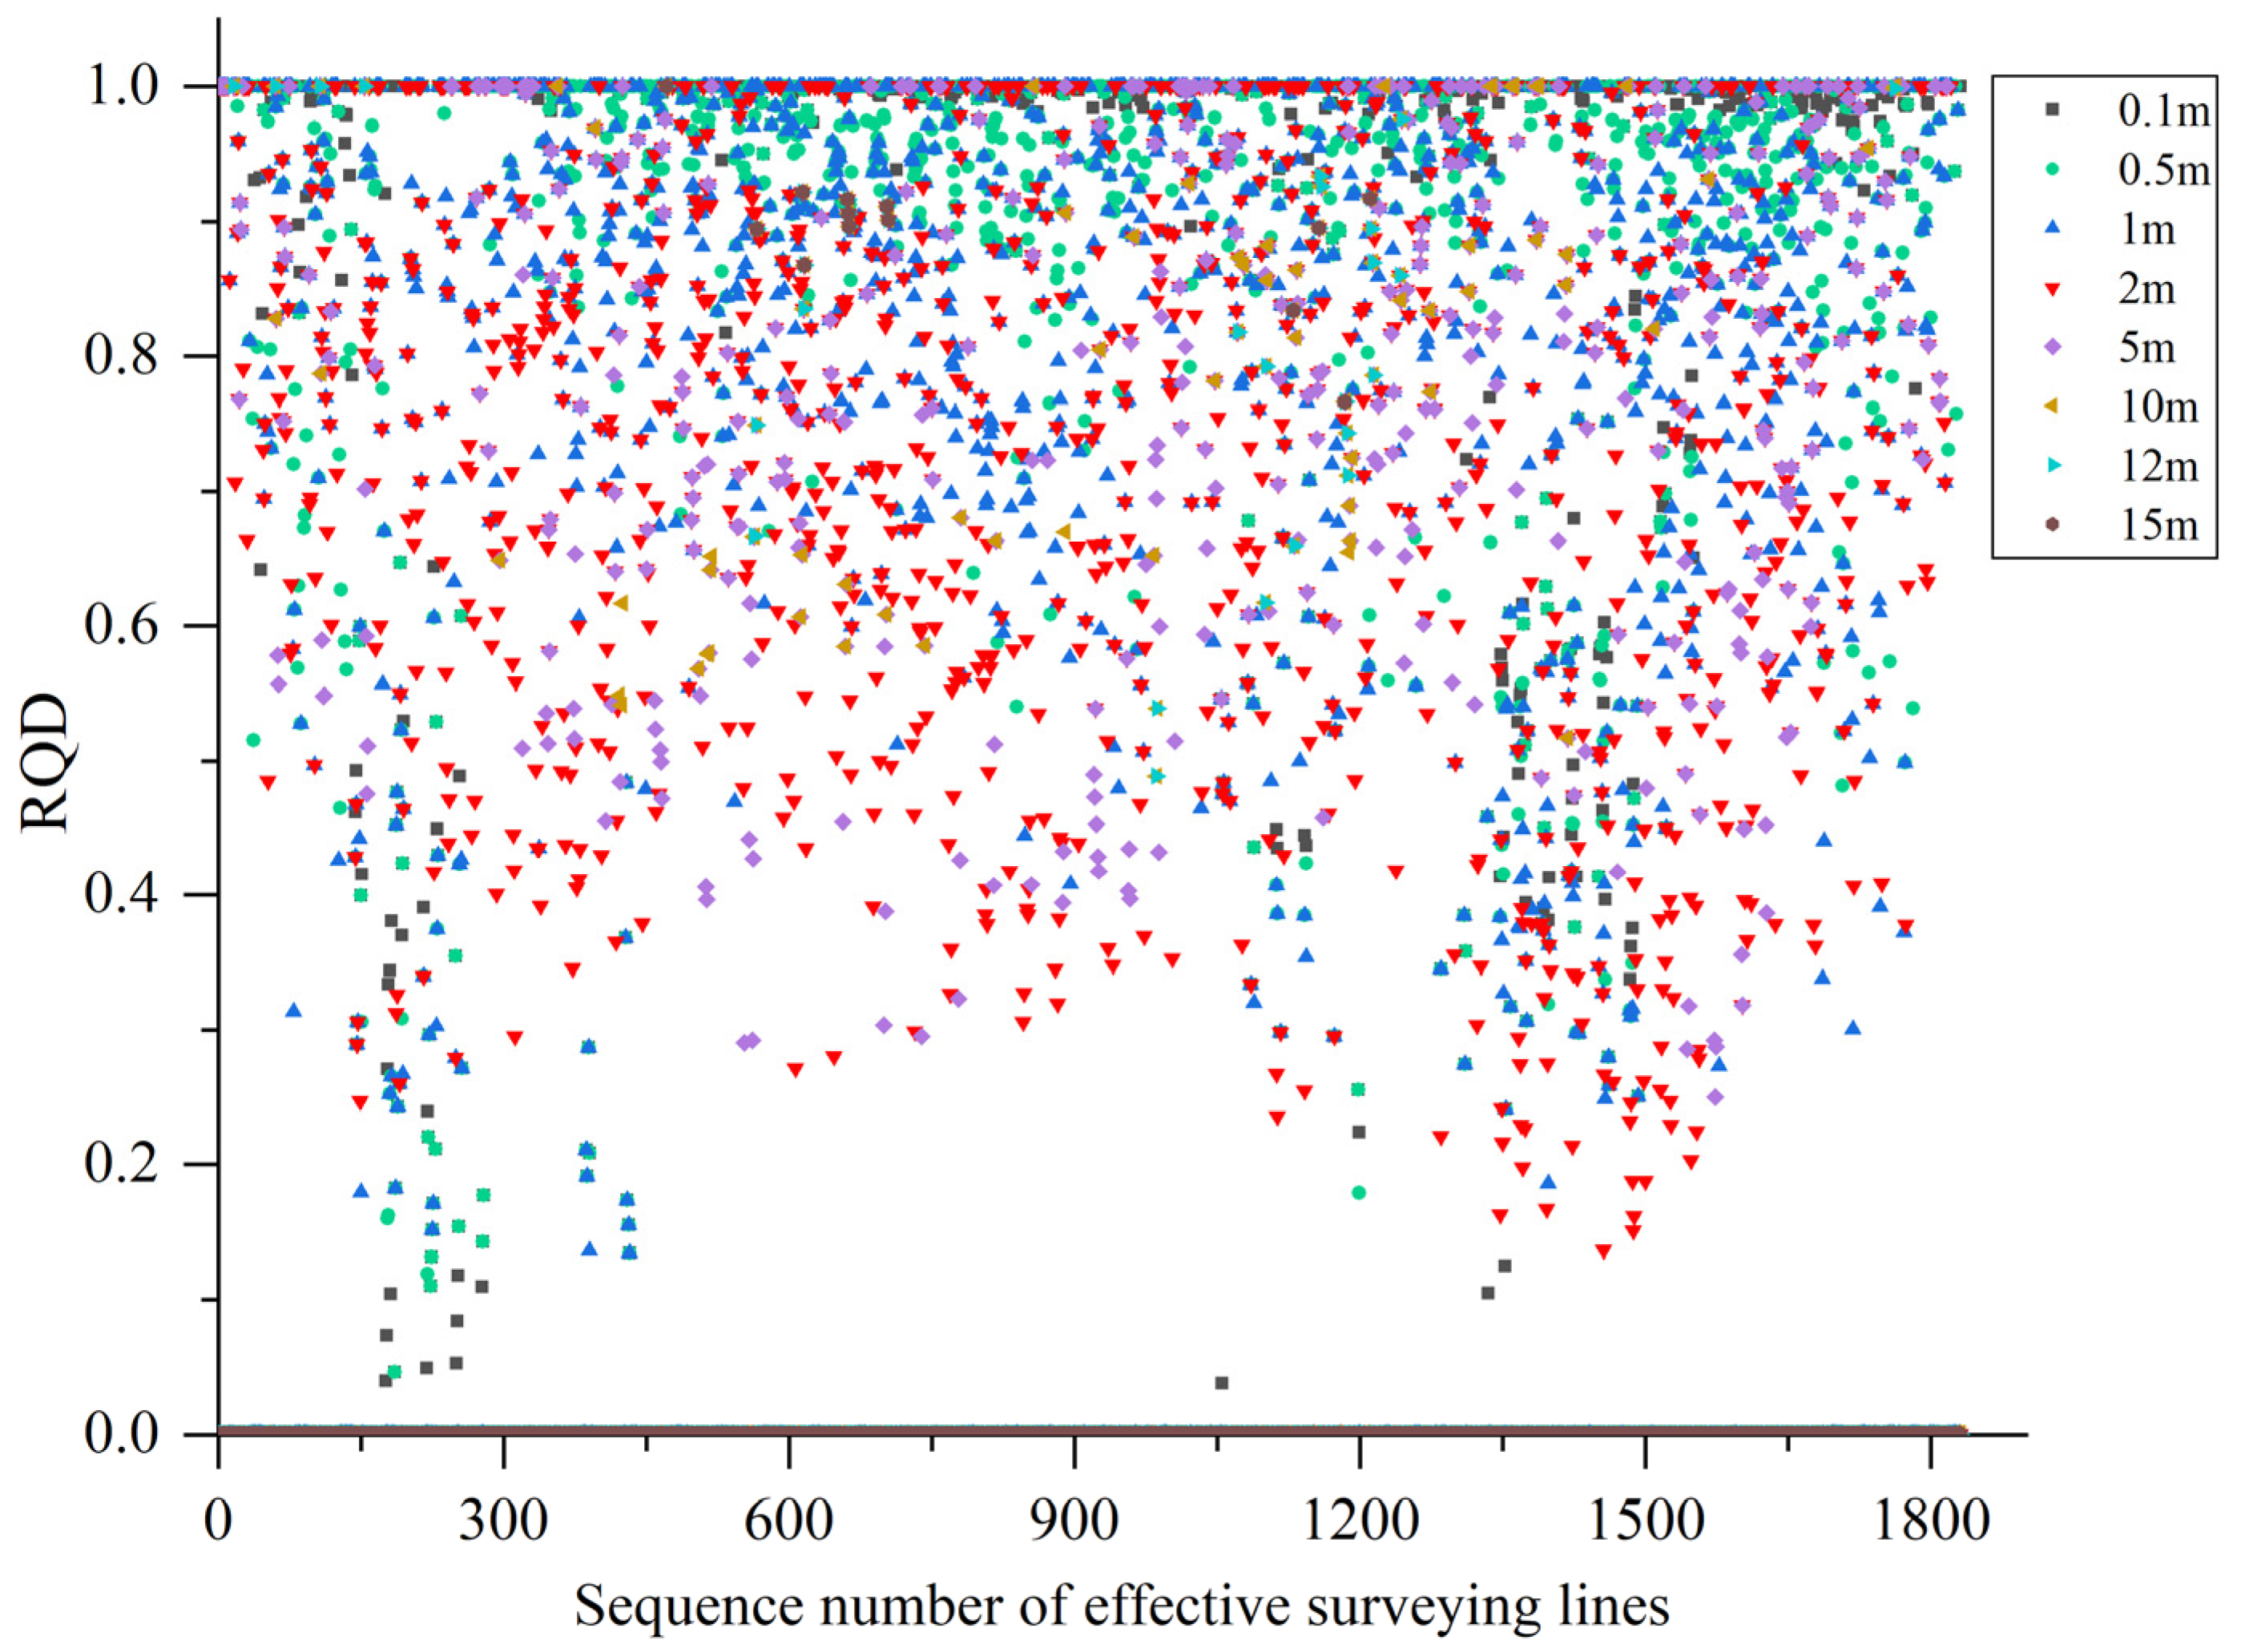
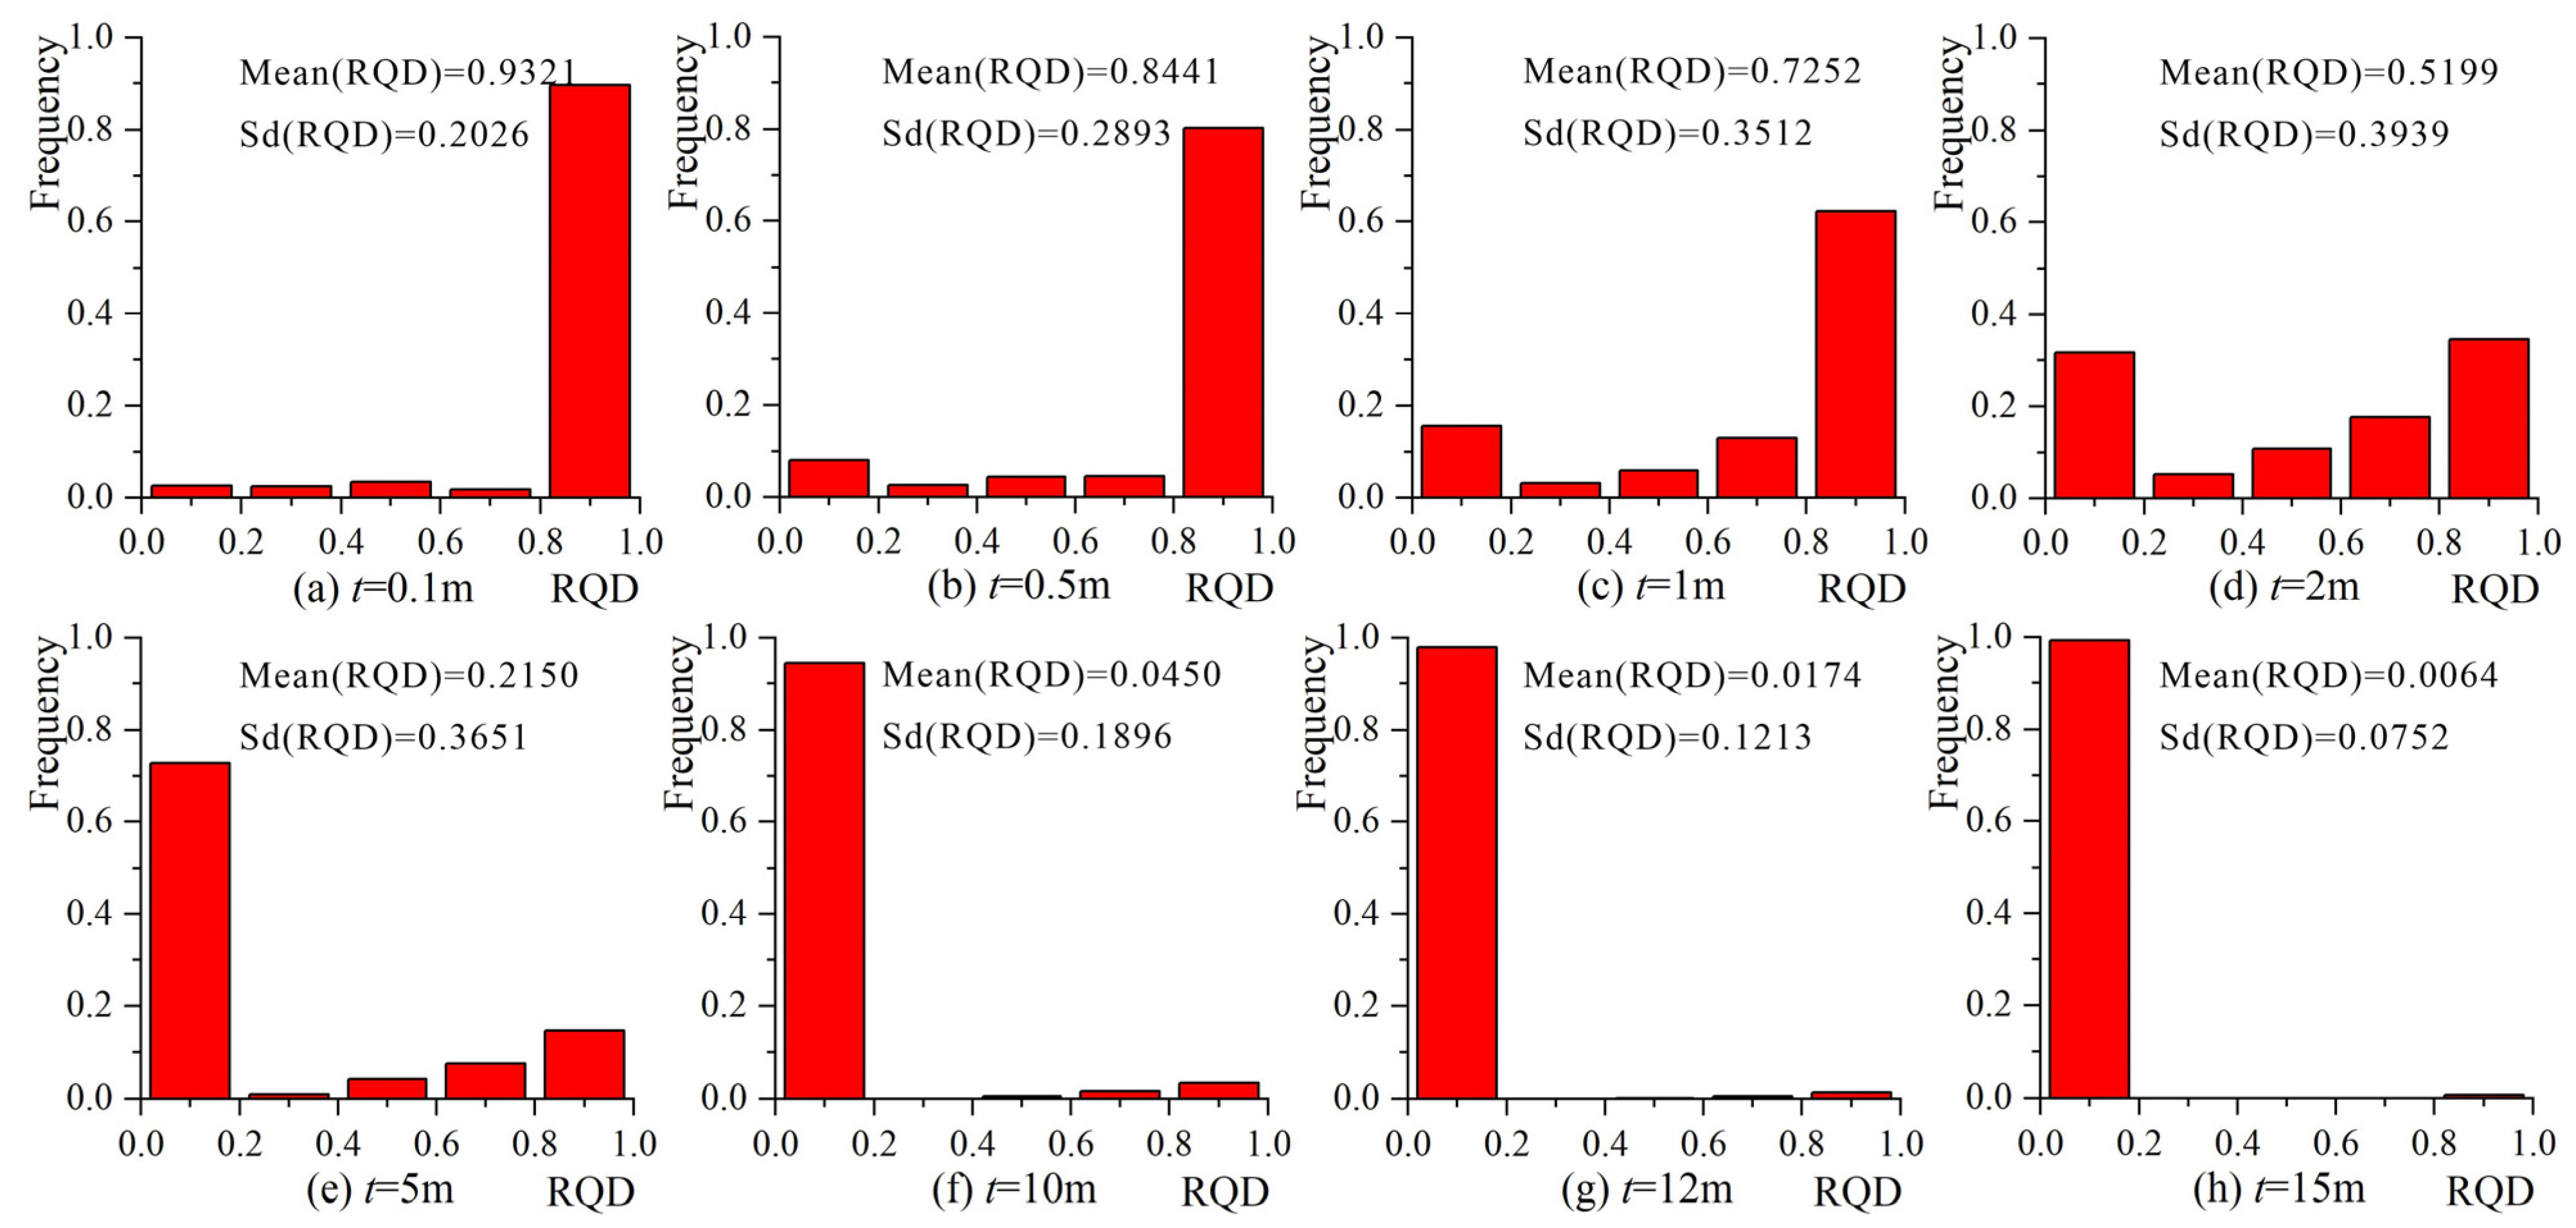
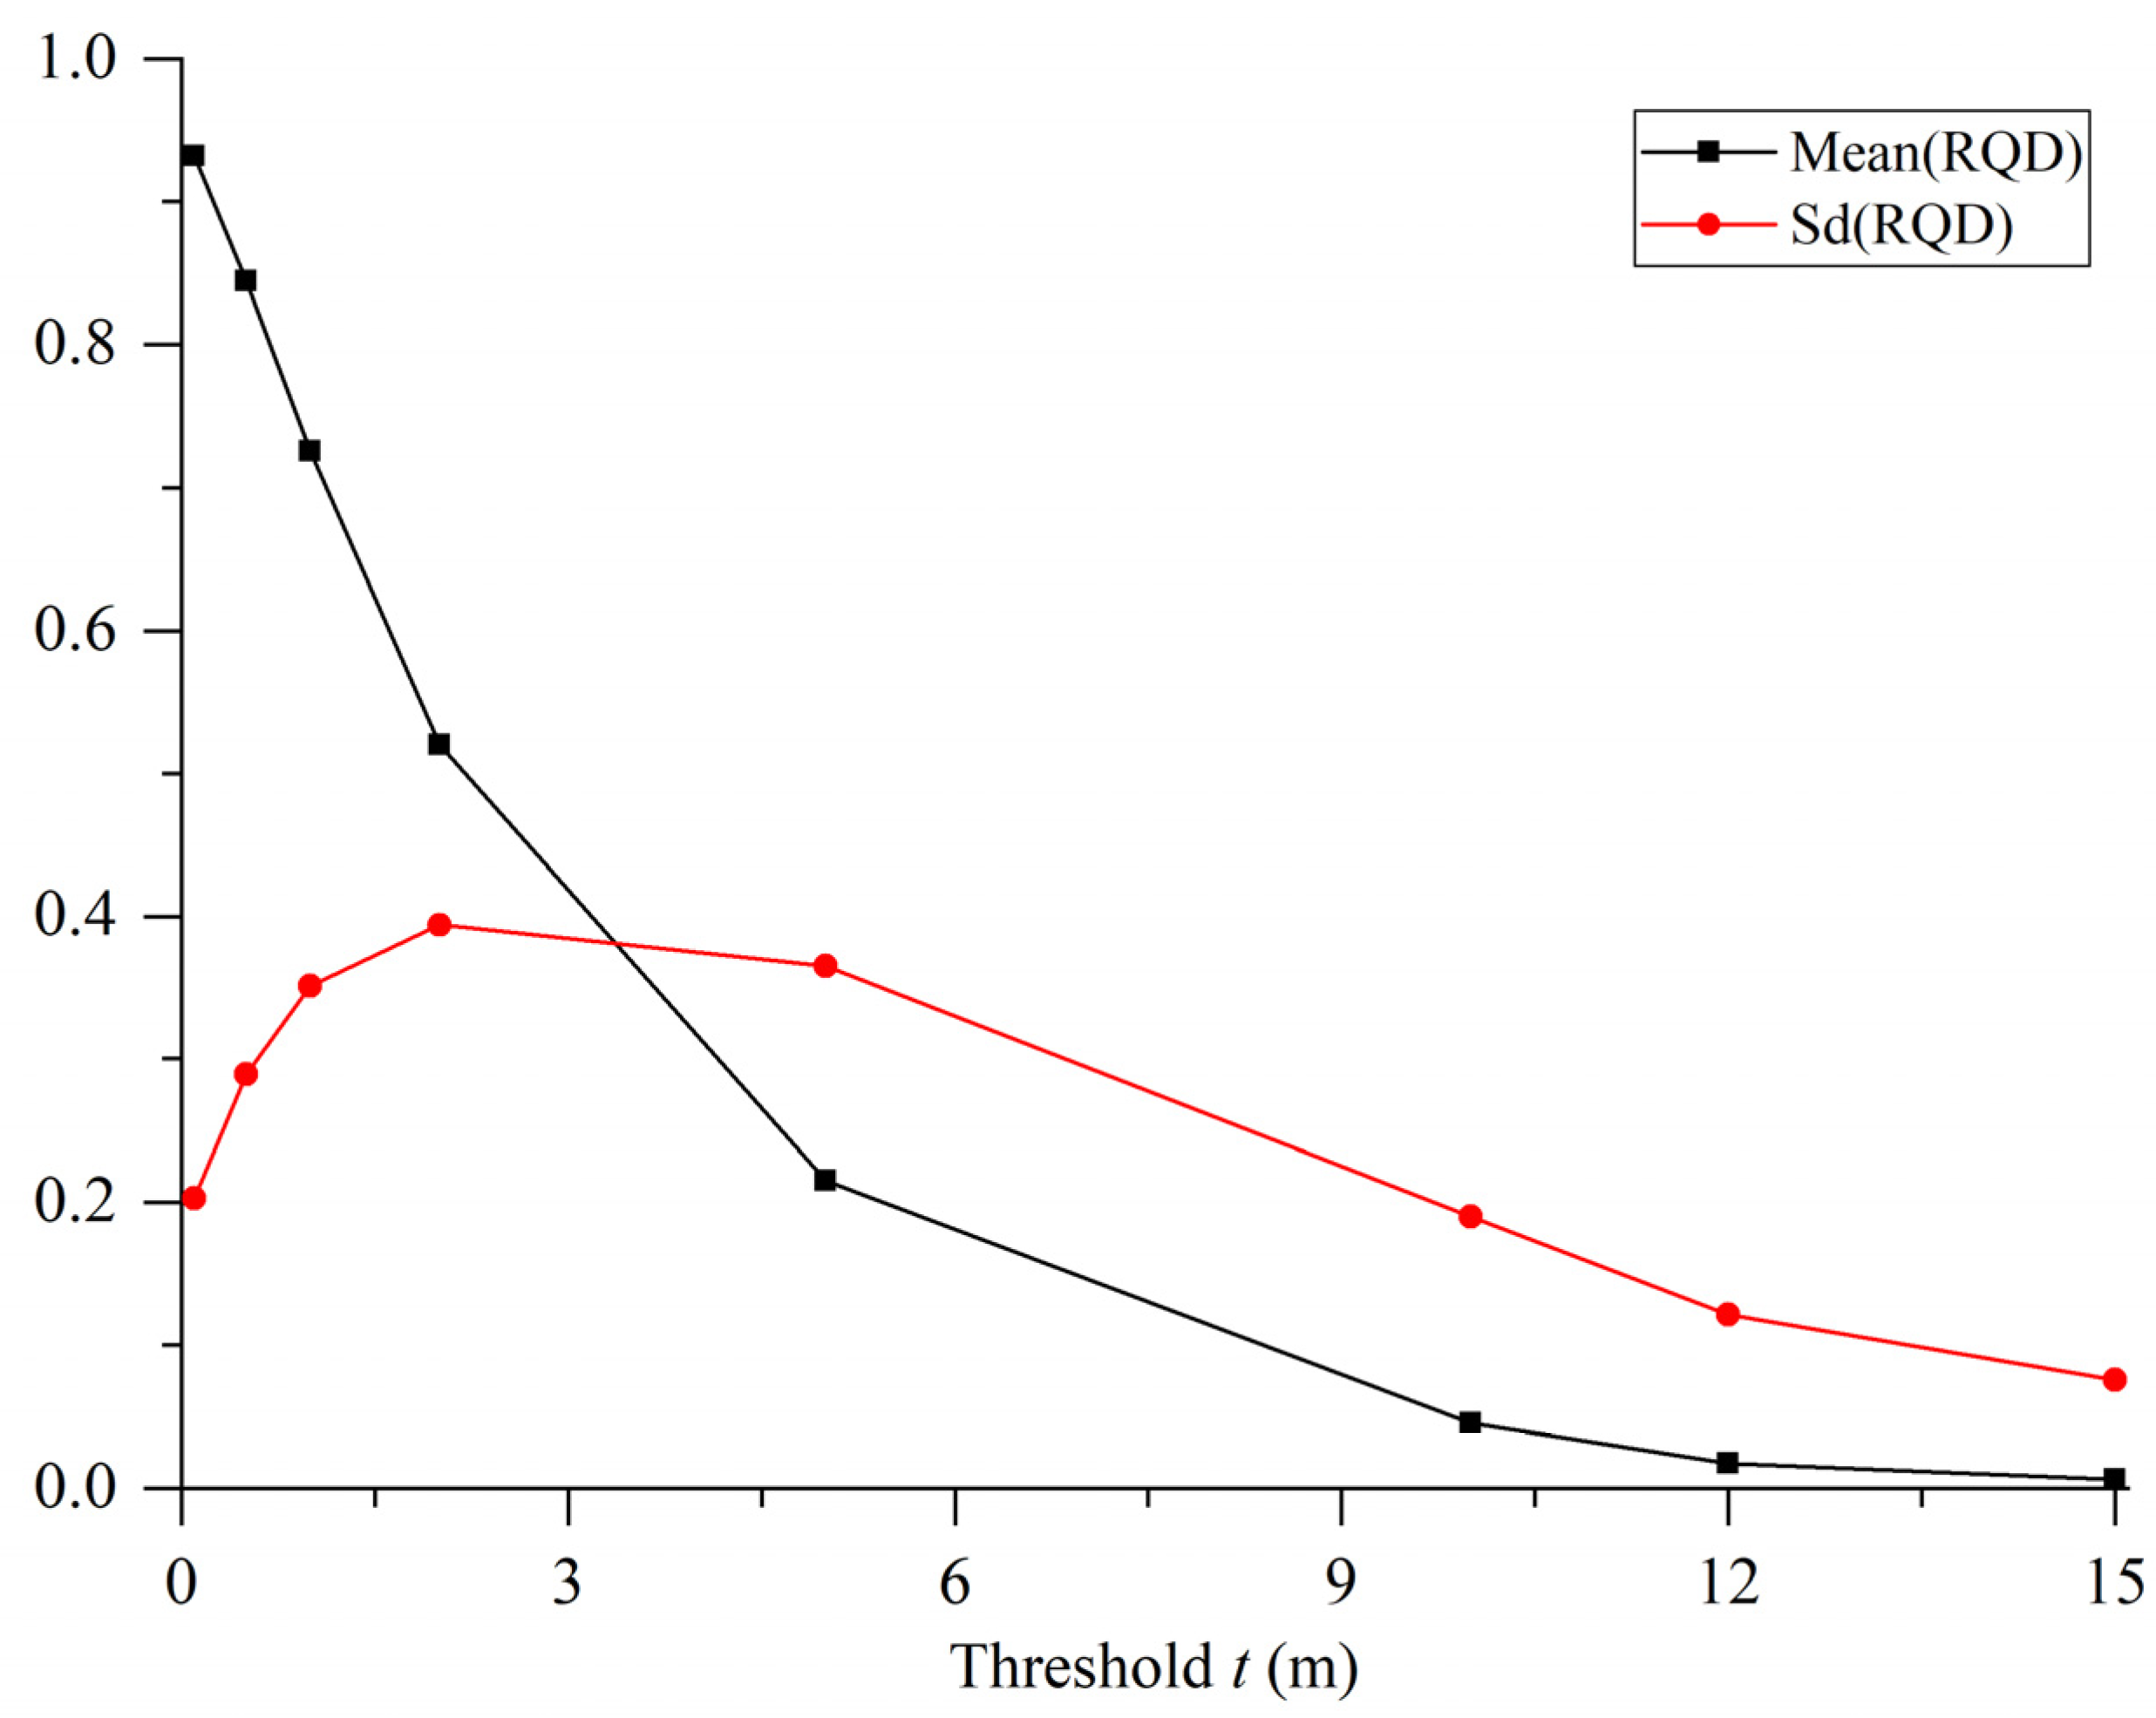
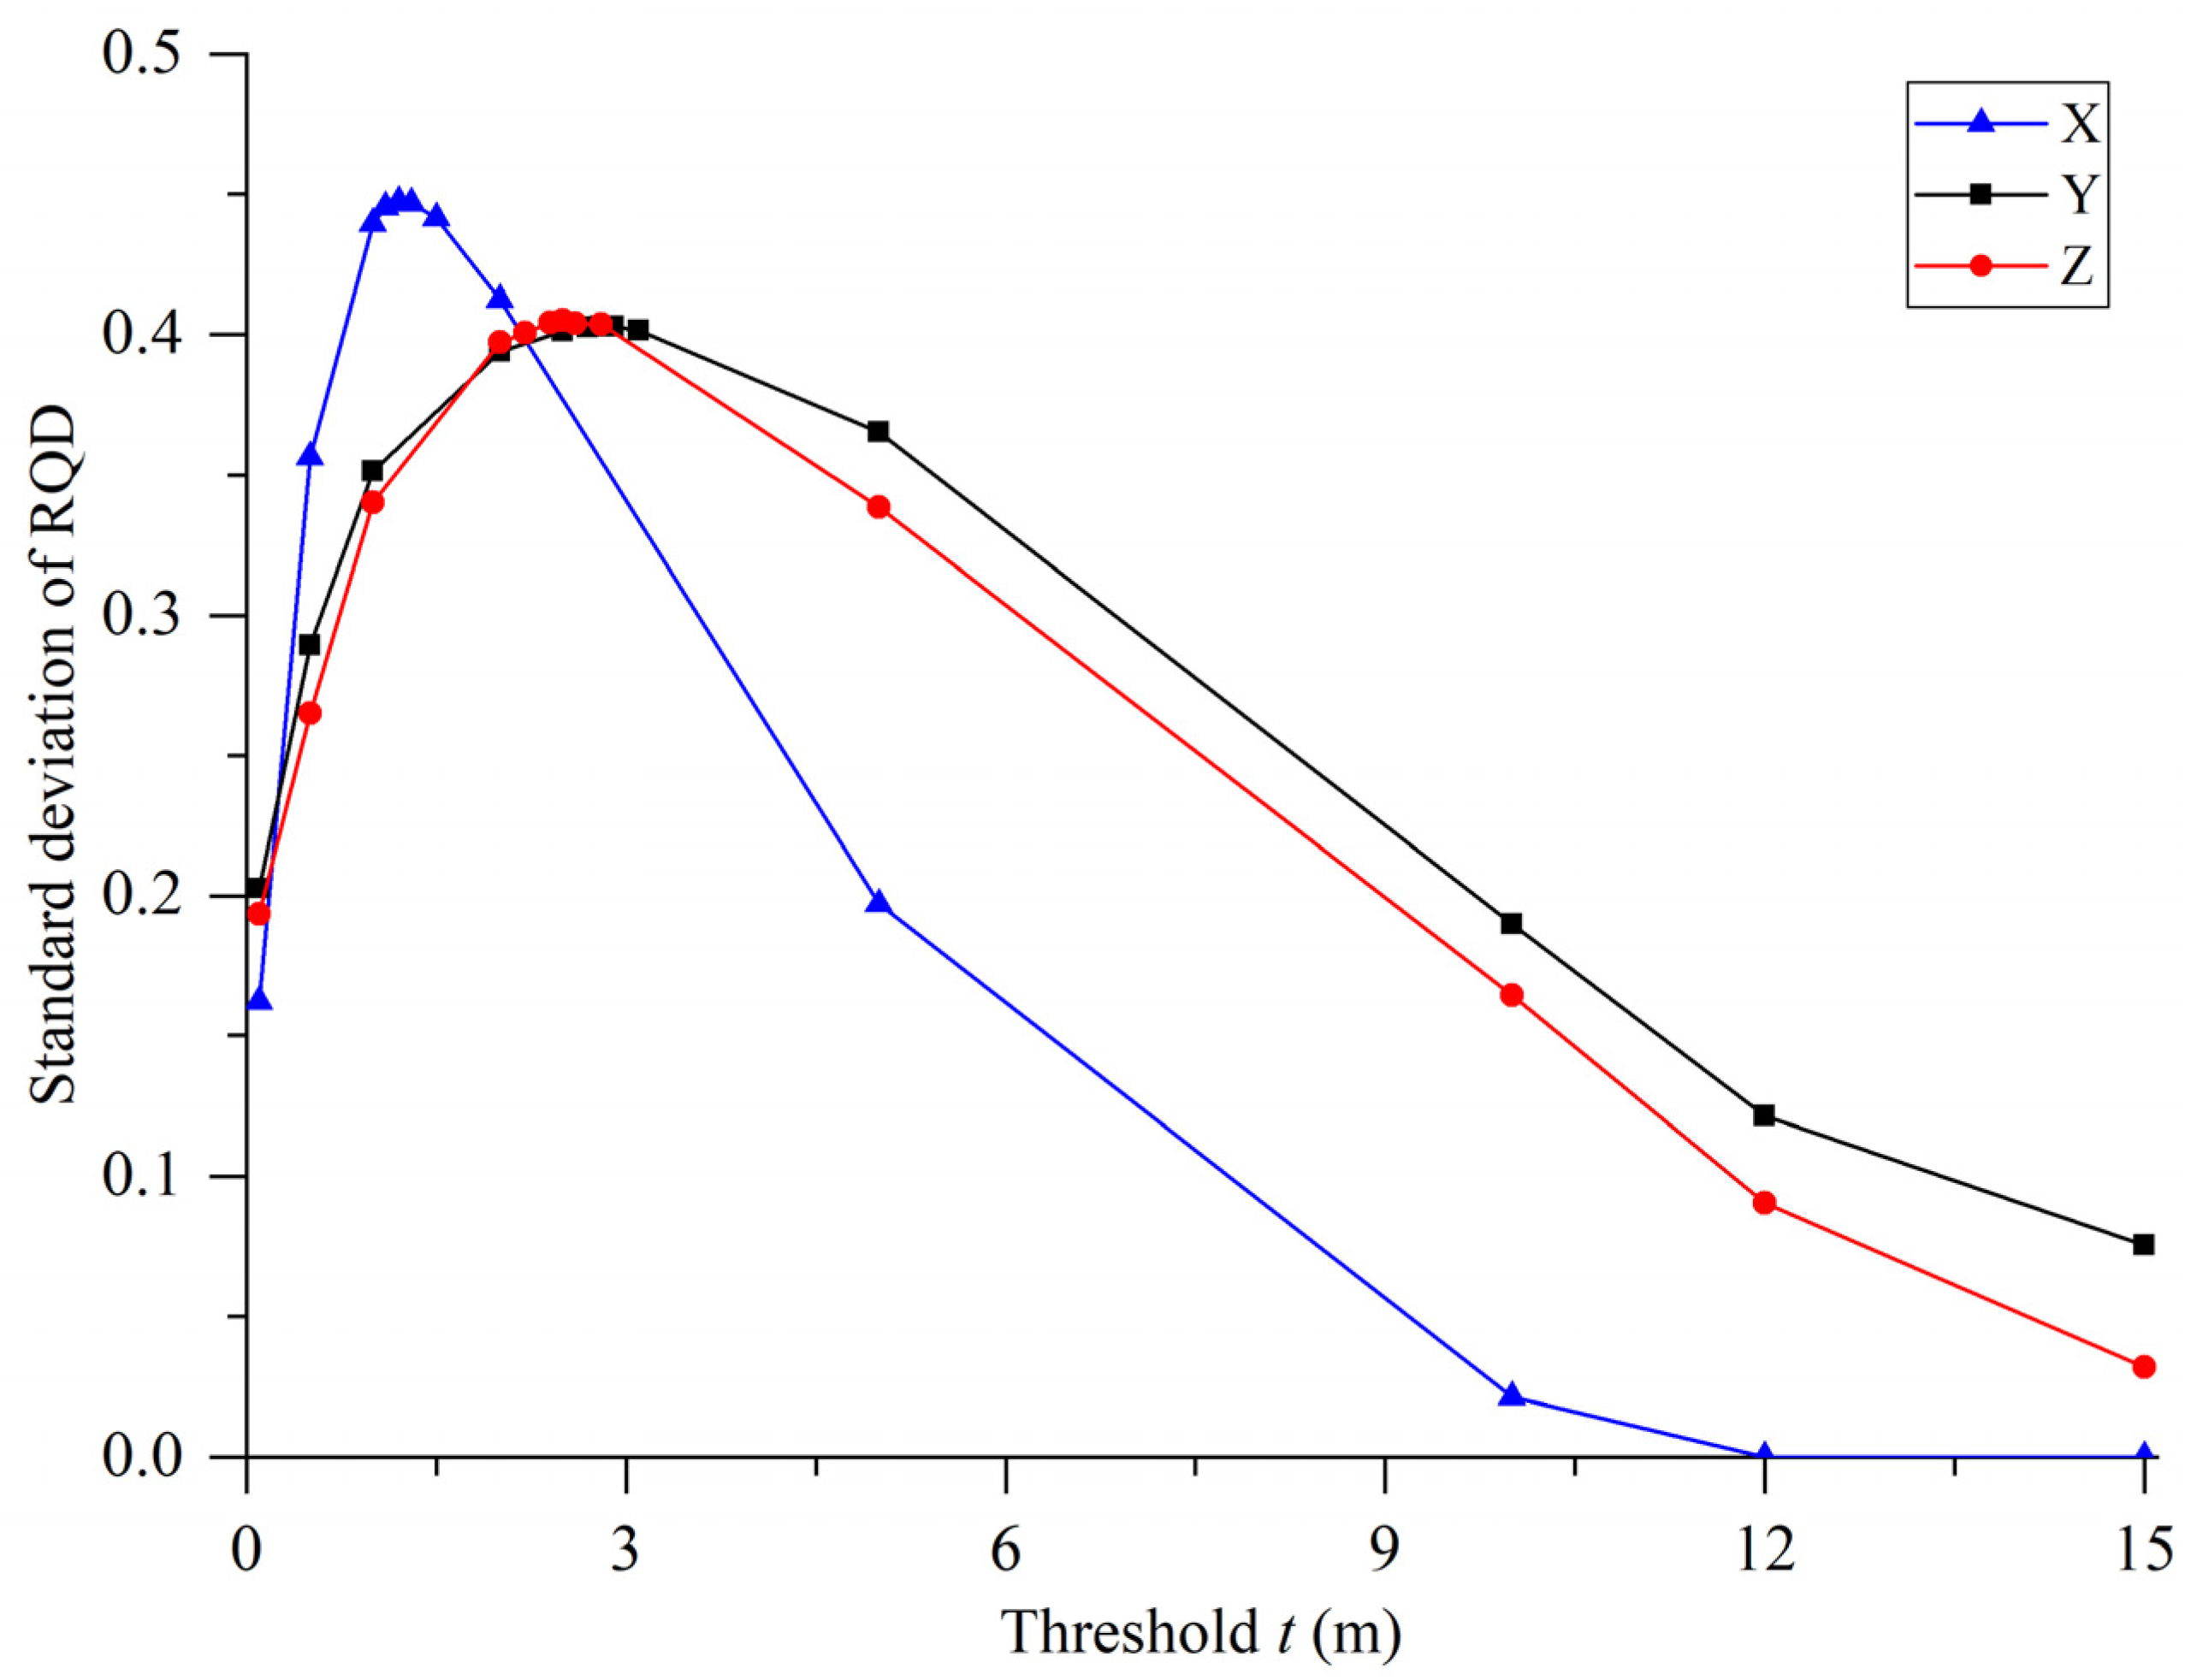
  • According to the anisotropy and heterogeneity of rock mass, the principle of maximum standard deviation of RQD was determined. When several surveying lines are laid parallel to the same direction, the threshold of discontinuity spacing t corresponding to the maximum standard deviation of RQD values obtained by all lines is the optimal threshold. For the research slope in this paper, 0.5 m was set as the distance between surveying lines laid parallel to the X-, Y-, and Z-axes, and the optimal discontinuity spacing thresholds were 1.2, 2.8, and 2.5 m, respectively.
  • Aiming at the problem of discontinuity measurement blank areas caused by gravel accumulation and vegetation on the slope, ellipsoids were set in the blank areas, and the influence of blank areas was eliminated in the RQD calculation. The generalized RQD of rock mass using the measurement data of discontinuities and eliminating the influence of measurement blank areas was obtained to describe the quality of rock mass more accurately. For the research slope in this paper, before and after eliminating the influence of blank areas, the generalized RQD decreased by 1.67%, from 46.58 to 44.91%. After eliminating the influence of measurement blank areas, the change in the generalized RQD of different slope rock mass was different, and the change in quality grade was also different. However, after eliminating the influence of blank areas, the generalized RQD can more accurately reflect the real quality of slope rock mass and provide more reliable data for engineering construction.

Author Contributions

Conceptualization, Q.D. and F.W.; methodology, Q.D.; software, Q.D.; validation, J.C., M.W. and X.Z.; formal analysis, Q.D.; investigation, Q.D.; data curation, Q.D.; writing—original draft preparation, Q.D. and F.W.; writing—review and editing, J.C.; visualization, M.W.; project administration, F.W.; funding acquisition, F.W. and M.W. All authors have read and agreed to the published version of the manuscript.

Funding

This work was supported by the National Natural Science Foundation of China (Grant Nos. 42077242, 42171407), the Key Project of NSFC-Yunnan Joint Fund (Grant No. U1702241), and the Open Fund of Key Laboratory of Urban Land Resources Monitoring and Simulation, Ministry of Natural Resources (Grant No. KF-2020-05-024).

Data Availability Statement

The data presented in this study are available on request from the corresponding author.

Acknowledgments

We would like to thank the students and all the staff in the Surveying and Mapping Engineering Teaching and Research Section of Jilin University who participated in this study.

Conflicts of Interest

The authors declare no conflict of interest.

References

  1. Zhang, W.; Chen, J.; Cao, Z.; Wang, R. Size effect of RQD and generalized representative volume elements: A case study on an underground excavation in Baihetan dam, Southwest China. Tunn. Undergr. Space Technol. 2013, 35, 89–98. [Google Scholar] [CrossRef]
  2. Bertuzzi, R.; Douglas, K.; Mostyn, G. Comparison of quantified and chart GSI for four rock masses. Eng. Geol. 2016, 202, 24–35. [Google Scholar] [CrossRef]
  3. Barton, N. Some new Q-value correlations to assist in site characterisation and tunnel design. Int. J. Rock Mech. Min. Sci. 2002, 39, 185–216. [Google Scholar] [CrossRef]
  4. Romana, M. New Adjustment Ratings for Application of Bieniawski Classification to Slopes. In Proceedings of the International Symposium on the Role of Rock Mechanics, Zacatecas, Mexico, 2–4 September 1985; pp. 49–53. [Google Scholar]
  5. Zheng, J.; Zhao, Y.; Lü, Q.; Deng, J.; Pan, X.; Li, Y. A discussion on the adjustment parameters of the Slope Mass Rating (SMR) system for rock slopes. Eng. Geol. 2016, 206, 42–49. [Google Scholar] [CrossRef]
  6. Sadagah, B.H.; Qari, M.Y.H.T. Regional Rock Quality Designation (RRQD) of the West Central Arabian Shield. Environ. Eng. Geosci. 1993, 30, 455–467. [Google Scholar] [CrossRef]
  7. Du, S.; Xu, S.; Yang, S.; Chen, J.; Wang, S. Application of rock quality designation (RQD) to engineering classification of rocks. J. Eng. Geol. 2000, 8, 351–356. [Google Scholar]
  8. Niibori, Y.; Nakata, R.; Tochiyama, O.; Mimura, H. Evaluation of Solute Transport through a Fracture by Considering the Spatial Distributions of Retardation Effect in Grain Scale. J. Hydrol. Eng. 2009, 14, 1214–1220. [Google Scholar] [CrossRef]
  9. Huang, R.; Huang, J.; Ju, N.; Li, Y. Automated tunnel rock classification using rock engineering systems. Eng. Geol. 2013, 156, 20–27. [Google Scholar] [CrossRef]
  10. Aydan, Ö.; Ulusay, R.; Tokashiki, N. A New Rock Mass Quality Rating System: Rock Mass Quality Rating (RMQR) and Its Application to the Estimation of Geomechanical Characteristics of Rock Masses. Rock Mech. Rock Eng. 2013, 47, 1255–1276. [Google Scholar] [CrossRef]
  11. Deere, D.U. Technical description of rock cores for engineering purposes. Rock Mech. Eng. Geol. 1964, 9, 17–22. [Google Scholar]
  12. Chen, J.; Wang, Q.; Zhao, H. Obtaining RQD of rock mass by sampling window method. Chin. J. Rock Mech. Eng. 2004, 29, 1491–1495. [Google Scholar]
  13. Wang, G.; Xiao, S.; Chen, J. Discontinuities in three-dimensional network of applied research in the RQD. Chin. J. Rock Mech. Eng. 2002, 21, 1761–1764. [Google Scholar]
  14. Zhang, W.; Wang, Q.; Chen, J.-P.; Tan, C.; Yuan, X.-Q.; Zhou, F.-J. Determination of the optimal threshold and length measurements for RQD calculations. Int. J. Rock Mech. Min. Sci. 2012, 51, 1–12. [Google Scholar] [CrossRef]
  15. Zhang, W.; Chen, J.; Wang, Q.; Ma, D.; Niu, C.; Zhang, W. Investigation of RQD variation with scanline length and optimal threshold based on three-dimensional fracture network modeling. Sci. China Technol. Sci. 2013, 56, 739–748. [Google Scholar] [CrossRef]
  16. Azimian, A. A New Method for Improving the RQD Determination of Rock Core in Borehole. Rock Mech. Rock Eng. 2015, 49, 1559–1566. [Google Scholar] [CrossRef]
  17. Du, S.; Wang, S. Anisotropy analysis of rock quality index RQD. J. Eng. Geol. 1996, 4, 48–54. [Google Scholar]
  18. Du, S.; Wang, S. Review and trend of quantifying rock quality. J. Eng. Geol. 1998, 6, 230–237. [Google Scholar]
  19. Palmstrom, A. Application of the Volumetric Joint Count as a Measure of Rock Mass Jointing. In Proceedings of the International Symposium on Fundamentals of Rock Joints, Björkliden, Sweden, 15–20 September 1985; pp. 103–110. [Google Scholar]
  20. Sen, Z.; Eissa, E.A. Rock quality charts for log-normally distributed block sizes. Int. J. Rock Mech. Min. Sci. Geomech. Abstr. 1992, 29, 1–12. [Google Scholar] [CrossRef]
  21. Li, P.; Yang, J.; Yang, J.; Zhao, W.; Nie, D. New formulae for volumetric joint count Jv of jointed rock mass. J. Eng. Geol. 2009, 17, 240–243. [Google Scholar]
  22. Eissa, E.A.; Sen, Z. Fracture simulation and mulity-directional rock quality designation. Bull. Assoc. Eng. Geol. 1991, 2, 193–201. [Google Scholar]
  23. Chen, W.; Yang, J.; Tan, X.; Yu, H. Study on mechanical parameters of fractured rock masses. Sci. China Technol. Sci. 2011, 54, 140–146. [Google Scholar] [CrossRef]
  24. Harrison, J.P. Selection of the threshold value in RQD assessments. Int. J. Rock Mech. Min. Sci. 1999, 36, 673–685. [Google Scholar] [CrossRef]
  25. Zheng, J.; Yang, X.; Lü, Q.; Zhao, Y.; Deng, J.; Ding, Z. A new perspective for the directivity of Rock Quality Designation (RQD) and an anisotropy index of jointing degree for rock masses. Eng. Geol. 2018, 240, 81–94. [Google Scholar] [CrossRef]
  26. Huang, L.; Tang, H.; Zhang, L.; Ge, Y.; Liu, Y. New model of relation between rock discontinuities trace length and diameter for semi-trace scanline sampling and new algorithm. Chin. J. Rock Mech. Eng. 2011, 30, 733–745. [Google Scholar]
  27. Wang, F. Engineering Application of Rapid Acquiring Rock Mass Fractures Information with Digital Close Range Photogrammetry. Master’s Thesis, Jilin University, Changchun, China, 2006. [Google Scholar]
  28. Wang, F.; Huang, R.; Chen, J.; Yang, G.; Ma, L. Control surveying of rock mass slope and orientation validation measurement of discontinuities based on reflectorless total station instrument. J. Jilin Univ. 2013, 43, 1607–1614. [Google Scholar]
  29. Wang, F.; Chen, J.; Yang, G.; Sun, F.; Jiang, Q. Solution models of geometrical information of rock mass discontinuities based on digital close range photogrammetry. J. Jilin Univ. 2012, 42, 1839–1846. [Google Scholar]
Figure 1. Geographical location and real scene of research slope.
Remotesensing 14 02275 g001
Figure 2. (a) Principle of digital close-range photogrammetry; (b) Schematic diagram of photograph perpendicular to slope.
Remotesensing 14 02275 g002
Figure 3. (a) Pole diagram of orientation of discontinuities; (b) Spatial expression of trace of discontinuities.
Remotesensing 14 02275 g003
Figure 4. Three-dimensional representation of discontinuity.
Remotesensing 14 02275 g004
Figure 5. Determining RQD of a single surveying line, which eliminates influence of measurement blank area.
Remotesensing 14 02275 g005
Figure 6. Three-dimensional disk model of discontinuities with ellipsoids.
Remotesensing 14 02275 g006
Figure 7. Schematic diagram of surveying lines laid parallel to coordinate axes.
Remotesensing 14 02275 g007
Figure 8. Relationship between RQD and distance between surveying lines.
Remotesensing 14 02275 g008
Figure 9. RQD values on parallel Y-axis effective surveying lines under different thresholds.
Remotesensing 14 02275 g009
Figure 10. RQD frequency distribution histogram of parallel Y-axis surveying lines under different thresholds.
Remotesensing 14 02275 g010
Figure 11. Variation in RQD mean and standard deviation with threshold t on parallel Y-axis surveying lines.
Remotesensing 14 02275 g011
Figure 12. Relationship between RQD standard deviation and discontinuity spacing threshold.
Remotesensing 14 02275 g012
Table 1. Measured data of discontinuities from research slope.
Discontinuity NumberX1Y1Z1X2Y2Z2Dip (°)Dip Angle
(°)
11042.061298.811019.301043.361300.221017.0422.5252.30
21041.711300.381019.221042.141299.531019.0322.7168.85
31042.191299.661018.811042.921300.801017.73358.8958.73
41043.071300.231017.021042.751300.011017.51124.4387.86
6811063.201281.84996.371063.591281.17995.3626.5787.96
6821063.011282.11996.671063.661281.78995.628.7460.64
6831065.461283.05997.031064.611281.58995.35186.7058.89
Table 2. Geometric parameters of seven ellipsoids used to fill in the blank fields.
Ellipsoid NumberCoordinates of Ellipsoid CenterLength of Half Axis
XeYeZeABC
11038.01271.01010.34.82.61.8
21034.51269.01014.54.03.31.5
31035.81266.71010.64.51.61.6
41045.91293.31016.35.53.52.0
51050.81272.0998.24.32.41.4
61052.81278.9999.35.84.32.2
71058.41286.1998.25.83.81.8
Table 3. Change in RQD with distance between surveying lines.
Distance between Surveying Lines (m)Generalized RQD
Parallel X-axis
Surveying Line
Parallel Y-axis
Surveying Line
Parallel Z-axis
Surveying Line
0.196.88%93.14%93.32%
0.2596.80%93.21%93.37%
0.596.79%93.21%93.07%
0.7596.01%92.85%94.17%
195.54%93.42%92.37%
295.92%91.32%94.02%
499.54%92.21%94.69%
899.46%89.18%100.00%
Table 4. Comparison of generalized RQD of rock mass before and after blank areas are eliminated.
Parallel Direction of
Surveying Lines
Without Eliminating Blank AreasEliminate Blank Areas
X-axisY-axisZ-axisX-axisY-axisZ-axis
Threshold t (m)1.22.82.51.22.82.5
Number of effective
surveying lines
223918311974223918311974
Average generalized RQD50.57%41.93%46.37%50.54%40.19%42.90%
Comprehensive
generalized RQD
46.58%44.91%
Publisher’s Note: MDPI stays neutral with regard to jurisdictional claims in published maps and institutional affiliations.

