Article

Identification of Coupling Relationship between Ecosystem Services and Urbanization for Supporting Ecological Management: A Case Study on Areas along the Yellow River of Henan Province

1
College of Resources and Environmental Sciences, Henan Agricultural University, Zhengzhou 450002, China
2
Henan Engineering Research Center of Land Consolidation and Ecological Restoration, Henan Agricultural University, Zhengzhou 450002, China
3
Faculty of Geographical Science, Beijing Normal University, Beijing 100875, China
*
Author to whom correspondence should be addressed.
Submission received: 1 April 2022 / Revised: 30 April 2022 / Accepted: 6 May 2022 / Published: 9 May 2022
(This article belongs to the Special Issue Remote Sensing Applications in Urban Ecosystem Services)

Abstract

:
Urbanization has an important effect on ecosystem services (ESs) and identifying the relationship between urbanization and ESs can provide a decision-making reference for regional ecological protection and management. Taking the areas along the Yellow River of Henan Province (AYRHP) as a research area, a coupling system of ESs and urbanization is established in this study to reveal the coupling relationship between the two. ESs are estimated by using Carnegie–Ames–Stanford approach, revision universal soil loss equation, and Integrated Valuation of Ecosystem Services and Trade-offs (InVEST) models. The urbanization level is evaluated from three dimensions, namely, population, economy, and land. The coupling coordination relationship between various ESs and urbanization in AYRHP is quantified from 2000 to 2018 on the county scale based on the coupling coordination degree (CCD) model. The lead–lag relationship between ESs and urbanization is identified by using the relative development degree model, and ecological management zoning is conducted. Results show that in the study period, net primary production (NPP), soil conservation, and food production are increased, whereas water yield is decreased. In the study period, population, economy, and land urbanization level are increasing, and the comprehensive urbanization level is increased by 51.63%. The total CCD between NPP, food production, and water yield and comprehensive urbanization is basic or moderate coordination, whereas that between soil conservation and comprehensive urbanization is moderate maladjustment. In the research period, the coupling coordination between NPP and food production and comprehensive urbanization is increasing; that between water yield and comprehensive urbanization is fluctuated; and that between soil conservation and comprehensive urbanization is decreasing. The result of the research into the relative development degree in 2018 showed that food production, water yield, and soil conservation lag behind the urbanization level in most regions and counties along the Yellow River of Henan Province. On the basis of the lead–lag relationship between different ESs and urbanization level, the AYRHP are divided into ecological reconstruction area, ecological and agricultural improvement area, and ecological conservation area. CCD and relative development degree models can be used to evaluate the coordination relationship between ESs and urbanization, which provides scientific support for regional ES management.

Graphical Abstract

1. Introduction

Since entering the 21st century, global urbanization has been advancing rapidly. By 2018, global urbanization has increased to 55%, which is nearly 130% higher than that of 1950. Since reform and opening up, China’s urbanization has also developed rapidly, growing from 10.6% in 1949 to 59.6% in 2018 [1]. In 2019, China’s urbanization level reached 60.6%, indicating that China has rapidly promoted the urbanization. The rapid development of urbanization has brought huge economic and social benefits, which makes more and more people gather in cities and towns, but intensifies the contradiction and conflict between people and the environment [2]. Urbanization has driven the rapid development of society and culture, but it has also led to the increasing degradation of water and soil resources and the reduction in ecosystem functions; this situation has brought pressure and challenges to the protection of ecological environment [3,4]. The Future Earth Plan, 2030 Agenda for Sustainable Development, Habitat, and other conferences emphasize that urbanization shall not only be coordinated with the ecological environment but also adapt to the carrying capacity of resources and environment [5]. How to promote the development of urbanization and minimize its negative effect on ecological environment has become a hot topic, which arouses concern for society. Identifying the relationship between urbanization and ecological environment has also become an important basis for China’s ecological civilization construction [2]. The existing research results of scholars include the evaluation on the coupling between urbanization and ecological environment [6,7], mutual relationship [8], and coupling theory and mechanism [9,10]. In the present study, the coupling coordination model [6], gray correlational model [11], double exponential curve [12], comprehensive response model [13], and value at risk model [14] are mainly used. The research scale includes national [15], provincial [7], and city levels [16]. Research has shown that along with the increase in the urban population, the demand for production and living also increases in urbanization, which puts pressure on the ecosystem and resource carrying capacity, resulting in serious ecological and environmental problems. At the same time, the ecological environment will also affect urbanization by environmental degradation, resource shortage, and other ways [17,18].
Ecosystem services (ESs) can represent ecological elements and functions; thus, ESs have become an important index for studying the ecological environment [19]. ESs refer to all types of benefit obtained by people from the ecosystem directly or indirectly [20]. ESs are not only the foundation of human survival and development but also directly provide clean sources of water, oxygen, and food for human survival. At the same time, ESs also have indirect functions, such as climate regulation, pollution purification, and soil conservation [21]. In a Millennium Ecosystem Assessment (MA) report, according to the relationship between ESs and structural functions, ESs are divided into four categories, namely, provision, regulating, supporting, and cultural services. Moreover, 60% of the global ecosystems are being or have been degraded due to the interference of human activities [22]. The degradation of ESs will directly hinder human survival and the sustainable development of society. With the deepening of the research on ESs, an increasing number of scholars have paid attention to the changes of ESs as a result of urbanization and explored the relationship between them. Mathematical statistics models are often used to identify the relationship between urbanization and ESs [23]. Huang et al. [24] found that urbanization will reduce the values of ESs by using SPSS correlation analysis at the county level in China. Peng et al. [25] studied the linear relationship between ESs and three urbanization indexes by using a linear regression model and further confirmed the response threshold of ESs to the three urbanization indexes. Taking the Pearl River Delta Urban Agglomeration as the research area, Zhang et al. [26] explored the effect of urbanization on the supply and demand of ESs through a regression analysis based on four categories of typical ESs, water yield, food production, carbon sequestration, and leisure services. Fu et al. [27] measured the urbanization level of Beijing using the entropy method and studied the effect of Beijing urbanization on ESs. Their research results showed that urbanization has a negative effect on ESs. However, an impact threshold value exists, which is related to the urbanization rate. Spatial autocorrelation analysis models can explicitly evaluate the relationship between urbanization and ESs, which has attracted research attention [28,29,30,31]. Ouyang et al. [32] evaluated the spatial interaction between urbanization and ESs in different urban agglomerations by using a Moran index based on the selection of 10 urban agglomerations in different growth stages. Degefu et al. [33] selected four cities in Ethiopia and compared the response of ESs to land use change by using a Moran model. Yao et al. [34] calculated the value of ESs of Wuhan urban agglomeration based on land use data and analyzed the influence of multidimensional urbanization level on the spatial differentiation of ES value based on bivariate spatial autocorrelation. Taking the middle reaches of the Yangtze River as the research unit, Chen et al. [35] identified a significantly negative correlation and a u-type curve exists between ES value and urbanization by using spatial autocorrelation and spatial regression models.
The scenario simulation method has been widely used recently to simulate the changes of ESs in different urban change scenarios [36,37]. Wang et al. [38] simulated the distribution and change in ESs in Dianchi Lake Basin under natural growth, urban planning, and ecological protection scenarios using the scenario simulation method. Chen et al. [39] simulated short-, medium-, and long-term land use changes in the Yangtze River Economic Belt using FLUS (future land use simulation) model, based on regional SSPs (socioeconomic shared paths), and quantified and evaluated six categories of ESs based on predicted land use patterns. Questionnaire surveys can evaluate the perception of ESs by different groups, and they can be used in studying the relationship between urbanization and ESs. Narducci et al. [40] found that urban land has a greater negative impact on ESs than agricultural land, and both urban and agricultural land are negatively correlated with water quality, air quality, species habitat, and other ESs. To sum up, existing research methods can be used to explore the effect of urbanization on ESs at different time and space scales and group scales; however, the coupling coordination relationship between urbanization and ESs is difficult to identify. Coordination degree is one of the important tools to study the coordinated development of environment and economy. It aims to quantitatively reflect the coordinated development degree of environment and economy, that is, whether they are in a state of imbalance or coordination. Control measures are taken in time according to the change trend of coordination degree to provide a theoretical basis for regional sustainable development [41,42]. The coupling coordination model has obvious advantages in analyzing the complex system relation composed of multiple factors and multiple levels, and it can better reflect the structure and function of complex systems [43]. Population, land, economy, and several aspects are involved in the improvement of urbanization. The urbanization level is evaluated from many dimensions, which can reflect the urbanization level more comprehensively. Therefore, urbanization and ESs are not one dimensional, and they are relatively complex systems. The coupling coordination model has great application potential in identifying the coupling coordination relationship between urbanization and ESs and between zoning regional coupling and coordination. Some research [4,5,44] has used the coupling coordination model to couple the relationship between ecosystem services and urbanization at different scales (e.g., city, river basin, and country) in China, but there is still a knowledge gap between the coupling coordination results and zoning policy practice.
A symposium on ecological protection and high-quality development of the Yellow River Basin was held in Zhengzhou in 2019. Ecological protection and high-quality development of the Yellow River Basin have become important development strategies, and how to protect the ecology of the Yellow River Basin will become an important issue in the future. At present, many ecological problems exist in the areas along the Yellow River of Henan Province (AYRHP), such as lack of water resources, shortage of ecological water, and imbalance of ecosystem functions. Especially in recent years, the pattern of land use has evolved violently, facing increased ecological risks, serious pollution in some areas, and many historical ecological problems. The Yellow River Basin is an important ecological barrier, food production base, and economic zone in China, which has an extremely important strategic position. Some progress has been made on the research of ecosystem services in the Yellow River Basin. Some researchers [45,46,47] have identified natural and human factors on ecosystem services in the Yellow River Basin. Geng et al. [48] analyzed trade-offs/synergies among ecosystem services in the Yellow River Basin. Wu et al. [49] and Guo et al. [50] clarified spatiotemporal patterns of ES value changes. Moreover, the relationship between ESs and ecological restoration has caused concern in the Loess Plateau [51,52,53], which is an important part of Yellow River Basin. The AYRHP are in the middle and lower reaches of the Yellow River, with dense cities and towns, large population, relatively weak economic foundation, and in the rapid development of urbanization, which has a significant effect on the ecological environment. It is vital to identify spatiotemporal changes of ESs, urbanization, and their coupling relationship in the AYRHP, but the relevant research is scare.
Taking AYRHP (counties and districts) as examples, this study estimates ESs using the Carnegie–Ames–Stanford approach (CASA), revision universal soil loss equation (RUSLE), and other models by selecting the rapid growth period of urbanization level from 2000 to 2018 as the research period. It evaluates the urbanization level from three dimensions, namely, population, economy, and land. The coupling coordination relationship between various ESs and urbanization is quantified based on the coupling coordination degree (CCD) model. A relative development model is adopted to identify the lead–lag relationship between ESs and urbanization, and zone the county-level ecological management. Related policy suggestions are proposed to provide decision-making reference for the ecological protection and high-quality sustainable development in the Yellow River Basin.

2. Materials and Methods
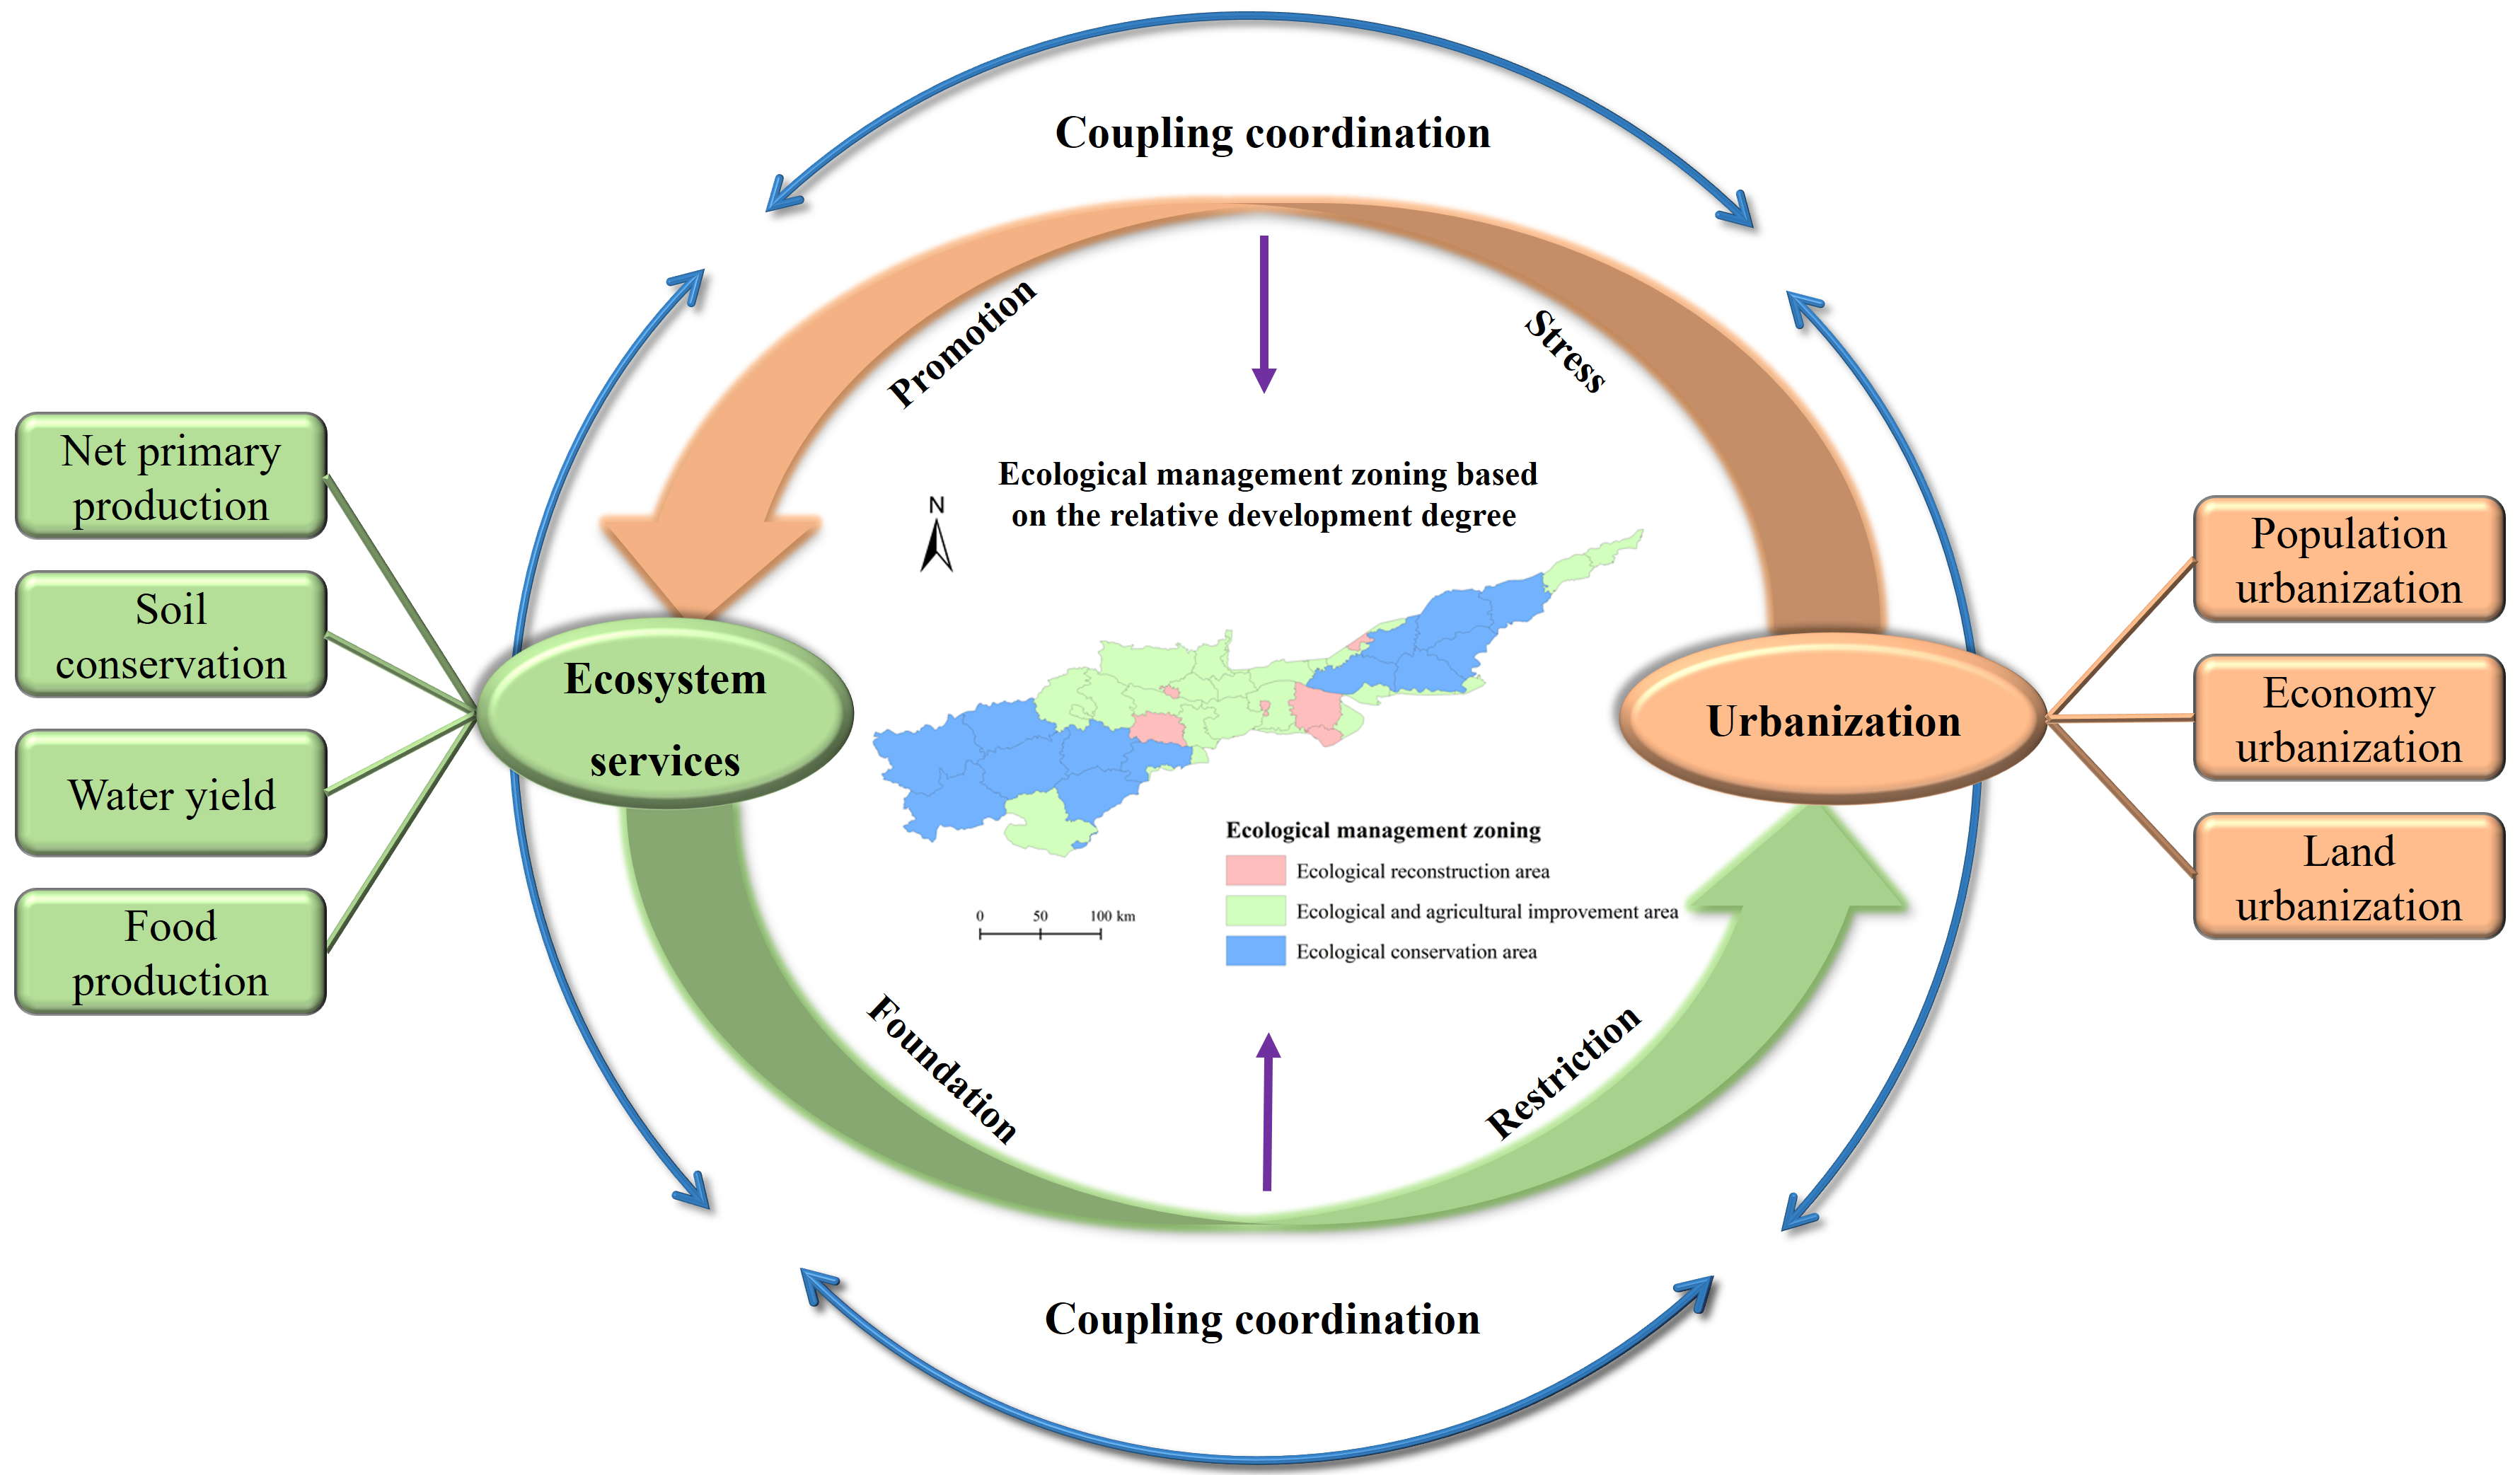
2.1. The Study Area

The AYRHP are located in the middle and lower reaches of the Yellow River. The areas are not only the birthplace of Chinese culture but also an important food production area of China. The areas are in the middle-east of China, connecting Shanxi in the north, Henan in the south, Shaanxi in the west, and Shandong in the east. From west to east, the AYRHP span 9 prefecture-level cities (i.e., Sanmenxia, Luoyang, Jiyuan, Jiaozuo, Zhengzhou, Xinxiang, Kaifeng, Anyang, and Puyang), including 42 counties and districts (Figure 1). The population of AYRHP was 34.13 million, accounting for 10.18% of the total population in the whole Yellow River Basin. In 2018, the urbanization rate of the permanent population reached 50.41%. The gross domestic product (GDP) growth rate was about 6.9%. The output value of the tertiary industry accounted for 39.24% of the total GDP. The income gap between urban and rural residents was about 13,786 yuan. The AYRHP have a complex terrain, with mountains, hills, and plains from the west to the east, and the altitude gradually decreases. The two banks of the Yellow River from Luoyang to Zhengzhou have mainly low mountains and hills, with an altitude of 200–500 m. The lowest altitude of the research area, which is 35 m, belongs to Wuba Town, Taiqian County, and Puyang City. The plain area to the east of Zhengzhou is the Huanghuaihai alluvial plain in the Eastern Henan, with flat land, rich land resources, and a long farming history. It is one of the key areas under agricultural comprehensive development. Our site is located in the junction zone of the north–south climate and the transitional zone between warm temperate and north subtropical. The climate type is a humid–semi-humid monsoon climate. The climate is dry and sandy in spring, rainy and hot in summer, abundant sunshine in autumn, and dry and cold in winter with little rain. The annual average temperature is 12–16 °C. The main stream in the AYRHP is 711 km long. The area of the regions where the Yellow River flows through is 36,500 km2. The research area has many reservoirs, among which the most famous are the Sanmenxia and Xiaolangdi Reservoirs.

2.2. Data Sources

The research data include altitude data, remote sensing data, meteorological data, soil attribute, and socioeconomic statistics. Table 1 present the details. Altitude data, remote sensing data, meteorological data, and soil attribute data provide basic parameter input data for the model to simulate the regulation services of ecosystem in net primary production (NPP), water yield, and soil conservation. Land use remote sensing monitoring data are used to obtain the land urbanization rate of various counties and districts. Socioeconomic statistical data are obtained from Henan Statistical Yearbook, China County-level Statistical Yearbook, and China County- and City-level Economic Statistical Yearbook, among others. These data are mainly used to calculate the population and economic urbanization rate of counties and districts in our site.

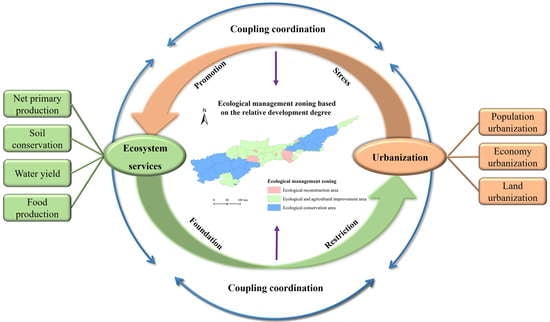
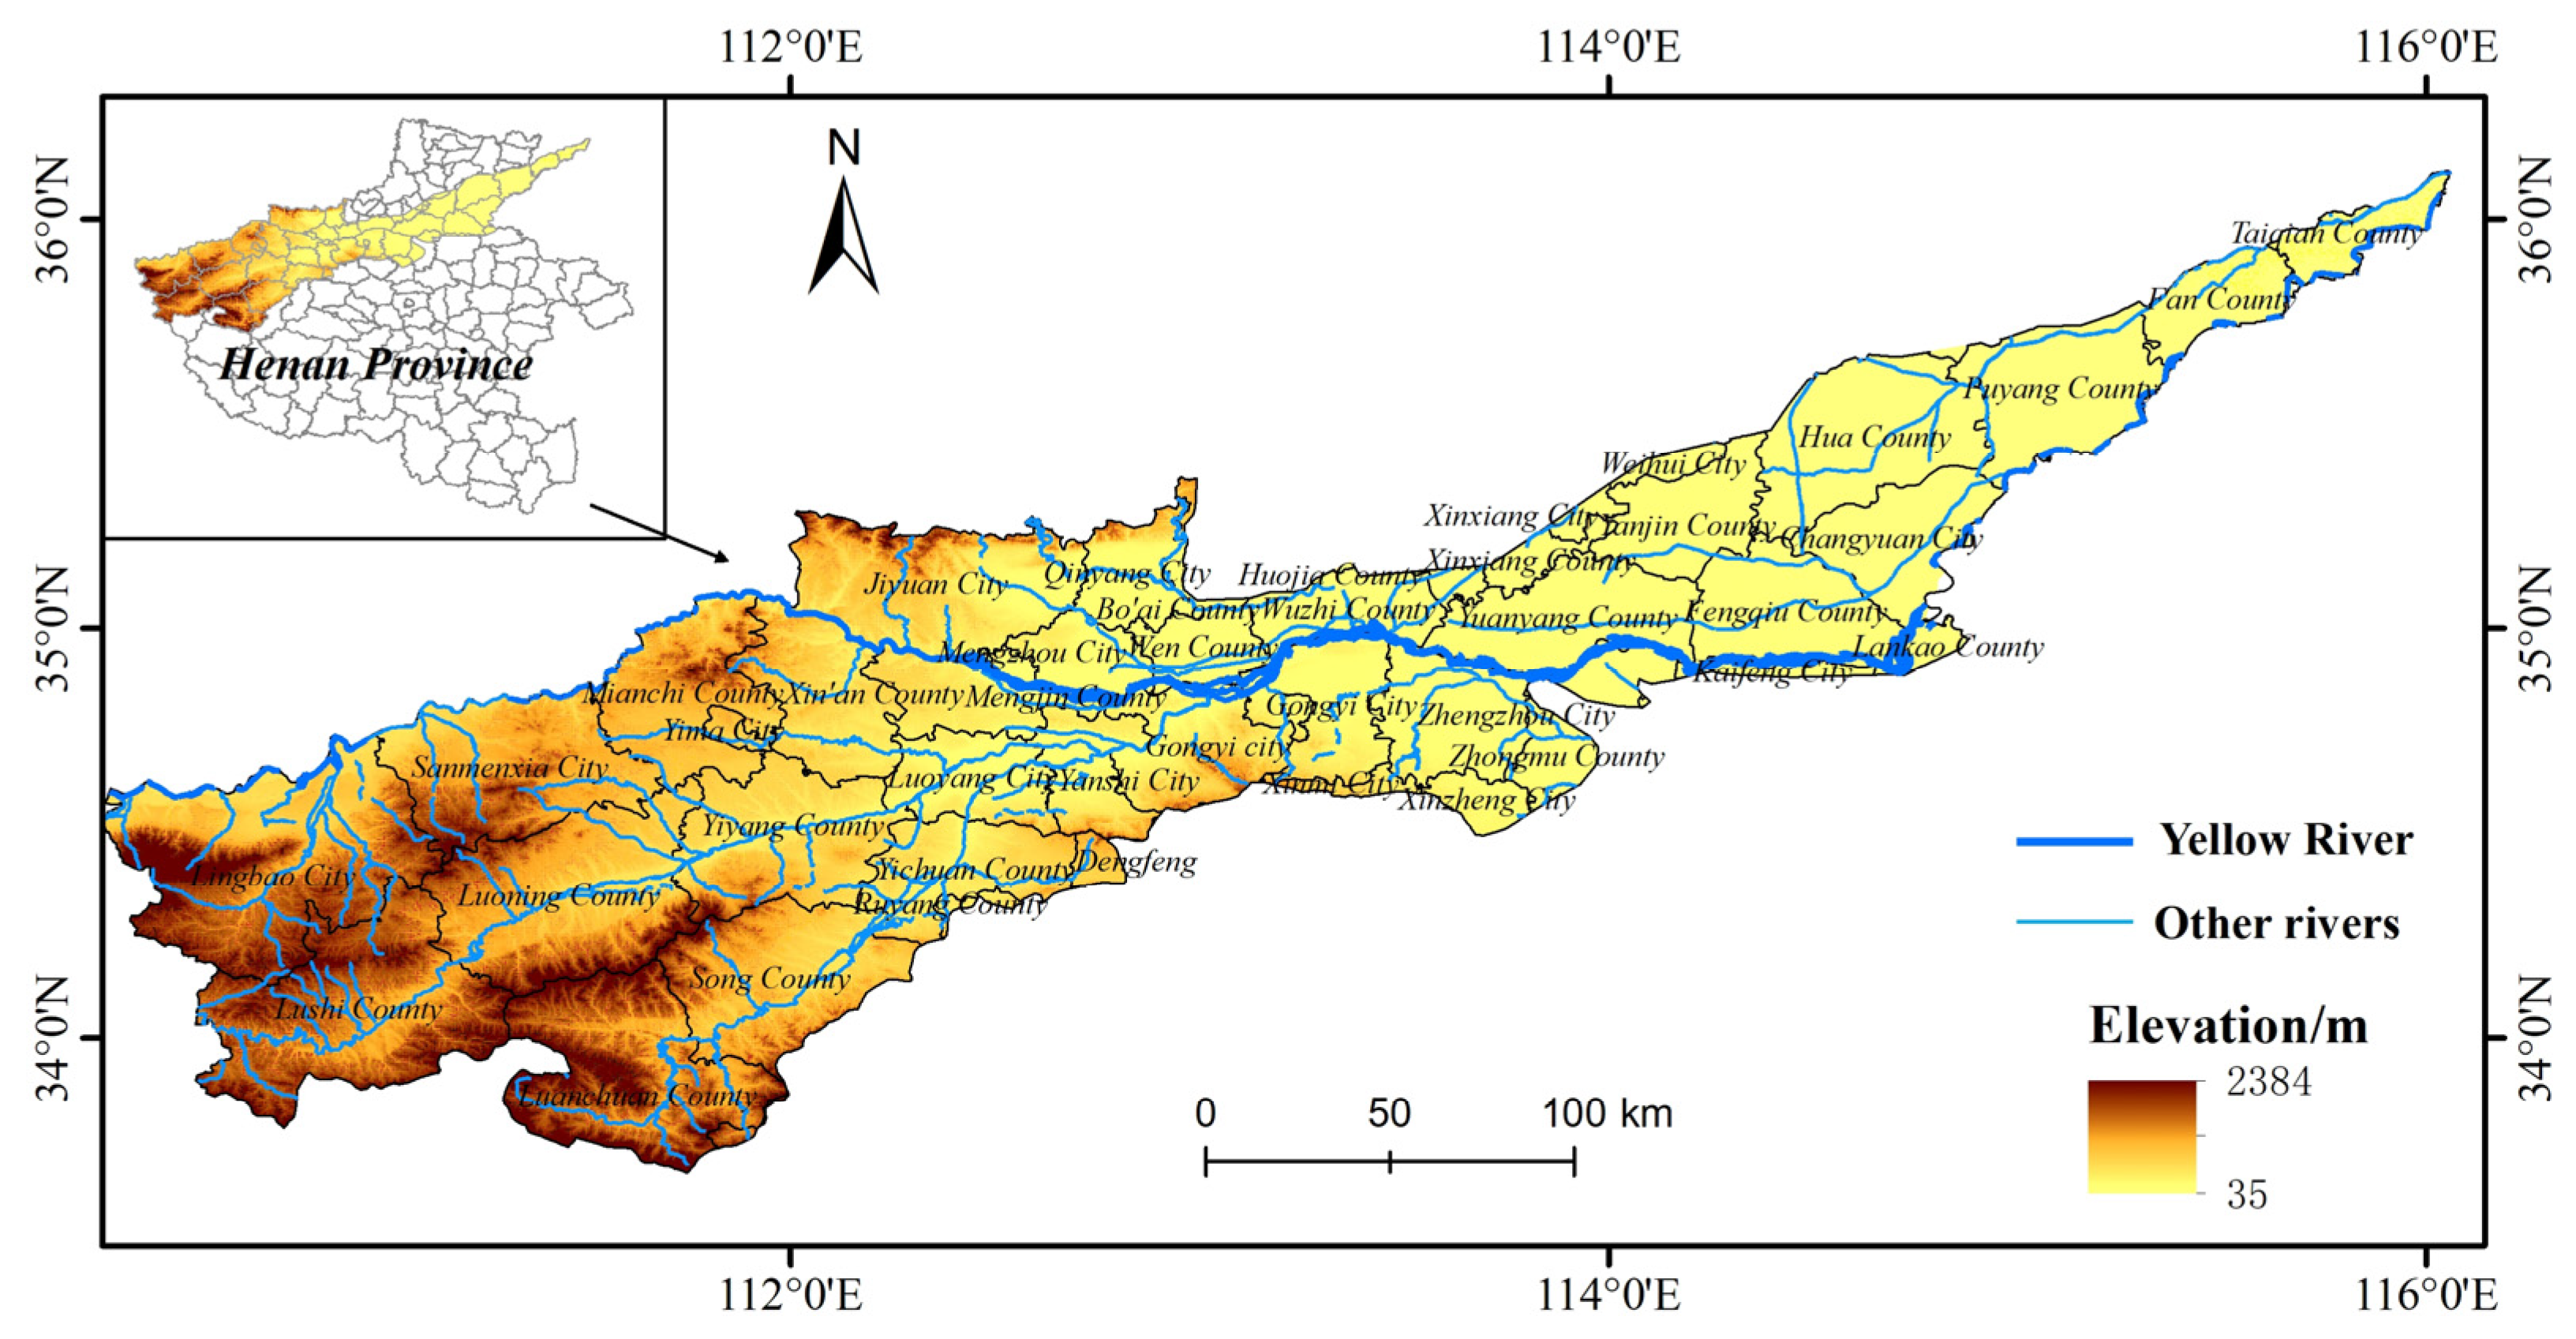
2.3. Research Framework

By evaluating ESs and urbanization, our study attempts to identify the coupling relationship between ESs and urbanization and divide ecological management zones (Figure 2). Based on the research framework, first, we selected four ecosystem services—food production, NPP, water yield, and soil conservation and evaluated the four ecosystem services and then highlighted the spatial-temporal changes in each ecosystem service. Second, we evaluated urbanization level from three dimensions, namely, population, economy, and land to obtain comprehensive urbanization. Third, we applied the coupling coordination degree model to identify the relationship between urbanization and ecosystem services. Meanwhile, the lead–lag relationship between ESs and urbanization is identified using the relative development model. Last, ecological management zoning is carried out according to the research results and we offered some policy suggestions in each ecological management zone.

2.4. Evaluation of Ecosystem Services

The southwest of the AYRHP mainly has mountains and hills, and the northeast has plains. Soil erosion is serious in the AYRHP. Mineral exploitation and human activities have damaged the local ecosystem. The research area is located in a semi-arid area, with high population density and great demand for industrial, agricultural, and domestic water. In the areas along the upper and middle reaches of the Yellow River of Henan Province, the implementation of ecological protection policies, such as returning the grain plots to forestry by the local governments, affects safe food production. The selection of ESs meets the concerns of the government and residents in the research area, and it has the availability of measurement data. In the study, four categories of ESs, namely, NPP, soil conservation, water yield, and food production are screened out for evaluation. An evaluation system for ESs in the AYRHP is constructed based on these categories of ESs (Table 2).

2.4.1. Evaluation on Net Primary Production

The NPP of vegetation refers to the total amount of organic matter remaining in the vegetation on land by removing the organic matter consumed by autotrophic respiration from the organic matter produced by photosynthesis per unit time and area. It intuitively reflects the organic matter production capacity of the vegetation community in the natural environment. In this study, NPP is estimated by using the CASA model based on the principle of light energy utilization. The specific model is as follows [54]:
N P P ( x , t ) = A P A R ( x , t ) × ε ( x , t )
where NPP(x,t) refers to the NPP of pixel x on the tth month (g·C·m−2), APAR(x,t) refers to the photosynthetically active radiation of pixel x on the tth month (MJ·m−2), and ε(x,t) refers to the actual light energy utilization of pixel x on the tth month (g·C·MJ−1). For the use of models and the selection of parameters, refer to Zhu et al. [55].

2.4.2. Evaluation on Soil Conservation

Soil plays an important role in human’s production and life. The important functions of soil conservation include maintaining soil nutrients, reducing nutrient loss, lowering risks leading to reservoir sedimentation and flood, and purifying water quality. It is of great significance to counties and cities with serious soil erosion in the AYRHP. The amount of soil conservation is equal to the difference between the potential and measured soil loss. The amount of soil loss without vegetation coverage and without any water and soil conservation measure is the potential amount of soil loss. At this moment, C = 1, and P = 1. The amount of soil loss in consideration of vegetation coverage, water, and soil conservation measures is the measured amount of soil loss. In this study, soil conservation is calculated by using the Sediment Delivery Ratio module of the Integrated Valuation of Ecosystem Services and Trade-offs (InVEST) model [56]. The specific calculation formulation is as follows [57,58]:
Ac = ApAm
Am = R × K × C × LS × P
Ap = LS × K × R
where Ac is the average soil conservation (t·hm−2·a−1), Am is the average measured soil loss (t·hm−2·a−1), Ap is the average potential soil loss (t·hm−2·a−1), R is the rainfall erosion factor (MJ·mm·hm−2·h·a−1), K is the soil erosion factor (t·h·MJ−1·mm−1), C is the vegetation coverage management factor, and L and S are topographical factors. Particularly, L is a slope length factor, and S is a slope steepness factor, which are automatically obtained by DEM in the model after filling the depression; P is the soil conservation measure factor; and C and P are valued according to the InVEST model manual and parameters of similar areas and combined with the actual situation in the research area.

2.4.3. Evaluation on Water Yield

The calculation of regional water yield can provide support for improving the regional water cycle, controlling soil desertification, and reducing soil loss and rational utilization of water resources. The evaluation on water yield service also relies on the Water Yield module of the InVEST model [54]. The difference between the precipitation and the actual evapotranspiration per unit area is the principle of water balance. On the basis of this principle, water yield in all raster cells in the research area is measured, considering the terrain, vegetation type, meteorology, and soil conditions. As a result, the spatialization of water yield service is realized. The specific calculation formulation is as follows [54]:
W Y x = ( 1 A E T x P x ) × P x
where WY(x) is the annual water yield of raster cells (mm), AET(x) is the annual actual evapotranspiration of raster cells (mm), and P(x) is the annual precipitation of raster cells (mm).

2.4.4. Evaluation on Food Production

A large number of fertile cultivated land is found in the AYRHP, which is an important food production area in Henan Province. Food production is an important service in ESs and has an important influence on human well-being. Food security plays an important role in regional stability and social development. Some scholars [25,59] have found that a linear relationship exists between NDVI and crop yield. The total food output in different counties and districts is distributed according to the ratio of the NDVI value to the total cultivated land NDVI value in each pixel, and the supply level of food production in each raster cell is obtained. The specific calculation formulation is as follows:
G i = G s u m × N D V I i N D V I s u m
where Gi is the grain yield in raster cell i (t), Gsum is the total grain yield in the research area (t), NDVIi is the cultivated land NDVI value in raster cell i, and NDVIsum is the sum of cultivated land NDVI values in the research area.

2.5. Measurement of Urbanization Level

Urbanization refers to a complex process of transformation from rural to urban, including population migration, change in industrial structure, increase in urban land, and improvement of income level. Specifically, urbanization refers to a new urbanization with the connotation of people’s livelihood, sustainable development, and quality for the core goal of pursuing equality, happiness, transformation, green, health, and intensification. It aims to realize the integration of regional overall planning and coordination, industrial transformation and upgrading, and intensive efficiency of land. Generally, the single-index method and comprehensive index method are used to quantify the level of urbanization. Compared with the single-index method, the comprehensive index method can better reflect the overall characteristics and level of urbanization. In this study, comprehensive urbanization is evaluated from three dimensions, namely, population, economy, and land. A total of three indexes, including the urbanization rate of permanent residents, the proportion of urban construction land area in the total land area, and the proportion of non-agricultural industries in GDP, are selected to more intuitively reflect the population, land, and economic urbanization level of counties and cities and build a comprehensive urbanization evaluation system. The indexes are initially selected to calculate the urbanization level at different dimensions. The urbanization levels at the three dimensions have the same weight. Finally, the weighted summation method is used to calculate the comprehensive urbanization level (Table 3).

2.6. Quantification of the Coupling Relationship between ESs and Comprehensive Urbanization

The coupling between the four categories of ESs and comprehensive urbanization can reflect the degree of interaction between them and the development and change process between them. The coupling coordination can clearly reflect the stage of coordinated coupling between the two systems. When the coupling coordination is larger, then the comprehensive urbanization and ESs are more coordinated. The specific calculation formulation is as follows:
T = a G i + b F ( x )
C = { G i × F ( x ) / [ ( G i + F ( x ) ) / 2 ] 2 } k
D = T × C
where T is the comprehensive evaluation value of ESs and comprehensive urbanization; G i (i = 1, 2, 3, 4) is the evaluation values for NPP, soil conservation, water yield, and food production, respectively; F ( x ) is the evaluation value for comprehensive urbanization; C is the coupling degree; and D refers to the CCD, which is in the range of [0, 1]. Two systems are of equal importance; thus, a = b = 0.5, and there exist two system layers, k = 2. The coupling coordination is divided into five types: major maladjustment (0.0–0.2), moderate maladjustment (0.2–0.4), basic coordination (0.4–0.6), moderate coordination (0.6–0.8), and high coordination (0.8–1.0).
To further identify the lead–lag relationship between urbanization and ESs in various counties and districts, their relative development degree is calculated. The types of the relative development are classified according to the relative development degree. On the basis of other research results, all counties and districts in the research area are divided into ES lag type, urbanization–ES synchronous development type, and urbanization lag type. The specific classification criteria are shown in Table 4.

3. Results

3.1. Spatiotemporal Change in ESs

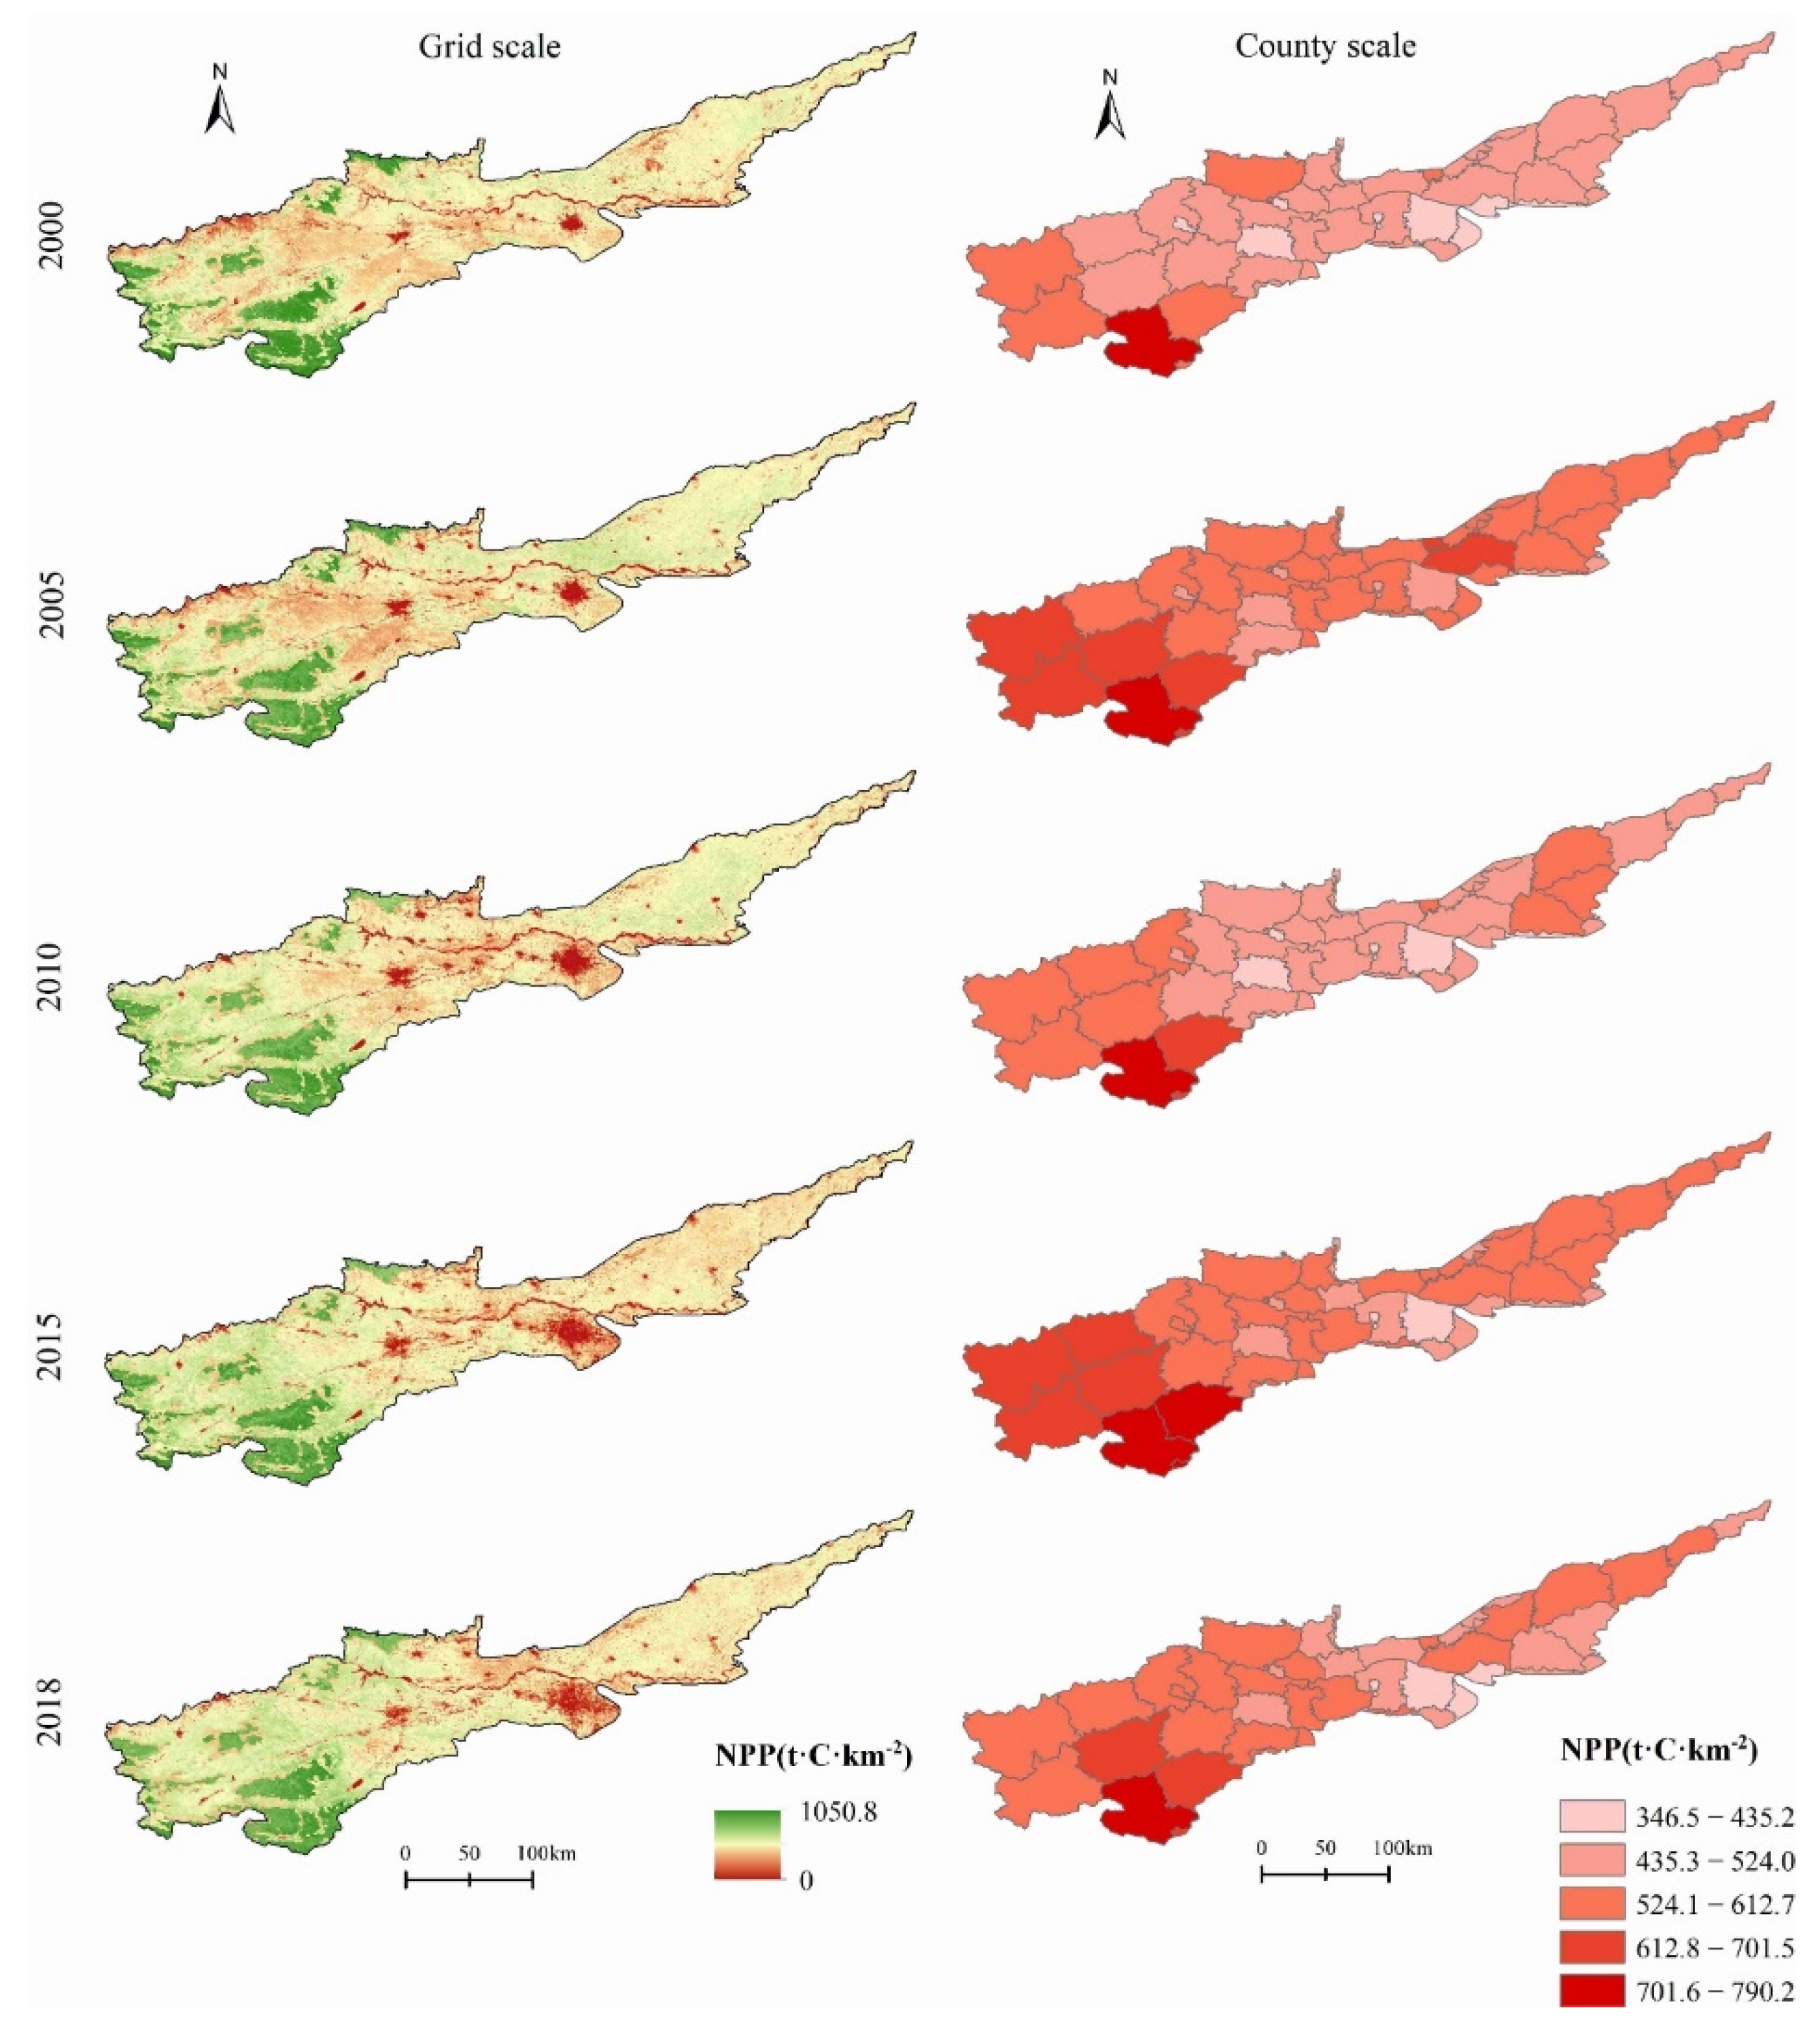
3.1.1. Net Primary Production

In 2000–2018, the total amount of NPP in the AYRHP increased. Particularly, the increment of NPP service amount in 2000–2015 was the highest (i.e., 18.19%). In 2000–2018, the amount of NPP service per unit area in the AYRHP increased from 502.8 g·C·m−2 to 563.6 g·C·m−2, with a growth rate of 12.09%. On the county scale, the amount of NPP service in 7 of 42 counties along the Yellow River of Henan Province decreased in 2000–2018. According to their decline ranges in total NPP, they ranked from large to small as follows: the urban area of Zhengzhou, Xinzheng City, Boai County, Wuzhi County, Zhongmou County, Wen County, and the urban area of Xinxiang; among which, the largest drop rate was 10.56% in the urban area of Zhengzhou. The amount of NPP service in the remaining 35 counties and districts increased. The growth rate of the amount of NPP service was 38.41% in Yima City.
From the spatial distribution (Figure 3), on the raster scale, the NPP in the AYRHP was high in the southwest and low in the northeast in 2000–2018. The low-value areas show a trend of agglomeration and expansion, whereas the spatial distribution in the high-value areas is stable. On the county scale, NPP spatial high-value areas at the county level were mainly distributed in the southwest of the research area in 2000–2018 (e.g., Luanchuan County, Song County, Lushi County, and Luoning County), whereas the low-value areas were mainly distributed in the urban areas of Zhengzhou and Luoyang. The combination of the two scales indicates that the NPP high-value areas in the research area were basically unchanged in 2000–2018, whereas the low-value areas expanded radially around from the urban area of Zhengzhou as a core, with the radius including Xinzheng City and Zhongmou County.

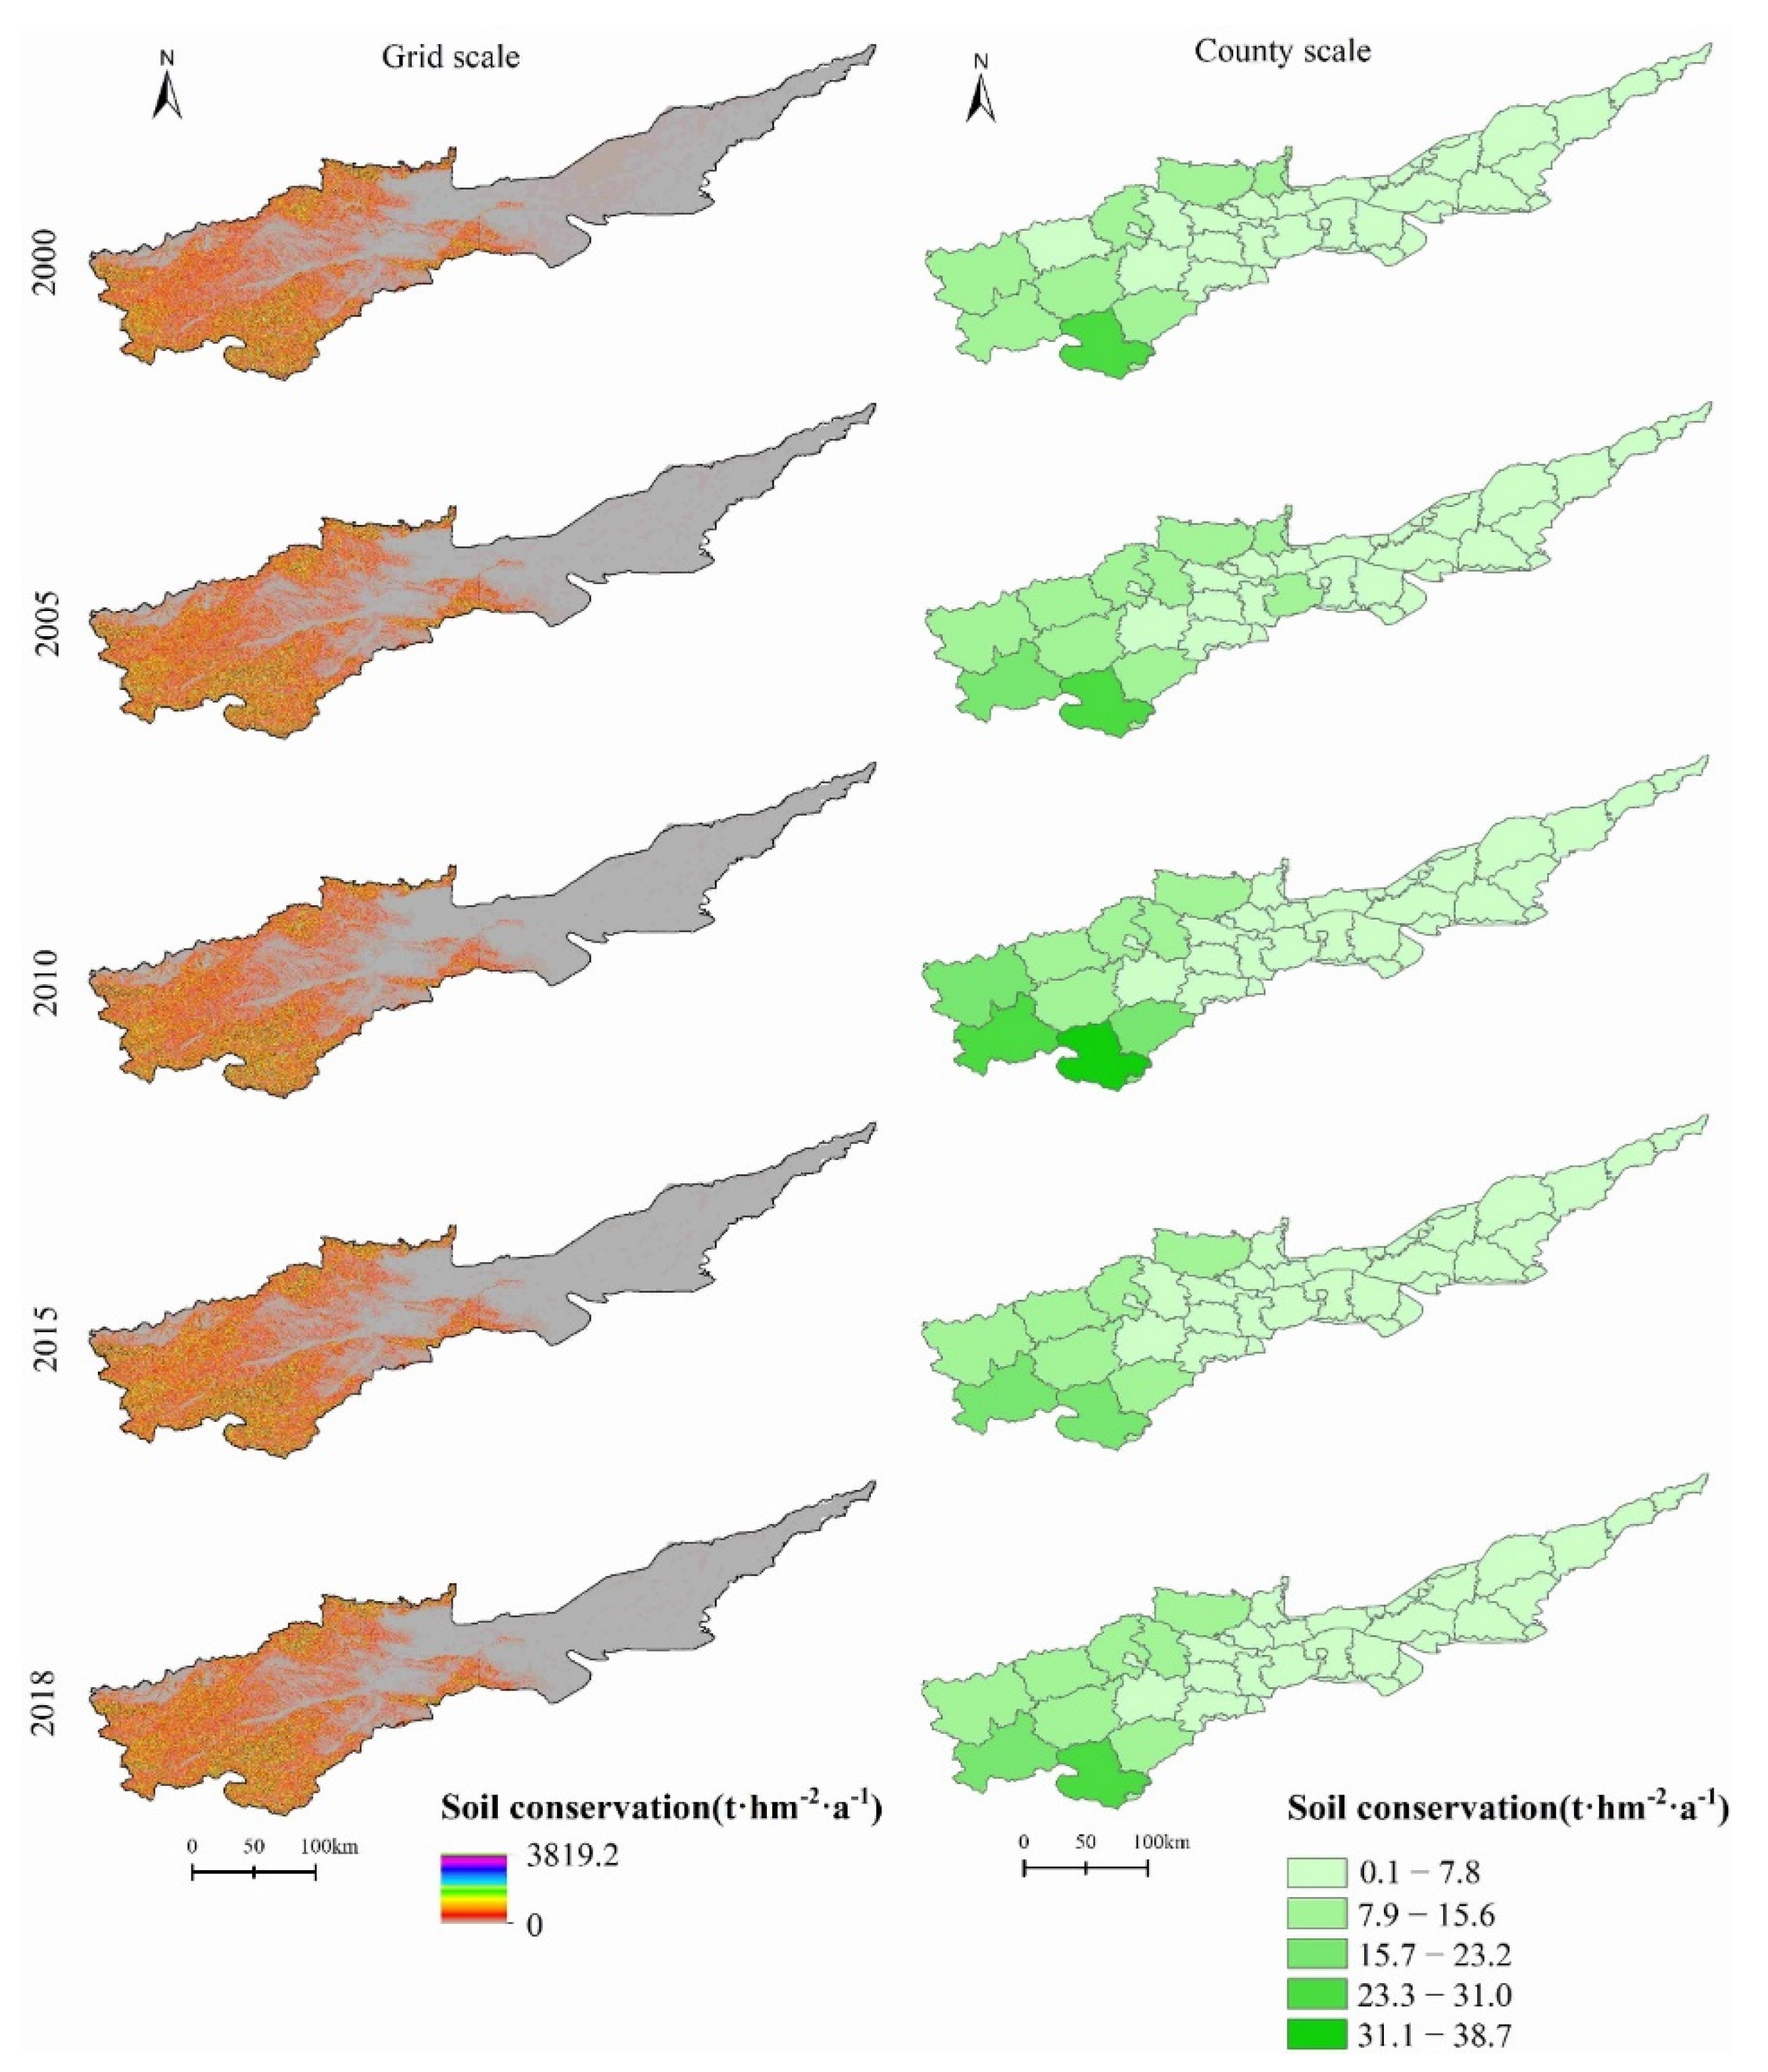
3.1.2. Soil Conservation
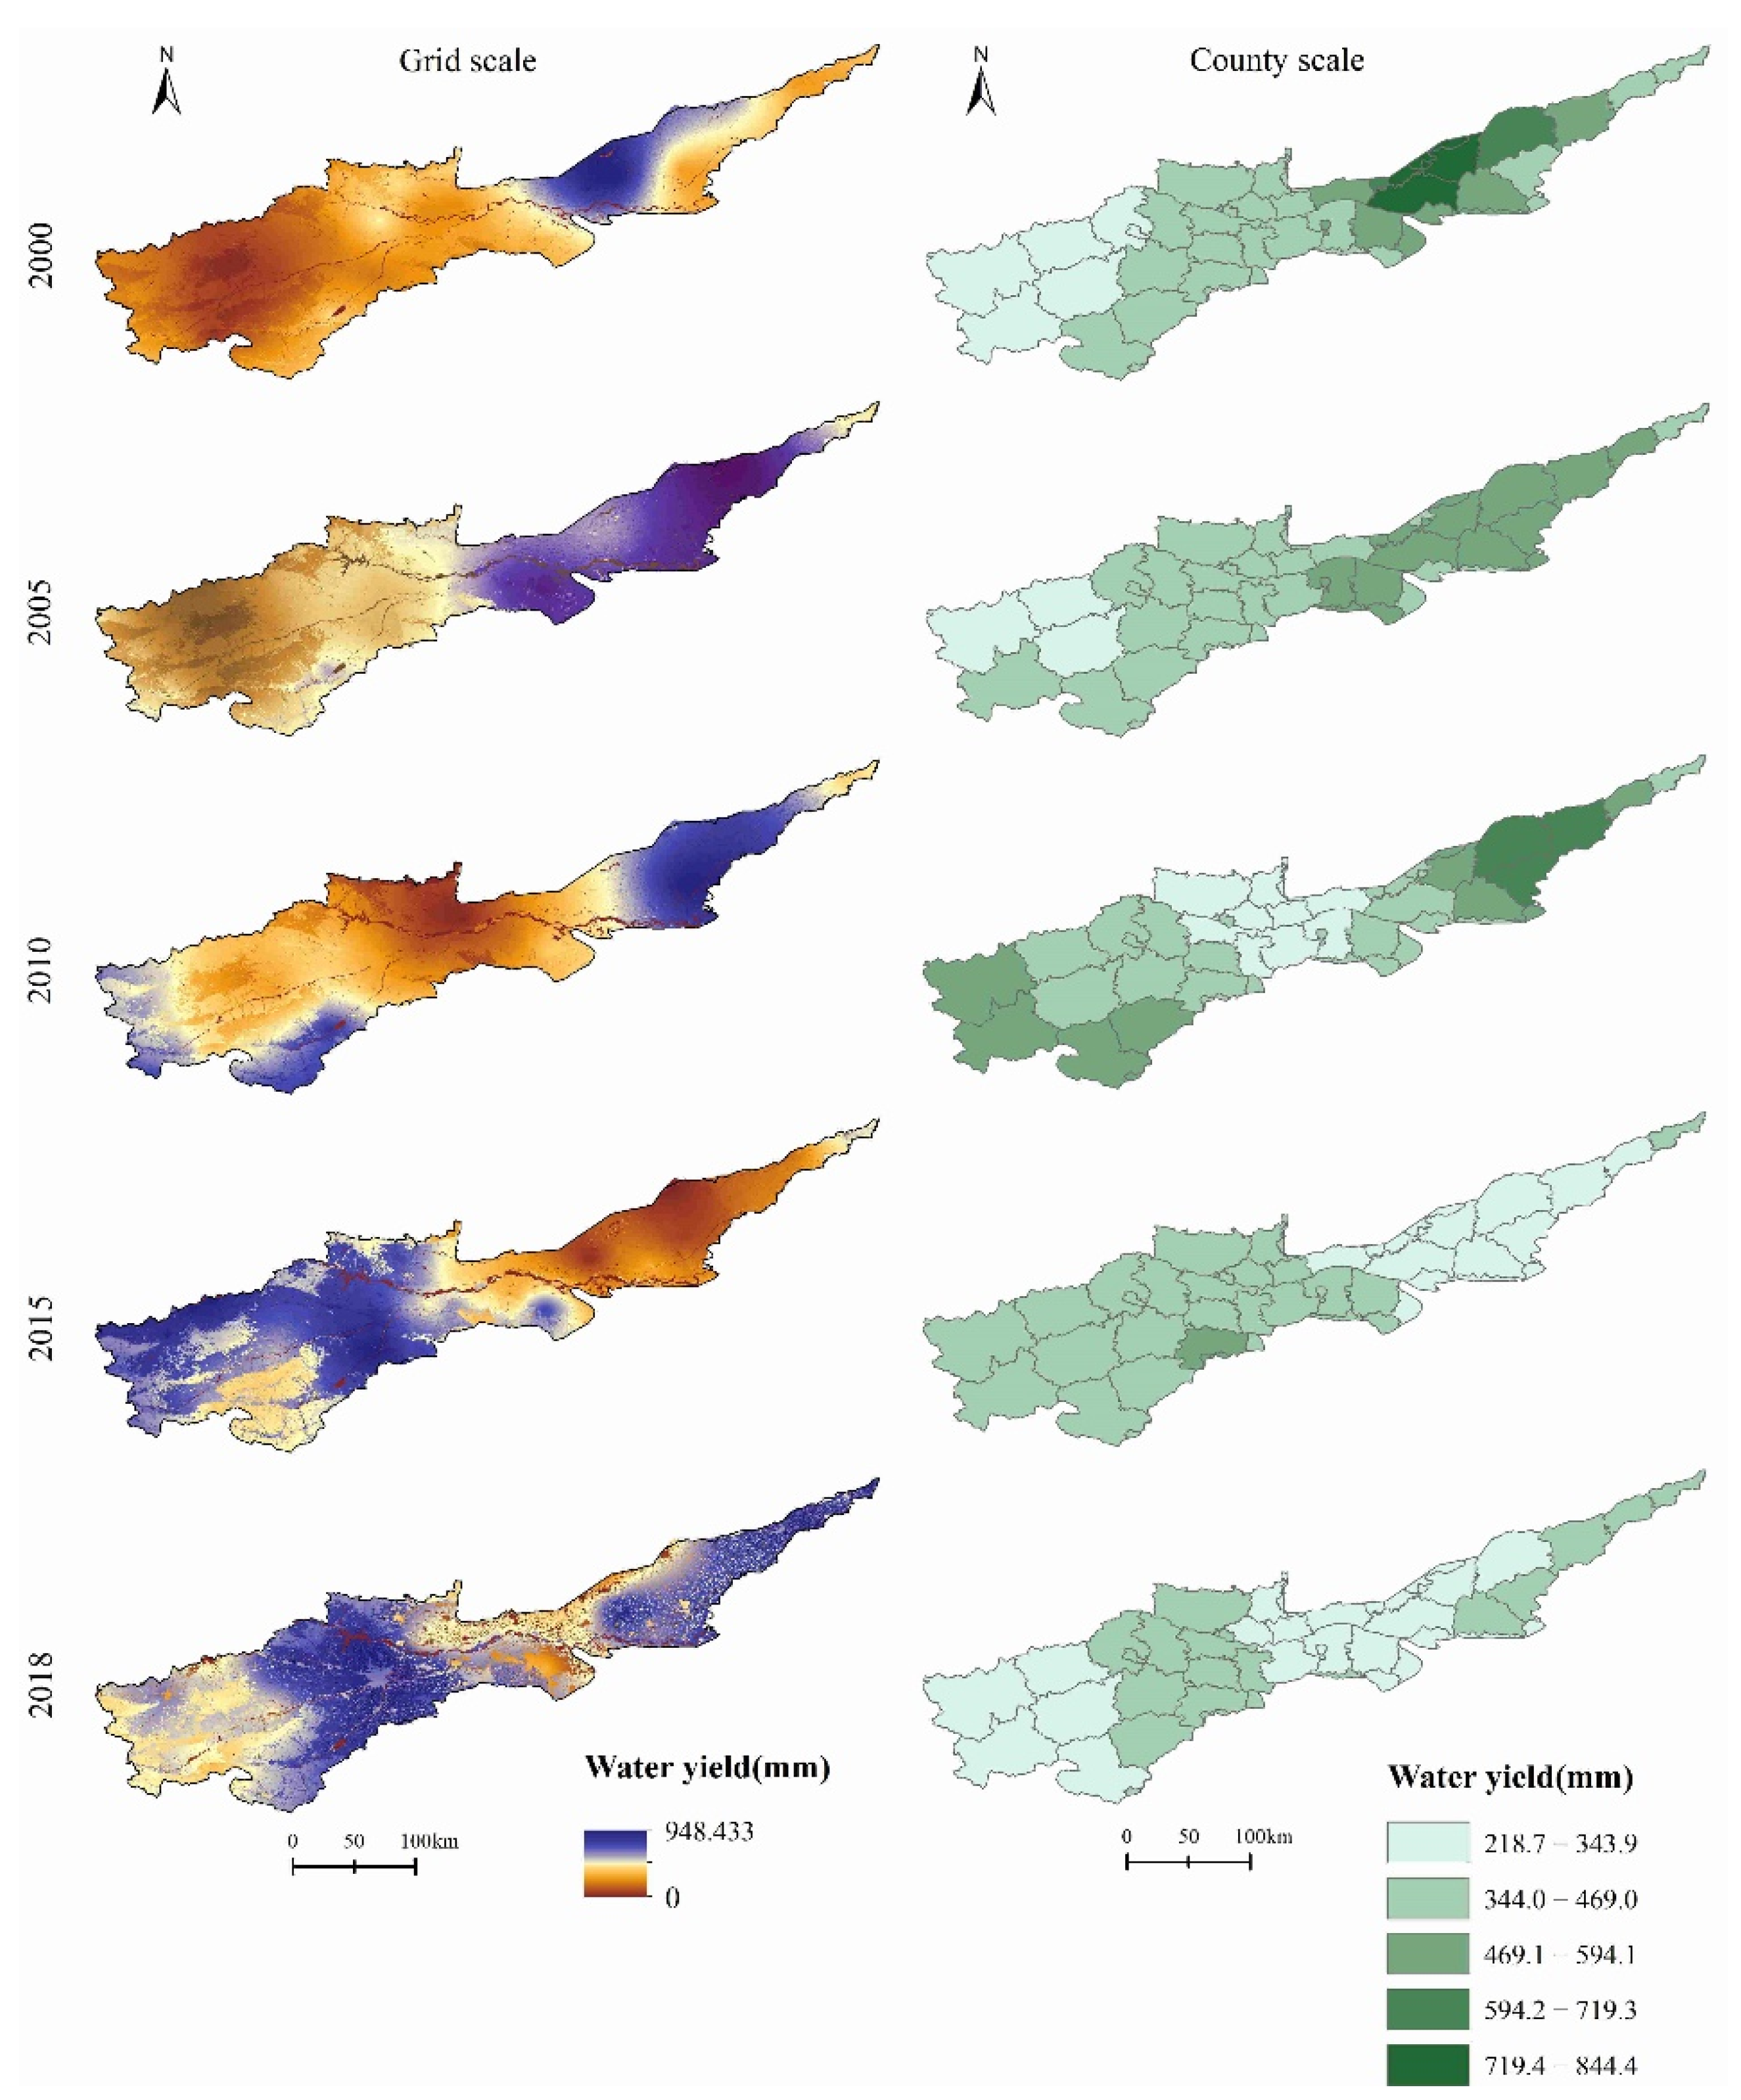
In 2000–2018, the total soil conservation amount in the AYRHP initially increased, then decreased, and increased again, and it rose during the entire research period. In 2000–2010, the growth rate of soil conservation was the highest (i.e., 50.71%). The soil conservation amount per unit area in the AYRHP in 2000–2018 increased from 4.6 t·hm−2·a−1 to 5.6 t·hm−2·a−1, with a growth rate of 21.74%. On the county scale, the soil conservation service in 15 of 42 counties in the AYRHP in 2000–2018 was growing, and the growth rate in the urban area of Sanmenxia was the highest (i.e., 77.51%). The soil conservation amount in the remaining 27 counties was decreasing. The decline rate of the soil conservation amount in the urban area of Xinxiang was the highest (i.e., 74.63%).
From the spatial distribution (Figure 4), on the raster scale, the soil conservation in the AYRHP was high in the southwest and low in the northeast in 2000–2018. The soil conservation services from the middle to the northeast of the research area were considerably lower than those in the southwest of the research area. On the county scale, the high-value areas of soil conservation service were mainly distributed in Luanchuan, Song, Lushi, and Lingbao Counties, presenting centralized and continuous distribution in space. The low-value areas of soil conservation service were mainly distributed in Taiqian, Wen, Wuzhi, and Yuanyang Counties, also presenting a concentrated and continuous distribution trend in space. The low-value areas were significantly different from the high-value areas in distribution. The main reason is that there exist mostly mountains and hills in the southwest, with rich vegetation cover types and strong soil conservation ability; whereas vast plains are present in the northeast area, where the land use type is mainly cultivated land, the land development is strong, and the soil conservation ability is thus weak.

3.1.3. Water Yield

In 2000–2018, the total water yield in the AYRHP initially decreased, increased, and then decreased again, and it dropped during the whole research period. The water yield in 2010 was the highest. In comparison with that in 2000, the growth rate was 3.05%. In 2000–2018, the water yield in the AYRHP decreased from 431.4 mm to 331.3 mm, with a drop rate of 22.97%. On the county scale, the amount of water yield in 34 of 42 counties along the Yellow River of Henan Province decreased in 2000–2018. The top three counties and districts in the decline of water yield are as follows: the urban area of Xinxiang (74.15%), Weihui City (69.78%), and Xinxiang County (68.31%). The water yield in the remaining eight counties and districts was increasing. According to growth rate, they ranked as follows: Yima City (17.19%), Mianchi County 15.16%), the urban area of Sanmenxia (10.15%), Luoning County (10.07%), Ruyang County (9.66%), Yiyang County (8.64%), Yichuan County (8.32%), and Dengfeng City (2.91%).
In 2000–2018, the spatial distribution of water yield in the AYRHP changed greatly, and the high- and low-value areas changed constantly (Figure 5). On the raster scale, the spatial distribution of water yield in 2000–2015 was low in the southwest and high in the northeast. The distribution range of high-value areas in the northeast of the research area was expanding. The spatial distribution of water yield in 2010 was low in the middle and high on both sides. In 2015, the spatial distribution of water yield was high in the southwest and low in the northeast. The regional difference of water yield service in 2018 became smaller. The high-value areas were mainly distributed in the middle and the northeast of the research area. On the county scale, the low-value areas of water yield were narrowed to four counties in the southwest (Lingbao County, Lushi County, Luoning County, and Sanmenxia City) from 2000 to 2005. The low-value areas of water yield service in 2010 were mainly distributed in Qinyang City, Mengzhou City, Wen County, Mengjin County, Yanshi City, Gongyi City, and Luoyang City. The low-value areas of water yield in 2015 were mainly distributed in Fan County, Puyang County, Hua County, Changyuan City, Fengqiu County, Yanjin County, and Yuanyang County. In 2018, the amount of water yield in all counties and districts decreased compared with those in previous years. The high- and low-value counties and districts were distributed in patches. From the spatiotemporal pattern of spatial distribution, the spatial distribution of water yield in the research area tended to be evenly distributed; however, the high-value areas of water yield continued to decrease sharply, and the amount of water yield in the research area showed a downward trend.

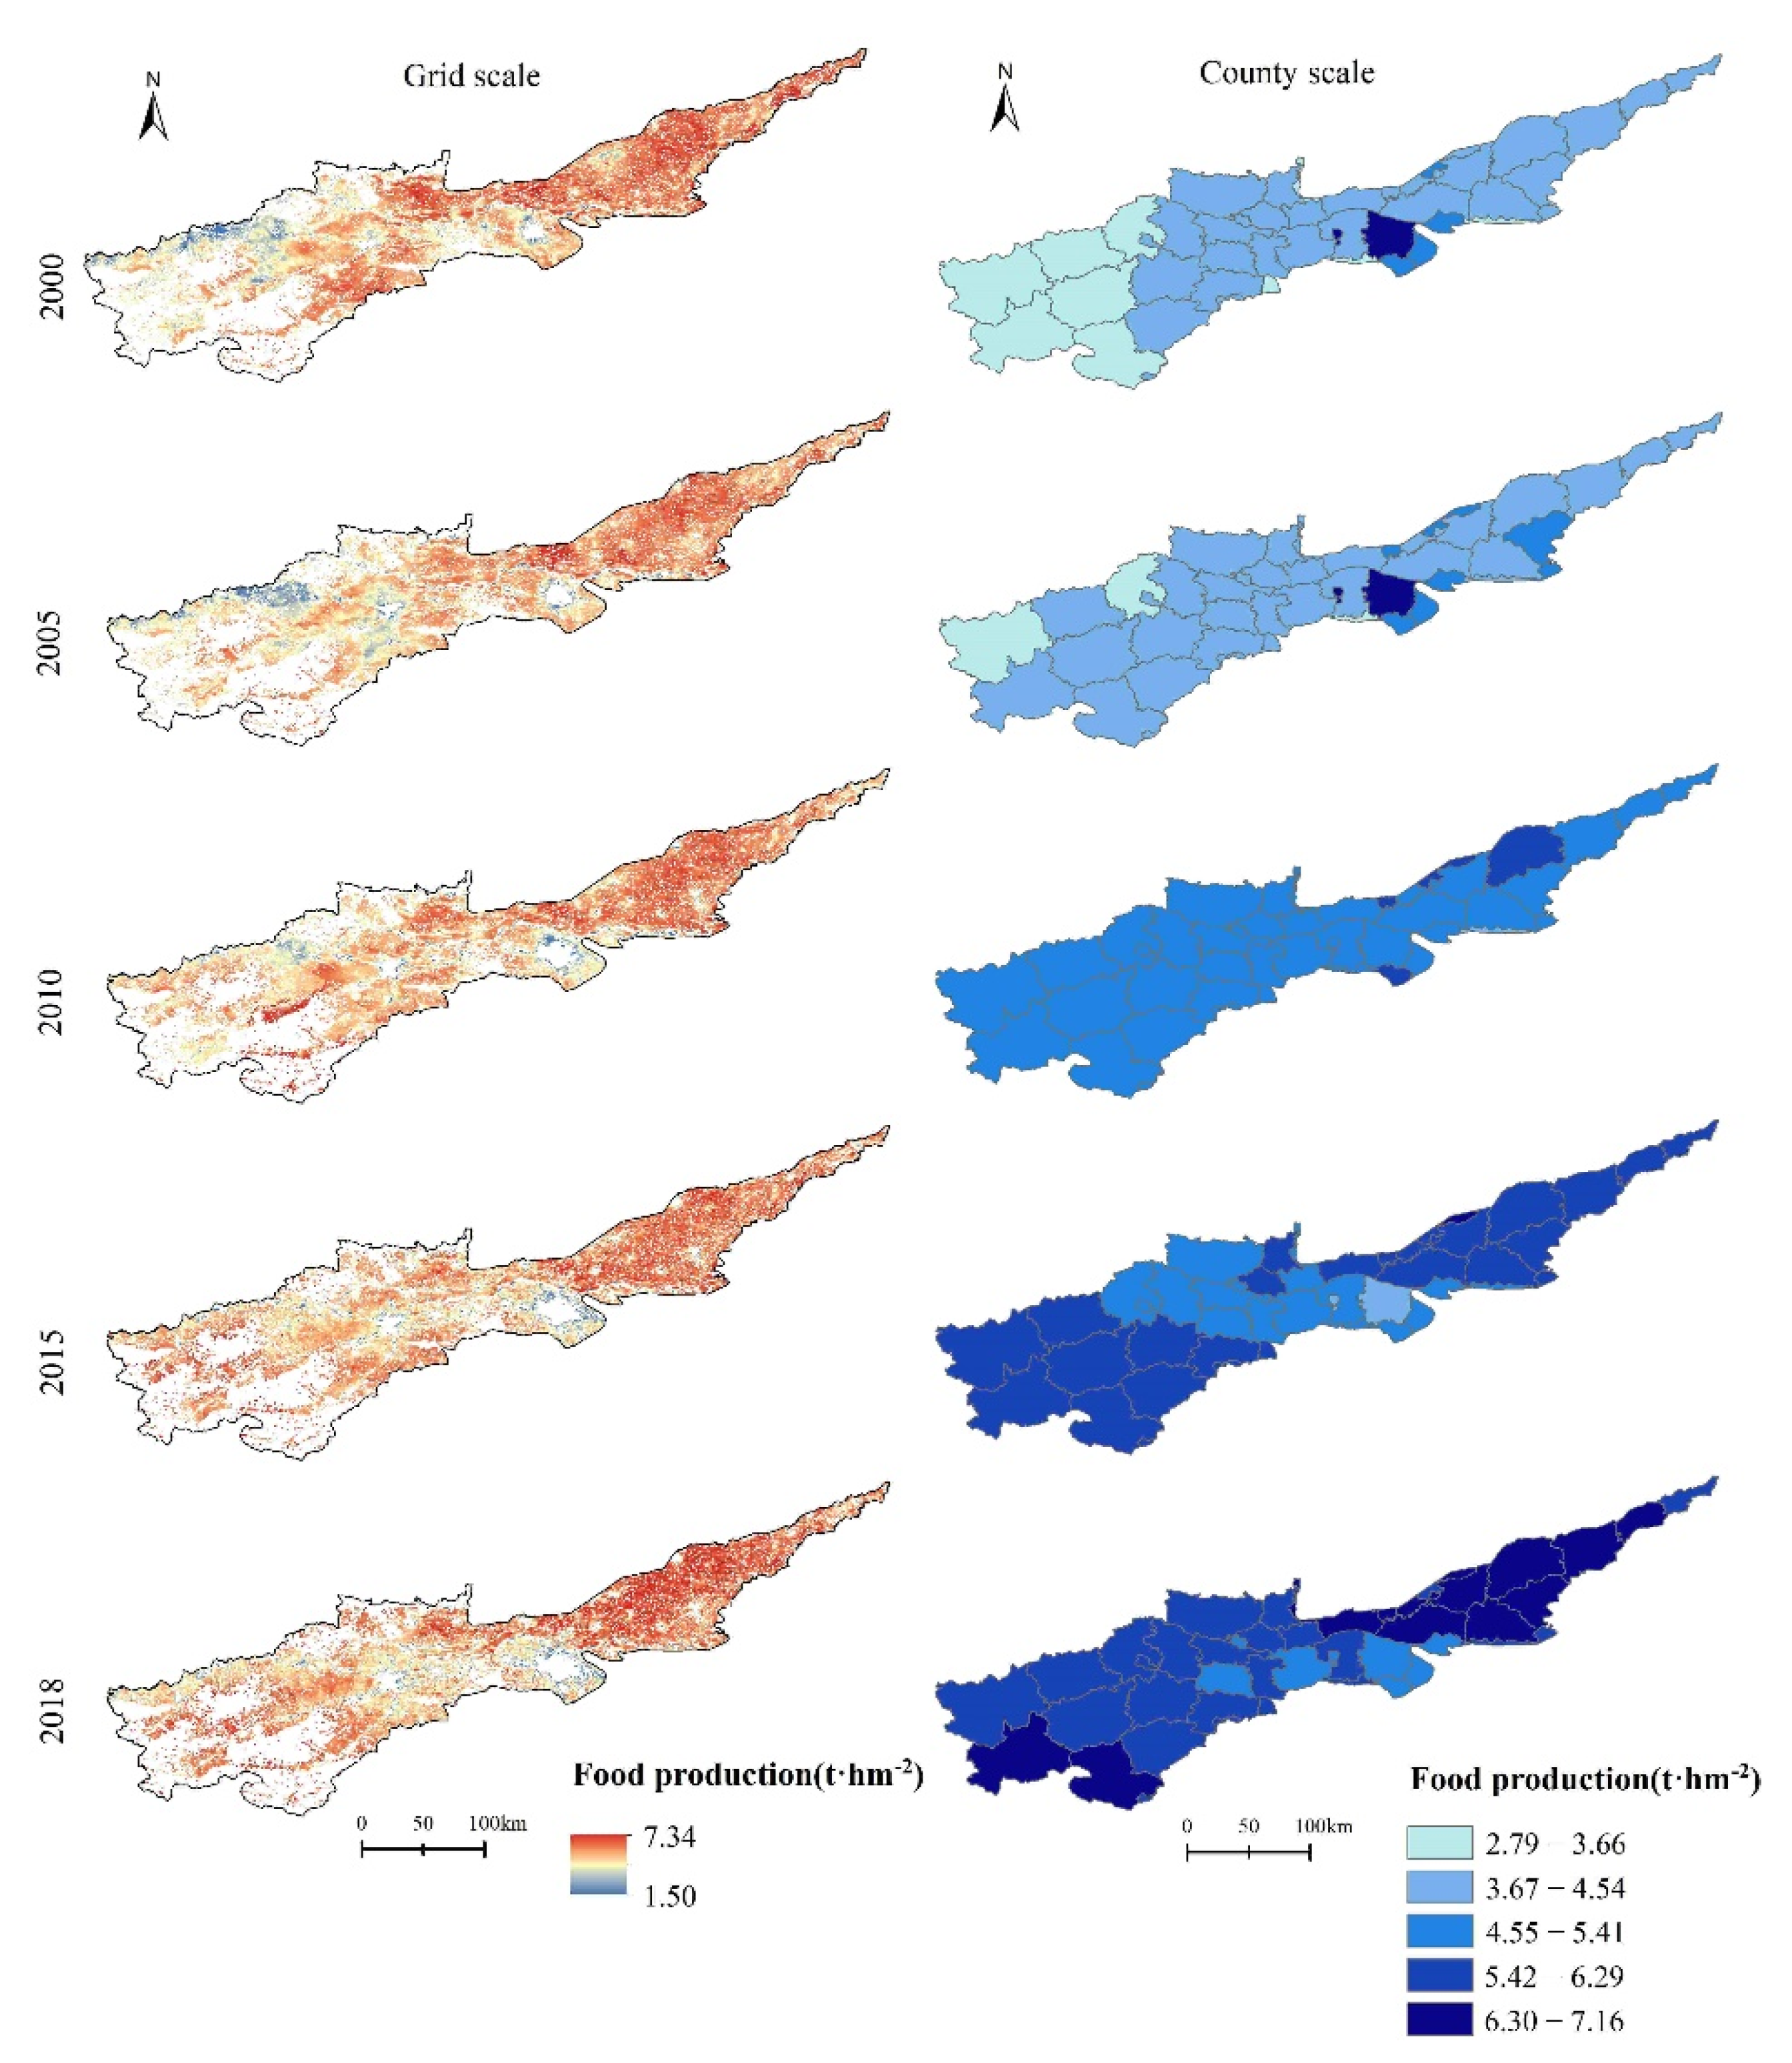
3.1.4. Food Production

In 2000–2018, the total food output in the AYRHP continued to grow, from 8.1576 million ton to 12.881 million ton. The total growth rate was 57.90%. Additionally, the food output volume per unit area in the study area increased from 3.97 tons/hm2 to 6.02 tons/hm2, an increase of 51.64%. On the county scale, the food output of only the urban area of Zhengzhou among 42 counties and districts of AYRHP was decreasing in 2000–2018, with a drop rate of 32.69%. The food output of the remaining 41 counties and districts were increasing. The top three areas with the highest growth rate in food output were Xinmi City (104.27%), Lingbao City (103.2%), and Lushi County (87.01%).
From the spatial distribution (Figure 6), on the raster scale, the spatial distribution of food output service in the AYRHP was low in the southwest and high in the northeast in 2000–2018. The distributed patches of food output correspond to the spatial distribution of cultivated land in the research area. On the county scale, the number of counties and districts in high-value areas of food output continued to increase in 2000–2018. The high-value areas were mainly distributed in Hua County, Puyang County, Fengqiu County, Yuanyang County, Lingbao City, Yiyang County, and Luoning County. The low-value areas of food production service were mainly distributed in the middle of the research area, namely, the urban area of Zhengzhou, Gongyi City, and Wen County.

3.2. Spatiotemporal Change in Urbanization Level

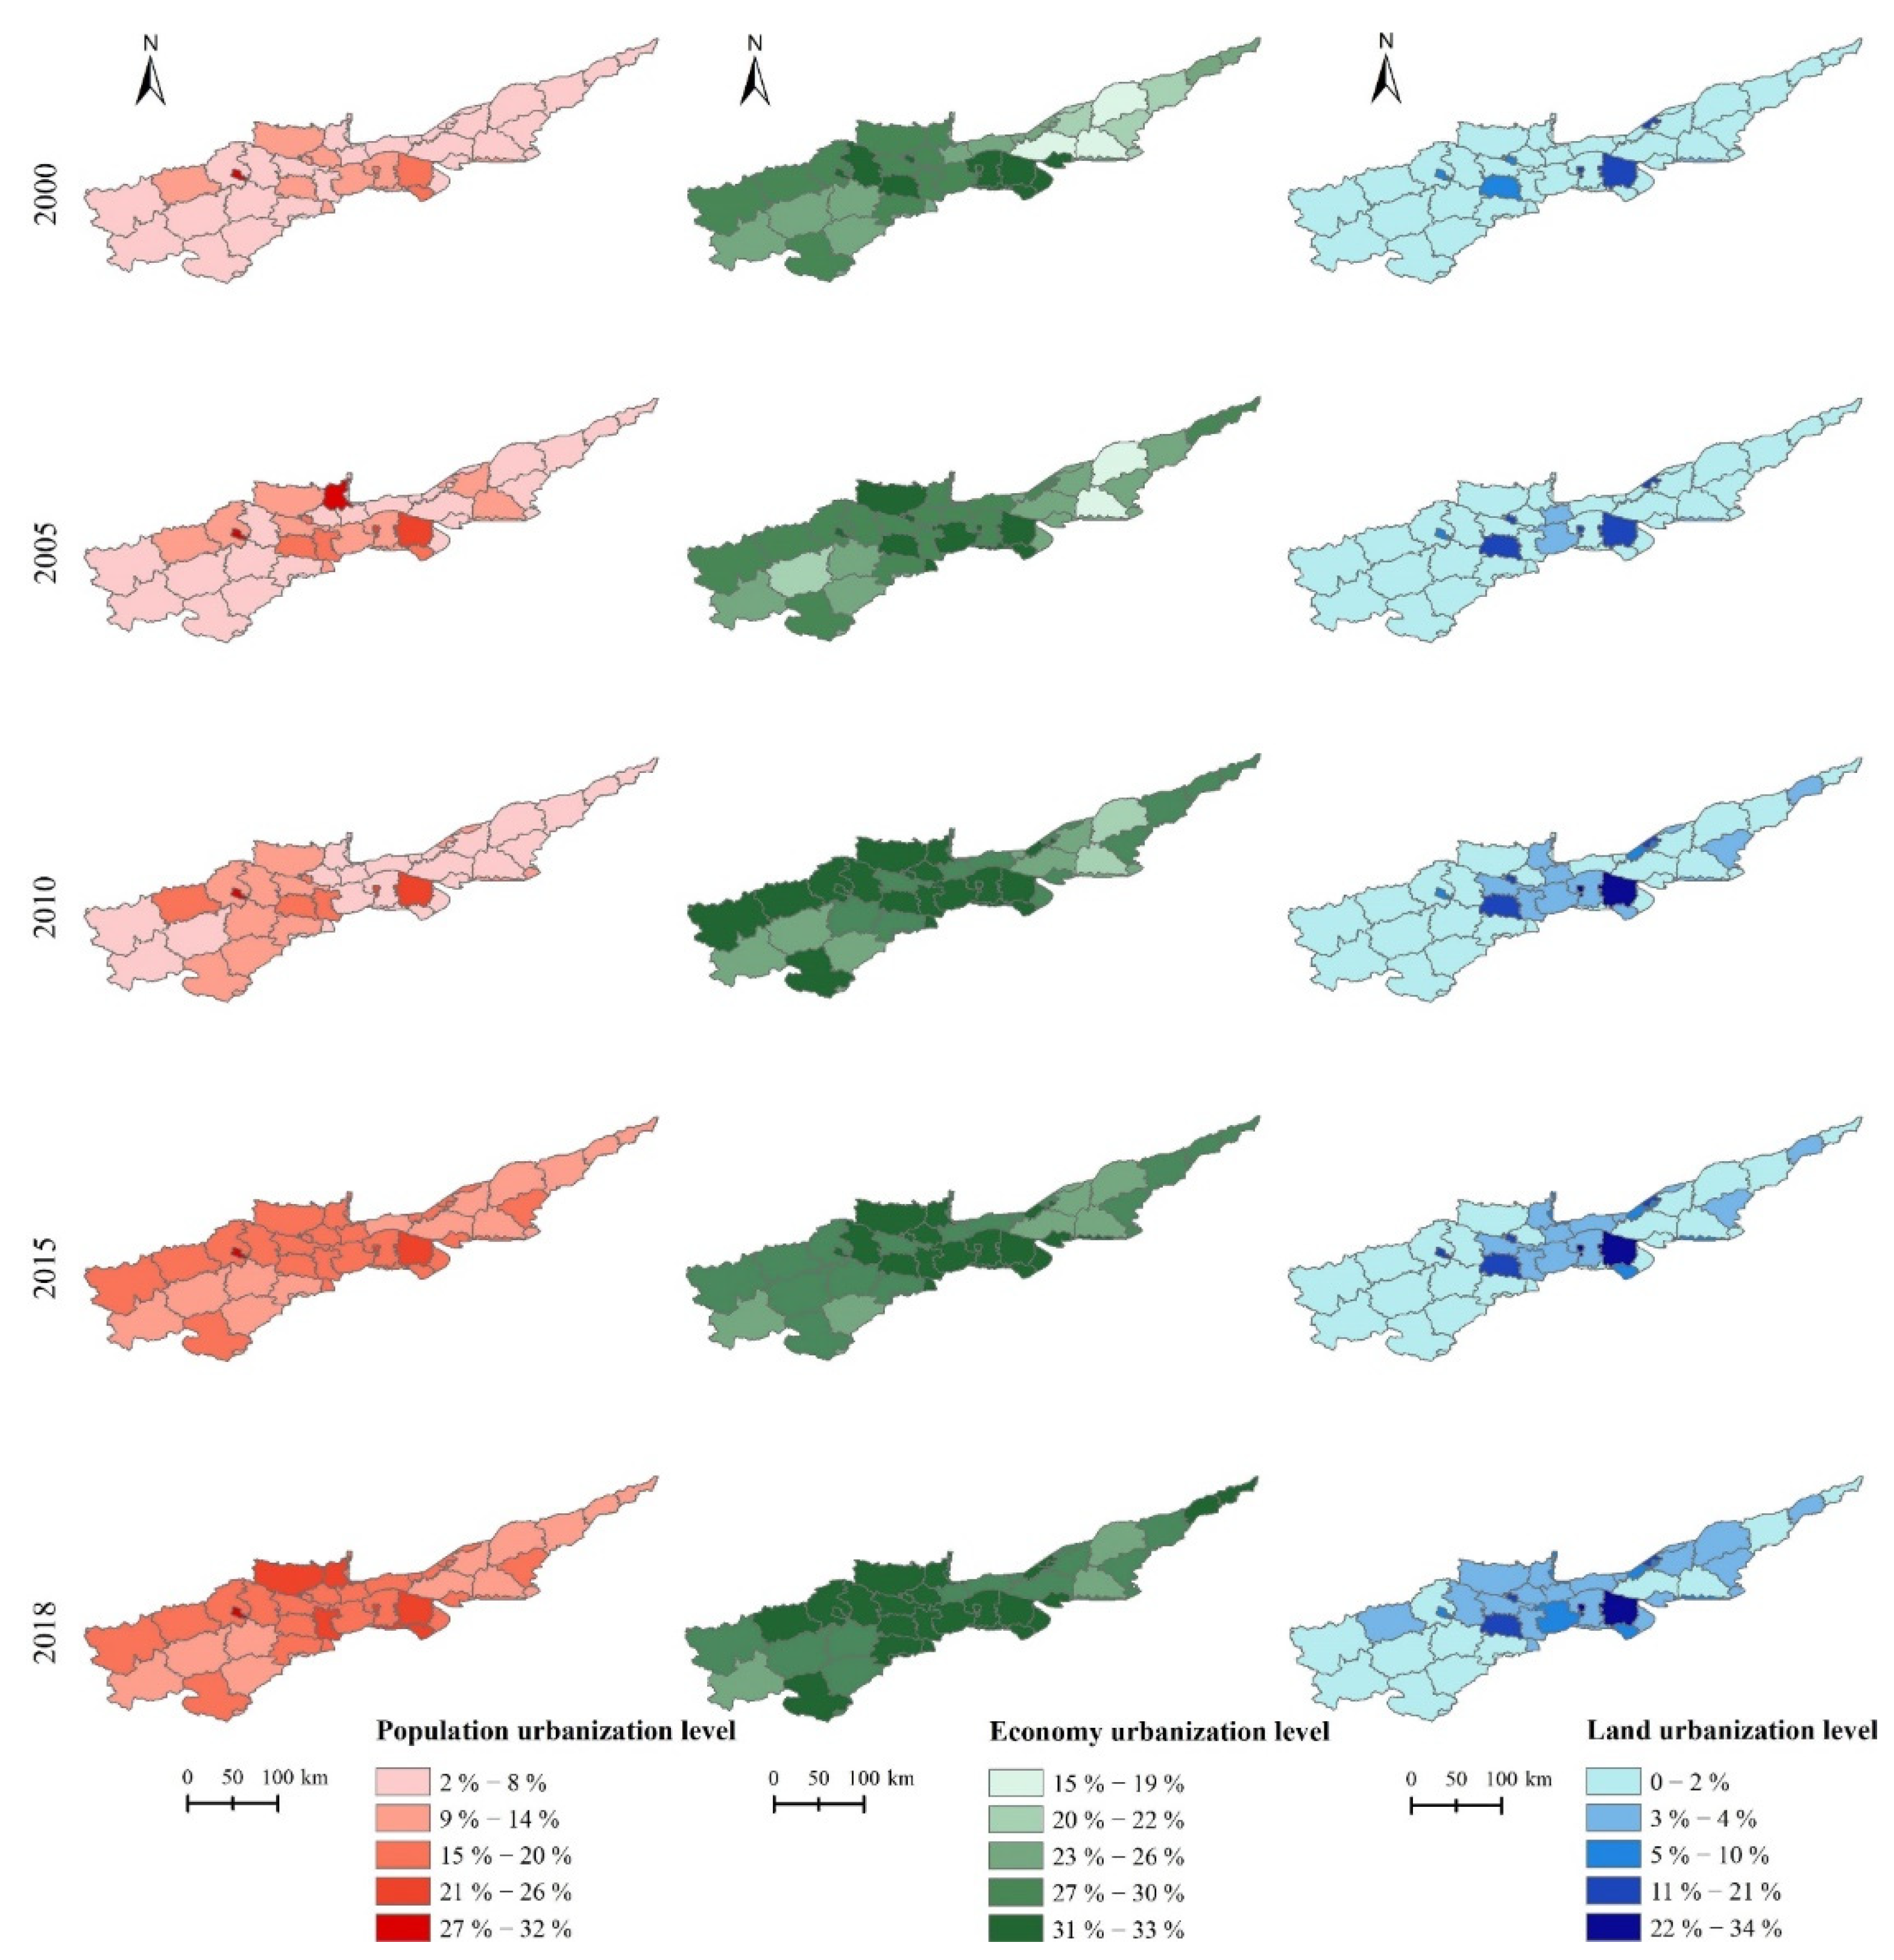
3.2.1. Single-Dimensional Urbanization

In 2000–2018, the population urbanization in the AYRHP continued to grow. Population urbanization level increased from 6.6% to 17%, with a growth rate of 157.58%. In comparison with that of 2000, the growth rate of urbanization level in 2010 was the lowest (i.e., 18.18%). In comparison with that of 2010, the population urbanization level in 2018 increased sharply. On the county scale, the population urbanization in all 42 counties and districts along the Yellow River of Henan Province were increasing in 2000–2018 (Figure 7). The top five areas with the highest growth rate of population urbanization were Fengqiu County (526.46%), Changyuan City (524.83%), Yanshi City (517.55%), Xinxiang County (500.47%), and Yichuan County (438.9%). The high-value areas in the population urbanization level were mainly distributed in Sanmenxia City, urban areas of Zhengzhou and Luoyang, and their surrounding counties and districts. The main reason is that various industries in the central urban area develop rapidly, which can provide a large number of jobs and attract a large number of people. The population density and the urbanization rate of permanent residents were also higher than those in the surrounding cities.
In 2000–2018, the economy urbanization in the AYRHP continued to grow. The economy urbanization level increased from 25.5% to 30.1%, with a growth rate of 18.04%. On the county scale, the economy urbanization in all 42 counties and districts were increasing in 2000–2018. The top five areas with the highest growth rate of economy urbanization were Fengqiu County (65.43%), Hua County (56.89%), Puyang County (43.29%), Yuanyang County (42.47%), and Yanjin County (37.52%). The distribution of high-value areas with economy urbanization level was similar to that of high-value areas with population urbanization level.
In 2000–2018, the land urbanization in the AYRHP continued to grow. The land urbanization level increased from 1.6% to 3.9%, with a growth rate of 143.75%. On the county scale, the land urbanization in all 42 counties and districts along the Yellow River of Henan Province were increasing in 2000–2018. According to the growth rate, the top five counties or districts were Xinzheng City (471.46%), Changyuan City (369.74%), Xinxiang County (348.54%), Mengjin County (295.09%), and Xin’an County (279.7%). The land urbanization in the AYRHP continued to grow, but the overall level was relatively low. Except for the central urban area, the land urbanization levels of other counties were at an extremely low level. The AYRHP still focus on agriculture, where the land use type is mainly cultivated land. At the same time, China’s cultivated land protection policy is extremely strict, which is the main reason for the low level of land urbanization in most counties in the research area.

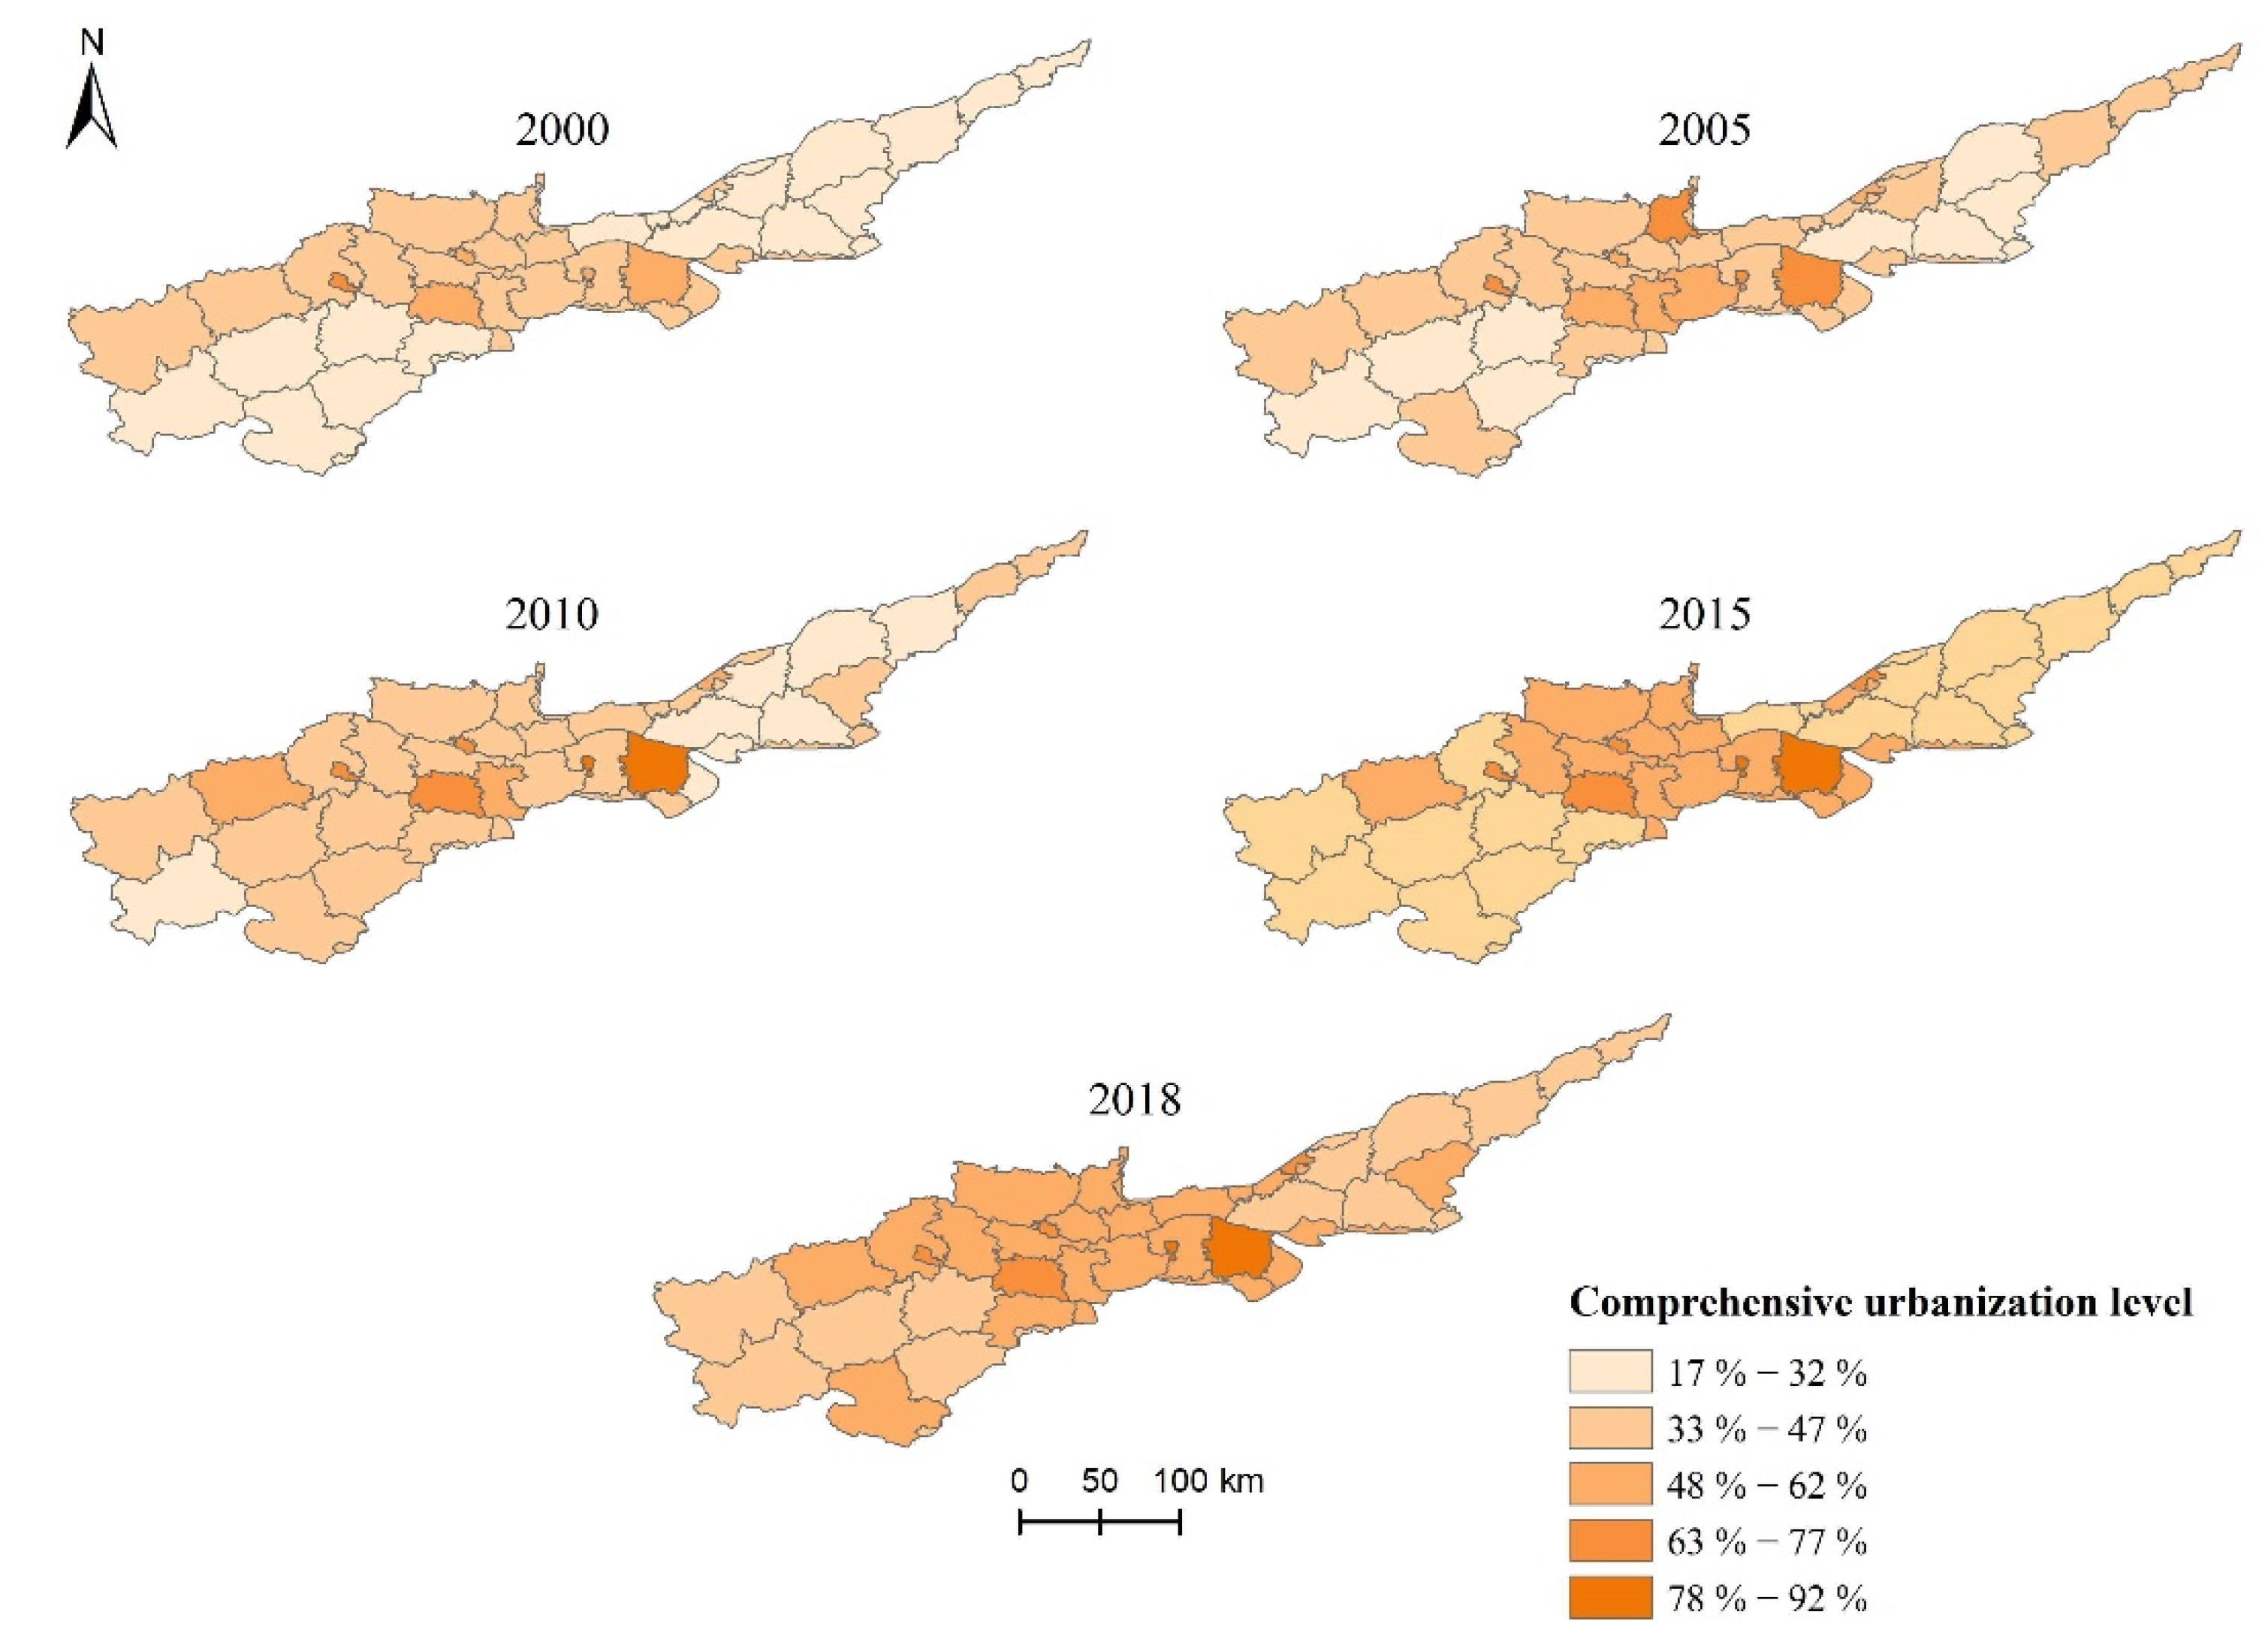
3.2.2. Comprehensive Urbanization

In 2000–2018, the comprehensive urbanization in the AYRHP continued to grow. The comprehensive urbanization level increased from 33.7% to 51.1%, with a growth rate of 51.63%. On the county scale, the comprehensive urbanization levels in all 42 counties and districts were increasing in 2000–2018. According to the growth rate, the top five counties or districts were Fengqiu County (123.17%), Changyuan City (95.03%), Hua County (89%), Xinxiang County (83.07%), and Yuanyang County (82.88%). In addition, the three counties or cities with the lower growth rate of comprehensive urbanization were Yima City (18.8%), Xinzheng City (27.03%), and the urban area of Sanmenxia City (29.99%).
From the spatial distribution (Figure 8), the comprehensive urbanization level in the AYRHP was high in the middle and low in the southwest and northeast in 2000–2018. The high-value areas in comprehensive urbanization level were mainly distributed in the urban area of Zhengzhou, Yima City, and the urban areas of Luoyang and Xinxiang City. The comprehensive urbanization levels of other counties were at a low level. The main reason is that these areas belong to the core cities, with a concentrated population, high economic development level, and high land use intensity. Social and economic preferential policies are inclined to these areas. The infrastructure and public services are perfect in these areas, with good employment and living environment. From the spatial change, the counties and districts with a large growth rate of comprehensive urbanization level are located in the middle and northeast of the research area.

3.3. Coupling Relationship between ESs and Comprehensive Urbanization

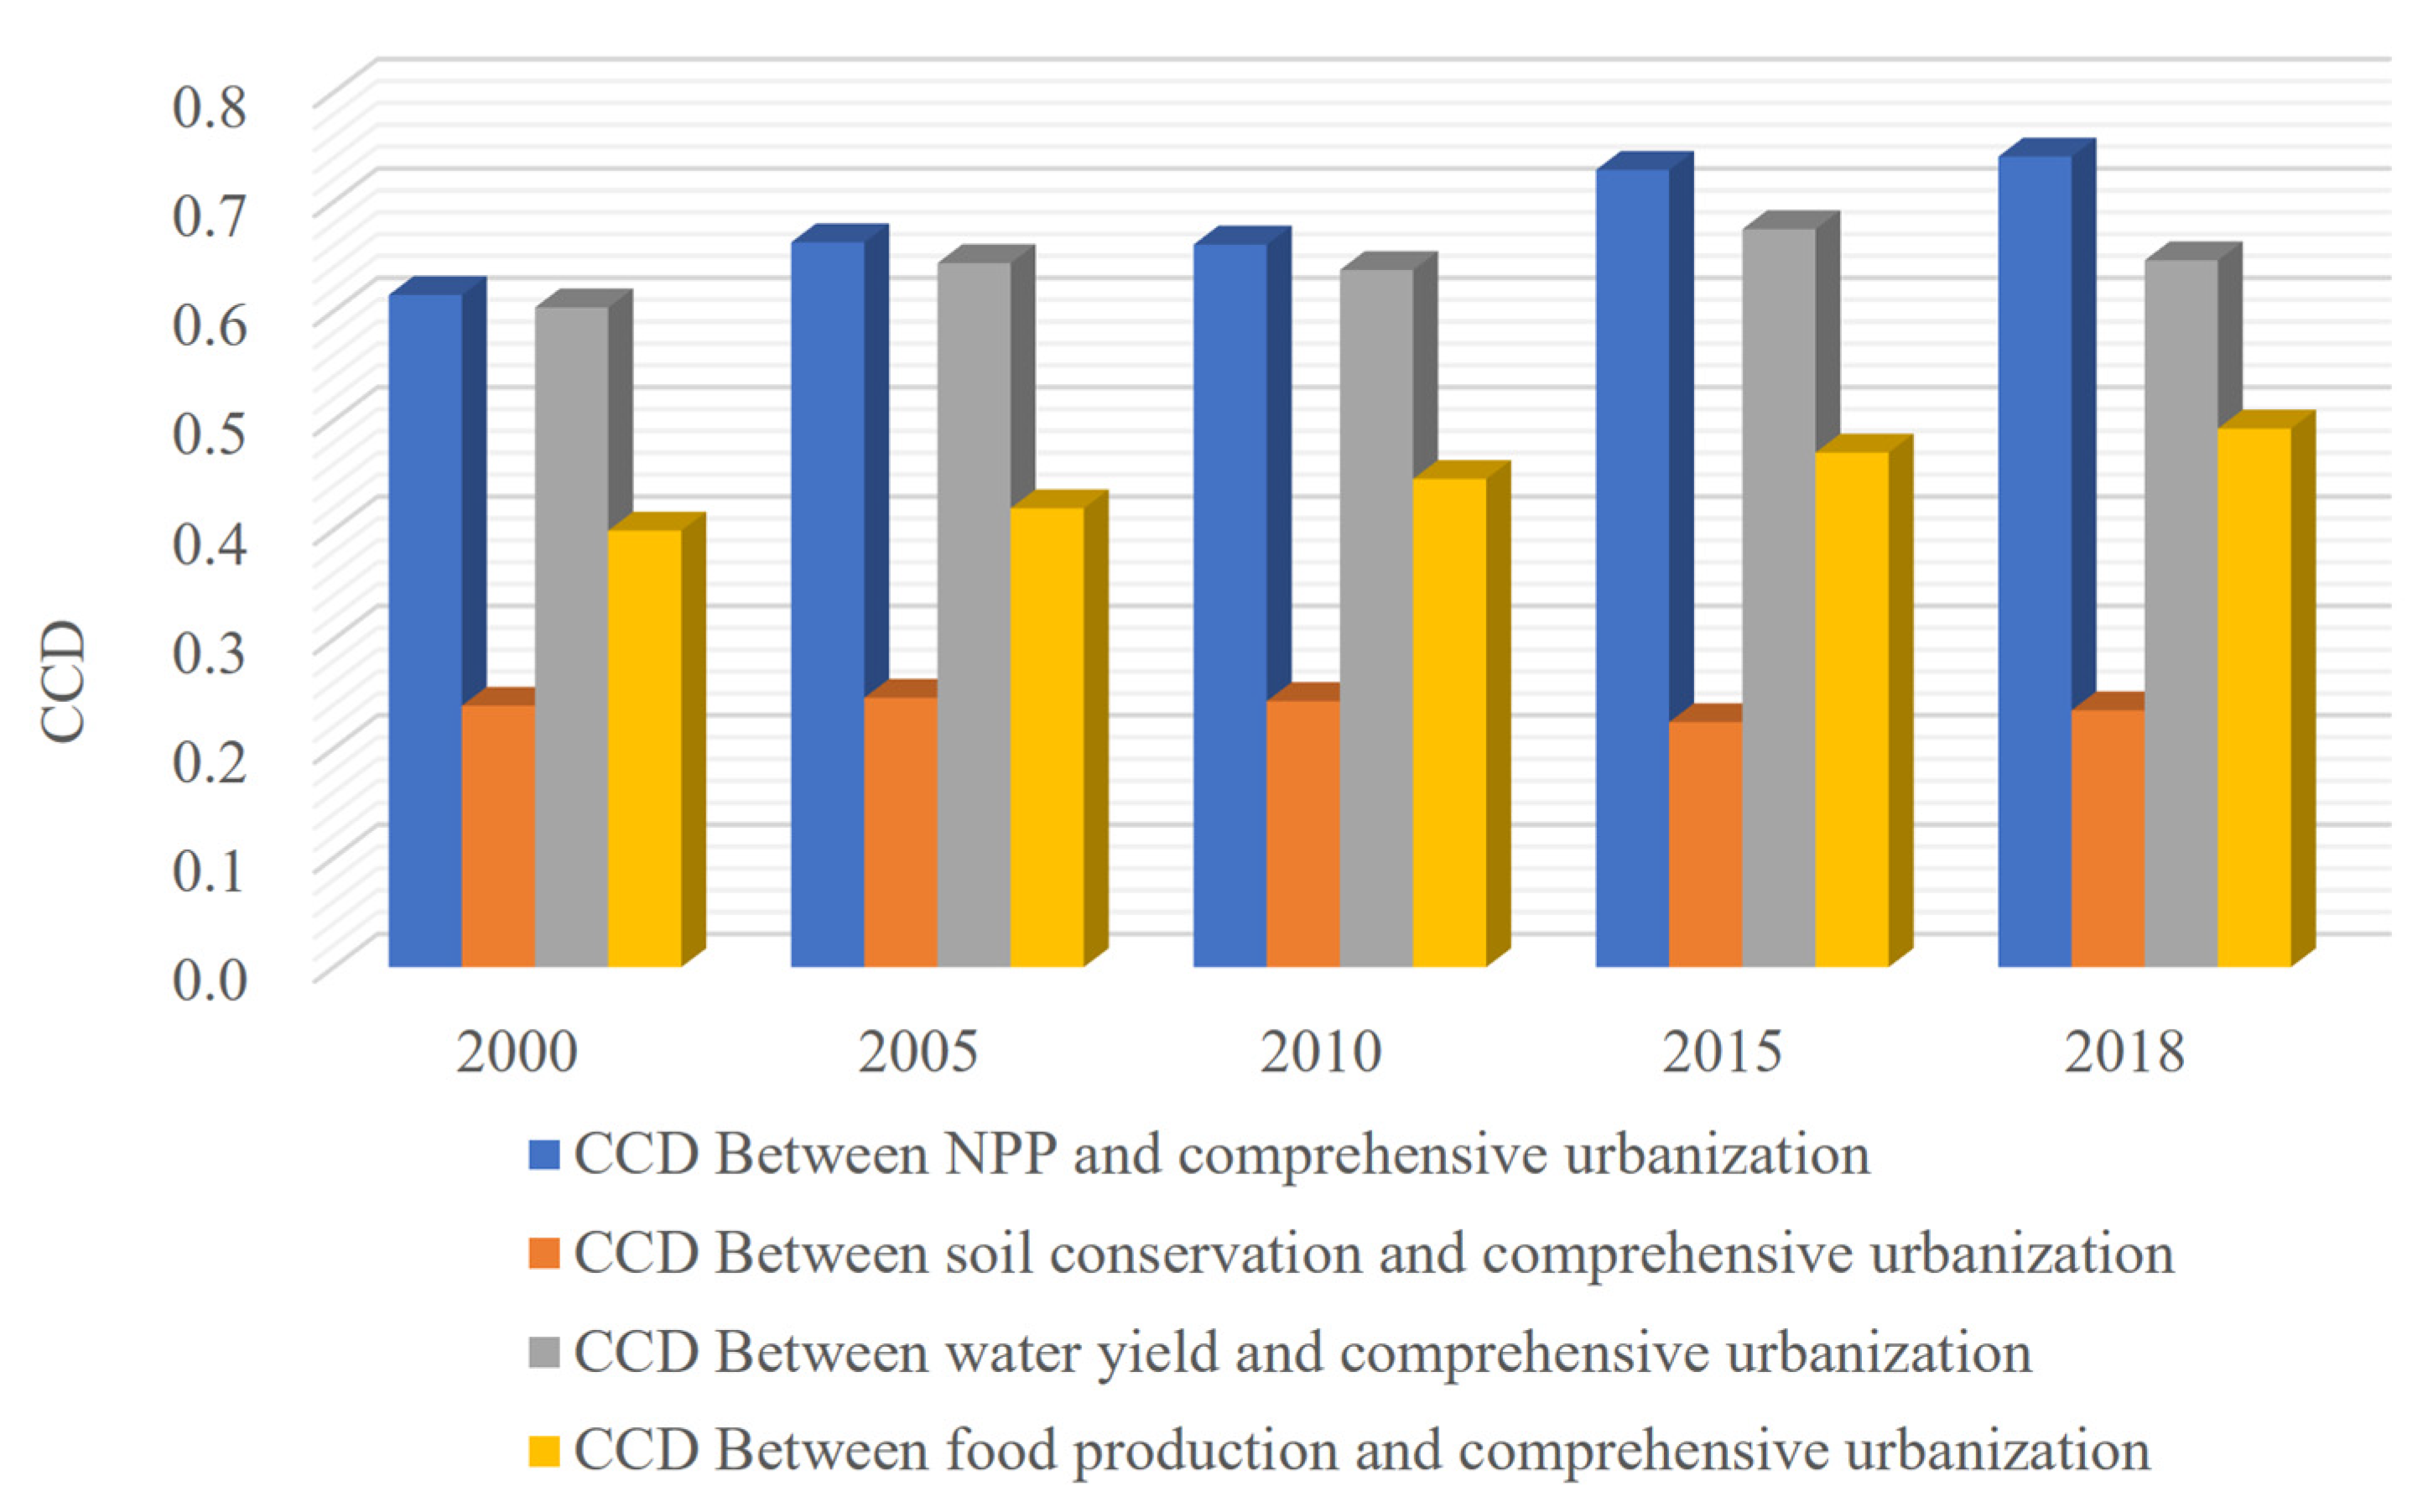
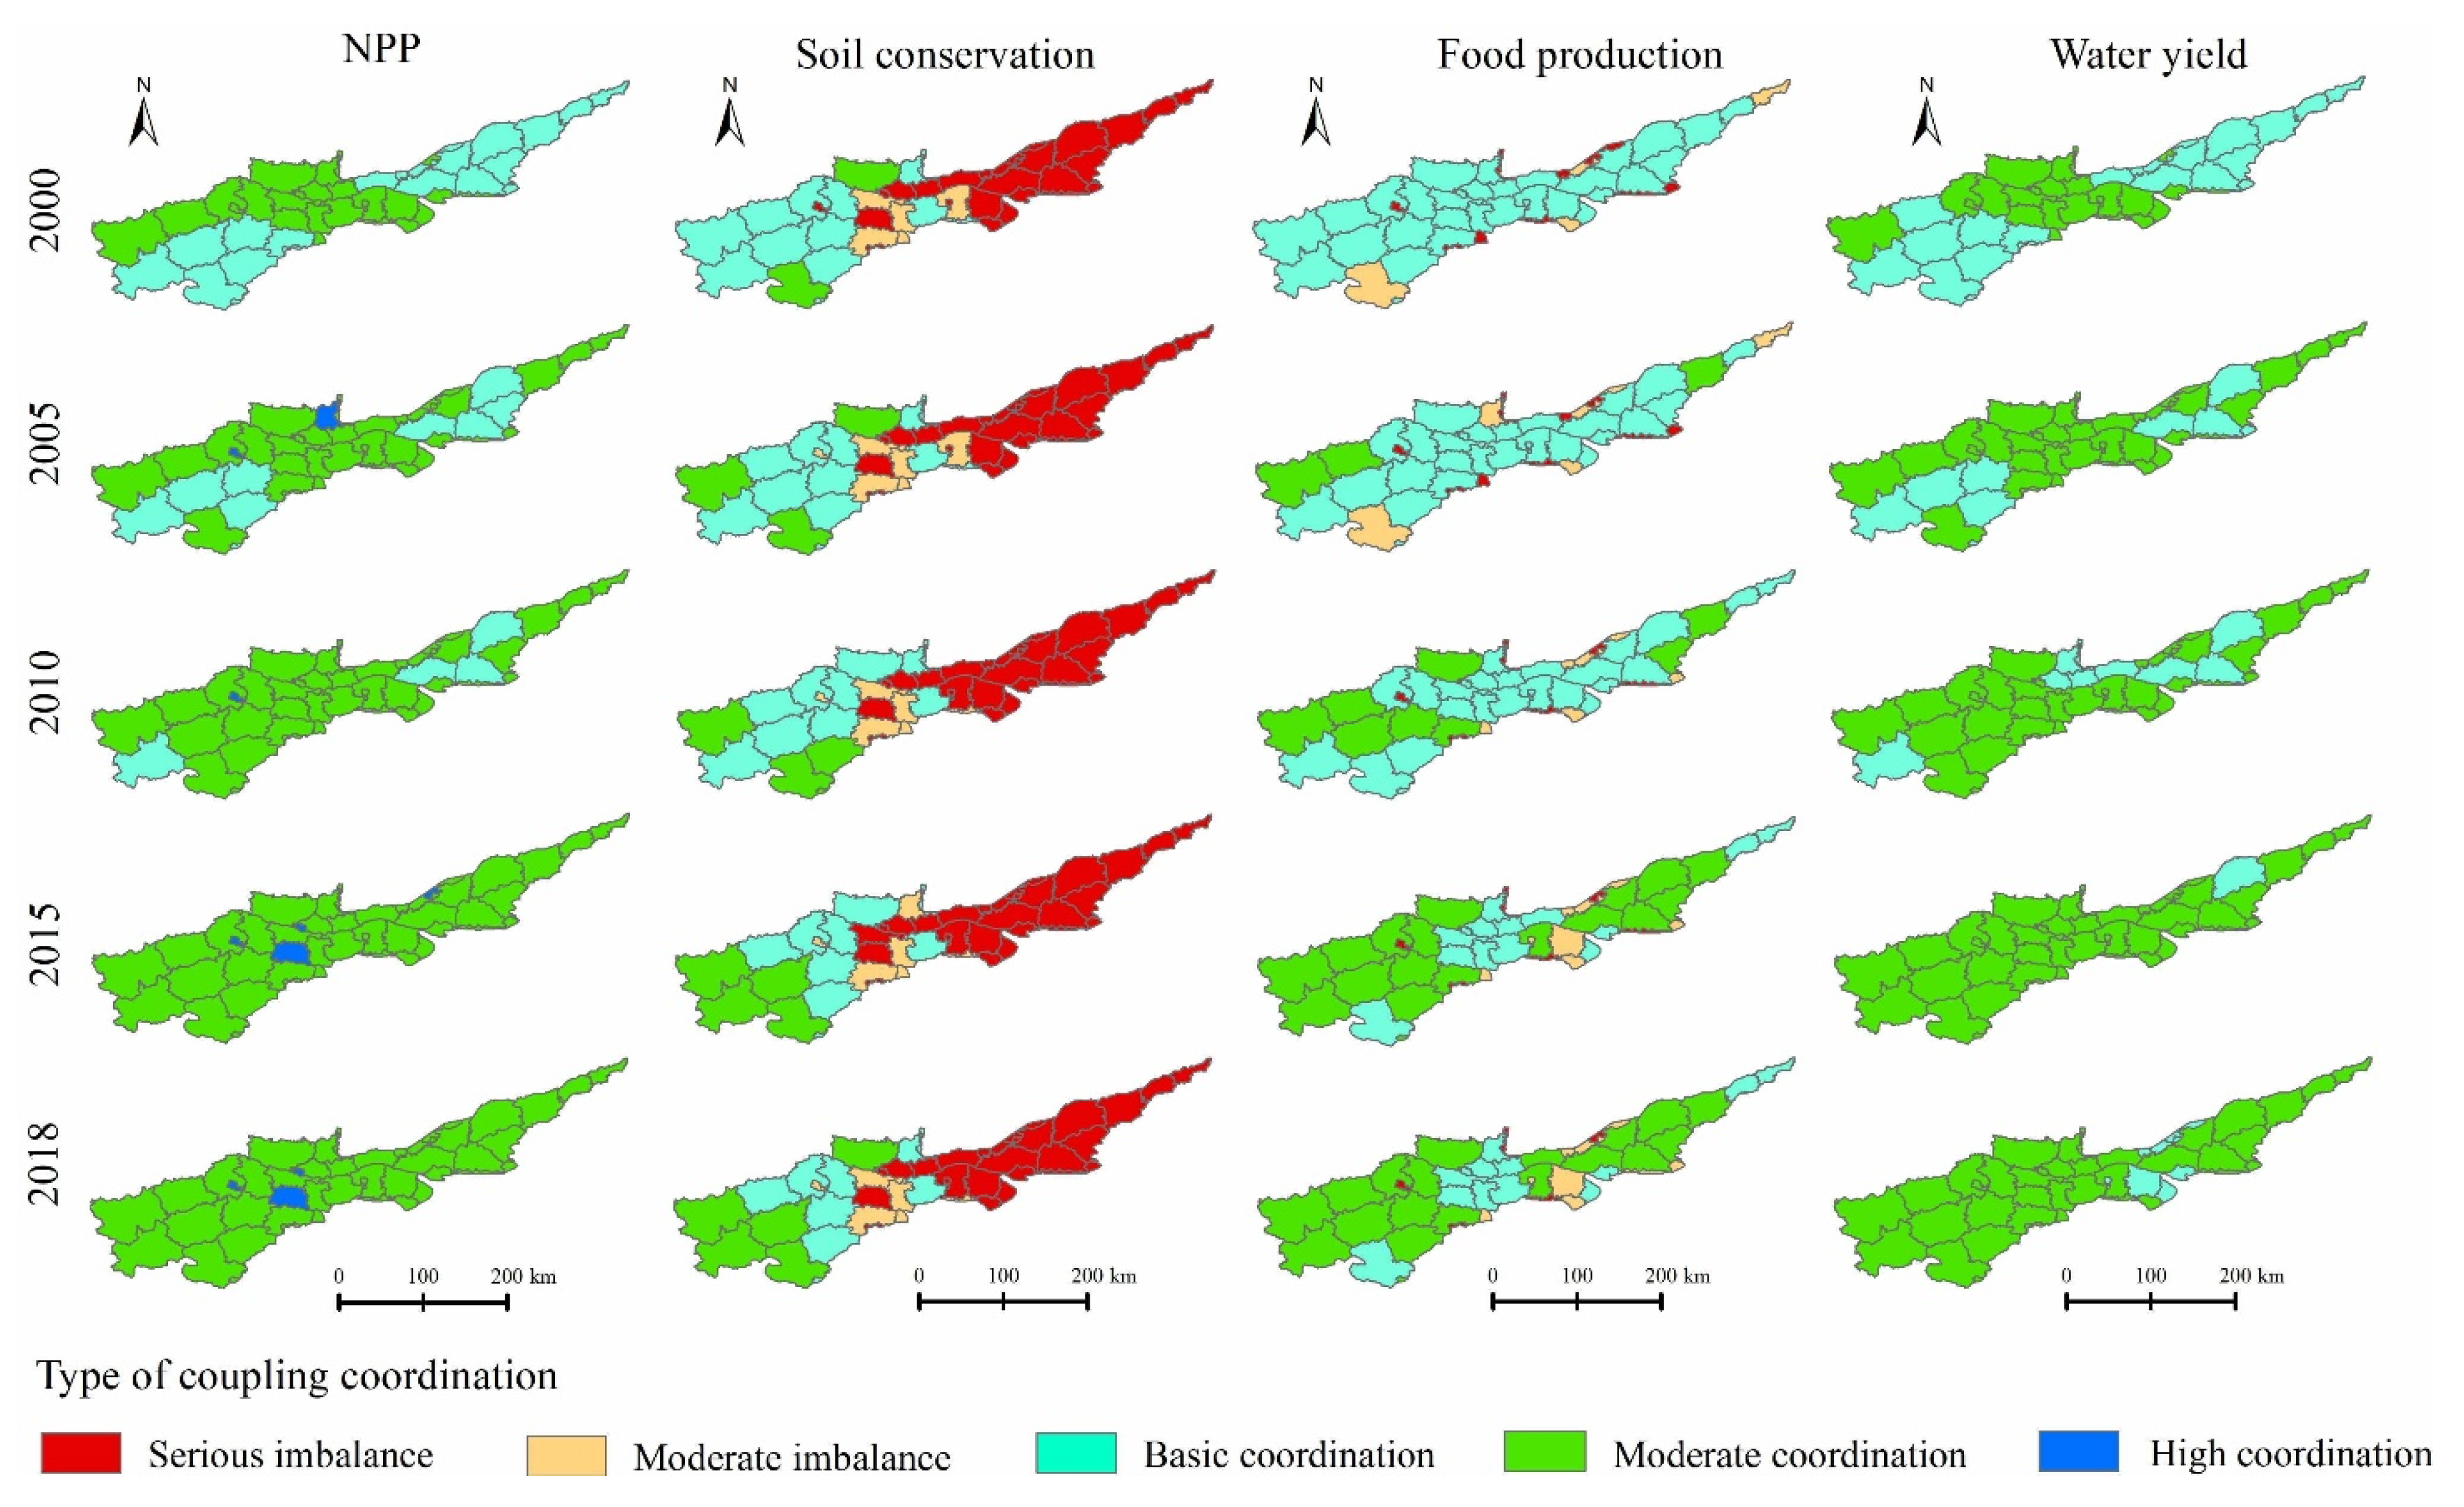
3.3.1. Spatiotemporal Change in the CCD between ESs and Comprehensive Urbanization

In 2000–2018, the CCD between NPP and comprehensive urbanization in the AYRHP increased from 0.615 to 0.741, with a growth rate of 20.5% (Figure 9). The total coupling coordination between NPP and comprehensive urbanization was moderate. From the spatial distribution, the CCD was high in the southwest and low in the northeast (Figure 10). Most counties and districts were in a moderate coordination. The CCD of 31 counties and cities in the research area increased in 2000–2018. Of all counties and districts, Fengqiu County had the highest growth rate of CCD (i.e., 56.18%). The proportion of counties and districts with moderate coordination increased from 76.19% to 95.24% in 2000–2018.
In 2000–2018, the CCD between soil conservation and comprehensive urbanization in our site decreased from 0.239 to 0.235, with a drop rate of 1.67% (Figure 9). The total coupling coordination between soil conservation and comprehensive urbanization was moderate maladjustment. From the spatial distribution, the CCD between soil conservation and comprehensive urbanization was high in the southwest and low in the northeast and decreased from the southwest to the northeast (Figure 10). Most counties and districts were in serious and moderate maladjustment. The CCD of only 10 counties increased in 2000–2018. Of all the counties and districts, the urban area of Sanmenxia had the highest growth rate (i.e., 34.88%). The CCD of 32 counties and districts in the research area decreased, in which Xinxiang County had the highest drop rate of CCD (i.e., 77.07%).
In 2000–2018, the coupling coordination between food production and comprehensive urbanization in our site increased from 0.399 to 0.492, with a growth rate of 23.31% (Figure 9). The total coupling coordination between food production and comprehensive urbanization was basic. From the spatial distribution, the CCD between food production and comprehensive urbanization was low in the middle and high in the southwest and the northeast (Figure 10). Most counties and districts were in moderate and basic coordination. From 2000 to 2018, only the CCD of the urban area of Zhengzhou and Xinxiang, Xinzheng city, decreased, and that of the other 39 counties and districts increased. Of all counties and districts, Xinmi City had the highest growth rate in CCD (i.e., 70.03%). The proportion of counties and districts with moderate coordination in the research area increased from 0 to 42.86% from 2000 to 2018.
In 2000–2018, the CCD between water yield and comprehensive urbanization in our site fluctuated. The coupling coordination in 2000 was the lowest (i.e., 0.603), whereas that in 2015 was the highest (i.e., 0.675; Figure 9). The total coupling coordination between water yield and comprehensive urbanization was moderate. From the spatial distribution, the basic and moderate coordination areas were concentrated and distributed in a continuous manner in space, and all counties and districts were in a coordinated state (Figure 10). The CCD of the 32 counties and districts in the research area increased in 2000–2018. Of all the counties and districts, Fengqiu County had the highest growth rate (i.e., 49.46%). In addition, the CCD of the remaining 10 cities and counties decreased. The urban area of Zhengzhou had the largest drop rate (i.e., 25.08%), followed by Xinzheng City and Zhongmou County.
Overall, the coupling coordination between NPP, food production, and water yield and comprehensive urbanization is basic or moderate, whereas that between soil conservation and comprehensive urbanization is moderate maladjustment. Specifically, the CCD between NPP and comprehensive urbanization is the highest, followed by the CCD between water yield and food production and comprehensive urbanization. The CCD between soil conservation and comprehensive urbanization is the lowest.

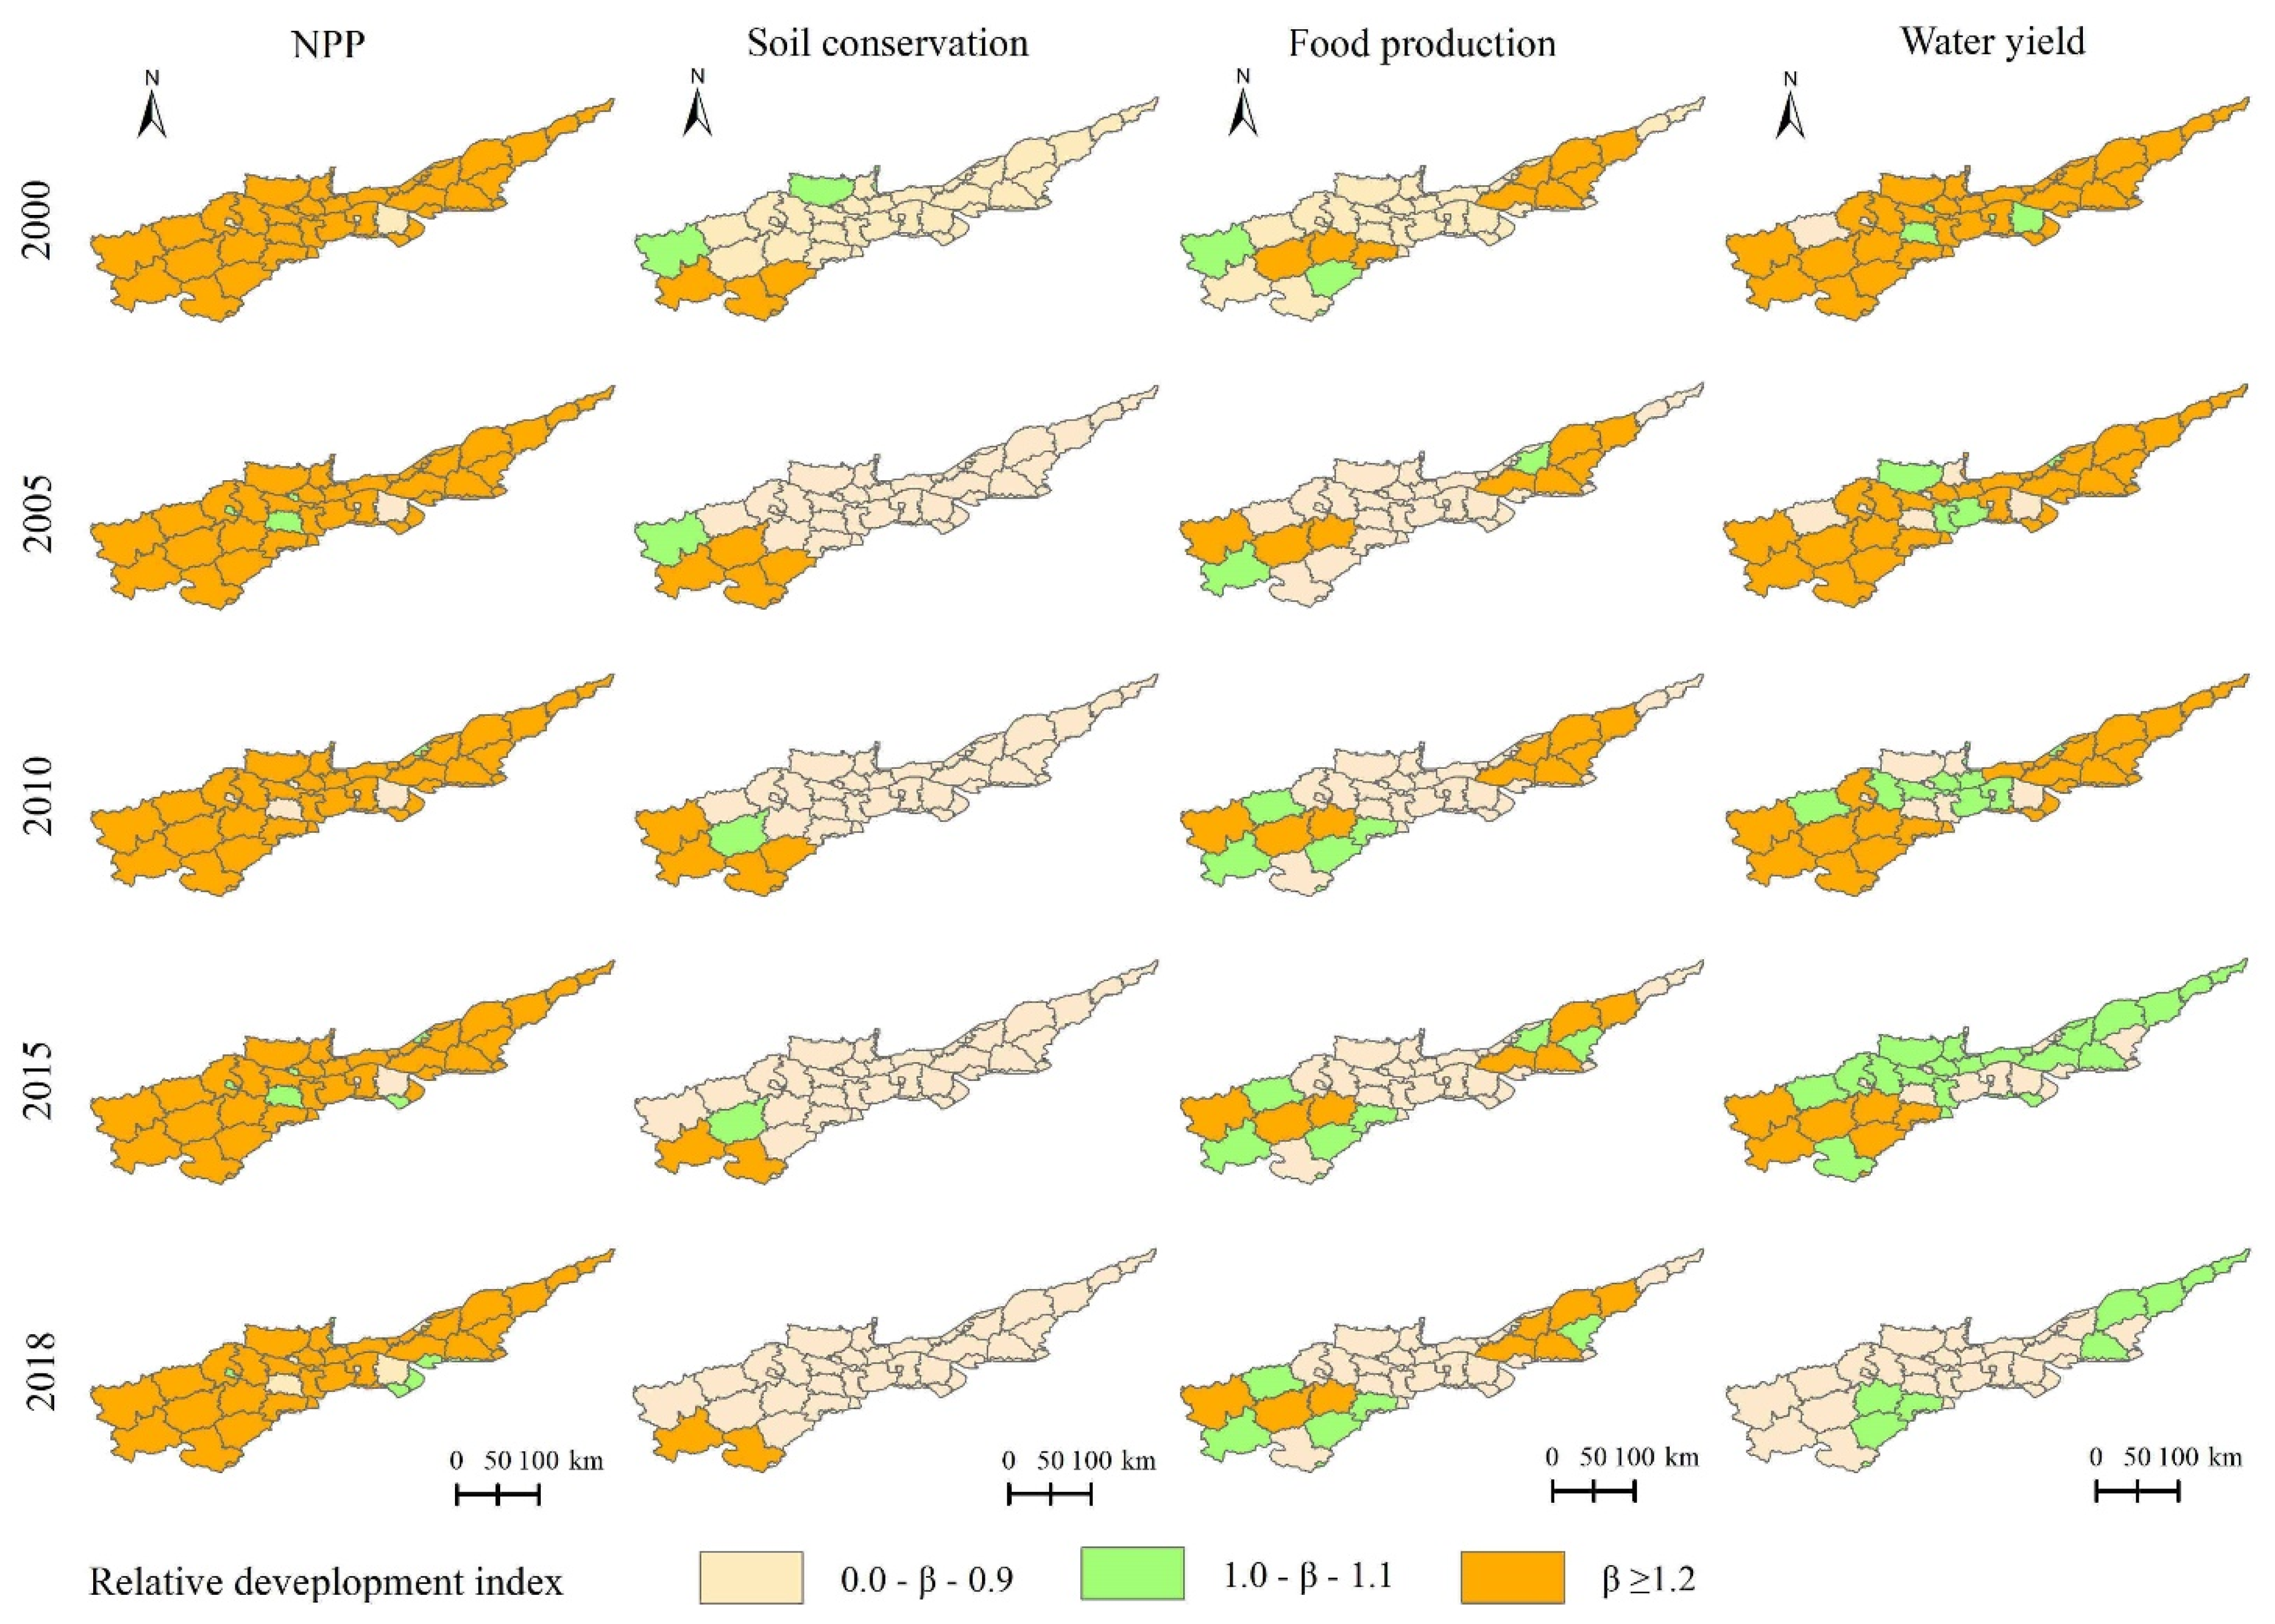
3.3.2. Spatiotemporal Change in the Relative Development Degree of ESs and Comprehensive Urbanization

In 2000–2018, the relative development of comprehensive urbanization and NPP in the AYRHP was mainly comprehensive urbanization lag type (Figure 11). The number of counties and districts with the lag type of comprehensive urbanization from 2000 to 2018 decreased from 40 to 34. At the same time, the number of cities and counties in the synchronous development of comprehensive urbanization and NPP also increased from 0 to 5.
In 2000–2018, the relative development of comprehensive urbanization and soil conservation in the AYRHP was mainly soil conservation lag type (Figure 11). The counties and districts with the lag type of soil conservation service were mainly distributed in the middle and southeast of the research area and continued to expand. From 2000 to 2018, the proportion of counties and cities of the lag type of soil conservation service increased from 85.71% to 95.24%.
In 2000–2018, the relative development of comprehensive urbanization and food production in the AYRHP was mainly food production lag type (Figure 11). The counties and districts of the lag type of food production service were mainly distributed in the middle and southeast of the research area and continued to decrease. Conversely, the counties and districts of comprehensive urbanization lag type were unchanged in number and spatial distribution. In addition, the number of counties and districts of food production–comprehensive urbanization synchronous development type increased from 2 to 5.
In 2000–2018, the relative development of comprehensive urbanization and water yield in our site changed greatly. The comprehensive urbanization lag type was dominant in 2000–2010, whereas the water yield lag type was dominant in 2018 (Figure 11). The proportion of counties and districts of the comprehensive urbanization lag type from 2000 to 2018 decreased from 90.48% to 0, whereas that of water yield lag type increased from 4.76% to 78.57%. The number of counties and districts in water yield–comprehensive urbanization synchronous development increased from 2 to 9.

4. Discussion

4.1. Influencing Factors on the Coupling Relationship between ESs and Urbanization

Some scholars have analyzed the relationship between urbanization and ecological environment in the Yellow River Basin using the coupling coordination model. Zhao et al. [1] constructed a new coupling coordination model between urbanization and ecological environment to quantitatively measure the spatiotemporal patterns of both and their development state. As a result, the mean value of the coordination between urbanization and ecological environment in the Yellow River Basin was obtained, that is, 0.20–0.60, which is in the low and moderate coordination on the whole. Sun et al. [65] measured the coupling coordination of urban agglomeration in the Yellow River Basin by using models in 2000–2019 and predicted that the coupling coordination between urbanization and ecological environment in the central plains in the Yellow River Basin will reach a primary or higher coordination state by 2025. According to this research, the total coupling coordination between multiple ESs (NPP, food production, and water yield) and comprehensive urbanization is basic or moderate. This conclusion is consistent with the research results of Zhao et al. [1] and Sun et al. [65].
In this study, the spatiotemporal change in the coupling coordination between ESs and urbanization in the AYRHP in 2000–2018 is identified using the coupling coordination model. The CCD between NPP and food production and comprehensive urbanization continues to increase because NPP, food production, and comprehensive urbanization in the AYRHP continue to grow in the research period. The main reason for the rise of NPP is the promotion of a series of ecological protection policies and measures in the AYRHP. Since 2003, the Henan Forestry Bureau has successively issued relevant policies and laws on the Green for Grain Project, Afforestation Method, and Natural Forest Protection Project. In 2018, Henan Province promulgated the Forest Henan Ecological Construction Plan, which provides a detailed deployment plan for the forestry ecological construction of the whole province. The increase in food production is affected by many factors. The annual food output in the AYRHP accounts for one-fifth of total food output of the Henan Province. It is an important food production area in Henan Province. A strict farmland protection system is implemented in China, implementing the strategy of better management of the granary and technologically using cultivated land resources into effect. The Henan provincial government has actively responded to national policies, continuously performed actions to protect and improve the quality of cultivated land, resolutely curbed the “non-agricultural” and “non-grain” problems of cultivated land, thereby promoting a series of measures and policies, such as the construction of high-standard farmland. The improvement of farmland infrastructure and the enhancement of agricultural technology are also important factors for the continuous increase in total grain output. Although the total grain output in the AYRHP is increasing, the grain output in some areas, such as Zhengzhou City, is decreasing. The main reason is that the main urban area of Zhengzhou has been expanding in recent years, and a large amount of land use has been converted from cultivated land to urban construction land. Therefore, the cultivated land has decreased sharply.
The CCD between water yield and comprehensive urbanization fluctuates during the research period due to the fluctuation of water yield. In comparison with 2000, water yield increases in 2010, but it drops in 2018. The calculation result of the relative development degree shows that the water yield of the AYRHP in 2018 is lag type. The main reason is the decrease in the amount of water yield. The AYRHP are located in a semi-arid area with a concentrated population and high agricultural intensity. Therefore, it has a shortage of water resources. Utilization and development of groundwater in some counties and districts along the Yellow River of Henan Province exceed 100%, and water resources are over-developed. The area of the funnel region of groundwater shows an upward trend. Agricultural water consumption accounts for about 80% of the total water consumption, and the utilization efficiency of agricultural water resources is low. When promoting the urbanization, the first issue to be concerned with is how to improve water yield and improve or solve the shortage of water resources. During the research period, the CCD between soil conservation and comprehensive urbanization is moderate maladjustment, and it is serious maladjustment in some counties and districts. The calculation result of the relative development degree shows that the soil conservation of most counties and districts along the Yellow River of Henan Province is lagged. Soil conservation generally increased in 2000–2018. However, the increased area is concentrated in the high-value areas of soil conservation in the southwest of the research area, whereas the low-value areas in the northeast are slightly changed. A Yellow River alluvial plain is present in the northeast along the Yellow River of Henan Province, with fertile soil and relatively loose soil. The Yellow River directly passes through the counties and cities in the northeast. The Yellow River has a relatively large curvature and a relatively serious swing. In addition, the land use types in these counties and districts are mostly cultivated land; thus, the soil erosion is serious, and the soil conservation level is low. By 2019, the area of soil loss in the Yellow River Basin accounts for about half of the basin area, which explains the reason for the maladjustment between soil conservation and comprehensive urbanization.
The CCDs between NPP, water yield, and soil conservation and comprehensive urbanization show a similar spatial distribution, that is, the distribution trend of high in the southwest and low in the northeast. The counties and districts in the southwest are located in the upper and middle reaches of the river, with high forest land coverage. Therefore, the ecosystem regulation services, including NPP, water yield, and soil conservation are relatively high. NPP, water yield, and soil conservation in these counties match the local comprehensive urbanization level; thus, the CCD is correspondingly high. The CCD between food production and comprehensive urbanization is low in the middle and high in the southwest and the northeast. The main reason is that the urbanization level of the central region is relatively high. It is the core region, but the grain output level of these regions is relatively low, which does not match the comprehensive urbanization level. Therefore, the coupling level is low.

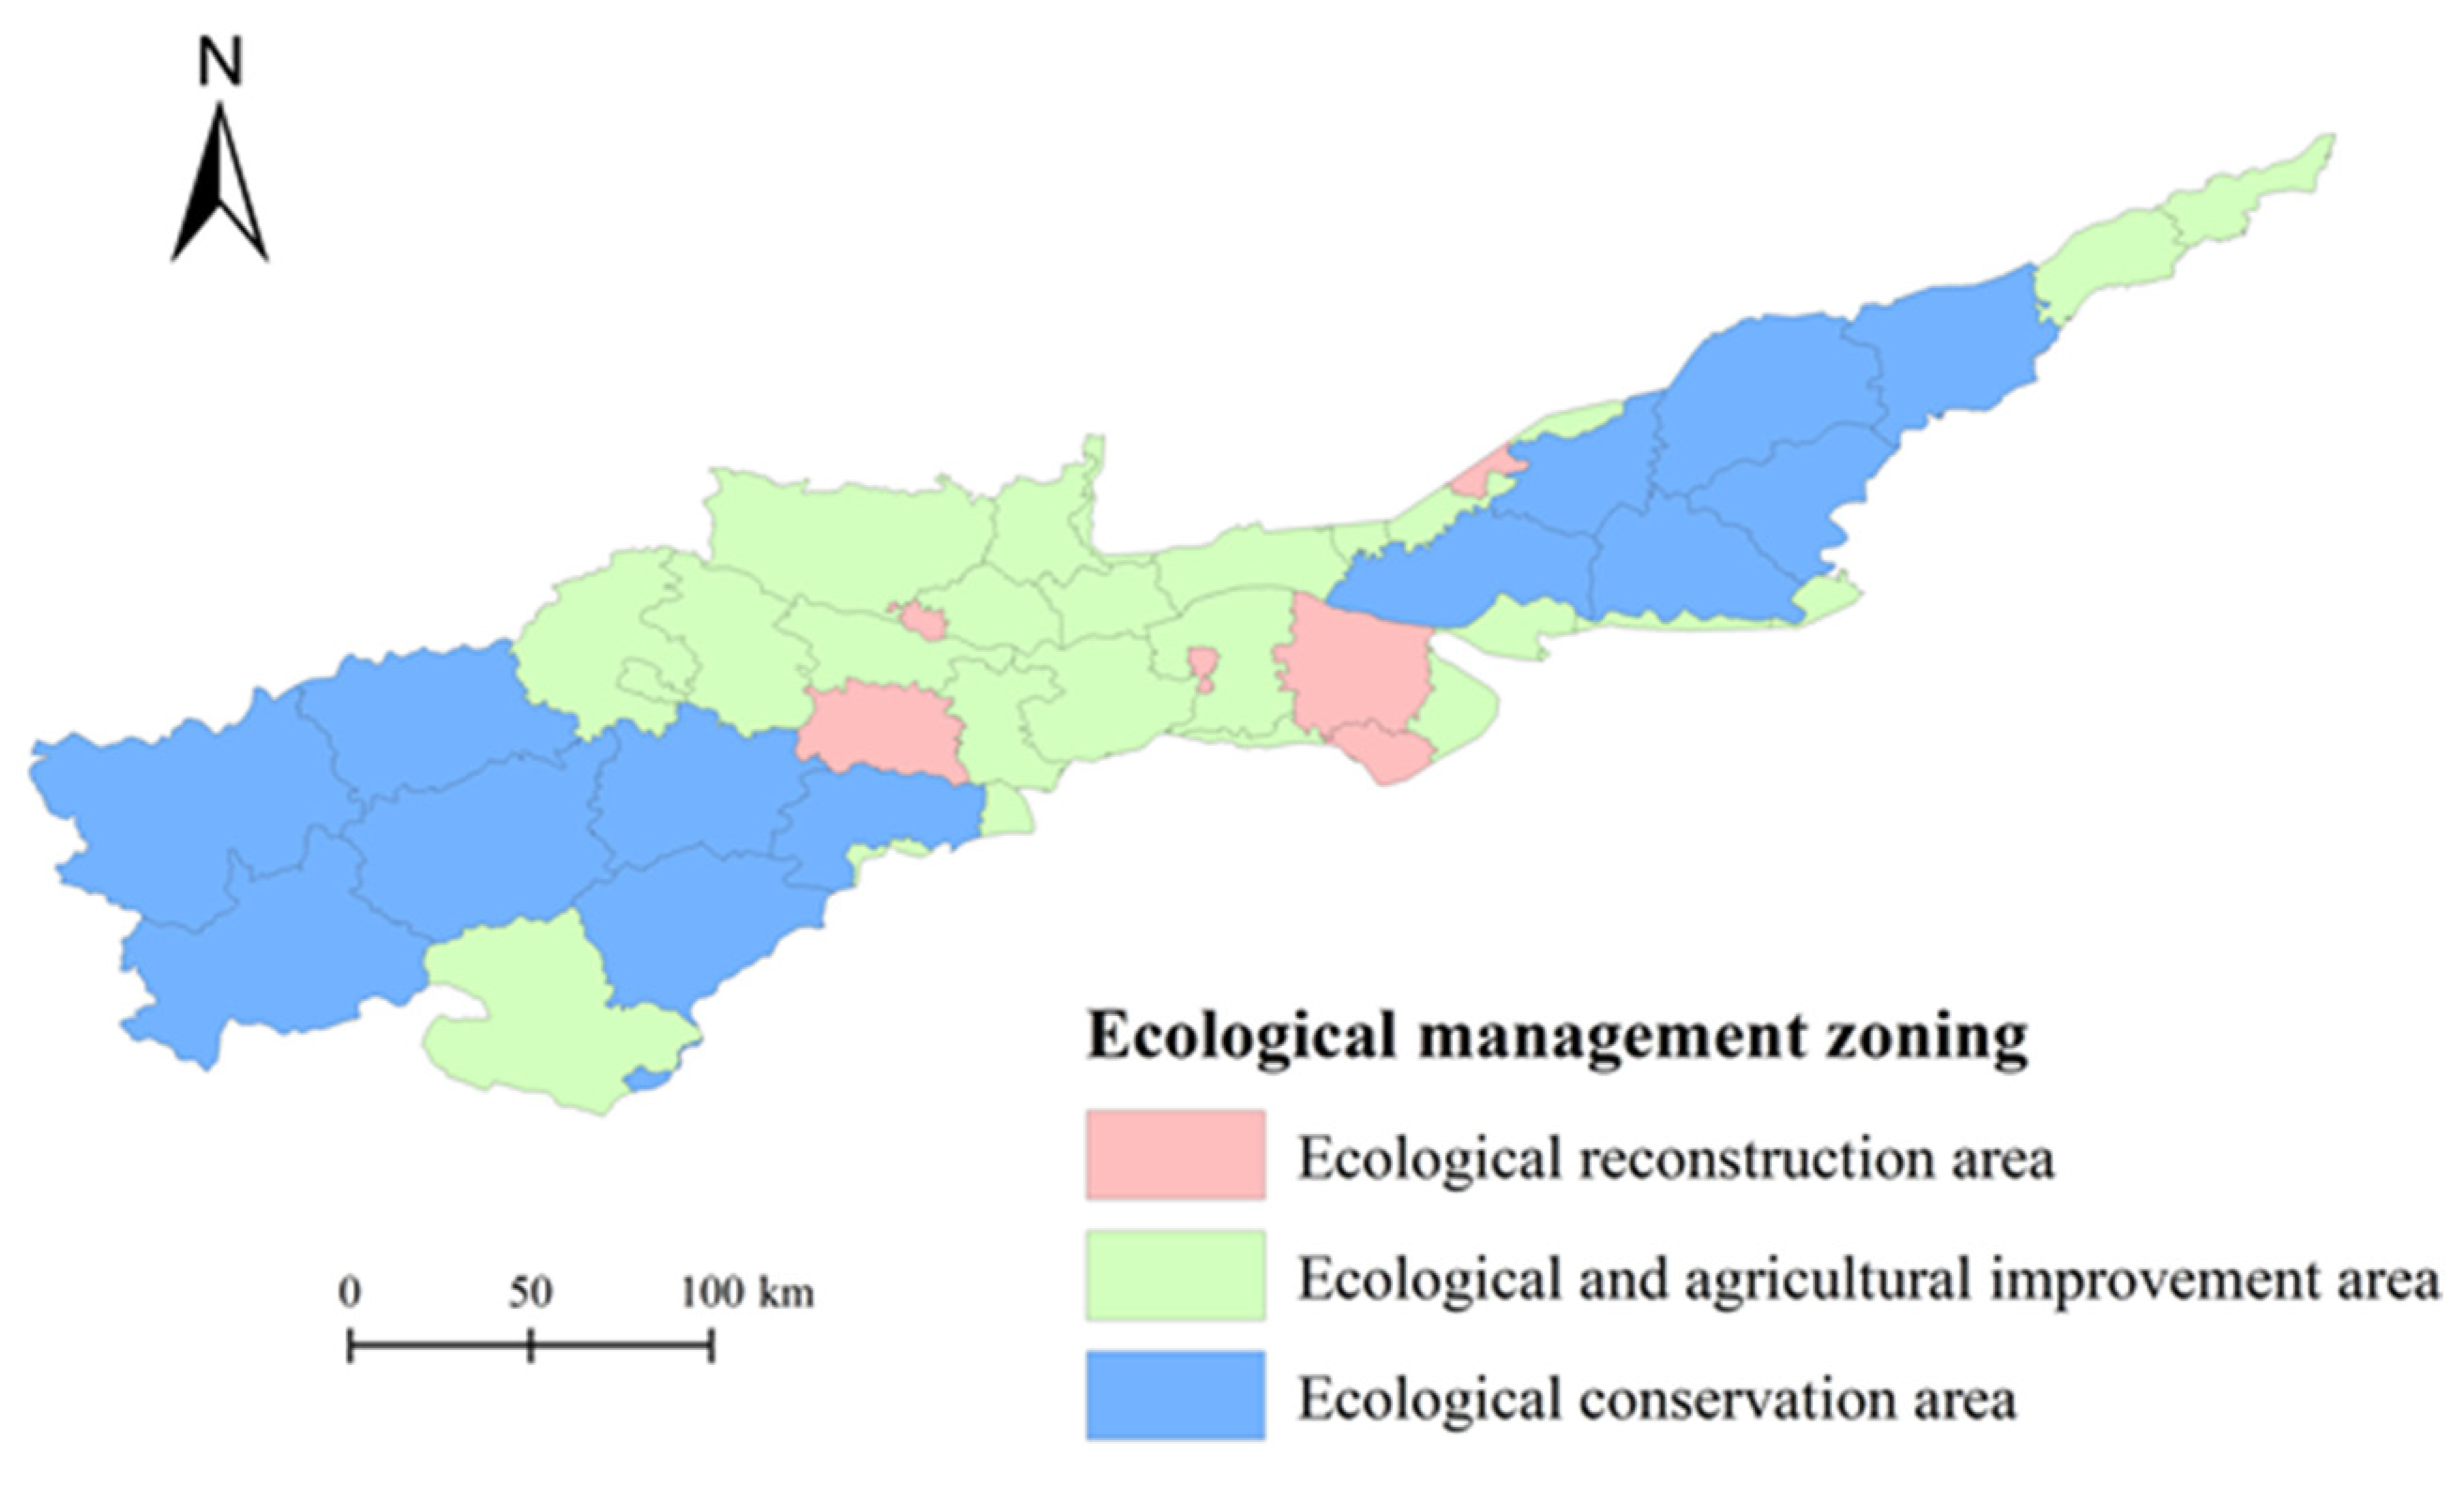
4.2. Ecological Management Zoning on the County Scale and Policy Suggestions

With the continuous development of urbanization and economy, the strained relations between human and land, between human and water, and between human and environment in the AYRHP will continue to intensify in the future. In the AYRHP, as an important food output and densely populated area, how to realize the coordinated development between urbanization and ecological environment is its important development strategic goal. The ecological management zoning on the county scale can provide a scientific support for ecological protection and high-quality development in the AYRHP.
Although the degree of coupling coordination between some ESs and comprehensive urbanization is rising, the results of relative development show that food production and soil conservation in most AYRHP lag behind the level of urbanization. In 2018, water yield in most counties and districts also lagged behind the level of comprehensive urbanization. The relative development index can accurately identify the lead–lag relationship between urbanization and ESs in various counties and districts. From the results of the relative development types of ES and comprehensive urbanization, the types of various counties and districts are clearly identified, namely, comprehensive urbanization lag type, ES lag type, or ES–comprehensive urbanization synchronous development type. Therefore, based on the relative development types of comprehensive urbanization and ES, the ecological management zoning is conducted. In 2018, except for NPP, the relative development types of soil conservation, food production, and water yield services and comprehensive urbanization are dominated by ES lag type and are in most counties and cities of the research area (Figure 10). In view of the restrictive role of ESs in urban sustainable development, the ES lag is taken as the reference of ecological management zoning. The counties and districts along the Yellow River of Henan Province are divided into three types of ecological management area, namely, ecological reconstruction area, ecological and agricultural improvement area, and ecological conservation area (Figure 12).
The counties and districts of NPP–soil conservation–water yield–food production lag type are classified as the ecological reconstruction area, including four urban districts, which are the core areas of social and economic development along the Yellow River of Henan Province. High comprehensive urbanization level and low ES capacity are the main characteristics of the area. Ecological protection should be taken as the premise of development in future development planning. The government should strictly control the boundaries of urban development and use the land intensively and economically. The urban green infrastructure and the area of urban green space should be increased. Nationwide water-saving action should be implemented to inhibit unreasonable water resource utilization. The core policy of the area is to control the urbanization and conduct ecological engineering construction to improve the level of ESs.
The three types of ecological and agricultural improvement area are soil conservation–water yield–food production lag type, soil conservation–food production lag type, and water yield–food production lag type. In particular, the soil conservation–water yield–food production lag type involves 21 counties and districts, which is the largest among the counties and districts of all ecological management types. These counties and districts are concentrated in the middle of the research area. Soil conservation–food production and water yield–food production lag types involve three counties and one county, respectively. These counties are distributed in the northeast and the southwest of the research area. The comprehensive urbanization level of ecological and agricultural improvement area is lower than that of ecological reconstruction area. According to the three lag types, we could find that both provision and regulating services lag behind the comprehensive urbanization in the ecological and agricultural improvement area. Therefore, the coordinated promotion of agricultural development and ecological construction should be noted in the process of policy implementation in this area. The local government should initially focus on adjusting and optimizing the land use structure, formulate a strict ecological protection red line, and clarify the agricultural and ecological spaces. In addition, the government should promote ecological construction to reduce soil erosion on both sides of the Yellow River by constructing a compound ecological corridor with organic integration of river, forest, and grass. In the construction of ecological engineering, excellent tree species with the ability to improve soil should be popularized to improve the level of soil conservation. The government should vigorously promote agricultural water conservation, continuously develop water-saving industries and technologies to improve the utilization efficiency of agricultural water resources and transform the utilization of water resources from an extensive way to an economical and intensive one. To improve the utilization efficiency of cultivated land resources, the existing permanent basic farmland is strictly protected, and high-standard farmland construction is conducted. River and road networks are taken as the backbone to promote the construction of shelter forest belt for farmland and improve food production.
The three types of ecological conservation area are soil conservation–water yield lag type, soil conservation lag type, and water yield lag type, which involve six, six, and one counties and districts, respectively. These counties and districts are distributed in the southwest mountainous area or the northeast plain of the research area. The comprehensive urbanization level in the ecological conservation area is relatively low, with lagged regulation service. Therefore, the soil conservation and water yield services in this area should be improved. Attention should be given to different policies in areas with different landforms. Song, Yichuan, Yiyang, Luoning, and Lushi Counties, the urban area of Sanmenxia, and Lingbao City are located in the upstream mountainous area with a high altitude. In these counties and districts, the government should build a comprehensive management with small watersheds as units and perform ecological conservation through transforming slope to ladder, economic fruit forest, soil and water conservation forest, and other measures. The government should actively implement strict ecological protection policies, such as returning farmland to forests and closing mountains for afforestation, and strictly abide by the ecological bottom line. They should also focus on the improvement of the quality of forests, coordinate the restoration of degraded forests, restore ecological forests in mountainous areas, and construct water conservation projects. Yuanyang County, Yanjin County, Changyuan City, Huaxian County, Fengqiu County, and Puyang County are located in the northeast plain area, with rich cultivated land resources. In these counties and districts, a planning idea that determines the city, land, people, and production by water should be proposed. We should reduce the use of pesticides and chemical fertilizer in farmland, reduce the pollution of water resources, and continuously improve the efficiency of agricultural water use. The local government should suit measures to local conditions, establish and perfect the characteristic industrial structure, improve the regional economic level and forest coverage, and orderly promote the urbanization and the construction of ecological projects.

5. Conclusions

In this study, the spatiotemporal evolution in the coupling coordination between ESs and urbanization in the 42 counties and districts along the Yellow River of Henan Province in 2000–2018 is quantified by means of InVEST, RUSLE, CASA, and coupling coordination models, and the coupling coordination relationship between ESs and comprehensive urbanization is identified. The conclusions drawn are as follows:
(1)
In 2000–2018, the total sum of NPP, soil conservation, and food production in the AYRHP increased, whereas water yield decreased. NPP and soil conservation are high in the southwest and low in the northeast. The food production is low in the southwest and high in the northeast. The water yield service shows different distribution trends in different time periods.
(2)
In 2000–2018, the comprehensive urbanization level in the AYRHP shows an upward trend, with a growth rate of 51.63%, showing a distribution trend of high in the middle, and low in the southwest and northeast.
(3)
The total coupling coordination between NPP, food production, and water yield and comprehensive urbanization is basic or moderate, whereas that between soil conservation and comprehensive urbanization is moderate maladjustment. In 2000–2018, the CCD between NPP/food production and comprehensive urbanization increased. The CCD between water yield and comprehensive urbanization fluctuated, and that between soil conservation and comprehensive urbanization decreased.
(4)
Although the degree of coupling coordination between some ESs and comprehensive urbanization is rising, the results of relative development show that the food production and soil conservation lag behind the level of urbanization in most districts and counties of the AYRHP. On the basis of the lead–lag relationship between different ESs and urbanization level, the AYRHP are divided into ecological reconstruction area, ecological and agricultural improvement area, and ecological conservation area.

Author Contributions

Conceptualization, M.L.; data curation, D.X.; funding acquisition, H.W.; methodology, D.X. and M.L.; software, D.X.; visualization, D.X.; writing—original draft, H.W. and D.X.; writing—review and editing, L.L., H.W. and J.H. All authors have read and agreed to the published version of the manuscript.

Funding

This research was funded by the National Key R&D Program of China (2021YFD1700900), Second Tibetan Plateau Scientific Expedition and Research Program (2019QZKK0608), the National Natural Science Foundation of China (41901259), Young backbone teachers program of Henan Province (2019GGJS048) and the special fund for top talents in Henan Agricultural University (30500425).

Data Availability Statement

Not applicable.

Conflicts of Interest

The authors declare no conflict of interest.

References

  1. Zhao, J.; Liu, Y.; Zhu, Y.; Qin, S.; Wang, Y.; Mao, C. Spatiotemporal differentiation and influencing factors of the coupling and coordinated development of new urbanization and ecological environment in the Yellow River Basin. Resour. Sci. 2020, 42, 159–171. (In Chinese) [Google Scholar] [CrossRef]
  2. Du, X.; Meng, Y.; Fang, C.; Li, C. Spatio-temporal characteristics of coupling coordination development between urbanization and Shandong Peninsula urban agglomeration. Acta Ecol. Sin. 2020, 40, 5546–5559. (In Chinese) [Google Scholar]
  3. Liang, L.; Wang, Z.; Fang, C.; Sun, Z. Spatiotemporal differentiation and coordinated development pattern of urbanization and the ecological environment of the Beijing-Tianjin-Hebei urban agglomeration. Acta Ecol. Sin. 2019, 39, 1212–1225. (In Chinese) [Google Scholar]
  4. Zhang, J.; Jiao, W.; Han, B. Characteristics of coordination changes and spatial coupling relationship between urbanization and ecosystem services. Acta Ecol. Sin. 2020, 40, 3271–3282. (In Chinese) [Google Scholar]
  5. Zhao, X.; Du, Y.; Li, H.; Wang, W. Spatio-temporal changes of the coupling relationship between urbanization and ecosystem services in the Middle Yellow River. J. Nat. Resour. 2021, 36, 131–147. (In Chinese) [Google Scholar] [CrossRef]
  6. Cui, M. The Relationship of Coupling Coordination between Urbanization and Ecological. Econ. Geogr. 2015, 35, 72–78. (In Chinese) [Google Scholar]
  7. Han, Y.; Zhang, Y. Coupling and Coordination Development Between Urbanization Eco-environment in Gansu Province. Res. Soil Water Conserv. 2021, 28, 256–263. (In Chinese) [Google Scholar]
  8. Liu, Y. Dynamic Econometric Analysis of the Relationship between Urbanization and Ecological Environment in Jiangxi Province. Resour. Sci. 2008, 30, 829–836. (In Chinese) [Google Scholar]
  9. Huang, J.; Fang, C. Analysis of coupling mechanism and rules between urbanization and eco-environment. Geogr. Res. 2003, 22, 211–220. (In Chinese) [Google Scholar]
  10. Fang, C.; Zhou, C.; Gu, C.; Chen, L.; Li, S. Theoretical analysis of interactive coupled effects between urbanization and eco-environment in mega-urban agglomerations. Acta Ecol. Sin. 2016, 71, 531–550. (In Chinese) [Google Scholar] [CrossRef]
  11. Lv, J.; Sun, Z.; Zhang, B. Discrimination of Key Factors for Coordinated Development of New Urbanization and Ecological Environment . Ecol. Econ. 2020, 36, 83–88. (In Chinese) [Google Scholar]
  12. Feng, E. Ecocity Construction Based on the Coupling Mechanism between urbanization and Eco-Environment. Ecol. Econ. 2006, 2, 53–56. (In Chinese) [Google Scholar]
  13. Liu, Y. Analysis on Comprehensive Response Degrees to Urbanization Level and Ecological Quality in Jiangxi Province. J. Nat. Resour. 2008, 23, 422–429. (In Chinese) [Google Scholar]
  14. Chen, X.; Zhou, H. Dynamic coordinated relationships and interactive effects between urban smart development and ecological efficiency: A case study of 276 cities at prefecture level and above in China. Geogr. Res. 2019, 38, 2653–2665. (In Chinese) [Google Scholar]
  15. Bi, G.; Yang, Q.; Liu, S. Coupling Coordination Development between Ecological Civilization Construction and Urbanization in China. Econ. Geogr. 2017, 37, 50–58. (In Chinese) [Google Scholar]
  16. Xie, H.; Zeng, W. Study on the coupling and coordinating development of urbanization and ecological environment in Wuhan city. Hubei Agr. Sci. 2021, 60, 86–91. (In Chinese) [Google Scholar]
  17. Xing, L.; Xue, M.; Hu, M. Dynamic simulation and assessment of the coupling coordination degree of the economy resources environment system: Case of Wuhan City in China. J. Environ. Manag. 2019, 230, 474–487. [Google Scholar] [CrossRef]
  18. Xiao, R.; Lin, M.; Fei, X.; Li, Y.; Zhang, Z.; Meng, Q. Exploring the interactive coercing relation-ship between urbanization and ecosystem service value in the Shanghai–Hangzhou Bay Metropolitan Region. J. Clean. Prod. 2020, 253, 119803. [Google Scholar] [CrossRef]
  19. Li, B.; Chen, D.; Wu, S.; Zhou, S.; Wang, T.; Chen, H. Spatio-temporal assessment of urbanization impacts on ecosystem services: Case study of Nanjing City, China. Ecol. Indic. 2016, 71, 416–427. [Google Scholar] [CrossRef]
  20. Daily, G.C. Nature’s Services Societal Dependence on Natural Ecosystems; Island Press: Washington, DC, USA, 1997. [Google Scholar]
  21. Chen, T.; Peng, L.; Wang, Q.; Liu, S. Measuring the Coordinated Development of Ecological and Economic Systems in Hengduan Mountain Area. Sustainability 2017, 9, 1270. [Google Scholar] [CrossRef] [Green Version]
  22. Millennium Ecosystem Assessment (MA). Ecosystem and Human Wellbeing: Current State and Trends; Island Press: Washington, DC, USA, 2005. [Google Scholar]
  23. Dai, X.; Johnson, B.A.; Luo, P.; Yang, K.; Dong, L.; Wang, Q.; Yao, Y. Estimation of Urban Ecosystem Services Value: A Case Study of Chengdu, Southwestern China. Remote Sens. 2021, 13, 207. [Google Scholar] [CrossRef]
  24. Huang, M.; Yang, F.; Zheng, S. Impact of Urbanization Process on Ecosystem Service Value in China. Res. Soil Water Conserv. 2019, 26, 352–359. (In Chinese) [Google Scholar]
  25. Peng, J.; Tian, L.; Liu, Y.; Zhao, M.; Wu, J. Ecosystem services response to urbanization in metropolitan areas: Thresholds identification. Sci. Total Environ. 2017, 607, 706–714. [Google Scholar] [CrossRef] [PubMed]
  26. Zhang, Z.; Peng, J.; Xu, Z.; Wang, X.; Meersmans, J. Ecosystem services supply and demand response to urbanization: A case study of the Pearl River Delta, China. Ecosyst. Serv. 2021, 49, 101274. (In Chinese) [Google Scholar] [CrossRef]
  27. Fu, M.; Xiao, N.; Zhao, Z.; Gao, X.; Li, J.; Center, B. Effects of Urbanization on Ecosystem Services in Beijing. Res. Soil Water Conserv. 2016, 23, 235–239. [Google Scholar]
  28. Ji, Z.; Xu, Y.; Wei, H. Identifying Dynamic Changes in Ecosystem Services Supply and Demand for Urban Sustainability: Insights from a Rapidly Urbanizing City in Central China. Sustainability 2020, 12, 3428. [Google Scholar] [CrossRef] [Green Version]
  29. Xing, L.; Zhu, Y.; Wang, J. Spatial spillover effects of urbanization on ecosystem services value in Chinese cities. Ecol. Indic. 2021, 121, 107028. [Google Scholar] [CrossRef]
  30. Chen, W.; Chi, G. Urbanization and ecosystem services: The multi-scale spatial spillover effects and spatial variations. Land Use Policy 2022, 114, 105964. [Google Scholar] [CrossRef]
  31. Shi, L.; Halik, Ü.; Mamat, Z.; Aishan, T.; Abliz, A.; Welp, M. Spatiotemporal investigation of the interactive coercing relationship between urbanization and ecosystem services in arid northwestern China. Land Degrad. Dev. 2021, 32, 4105–4120. [Google Scholar] [CrossRef]
  32. Ouyang, X.; Tang, L.; Wei, X.; Li, Y. Spatial interaction between urbanization and ecosystem services in Chinese urban agglomerations. Land Use Policy 2021, 109, 105587. [Google Scholar] [CrossRef]
  33. Degefu, M.A.; Argaw, M.; Feyisa, G.L.; Degefa, S. Dynamics of urban landscape nexus spatial dependence of ecosystem services in rapid agglomerate cities of Ethiopia. Sci. Total Environ. 2021, 798, 149192. [Google Scholar] [CrossRef] [PubMed]
  34. Yao, X.; Zeng, J.; Li, W. Spatial correlation characteristics of urbanization and land ecosystem service value in Wuhan Urban Agglomeration. Trans. Chin. Soc. Agric. Eng. 2015, 31, 249–256. (In Chinese) [Google Scholar]
  35. Chen, W.; Liu, Z.; Li, J.; Ran, D.; Zeng, J. Mapping the spatial relationship between ecosystem services and urbanization in the middle reaches of the Yangtze River Urban Agglomerations. Acta Ecol. Sin. 2020, 40, 5137–5150. (In Chinese) [Google Scholar]
  36. Peng, K.; Jiang, W.; Ling, Z.; Hou, P.; Deng, Y. Evaluating the potential impacts of land use changes on ecosystem service value under multiple scenarios in support of SDG reporting: A case study of the Wuhan urban agglomeration. J. Clean. Prod. 2021, 307, 127321. [Google Scholar] [CrossRef]
  37. Wang, Y.; Li, X.; Zhang, Q.; Li, J.; Zhou, X. Projections of future land use changes: Multiple scenarios-based impacts analysis on ecosystem services for Wuhan city, China. Ecol. Indic. 2018, 94, 430–445. [Google Scholar] [CrossRef]
  38. Wang, R.; Bai, Y.; Alatalo, J.M.; Yang, Z.; Yang, Z.; Yang, W.; Guo, G. Impacts of rapid urbanization on ecosystem services under different scenarios–A case study in Dianchi Lake Basin, China. Ecol. Indic. 2021, 130, 108102. [Google Scholar] [CrossRef]
  39. Chen, D.; Jiang, P.; Li, M. Assessing potential ecosystem service dynamics driven by urbanization in the Yangtze River Economic Belt, China. J. Environ. Manag. 2021, 292, 112734. [Google Scholar] [CrossRef]
  40. Narducci, J.; Quintas-Soriano, C.; Castro, A.; Som-Castellano, R.; Brandt, J.S. Implications of urban growth and farmland loss for ecosystem services in the western United States. Land Use Policy 2019, 86, 1–11. [Google Scholar] [CrossRef]
  41. Zhang, K.; Wen, Z. Review and challenges of policies of environmental protection and sustainable development in China. J. Environ. Manag. 2008, 88, 1249–1261. [Google Scholar] [CrossRef]
  42. Li, M.; Li, Z.; Dong, L. Economic- Environment Harmony Degree evolvement and its Regional Difference. Econ. Geogr. 2009, 29, 1634–1639. (In Chinese) [Google Scholar]
  43. Yao, S.; Zhang, P.; Yu, C.; Li, J.; Wang, C. The Theory and Practice of New Urbanization in China. Sci. Geogr. Sin. 2014, 34, 641–647. (In Chinese) [Google Scholar]
  44. Qiao, H. Quantitative coupling between urbanization of Lanzhou city and its ecosystem service value. Bull. Soil Water Conserv. 2017, 37, 333–337. [Google Scholar]
  45. Zhang, Y.; Lu, X.; Liu, B.; Wu, D.; Fu, G.; Zhao, Y.; Sun, P. Spatial relationships between ecosystem services and socioecological drivers across a large-scale region: A case study in the Yellow River Basin. Sci. Total Environ. 2021, 766, 142480. [Google Scholar] [CrossRef] [PubMed]
  46. Fang, L.; Wang, L.; Chen, W.; Sun, J.; Cao, Q.; Wang, S.; Wang, L. Identifying the impacts of natural and human factors on ecosystem service in the Yangtze and Yellow River Basins. J. Clean. Prod. 2021, 314, 127995. [Google Scholar] [CrossRef]
  47. Liu, B.; Pan, L.; Qi, Y.; Guan, X.; Li, J. Land Use and Land Cover Change in the Yellow River Basin from 1980 to 2015 and Its Impact on the Ecosystem Services. Land 2021, 10, 1080. [Google Scholar] [CrossRef]
  48. Geng, W.; Li, Y.; Zhang, P.; Yang, D.; Jing, W.; Rong, T. Analyzing spatio-temporal changes and trade-offs/synergies among ecosystem services in the Yellow River Basin, China. Ecol. Indic. 2022, 138, 108825. [Google Scholar] [CrossRef]
  49. Wu, C.; Ma, G.; Yang, W.; Zhou, Y.; Peng, F.; Wang, J.; Yu, F. Assessment of ecosystem service value and its differences in the Yellow River Basin and Yangtze River Basin. Sustainability 2021, 13, 3822. [Google Scholar] [CrossRef]
  50. Guo, A.; Zhang, Y.; Zhong, F.; Jiang, D. Spatiotemporal Patterns of Ecosystem Service Value Changes and Their Coordination with Economic Development: A Case Study of the Yellow River Basin, China. Int. J. Environ. Res. Public Health 2020, 17, 8474. [Google Scholar] [CrossRef]
  51. Feng, Q.; Zhao, W.; Hu, X.; Liu, Y.; Daryanto, S.; Cherubini, F. Trading-off ecosystem services for better ecological restoration: A case study in the Loess Plateau of China. J. Clean. Prod. 2020, 257, 120469. [Google Scholar] [CrossRef]
  52. Yang, M.; Gao, X.; Zhao, X.; Wu, P. Scale effect and spatially explicit drivers of interactions between ecosystem services—A case study from the Loess Plateau. Sci. Total Environ. 2021, 785, 147389. [Google Scholar] [CrossRef]
  53. Wei, H.; Fan, W.; Ding, Z.; Weng, B.; Xing, K.; Wang, X.; Lu, N.; Ulgiati, S.; Dong, X. Ecosystem Services and Ecological Restoration in the Northern Shaanxi Loess Plateau, China, in Relation to Climate Fluctuation and Investments in Natural Capital. Sustainability 2017, 9, 199. [Google Scholar] [CrossRef] [Green Version]
  54. Potter, C.; Randerson, J.T.; Field, C.B.; Matson, P.A.; Vitousek, P.M.; Mooney, H.A.; Klooster, S.A. Terrestrial ecosystem production: A process model based on global satellite and surface data. Glob. Biogeochem. Cycles 1993, 7, 811–841. [Google Scholar] [CrossRef]
  55. Zhu, W.Q.; Pan, Y.Z.; He, H.; Yu, D.Y.; Hu, H.B. Simulation of maximum light use efficiency for some typical vegetation types in China. Chin. Sci. Bull. 2006, 51, 457–463. [Google Scholar] [CrossRef]
  56. Tallis, H.; Ricketts, T.; Guerry, A.; Wood, S.; Sharp, R.; Nelson, E.; Ennaanay, D.; Wolny, S.; Olwero, N.; Vigerstol, K.; et al. InVEST2.5.3 User’s Guide, the Natural Capital Project; Stanford University: Stanford, CA, USA, 2013. [Google Scholar]
  57. Wischmeier, W.H.; Johnson, C.B.; Cross, B.V. Soil erodibility nomograph for farmland and construction sites. J. Soil Water Conserv. 1971, 26, 189–193. [Google Scholar]
  58. Lufafa, A.; Tenywa, M.M.; Isabirye, M.; Majaliwa, M.J.G.; Woomer, P.L. Prediction of soil erosion in a Lake Victoria basin catchment using a GIS-based Universal Soil Loss model. Agric. Syst. 2003, 76, 883–894. [Google Scholar] [CrossRef]
  59. Liu, L.; Liu, C.; Wang, C.; Li, P. Supply and demand matching of ecosystem services in loess hilly region: A case study of Lanzhou. Acta Geogr. Sin. 2019, 74, 1921–1937. (In Chinese) [Google Scholar]
  60. Li, W.; Wang, Y.; Xie, S.; Cheng, X. Coupling coordination analysis and spatiotemporal heterogeneity between urbanization and ecosystem health in Chongqing municipality, China. Sci. Total Environ. 2021, 791, 148311. [Google Scholar] [CrossRef]
  61. Chen, J.; Li, Z.; Dong, Y.; Song, M.; Shahbaz, M.; Xie, Q. Coupling coordination between carbon emissions and the eco-environment in China. J. Clean. Prod. 2020, 276, 123848. [Google Scholar] [CrossRef]
  62. Fan, W.; Wang, H.; Liu, Y.; Liu, H. Spatio-temporal variation of the coupling relationship between urbanization and air quality: A case study of Shandong Province. J. Clean. Prod. 2020, 272, 122812. [Google Scholar] [CrossRef]
  63. Yang, C.; Zeng, W.; Yang, X. Coupling coordination evaluation and sustainable development pattern of geo-ecological environment and urbanization in Chongqing municipality, China. Sustain. Cities Soc. 2020, 61, 102271. [Google Scholar] [CrossRef]
  64. Yuan, Y.; Wu, S.; Yu, Y.; Tong, G.; Mo, L.; Yan, D.; Li, F. Spatiotemporal interaction between ecosystem services and urbanization: Case study of Nanjing City, China. Ecol. Indic. 2018, 95, 917–929. [Google Scholar] [CrossRef]
  65. Sun, B.; Xu, W.; Xue, J. Prediction of Coupling and Coordination between Urbanization and Eco-environment of Urban Agglomeration in Yellow River Basin, China. J. Earth Sci. Environ. 2021, 43, 87–896. (In Chinese) [Google Scholar]
Figure 1. Location of the research area.
Remotesensing 14 02277 g001
Figure 2. The framework of coupling ecosystem services and urbanization.
Remotesensing 14 02277 g002
Figure 3. Spatiotemporal distribution patterns of NPP in the AYRHP on grid and county scales.
Remotesensing 14 02277 g003
Figure 4. Spatiotemporal distribution patterns of soil conservation amount in the AYRHP on grid and county scales.
Remotesensing 14 02277 g004
Figure 5. Spatiotemporal distribution patterns of water yield in the AYRHP on raster and county scales.
Remotesensing 14 02277 g005
Figure 6. Spatiotemporal distribution patterns of food production in the AYRHP on raster and county scales.
Remotesensing 14 02277 g006
Figure 7. Spatiotemporal distribution patterns of population, economy, and land urbanization in the AYRHP on the county scale.
Remotesensing 14 02277 g007
Figure 8. Spatiotemporal distribution patterns of comprehensive urbanization in the AYRHP on the county scale.
Remotesensing 14 02277 g008
Figure 9. Temporal change in the coupling coordination between ESs and comprehensive urbanization in the AYRHP.
Remotesensing 14 02277 g009
Figure 10. Spatiotemporal change in the coupling coordination between ESs and comprehensive urbanization in the AYRHP.
Remotesensing 14 02277 g010
Figure 11. Spatiotemporal change in the relative development of ESs and comprehensive urbanization in the AYRHP on the county scale.
Remotesensing 14 02277 g011
Figure 12. Ecological management zoning at the county level in the AYRHP.
Remotesensing 14 02277 g012
Table 1. Data source and usage.
Data NamesData LayoutData SourcesData Usage
Digital elevation model (DEM)Raster data with a spatial resolution of 100 mGeospatial Data Cloud (http://www.gscloud.cn/search, acquired on 5 January 2021)DEM of no depression in the research area
Land use remote sensing monitoring dataRaster data with a spatial resolution of 30 mResource and Environment Science and Data Center (http://www.resdc.cn/, acquired on 5 January 2021)Land urbanization rates of various counties and districts obtained; simulated the basic parameter input data of NPP, water yield, and soil conservation
MOD13Q1Raster data with a spatial resolution of 250 mNASA official website (https://www.nasa.gov/, acquired on 10 February 2021)Normalized difference vegetation index (NDVI) data obtained
China subset and global land cover dataRaster data with a spatial resolution of 100 mBig Data Center of Sciences in Cold and Arid Regions (http://bdc.casnw.net/yyzc/sj/250299.shtml, acquired on 10 October 2020)Vegetation type in the research area obtained
Monthly rainfall dataList dataChina Meteorological Data Network (http://data.cma.cn/, acquired on 10 October 2020)Raster graphics of rainfall erosion factors and annual average rainfall obtained
Soil texture, content of soil organic matter, and soil depthRaster data with a spatial resolution of 1000 mBig Data Center of Sciences in Cold and Arid Regions (http://bdc.casnw.net/yyzc/sj/250299.shtml, acquired on 10 October 2020)Simulated the basic parameter input data of water yield and soil conservation model
Monthly air temperature, monthly rainfall, monthly radiation, and daily minimum/maximum air temperatureList dataChina Meteorological Data Network (http://data.cma.cn/, acquired on 10 October 2020)Monthly average temperature, radiation raster data, and annual potential evaporation data obtained
Annual food outputStatistical dataHenan Statistical YearbookFood output in the basin obtained
Urbanization rate of permanent residentsStatistical dataChina County-level Statistical YearbookUrbanization rate of the population obtained
GDP of primary, secondary, and tertiary industriesStatistical dataHenan Statistical Yearbook, China County-level Statistical Yearbook, and Statistical Bulletin of National Economic and Social DevelopmentProportion of non-agricultural industries in GDP
Table 2. Criteria for selecting ESs in the AYRHP.
Ecosystem ServicesSelection Reason
Provision services
Food productionFood production is directly related to the normal life and wellbeing of local residents. The research area is the main food production area of China. Agriculture is an important industry in the research area.
Regulating services
NPPNPP directly reflects the production capacity of naturalized plant communities under natural environmental conditions. As an important factor of judging the carbon sources/sinks of ecosystem and regulating the ecological process, it reflects the carbon sequestration status of the ecosystem.
Water yieldWater is the main factor limiting the construction of ecological environment in the research area, and it maintains many important functions of the ecosystem. The AYRHP are located in the semi-arid area; thus, the demand for water is relatively strong.
Soil conservationThe west of the study area is dominated by mountains and hills, whereas the east is dominated by plains, with large altitude difference and serious soil erosion. In addition, the main channel of the Yellow River swings seriously, which will erode the plain cultivated land on both sides of the downstream of the river, thereby affecting food security.
Table 3. Evaluation system for comprehensive urbanization level.
ObjectivesDimensionIndexWeightReferences
Comprehensive urbanizationPopulation urbanizationUrbanization rate of permanent residents (%)1/3[60,61]
Economy urbanizationProportion of non-agricultural products in total GDP (%)1/3[60,62]
Land urbanizationPercentage of urban land in total land area (%)1/3[60,63,64]
Table 4. Classification criteria of relative development types of ESs and comprehensive urbanization.
TypeRelative Development DegreeClassification
Relative development types0 < β = G i / F ( x ) < 0.9Lag type of ES
0.9 < β = G i / F ( x ) < 1.1Urbanization–ES synchronous development type
β = G i / F ( x ) > 1.1Lag type of comprehensive urbanization
Publisher’s Note: MDPI stays neutral with regard to jurisdictional claims in published maps and institutional affiliations.

