Article

Spectral Reflectance of Wheat Residue during Decomposition and Remotely Sensed Estimates of Residue Cover

by
Craig S. T. Daughtry
1,*,
Guy Serbin
2,
James B. Reeves III
3,
Paul C. Doraiswamy
1 and
Earle Raymond Hunt, Jr.
1
1
USDA-ARS Hydrology and Remote Sensing Laboratory, 10300 Baltimore Avenue, Beltsville, MD 20705, USA
2
ASRC Management Services, USDA-FAS Office of Global Analysis, Washington, DC, 20250, USA
3
USDA-ARS Environmental Management and Byproduct Utilization Laboratory, Beltsville, MD 20705, USA
*
Author to whom correspondence should be addressed.
Remote Sens. 2010, 2(2), 416-431; https://0-doi-org.brum.beds.ac.uk/10.3390/rs2020416
Submission received: 23 December 2009 / Revised: 20 January 2010 / Accepted: 21 January 2010 / Published: 27 January 2010

Abstract

:
Remotely sensed estimates of crop residue cover (fR) are required to assess the extent of conservation tillage over large areas; the impact of decay processes on estimates of residue cover is unknown. Changes in wheat straw composition and spectral reflectance were measured during the decay process and their impact on estimates of fR were assessed. Proportions of cellulose and hemicellulose declined, while lignin increased. Spectral features associated with cellulose diminished during decomposition. Narrow-band spectral residue indices robustly estimated fR, while broad-band indices were inconsistent. Advanced multi-spectral sensors or hyperspectral sensors are required to assess fR reliably over diverse agricultural landscapes.

1. Introduction

Crop residues or plant litter is the portion of a crop left in the field after harvest. Management of crop residues is an integral part of most conservation tillage systems. Crop residues on the soil surface provide a protective barrier against water and wind erosion and reduce the amount of soil, nutrients, and pesticides that reaches streams and rivers [1,2]. Crop residues also contribute to soil organic matter which improves soil quality and sequesters carbon. Long-term use of conservation tillage practices that leave crop residues undisturbed following harvest can lead to increased soil organic matter, improved soil structure, and increased aggregation compared with intensively tilled soils [3]. The overall result is less soil erosion and improved soil and water quality. However, soil tillage and crop residue harvesting for feed, fiber, or bio-energy are management practices that reduce crop residue mass and cover.
The erosion protection afforded by crop residues on the soil surface diminishes as they decompose and lose both mass and cover. The decay processes in natural ecosystems have been described as a continuum beginning with fresh plant litter and leading to formation of refractory soil organic matter [4]. The rates of mass loss have been related to both litter quality (litter type and chemistry), environmental conditions (temperature, moisture, and soil type), and biotic activity (microbial and faunal) [5]. In many conservation tillage systems, the decay continuum, described for natural ecosystems [4], is also evident as fresh crop residues are added at each harvest on top of partially decomposed crop residues from previous crops. In contrast, most of the crop residue for intensively-tilled systems is incorporated into the soil and decomposes rapidly. Managing crop residue and predicting its decomposition over time is critical for controlling water and wind erosion and sequestering carbon in soils. Methods for describing the rates of crop residue decomposition often normalize weather data to optimal temperature and moisture conditions and then accumulate the temperature and moisture factors, e.g., [5,6,7,8].
The Conservation Technology Information Center (CTIC) has defined three categories of tillage and planting systems based on crop residue cover after planting: intensive tillage has <15% residue cover; reduced tillage has 15–30% residue cover, and conservation tillage has >30% residue cover [9]. Quantification of crop residue cover is required to evaluate the effectiveness and extent of conservation tillage practices, as well as the extent of bio-fuel harvesting. The standard technique for measuring mean crop residue cover in fields is the line-point transect method [10,11]. Regional assessments of conservation tillage practices based on annual roadside surveys of crop residue levels after planting are compiled for selected counties [9]. However, these surveys are subjective and the techniques vary from county to county [12,13]. No program exists for objectively monitoring crop residue cover and tillage intensity over broad areas.
Traditional remote sensing approaches for identifying crops and estimating crop yields [14,15], have had mixed success because crop residues and soils are spectrally similar and often differ only in amplitude in the visible and near infrared wavelengths [12,13,16,17,18]. Nevertheless numerous crop residue/soil tillage indices have been reported that use various combinations of the Landsat Thematic Mapper (TM) bands [16,18,19,20,21,22]. These indices are based on relative differences in broad band reflectance for soils and crop residues.
An alternative approach is based on detecting the absorption features in the 1,500–2,500 nm wavelength region that are overtones and combinations of the fundamental molecular vibrations occurring in the 2.5–25 μm region [23]. In plants, three relatively narrow absorption features, centered near 1,730, 2,100, and 2,300 nm, are primarily associated with nitrogen (in proteins), cellulose, and lignin concentrations [24,25,26]. These features are not readily discernible in the spectra of fresh vegetation [26] or wet crop residues [27], but are evident in reflectance spectra of dry plant litter [24] and crop residues [17,28]. Reflectance spectra of dry soils also lack these absorption features, but may have additional absorption features associated with minerals [17,18,27,28].
Cellulose, lignin, and other structural polysaccharides (e.g., hemicellulose) are intertwined in plant cell walls and their spectra have overlapping absorptions in both the 2,100 nm and 2,300 nm regions [26]. Continuum removal or baseline normalization is a spectroscopic analysis technique to estimate of the reflectance spectrum without the absorption due to the compound of interest [25,26]. The band center is the wavelength of the minimum value in the continuum-removed reflectance spectrum and its position and depth shifts as the relative proportions of structural polysaccharides change [26]. The dynamic range of the continuum-removed reflectance spectra for dry crop residues on diverse soils was greater for the absorption feature near 2,100 nm than for the 2,300 nm feature [27]. The cellulose absorption index (CAI) approximated the band center depth of the 2,100 nm feature using only three narrow spectral bands—two on the shoulders and one near the center [17]. Both continuum-removed reflectance variables and CAI provided better discrimination of crop residues than reflectance factors because crop residues can be darker or brighter than the soils [27]. Crop residue cover was linearly related to CAI using ground-based [17,29], aircraft [28,30], and satellite [31] hyperspectral sensors. These relatively narrow spectral features are not detected by broad band multispectral sensors, e.g., Landsat TM.
As the chemical and physical properties of crop residues change during decomposition, the strength of their absorption features which could change their reflectance spectra and affect the ability of remote sensing methods to assess crop residue cover. Our objectives were to measure and model the changes in wheat straw fiber composition and spectral reflectance during decomposition and to assess the impact of these changes on remotely sensed estimates of residue cover.

2. Materials and Methods

2.1. Experiment Design

Winter wheat (Triticum aestivum L.) was grown in a production field at the USDA-ARS Beltsville Agricultural Research Center near Beltsville, Maryland. After the wheat was harvested for grain on 22 July 2006, samples of the straw were collected.
Approximately 500 g of straw was placed in 0.7 × 0.9 m black fiberglass mesh (1.1 × 1.3 mm openings) bags. The bags plus straw were sealed, dried at 50 °C to constant weight, and weighed. On 1 August 2006, the bags were staked securely on the surface of a Galestown loamy sand (siliceous, mesic Psammentic Hapludult) in a field previously planted to wheat and double-cropped with soybeans (Glycine max Merr.). The bags were arranged in six clusters in a randomized complete block design (2 moisture levels and 3 blocks). Three clusters of bags (wet treatment) received 4 mm of supplemental irrigation twice daily from 3 August to 12 October 2006 and from 16 July to 15 October 2007 while the remaining clusters of bags (dry treatment) received only normal precipitation. Daily minimum and maximum air temperatures and precipitation were recorded at a weather station within 0.3 km.
After 0, 57, 136, 212, 325, 419, and 522 days, one bag was removed from each cluster (n = 6), air-dried in a greenhouse, and stored. At the completion of the experiment on day 673, the remaining bags (n = 18) were removed from the field. All bags were dried at 50 °C to constant weight and weighed.

2.2. Reflectance Measurements

Samples of dried wheat straw from each bag were placed to a 2-cm depth in 45-cm square trays that were painted flat black. Duplicate trays were prepared. Reflectance spectra were acquired with a spectroradiometer (FieldSpec Pro, Analytical Spectral Devices, Boulder, CO, USA) over the 350 to 2,500 nm wavelength region at 1-nm intervals. The samples were illuminated by six 100-W quartz-halogen lamps mounted on the arms of a camera copy stand at 45 cm over the sample at a 45° illumination zenith angle. A current-regulated DC power supply stabilized the output of the lamps. The 18° fore-optic of the spectroradiometer were aligned and positioned 60 cm from the sample surface at a 0° view zenith angle. The diameter of the field of view of the spectroradiometer was 19 cm. The illumination and view angles were chosen to minimize shadowing and to emphasize the fundamental spectral properties of the samples. Four spectra of 50 scans each were acquired from each sample by rotating the sample tray 90° after each spectrum. A 61-cm square Spectralon (Labsphere, Inc, North Sutton, NH, USA) reference panel was placed in the field of view and illuminated and viewed in the same manner as the samples. Reflectance factors were calculated and corrected for the reflectance of the Spectralon reference panel [32].
Reflectance spectra were also acquired of soils with minor modifications. The 8° fore optic was used which resulted in an 8.5 cm diameter field of view. The agricultural top soils were Loring (fine-silty, mixed, active, thermic Oxyaquic Fragiudalfs) from Como, Mississippi; Sverdrup (sandy mixed, frigid, Typic Hapludolls) from Morris, Minnesota, and Gaston (fine, mixed, active, thermic Humic Hapludults) from Salisbury, North Carolina). Each soil was oven-dried at 105 °C, crushed to pass a 2-mm screen, and placed to a depth of 1 cm in 20-cm diameter sample trays.
The reflectance of mixed scenes R(M,λ) with various proportions of crops residues and soils was simulated using linear combinations of the reflectance factors for crop residues and soils [17,28]:
R(M,λ) = R(S,λ) (1 − fR) + R(R,λ) (fR)
where R(S,λ) and R(R,λ) are reflectance factors in waveband λ for soils and crop residues, respectively, fR is the fraction residue cover that ranged from 0 (100% soil) to 1.0 (100% crop residue), and (1 − fR) is the soil fraction.
From the literature, four broad-band indices were found to be related to residue cover:
NDTI = (TM5 − TM7)/(TM5 + TM7)
where NDTI is the Normalized Difference Tillage Index [22];
NDI5 = (TM4 − TM5)/(TM4 + TM5)
NDI7 = (TM4 − TM7)/(TM4 + TM7)
where NDI is the Normalized Difference Index [20]; and
NDSVI = (TM5 − TM3)/(TM5 + TM3)]
where NDSVI is the Normalized Difference Senescent Vegetation Index [21]. In addition, the widely used Normalized Difference Vegetation Index (NDVI) was included:
NDVI = (TM4 − TM3)/(TM4 + TM3),
where TM3, TM4, TM5, and TM7 correspond to reflectance in the Landsat Thematic Mapper (TM) band 3 (630–690 nm), band 4 (760–900 nm), band 5 (1,550–1,750 nm), and band 7 (2,080–2,350 nm), respectively.
Three narrow band spectral indices for detecting crop residue cover based on cellulose and lignin absorption features were also evaluated. The Cellulose Absorption Index (CAI) [17] was calculated as:
CAI = 100 (0.5(R2.0 + R2.2) – R2.1
where R2.0, R2.1, and R2.2 refer to reflectance values in 10-nm bands centered at 2,030 nm, 2,100 nm, and 2,210 nm, respectively. Two indices that used the relatively narrow ASTER [33] shortwave infrared bands are the Lignin Cellulose Absorption (LCA) [29] index and the Shortwave Infrared Normalized Difference Residue Index (SINDRI) [30] are defined as:
LCA = 100 [(A6 − A5) + (A6 − A8)]
SINDRI = 100 (A6 − A7)/(A6 + A7)
where A5, A6, A7, and A8 correspond the ASTER reflectance band 5 (2,145−2,185 nm), band 6 (2,185−2,225 nm), band 7 (2,235−2,285 nm), and band 8 (2,295−2,365 nm), respectively.

2.3. Fiber Analyses

Samples of wheat straw from each bag were ground to pass a 1-mm screen. Neutral detergent fiber (NDF), acid detergent fiber (ADF), hemicellulose, cellulose, and lignin were determined by Goering and Van Soest [34] methods as modified by Ankom Technology [35]. Briefly, 0.25 g of ground wheat straw was placed in a filter bag, heat sealed, and extracted successively with neutral detergent solution, acid detergent solution, and 72% H2SO4. Filter bags with samples were rinsed with hot water and dry weights were recorded after each extraction. Fiber composition was corrected for ash content of the wheat straw. All chemical assay results were the average of triplicate determinations. NDF is the material remaining after digestion of the wheat straw in a neutral detergent solution and contains predominately hemicellulose, cellulose, and lignin. ADF is the material remaining after extraction of the NDF with an acidic detergent solution and contains predominately cellulose and lignin. Lignin fiber is material remaining after digesting the ADF in 72% H2SO4 and contains lignin and ash. Ash is the material remaining after heating the lignin fiber for 3 hours at 525° and correcting for the blank bag ash content. Thus, hemicellulose = NDF – ADF; cellulose = ADF – lignin fiber; and lignin = lignin fiber – ash.

2.4. Data Analysis

2.4.1. Decomposition Days

The decomposition day (DD) concept was used to normalize time assuming that the most important environmental factors for decomposition are temperature and moisture [6,7,8]. Each coefficient was constrained from 0 to 1, with 1 indicating optimum conditions for microbial activity (maximum decomposition) and 0 indicating no microbial activity (no decomposition). The lower of the two coefficients was used to represent the actual decomposition for a given day relative to a day with optimum conditions.
The moisture coefficient (MC) was controlled by precipitation (or irrigation) and declined until the next event. The coefficient decreased to 50% of the previous day’s value giving the equivalent of about 2.0 optimum moisture days over the next 7 days for each precipitation event that exceeded 4 mm [7]. A precipitation threshold of 4 mm was adequate to wet dense layers of crop residues on the soil surface [36]. When precipitation ≥4 mm, MC = 1. When precipitation was <4 mm, the crop residues were partially wetted and MC = precipitation/4. Another precipitation or irrigation event would reset MC based on precipitation amount. When the bags of straw were irrigated, the moisture coefficient was set to 1. The temperature coefficient (TC) was calculated as [8]:
TC = [2(T + A)2 (Topt + A)2 – (T + A)4] / (Topt + A)4
where T is the daily average air temperature; Topt = 32 °C; and A = 0. The equation was constrained to remain at 0 when T < A. The daily fractional decomposition day was set to the minimum of the moisture or temperature coefficient for that day and accumulated as decomposition days (DD) for each treatment.

2.4.2. Statistical Analyses

A first-order exponential decay model was fitted to straw mass and DD using the nonlinear regression procedure in SAS [34]. Decomposition rates were determined using Mt/M0 = exp−k(DD), where Mt is the biomass at time t, M0 is the initial biomass, k is the decomposition coefficient (g g−1 DD−1), and DD is the decomposition days [8]. Changes in wheat straw composition were modeled as linear functions of DD. The wheat straw composition data were empirically connected with the spectral reflectance data using Pearson correlation for single wavelengths and stepwise regression for multiple wavelengths. In addition, major absorption features in vegetation reflectance spectra were delineated (i.e., 408–518 nm, 588–750 nm, 1,116–1,284 nm, 1,634–1,786 nm, 2,006–2,196 nm, and 2,222–2,378 nm) and continuum removal techniques were employed [24,25,26]. For each major absorption feature, band depth was normalized to the wavelength at the center of the absorption feature (BNC) or to the area of the absorption feature (BNA).

3. Results and Discussion

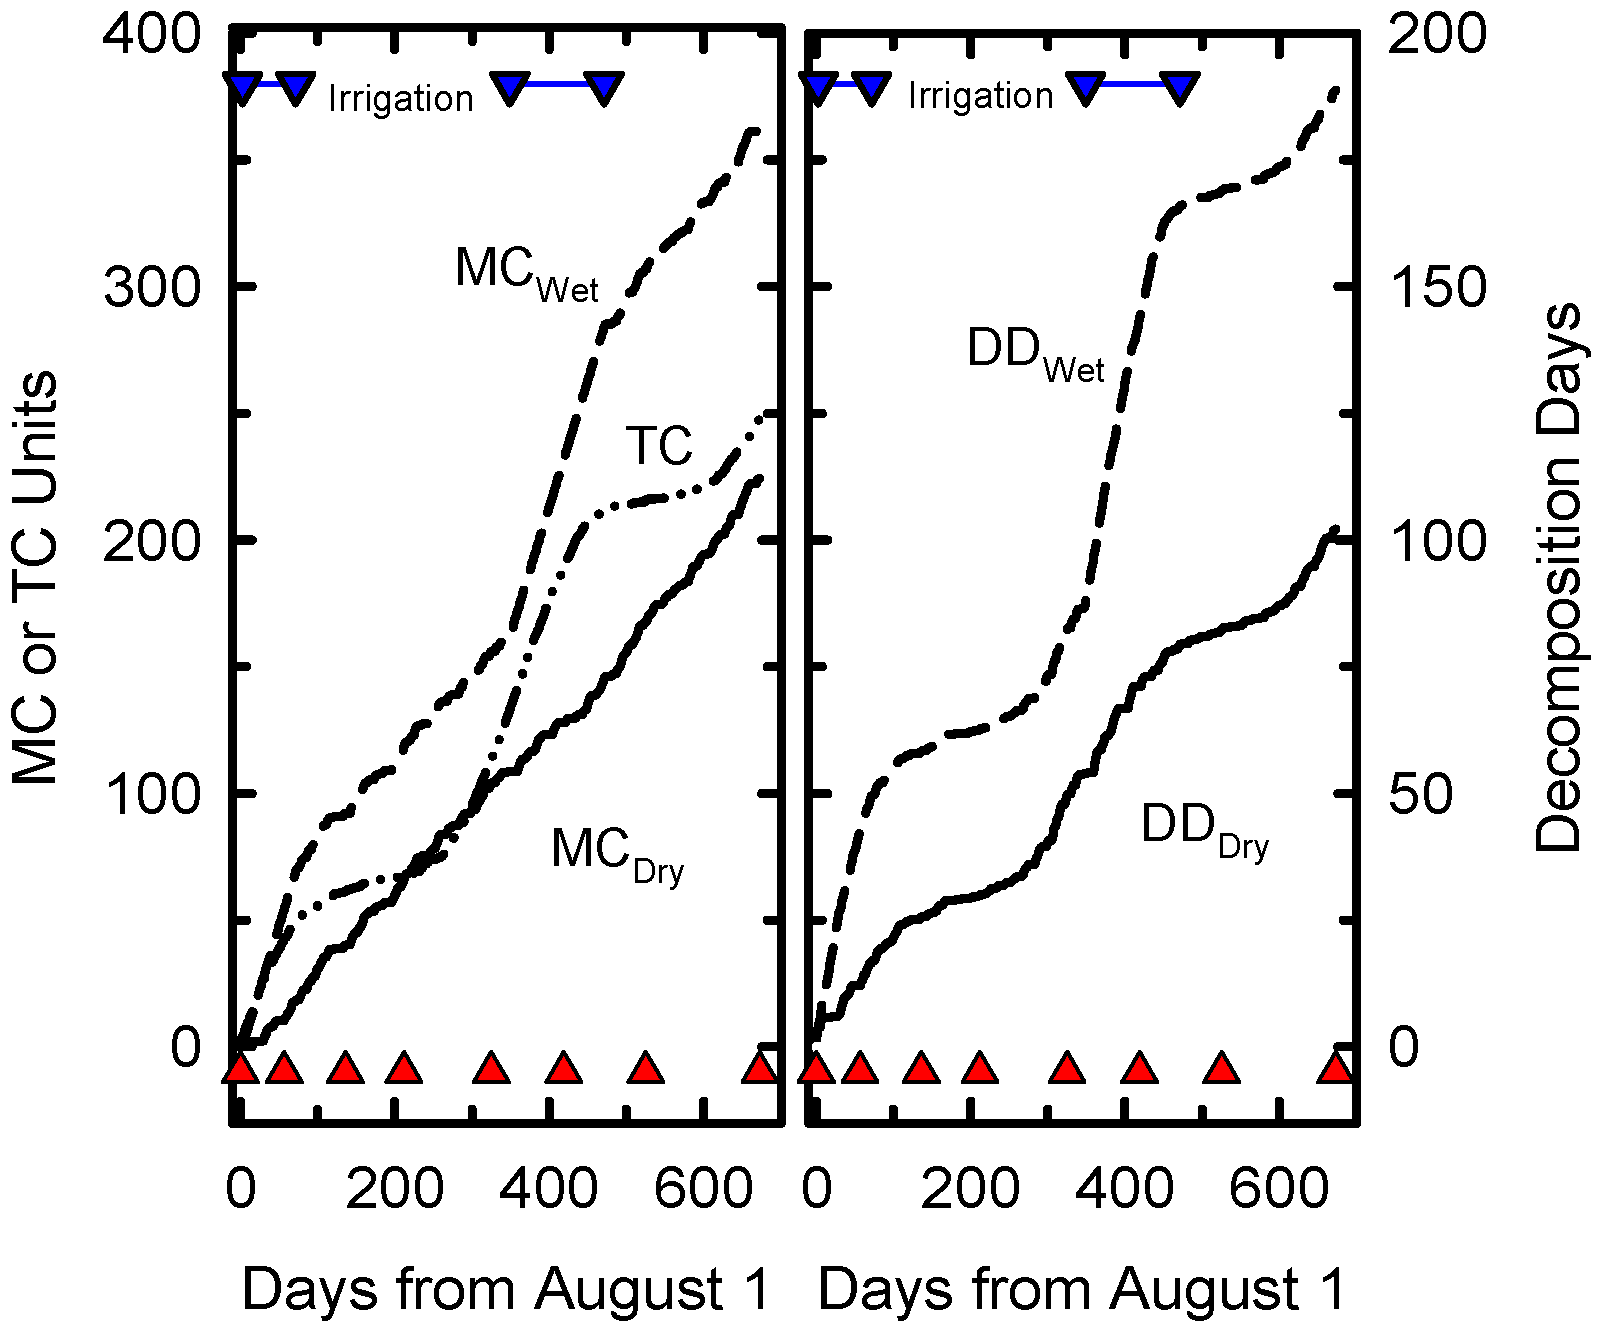
The accumulation of decomposition days at Beltsville was limited by moisture at some times of the year and temperature at others (Figure 1). Temperature was the limiting factor when supplemental irrigation was applied to the wet treatment. Supplemental irrigation was applied for only 181 of the 673 days of the experiment but the irrigation treatment nearly doubled the cumulative DD compared to DD for normal precipitation.
Figure 1. Cummulative daily Temperature Coefficients (TC), daily Moisture Coefficients (MC), Decomposition Days (DD) for dry and wet treatments as functions of calendar days from start of the experiment on August 1, 2006. The inverted blue triangles joined a blue line indicate days when irrigation was applied. Solid red triangles indicate sampling dates.
Remotesensing 02 00416 g001
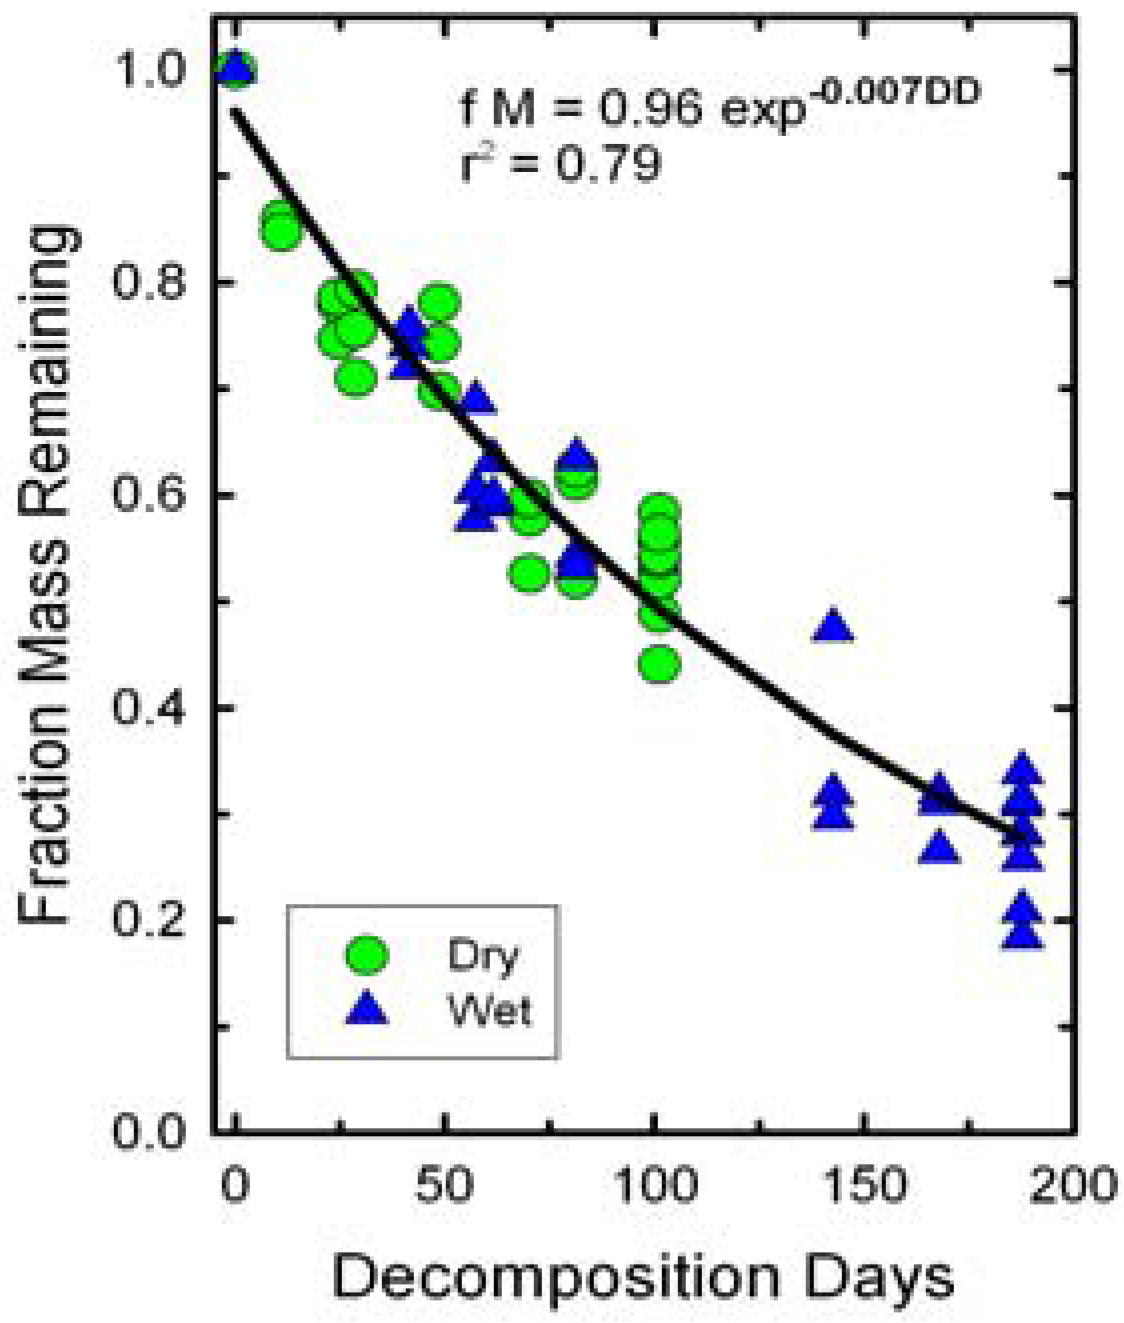
The fraction of dry mass remaining in the bags declined as a function of decomposition days (Figure 2). Irrigation did not significantly affect slopes of the decline in dry mass remaining because of the normalization of DD. Thus, both wet and dry treatments were fitted with a single line. The slope of the decline in biomass or k value was less than those reported for field observations of winter wheat residues [6,7,8].
Figure 2. Changes in initial wheat straw mass as a function of decomposition days (DD). A single exponential decay function fit both dry and wet treatments.
Remotesensing 02 00416 g002
Three factors probably contributed to the lower decomposition rates observed in this study. First, the residue layer in the mesh bags was quite thick (~10 cm initially) and had limited contact with the soil where conditions were most favorable for decomposition. Steiner et al. [8] reported highest decomposition rates where a high proportion of the residue elements were in direct contact with the soil. Second, the soil in this study was a loamy sand with low soil organic matter content and low water holding capacity. Stroo et al. [6] showed that much higher decomposition rates for straw on silt loams than on sands were associated with physical factors controlling water movement and soil organic matter content that enhanced microbial populations. The clay loam used by Steiner et al. [8] has a higher water holding capacity than the loamy sand used in our study. Three, the generally lower decompositions rates for the litter bag approach has been attributed to exclusion of macro-organisms [4,5] and reduced movement by wind and water [7].
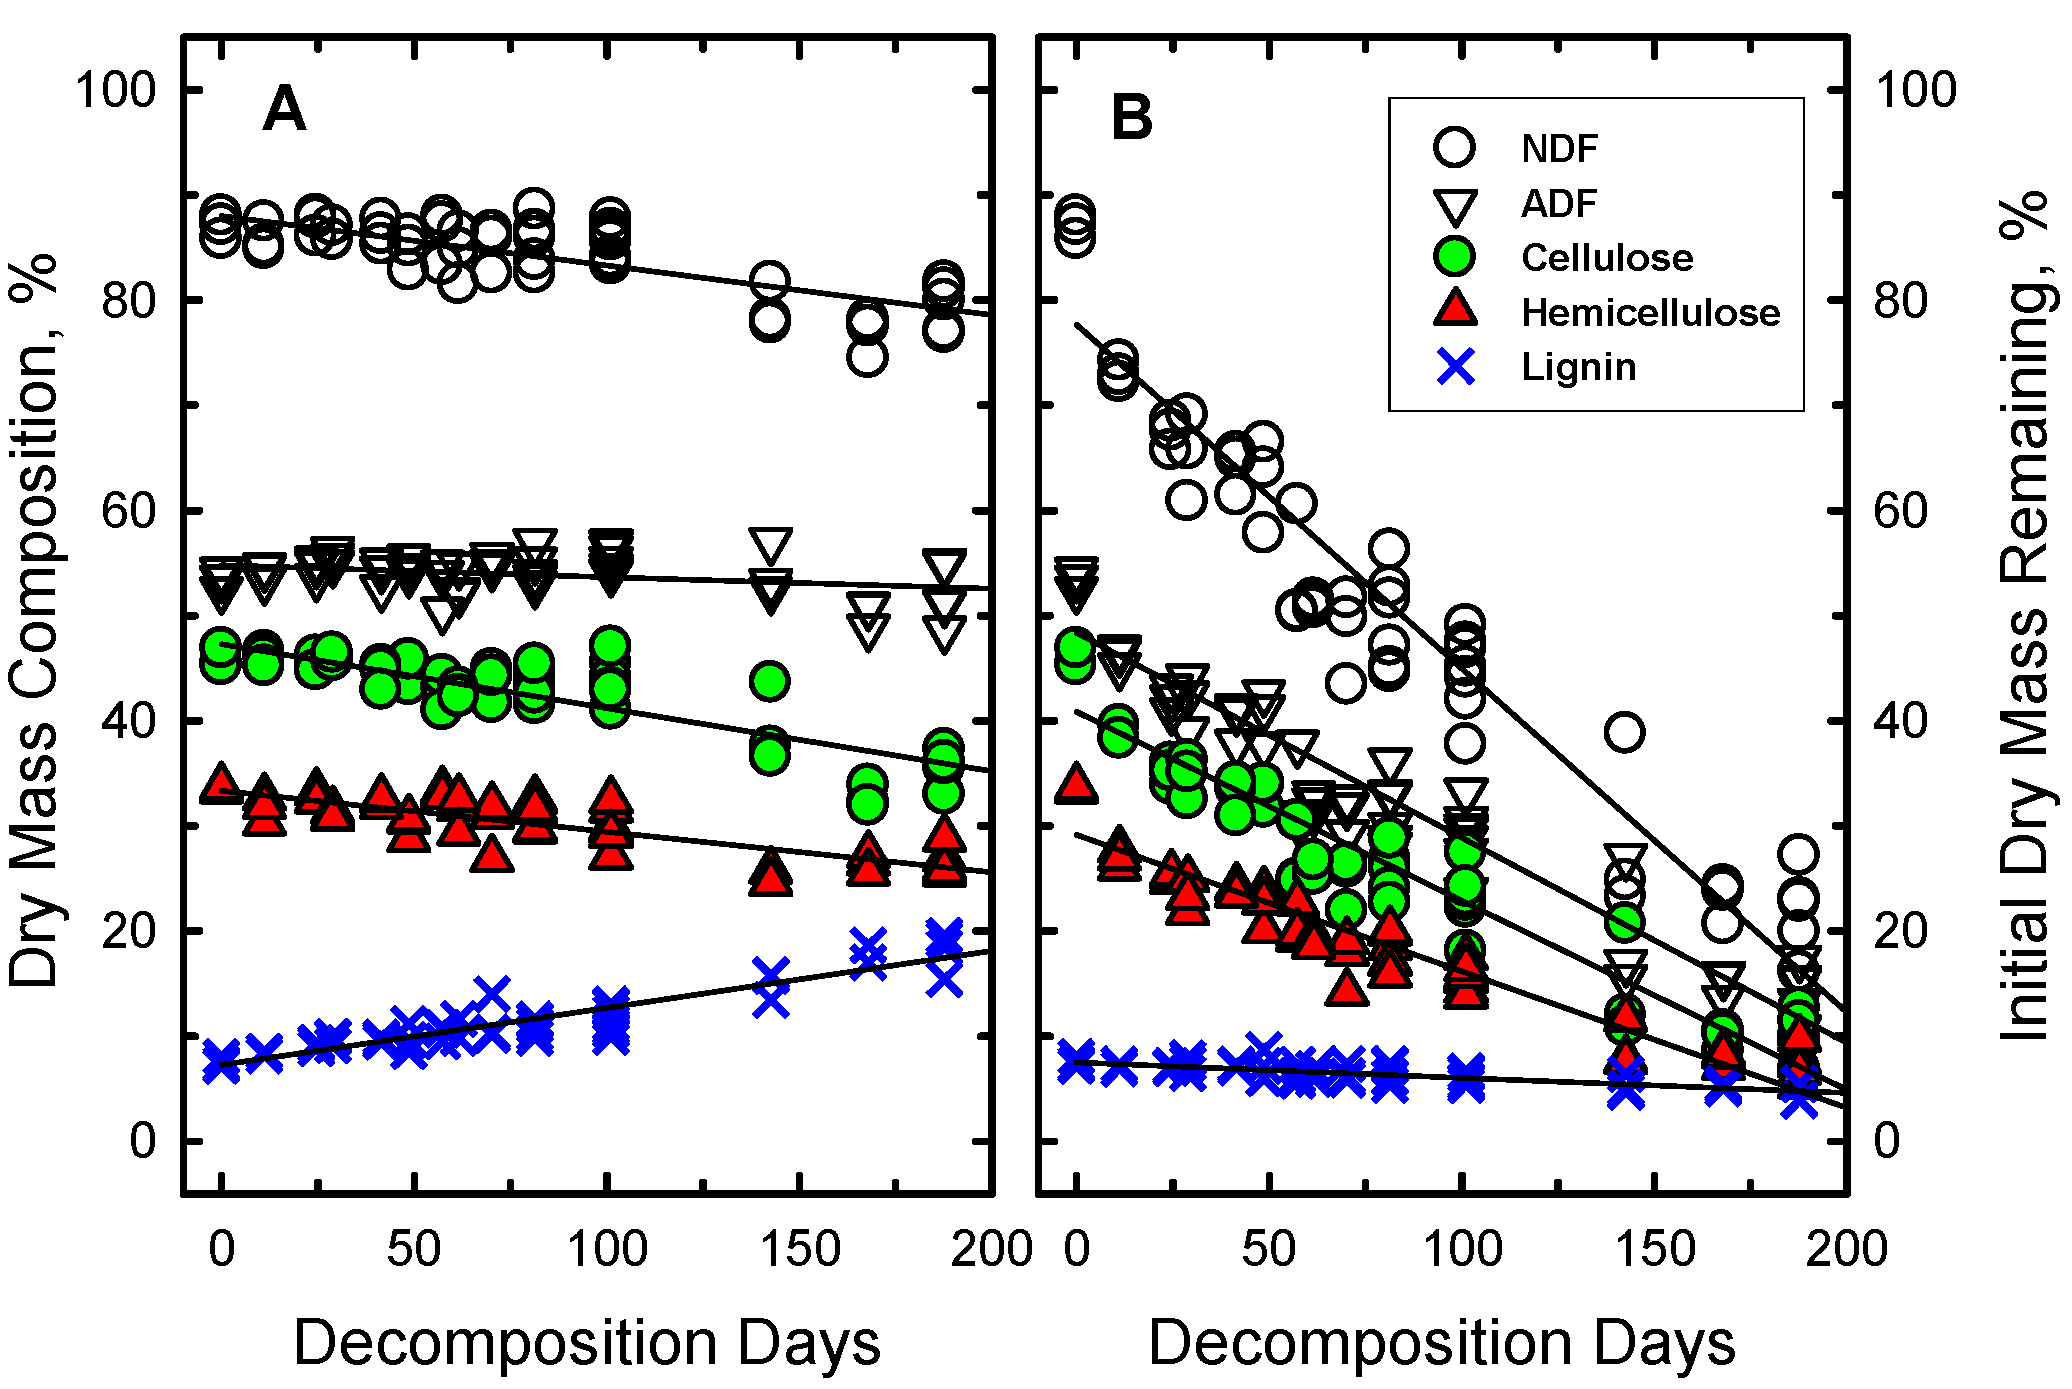
The wheat straw mass did not disappear uniformly (Figure 3). Some components of the straw disappeared more rapidly than others. The relative proportions of NDF, hemicellulose and cellulose in the wheat straw declined significantly as a function of DD (Figure 3A) while the relative proportion of lignin in the straw significantly increased (more than doubled). However, when the proportion of initial mass of each component was calculated, all declined significantly except lignin which remained unchanged (Figure 3B). Similar patterns of changes in fiber composition also occurred in the weathered outer layers of large round bales of hay stored outdoors [38] and in forest ecosystems during the early stage of litter decomposition when environmental conditions were major controlling factors [5]. The onset of mass loss due to degradation of cellulose and hemicellulose began rapidly in pine litter, but the first net loss of lignin mass was after 2 years [39].
Figure 3. Changes in the (a) concentrations and (b) initial mass of the structural components of wheat straw as a function of decomposition days (DD). The root mean square error (RSME) of the regression line for each component, except NDF, is smaller than the symbol size. For NDF, the RMSE is 1.3 times the symbol size.
Remotesensing 02 00416 g003
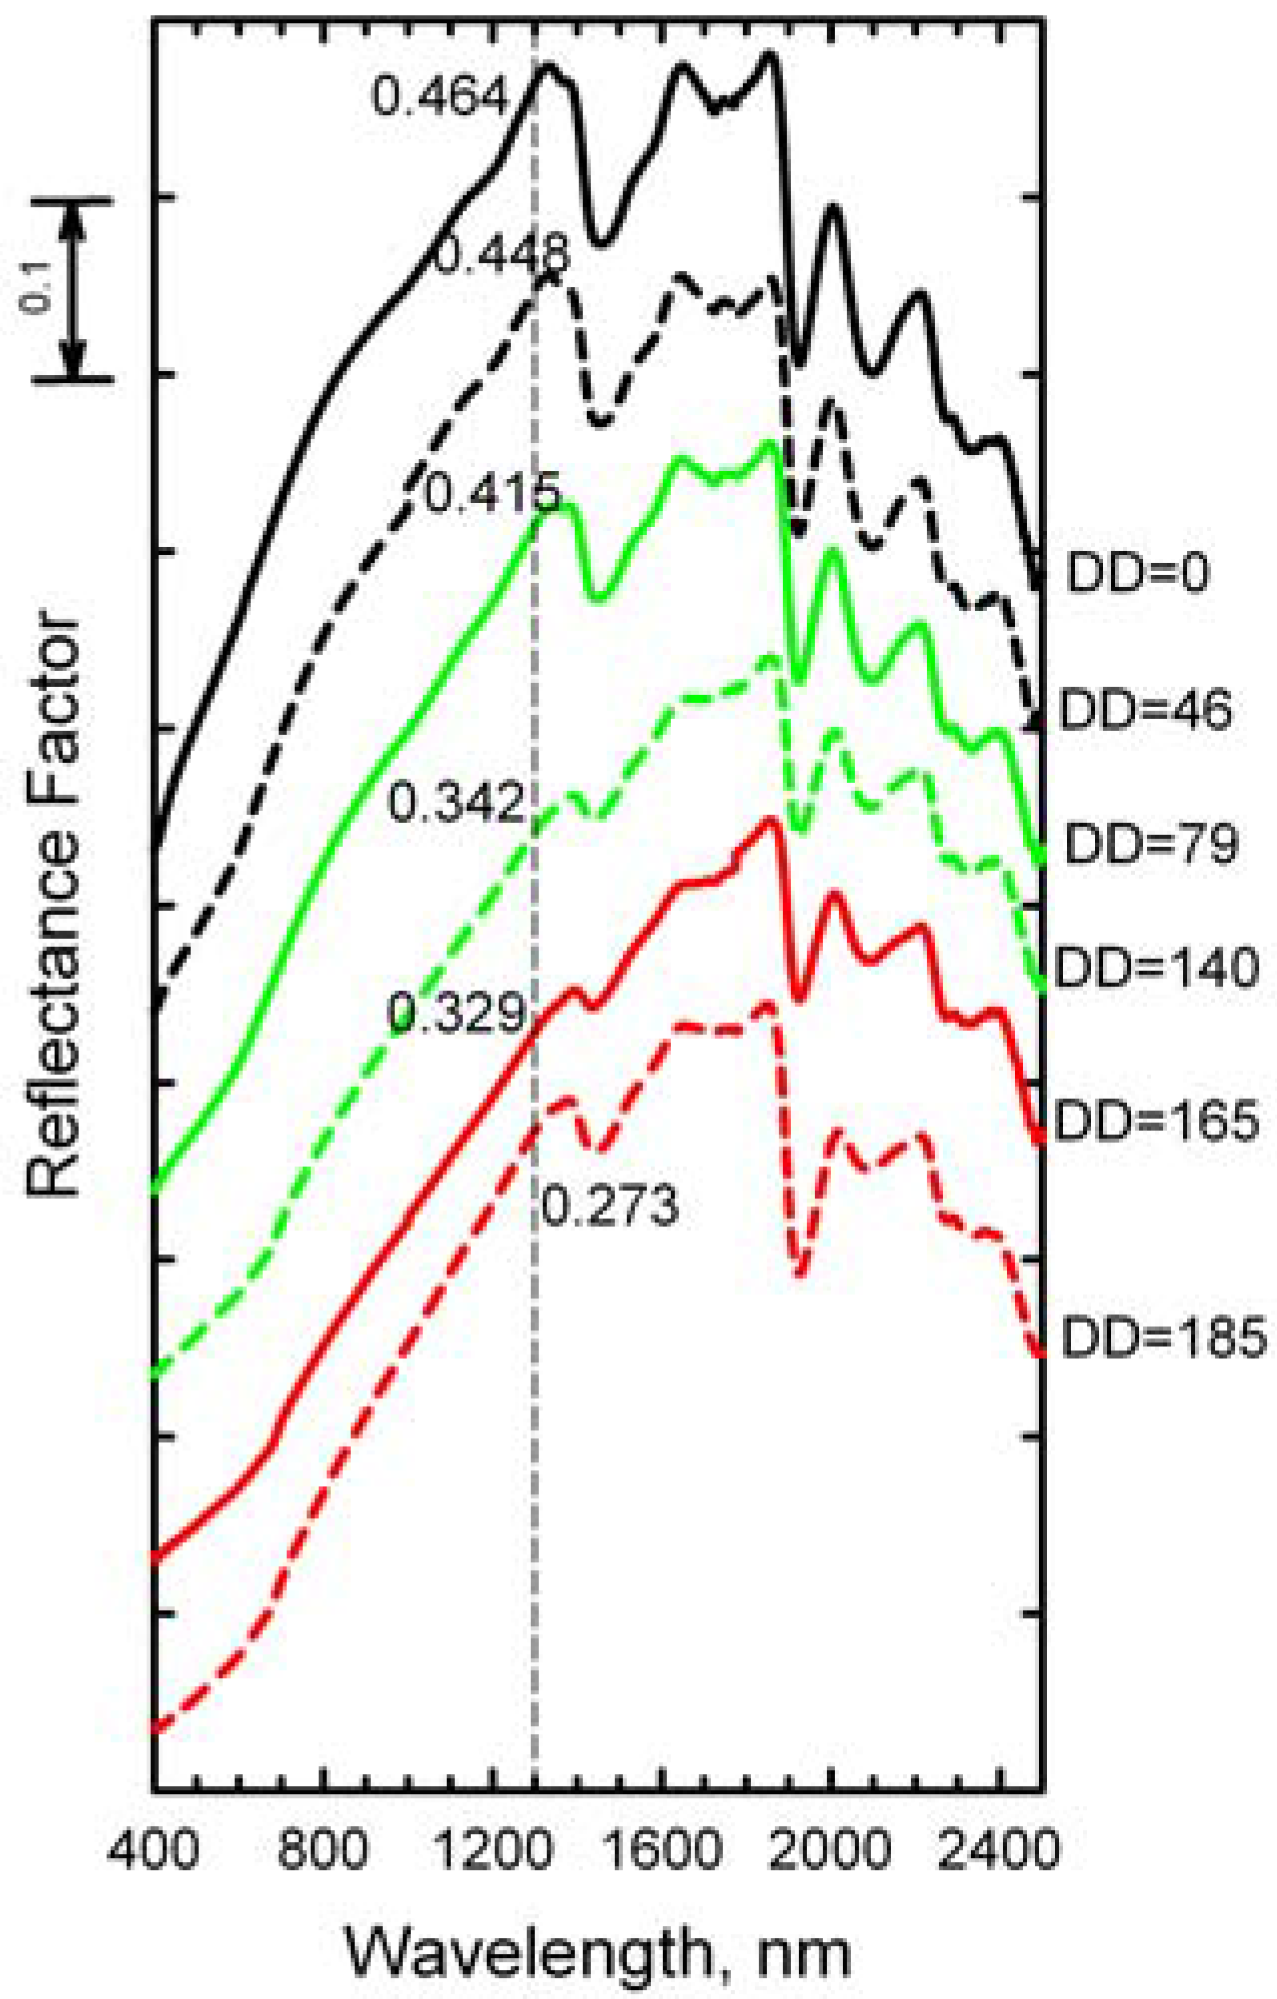
The reflectance spectra of dry wheat straw at selected DD (Figure 4) illustrate the subtle changes in spectrum shape as the wheat straw decomposed. These spectra lack the chlorophyll and water absorptions that dominate the spectra of green leaves [24]. Structural components (cellulose, hemicellulose, and lignin) of the wheat straw dominate the spectrum of each sample at wavelengths >1,300 nm. The intensities of the cellulose and lignin absorption features near 1,710, 2,100, and 2,350 nm diminished as the wheat straw decomposed [24,25]. The relative intensity of the absorption feature near 2,100 nm, defined as the cellulose absorption index (CAI), is related to crop residue cover [17,28,31].
Figure 4. Spectral reflectance of wheat straw at selected decomposition days (DD). The spectra are displaced vertically to avoid overlap. Reflectance at 1,300 nm is provided for each spectrum.
Remotesensing 02 00416 g004
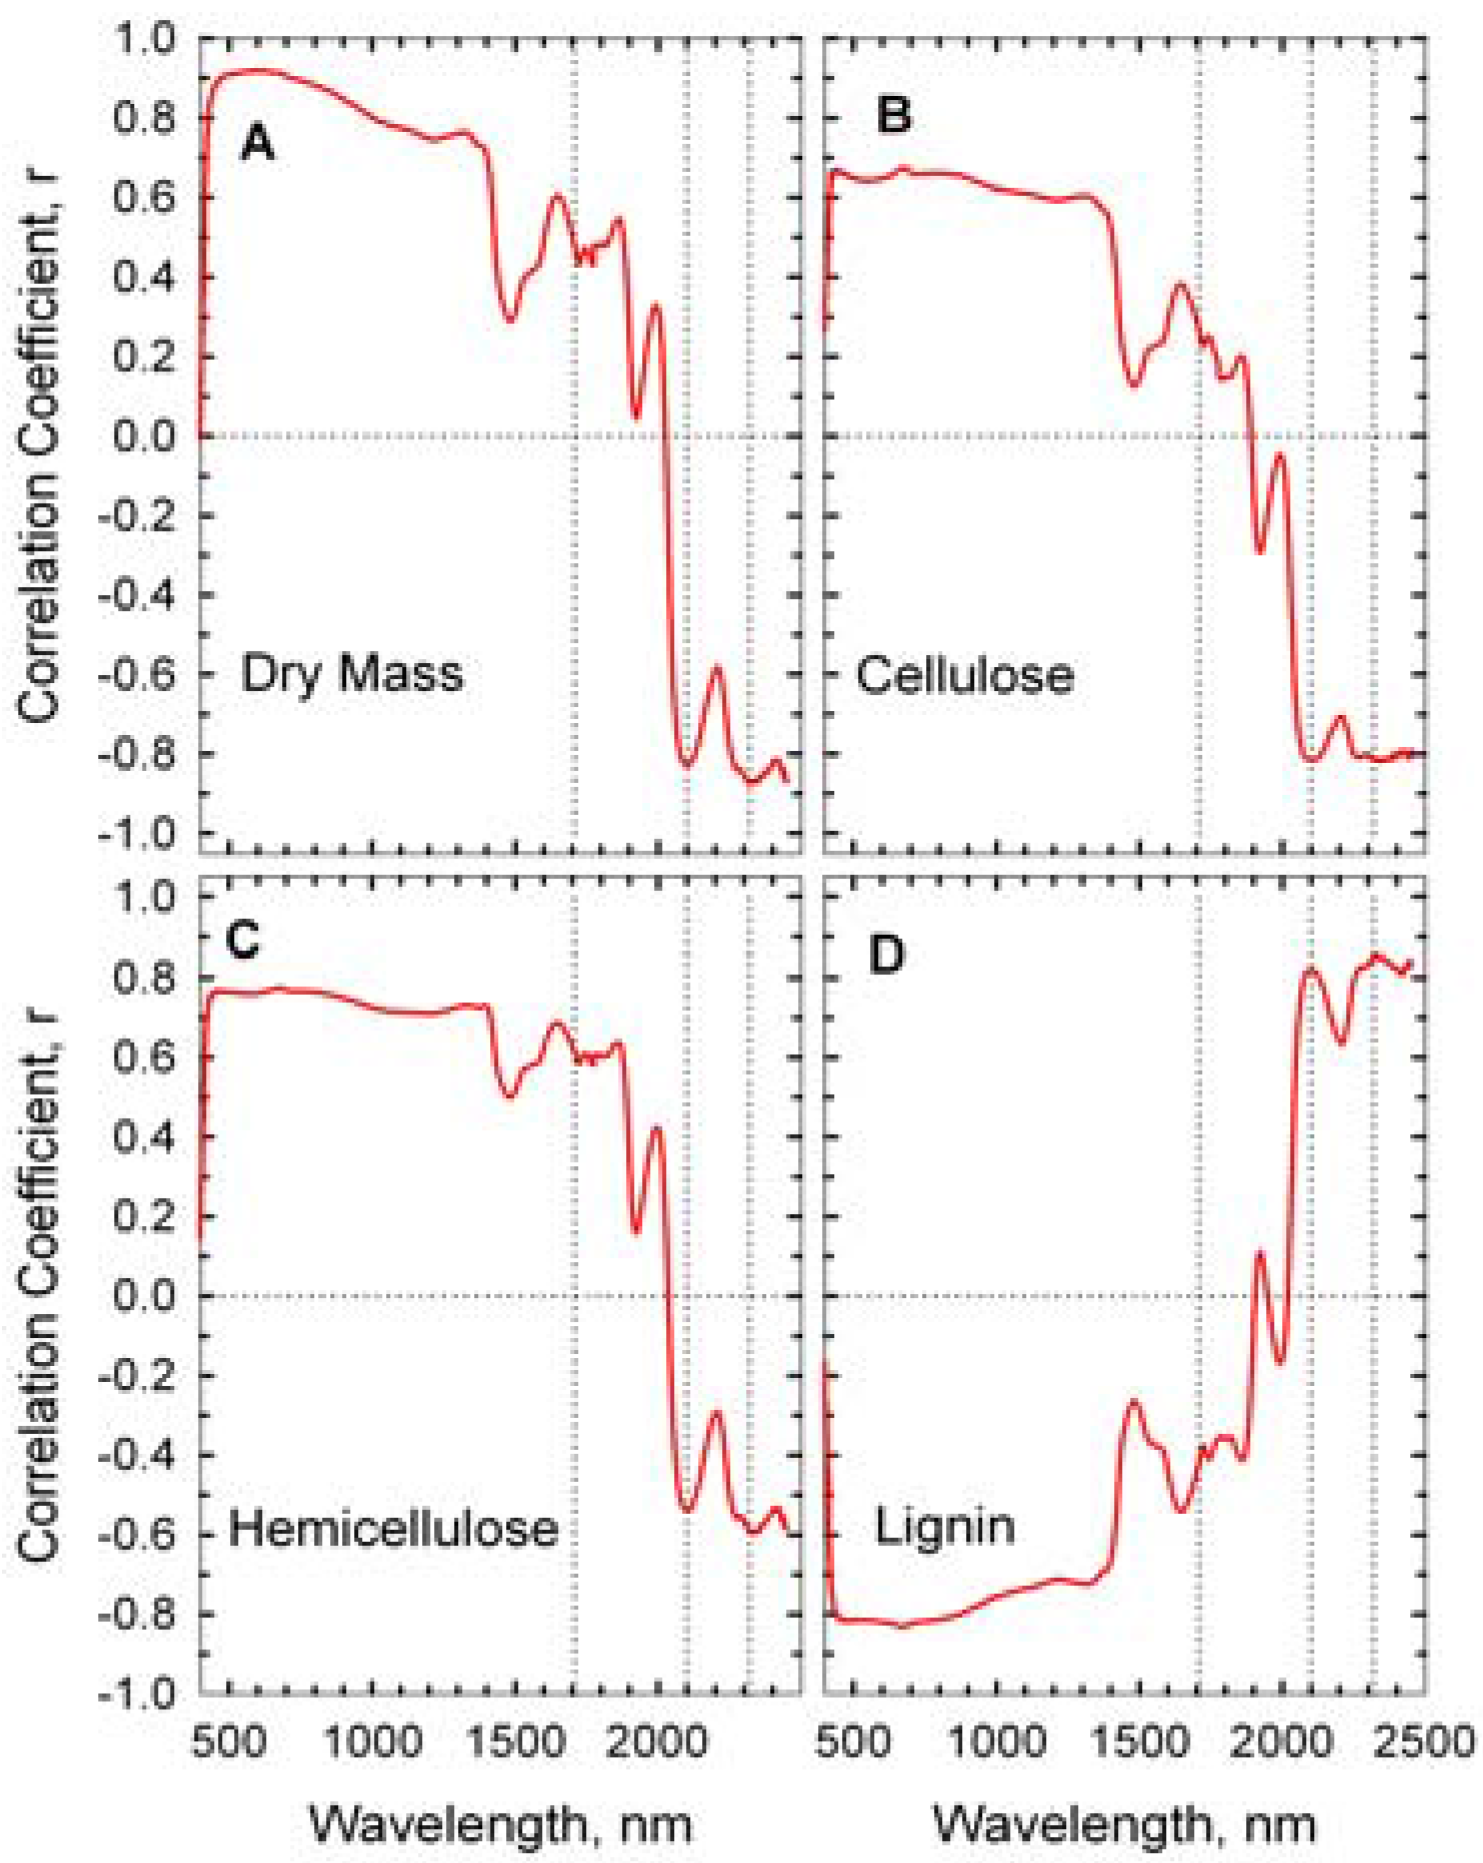
The correlations between wheat straw mass, its composition, and reflectance spectra are presented as correlograms in Figure 5. Reflectance near 1,710, 2,100, and 2,350 nm were strongly correlated with the concentrations of hemicellulose, cellulose, and lignin [24,26]. Cellulose content of the wheat straw was negatively correlated to reflectance at 2,100 while lignin content was positively correlated to reflectance. High correlations in the visible and near infrared wavelengths (400–1,300 nm) were probably associated with overall decrease in straw reflectance (Figure 4) rather than a specific fiber component.
Figure 5. Correlograms of wheat straw components and reflectance spectra. Dotted vertical lines are at 1,710, 2,100, and 2,310 nm.
Remotesensing 02 00416 g005
In order to assess the impact of crop residue decomposition on the detection of crop residue cover, the reflectance of mixed scenes with various proportions of crop residue and soils was simulated using linear combinations of reflectance factors (Equation 1).
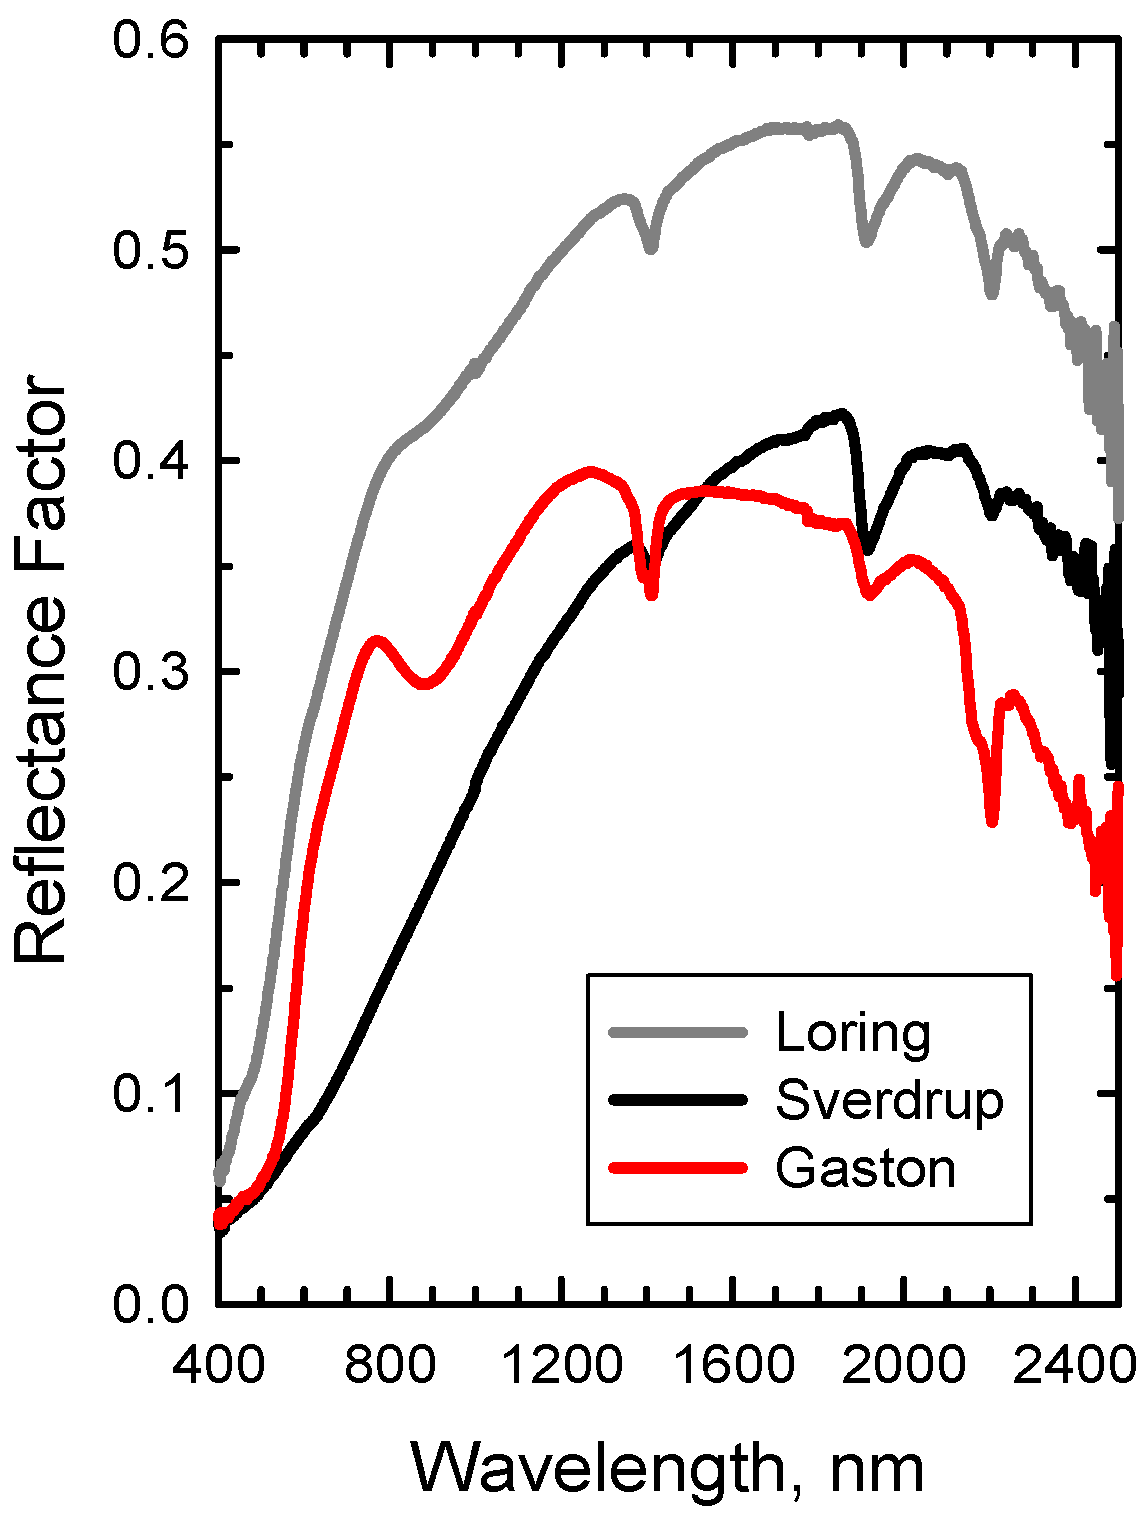
Figure 6. Reflectance spectra of three diverse soils: Loring (Alfisol), Sverdrup (Mollisol), and Gaston (Ultisol).
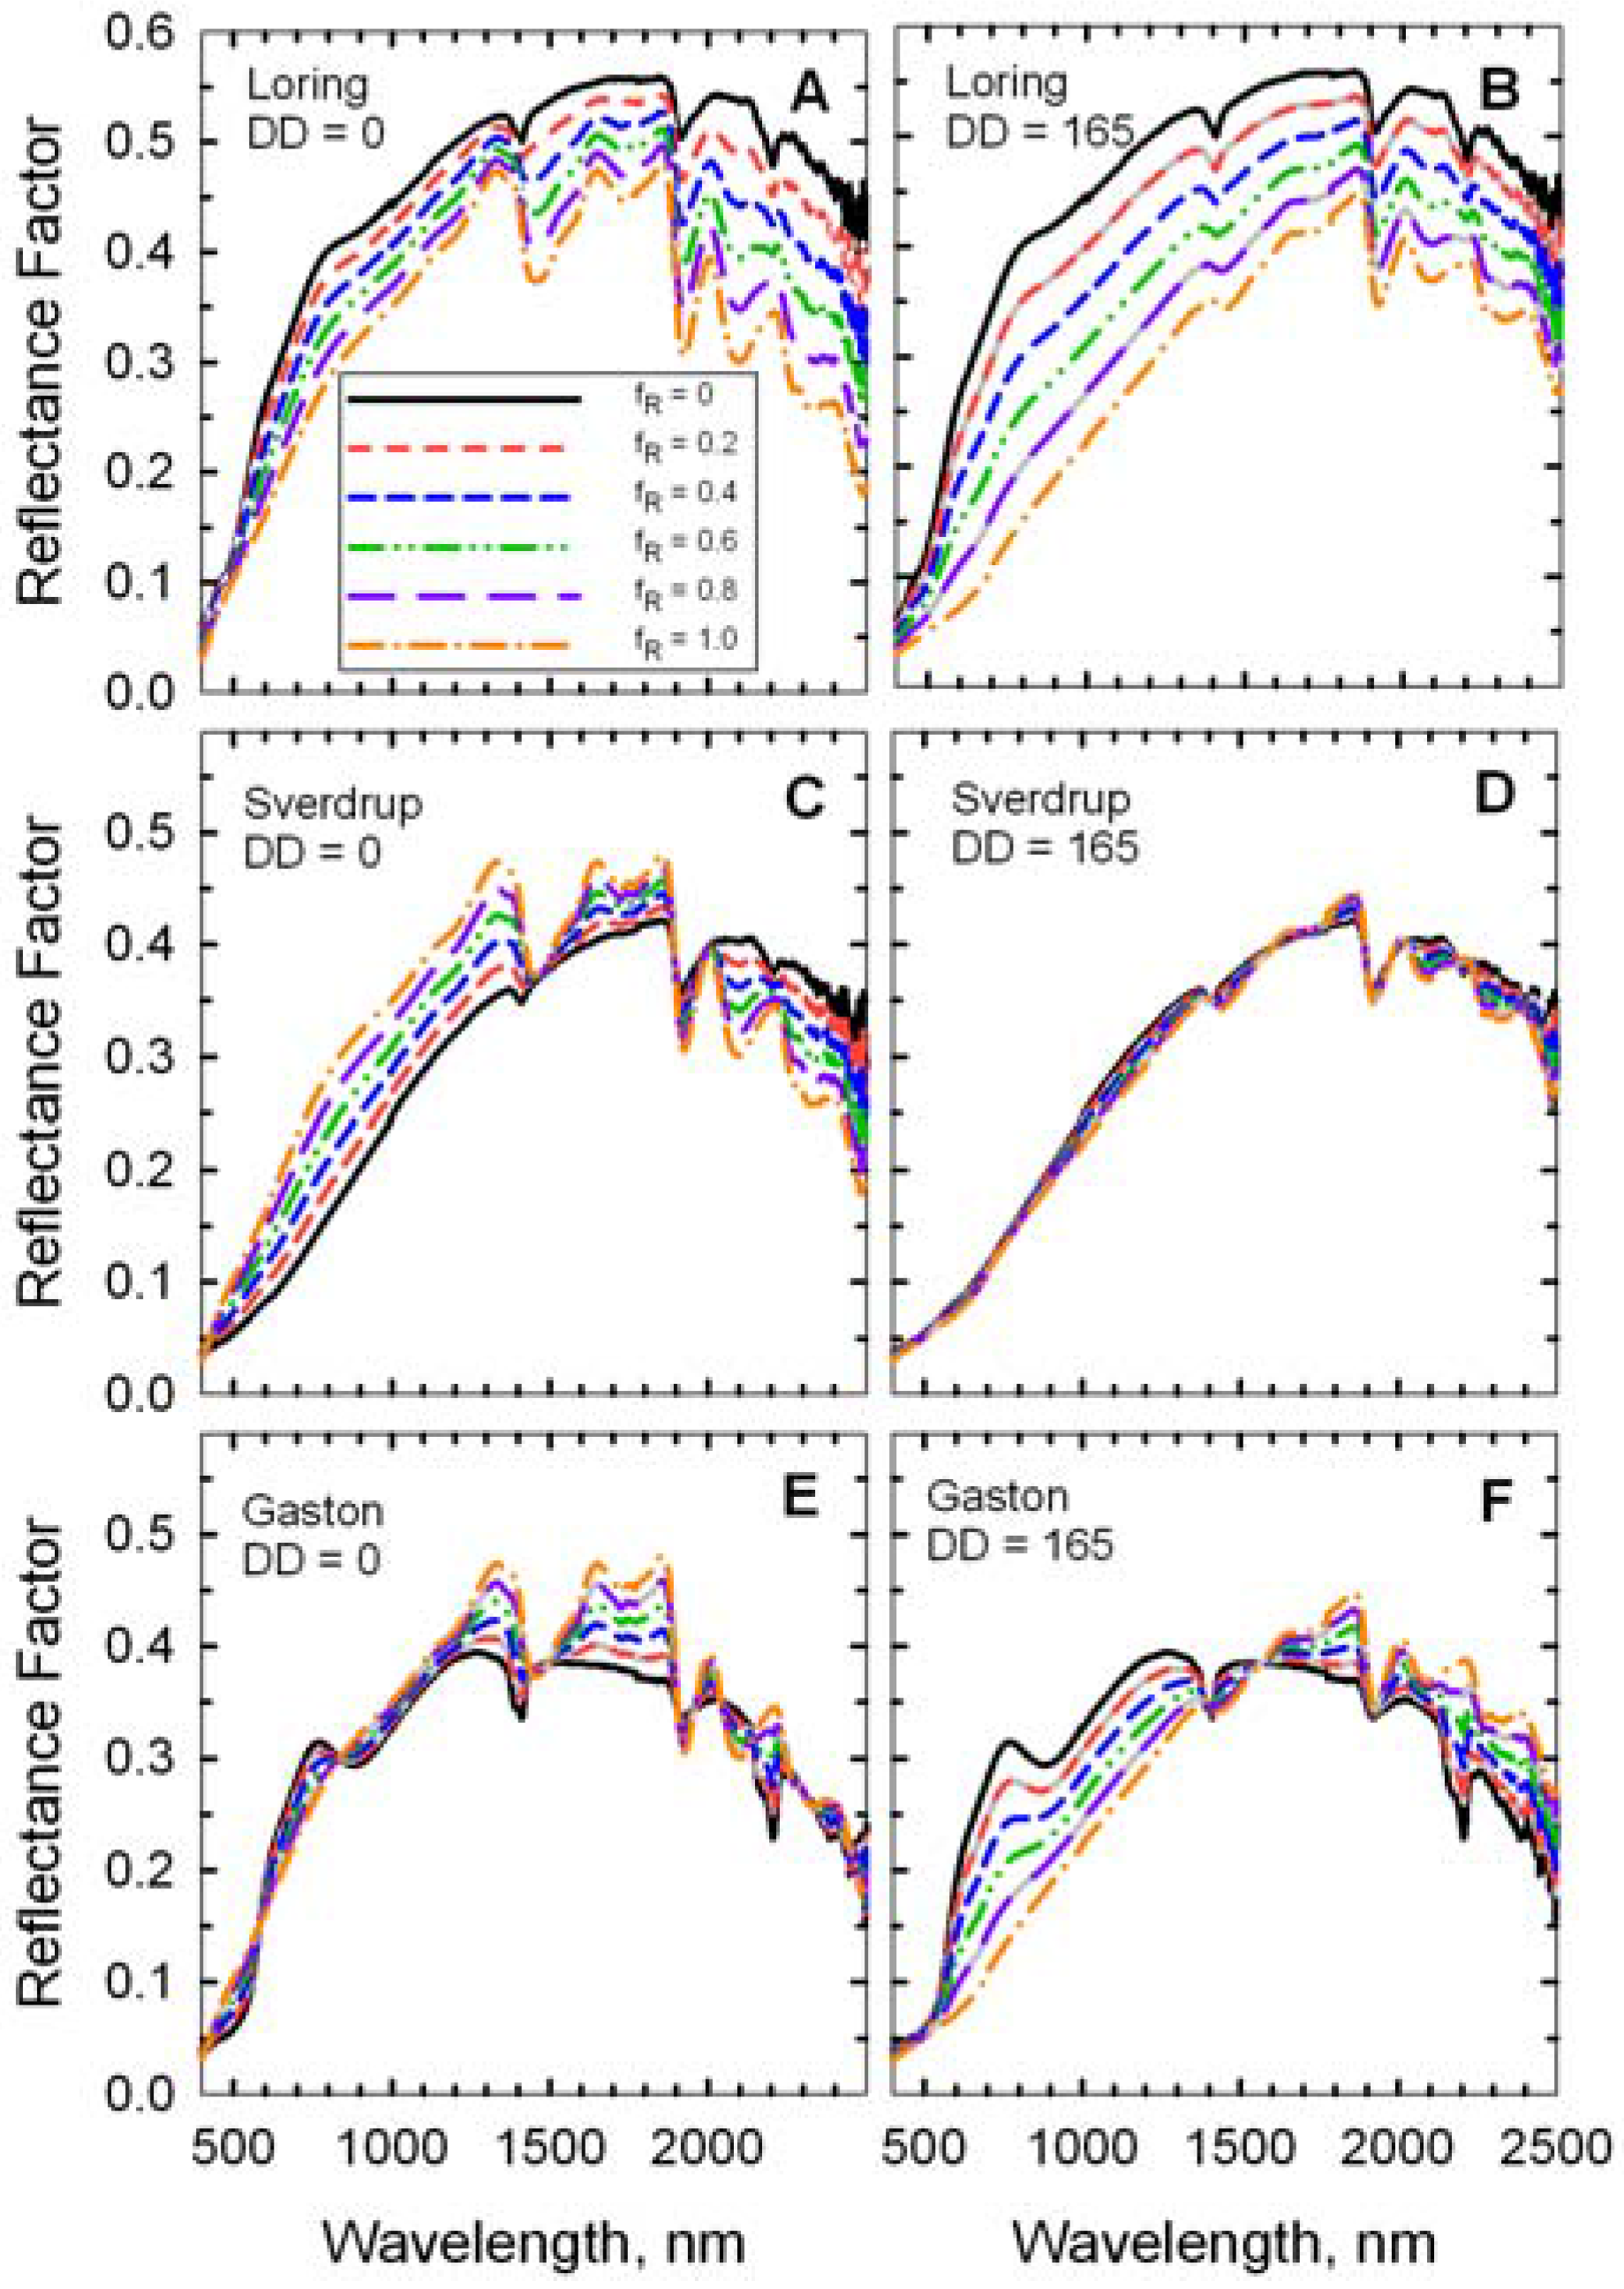
Remotesensing 02 00416 g006
Figure 7. Reflectance spectra of simulated scenes with mixtures of two wheat residues (DD = 0 and DD = 165) on three soils. The fraction residue cover (fR) ranged from 0 (100% soil) to 1.0 (100% wheat residue).
Remotesensing 02 00416 g007
The mineral absorption feature near 2,200 m was evident in the spectrum of each bare soil (Figure 6 and fR = 0 in Figure 7), but was attenuated as residue cover increased (Figure 7). Likewise, the cellulose feature near 2100 nm was evident in the spectrum of each crop residue (Figure 4 and fR = 1 in Figure 7), but diminished as residue cover decreased. The fresh straw (DD = 0) was darker than the Loring soil, but brighter than the Sverdrup soil at wavelengths <1,800 nm (Figure 7). Reflectance of the fresh straw and Gaston soil were approximately equal at wavelengths <1,300 nm. As the residue decomposed, differences in reflectance increased for the Loring and Gaston soils, but diminished for the Sverdrup soil (
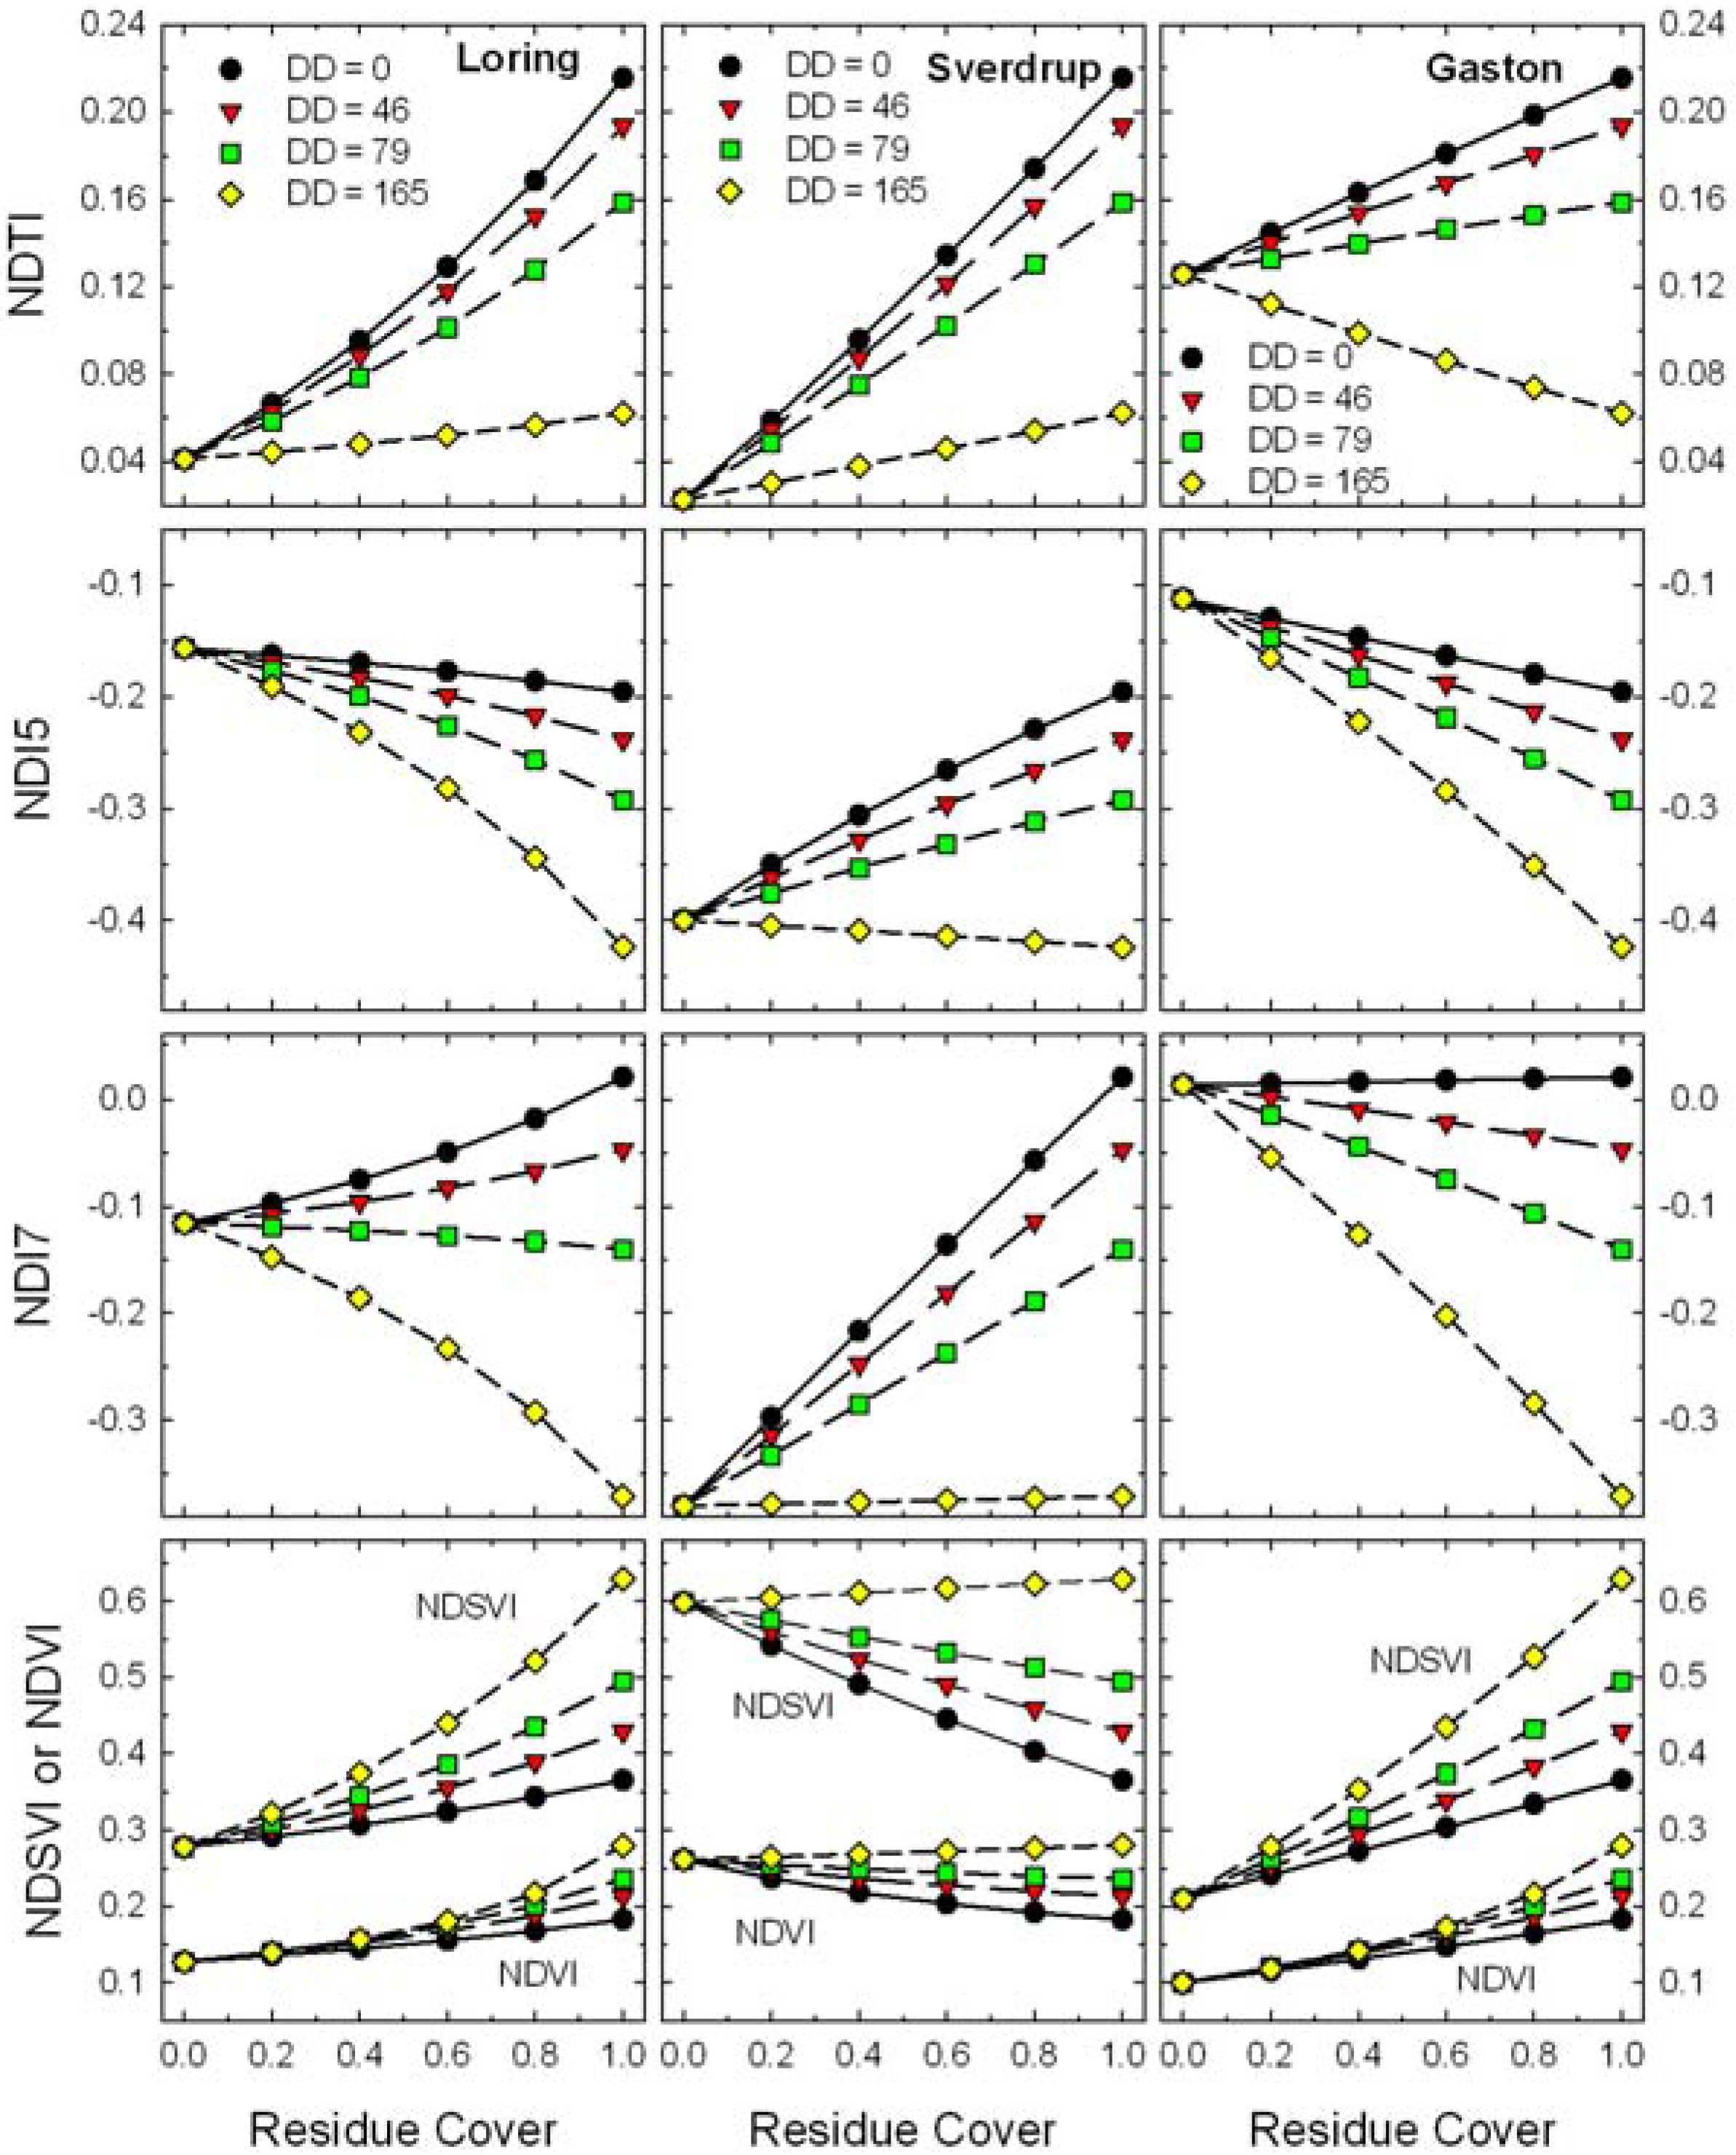
Figure 7). The responses of the four Landsat TM spectral residue indices (Equations 2–5) plus NDVI (Equation 6) to changes in residue cover for simulated scenes with four ages (i.e., decomposition days, DD) of wheat straw on Loring, Sverdrup, and Gaston soils are plotted (Figure 8).
Figure 8. Expected responses of Landsat TM band residue indices (Equations 2–6) to changes in residue cover for scenes with mixtures of four ages (i.e., decomposition days, DD) of wheat residues and three soils.
Remotesensing 02 00416 g008
These contrasting soils produced large relative shifts in bare soil values for all of the Landsat TM indices (Figure 8). Although the bare soil value for NDTI changed with soil type, the slope of the relationship remained positive except for the oldest residues (DD = 165). Local calibrations for soil and crop residue reflectance appear possible for NDTI [17,21]. However, the slopes of residue cover vs. NDI5, NDI7, and NDSVI ranged from negative to positive as the soil background changed and positive to negative as the residues aged. Although these indices have been described for assessing crop residue cover [19,20], variations in soil and residue reflectance will cause problems assessing crop residue cover for these indices.
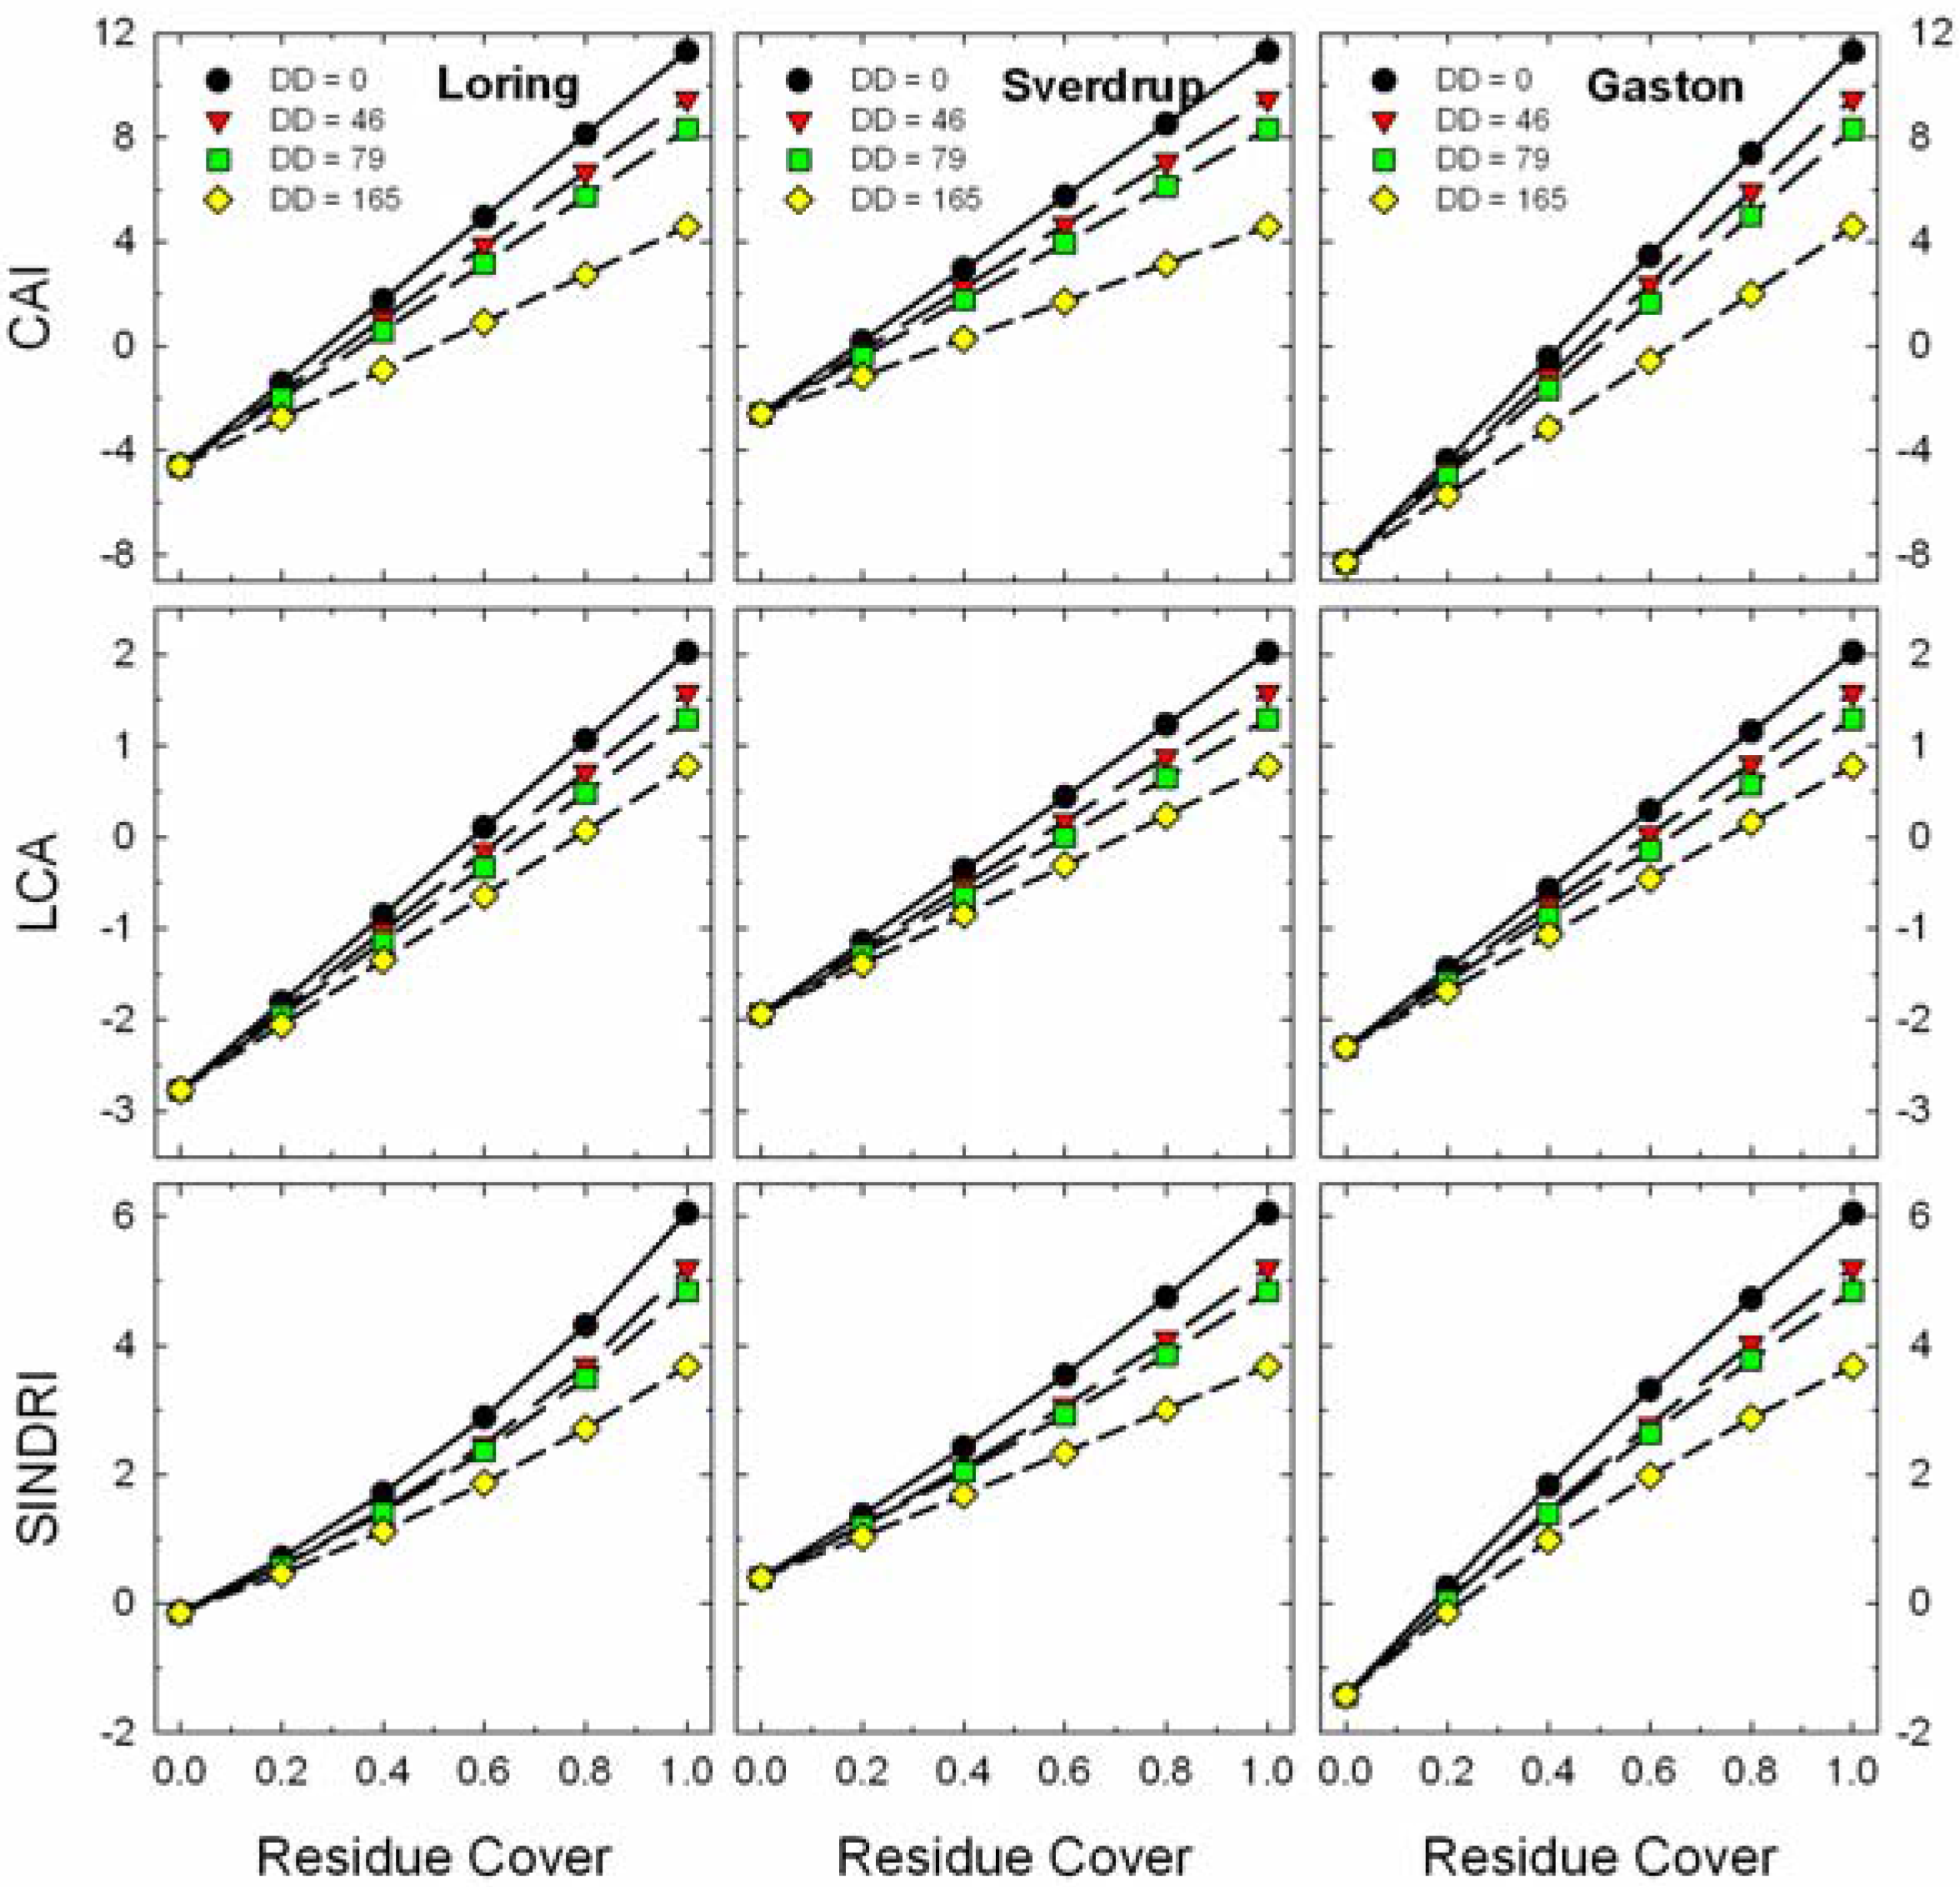
The slopes of residue cover vs. CAI, LCA, and SINDRI were relatively constant for the three soils (Figure 9). The strong clay mineral absorption observed near 2,200 nm in the Gaston soil (Figure 6) influenced the bare soil values for all three indices (Figure 9). As crop residues decompose, the slope of these indices vs. residue cover also changed slightly, but remained positive. The changes in CAI with residue age (DD) are related to the changes in the relative depth of the cellulose absorption feature near 2,100 nm (Figure 3) as the wheat straw decomposed and the proportion of cellulose declined (Figure 4). The LCA and SINDRI (Equations 8, 9), which used bands located on the sides and shoulders of the cellulose and lignin absorption features, also tracked the changes in composition of the wheat straw.
Figure 9. Expected responses of advanced residue indices (Equations 7–9) to changes in residue cover for scenes with mixtures of four ages (i.e., decomposition days, DD) of wheat residues and three soils.
Remotesensing 02 00416 g009
What is the impact of decomposition on remote estimates of residue cover? In agricultural fields with limited tillage, the oldest crop residues (i.e., DD = 165 in Figure 8 and Figure 9) would have lost >70% of their original mass (Figure 2) and would be covered by or mixed with the newer residues of subsequent crops. Thus, from a pragmatic point of view, these oldest residues (DD = 165) are a minor component of the total crop residue cover and will be excluded from the following discussion. For each crop residue index in Figure 8 and Figure 9, the difference (range) between wheat residue end-point (fR = 1) and the bare soil end-point (fR = 0) was calculated. The impact of decomposition at DD = 79 (~55% of original dry mass lost) was expressed as the relative change in the range of each index and each soil (Table 1). For the three narrow-band indices (i.e., CAI, LCA, and SINDRI), the range decreased 15 to 21% depending on soil type. If these indices were calibrated with fresh residue (DD = 0) and then used to estimate the cover of aged residue (DD = 79), we would expect the aged residue cover on a dark-colored soil (e.g., Sverdrup) to be under-estimated by as much as 21% of true value using CAI or SINDRI. Since conservation tillage is defined as more than 30% residue cover (fR > 0.3) [9], an error of 21% of value (i.e., ±6% cover) is within the accuracy expected from the line-point transect method [10,11] for measuring crop residue cover. The changes in range of the four broad-band indices associated with residue age and soil type were large (Table 1). For example, if NDTI was calibrated with fresh residue (DD = 0) and then used to estimate the cover of age residue (DD = 79), we would expect the aged residue cover to under-estimated by 29 to 63%. The other broad-band indices showed even larger over- and under-estimates of residue cover. These results indicate that current broad-band, multispectral imaging systems will not provide robust estimates of crop residue cover when the reflectance of the soils and residues are variable across agricultural landscapes.
Table 1. Effects of soil type and residue age on the range of spectral residue indices.
SoilResidue Age NDTINDI7NDI5NDSVICAILCASINDRI
LoringDD = 0Rangea0.1740.137−0.0390.08715.94.86.2
DD = 79Range0.118−0.024−0.1360.21612.94.15.0
Changeb−0.325−1.1772.4571.483−0.188−0.152−0.196
SverdrupDD = 0Range 0.1930.4010.204−0.23313.94.05.7
DD = 79Range0.1360.2400.107−0.10410.93.24.4
Change−0.294−0.401−0.474−0.554−0.214−0.184−0.214
GastonDD = 0Range 0.0900.007−0.0830.15519.64.37.5
DD = 79Range0.033−0.154−0.1800.28516.63.66.3
Change−0.632−23.2211.1600.831−0.152−0.168−0.162
Note: aResidue Index (RI) Range = [residue index value (fR = 1)] – [residue index value (fR = 0)] for new (DD = 0) and old (DD = 79) wheat residues. bChange = [(Range(DD = 79) / Range(DD = 0)] − 1.

4. Conclusions

In this study, we measured the changes in composition and reflectance of wheat straw during the decay process. As the wheat straw decomposed, the cellulose and hemicellulose components declined more rapidly than the lignin component. Changes in the reflectance spectra of the wheat straw accompanied the changes in composition. Reflectance spectra of scenes with various proportions of wheat residue cover on diverse soils were simulated using a linear mixture model [17]. An ideal residue or tillage index would estimate crop residue cover regardless of soil type and residue composition (age). Empirical residue indices calculated using the relatively broad Landsat TM bands were unreliable because the wheat residues could be brighter or darker than the soils. Physically-based spectral analysis approaches based on detecting absorption features associated with cellulose and lignin near 2,100 nm and 2,300 nm were robust and were minimally affected by decay processes until more than half of the original dry mass of the residues was lost.
Thus, advanced multispectral sensors with a few appropriately positioned, relatively narrow (10–40 nm) bands or hyperspectral sensors are needed to reliably assess crop residue cover, an important indicator of soil tillage intensity and conservation practices over diverse agricultural landscapes. The areal extent of tillage intensity classes by soil and crop types could be mapped relative to environmentally sensitive zones within watersheds. Areas requiring site-specific conservation practices, such as planting cover crops, establishing buffer strips, and minimum-till planting, could be highlighted for further examination. The overall result will be less soil erosion and improved soil and water quality. While this research underscores the importance of physically-based remote sensing approaches, it needs to be replicated for other crops, soils, and climates and verified with actual field data. Much of this research is underway.

Acknowledgements

We gratefully acknowledge the assistance of Adam Hidey, Michael Bayless, and Sam Hayden in preparing and analyzing the samples.

References

  1. Lal, R.; Kimble, J.M.; Follett, R.F.; Cole, C.V. The Potential of US Cropland to Sequester Carbon and Mitigate the Greenhouse Effect; Lewis Publishers: Boca Raton, FL, USA, 1999; p. 128. [Google Scholar]
  2. Lobb, D.A.; Huffman, E.; Reicosky, D.C. Importance of information on tillage practices in the modeling of environmental processes and in the use of environmental indicators. J. Environ. Manage. 2007, 82, 377–387. [Google Scholar]
  3. Rasmussen, P.E.; Rohde, C.R. Long-term tillage and nitrogen fertilization effects on organic N and C in a semi-arid soil. Soil Sci. Soc. Am. J. 1988, 44, 596–600. [Google Scholar] [CrossRef]
  4. Melillo, J.M.; Aber, J.D.; Linkins, A.E.; Ricca, A.; Fry, B.; Nadelhoffer, K.J. Carbon and nitrogen dynamics along the decay continuum: plant litter to soil organic matter. Plant Soil 1989, 11, 189–198. [Google Scholar] [CrossRef]
  5. Berg, B.; McClaugherty, C. Plant Litter: Decomposition, Humus Formation, Carbon Sequestration, 2nd ed.; Springer-Verlag: Berlin, Germany, 2008; p. 338. [Google Scholar]
  6. Stroo, H.F.; Bristow, K.L.; Elliott, L.F.; Papendick, R.I.; Campbell, G.S. Predicting rates of wheat residue decomposition. Soil Sci. Soc. Am. J. 1989, 53, 91–99. [Google Scholar] [CrossRef]
  7. Steiner, J.L.; Schomberg, H.H.; Douglas, C.L., Jr.; Black, A.L. Standing stem persistence in no-tillage small-grain fields. Agron. J. 1994, 86, 76–81. [Google Scholar]
  8. Steiner, J.L.; Schomberg, H.H.; Unger, P.W.; Cresap, J. Crop residue decomposition in no-tillage small-grain fields. Soil Sci. Soc. Am. J. 1999, 63, 1817–1824. [Google Scholar] [CrossRef]
  9. CTIC. Crop Residue Management Survey System; Conservation Technology Information Center: West Lafayette, IN, USA, 2009; Available online: http://www.crmsurvey.org/ (accessed on 26 January 2010).
  10. Laflen, J.M.; Amemiya, M.; Hintz, E.A. Measuring crop residue cover. J. Soil Water Conserv. 1981, 36, 341–343. [Google Scholar]
  11. Morrison, J.E., Jr.; Huang, C.; Lightle, D.T.; Daughtry, C.S.T. Residue cover measurement techniques. J. Soil Water Conserv. 1993, 48, 479–483. [Google Scholar]
  12. Thoma, D.P.; Gupta, S.C.; Bauer, M.E. Evaluation of optical remote sensing models for crop residue cover assessment. J. Soil Water Conserv. 2004, 59, 224–233. [Google Scholar]
  13. Streck, N.A.; Rundquist, D.; Connot, J. Estimating residual wheat dry matter from remote sensing measurements. Photogramm. Eng. Remote Sens. 2002, 68, 1193–1201. [Google Scholar]
  14. Bauer, M.E. Spectral inputs to crop identification and condition assessment. Proc. IEEE 1985, 73, 1071–1085. [Google Scholar] [CrossRef]
  15. MacDonald, R.B.; Hall, F.G. Global crop forecasting. Science 1980, 208, 670–679. [Google Scholar] [CrossRef] [PubMed]
  16. Baird, F.; Baret, F. Crop residue estimation using multiband reflectance. Remote Sens. Environ. 1997, 59, 530–536. [Google Scholar] [CrossRef]
  17. Daughtry, C.S.T. Discriminating crop residues from soil by shortwave infrared reflectance. Agron. J. 2001, 93, 125–131. [Google Scholar] [CrossRef]
  18. Serbin, G.; Daughtry, C.S.T.; Hunt, E.R., Jr.; Brown, D.J. Effect of soil on remote sensing of crop residue cover. Soil Sci. Soc. Am. J. 2009, 73, 1545–1558. [Google Scholar] [CrossRef]
  19. Corak, S.J.; Kaspar, T.C.; Meek, D.W. Evaluating methods for measuring residue cover. J. Soil Water Conserv. 1993, 48, 700–704. [Google Scholar]
  20. McNairn, H.; Protz, R. Mapping corn residue cover on agricultural fields in Oxford County, Ontario, using Thematic Mapper. Can. J. Remote Sens. 1993, 19, 152–159. [Google Scholar] [CrossRef]
  21. Qi, J.; Marsett, R.; Heilman, P.; Biedenbender, S.; Biedenbender, S.; Moran, M.S.; Goodrich, D.C.; Weltz, M. RANGES improves satellite-based information and land cover assessments in Southwest United States. EOS Trans. Am. Geophys. Union 2002, 83, 601–606. [Google Scholar] [CrossRef]
  22. van Deventer, A.P.; Ward, A.D.; Gowda, P.H.; Lyon, J.G. Using Thematic Mapper data to identify contrasting soil plains and tillage practices. Photogramm. Eng. Remote Sens. 1997, 63, 87–93. [Google Scholar]
  23. Workman, J., Jr.; Weyer, L. Practical Guide to Interpretive Near-Infrared Spectroscopy; CRC Press: Boca Raton, FL, USA, 2008; p. 332. [Google Scholar]
  24. Curran, P.J.; Dungan, J.L.; Peterson, D.L. Estimating the foliar biochemical concentration of leaves with reflectance spectrometry: testing the Kokaly and Clark methodologies. Remote Sens. Environ. 2001, 76, 349–359. [Google Scholar] [CrossRef]
  25. Kokaly, R.F.; Clark, R.N. Spectroscopic determination of leaf biochemistry using band-depth analysis of absorption features and stepwise multiple linear regression. Remote Sens. Environ. 1999, 67, 267–287. [Google Scholar] [CrossRef]
  26. Kokaly, R.F.; Asner, G.P.; Ollinger, S.V.; Martin, M.E.; Wessman, C.A. Characterizing camopy biochemistry from imaging spectroscopy and its application to ecosystem studies. Remote Sens. Environ. 2009, 113, S78–S91. [Google Scholar] [CrossRef]
  27. Daughtry, C.S.T.; Hunt, E.R., Jr.; McMurtrey, J.E., III. Assessing crop residue cover using shortwave infrared reflectance. Remote Sens. Environ. 2004, 90, 126–134. [Google Scholar] [CrossRef]
  28. Daughtry, C.S.T.; Hunt, E.R., Jr. Mitigating the effects of soil and residue water contents on remotely sensed estimates of crop residue cover. Remote Sens. Environ. 2008, 112, 1647–1657. [Google Scholar] [CrossRef]
  29. Daughtry, C.S.T.; Hunt, E.R., Jr.; Doraiswamy, P.C.; McMurtrey, J.E., III. Remote sensing the spatial distribution of crop residues. Agron. J. 2005, 97, 864–871. [Google Scholar] [CrossRef]
  30. Serbin, G.; Hunt, E.R., Jr.; Daughtry, C.S.T.; Doraiswamy, P.C. An improved ASTER index for remote sensing of crop residue. Remote Sens. 2009, 1, 971–991. [Google Scholar] [CrossRef]
  31. Daughtry, C.S.T.; Doraiswamy, P.C.; Hunt, E.R., Jr.; Stern, A.J.; McMurtrey, J.E., III; Prueger, J.H. Assessing crop residue cover and soil tillage intensity. Soil Tillage Res. 2006, 91, 101–108. [Google Scholar] [CrossRef]
  32. Robinson, B.F.; Biehl, L.L. Calibration procedures for measurements of reflectance factor in remote sensing field research. Proc. Soc. Photo-Optical Instrum. Eng. SPIE 1979, 196, 16–26. [Google Scholar]
  33. Abrams, M. ASTER: data products for the high spatial resolution imager on NASA's EOS-AM1 platform. Int. J. Remote Sens. 2000, 21, 847–861. [Google Scholar] [CrossRef]
  34. Goering, H.K.; Van Soest, P.J. Forage Fiber Analysis. USDA Agricultural Handbook 379; US Government Printing Office: Washington, DC, WA, USA, 1970. [Google Scholar]
  35. Ankom Technology. Available online: http://www.ankom.com/09_procedures/procedures.shtml (accessed on 26 January 2010).
  36. Schreiber, J.D. Leaching of nitrogen, phosphorous, and organic carbon form wheat straw residues: II. Loading rate. J. Environ. Qual. 1985, 14, 256–260. [Google Scholar] [CrossRef]
  37. SAS/STAT User’s Guide. Version 9.2; SAS Institute: Cary, NC, USA, 2008.
  38. Norman, R.C.; Coblentz, W.K.; Hubbell, D.S., III; Ogden, R.K.; Coffey, K.P.; Caldwell, J.D.; Rhein, R.T.; West, C.P.; Rosenkrans, C.F., Jr. Effects of storage conditions on the forage quality characteristics and ergovaline content of endophyte-infected Tall Fescue hays. Crop Sci. 2007, 47, 1635–1646. [Google Scholar]
  39. Berg, B.; Hannus, K.; Popoff, T.; Theander, O. Changes in the organic-chemical components during decomposition: long-term decomposition in a Scots pine forest. Can. J. Bot. 1982, 60, 1310–1319. [Google Scholar] [CrossRef]

