Article

Comparison of Area-Based and Individual Tree-Based Methods for Predicting Plot-Level Forest Attributes

1
Finnish Geodetic Institute, Geodeetinrinne 2, PL 15, 02431 Masala, Finland
2
Department of Forest Resource Management, University of Helsinki, Latokartanonkaari 7, 00014 Helsinki, Finland
*
Author to whom correspondence should be addressed.
Remote Sens. 2010, 2(6), 1481-1495; https://0-doi-org.brum.beds.ac.uk/10.3390/rs2061481
Submission received: 15 April 2010 / Revised: 20 May 2010 / Accepted: 24 May 2010 / Published: 2 June 2010

Abstract

:
Approaches to deriving forest information from laser scanner data have generally made use of two methods: the area-based and individual tree-based approaches. In this paper, these two methods were evaluated and compared for their abilities to predict forest attributes at the plot level using the same datasets. Airborne laser scanner data were collected over the Evo forest area, southern Finland, with an averaging point density of 2.6 points/m2. Mean height, mean diameter and volume were predicted from laser-derived features for plots (area-based method) or tree height, diameter at breast height and volume for individual trees (individual tree-based method) using random forests technique. To evaluate and compare the two forest inventory methods, the root-mean-squared error (RMSE) and correlation coefficient (R) between the predicted and observed plot-level values were computed. The results indicated that both area-based method (with an RMSE of 6.42% for mean height, 10.32% for mean diameter and 20.90% for volume) and individual tree-based method (with an RMSE of 5.69% for mean height, 10.77% for mean diameter and 18.55% for volume) produced promising and compatible results. Increase in point density is expected to increase the accuracy of the individual tree-based technique more than that of the area-based technique.

1. Introduction

Airborne laser scanning (ALS) is an active remote-sensing technique that provides three-dimensional (3D) high-precision measurements of targets in the form of a point cloud (x,y,z, intensity of the backscattered power), based on laser-ranging measurements supported by the position and orientation information derived with use of a differential Global Positioning System (dGPS) device and an inertial measurement unit (IMU) [1,2]. Rapid technical advances in laser scanning currently make ALS one of the most promising technologies for the retrieval of detailed information on forests at different levels, i.e., from the individual tree to the plot/stand and nationwide. ALS data has proven superior to the other main optical data used in forest measurements [3].
Approaches to deriving forest information from laser scanner data can be mainly divided into two groups: area-based (or distribution-based) and individual tree-based approaches [4]. In area-based methods, quantiles (percentiles) and other nonphysical distribution-related features of reflected laser canopy height are used to predict forest characteristics, such as mean tree height, mean diameter, basal area, volume and biomass, at the plot or stand level or for other areas of interest, typically using regression, discriminant analysis or nonparametric estimation techniques. Establishment of the estimation methods is strongly based on accurate field data. Previous studies have indicated that mean height [e.g., 5,6,7], basal area [e.g., 7,8,9], mean volume [e.g., 9,10,11,12,13,14] and biomass [15] can be accurately predicted with area-based methods. For example, Means et al. [9] used height percentiles and canopy cover percentiles in the estimation of stand height, stand volume and basal area in forests dominated by Douglas-fir, with tree heights ranging from 7 to 52 m. Regression models produced a coefficient of determination (R2) of 0.93, 0.97 and 0.95 for mean height, stand volume and basal area, respectively. Næsset and Økland [16] used canopy height percentiles, maximum and mean values and coefficients of variation to predict mean tree height with a standard error of 7.6% (1.5 m). Wallerman and Holmgren [17] used the most similar neighbors (MSN) technique to estimate mean stem density and volume for stands dominated by Norway spruce, Scots pine and birch in Sweden with ALS data and optical satellite image data. They reported relative root-mean-squared errors (RMSEs) of 22% for mean stem density and 20% for mean volume. Lim and Treitz [15] estimated total biomass in unevenly aged, mature to overmature, tolerant hardwood forest, based on different canopy-based quantile estimators, and reported R2 between 0.83 and 0.90 and RMSE between 48 and 67 Mg/ha.
If the number of laser pulses is increased to about 5–10 measurements per m2, it is also possible to recognize individual trees [18,19,20,21,22]. Kaartinen and Hyyppä [23] found that two points per m2 were adequate for older tree modeling with good accuracy. The basic principle of the individual tree-based method is to measure tree height, crown dimensions and tree species information from each individual tree and to derive other individual tree attributes, mainly based on these three physical parameters, such as volume, biomass, diameter-at-breast height (DBH) and age, using existing models and statistical techniques. The attributes are then aggregated at the required level (groups of trees, plots, stands). Since tree height and crown diameter may be underestimated by laser measurements [e.g., 21,22,23,24], it is good practice to calibrate the laser-derived metrics with field measurements [6,25]. Bortolot and Wynne [26] used a stepwise multiple linear regression to find an equation form for predicting biomass using laser-derived tree counts and heights at the individual tree level. When the model developed was applied to new data, correlation between the actual and predicted aboveground biomass ranged between 0.59 and 0.82, and RMSEs between 13.6 and 140.4 t/ha. Hyyppä and Inkinen [22] demonstrated that high-density laser measurements were useful for detecting individual trees and for deriving characteristics such as tree height, location and crown diameter. The tree height of the dominant storey was obtained with a standard error of less than 1 m. Mean tree height and volume were evaluated at the stand level with standard errors of 13.6% and 9.5% of the respective mean values. In [21], the local maximum technique was used to locate trees from a laser dataset acquired over deciduous, coniferous and mixed stands of varying age classes and settings typical of the southeastern United States. The results for estimating crown diameter were similar for both pines and deciduous trees, with R2 values of 0.62–0.63 for the dominant trees (RMSE 1.36–1.41 m). The crown diameter measured improved the R2 values for volume and biomass estimation by up to 0.25 for both pine and deciduous plots, while the RMSE improved by up to 8 m3/ha for volume and 7 Mg/ha for biomass. For the pine plots, the average crown diameter alone explained 78% of the variance associated with biomass (RMSE 31.28 Mg/ha) and 83% of the variance for volume (RMSE 47.90 m3/ha). Morsdorf et al. [27] demonstrated an individual tree detection method, using cluster analysis over a site forming part of the Swiss National Park. Tree position, height and crown diameter were derived from the segmented clusters and compared with field measurements. A robust linear regression of 917 tree height measurements yielded an adjusted R2 of 0.92. Lee and Lucas [28] used a height-scaled crown openness index, which provided a quantitative measure of the relative penetration of laser pulses into the canopy, for individual tree detection and predicting the tree height over mixed-species woodlands and open forest near Injune, Australia; an RMSE of 2.25 m was achieved for tree height. Maltamo et al. [29] used k-MSN techniques to predict both basic tree attributes and characteristics describing tree quality and achieved RMSEs of better than 10% in most cases.
Both area- and individual tree-based methods have advantages and disadvantages. Individual tree-based methods require higher pulse density laser data for individual tree detection. As a result, the cost for data acquisition is also higher. As a reward, more detailed information can be provided by individual tree-based methods and can be aggregated to a higher level later on as requested. To establish the relationship between laser-derived features and forest parameters in the area-based methods, considerable amounts of field measurements are needed as compared with field measurements for calibration in the individual tree-based method. Which method to use is dependent on the need for scale and accuracy of the forestry information and available point density of the laser data.
Although many studies used these methods for predicting forest characteristics, few were carried out to compare their abilities to predict forest attributes under the same conditions and using the same data and modeling technique. Here, we evaluate and compare these two methods for their accuracy and ability to predict forest attributes, i.e., mean height, mean diameter and mean volume at the plot level, from laser-derived features. A novel method (random forests) was used to develop the relationship between laser features and forest characteristics. Evaluation was performed by comparing the observed and predicted data over 69 sample plots.

2. Materials

2.1. Study Area

The 5 × 5-km study area is situated in Evo, southern Finland which belongs to the southern Boreal Forest Zone. It consists mainly of approximately 2,000 ha of managed boreal forest having an average stand size slightly less than 1 ha [30]. The topography of the area varies from 125 m to 185 m above sea level. Scots pine (Pinus sylvestris) and Norway spruce (Picea abies) are the dominant tree species in the study area, contributing 40% and 35% of the total volume, respectively [30]. The percentage of deciduous trees is 24% of the total volume.

2.2. Field Measurements

Field measurements were undertaken in summer 2007 and 2008 on 69 circular plots with 10-m fixed radii. Sampling of the field plots was based on prestratification of existing stand inventory data. All trees having a DBH of over 5 cm were tallied and tree height, DBH, lower limit of living crown, crown width and species were recorded. The tree volumes were calculated with standard Finnish models [31]. The plot-level data were obtained by averaging or summing the tree data. The descriptive statistics of the plots are summarized in Table 1.
Tree locations were calculated using the geographic coordinates of the plot centers and the direction and distance of trees relative to the plot center. The plot centers were measured with a Trimble GEOXM 2005 Global Positioning System (GPS) device (Trimble Navigation Ltd., Sunnyvale, CA, USA), and the locations were postprocessed with local base station data, resulting in an average error of approximately 0.6 m [30]. Tree heights were measured using Vertex clinometers. DBH was measured with steel calipers.
Table 1. Statistical summary of plot attributes.
VariableMinMaxMeanStandard deviation
Mean tree height (m)10.029.518.23.9
Mean DBH (cm)10.626.217.63.5
Volume (m3/ha)59.4507.6235.788.3

2.3. Airborne Laser Data

The ALS data were collected in midsummer 2006, using an Optech ALTM3100C-EA system operating at a pulse rate of 100 kHz. The data were acquired at a flight altitude of 800 m, resulting in an average point density of 2.6 (ranging from 1.8 to 3.4) laser hits per m2 in nonoverlapping areas and a footprint of 70 cm in diameter. The system was configured to record multiple returns per pulse, i.e., first or only, last, and intermediate.
The ALS data were first classified into ground or nonground points using the TerraScan based on the method explained in [32]. A digital terrain model (DTM) was then calculated using classified ground points. Laser heights above the ground (normalized height or canopy height) were calculated by subtracting the ground elevation from the corresponding laser measurements. Canopy heights greater than 2 m were considered as returns from vegetation and used for tree or plot feature extraction.

3. Methodology

3.1. Area-Based Method

In the present study, the area-based method used the canopy height or vertical distribution of laser returns for estimating plot-level forest inventory parameters (e.g., mean height, mean DBH, and volume). The first laser returns within each plot were extracted. Then descriptive features (e.g., max., mean and standard deviation) were derived individually per plot from the normalized point height for the vegetation points of the first returns. The features derived from laser data are maximum height, mean height calculated as the arithmetic mean of laser heights, standard deviation of laser heights, coefficient of variation, penetration computed as the proportions of ground hits to total number of hits, percentiles calculated from 0% to 100% of canopy height distribution at 10% intervals and canopy cover percentiles expressed as the proportion of first returns below a given percentage of total height from 10% to 90% of the heights with 10% intervals. Plot-level characteristics were estimated based on these features and by the random forests approach, which is a nonparametric regression technique (see Section 3.3) [33]. A summary of plot features is given in Table 2.

3.2. Individual Tree-Based Method

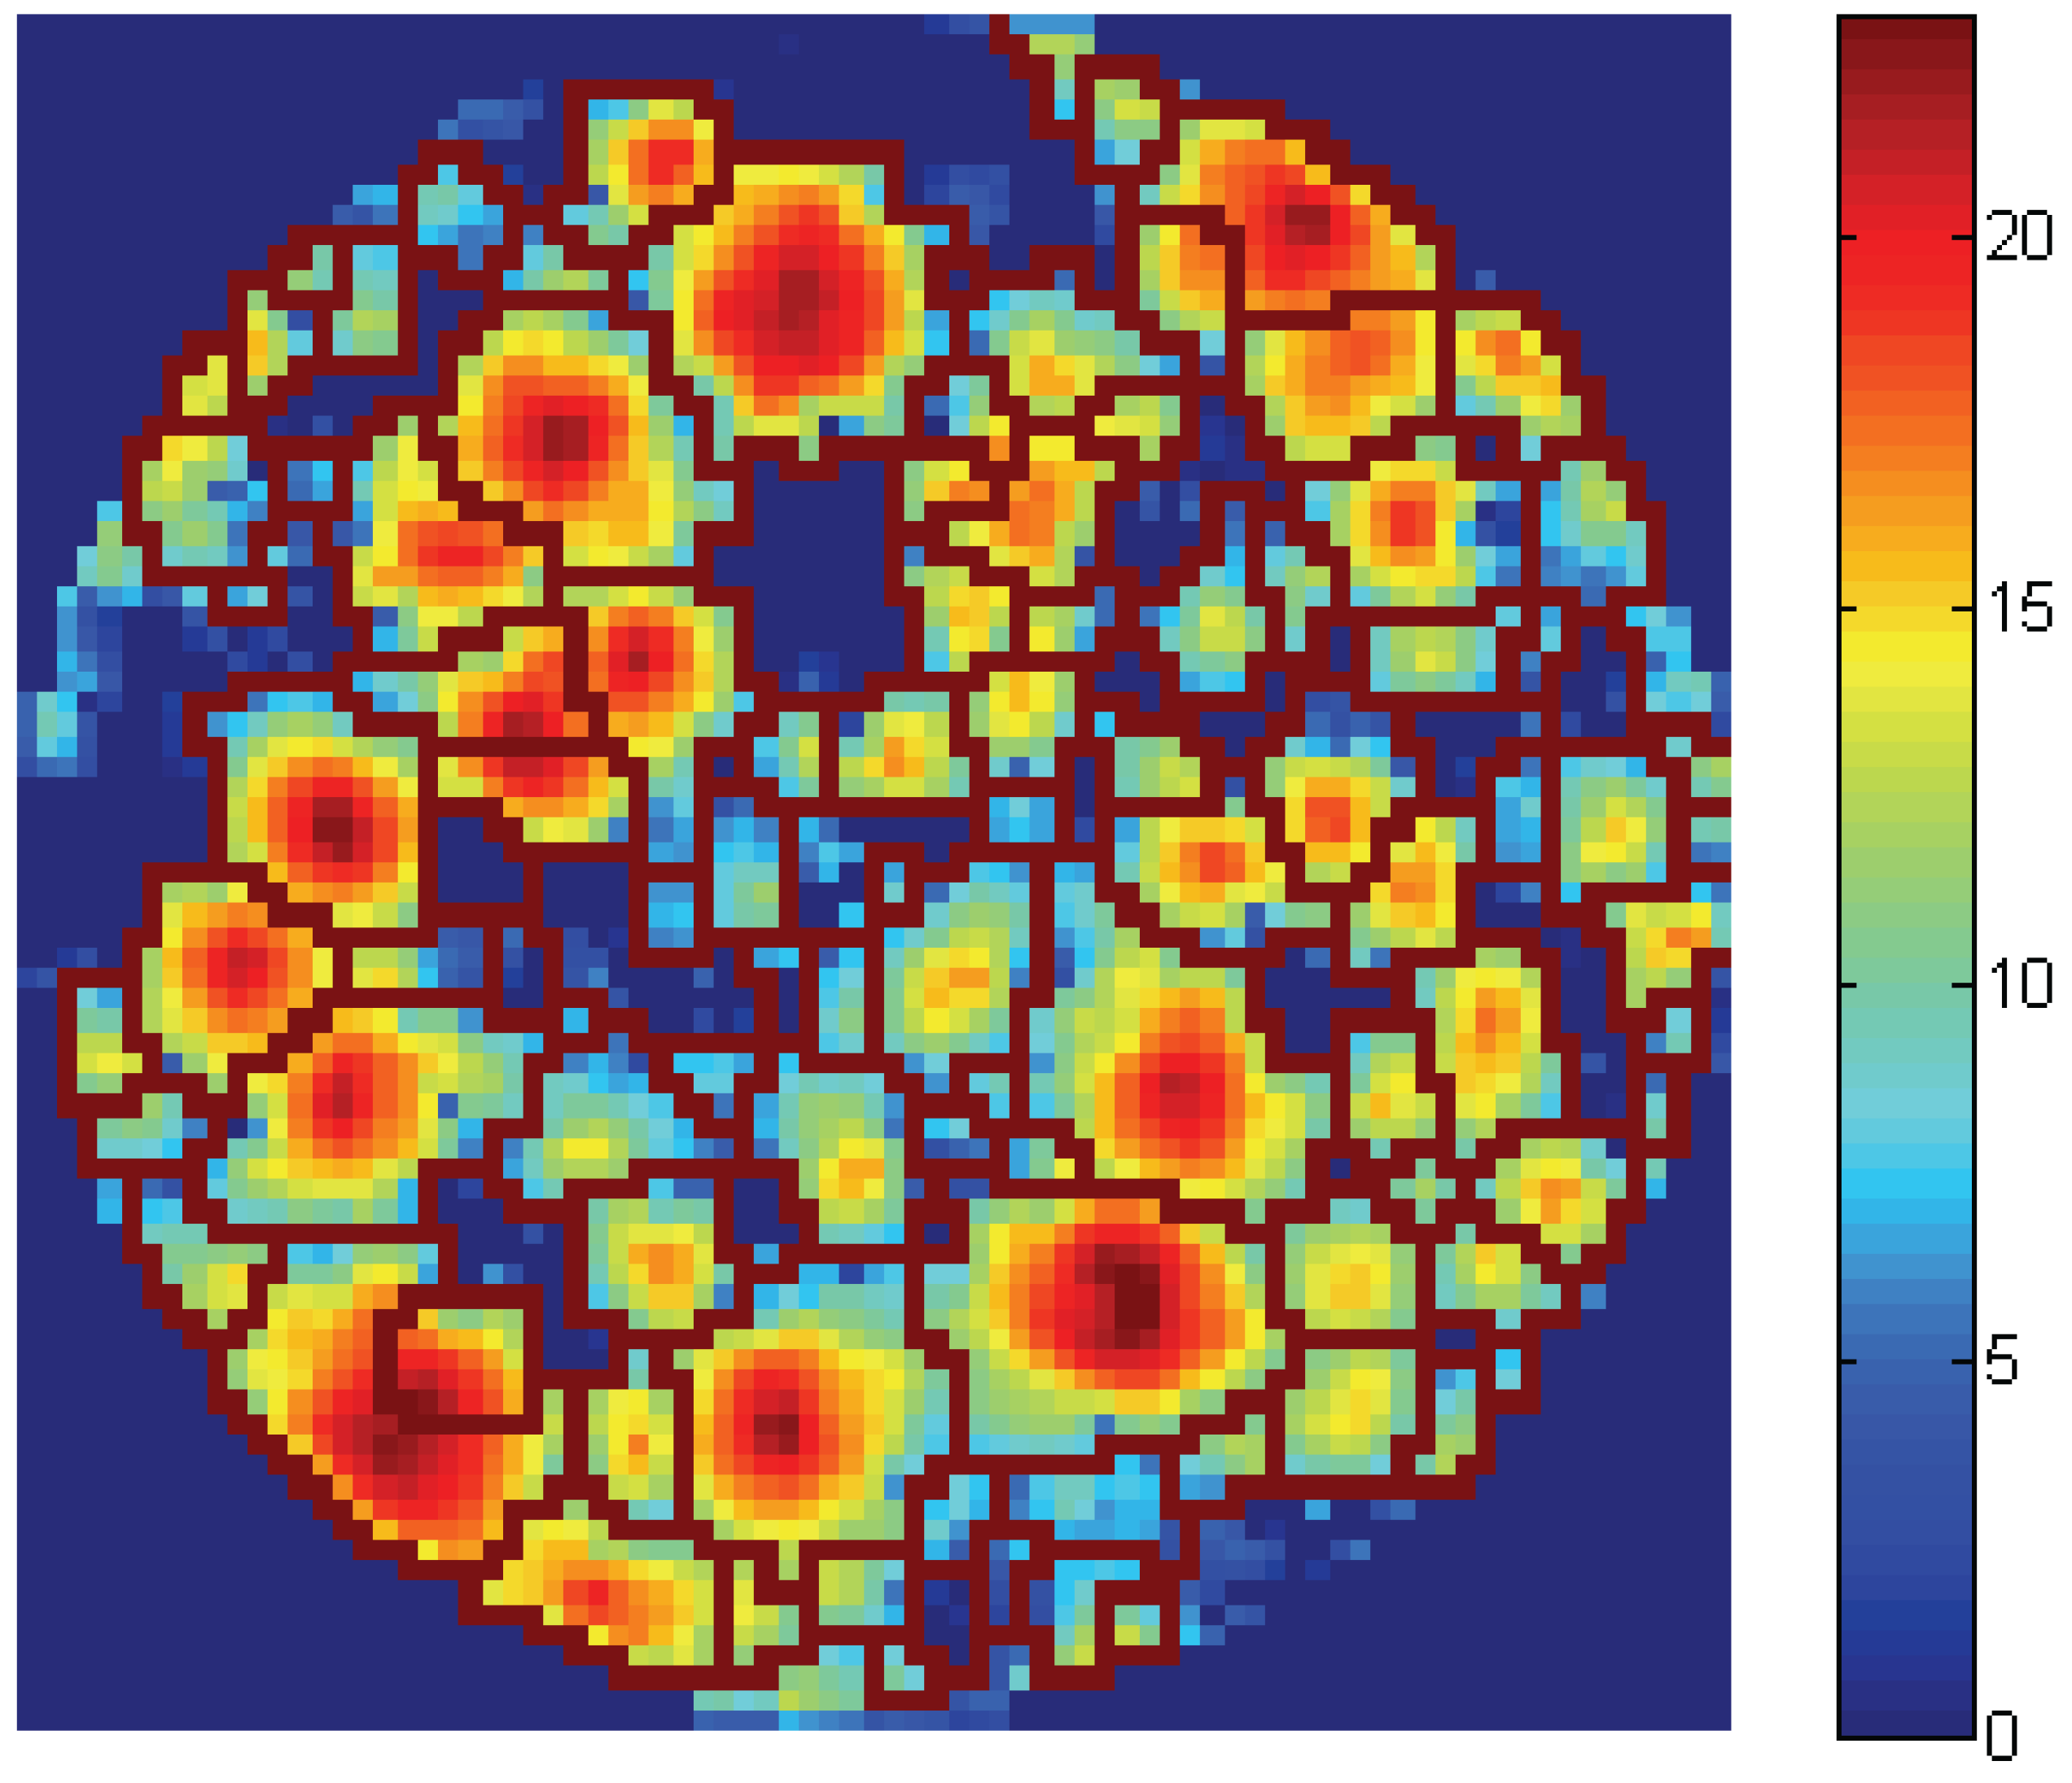
3.2.1. Individual Tree Delineation

Individual tree-based methods rely on detecting individual trees, constructing their geometry (e.g., tree height, crown shape) and deriving characteristics such as stem volume and stem diameter, based on geometry and other statistical variables. An individual tree detection method was developed consisting of the following steps:
  • A raster canopy height model (CHM) was created from normalized canopy height data for each plot by taking the maximum values within 0.5 × 0.5-m cells.
  • The CHM was smoothed with a Gaussian filter to remove small variations on the crown surface. The degree of smoothness was determined by the value of the standard deviation (Gaussian scale) and kernel size (5 × 5 pixels) of the filter.
  • Minimum curvature, one of the principal curvatures, was calculated from the smoothed CHM. For a surface such as that of the CHM, a higher value of minimum curvature describes the treetop.
  • The smoothed CHM image was then scaled based on the computed minimum curvature resulting in a smoothed, yet contrast-stretched image.
  • Local maxima were then searched in a given neighborhood (3 × 3 windows). They were considered as treetops and used as seeds in the following marker-controlled watershed transformation for tree crown delineations.
Figure 1 demonstrates one example of individual tree delineation. During the segmentation processes, the tree crown shape and location of individual trees were determined. Each segment was considered to present a single tree crown. Laser returns falling within each individual tree segment were extracted and used for deriving tree features. In total, 26 features were generated from the first returns. They are arithmetic means of laser heights, standard deviation of heights, heights range, crown area, crown volume as convex hull in 3D, percentiles calculated from 0% to 90% of canopy height distribution for tree with 10% interval, maximum laser height, maximum crown diameter and canopy cover expressed as percentages of returns below a certain height (e.g., 10% to 90% of total height). A summary of individual tree features is given in Table 2.
Figure 1. Individual tree detection for a single sample plot showing a CHM [m] overlaid with derived tree crown segments.
Remotesensing 02 01481 g001
Instead of using the existing models, individual tree DBH and stem volume were predicted based on these laser-derived features using the same nonparametric method (see Section 3.3) as the area-based method. Tree height was also predicted with the same procedure, i.e., tree height was predicted based on all tree features instead of using only maximum laser height as predictor in a linear regression. The plot-level characteristics were then computed by aggregating the value for trees in the plot.

3.3. Random Forests

Random forests (RF), a nonparametric regression method, was used for retrieval of forest parameters from laser-derived features for both the area-based and individual tree-based methods. RF was first developed as a classifier consisting of a collection of decision trees [33,34], but it is also used for solving regression problems. For regression, the RF prediction is obtained by aggregating regression trees, each constructed using a different random sample set of the training data, and choosing splits of the regression trees from subsets of the available features, randomly chosen at each node. We used RF to construct the prediction models because it works well when many features are available and no variable selection procedures are needed. To briefly describe the algorithm: RF is a collection of regression trees. A regression tree is built based on bootstrap samples selected randomly from a training dataset. A random set of attributes is then chosen from laser features and the best feature is selected for splitting in each node until it grows into a proper tree, i.e., all leaf nodes are either too small to split or are homogeneous. The interested reader is encouraged to read further [33,34].
Table 2. Summaries of features extracted for plots and individual trees.
Plot featuresIndividual tree features
Maximum heightMaximum height
Mean heightMean height
Standard deviationStandard deviation
Coefficient of variationHeight range
PenetrationCrown area
Height percentiles (0% to 90%)Crown volume
Canopy cover percentiles (10% to 90%)Maximum crown diameter
Height percentiles (0% to 90%)
Canopy cover percentiles (10% to 90%)

3.4. Accuracy Assessment

In the area-based method, the candidate predictors were 23 plot features derived from the ALS data. The response variables were the mean height, mean diameter and volume at the plot level. The random forests model was obtained by aggregating 60 regression trees, with five features tried at each split. The model built was then applied for prediction of data not in the bootstrap sample (they are called out-of-bag samples which are about one third of the total samples and act as testing data). For example, among 69 plots, 46 plots were used for training and the rest of 23 plots for testing each time when a regression tree was built. RMSEs between the predicted and observed values for the out-of-bag samples were used as a measure for error estimates and correlation coefficient (R) as a measure for goodness of the modeling.
In the individual tree-based method, laser-detected individual trees were first matched to those measured in the field by a method described in [35]. The method is based on a modified Hausdorff distance to find the closest corresponding trees in a 3D space. Matched trees were used for training the prediction models based on the same procedure as in the area-based method with 26 tree features as candidate predictors and tree height, DBH and stem volume as response variables. The tree attributes were then estimated for all trees. Plot-level estimates for mean height, mean diameter and mean volume were calculated by aggregating the data for individual trees in the plot and compared with field data. RMSEs and Rs between the estimated and observed values were computed.

4. Results

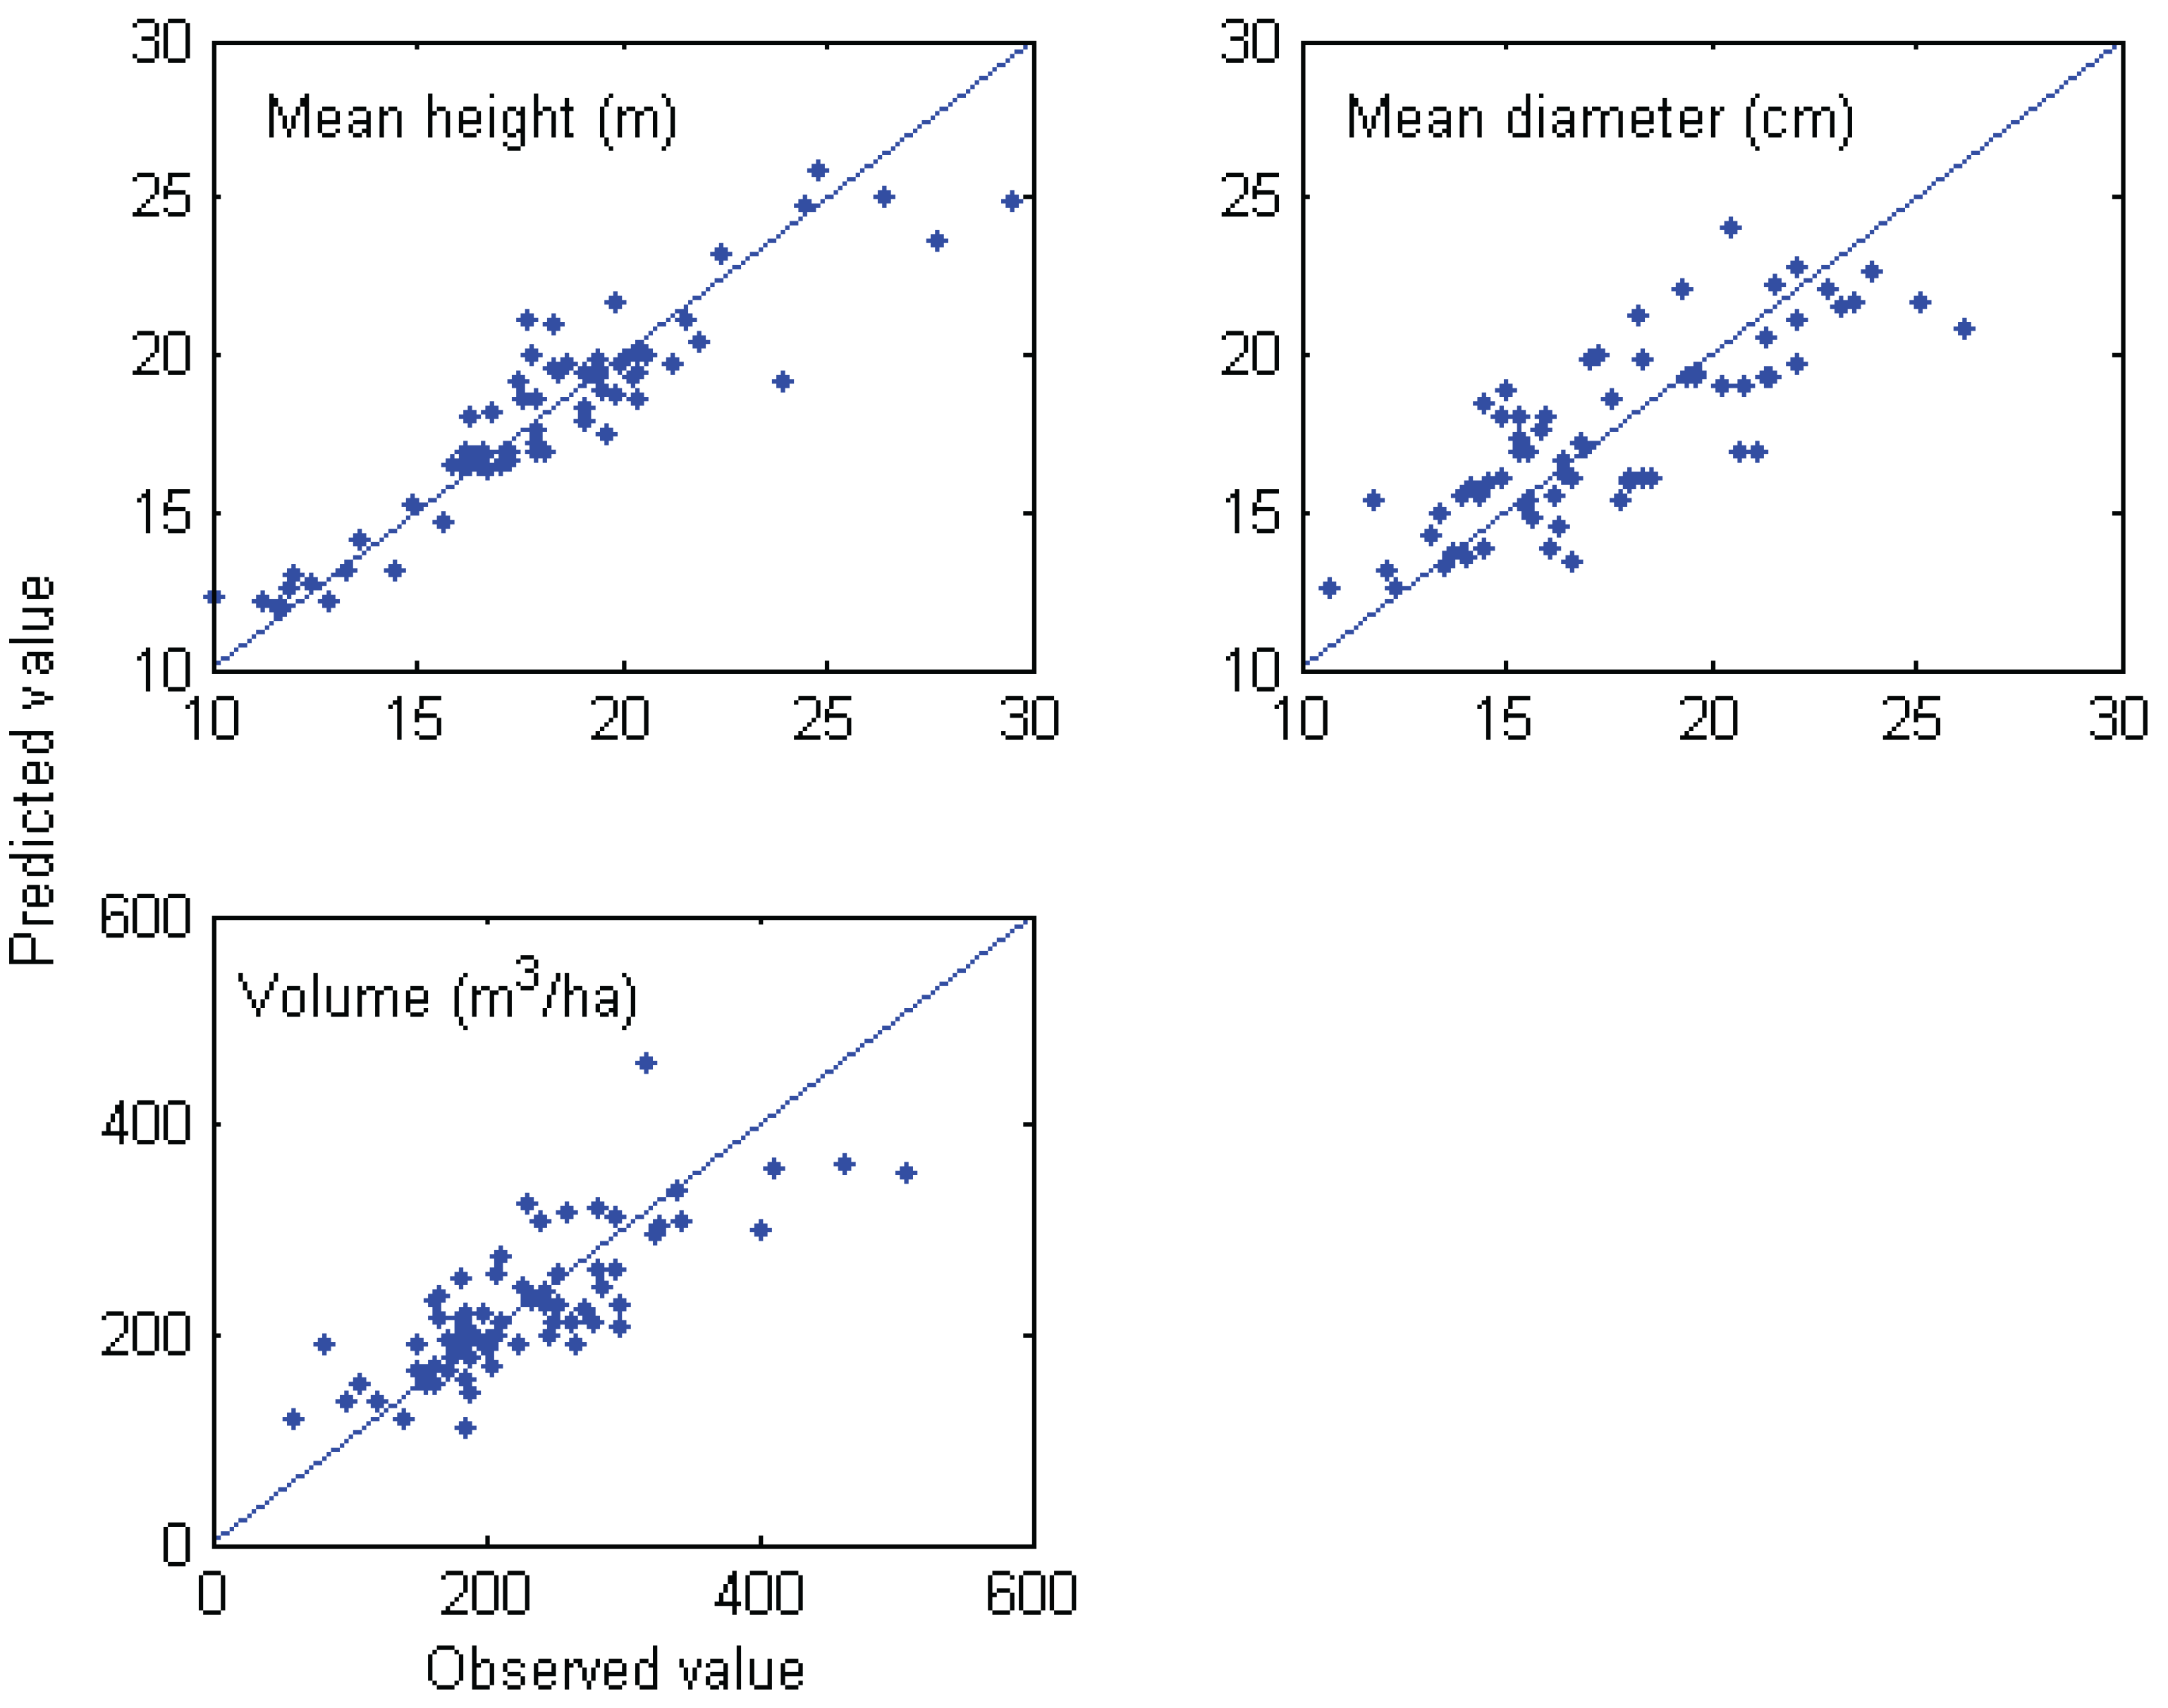
4.1. Area-Based Prediction

Predictions of plot-level variables with the random forests approach and the area-based method were compared with the corresponding field-measured data for 69 plots. Figure 2 shows the scatter plots of the predicted versus reference values for mean height, mean diameter and mean volume. Mean height was estimated with an RMSE of 6.42% and a correlation coefficient of 0.94. For mean diameter estimation, the corresponding values were 10.32% and 0.84, respectively, and for mean volume 20.9% and 0.79. The level of estimation errors was compatible with the field measurements.
Figure 2. Reference values vs. predicted values for mean height, mean diameter and volume using the area-based method.
Remotesensing 02 01481 g002

4.2. Individual Tree-Based Prediction

Based on the results of individual tree detection and matching with field-measured trees, the matching rate for 69 plots ranged from 43% to 96%, with a mean of 69%. To investigate the effect of the tree detection on the results, different schemes for aggregating plot-level attributes were adopted:
C1.
Matched field trees against matched laser trees,
C2.
All field trees against matched laser trees (those matched with field trees),
C3.
All field trees against all laser-detected trees,
C4.
Linear regression performed at the plot level with all detected trees against all field trees.
In case C1, we assumed that individual tree detection was perfect in that all field trees were matched with one and only one laser-detected tree, i.e., a 100% matching rate. Case C2 represents a situation in which the field trees were under-segmented; e.g., only taller trees were detected by laser and smaller trees were either integrated with a nearby taller tree or were undetectable by the laser measurements. In contrast to C2, all laser-detected trees, in case C3, were used in plot-level estimation, whether matched with a field tree or not, which is a more practical realization from the operational point of view. Due to the errors (under and over-segmentation) in tree detection, linear regressions were performed at the plot level to calibrate the errors caused by tree detection (C4), which makes results more comparable to the area-based method.
Table 3 summarizes the results for these four cases. The results suggested that the estimates varied significantly, depending on the individual tree detection results and calibration applied, especially for the characteristics obtained by summing the individual tree data. If tree detection was perfectly done (C1), RMSEs of 4.42% for mean height, 7.21% for mean diameter and 15.35% for mean volume could be achieved. In general, R between the observed and predicted plot-level attributes were over 0.9 for mean heights, 0.8 for mean diameters and 0.75 for mean volumes, and RMSE of under 10% for mean heights, 13% for mean diameters, and 35% for mean volume, except in case C3.
Table 3. Correlation coefficients (R) and RMSEs of plot-level predictions with RF and individual tree-based methods.
RMSE (%)R
VariableC1C2C3C4C1C2C3C4
Mean height4.429.38.185.690.970.910.960.95
Mean diameter7.2112.0912.0010.770.940.840.840.84
Mean volume15.3533.6156.5218.550.950.760.850.85
Figure 3. Comparison of RMSEs and R for mean height, mean diameter and volume estimation, using area-based and individual tree-based methods.
Remotesensing 02 01481 g003

4.3. Comparison of Both Methods

The comparisons of both methods are graphically presented in Figure 3. If the same amount of field measurements were used in the prediction, both the area-based and individual tree-based methods produced similar result for mean diameter. The individual tree-based method gave slightly better results for mean height and mean volume (area-based vs. C4). With the individual tree-based method, the key issue is the accuracy of individual tree detection. If individual trees could be recognized accurately the prediction accuracy could be improved significantly, especially for volume (C1 vs. C3). If the most of the trees were identified, such as in case C2, we could obtain results that are compatible to those of the area-based method for mean height and mean diameter. Mean volume is influenced most by individual tree detection.
Figure 4. Scatter plot of stem number per plot versus matching rate.
Remotesensing 02 01481 g004

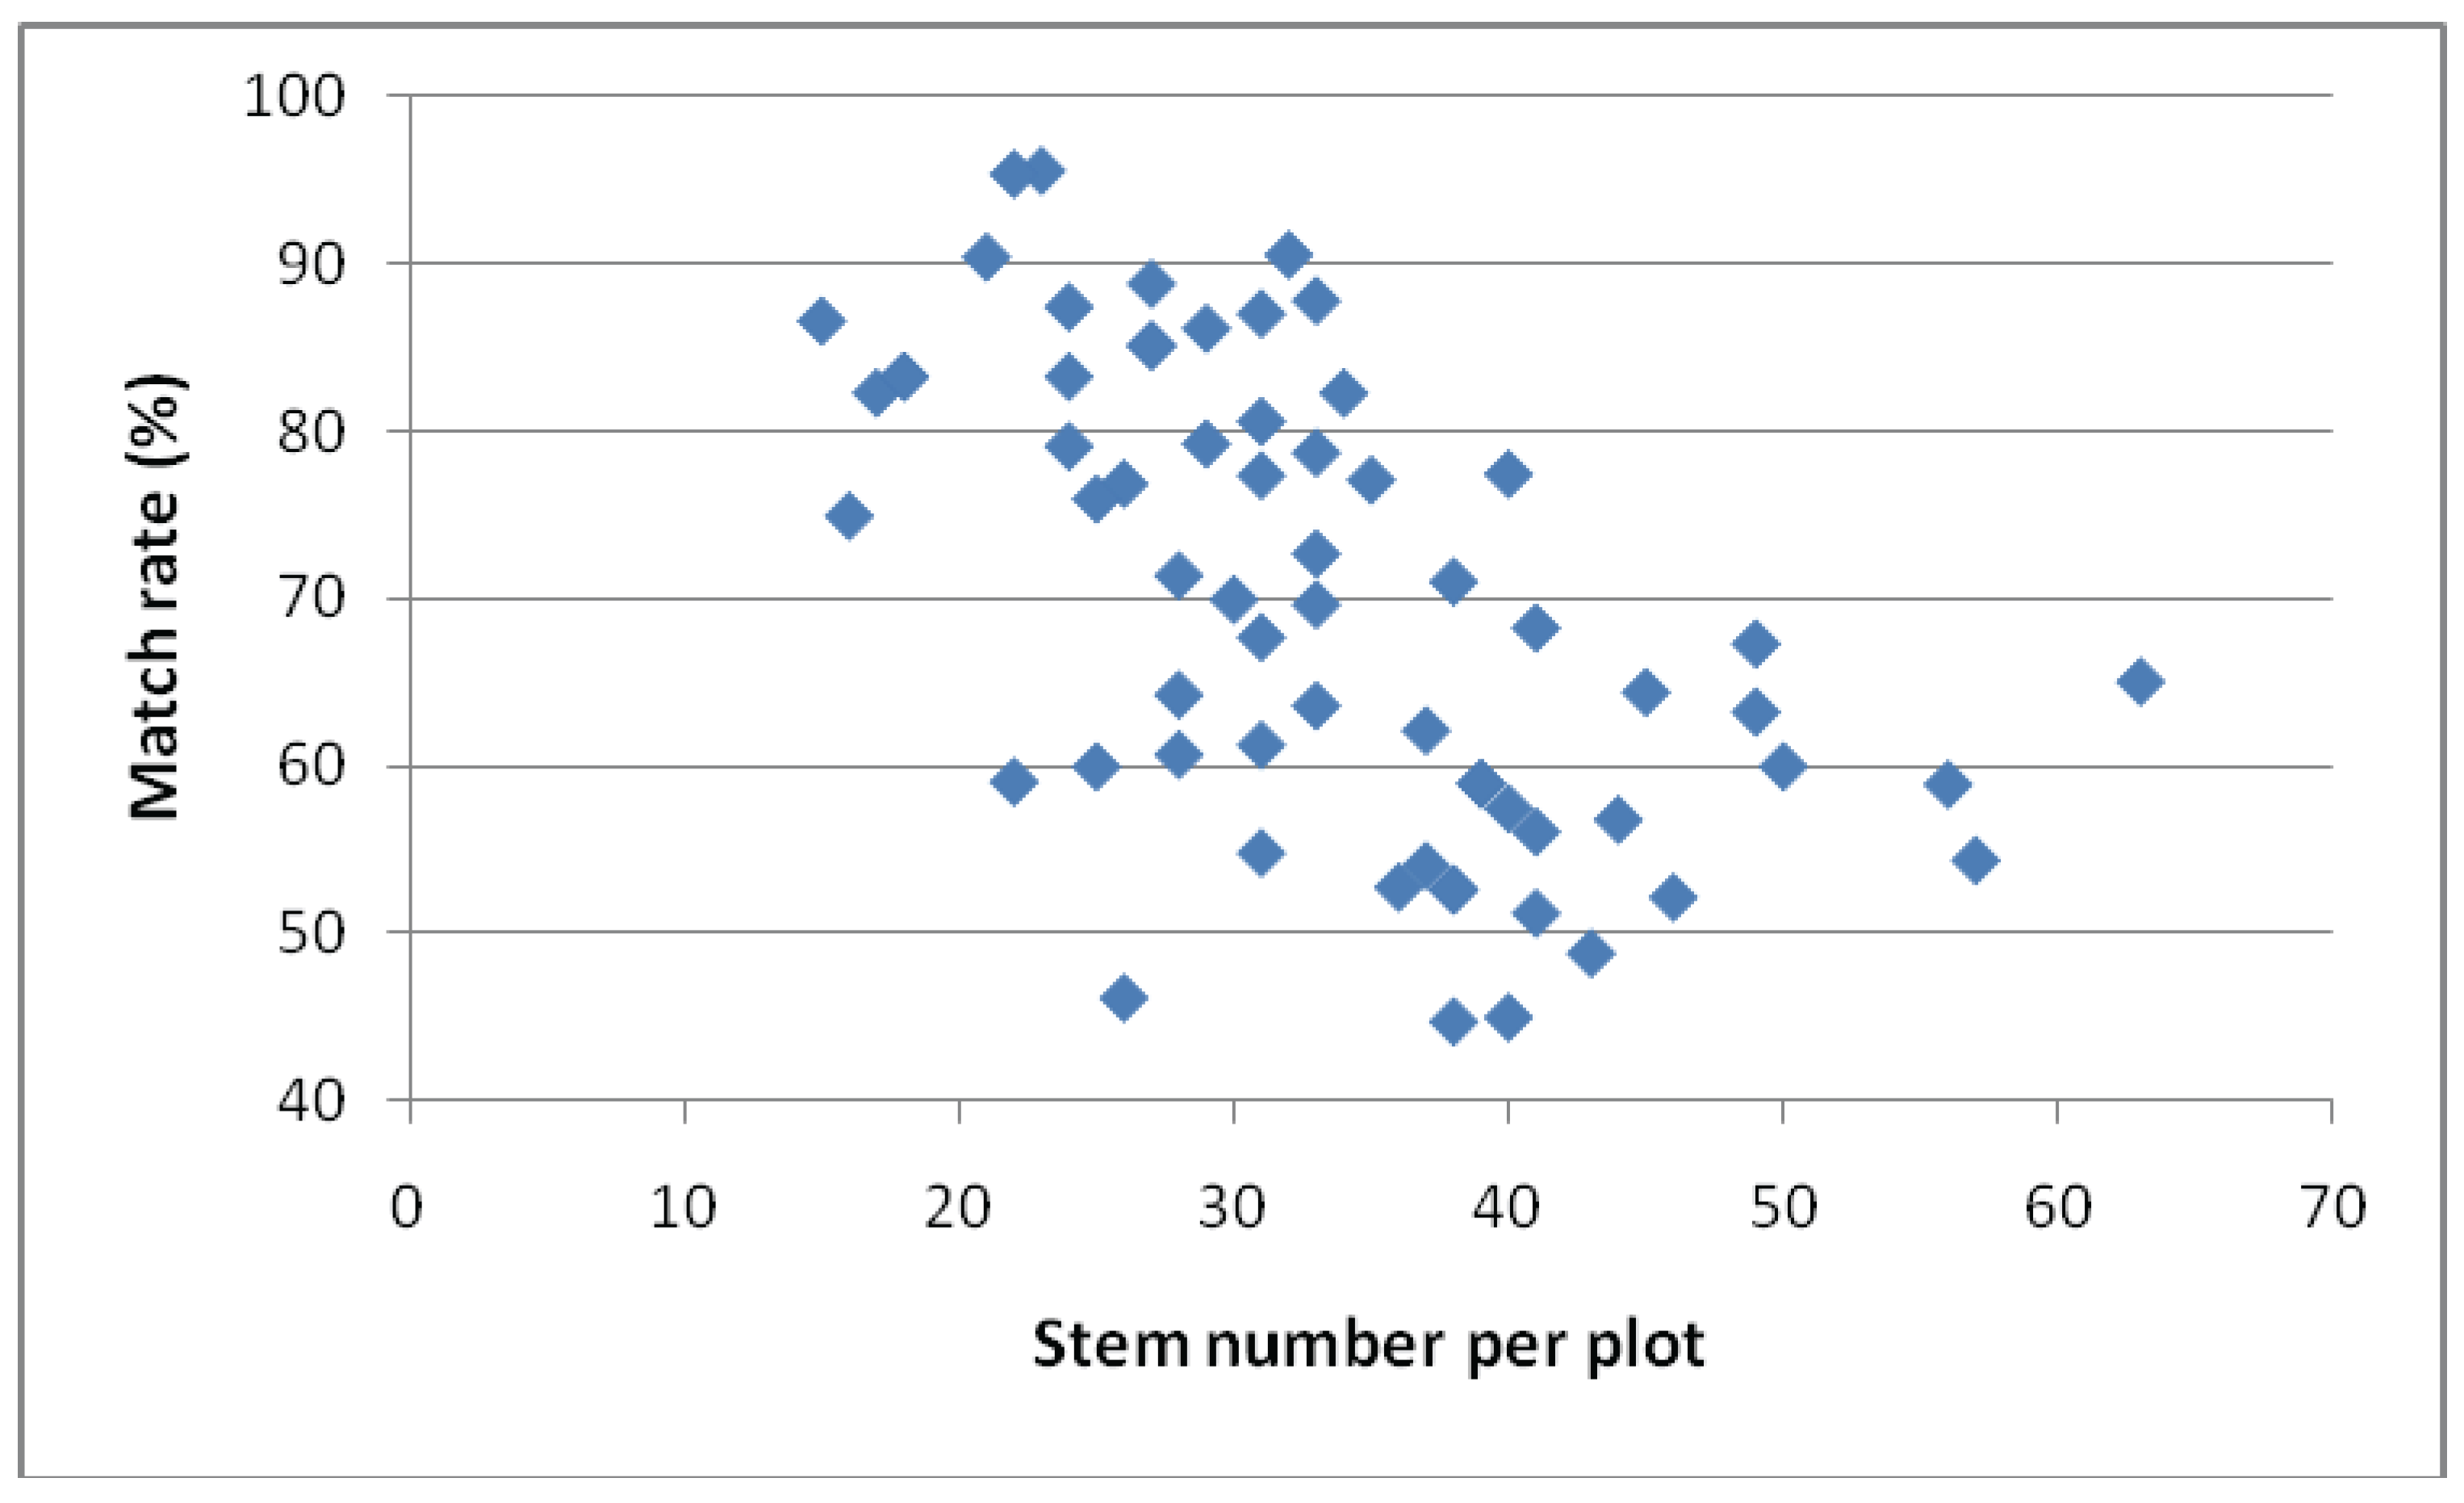
4.4. Effect of Individual Tree Detection

Since individual tree detection has significant impact on the estimation results, it needs further investigation to improve the performance of the individual tree-based method. We used three measures to evaluate individual tree detection accuracy in this study, i.e., matching rate and percentage of under- and over-segmentation. Under-segmentation describes those trees undetectable with the laser and over-segmentation presents trees that are nonexistent, e.g., due to splitting of larger trees. Figure 4 showed the matching rate as a function of stem number (plot density) in which a linear trend could be observed. As expected, the matching rate increased as the stem number decreased. Figure 5 demonstrated the relationship between the under-/over-segmentation and caused errors in estimates. As can be seen, errors in volume estimates increased with the increase in under- and over-segmentation. However the impact of under- and over-segmentation on estimates is different in magnitude. The error in estimates caused by under-segmentation ranged from −3% to 31% with a mean of 5% for mean height, from −15% to 27% with a mean of −1% for mean diameter and from 0 to 55% with a mean of 22% for mean volume. The errors in estimates caused by over-segmentation ranged from -9% to 11% with a mean of −1% for mean height, from −11% to 16% with a mean of −2% for mean diameter and from 12% to 161% with a mean of 53% for mean volume. Over-segmentation was a more serious problem than under-segmentation for volume estimates, while under-segmentation had more impact on mean height and mean diameter estimates in this study.
Figure 5. Estimation errors of mean height, mean diameter and mean volume caused by under-segmentation (upper panels) and over-segmentation (lower panels).
Remotesensing 02 01481 g005

5. Discussion and Conclusions

Two widely used methods for predicting forest attributes were evaluated and compared based on laser-derived statistical and physical features. The test results suggested that similar accuracy was achieved with both methods for mean diameter and slightly better accuracy for mean height and volume using the individual tree-based method. The individual tree-based method gave varying results, depending on the accuracy of individual tree detection and applied calibration. Regardless of the difference in accuracy, both methods gave very promising results in estimating the plot-level attributes.
It is worth mentioning that the point density of the laser data in this study is not high. Therefore individual tree detection cannot be done in an optimal way with such data, but it is higher than that (e.g., one point/m2) applied in conventional area-based methods. If the point density of laser data can be increased, e.g., by over five points per m2, individual tree detection will probably be improved and thus also plot-level estimates of forest attributes based on the individual tree method. Another factor that could influence the results of the individual tree-based method is the fact that plots in the study area had a more complex structure, which increases the difficulties in tree detection.
The key issue with individual tree-based method is the accuracy of individual tree detection. The reason for the varying results based on the individual tree method is mainly due to the inaccuracy in individual tree detection. Firstly, the laser can’t see all the trees from above, so the smaller trees and/or understory vegetation cannot be detected or merged with nearby trees [36], causing under-segmentation. On the other hand, some trees with larger branches may be identified as two or more segments (trees), causing over-segmentation in tree detection. Both under- and over-segmentation can cause errors in plot-level estimates based on the individual tree method. However, under- and over-segmentation behave differently with respect to plot-level estimates. Under-segmented plots tend to produce more accurate results than those that are over-segmented. This can be explained by the fact that under-segmentations normally occur when smaller trees merge with nearby larger trees or when trees with similar height grow closely, while over-segmentations usually occur when larger trees with unsmooth crowns split into two or more segments. In this study, the tree segmentation algorithm tended to merge smaller trees and to split taller trees with larger crowns. This may suggest that a multi-scale approach could be adapted in the tree detection algorithm to detect trees of different sizes. Secondly, the accuracy of individual tree detection was also influenced by plot structure. Plots dominated by coniferous trees produced higher detection rates and lower error rates than plots dominated by deciduous trees or mixed plots. Denser plots also give less accurate results than sparse plots.
Additionally, in the individual tree-based method, a bias could result from the fact that only matched trees were used for training as most of them were dominant ones which were not representatives of the stem distribution. However, the problem could be partially compensated by using larger number of matched trees for training (over 1,400 in this study).
One advantage of the individual tree-based method over the area-based method is that at least a major part of the stem distribution can be derived directly from the individual tree detection. Smaller-sized trees, which are often undetectable, can be taken into account using theoretical stem distributions [e.g., 37]. In addition, individual tree detection in multitemporal studies would be required for detailed mensuration of tree growth and input data for various growth and biomass models. Furthermore, the individual tree-based method provides the possibility to develop species-specific models which could lead to more accurate stand-level estimation particularly for mixed stands.
One challenge with individual tree-based methods is how to calibrate the plot-level estimates caused by errors in tree detection. In this study, the solution was to apply a simple linear regression. The other alternatives need to be studied, e.g., use stem distribution information to take into account trees obscured in the ALS data. The results also confirmed that the individual-tree method, without calibration at plot level, did not result in acceptable accuracy (case C3) using present state-of-the-art tree finding algorithms in boreal forests. Thus, methods combining the complementary features of original area-based and individual tree-based methods are expected to yield highest accuracy.
From the economic point of view, the area-based method is more efficient both in computation and laser data acquisitions. Normally, low-point-density data are sufficient for deriving accurate estimates at the plot/stand level. However, larger amounts of field measurements are required to establish the relationship between laser-derived features and forest characteristics, because the accuracy of area base estimates is largely dependent on the amount and accuracy of field measurements. With the individual tree-based method, individual trees need to be identified and processed, so it is computationally more expensive. Furthermore, higher point-density data are preferable for more accurate individual tree detection, because the accuracy of the estimates is highly dependent on the accuracy of individual tree detection, thus increasing the data acquisition costs. Accurate field measurements are also needed for calibrating/establishing the prediction model both at the tree level and plot level, which are not conventionally done with individual tree-based methods.
In the present study, RF was used to build prediction models for both methods to eliminate the effects caused by the method applied and make the results comparable since, with random forests, no standard models were needed for prediction. All plot/tree attributes were estimated based on the plot/tree features derived from ALS data. However, it’s worth noting that plot and tree features could show different reliability (plot features are more accurately described than tree features). The difference between them could influence the results obtained by individual tree- and area-based methods.
Due to high acquisition costs, only the area-based methodology has been utilized in practical applications so far. However, given the fact that high-density laser data will be available at increasingly lower prices, individual-tree-based methods when incorporated with terrestrial laser scanning and logging machine measurements would pave the way for ‘precision forestry’, in which forest resource monitoring could be carried out at the single-tree level. Forests will eventually be continuously (e.g., at 10 year intervals) surveyed using laser scanners, enabling the use of change detection techniques (e.g., [36]) together with single-time survey techniques tested here.
It should be noted, based on this paper, we cannot draw a final conclusion as to which method is the most feasible for operational forest inventory. Different costs, output quality and capacity to provide stem diameter distributions will lead to the conclusion that one method is more feasible than the other for different forestry applications.

Acknowledgements

Financial support from the Academy of Finland (projects “Improving forest supply chain by means of advanced laser measurements” and “Forest Tomography”) is gratefully acknowledged.

References

  1. Baltsavias, E.P. Airborne Laser Scanning: Basic Relations and Formulas. ISPRS J. Photogramm. Remote Sens. 1999, 54, 199–214. [Google Scholar] [CrossRef]
  2. Wehr, A.; Lohr, U. Airborne Laser Scanning—An Introduction and Overview. ISPRS J. Photogramm. Remote Sens. 1999, 54, 68–82. [Google Scholar] [CrossRef]
  3. Hyyppä, H.; Hyyppä, J. Comparing the Accuracy of Laser Scanner with Other Optical Remote Sensing Data Sources for Stand Attribute Retrieval. The Photogramm. J. Fin. 1999, 16, 5–15. [Google Scholar]
  4. Hyyppä, J.; Hyyppä, H.; Leckie, D.; Gougeon, F.; Yu, X.; Maltamo, M. Review of Methods of Small-Footprint Airborne Laser Scanning For Extracting Forest Inventory Data In Boreal Forests. Int. J. Remote Sens. 2008, 29, 1339–1366. [Google Scholar] [CrossRef]
  5. Holmgren, J. Prediction of Tree Height, Basal Area and Stem Volume in Forest Stands Using Airborne Laser Scanning. Scand. J. For. Res. 2004, 19, 543–553. [Google Scholar] [CrossRef]
  6. Magnussen, S.; Boudewyn, P. Derivations of Stand Heights from Airborne Laser Scanner Data with Canopy-Based Quantile Estimators. Can. J. For. Res. 1998, 28, 1016–1031. [Google Scholar] [CrossRef]
  7. Næsset, E. Forest Stand Characteristics with Airborne Scanning Laser Using a Practical Two-Stage Procedure and Field Data. Remote Sens. Environ. 2002, 80, 88–99. [Google Scholar] [CrossRef]
  8. Lefsky, M.A.; Harding, D.; Cohen, W.B.; Parker, G.; Shugart, H.H. Surface Lidar Remote Sensing of Basal Area and Biomass in Deciduous Forests of Eastern Maryland, USA. Remote Sens. Environ. 1999, 67, 83–98. [Google Scholar] [CrossRef]
  9. Means, J.E.; Acker, S.A.; Fitt, B.J.; Renslow, M.; Emerson, L.; Hendrix, C.J. Predicting Forest Stand Characteristics with Airborne Scanning Lidar. Photogramm. Eng. Remote Sens. 2000, 66, 1367–1371. [Google Scholar]
  10. Næsset, E. Estimating Timber Volume of Forest Stands Using Airborne Laser Scanner Data. Remote Sens. Environ. 1997, 61, 246–253. [Google Scholar] [CrossRef]
  11. Holmgren, J.; Nilsson, M.; Olsson, H. Estimation of Tree Height and Stem Volume on Plots Using Airborne Laser Scanning. For. Sci. 2003, 49, 419–428. [Google Scholar]
  12. Lim, K.; Treitz, P.; Wulder, M.; St-Onge, B.; Flood, M. LIDAR Remote Sensing of Forest Structure. Prog. Phys. Geog. 2003, 27, 88–106. [Google Scholar] [CrossRef]
  13. Maclean, G.A.; Krabill, W.B. Gross-merchantable Timber Volume Estimation Using an Airborne LIDAR System. Canad. J. Remote Sens. 1986, 12, 7–18. [Google Scholar] [CrossRef]
  14. Hollaus, M.; Wagner, W.; Schadauer, K.; Maier, B.; Gabler, K. Growing Stock Estimation for Alpine Forests in Austria: A Robust Lidar-based Approach. Canad. J. For. Res. 2009, 39, 1387–1400. [Google Scholar] [CrossRef]
  15. Lim, K; Treitz, P. Estimation of Above Ground Forest Biomass from Airborne Discrete Return Laser Scanner Data Using Canopy-Based Quantile Estimators. Scand. J. For. Res. 2004, 19, 558–570. [Google Scholar]
  16. Næsset, E.; Økland, T. Estimating Tree Height and Tree Crown Properties Using Airborne Scanning Laser in a Boreal Nature Reserve. Remote Sens. Environ. 2002, 79, 105–115. [Google Scholar] [CrossRef]
  17. Wallerman, J.; Holmgren, J. Estimating Field-Plot Data of Forest Stands Using Airborne Laser Scanning and SPOT HRG Data. Remote Sens. Environ. 2007, 110, 501–508. [Google Scholar] [CrossRef]
  18. Brandtberg, T.; Warner, T.A.; Landenberger, R.E.; McGraw, J.B. Detection and Analysis of Individual Leaf-Off Tree Crowns in Small Footprint, High Sampling Density Lidar Data from the Eastern Deciduous Forest in North America. Remote Sens. Environ. 2003, 85, 290–303. [Google Scholar] [CrossRef]
  19. Leckie, D.; Gougeon, F.; Hill, D.; Quinn, R.; Armstrong, L.; Shreenan, R. Combined High-Density Lidar and Multispectral Imagery for Individual Tree Crown Analysis. Canad. J. Remote Sens. 2003, 29, 633–649. [Google Scholar] [CrossRef]
  20. Persson, Å.; Holmgren, J.; Söderman, U. Detecting and Measuring Individual Trees Using an Airborne Laser Scanner. Photogramm. Eng. Remote Sens. 2002, 68, 925–932. [Google Scholar]
  21. Popescu, S.; Wynne, R.; Nelson, R. Measuring Individual Tree Crown Diameter with Lidar and Assessing Its Influence on Estimating Forest Volume and Biomass. Canad. J. Remote Sens. 2003, 29, 564–577. [Google Scholar] [CrossRef]
  22. Hyyppä, J.; Inkinen, M. Detecting and Estimating Attributes for Single Trees Using Laser Scanner. The Photogramm. J. Fin. 1999, 16, 27–42. [Google Scholar]
  23. Kaartinen, H.; Hyyppä, J. EuroSDR/ISPRS Project, Commission II “Tree Extraction”, Final Report; EuroSDR Official Publication No. 53; European Spatial Data Research: Dublin, Ireland, 2008. [Google Scholar]
  24. Gaveau, D.L.A.; Hill, R.A. Quantifying Canopy Height Underestimation by Laser Pulse Penetration in Small-Footprint Airborne Laser Scanning Data. Canad. J. Remote Sens. 2003, 29, 650–657. [Google Scholar] [CrossRef]
  25. Rönnholm, P.; Hyyppä, J.; Hyyppä, H.; Haggrén, H.; Yu, X.; Pyysalo, U.; Pöntinen, P.; Kaartinen, H. Calibration of Laser-Derived Tree Height Estimates by Means of Photogrammetric Techniques. Scand. J. For. Res. 2004, 19, 524–528. [Google Scholar] [CrossRef]
  26. Bortolot, Z.; Wynne, R.H. Estimating Forest Biomass Using Small Footprint Lidar Data: An Individual Tree-Based Approach That Incorporates Training Data. ISPRS J. Photogramm. Remote Sens. 2005, 59, 342–360. [Google Scholar] [CrossRef]
  27. Morsdorf, F.; Meier, E.; Kötz, B.; Itten, K.I.; Bobbertin, M.; Allgöwer, B. LIDAR-Based Geometric Reconstruction of Boreal Type Forest Stands at Single Tree Level for Forest and Wildland Fire Management. Remote Sens. Environ. 2004, 92, 353–362. [Google Scholar] [CrossRef]
  28. Lee, A.C.; Lucas, R.M. A Lidar-Derived Canopy Density Model for Tree Stem and Crown Mapping in Australian Forests. Remote Sens. Environ. 2007, 111, 493–518. [Google Scholar] [CrossRef]
  29. Maltamo, M.; Peuhkurinen, J.; Malinen, J.; Vauhkonen, J.; Packalén, P.; Tokola, T. Predicting Tree Attributes and Quality Characteristics of Scots Pine Using Airborne Laser Scanning Data. Silva Fenn. 2009, 43, 507–521. [Google Scholar] [CrossRef]
  30. Holopainen, M.; Haapanen, R.; Tuominen, S.; Viitala, R. Performance of airborne laser scanning- and aerial photograph-based statistical and textural features in forest variable estimation. In Proceedings of SilviLaser 2008: 8th International Conference on LiDAR Applications in Forest Assessment and Inventory, Edinburgh, UK, September 17–19, 2008; pp. 105–112.
  31. Laasasenaho, J. Taper Curve and Volume Functions for Pine, Spruce and Birch. Communicationes Instituti Forestalis Fenniae. 1982, 108, 1–74. [Google Scholar]
  32. Axelsson, P. DEM generation from laser scanner data using adaptive TIN models. In Proceedings of ISPRS XIXth Congress, Amsterdam, The Netherlands, 16–23 July 2000; In International Archives of Photogrammetry and Remote Sensing. Vol. XXXIII(B4), pp. 110–117.
  33. Breiman, L. Random Forests. Mach. Learning 2001, 45, 5–32. [Google Scholar] [CrossRef]
  34. Breiman, L.; Cutler, A. Random forests. Available online: http://www.stat.berkeley.edu/users/breiman/RandomForests/cc_home.htm (accessed on November 20, 2008).
  35. Yu, X.; Hyyppä, J.; Kukko, A.; Maltamo, M.; Kaartinen, H. Change Detection Techniques for Canopy Height Growth Measurements Using Airborne Laser Scanning Data. Photogramm. Eng. Remote Sens. 2006, 72, 1339–1348. [Google Scholar] [CrossRef]
  36. Yu, X.; Hyyppä, J.; Kaartinen, H.; Maltamo, M. Automatic Detection of Harvested Trees and Determination of Forest Growth Using Airborne Laser Scanning. Remote Sens. Environ. 2004, 90, 451–462. [Google Scholar] [CrossRef]
  37. Maltamo, M; Eerikäinen, K.; Pitkänen, J.; Hyyppä, J.; Vehmas, M. Estimation of Timber Volume and Stem Density Based on Scanning Laser Altimetry and Expected Tree Size Distribution Functions. Remote Sens. Environ. 2004, 90, 319–330. [Google Scholar]

