Article

Tracking Desertification in California Using Remote Sensing: A Sand Dune Encroachment Approach

Department of Geography, York University, 4700 Keele Street, N430 Ross Building, Toronto, ON, M3J 1P3, Canada
*
Author to whom correspondence should be addressed.
Submission received: 15 October 2010 / Revised: 3 December 2010 / Accepted: 20 December 2010 / Published: 24 December 2010

Abstract

:
Most remote sensing studies in deserts focus solely on vegetation monitoring to assess the extent of desertification. However, the application of sand dune encroachment into such studies would greatly improve the accuracy in the prediction criteria of risk-prone areas. This study applies the latter methodology for tracking desertification using sand dunes in the Kelso Dunes (in Newberry-Baker, CA, USA). The approach involves the comparison of spectral characteristics of the dunes in Landsat Thematic Mapper (TM) images over a 24-year period (1982, 1988, 1994, 2000, and 2006). During this 24-year period, two El Niño events occurred (1983 and 1993); it was concluded that despite the shift in predominant winds, the short-term variation in wind direction did not make a noticeable change in dune formation, but greatly influences vegetation cover. Therefore, relying solely on vegetation monitoring to assess desertification can lead to overestimations in prediction analysis. Results from this study indicate that the Kelso Dunes are experiencing an encroachment rate of approximately 5.9 m3/m/yr over the 24-year period. While quantifying the Kelso Dunes or any natural dynamic system is subject to uncertainties, the encroachment rate approach reflects the highly heterogeneous nature of the sand dunes (in regards to spectral variability in brightness) at Kelso Dunes and serves as an exemplar for future research.

1. Introduction

Desertification is the persistent degradation of land in arid and dry sub-humid environments due to climatic variations and human intervention (e.g., overgrazing, over-cultivation) [1,2]. The influence of anthropogenic activities and climatic variations are common sources of dune degradation; however it is difficult to determine which of these two sources is the primary source of that degradation [2]. Arid environments are highly susceptible to desertification since they can experience long periods of drought; this water scarcity also limits the livelihood of livestock and the production of crops for inhabitants of these areas [2]. Traditionally, desertification assessment has been approached from a site-specific perspective (on the basis of changes to vegetation cover), making it difficult to understand its spatial extent [3,4,5,6,7]. Further, non-photosynthesizing vegetation (NPV) can be difficult to assess in arid environments [8]. Remote sensing approaches to tracking desertification or dune encroachment in arid environments are met with complications related to: (1) the spectral contribution of plants in deserts being overwhelmed by the soil background [18,19,20], and (2) desert plants having spectrally dissimilar signatures than their humid counterparts since these plants have evolved to adapt to harsh growing conditions [18,21,22,23] (Figure 1). An alternative to tracking vegetation change is to focus on the sand and parent material of the dunes themselves to assess the reactivation of stabilized dunes as a means of evaluating sand encroachment and desertification [9,10,11]. Such approaches permit the visualization of sand dune mobility and can be aided by remote sensing [12,13]. Remote sensing is a time- and cost-efficient method that has become a valuable tool for monitoring environmental change and therefore holds great potential for desertification assessment [14,15,16,17].
The loss of vegetation is not the only method available to quantify desertification [24]. The ability to discriminate active from inactive sand to assess sand transport (and thus, potential encroachment) offers an alternative avenue for desertification research [9,10,11]. A study conducted by Valor and Caselles [25] demonstrated that temperature plays a role in desertification, and proposed a preliminary thermal degradation index that used data from the thermal infrared channel. However, the temperature approach by Valor and Caselles [25] requires the measurement of in situ surface temperature maximums and minimums, something that unfortunately is unavailable to us for the period of study. Our study develops an alternative approach to assess desertification that does not incorporate thermal data, but rather focuses on tracking dune reactivation and sand brightness characteristics. Active sand dunes are defined as regions with evidence of recent or current sand mobility [32,33]. Inactive sand dunes are defined as regions with more coarse (greater than 250 μm) and fine (less than 62 μm) sand particles than active sand [32,33,34].
Establishing the criteria for mapping active and inactive sand areas on remotely sensed images will improve prediction analysis of high-risk regions. With regard to spectral brightness, sand dunes are characteristically unique; active sand dunes reflect a greater amount of electromagnetic radiation than inactive dunes [11,26,27,28,29,30], with active dunes consistently appearing brighter than inactive dunes [31]. Active sand surfaces have a higher albedo than inactive sand surfaces and can be successfully traced in remotely sensed images based on albedo differences [28], as demonstrated for Landsat Thematic Mapper (TM) data [11,20].
Figure 1. Spectral response curves after Ehleringer (1981) [18] for healthy non-desert and desert vegetation, and sand. Notice how the spectral reflectances for desert vegetation are spectrally dissimilar and do not exhibit a strong red edge (an abrupt change in the 680 nm (red) to 800 nm (near infrared) wavelength region) due to reduced leaf absorption in the visible region of the electromagnetic spectrum and strong wax absorption around the 1,720 nm wavelength region [21,22].
Remotesensing 03 00001 g001
Observed spectral differences are a result of grain size and composition differences [26,27,28,29,30,31,34,35]. Active sand is consistently brighter and is expressed generally by a unimodal distribution of brightness values while inactive sand has a greater mix of coarse and fine materials; this composition leads to a lower albedo [11]. Notably, the definition of active and inactive dunes should be defined based on the location in which it is applied; the definition is subject to appropriate time-scale and regional or seasonal trends [32].
This study applies the sand encroachment approach for assessing the extent of desertification as opposed to the more traditional vegetation monitoring approach. We measure encroachment by observing the spatial extent of reactivated sand dunes to assess whether these reactivated dunes extend into previously non-dune environments. Through an example, the Kelso Dunes in California, this approach investigates dune reactivation and encroachment over a 24-year period.

2. Methods

2.1. Study Area

The Kelso Dunes are located in the Mojave National Preserve (34°54.651′N, 115°43.856′W) in Newberry-Baker, CA, USA (Figure 2). Along with the Devils Playground, this region comprises the largest dune field in the Mojave Desert. The Kelso Dunes include both active and inactive dunes and cover over 115 km2, rising to over 200 m above the desert floor [33]. Good reviews of the dunes and the surrounding area are provided in Sharp [36] and Lancaster et al. [37,38,39]. Northwestern winds blow sand from the Soda Lake drainage basin, washing sediment down from surrounding mountains. Strong windstorms carry the sediment southeastward where the winds meet the bowl formed by both the Granite and Providence Mountains [36,37,38]. The mountainous regions surrounding the Kelso Dunes act as a wind barrier, slowing sediment transport to ultimately form dunes [36,37,38,39,40,41]. Frequent winds from other directions push the sand into a central peak; the Kelso Dunes resembles a three-horned star dune, which indicates a normal change in prevailing wind direction [36,40]. At Kelso, active sand dunes are identified as regions with sparse vegetation cover (10–20%) [11] and composed of well-sorted sand with wind ripples and slip faces [11,32,40,42,43,44], while inactive dunes are composed of poorly sorted sand having few wind ripples, no slip faces [11,40], and more vegetative cover. Surrounding vegetation is dominated by the ubiquitous creosote bush (Larrea tridentata) [45]. Summer temperatures can exceed 40 °C while winter temperatures are milder, occasionally dropping below freezing; diurnal temperatures fluctuations are considerable [45,46]. Annual average maximum and minimum temperatures (1958–2010) are 22.4 °C and 11.8 °C respectively, with 349.6 mm of annual precipitation (lowest in the summer), of which approximately 31% falls as snow (NOAA National Climatic Centre: Mitchell Caverns Weather Station).
Figure 2. Kelso Dunes is located in southeastern California, USA in the Mojave National Preserve, neighbouring the Devils Playground.
Remotesensing 03 00001 g002

2.2. Data and Analysis

Landsat Thematic Mapper (TM) images and raster-based topographical maps were obtained from the United States Geological Survey (USGS) and the California Geographical Survey (CGS). Each image was clipped to coincide with the corresponding 7.5 minute DEM tile obtained from the NASA Shuttle Radar Topographic Mission (SRTM). Images were gathered for a 24-year period (22 July 1982, 13 July 1988, 18 July 1994, 10 July 2000, and 25 July 2006) with two El Niño years (1983 and 1993) documented. El Niño-Southern Oscillation (ENSO) is defined as a prolonged difference in Pacific Ocean surface temperatures when compared with the average value. In southern California, winters during El Niño are significantly wetter and summers are warmer and drier [33].
Aerial photography (1:20,000) provided by the USGS augmented the data for visualization purposes and for visual assessments of classification precision. Atmospheric corrections (ATCOR3) were run on the Landsat scenes using environmental data from the Mitchell Caverns weather station (the closest weather station to the Kelso Dunes); general elevations for ATCOR3 were obtained from the DEM data and were used to correct for regional cosine errors. After running the atmospheric corrections, masks were created to constrain calculations to the Kelso Dunes. Results from these calculations would be used to distinguish between active and inactive dunes.
Using methods outlined by Blount [31], contrast enhancements were applied to the Landsat data, including Gaussian stretches on bands 5, 4, and 1. The active and inactive dunes were distinguished by spectral brightness, as defined by Blount [31], where active dunes appear brighter than inactive dunes. Band threshold values were used that split the bimodal distribution of brightness values between active and inactive dune pixels and approximate a function that is equidistant from the pairs of curves on each graph of Figure 3.
Dune type was classified according to morphological criteria defined by Breed and Grow [27] and individual dunes were identified following the criteria in McKee [47] who noted that although no single type of evidence is conclusive in an aeolian environment, together, the various features present strong evidence of dune deposition. McKee [47] focused on the analysis of slip faces, extent of the sand body, ripple marks, and the slope to define an individual dune. Informal assessment of accuracy was done by comparing the dune classifications to air photos acquired for periods corresponding to the imagery. Further, change detection was assessed by pair-wise comparisons of the classified images.
To determine the extent of desertification, the dune environments were visualized in plan-view and in 3D to gain a better spatial context using Terrain Analysis System (TAS) software [48]. The movement of sand at the Kelso dunes was assessed temporally by comparing the five images of the Kelso Dunes representing the 24-year period. Images from each year were overlain to visualize the degree of southeastward shift. Encroachment (the rate of sand movement into new territory) was computed based on the method described by Ben-Dor et al. [33]; lines representing the sand front were joined for three images obtained at the different time periods to form a polygon that depicted the total area covered by sand during those years. For each polygon, the length of the line was extracted and Equation 1 was used to compute the advancement rate [10],
R a = v 1 4 × S t L
where Ra is the advancement rate of an active sand dune (m3/m/yr), ν is the movement rate (in m), S is the area covered by the sand dune between successive years (in m2), t is the time between successive remotely sensed data (in yr), and L is the sand dune front length (in m).

3. Results and Discussion
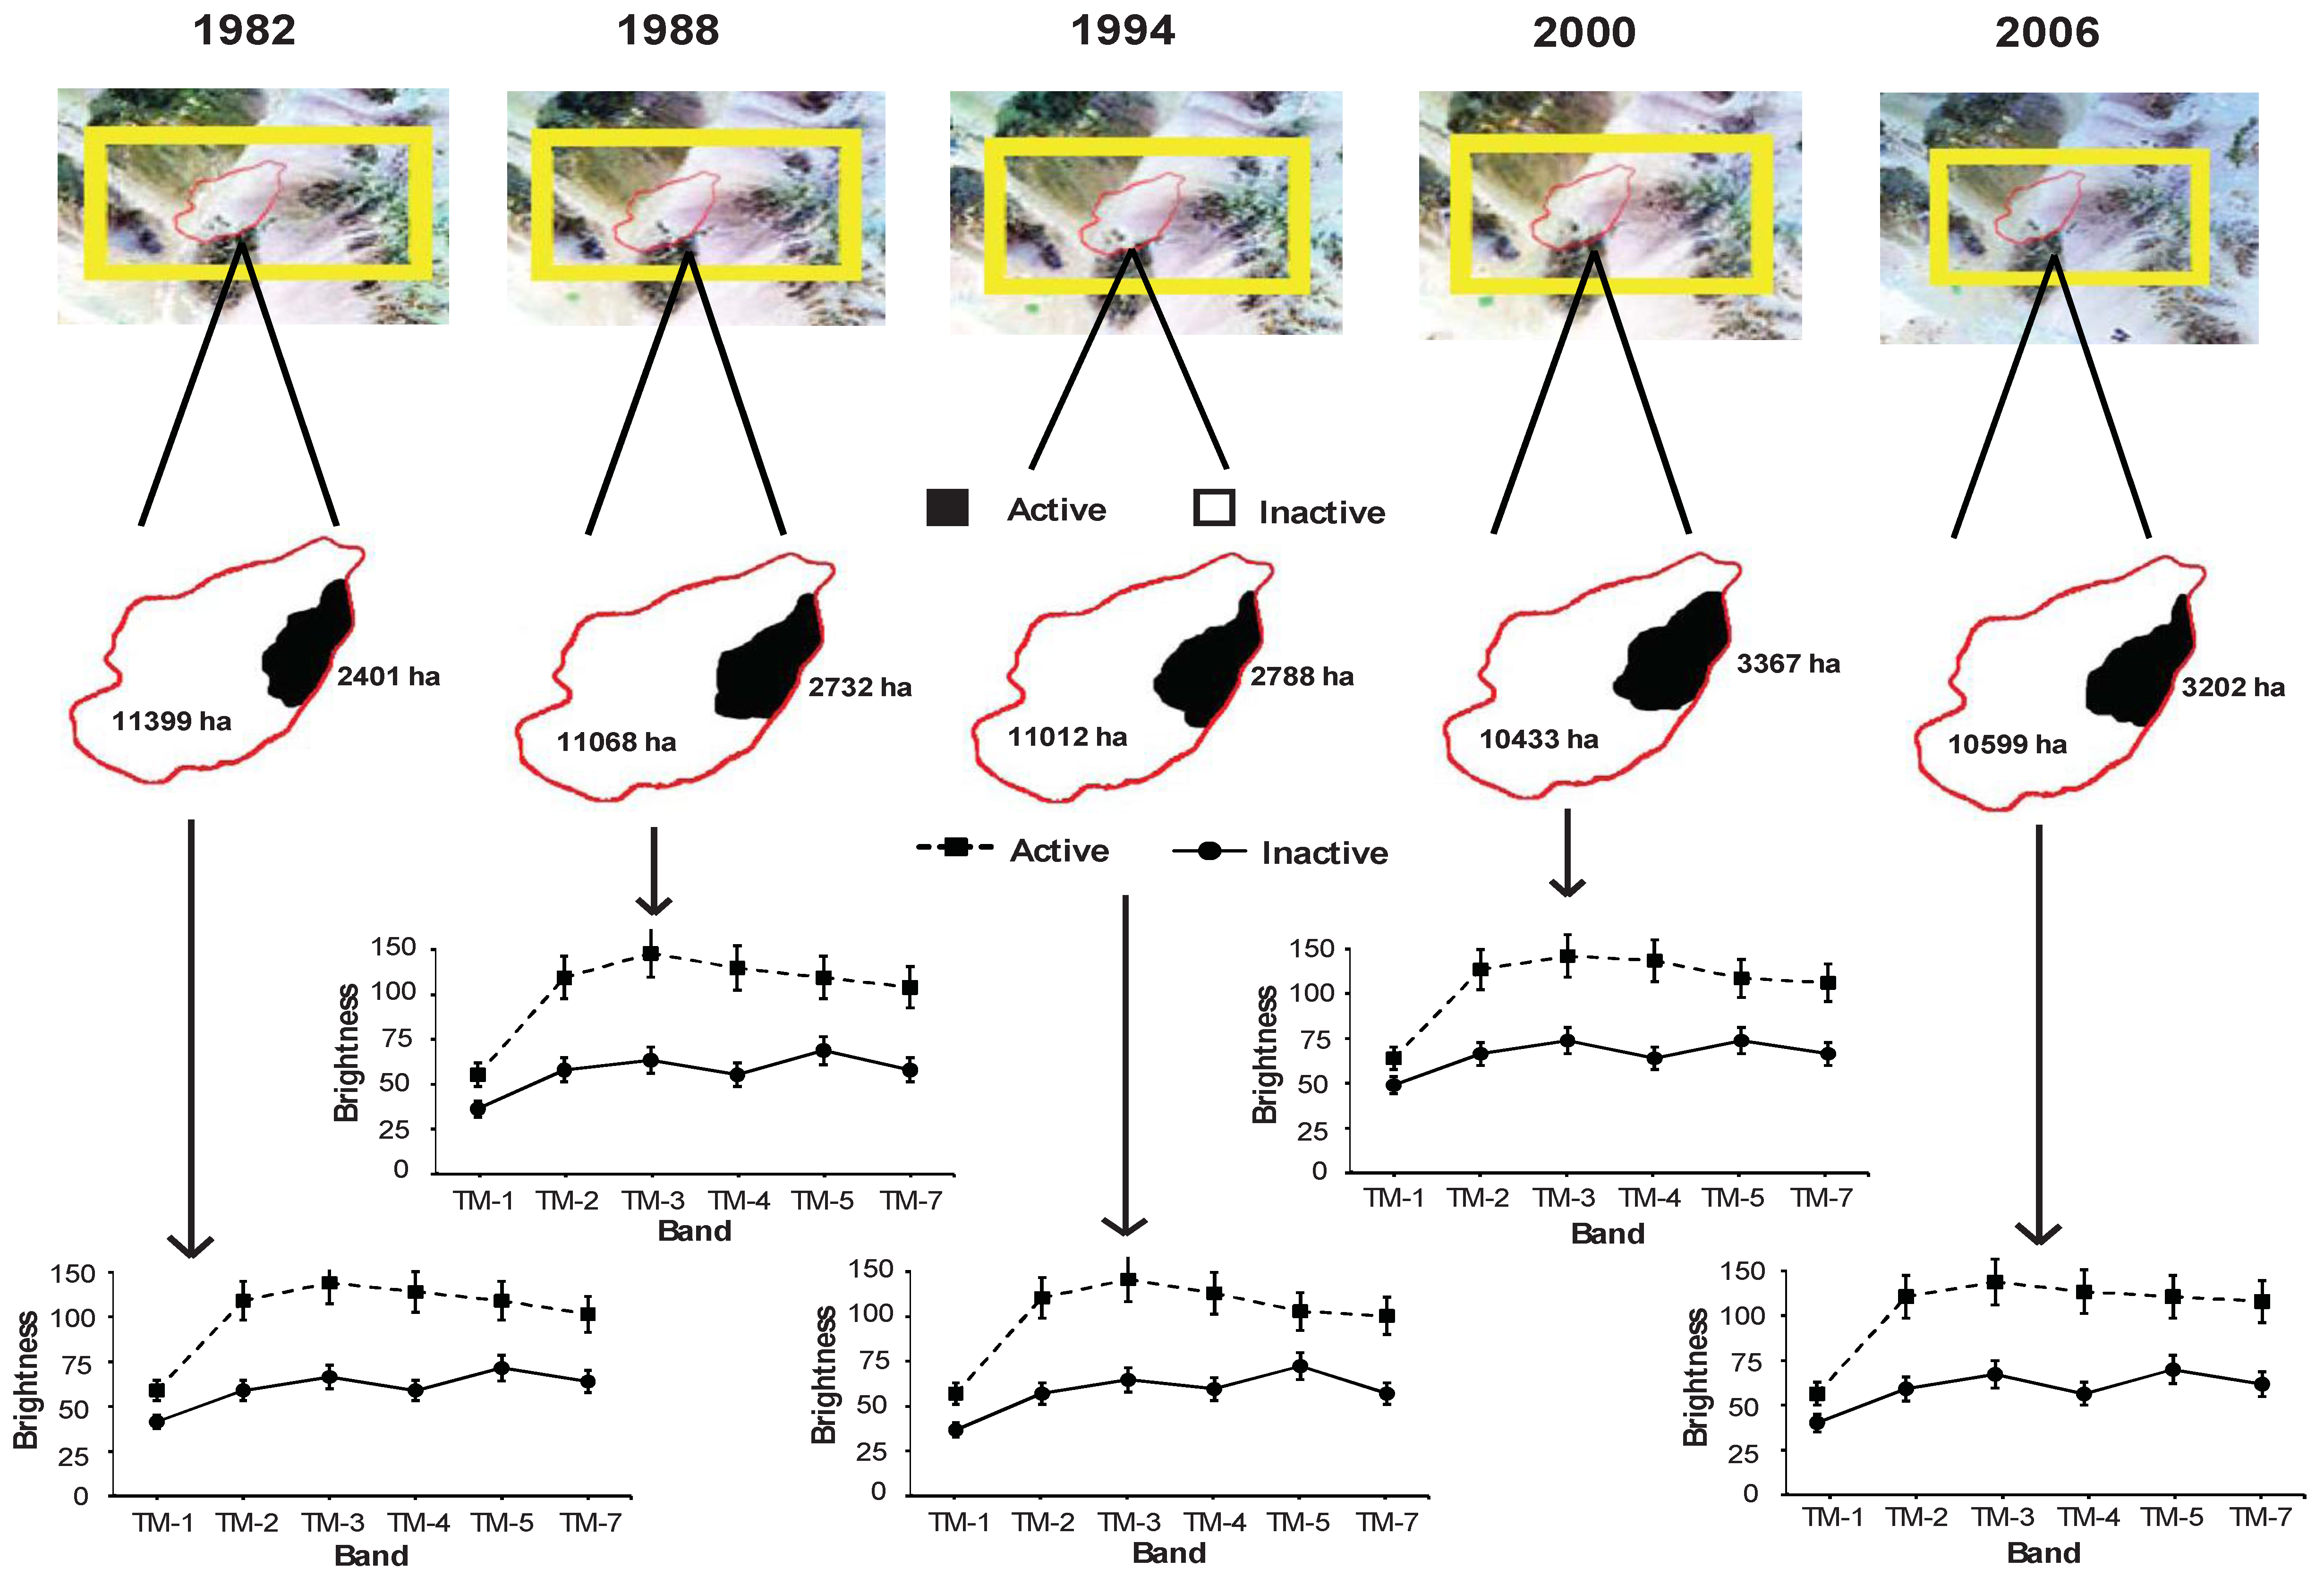
There is a clear distinction between the spectral signatures of active and inactive dunes. One-way Analysis of Variance (ANOVA) tests were performed on the zonal statistics for each TM-band; results indicate that mean brightness values differ significantly between active and inactive dune areas for each spectral band (P < 0.05). Figure 3 contains a summary of the average brightness of active and inactive dune pixels, averaged across the 5 individual years of data spanning the 24-year study period. Active and inactive dunes are easily separated because the inactive dunes are spectrally darker than the active dunes, with the greatest differences being in TM-3 (Figure 4).
As sand becomes more active, the particles become better sorted and presence of coarse grains decreases [34]. Since active and inactive sand dunes are partially characterized by an increasing degree of relatively visualization of the satellite data coincidently with vegetation data acquired from air photos helps to aid with interpretation and assessments of activity. As sand becomes increasingly active, vegetation cover is reduced; additionally, these areas become increasingly covered by active wind ripples and the slip faces become more developed [11]. Paisley et al. [11] confirm the relationship between sand activity and vegetation; they observed that the spectral characteristics for dunes, such as those at Kelso, can be used to distinguish between active and inactive dunes in other regions too.
The southeastern region of the Kelso Dunes is inactive; this region appears the darkest in tone on the Landsat TM images and appears the most stabilized. Active dunes are easier to identify than inactive dunes, especially when compared with vegetative data, the loss of which is depicted in Landsat images, primarily on TM-4. Thus, the difference in spectral reflectance can be explained by the presence of vegetation as seen in the Landsat TM band. Visually, active dunes have a well-sorted morphology and sparse vegetation cover [49]; however, inactive dunes are more difficult to distinguish as they present a wider range of characteristics that are not as easily defined and more factors need to be considered. Generally, inactive dunes tend to have reduced lee face angles, are more vegetated, and have moderately-to-poorly sorted sand [32]. Transitions between active and inactive dunes are particularly complex and difficult to identify, but can greatly affect the regional image classification [32]. Boundaries are also difficult to distinguish because of the potential for considerable spectral mixing [50,51]. Pair-wise comparisons of the images for the 24-year period indicate that the advancement rate of sand within the Kelso Dunes experienced an encroachment rate of approximately 5.9 m3/m/yr, with advancement accelerating towards the latter half (Table 1).
Figure 3. Flow diagram to illustrate data processing steps: mask created for Kelso Dunes in Landsat images (yellow frame), active and inactive dunes identified (in hectares), and computed brightness values. Graphs portray average, minimum, and maximum brightness values for each spectral band.
Remotesensing 03 00001 g003
Figure 4. Zonal statistics: the spectral signatures of active and inactive dunes across a 24-year period (1982 to 2006). Error bars represent maximum and minimum, and data points represent average of the zones.
Remotesensing 03 00001 g004
Table 1. The advancement rate recorded during the 24-year period from 1982 to 2006 for the Kelso Dunes.
YearAdvancement Rate (m3m−1yr−1)
1982 to 19882.8
1982 to 19943.7
1982 to 20004.4
1982 to 20065.9
The spatial pattern of vegetation cover suggests that vegetation does not have a large influence on the TM spectra of arid regions and therefore, with less than 35% of vegetation cover in the Kelso Dunes, vegetation should not be the basis of desertification assessment. The TM spectrum is influenced more by the spectral differences between active and inactive sand than by vegetation. The tones observed on the Landsat TM images indicate movement of sand from the Mojave River where sand is transported to the west through the Devil’s Playground before being deposited in the Kelso Dunes area.
Analysis of the spatial patterns of sand encroachment indicated that the sand at the top of the active dunes at Kelso is subject to more movement than sand at the base of the active area likely due to increased exposure to stronger winds (speculation statement supported by Paisley et al. [11] and Lancaster [32]). However, it is not clear whether sand grain size has an effect on the distribution of inactive sand and whether the evidence of desertification is influenced not only by humans, but also by climatic change.
In order to understand sand migration, organizing a GIS-based analysis that incorporates attribute data (i.e., wind speed and direction) with remotely sensed images is required to model the formation of sand dunes [32]. However, the observed desertification patterns are not unique to the Kelso Dunes, also noted by Karnieli and Tsoar [53] on inactive sand. Karnieli and Tsoar [53] determined that inactive dunes were darker than active dunes on satellite images (for visible and NIR bands) and the inactive dunes along the Israel/Egypt border contained a biogenic crust that was responsible for the low albedo. The presence of a biogenic crust highlights that the detection of inactive dunes on optical and radar images is based on sand composition.
We suggest that anthropogenic activity at the Kelso Dunes is one possible cause for the acceleration of sand encroachment, since the documented climate variations during the study period were small, with only minor and consistent fluctuations [11,32,34,54]. However, further research would be required to make a definitive assessment. Climate data from Mitchell Caverns provide an approximate a half-century of climate records for this region. Although two El Niño events occurred during the study’s 24-year period, it was concluded that despite the shift in predominant winds, the short-term variation in wind direction did not make a noticeable change in dune formation, but greatly influences vegetation cover. A longer temporal scale would address the pattern of sand migration to determine if the encroachment rate approach is a more viable alternative for desertification research.

4. Conclusions

The TM spectral DN values for active dunes are higher (brighter) than the TM spectral DN values for inactive dunes. By comparing the DN values of the TM bands, these spectral differences are apparent. DN values are used to differentiate between active and inactive dunes and denote the degree of sand activity in the Kelso Dunes. The ability to identify active and inactive dunes at Kelso has implications for other deserts; analysis of a longer temporal scale has the potential for tracing the movement of sand. This study provided quantitative insight on dune dynamics to assess desertification. Also, applying the encroachment rate approach provides an alternative to vegetation monitoring that is susceptible to sand and soil background effects. The ability to assess dune movement using images collected in successive years can help create elevation change maps, sand profiles, and land cover change maps for deserts, provided that the image resolution is sufficient. In arid regions, where desertification is most critical, monitoring the activation and movement of sand becomes of great importance. While quantifying the Kelso Dunes or any natural dynamic system is subject to uncertainties, the encroachment rate approach reflects the highly heterogeneous nature of the sand dunes (in regards to spectral variability in brightness) at Kelso Dunes and serves as an exemplar for future research.

Acknowledgements

The authors of this paper would like to acknowledge the help by Arizona State Climatologist Nancy Selover and Arizona State University professor Ron Dorn who offered valuable insight on desert geomorphology in the Kelso Dunes. We also wish to thank the editor of this journal and the anonymous reviewers during the revision process.

References

  1. Bauer, S.; Stringer, L.C. The role of science in the global governance of desertification. J. Environ. Develop. 2009, 18, 248–267. [Google Scholar] [CrossRef]
  2. Aubreville, A. La foret coloniale: les forets de l’Afrique occidentale francaise. J. Acad. Sci. Colon. 1938, 9, 35–45. [Google Scholar]
  3. Collado, A.D.; Chuvieco, E.; Camarasa, A. Satellite remote sensing analysis to monitor desertification processes in the crop-rangeland boundary of Argentina. J. Arid Environ. 2002, 52, 121–133. [Google Scholar] [CrossRef]
  4. Diouf, A.; Lambin, E.F. Monitoring land-cover changes in semi-arid regions: Remote sensing and field observations in the Ferlo, Senegal. J. Arid Environ. 2001, 48, 129–148. [Google Scholar] [CrossRef]
  5. Holm, A.M.; Cridland, S.W.; Roderick, M.L. The use of time-integrated NOAA NDVI data and rainfall to assess landscape degradation in the arid shrubland of Western Australia. Remote Sens. Environ. 2003, 85, 145–158. [Google Scholar] [CrossRef]
  6. Prince, S.D.; de Colstoun, E.B.; Kravitz, L.L. Evidence from Rain-use Efficiencies Does Not Indicate Extensive Sahelian Desertification; Academic Press: San Diego, CA, USA, 1998; pp. 61–78. [Google Scholar]
  7. Runnstrom, M.C. Is Northern China winning the battle against desertification? Satellite remote sensing as a tool to study biomass trends on the Ordos Plateau in semiarid China. Ambio 2000, 29, 468–476. [Google Scholar]
  8. Hill, J.; Mégier, J. Imaging Spectrometry—A Tool for Environmental Observations (Eurocourses: Remote Sensing); Springer: New York, NY, USA, 1994; pp. 1–344. [Google Scholar]
  9. Balduzzi, I.; Bozzano, A.; Corradi, N.; Mariotti, L.M.; Vagge, I. The evolution of the dune fields of Platmona-Marritza (northern Sardinia): Application of remote-sensing methods. Chem. Ecol. 2006, 22, S371–S381. [Google Scholar] [CrossRef]
  10. del Valle, H.F.; Rostagno, C.M.; Coronato, F.R.; Bouza, P.J.; Blanco, P.D. Sand dune activity in north-eastern Patagonia. J. Arid Environ. 2008, 72, 411–422. [Google Scholar] [CrossRef]
  11. Paisley, E.C.I.; Lancaster, N.; Gaddis, L.R.; Greeley, R. Discrimination of active and inactive sand from remote sensing: Kelso Dunes, Mojave Desert, California. Remote Sens. Environ. 1991, 37, 153–166. [Google Scholar] [CrossRef]
  12. Hellden, U. Desertification—Time for an assessment. Ambio 1991, 20, 372–383. [Google Scholar]
  13. Tucker, C.J.; Dregne, H.E.; Newcomb, W.W. Expansion and contraction of the Sahara Desert from 1980 to 1990. Science 1991, 253, 299–301. [Google Scholar] [CrossRef] [PubMed]
  14. Jacobberger, P.A. Reflectance characteristics and surface processes in stabilized dune environments. Remote Sens. Environ. 1989, 28, 287–295. [Google Scholar] [CrossRef]
  15. Otterman, J. Satellite and field studies of man’s impact on the surface in arid regions. Tellus 1981, 33, 68–77. [Google Scholar] [CrossRef]
  16. Robinove, C.J.; Chavez, P.S.; Gehring, D.; Holmgren, R. Arid land monitoring using Landsat albedo difference images. Remote Sens. Environ. 1981, 11, 133–156. [Google Scholar] [CrossRef]
  17. Tucker, C.J.; Justice, C.O. Satellite remote sensing of desert spatial extent. Desertification Control Bull. 1986, 13, 2–50. [Google Scholar]
  18. Ehleringer, J.R. Leaf absorptances of Mohave and Sonoran desert plants. Oecologia 1981, 49, 366–370. [Google Scholar] [CrossRef]
  19. Huete, R.; Jackson, R.D.; Post, D.F. Spectral response of a plant canopy with different soil backgrounds. Remote Sens. Environ. 1985, 17, 37–53. [Google Scholar] [CrossRef]
  20. Tueller, P.T. Remote sensing science applications in arid environments. Remote Sens. Environ. 1987, 23, 143–154. [Google Scholar] [CrossRef]
  21. Collins, W. Remote sensing of crop type and maturity. Photogramm. Eng. Remote Sens. 1978, 44, 43–55. [Google Scholar]
  22. Ray, T.W.; Murray, B.C. Remote Monitoring of Shifting Sands and Vegetation Cover in Arid Regions. In Proceedings of International Geoscience and Remote Sensing Symposium, Pasadena, CA, USA, August 1994; pp. 1033–1035.
  23. Ray, T.W.; Murray, B.C. Nonlinear spectral mixing in desert vegetation. Remote Sens. Environ. 1998, 55, 59–64. [Google Scholar] [CrossRef]
  24. Karnieli, A.; Dall’Olmo, G. Remote sensing monitoring of desertification, phenology, and droughts. Int. J. Manage. Environ. Qual. 2003, 14, 22–38. [Google Scholar] [CrossRef]
  25. Valor, E.; Caselles, V. Towards the Use of Temperature in Desertification Monitoring: Results of DeMon-I Project; AA Balkema: Rotterdam, The Netherlands, 1997; p. 305. [Google Scholar]
  26. Blount, H.G.; Greeley, R.; Christensen, P.R.; Arvidson, R. Bright sand/dark dust: The identification of active sand surfaces on the earth and Mars. In Reports of Planetary Geology and Geophysics Program; NASA: Washington, DC, USA, 1986; pp. 257–258. [Google Scholar]
  27. Breed, C.S.; Grow, T. Morphology and distribution of dunes in sand seas observed by remote sensing. In A Study of Global Sand Seas (USGS Professional Paper1052); McKee, E.D., Ed.; US Government Printing Office: Reston, VA, USA, 1979; pp. 253–302. [Google Scholar]
  28. Maxwell, T.A.; Haynes, C.V. Remote sensing of sand transport in the Western Desert of Egypt. In Geology of the Arab World; Sadek, A., Ed.; Cairo University: Cario, Egypt, 1992; pp. 19–31. [Google Scholar]
  29. Thomas, D.S.G.; Leason, H.C. Dunefield activity response to climate variability in the southern Kalahari. Geomorphology 2005, 64, 117–132. [Google Scholar] [CrossRef]
  30. Katra, I.; Scheidt, S.; Lancaster, N. Changes in active eolian sand at northern Coachella Valley, California. Geomorphology 2009, 105, 277–290. [Google Scholar] [CrossRef]
  31. Blount, H.G. Regional Aeolian Dynamics from Remote Sensing: Origin of the Gran Desierto, Sonora, Mexico. Ph.D. Thesis, Arizona State University, Tempe, AZ, USA, 1988; pp. 231–268. [Google Scholar]
  32. Karnieli, A. Development and implementation of spectral crust index over dune sands. Int. J. Remote Sens. 1997, 18, 1207–1220. [Google Scholar] [CrossRef]
  33. Ben-Dor, E.; Levin, N.; Singer, A.; Karnieli, A.; Braun, O.; Kidron, G.J. Quantitative mapping of the soil rubification process on sand dunes using an airborne hyperspectral sensor. Geoderma 2006, 131, 1–21. [Google Scholar] [CrossRef]
  34. Ramsey, M.S.; Christensen, P.R.; Lancaster, N.; Howard, D.A. Identification of sand sources and transport pathways at the Kelso Dunes, California, using thermal infrared remote sensing. Geol. Soc. Am. Bull. 1999, 111, 646–662. [Google Scholar] [CrossRef]
  35. Lancaster, N. Controls on aeolian activity: Some new perspectives from the Kelso dunes, Mojave Desert, California. J. Arid Environ. 1994, 27, 113–125. [Google Scholar] [CrossRef]
  36. Sharp, R.P. Kelso dunes, Mohave Desert, California. Geol. Soc. Am. Bull. 1966, 77, 1045–1074. [Google Scholar] [CrossRef]
  37. Lancaster, N. Development of Kelso Dunes, Mojave Desert, California. Nat. Geogr. Res. Explor. 1993, 9, 444–459. [Google Scholar]
  38. Lancaster, N.; Tchakerian, V.P. Late quaternary eolian dynamics, Mojave Desert, California. In Paleoenvironments and Paleohydrology of the Mojave and Southern Great Basin Deserts; Enzel, Y., Wells, S.G., Lancaster, N., Eds.; The Geological Society of America, Inc.: Boulder, CO, USA, 2003; pp. 231–249. [Google Scholar]
  39. Lancaster, N.; Wintle, A.G.; Edwards, S.R.; Duller, G.; Tchakerian, V.P. Chronology of eolian activity at Kelso Dunes: Evidence from luminescence dating of dune sediments. GSA Abstract. Prog. 1991, 23, A355. [Google Scholar]
  40. Ramsey, M.S.; Christensen, P.R.; Lancaster, N.; Howard, D.A. Identification of sand sources and transport pathways at the Kelso Dunes, California using thermal infrared remote sensing. Geol. Soc. Am. Bull. 1999, 111, 646–662. [Google Scholar] [CrossRef]
  41. Wintle, A.G.; Lancaster, N.; Edwards, S.R. Infrared stimulated luminescence (IRSL) dating of late-Holocene aeolian sands in the Mojave Desert, California, USA. Holocene 1994, 4, 74–78. [Google Scholar] [CrossRef]
  42. Li, X.R.; Tan, H.J.; He, M.Z.; Wang, X.P.; Li, X.J. Patterns of shrub species richness and abundance in relation to environmental factors on the Alxa Plateau: prerequisites for conserving shrub diversity in extreme arid desert regions. Sci. China Ser. D: Earth Sci. 2009, 52, 669–680. [Google Scholar] [CrossRef]
  43. Miao, T.D.; Mu, Q.S.; Wu, S.Z. Computer simulation of aeolian sand ripples and dunes. Phys. Lett. A 2001, 288, 16–22. [Google Scholar] [CrossRef]
  44. Pelletier, J.D. Controls on the height and spacing of eolian ripples and transverse dunes: A numerical modeling investigation. Geomorphology 2009, 105, 322–333. [Google Scholar] [CrossRef]
  45. Lei, S.A. Soil properties of the Kelso sand dunes in the Mojave Desert. Southwest. Nat. 1993, 43, 47–52. [Google Scholar]
  46. Chapman, D.M.; Geary, M.; Roy, P.S.; Thorne, B.G. Coastal Evolution and Coastal Erosion in New South Wales; Coastal Council of New South Wales: Sydney, NSW, Australia, 1982; pp. 247–280. [Google Scholar]
  47. McKee, E.D. Introduction to a study of global sand seas. In A Study of Global Sand Seas; McKee, E.D., Ed.; United States Geological Survey: Reston, VA, USA, 1979; pp. 3–19. [Google Scholar]
  48. Lindsay, J.B. The Terrain Analysis System: A tool for hydro-geomorphic applications. Hydrol. Processes 2005, 19, 1123–1130. [Google Scholar] [CrossRef]
  49. Barbour, M.G.; Burk, J.H.; Pitts, W.D.; Gilliam, F.S.; Schwartz, M.W. Terrestrial Plant Ecology, 3rd ed.; Benjamin Cummings, Addison Wesley Longman Inc.: San Francisco, CA, USA, 1999; pp. 38–59. [Google Scholar]
  50. Congalton, R.G.; Green, K. Assessing the Accuracy of Remotely Sensed Data: Principles and Practices; Lewis Publishers: Boca Raton, FL, USA, 1999; pp. 89–137. [Google Scholar]
  51. Myint, S.W.; Okin, G.S. Modelling land-cover types using multiple endmember spectral mixture analysis in a desert city. Int. J. Remote Sens. 2009, 30, 2237–2257. [Google Scholar] [CrossRef]
  52. Smith, H.T.U. Past Versus Present Wind Action in the Mojave Desert Region, California, US; Research Laboratories Publication: New Bedford, MA, USA, 1967; pp. 1–34. [Google Scholar]
  53. Karnieli, A.; Tsoar, H. Spectral reflectance of biogenic crust developed on desert dune sand along the Israel-Egypt border. Int. J. Remote Sens. 1995, 16, 369–374. [Google Scholar] [CrossRef]
  54. Yizhaq, H.; Balmforth, N.J.; Provenzale, A. Blown by wind: Nonlinear dynamics of aeolian sand ripples. Physica D 2004, 195, 207–228. [Google Scholar] [CrossRef]

