Urban Sprawl Analysis and Modeling in Asmara, Eritrea


Abstract
:
1. Introduction
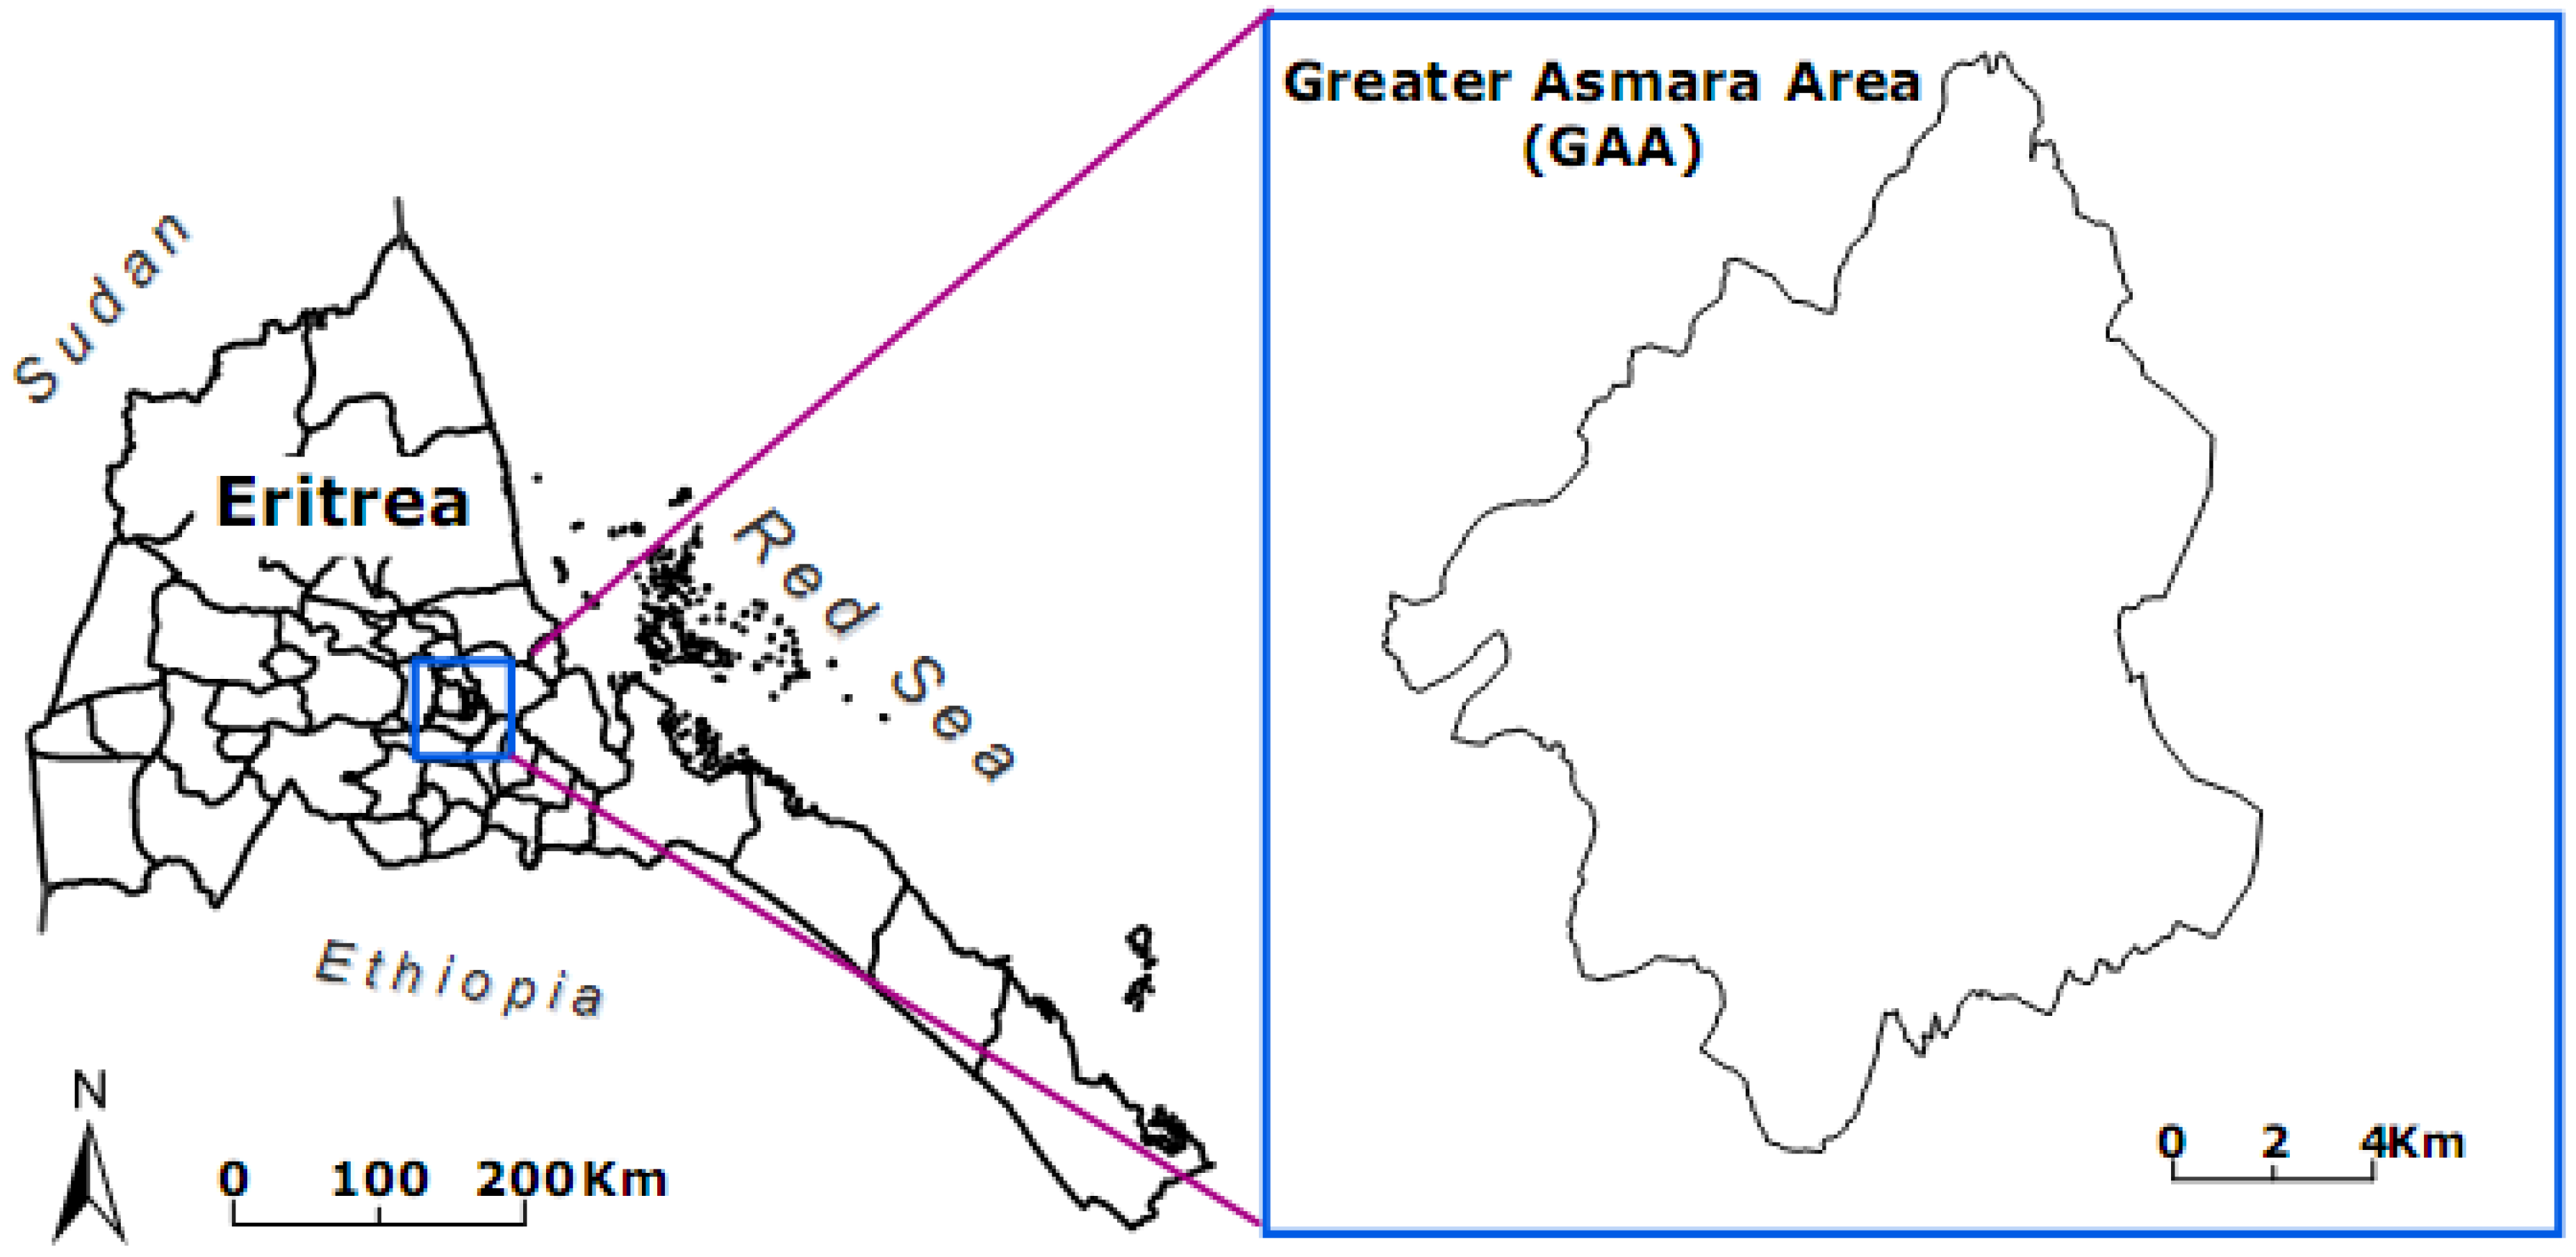
2. Study Area

3. Data
4. Methods
4.1. Satellite Image Pre-Processing and Landuse Mapping
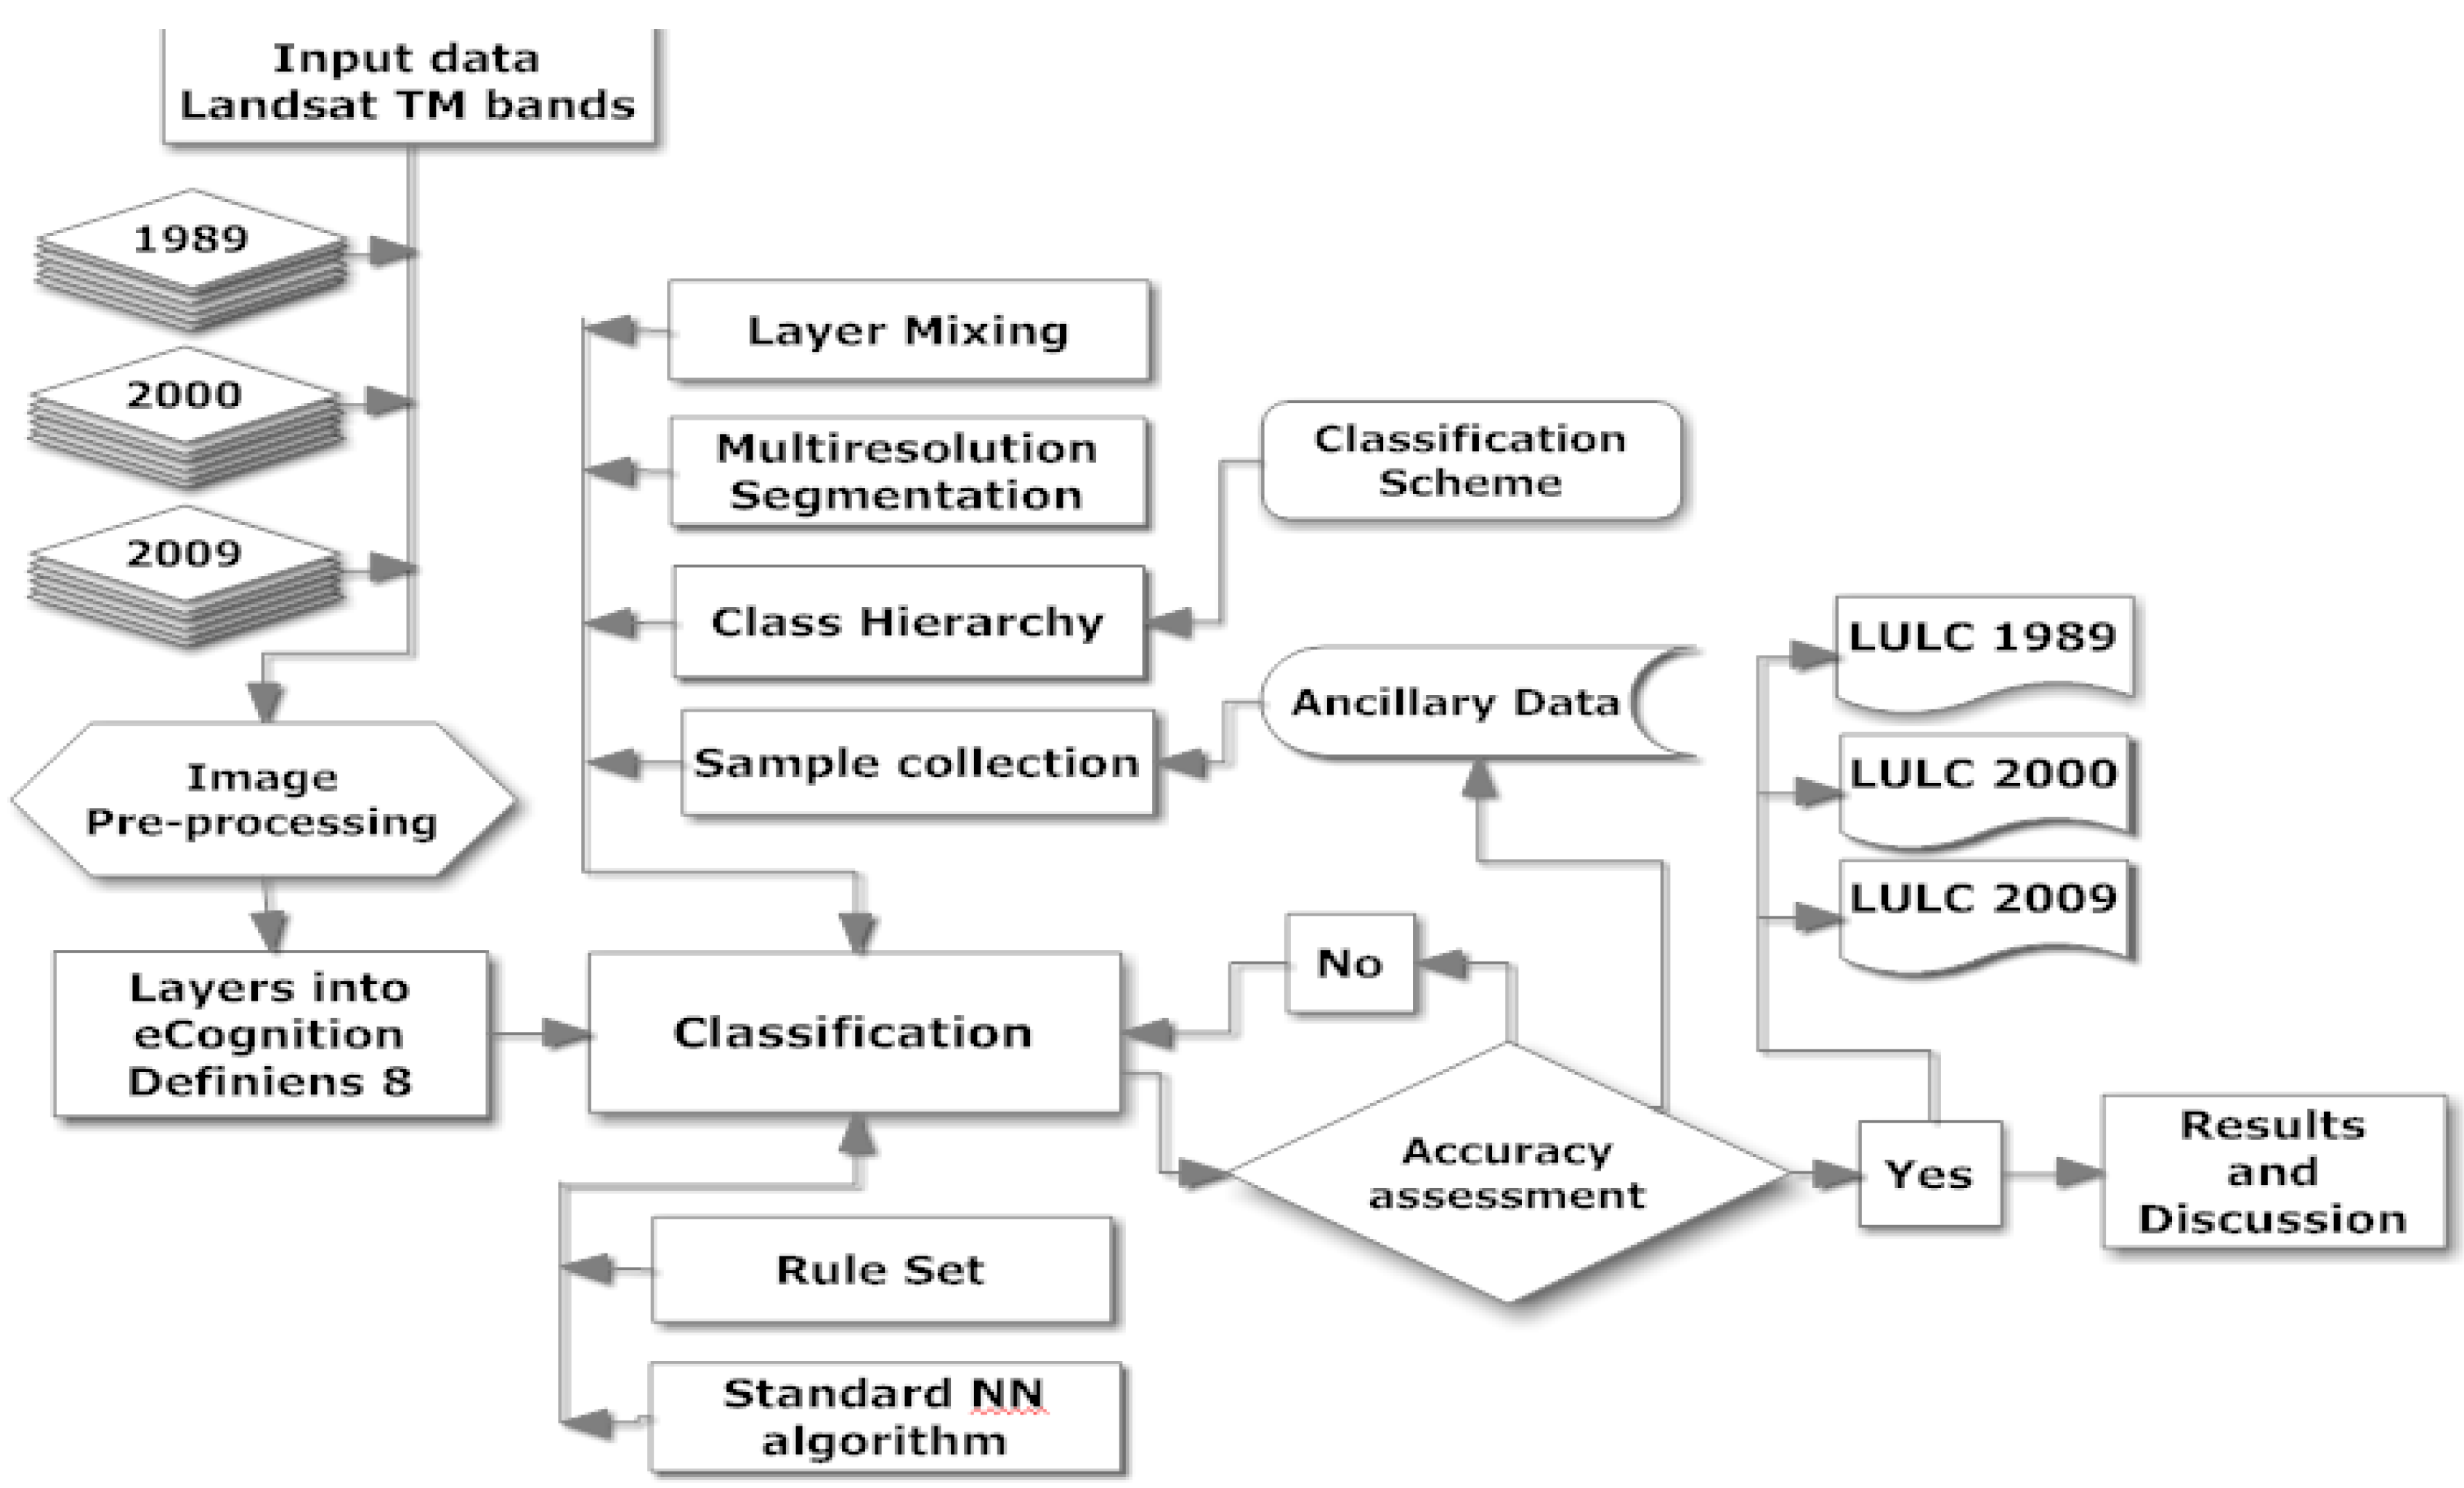
4.1.1. Image Pre-Processing
4.1.2. Object-Based Image Analysis (OBIA) using eCognition Developer
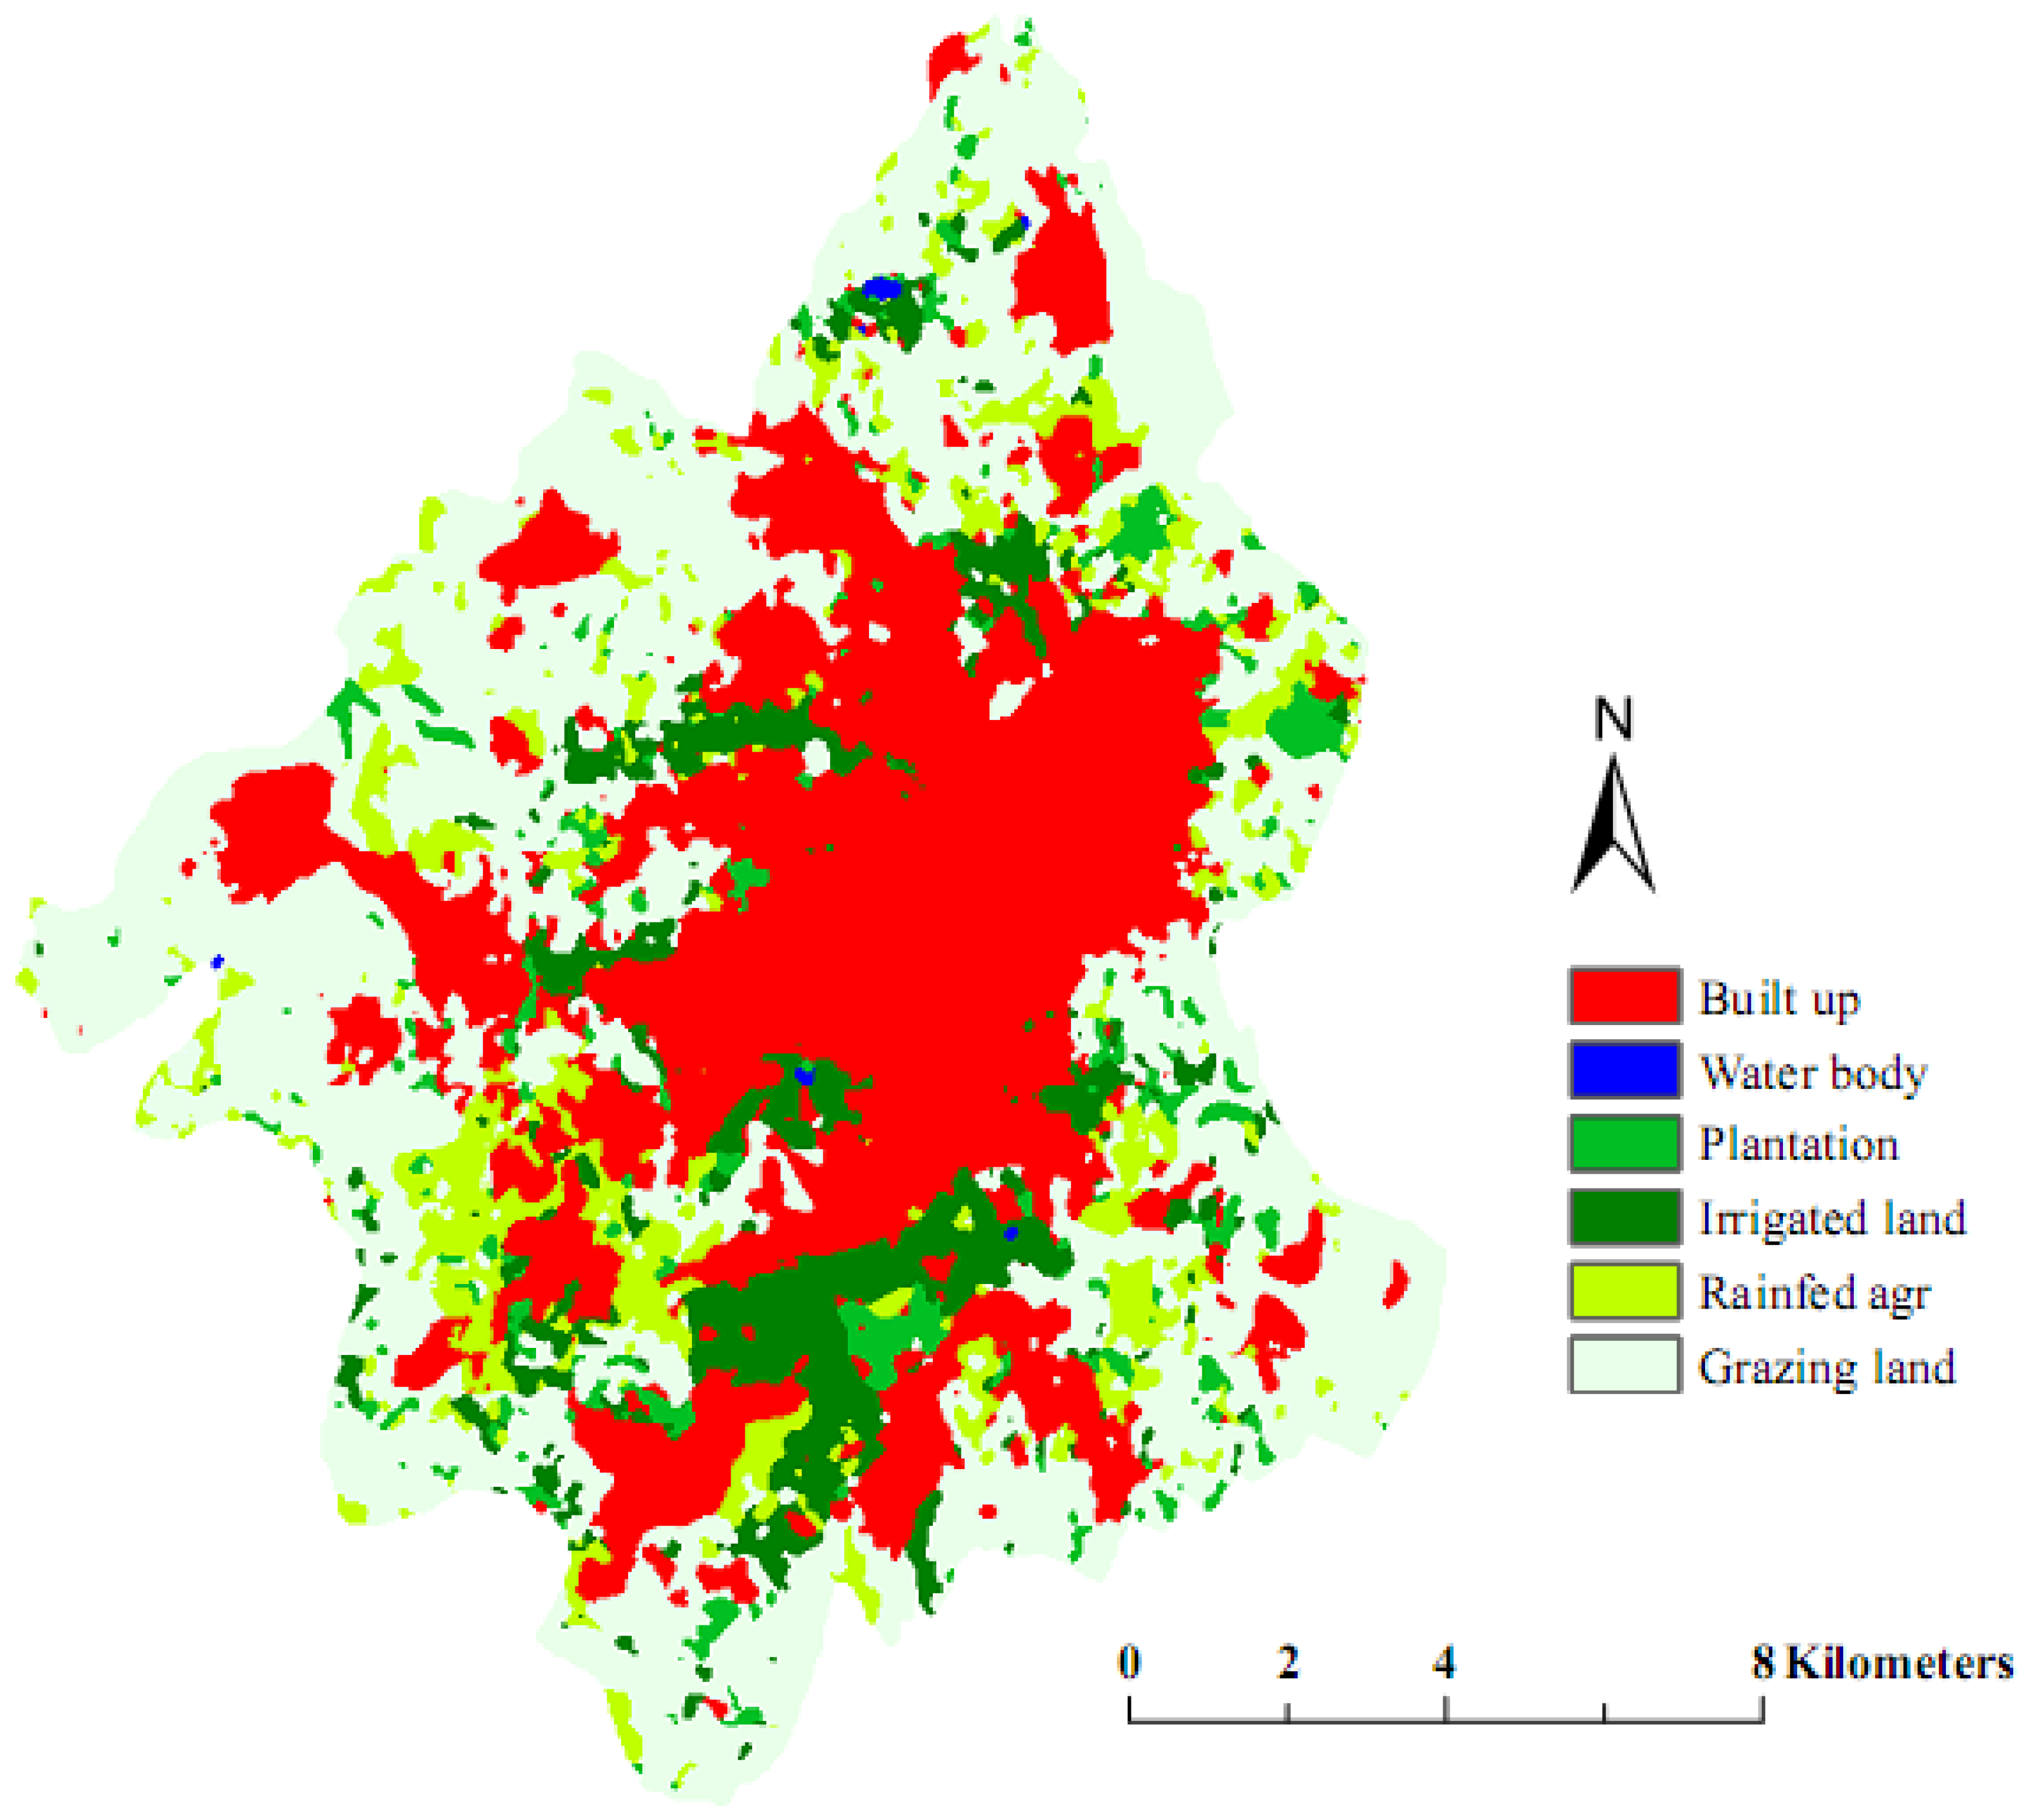
Classification Scheme

| No | LULC Classes | Simplified description based on the MoLWE-DoL |
|---|---|---|
| 1 | Built-up | Industrial, commercial and public built-ups; transportation and other continuous and non continuous urban fabrics and related built-up areas |
| 2 | Water body | Dams and other water bodies (swamp area) |
| 3 | Irrigation | Flowering and fruit irrigation, high potential urban agricultural areas, nursery |
| 4 | Grazing land | Bare soil, barren lands and grazing areas |
| 5 | Plantation | Seasonal wet lands, artificial trees and natural bushes |
| 6 | Rainfed | Any kind of rainfed agriculture, other than irrigation |
Image Segmentation
Training Sites and Classification Algorithm
4.1.3. Accuracy Assessment
4.2. Urban Landuse Cover Change (LUCC) Detection and Urban Sprawl Analysis
4.2.1. LUCC Detection Using Post-Classification Method and Land Change Modeler (LCM)
4.2.2. Urban Sprawl Measurement with Shannon’s Entropy
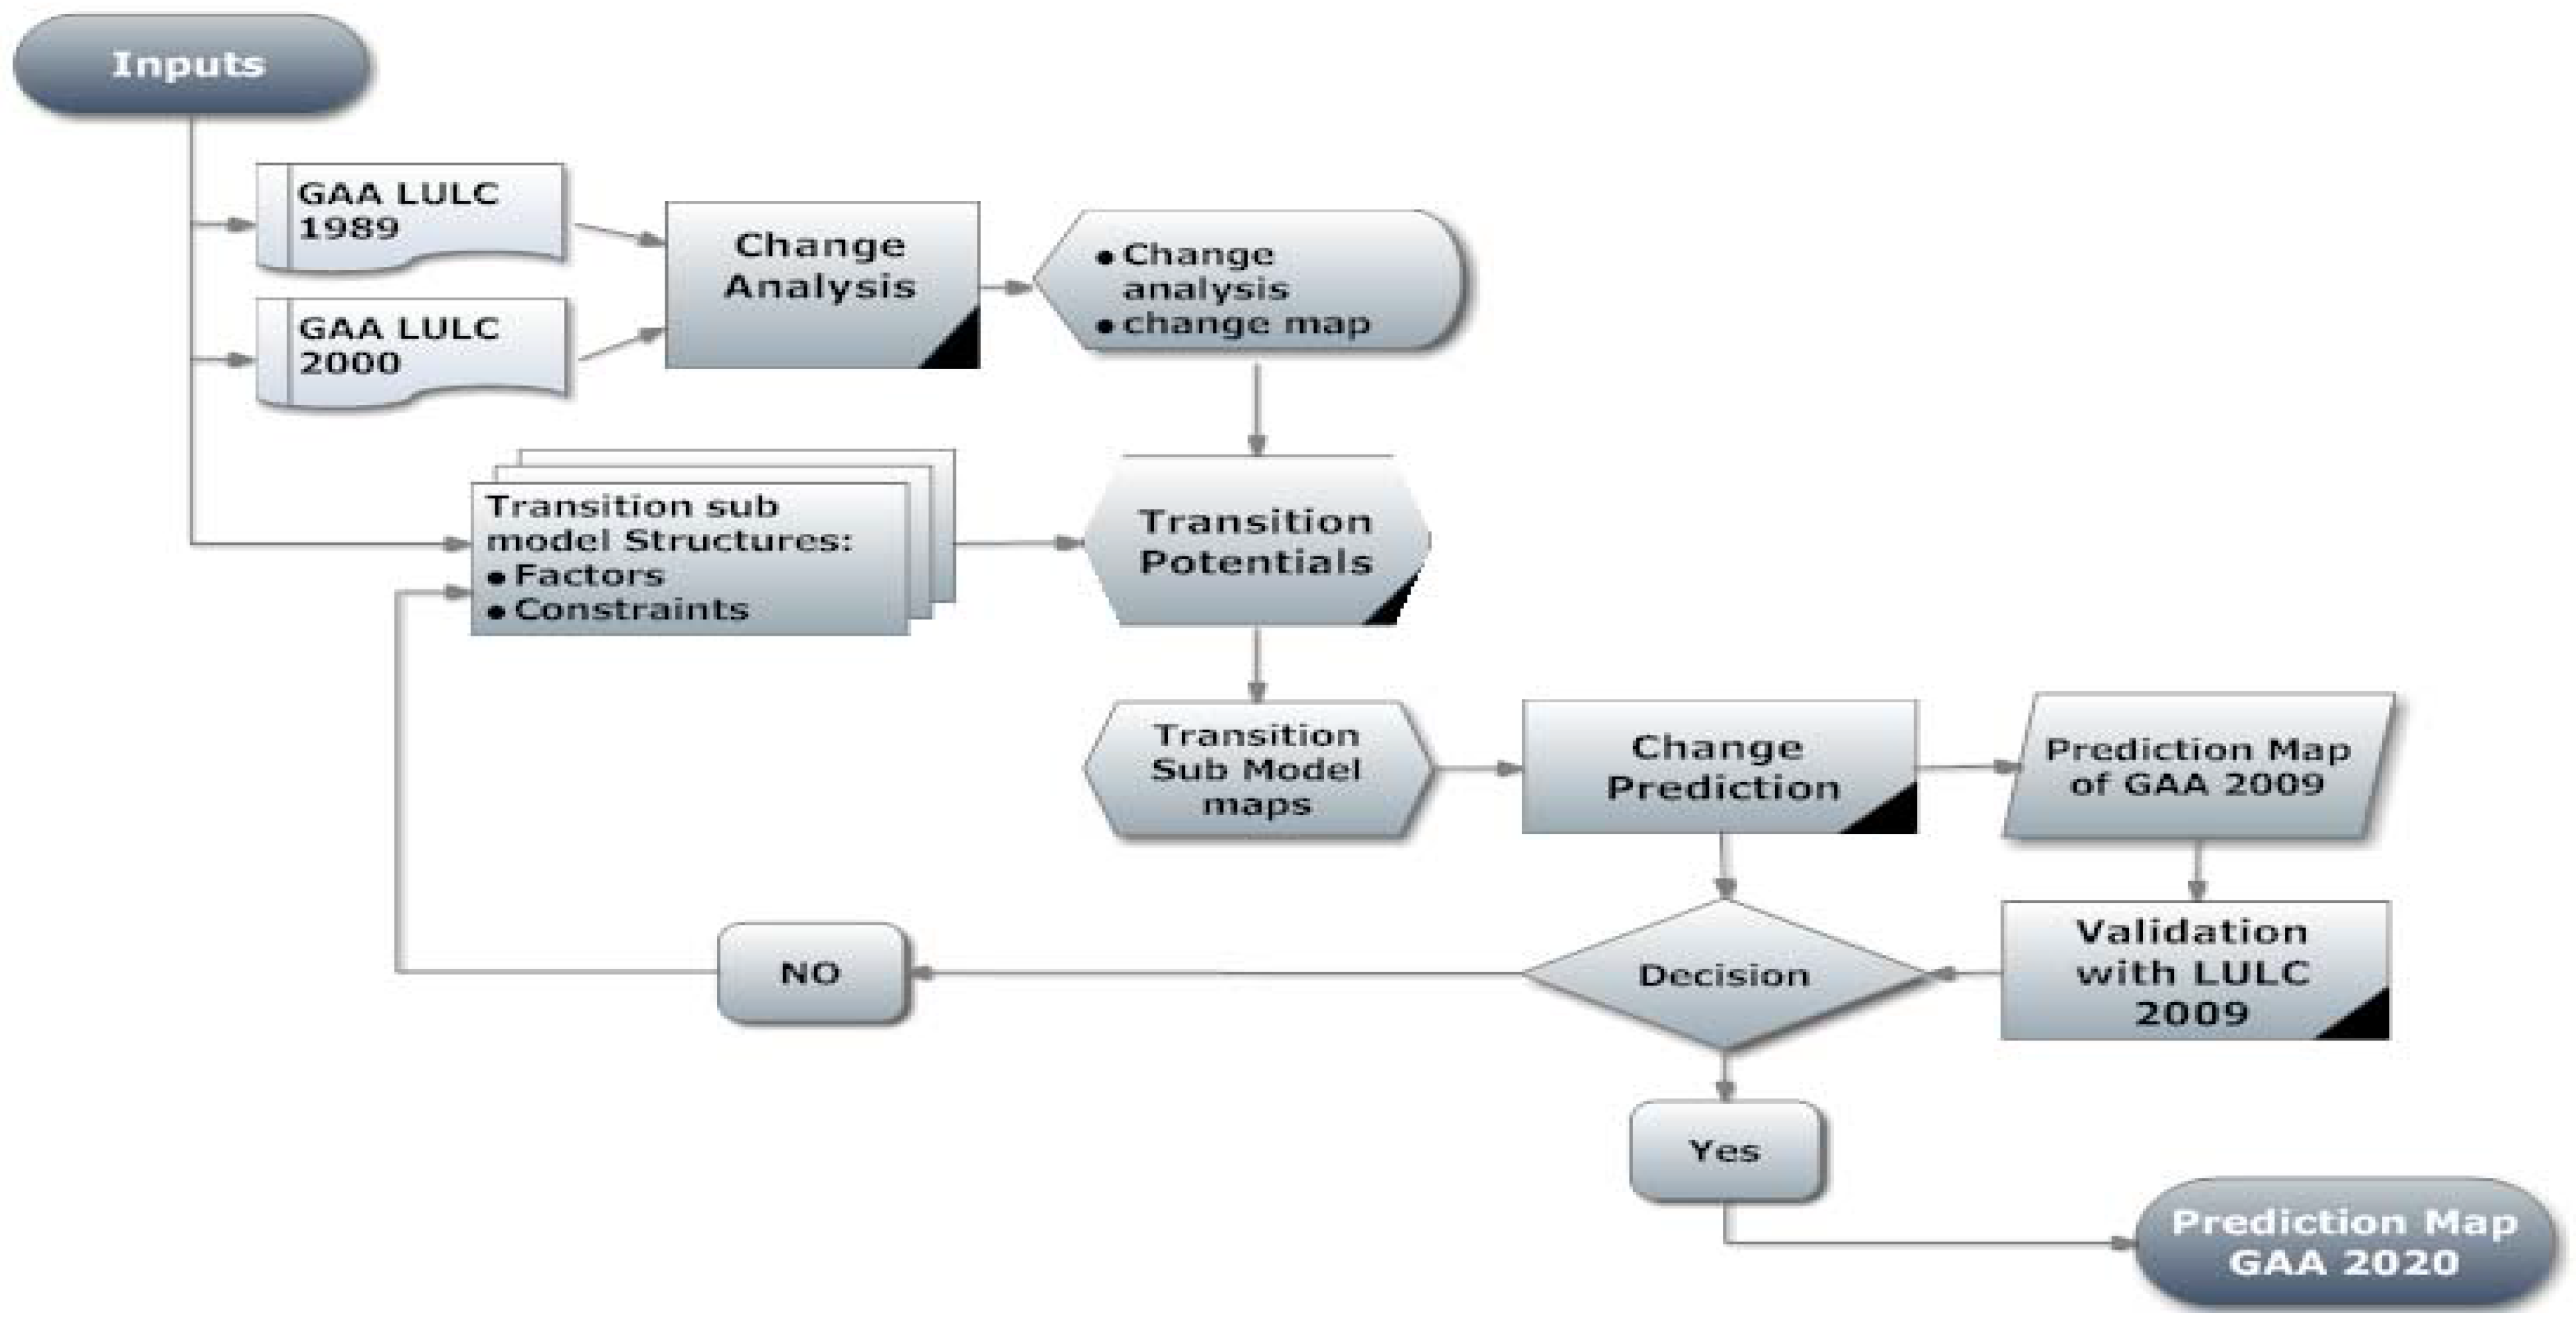
4.3. Urban Growth Model
4.3.1. Urban Landuse Modeling using LCM

4.3.2. Model Validation
5. Results and Discussion
5.1. Landcover Classification and Accuracy Assessment

| Land Class | Producer’s | User’s | KIA per Class | ||||||
|---|---|---|---|---|---|---|---|---|---|
| 1989 | 2000 | 2009 | 1989 | 2000 | 2009 | 1989 | 2000 | 2009 | |
| Built-up | 1 | 1 | 0.98 | 1 | 1 | 1 | 1 | 1 | 0.97 |
| Irrigation | 1 | 1 | 1 | 0.71 | 1 | 0.68 | 1 | 1 | 1 |
| Rainfed | 0.95 | 0.8 | 0.9 | 0.95 | 1 | 0.66 | 0.93 | 0.74 | 0.9 |
| Plantation | 0.88 | 1 | 0.85 | 1 | 0.8 | 1 | 0.87 | 1 | 0.85 |
| Water body | 1 | 1 | 1 | 1 | 1 | 1 | 1 | 1 | 1 |
| Grazing land | 0.88 | 1 | 0.91 | 1 | 1 | 1 | 0.87 | 1 | 0.85 |
| LULC Map of: | 1989 | 2000 | 2009 | ||||||
| Overall accuracy | 0.952 | 0.946 | 0.945 | ||||||
| KIA | 0.937 | 0.934 | 0.918 | ||||||
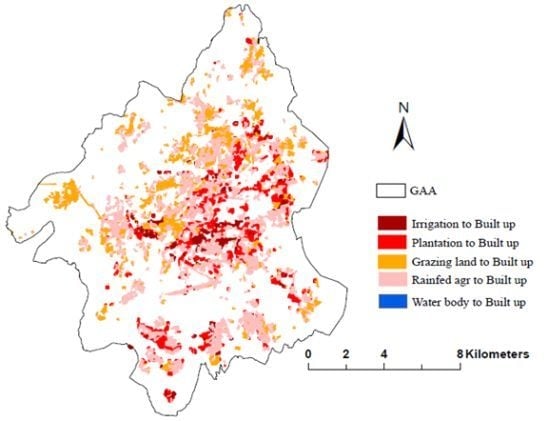
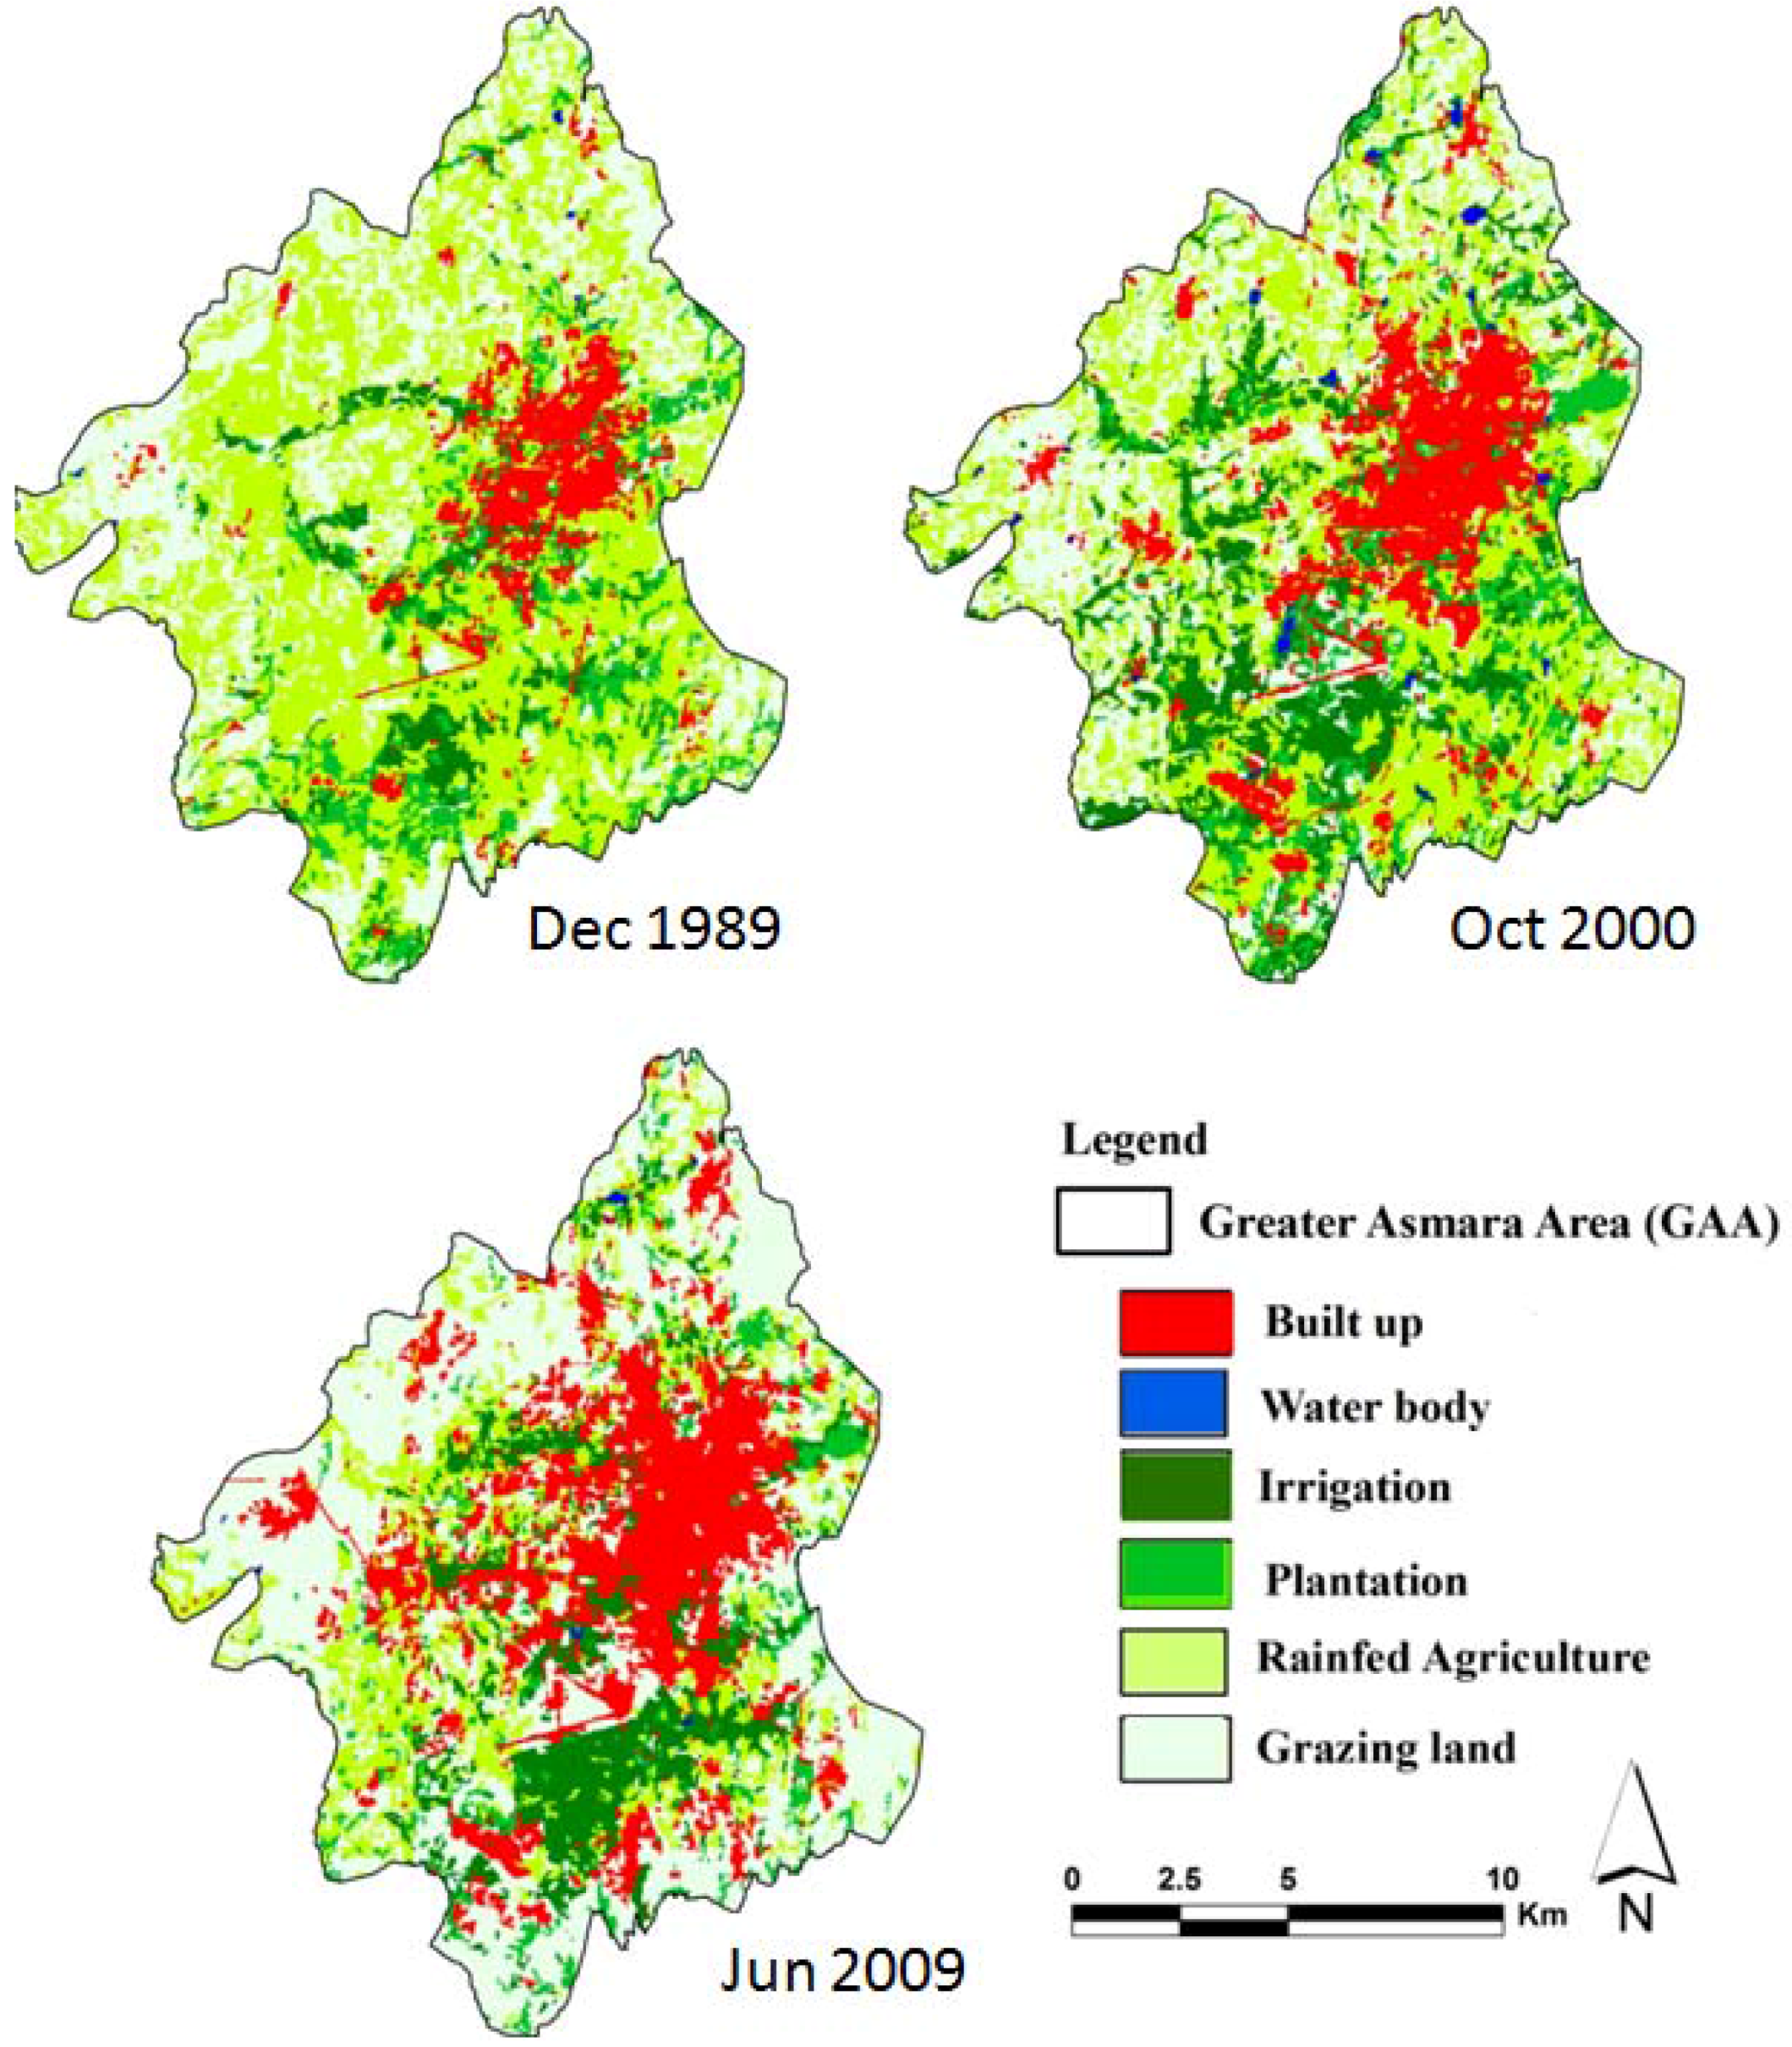
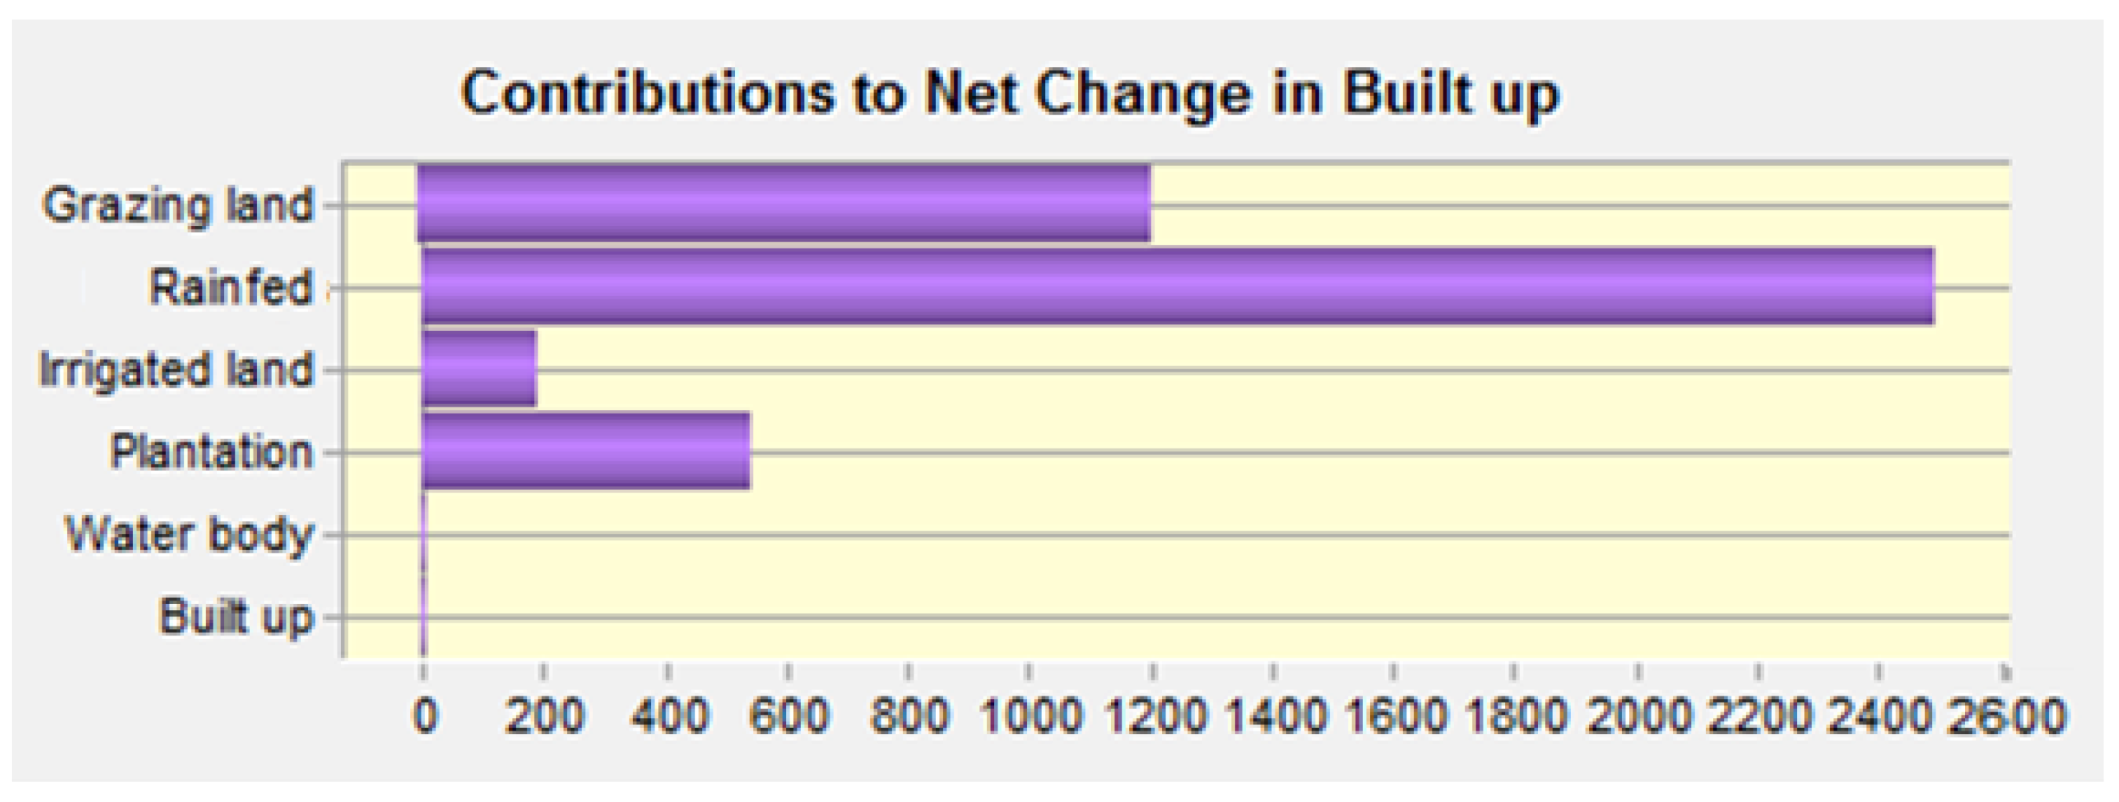
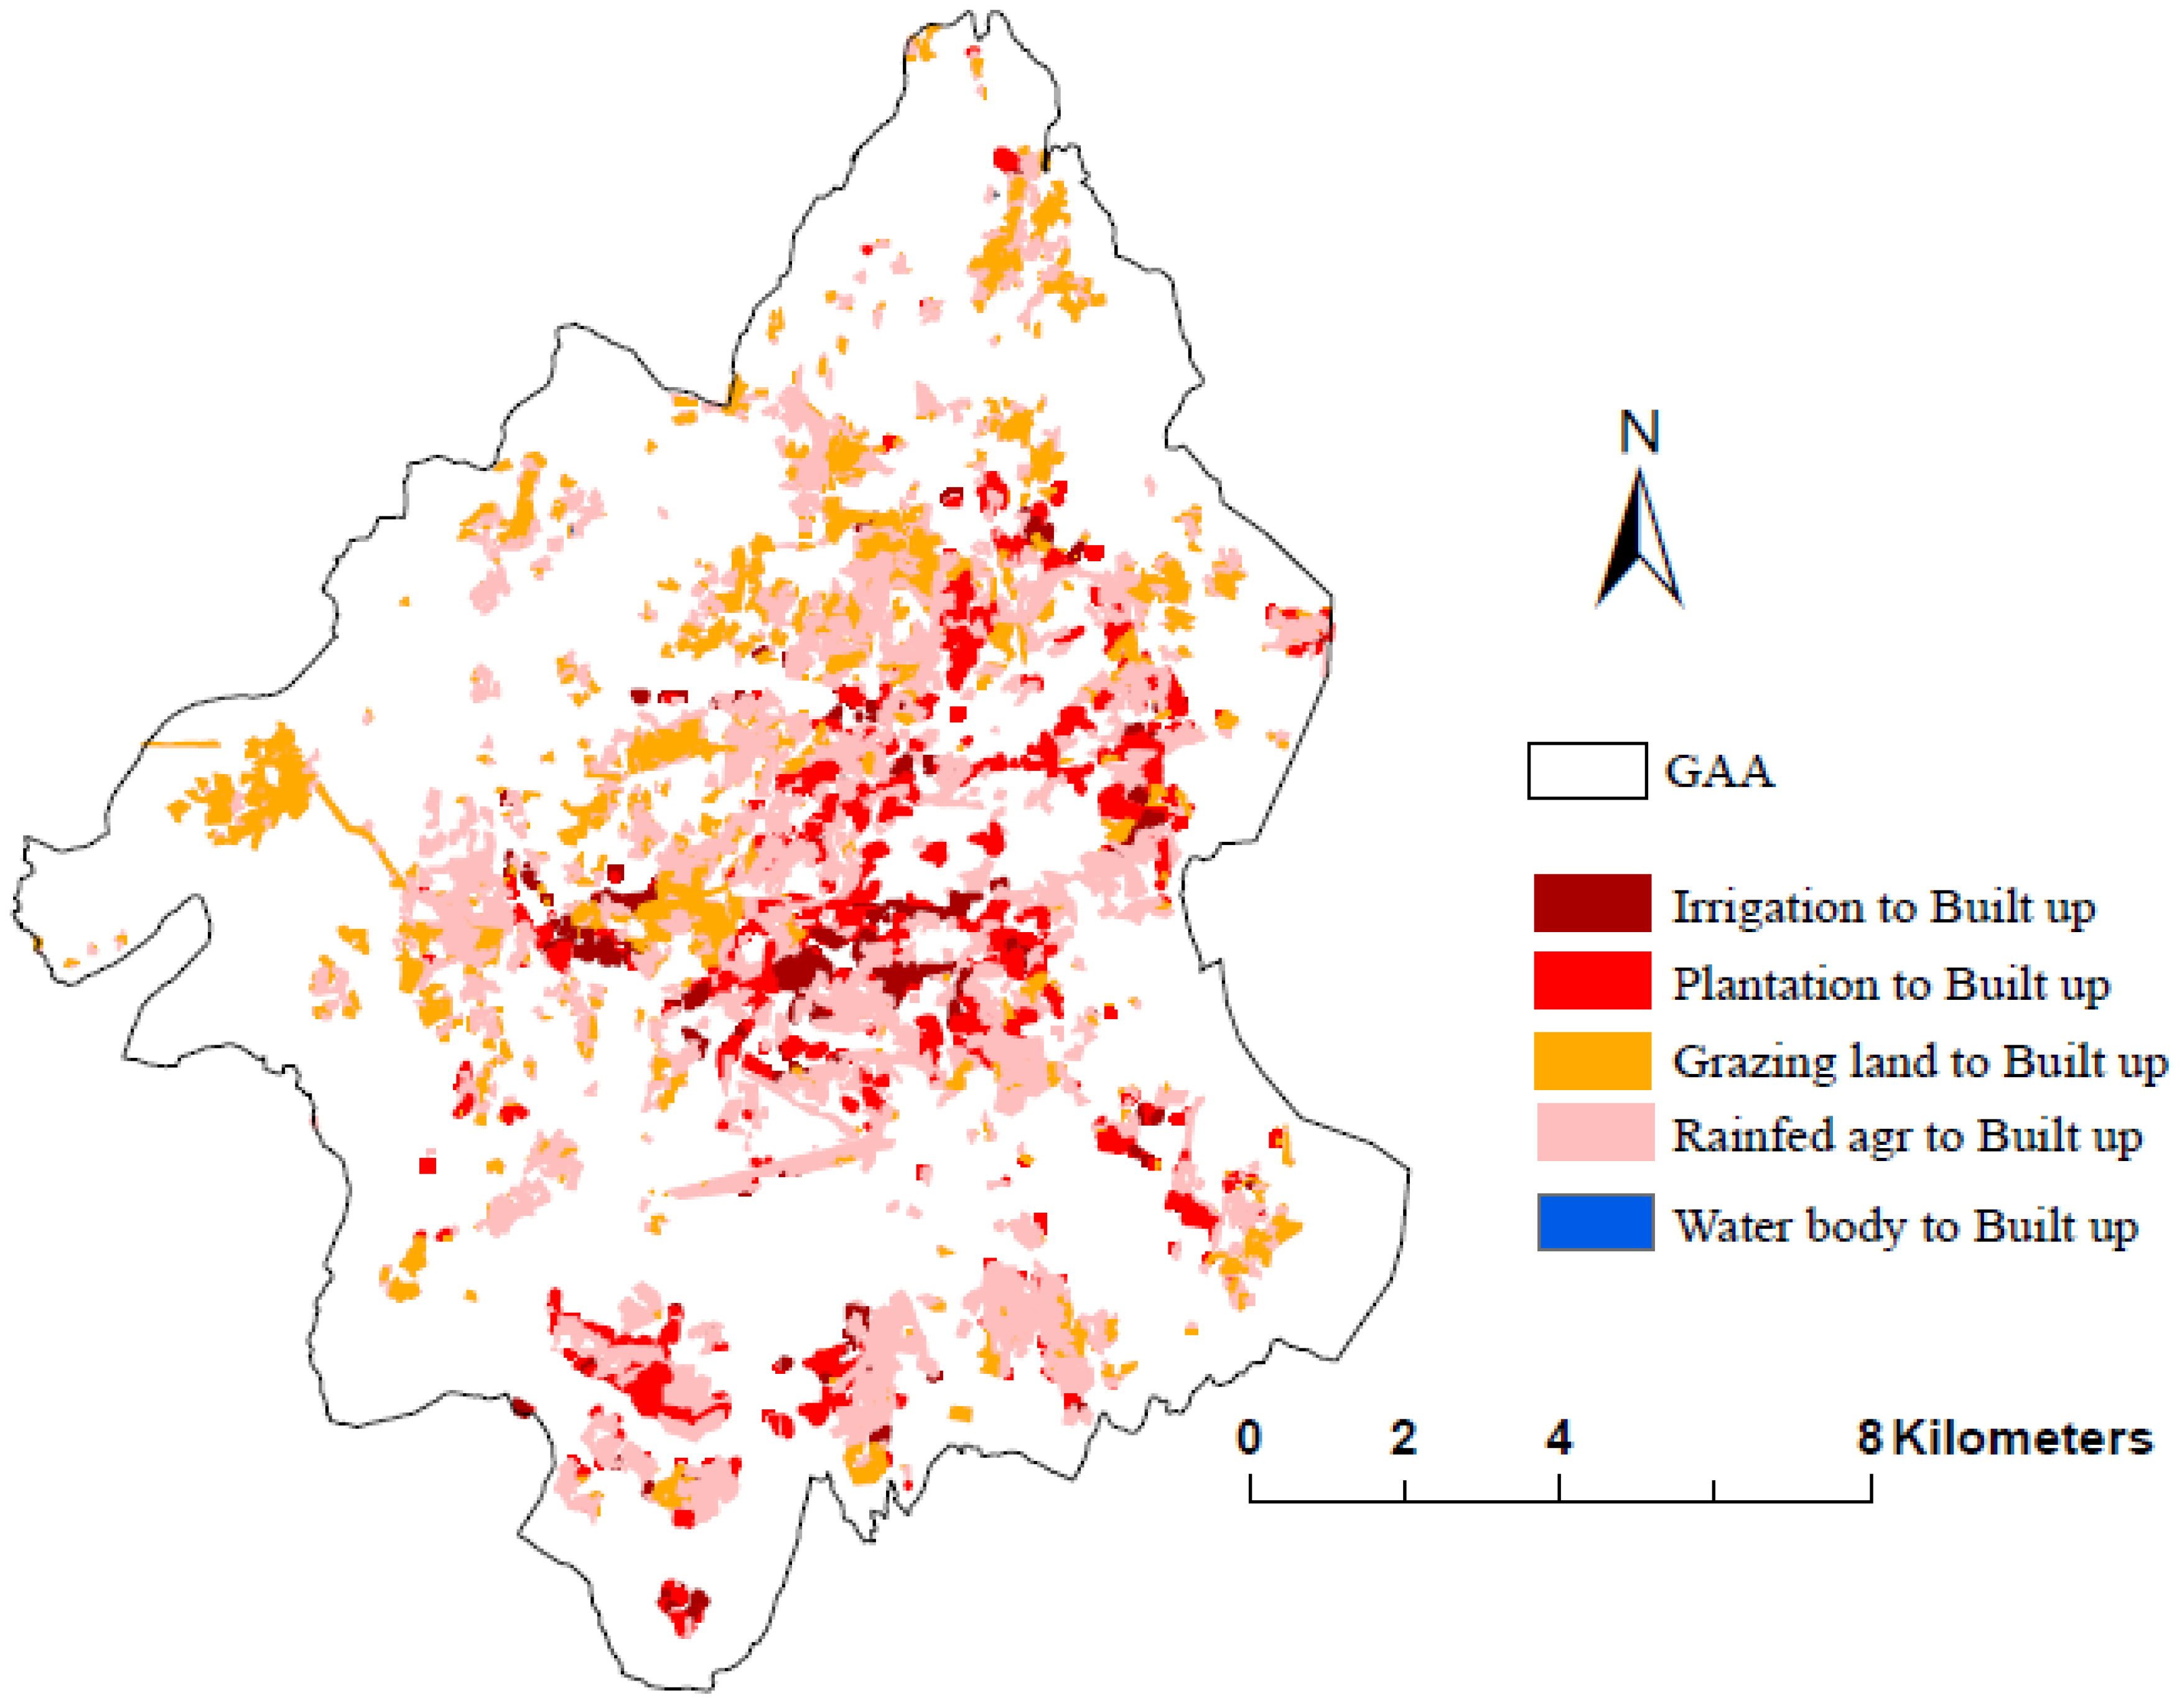
5.2. LUCC Detection, Quantification and Analysis
| Land Class | 1989 | 2000 | 2009 | |||
|---|---|---|---|---|---|---|
| area (ha) | area (%) | area (ha) | area (%) | area (ha) | area (%) | |
| Built-up | 1,464.4 | 6.9 | 3,172.6 | 14.9 | 5,905.0 | 27.8 |
| Grazing land | 6,857.3 | 32.3 | 6,252.9 | 29.4 | 8,767.0 | 41.2 |
| Irrigation | 1,042.3 | 4.9 | 3,150.9 | 14.8 | 2,143.0 | 10.1 |
| Plantation | 2,067.0 | 9.7 | 1,661.4 | 7.8 | 1,156.0 | 5.4 |
| Rainfed | 9,799.4 | 46.1 | 6,916.7 | 32.5 | 3,257.0 | 15.3 |
| Water body | 23.9 | 0.1 | 99.8 | 0.5 | 26.0 | 0.1 |
| Total | 21,254.3 | 21,254.3 | 21,254.0 | |||


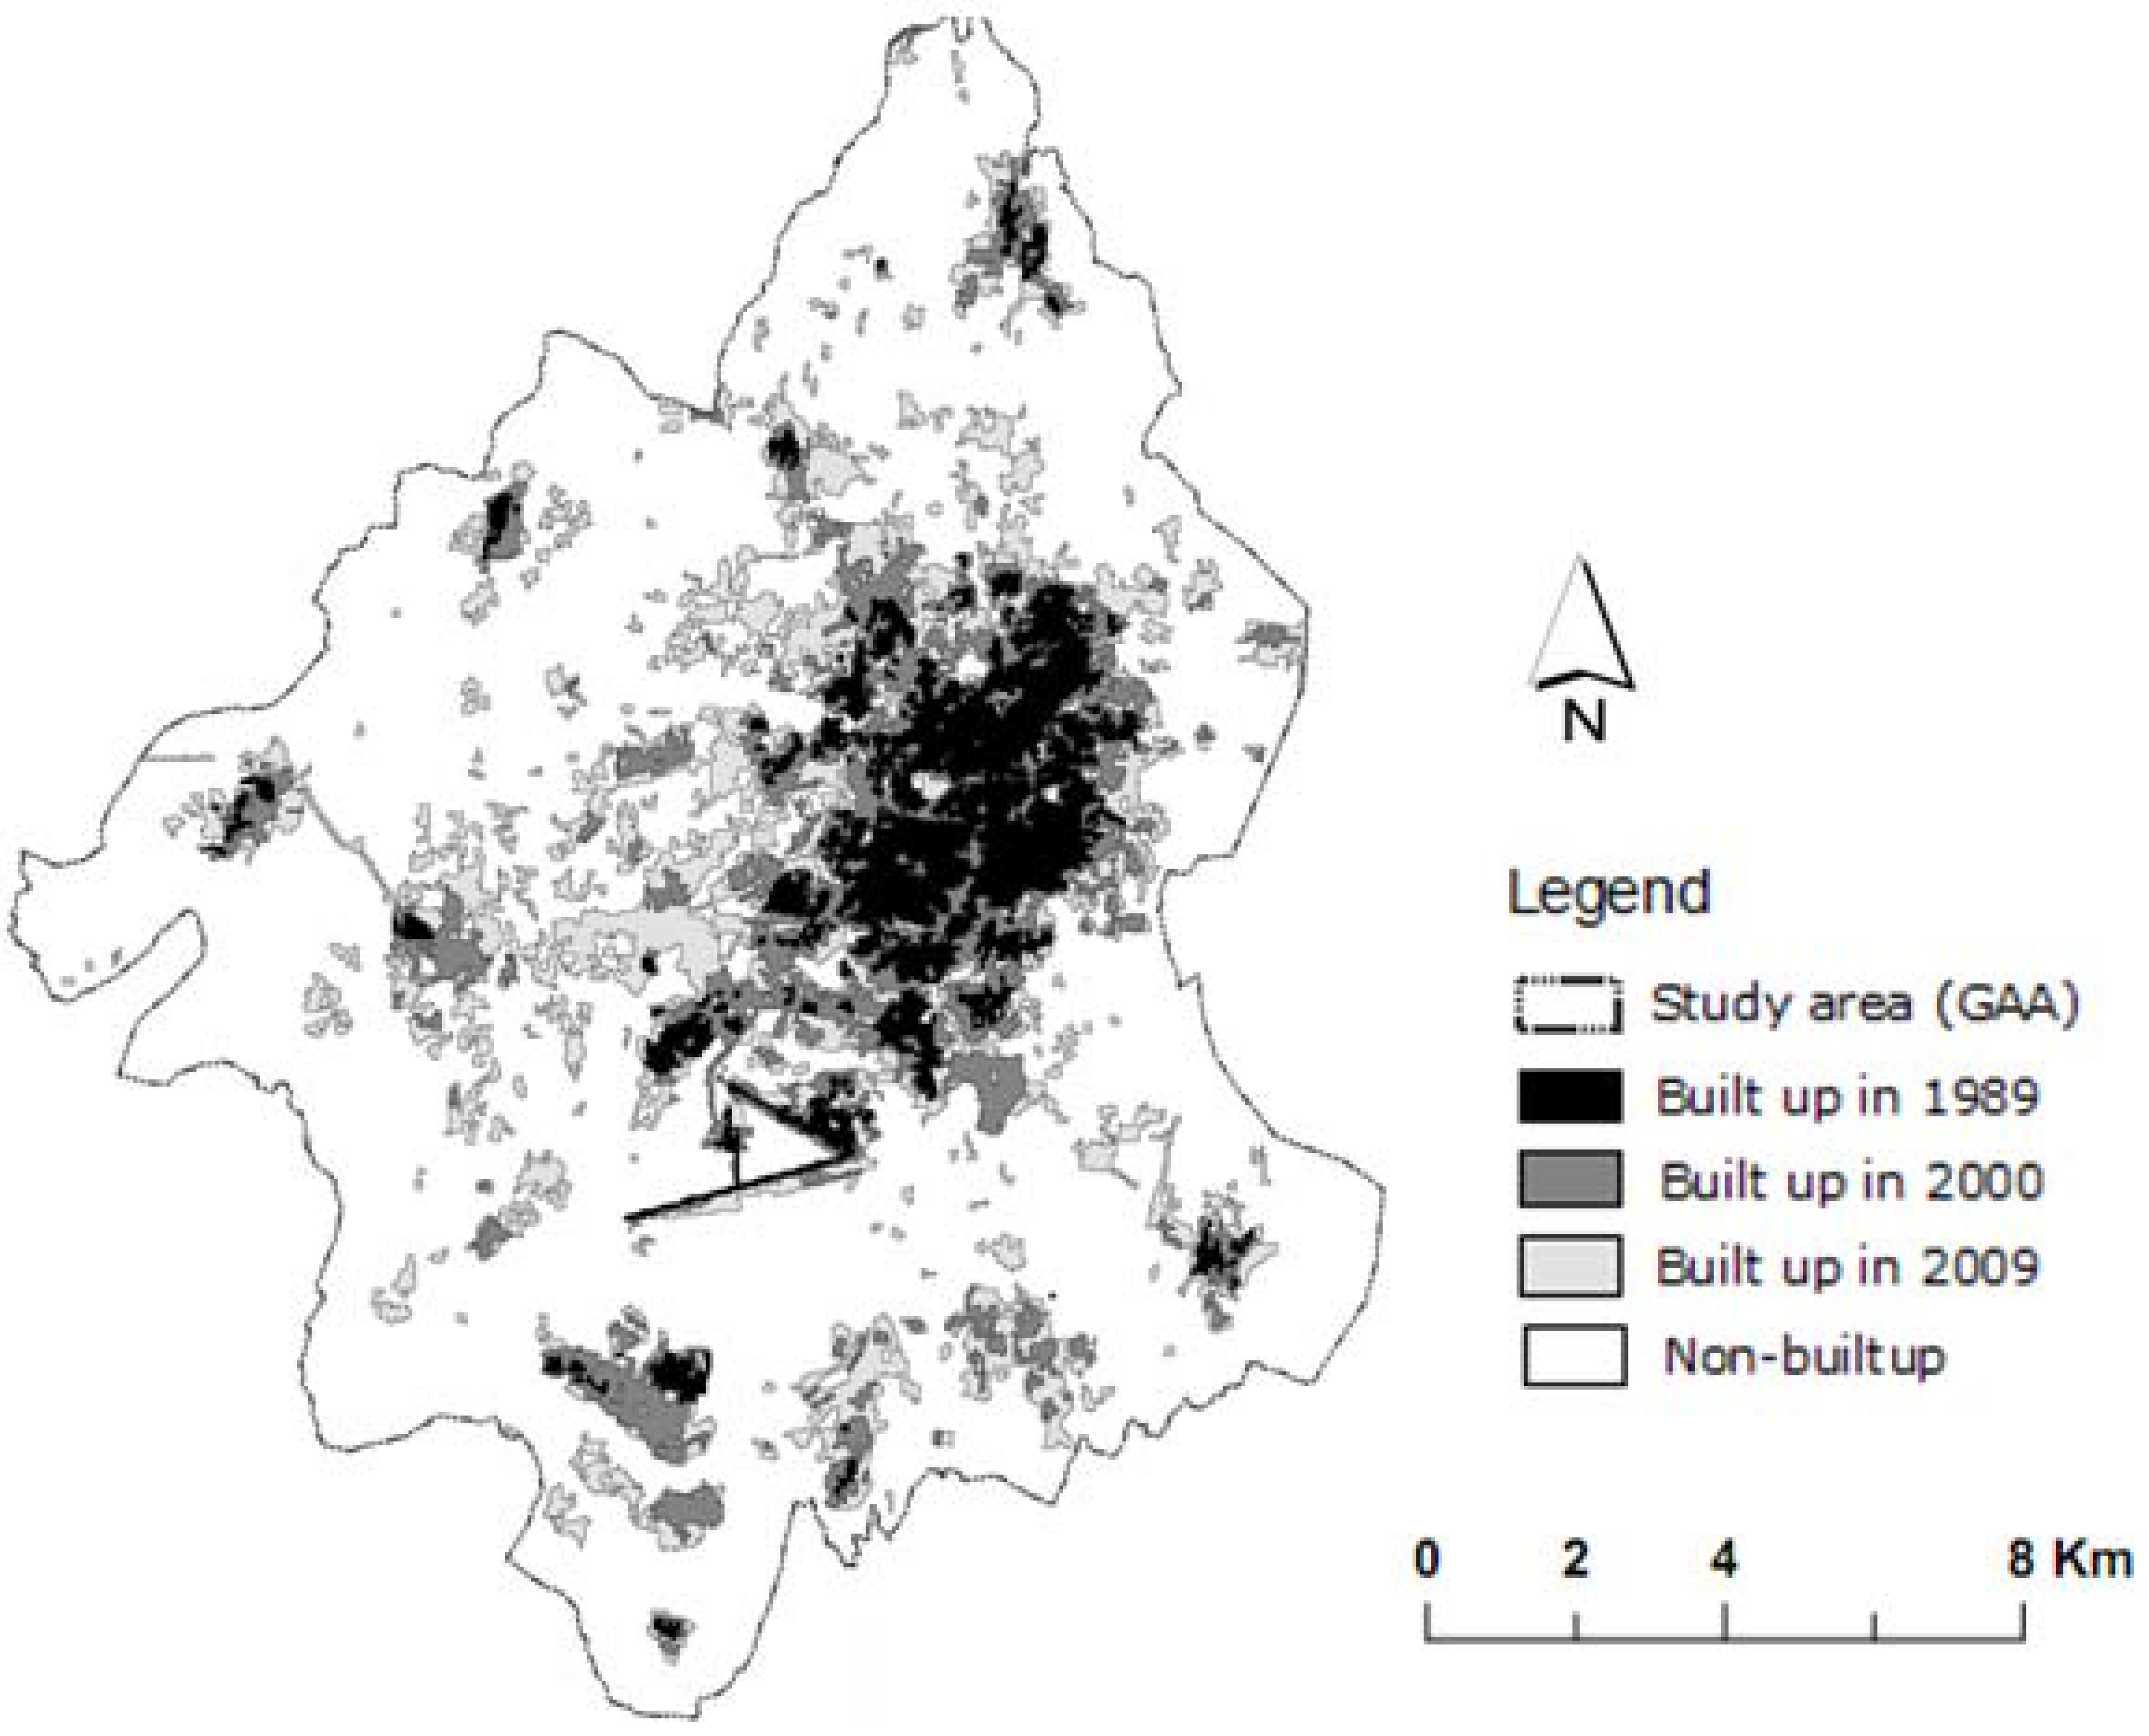
5.3. Urban Sprawl Measurement

| Land class | 1989 | 2000 | 2009 | |||
|---|---|---|---|---|---|---|
| Area (ha) | Area (%) | Area (ha) | Area (%) | Area (ha) | Area (%) | |
| Built up | 1,464.4 | 6.9 | 3,172.6 | 14.9 | 5,905.0 | 27.8 |
| Non built up | 19,789.9 | 93.1 | 18,081.7 | 85.1 | 15,349.0 | 72.2 |
| Total (ha) | 21,254.3 | 100.0 | 21,254.3 | 100.0 | 21,254.0 | 100.0 |
5.4. LUCC Modeling and Validation
| Land class | 2009 | 2020 | ‘Expected’ change in 2020 | |
|---|---|---|---|---|
| in hectares | in% | |||
| Built-up | 5,905.00 | 7,388.83 | 1,483.83 | 25.13 |
| Grazing land | 8,767.00 | 9,225.99 | 458.99 | 5.24 |
| Irrigation | 2,143.00 | 1,738.28 | −404.72 | −18.89 |
| Plantation | 1,156.00 | 910.92 | −245.08 | −21.20 |
| Rainfed | 3,257.00 | 1,964.28 | −1,292.72 | −39.69 |
| Water body | 26.00 | 25.70 | -0.30 | −1.15 |
| Sum | 21,254.00 | 21,254.00 | ||
6. Conclusion
Acknowledgements
References and Notes
- Population Division of the Department of Economic and Social Affairs of the United Nations Secretariat. World Population Prospects: The 2008 Revision and World Urbanization Prospects: The 2009 Revision. Available online: http://esa.un.org/wup2009/unup/ (accessed on 12 May 2010).
- Angel, S.; Sheppard, S.C.; Civco, D. The Dynamics of Global Urban Expansion; The World Bank Transportation and Urban Development Department: Washington, DC, USA, 2005; p. 206. [Google Scholar]
- United Nations Population Fund. The State of the World Report. Unleashing the Potential of Urban Growth; United Nations Population Fund: New York, NY, USA, 2007. [Google Scholar]
- Cheng, J. Modeling Spatial & Temporal Urban Growth. Ph.D. Thesis, Faculty of Geographical Sciences, Utrecht University, Utrecht, The Netherlands, 2003. [Google Scholar]
- Bhatta, B. Analysis of Urban Growth and Sprawl from Remote Sensing Data; Springer-Verlag: Berlin/Heidelberg, Germany, 2010. [Google Scholar]
- Rahman, G.; Alam, D.; Islam, S. City Growth with Urban Sprawl and Problems of Management. In Proceedings of the 44th ISOCARP Congress, Dalian, China, 19–23 September 2008.
- Ministry of Land Water and Environment, Department of Environment. Support the Development of Legislative and Regulatory Framework and the Strengthening of Government’s Capacity for Effective Natural Resources Management; MoLWE-DoE: Asmara, Eritrea, 2005; pp. 22–23.
- BCEOM/Groupe Huit-Optima. Asmara Infrastructure Development Study, Executive Summary of the Strategic Urban Development Plan; July 2006; pp. 8–11. [Google Scholar]
- Proclamation No. 58/1994 to reform the System of Land Tenure in Eritrea, to Determine the Manner of Expropriating Land for Purposes of National Development, and to Determine the Powers and Duties of the Land Commission; Ministry of Land Water and Environment, Department of Land: Asmara, Eritrea, 1994.
- Goodchild, M.F. Spatial analysis: Methods and problems in land use management. In Spatial Information for Land Use Management; Hill, M.J., Aspinall, R.J., Eds.; Gordon and Breach Science Publishers: Singapore, 2000; pp. 39–50. [Google Scholar]
- Masser, I. Managing our urban future: The role of remote sensing and geographic information systems. Habitat Int. 2001, 25, 503–512. [Google Scholar] [CrossRef]
- Im, J.; Jensen, J.; Tullis, J. Object-based change detection using correlation image analysis and image segmentation. Int. J. Remote Sens. 2008, 29, 399–423. [Google Scholar] [CrossRef]
- Herold, M.; Goldstein, N.; Clarke, K. The spatio-temporal form of urban growth: Measurement, analysis and modeling. Remote Sens. Environ. 2003, 85, 95–105. [Google Scholar]
- Li, X.; Yeh, A.G.O. Analyzing spatial restructuring of land use patterns in a fast growing region using remote sensing and GIS. Landscape Urban Plan. 2004, 69, 335–354. [Google Scholar] [CrossRef]
- Weng, Y. Spatiotemporal changes of landscape pattern in response to urbanization. Landscape Urban Plan. 2007, 81, 341–353. [Google Scholar] [CrossRef]
- Yuan, F.; Sawaya, K.; Loeffelholz, B.; Bauer, M. Land cover classification and change analysis of the Twin cities (Minnesota) metropolitan area by multitemporal Landsat. Remote Sens. Environ. Remote Sens. Environ. 2005, 98, 317–328. [Google Scholar] [CrossRef]
- Food and Agriculture Organization (FAO). Country Profile. Available online: http://www.fao.org/ag/AGP/AGPC/doc/Counprof/eritrea/Eritrea.htm (accessed on 15 October 2010).
- US Geological Survey Earth Resources Observation & Science Center (EROS), USGS, Sioux Falls, SD, USA. Available online: http://earthexplorer.usgs.gov/ (accessed on 21 April 2010).
- NASA Land Processes Distributed Active Archive Center (LP DAAC). ASTER L1B. USGS/Earth Resources Observation and Science (EROS) Center: Sioux Falls, SD, USA, 2001. Available online: http://www.gdem.aster.ersdac.or.jp/ (Accessed on 12 April 2010). [Google Scholar]
- Masek, J.G.; Lindsay, F.E.; Goward, S.N. Dynamics of urban growth in the Washington DC metropolitan area, 1973–1996, from Landsat observations. Int. J. Remote Sens. 2000, 21, 3473–3486. [Google Scholar] [CrossRef]
- Kaufmann, R.; Seto, K. Change detection, accuracy, and bias in a sequential analysis of Landsat imagery in the Pearl River Delta, China: econometric techniques. Agr. Ecosyst. Environ. 2001, 86, 286–302. [Google Scholar] [CrossRef]
- Gluch, R. Urban growth detection using texture analysis on merged Landsat TM and SPOT-P data. Photogramm. Eng. Remote Sens. 2002, 68, 1283–1288. [Google Scholar]
- Herold, M.; Scepan, J.; Clarke, C. The use of remote sensing and landscape metrics to describe structures and changes in urban land uses. Environ. Plan. 2002, 34, 1443–1458. [Google Scholar] [CrossRef]
- Cabral, P.; Gilg, J.-P.; Painho, M. Monitoring Urban Growth Using Remote Sensing, GIS and Spatial Metrics. In Proceedings of SPIE Optics & Photonics: Remote Sensing and Modeling of Ecosystems for Sustainability; San Diego, CA, USA, 2005; pp. 1–9. [Google Scholar]
- Cabral, P.; Zamyatin, A. Three Land Change Models for Urban Dynamics Analysis in Sintra-Cascais Area. In Proceedings of the 1st EARSel Workshop of the SIG Urban Remote Sensing, Berlin, Germany, 2–3 March 2006.
- Anderson, J.; Hardy, E.; Roach, J.; Witner, R. A Land Use and Land Cover Classification System for Use with Remote Sensor Data; US Geological Survey Professional Paper 964; USGS: Washington, DC, USA, 1976.
- Wulder, M.A.; Franklin, S.E. Understanding Forest Disturbance and Spatial Pattern: Remote Sensing and GIS Approaches; CRC Press: Boca Raton, FL, USA, 2007; p. 252. [Google Scholar]
- Araya, Y.H.; Cabral, P. Analysis and Modeling of Urban Land Cover Change in Setúbal and Sesimbra, Portugal. Remote Sens. 2010, 2, 1549–1563. [Google Scholar] [CrossRef]
- Navulur, K. Multispectral Image Analysis Using the Object-Oriented Paradigm; CRC Press: Boca Raton, FL, USA, 2007; p. 165. [Google Scholar]
- Food and Agriculture Organization of the United Nations, Rome. Africover: Specifications for Geometry and Cartography; Environment and Natural Resources Series; FAO: Rome, Italy, 2000; p. 67. [Google Scholar]
- Benz, U.C.; Hofmann, P.; Willhauck, G.; Lingenfelder, I.; Heynen, M. Multi-resolution, object-oriented fuzzy analysis of remote sensing data for GIS-ready information. ISPRS Photogramm. Remote Sens. 2004, 58, 239–258. [Google Scholar] [CrossRef]
- Definiens. eCognition Developer 8 Reference Book User Guide, Version 1.2.0; Definiens AG: München, Germany, 2009; 34–38.
- Lewinski, S. Applying Fused Multispectral and Panchromatic Data of Landsat ETM+ to Object Oriented Classification. In Proccedings of the 26th EARSeL Symposium, New Developments and Challenges in Remote Sensing, Warsaw, Poland, 29 May–2 June 2006.
- Congalton, R.G. A review of assessing the accuracy of classifications of remotely sensed data. Remote Sens. Environ. 1991, 37, 35–46. [Google Scholar] [CrossRef]
- Mucher, C.; Steinnocher, K.; Kressler, F. Land cover characterization and change detection for environmental planning of Pan-Europe. Int. J. Remote Sens. 2000, 21, 1159–1181. [Google Scholar] [CrossRef]
- Weng, Q. Land use change analysis in the Zhujiang Delta of China using satellite remote sensing, GIS and stochastic modelling. J. Environ. Manage. 2002, 64, 273–284. [Google Scholar] [CrossRef] [PubMed]
- Heinimann, A.; Breu, T.; Kohler, T. The challenge of applying geographic information systems to sustainable mountain development. Mt. Res. Dev. 2003, 23, 312–319. [Google Scholar] [CrossRef]
- Singh, A. Review Article Digital change detection techniques using remotely-sensed data. Int. J. Remote Sens. 1989, 10, 989–1003. [Google Scholar] [CrossRef]
- Jensen, J.R. Introductory Digital Image Processing: A Remote Sensing Perspective, 2nd ed.; Prentice-Hall: Englewood Cliffs, NJ, USA, 1996. [Google Scholar]
- Wilson, E.H.; Hurd, J.D.; Civco, D.L.; Prisloe, S.; Arnold, C. Development of a geospatial model to quantify, describe and map urban growth. Remote Sens. Environ. 2003, 86, 275–285. [Google Scholar] [CrossRef]
- Yeh, A.; Li, X. Measurement and monitoring of urban sprawl in a rapidly growing region using entropy. Photogramm. Eng. Remote Sens. 2001, 67, 83–90. [Google Scholar]
- Sun, H.; Forsythe, W.; Waters, N. Modeling urban land use change and urban sprawl: Calgary, Alberta, Canada. Netw. Spat. Econ. 2007, 7, 353–376. [Google Scholar] [CrossRef]
- Bhatta, B.; Saraswati, S.; Bandyopadhyay, D. Quantifying the degree-of-freedom, degree-of-sprawl, and degree-of-goodness of urban growth from remote sensing data. Appl. Geogr. 2010, 30, 96–111. [Google Scholar] [CrossRef]
- Leta, M.; Prasad, K.; Bandarinath, K.; Raghavaswamy, R.; Rao, S. Measuring urban sprawl: A case study of Hyderabad. GIS Dev. 2001, 5. Available online: http://www.geospatialworld.net/index.php?option=com_content&view=article&id=16659%3Ameasuring-urban-sprawl-a-case-study-of-hyderabad&catid=158%3Aurban-planning-urban-sprawl&Itemid=41 (accessed on 20 May 2010).
- Sudhira, H.S.; Ramachandra, T.V.; Jagadish, K.S. Urban sprawl: Metrics, dynamics and modeling using GIS. Int. J. Appl. Earth Obs. Geoinf. 2004, 5, 29–39. [Google Scholar] [CrossRef]
- Lee, J.; Klosterman, E.R.; Salling, M.; Kulikowski, T.D. Development of a Community Accessible Urban Sprawl Impact Assessment System in Northeast Ohio, 15-County Region for the Empact Project; Phase One Report. US EPA: Washington, DC, USA, 1999. Available online: http://gis.kent.edu/gis/empact/filelib/review.pdf (accessed on 2 November 2010).
- Pontius, R.G., Jr.; Chen, H. Land Change Modeling with GEOMOD; Clark University: Worcester, MA, USA, 2006. [Google Scholar]
- Eastman, R.J. IDRISI Andes, Guide to GIS and Image Processing; Clark University: Worcester, MA, USA, 2006; pp. 87–131. [Google Scholar]
- Rumelhart, D.; Hinton, G.; Williams, R. Learning internal representations by error propagation. Parallel distributed processing: Explorations in the microstructures of cognition. Nature 1986, 1, 318–362. [Google Scholar]
- Langley, S.K.; Cheshire, H.M.; Humes, K.S. A Comparison of single data and multitemporal satellite image classification in semi-arid grassland. J. Arid Environ. 2001, 49, 401–410. [Google Scholar] [CrossRef]
- Pontius, G.R. Quantification error versus location error in comparison of categorical maps. Photogramm. Eng. Remote Sens. 2000, 66, 1011–1016. [Google Scholar]
- Anderson, J.; Hardy, E.; Roach, J.; Witner, R. A Land Use and Land Cover Classification System for Use with Remote Sensor Data; US Geological Survey Professional Paper 964; USGS: Washington, DC, USA, 1978.
- Abraham, D.; Filmon, T.; Selamawit, T. An Appraisal of the Current Status and Potential of Surface Water in Upper Anseba Catchment, Eritrea; SLM Eritrea; CDE: Bern, Switzerland, 2009. [Google Scholar]
- Negassi, A.; Bein, E.; Ghebru, K.; Tengnas, B. Soil and Water Conservation Manual for Eritrea; RELMA Technical Handbook, Series 29; RELMA: Nairobi, Kenya, 2002. [Google Scholar]
- Buiton, P.J. A vision for equitable land use allocation. Land Use Policy 1994, 12, 63–68. [Google Scholar]
- Buliung, R.N.; Kanaroglou, P.S. Urban form and household activity travel behavior. Growth Change 2006, 37, 172–178. [Google Scholar] [CrossRef]
- Johnson, M.P. Environmental impacts of urban sprawl: A survey of the literature and proposed research agenda. Environ. Plan. 2001, 33, 717–735. [Google Scholar] [CrossRef]
- Proclamation No. 31/1997 for Land Allocation System and Land Administration Decision; Ministry of Land Water and Environment, Department of Land: Asmara, Eritrea, 1997.
© 2011 by the authors; licensee MDPI, Basel, Switzerland. This article is an open access article distributed under the terms and conditions of the Creative Commons Attribution license (http://creativecommons.org/licenses/by/4.0/).
Share and Cite
Tewolde, M.G.; Cabral, P. Urban Sprawl Analysis and Modeling in Asmara, Eritrea. Remote Sens. 2011, 3, 2148-2165. https://0-doi-org.brum.beds.ac.uk/10.3390/rs3102148
Tewolde MG, Cabral P. Urban Sprawl Analysis and Modeling in Asmara, Eritrea. Remote Sensing. 2011; 3(10):2148-2165. https://0-doi-org.brum.beds.ac.uk/10.3390/rs3102148
Chicago/Turabian StyleTewolde, Mussie G., and Pedro Cabral. 2011. "Urban Sprawl Analysis and Modeling in Asmara, Eritrea" Remote Sensing 3, no. 10: 2148-2165. https://0-doi-org.brum.beds.ac.uk/10.3390/rs3102148