1. Introduction
Most shallow coastal waters, especially estuaries and bays, contain moderate-to-high concentrations of suspended particles derived from freshwater inflow, horizontal advection from adjacent environments or the resuspension of local bottom sediments. Temporal changes in the influx of suspended particulate concentration can reflect an integrated response to changes in land cover and land use practices in watersheds coupled to coastal waters. Total suspended matter (TSM) containing both inorganic and organic particles suspended within the water column often can govern the overall water quality of an aquatic system and control many biological, chemical and geological processes. A major effect that TSM has on water quality is its influence on the underwater light field. Through absorption and scattering, TSM can alter the spectral nature and reduce light intensity to a level that significantly limits phytoplankton production within the water column [
1,
2,
3,
4,
5,
6] and primary production of submerged vegetation on the seabed [
7,
8,
9]. Coral reefs are negatively impacted by the deposition of TSM [
10,
11]. Several investigators [
12,
13,
14] have reported the redistribution and transport of water-borne pathogens, pollutants, and other materials associated with TSM dynamics thereby proving a direct link between TSM and human health. Hence, there is considerable interest in monitoring the transport and fate of TSM from a broad range of investigators, environmental managers, and policy makers.
Although the use of remote sensing to map TSM concentration or indices of water clarity such as turbidity is well established for several sensors ([
15] and references therein), various attributes of a coastal system (e.g., small surface area, complex shoreline geometry) or particular aspects of TSM dynamics (e.g., high temporal variability, high spatial gradients) can significantly limit the application of a given sensor. In general, the spatial resolution or ground sampling distance (GSD) and revisit period of a sensor largely defines the utility of a sensor’s data to a coastal environment. For example, Miller and McKee [
16] demonstrated that TSM concentration could be mapped successfully for a variety of coastal waters using MODIS 250 m band 1 data using a simple atmospheric correction model. Numerous other investigators (e.g., [
17,
18,
19,
20,
21]) provide additional evidence that MODIS 250 m data can be used to examine water quality parameters related to TSM concentration using various atmospheric correction methods, image processing techniques and collection of field data.
The use of MODIS 250 m data has been reasonably robust in coastal and inland waters because scattering from suspended material frequently dominates the reflectance spectra in the red region of the electromagnetic spectrum when compared to pure water, phytoplankton and CDOM (Colored Dissolved Organic Matter) absorption [
22,
23]. Additionally, atmospheric correction schemes based on near-IR radiances perform better in the red than short-wavelength visible (e.g., blue) regions of the spectrum. TSM images or maps thus can be created from MODIS data at a high temporal frequency (daily), moderate spatial resolution (250 m pixel) and large spatial scale (2,300 km swath) and used to investigate coastal processes related to the dynamics of TSM in a range of sufficiently large coastal aquatic systems.
Recently, Miller and Buonassissi [
24] conducted preliminary investigations on material transport in the Albemarle-Pamilco Estuarine System (APES) in North Carolina, USA using MODIS 250 m TSM images. A major obstacle to performing these investigations was a severe lack of historical TSM field data in which to develop a regional MODIS algorithm. The limited field data did, however, confirm that the MODIS 250 m TSM algorithm reported by Miller and McKee [
16] was appropriate for describing TSM distributions in the large sounds and embayments of the APES. In general, MODIS 250 m data proved very useful in examining large-scale dynamics of TSM, however, the 250 m pixel resolution was too coarse scale to resolve TSM concentrations within several estuaries, embayments and coastal inlets due to their small surface area or complex shoreline geometry. Given the paucity of historical field data for the APES and major cost associated with field campaigns, the study presented here was an effort to assess whether MODIS-derived TSM images could be used as a base image in which to develop TSM algorithms for two additional sensors that provide images at different spatial resolutions. Further, if this approach yielded similar estimates of TSM concentration, then a multi-sensor approach employing a range of image resolutions could then provide a comprehensive analysis of TSM dynamics throughout the entire APES and be used to direct future campaigns to acquire much needed field data.
2. Data and Methods
To develop a multi-sensor approach to examining the dynamics of TSM, we acquired same day images of the lower APES from three sensors with different spatial resolutions: MODIS (250 m), Landsat 7 ETM+ (30 m) and FORMOSAT-2 remote sensing instrument (RSI) (8 m). These sensors were selected in part because each sensor has a red reflectance band for measuring TSM concentrations following the procedure of Miller and McKee [
16]. Additionally, the MODIS and Landsat ETM+ instruments are well characterized and data are readily available at no cost. Similarly, the FORMOSAT-2 has unique imaging capabilities (see below) suggesting that the RSI could be used to image highly dynamic systems.
The revisit time for the sensors is 1, 1.5 and 16 days for FORMOSAT-2 RSI, MODIS and Landsat 7 ETM+, respectively. Since the Landsat ETM+ onboard the Landsat 7 satellite has the longest revisit time of 16 days, FORMOSAT-2 RSI acquisitions (see
Section 2.4 below) were made on 8 November, 24 November and 10 December 2010 corresponding to the Landsat 7 ETM+ overpass of the study area. Two MODIS instruments are currently operational. One is onboard the Terra and one on the Aqua satellite. MODIS Terra images the North Carolina coast at
ca. 1030 while MODIS Aqua images the same region at
ca. 1330 local time. Location of the APES within the three MODIS Terra images acquired during the study period were near nadir and therefore used in this study to avoid potential problems with coregistration of sensor images and atmospheric correction.
2.1. Study Site—The Ablemarle-Pamlico Estuarine System, NC, USA
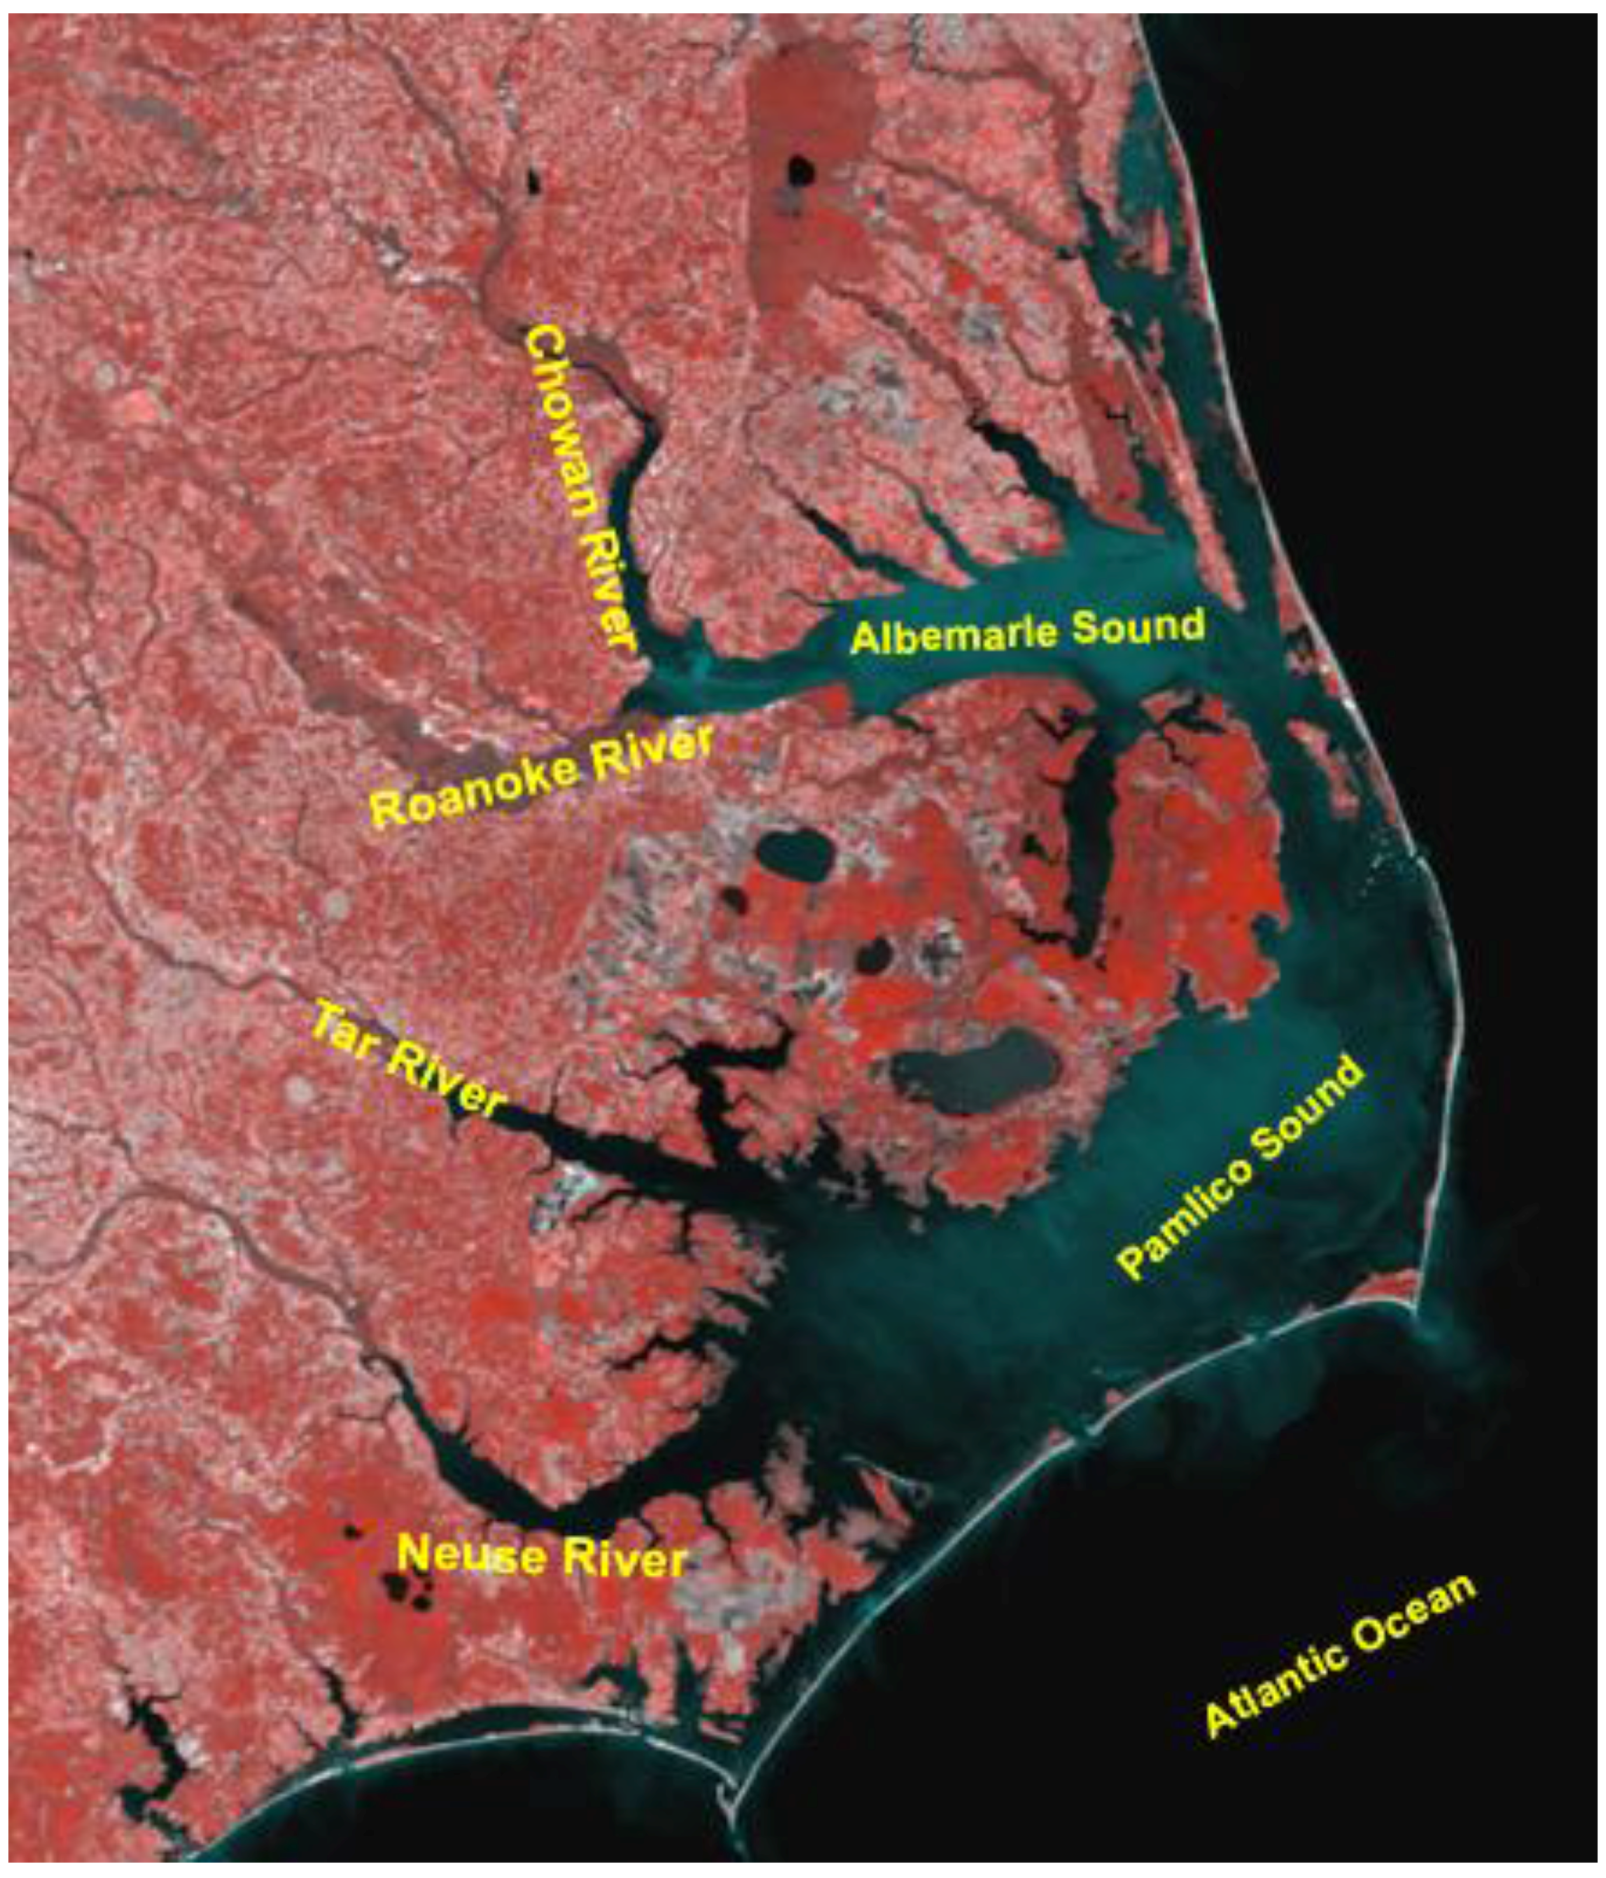
The Albemarle-Pamlico Estuarine System (APES) is the second largest estuary and largest coastal lagoonal system in the United States with a surface area of ~80,000 km
2, a mean depth of ~4.5 m and maximum depth of 7.5 m (
Figure 1). The APES is a vital state and national resource that contributes more than $3B annually from fisheries, employment and tourism [
25] and serves as the most important coastal fisheries nursery in the Southeast/Mid-Atlantic region of the United States [
26].
Major freshwater discharge into the APES is from four rivers (Chowan, Roanoke, Tar and Neuse) that primarily drain the Piedmont and Coastal-Plain regions of North Carolina [
27]. The Outer Banks barrier island chain restricts exchange with coastal shelf waters primarily through three narrow inlets. This restricted flow limits astronomical tides and creates the lagoonal nature of the APES. Wind forcing primarily drives water circulation in the major sounds and estuaries (e.g., [
28,
29,
30]). Given the large surface area, shallow bathymetry with broad shoals, and alignment of the long axis of Pamilco Sound with the prevailing wind direction [
29], a dominate feature of the APES as frequently observed in remotely sensed images or field observations is the moderate-to-high concentration of suspended material or turbidity throughout most of the system’s water bodies. This is true following even modest winds [
31] but is most prevalent following storms such as the frequently occurring winter Nor’ Easters (
Figure 2). However, field data associated with the import, transport and fate of particles (deposition/resuspension) is severely limited and hence the dynamics of TSM in the APES is largely unknown.
Figure 1.
A MODIS 250 m false color image of the Albemarle-Pamlico Estuarine System, North Carolina showing the major rivers and sounds.
Figure 1.
A MODIS 250 m false color image of the Albemarle-Pamlico Estuarine System, North Carolina showing the major rivers and sounds.
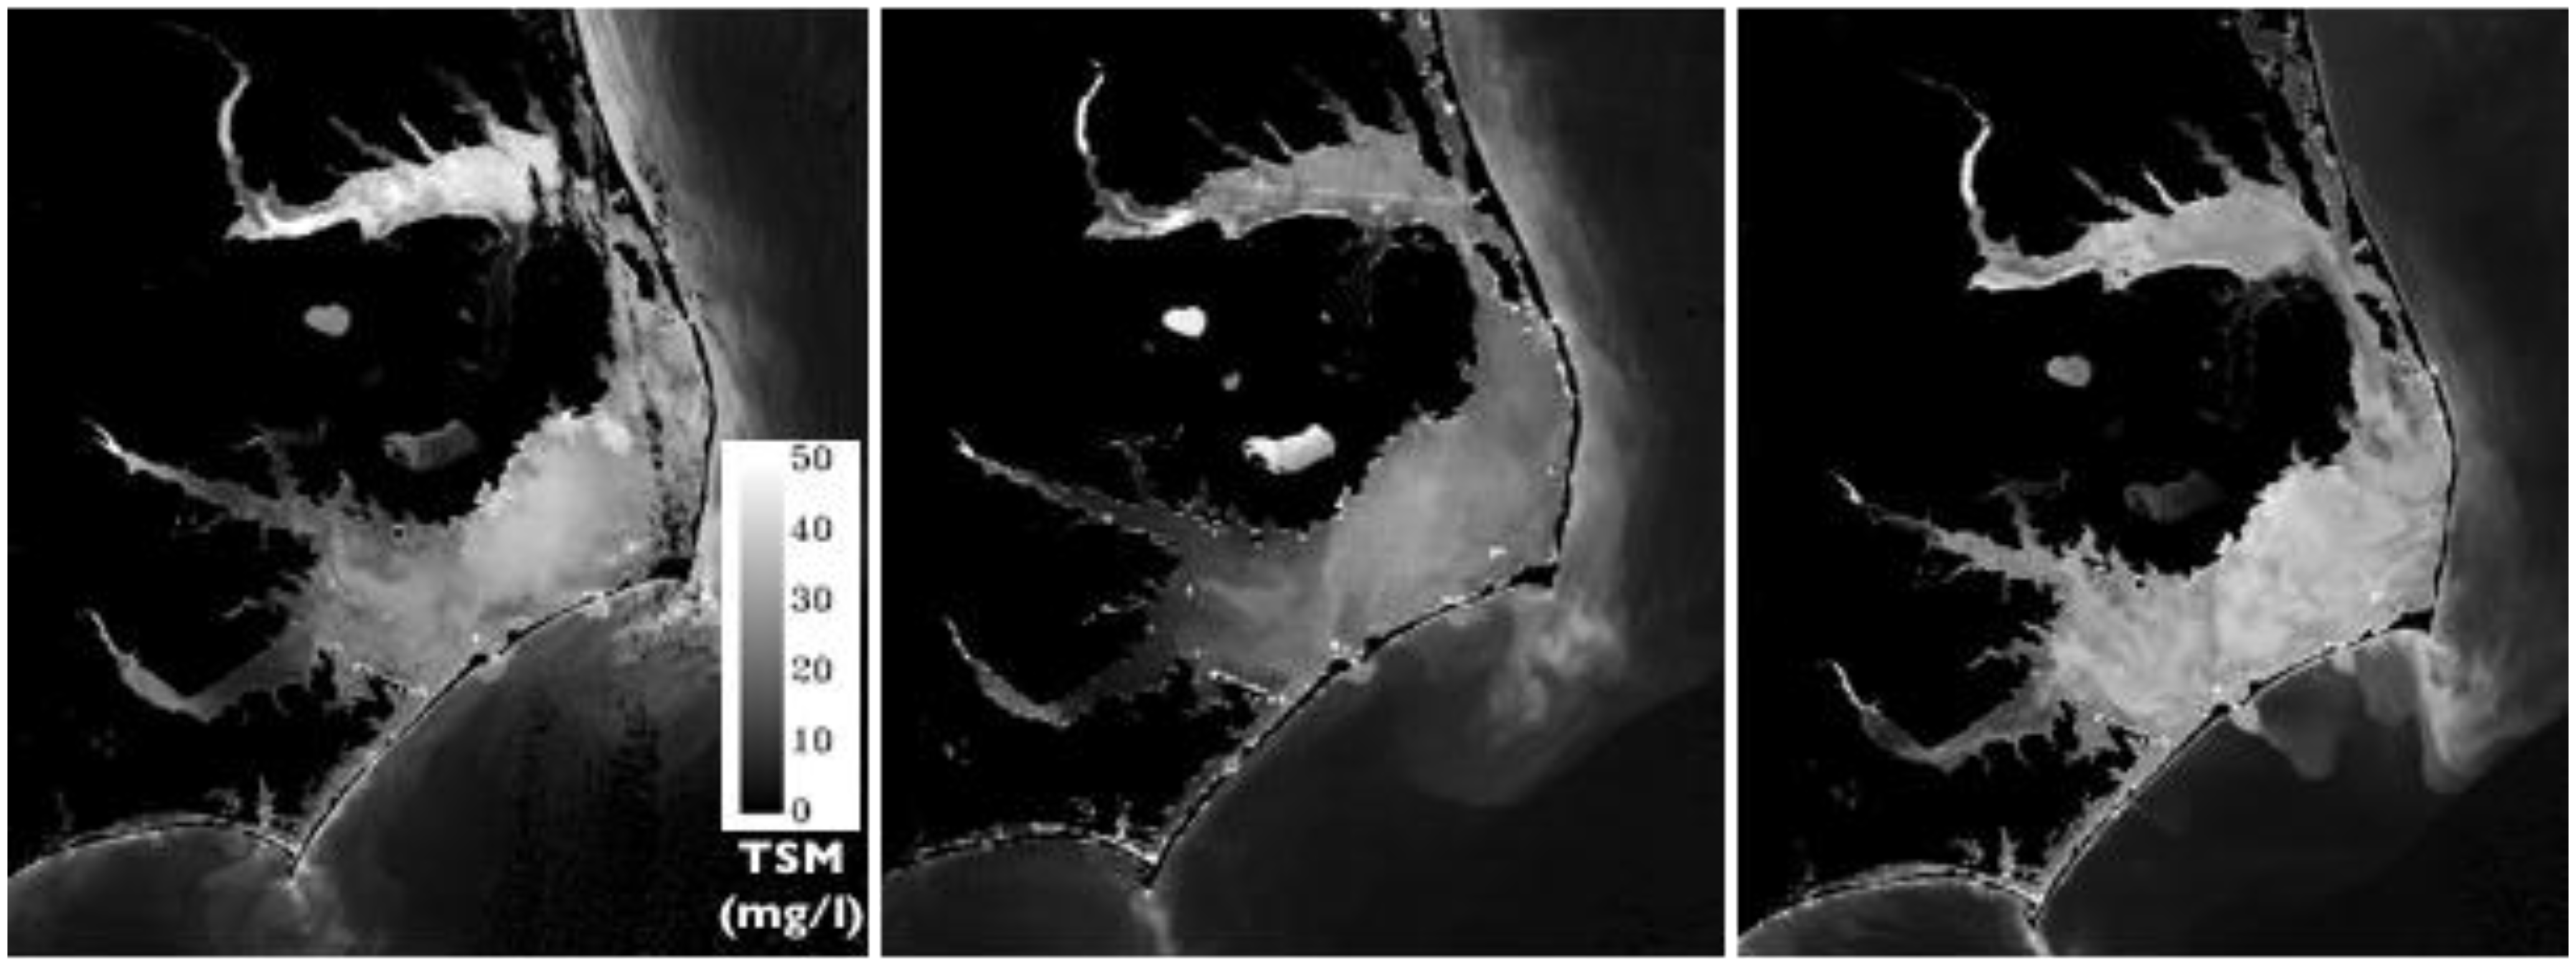
Figure 2.
Images of Total Suspended Matter concentration (mg/L) of the APES derived from MODIS Terra 250 m data acquired on 7, 8, and 11 February 2010 (left to right) showing significant large-scale variation in TSM following the passage of a strong front that occurred over a short time period. Land and clouds are masked to black. From Miller and Buonassissi [
32].
2.2. MODIS
MODIS Terra Level 0 data were acquired from the NASA MODIS L1 and Atmospheres Archive and Distribution System (LAADS;
http://ladsweb.nascom.nasa.gov/data/search.html) and processed using the NASA SeaDAS (SeaWiFS Data Analysis System) v5.4 software. Each MODIS granule containing 5 minutes of data was processed to Level 1A and geolocation information extracted (l1agen_modis). Level 1A files were subset (l1aextract_modis) to contain the entire APES and most of the adjacent drainage basins and coastal area. A file containing MODIS 250 m data (Bands 1 and 2) was then generated using SeaDAS L1B processing.
2.3. Landsat 7 ETM+
Landsat 7 ETM+ scenes (path 14, row 36) for the three sample dates were obtained from the USGS Earth Resources Observation and Science (EROS) Center using the USGS Global Visualization Viewer (GloVis) online search and order tool for satellite data. Band 3 (red reflectance band, 630–690 nm) were converted to top-of-atmosphere radiance using the ENVI v 4.7 (ITT Visual Information Solutions, Inc.) Landsat calibration tool. Landsat 7 ETM+ images acquired after 31 May 2003 have missing data referred to as “gaps” due to the failure of the Scan Line Corrector (SLC). The scan gaps vary in width from one pixel near the image center to 14 pixels along the east and west edges of the image, creating a repeating wedge-shaped pattern along the edges. There are no gaps for approximately 22 km of the middle of the scene [
33]. The middle of a scene with no missing data was used for the sensor matchups described below.
2.4. FORMOSAT-2 RSI
FORMOSAT-2 containing the remote sensing instrument (RSI) is the second satellite owned and operated by the National Space Organization (NSPO) of Taiwan and was launched on 21 May 2004 into an operational sun-synchronous orbit and high altitude of 891 km. A detailed description of the RSI and FORMOSAT-2 satellite is given by Liu [
34]. Briefly, FORMOSAT-2 RSI was principally designed for daily imaging of land-based targets. Off-nadir images are obtained through a targeting system that can point ±45° along track and ±45° across track. The high orbital altitude and off-nadir viewing provide the capability where a scene can be observed each day from the same viewing angle under similar illumination conditions. Scene coverage is 24 km × 24 km. Each scene acquires data in four multispectral bands at 8 m and a 2 m panchromatic band (
Table 1). A series of scenes can be acquired sequentially along-track to generate a 24 km wide swath or strip of ground coverage. FORMOSAT-2 RSI, however, does not continuously collect data. Coverage of an area is obtained through a data collection request submitted to NSPO or from Astrium Geo-Information Services.
Table 1.
Spectral and spatial characteristics of the remote sensing instrument (RSI) onboard the FORMOSAT-2 satellite.
Table 1.
Spectral and spatial characteristics of the remote sensing instrument (RSI) onboard the FORMOSAT-2 satellite.
| Band | Spectral range (nm) | Spatial resolution (m) |
|---|
| B1 | 450–520 | 8 |
| B2 | 520–600 | 8 |
| B3 | 630–690 | 8 |
| B4 | 760–900 | 8 |
| PAN | 450–900 | 2 |
The multispectral FORMOSAT-2 RSI images used in this study were obtained as coregistered geotiff files. FORMOSAT-2 RSI band 3 (red reflectance, 630–690 nm) images were converted to top-of-atmosphere radiance (W/m2/sr/μm) in ENVI v4.7 with the gain and offset tool using calibration values for each band provided in an accompanying metadata file. Three overlapping images of approximately (24 km (east-west, swath), by 100 km (north-south, along-track)) were collected to cover an area within the Landsat 7 ETM+ and MODIS images collected in a single satellite pass.
2.5. Atmospheric Corrections and Image Processing
A major challenge to using remotely sensed images for coastal waters is obtaining effective atmospheric correction for images in the visible portion of the electromagnetic spectrum. Atmospheric correction of ocean color (
i.e., images within the visible spectrum) data has been a major area of investigation for many years, and numerous papers exist that address this topic for most sensors. Hu
et al. [
35] provide a good overview regarding the details of atmospheric correction for turbid waters.
The atmospheric correction of MODIS 250 m data was performed in SeaDAS v5.4 (l2gen) using the single-scattering white aerosol model with 859 nm (MODIS Band 2) as the longest wavelength for aerosol model selection. All L2 mask flags were deselected. Subsequent processing of MODIS images was done using ENVI v4.7. The resulting normalized water-leaving radiance (nLw) file (mW/cm
2/sr/μm) was converted to TSM concentration (mg/L) using a modified version (reflectance to nLw) of the Miller and McKee TSM algorithm [
16] for MODIS 250 m data.
Landsat 7 ETM+ and FORMOSAT-2 RSI images were atmospherically corrected using the ENVI atmospheric correction module FLAASH v4.7 (Fast Line-of-sight Atmospheric Analysis of Spectral Hypercubes). FLAASH is an atmospheric correction-modeling tool for retrieving spectral reflectance for hyperspectral and multispectral images that incorporates MODTRAN4 radiative transfer code and produces atmospherically corrected surface reflectance values. Landsat 7 ETM+ and FORMOSAT-2 RSI top-of-atmosphere radiance files are imported into FLAASH after converting the radiance to units of mW/cm
2/sr/nm from W/m
2/sr/μm. FLAASH uses atmosphere settings based on local conditions. The atmosphere model (
i.e., water vapor) was chosen based on local temperature during image acquisition. The aerosol model was selected based on local visibility as calculated using the equation from Retalis
et al. [
36] that uses the MODIS aerosol optical thickness (τ
a) product at 551 nm. All images were processed using the DISORT multi-scattering model (most accurate correction for visible wavelengths) with 16 streams, default multispectral MODTRAN resolution of 15 cm
−1, mid-latitude winter atmosphere, maritime aerosols and visibility of 60 km. Land and clouds were masked in the atmospherically corrected reflectance files using a threshold value for near-infrared land reflectance measured in Landsat 7 ETM+ band 7 and FORMOSAT-2 RSI band 4.
Upon atmospheric correction, the scan gaps in Landsat 7 ETM+ images were corrected using the ENVI v4.7 Landsat Gapfill tool with the ‘single file gap triangulation’ method selected. Landsat 7 ETM+ images and FORMOSAT-2 RSI images were then resampled (nearest neighbor algorithm) to 250 m and coregistered to the corresponding MODIS 250 m TMS image by layer stacking the images within ENVI v4.7 into a single file. Selected regions of interests (ROIs) were created and data extracted from all three sensor images for subsequent analysis.
3. Results and Discussion
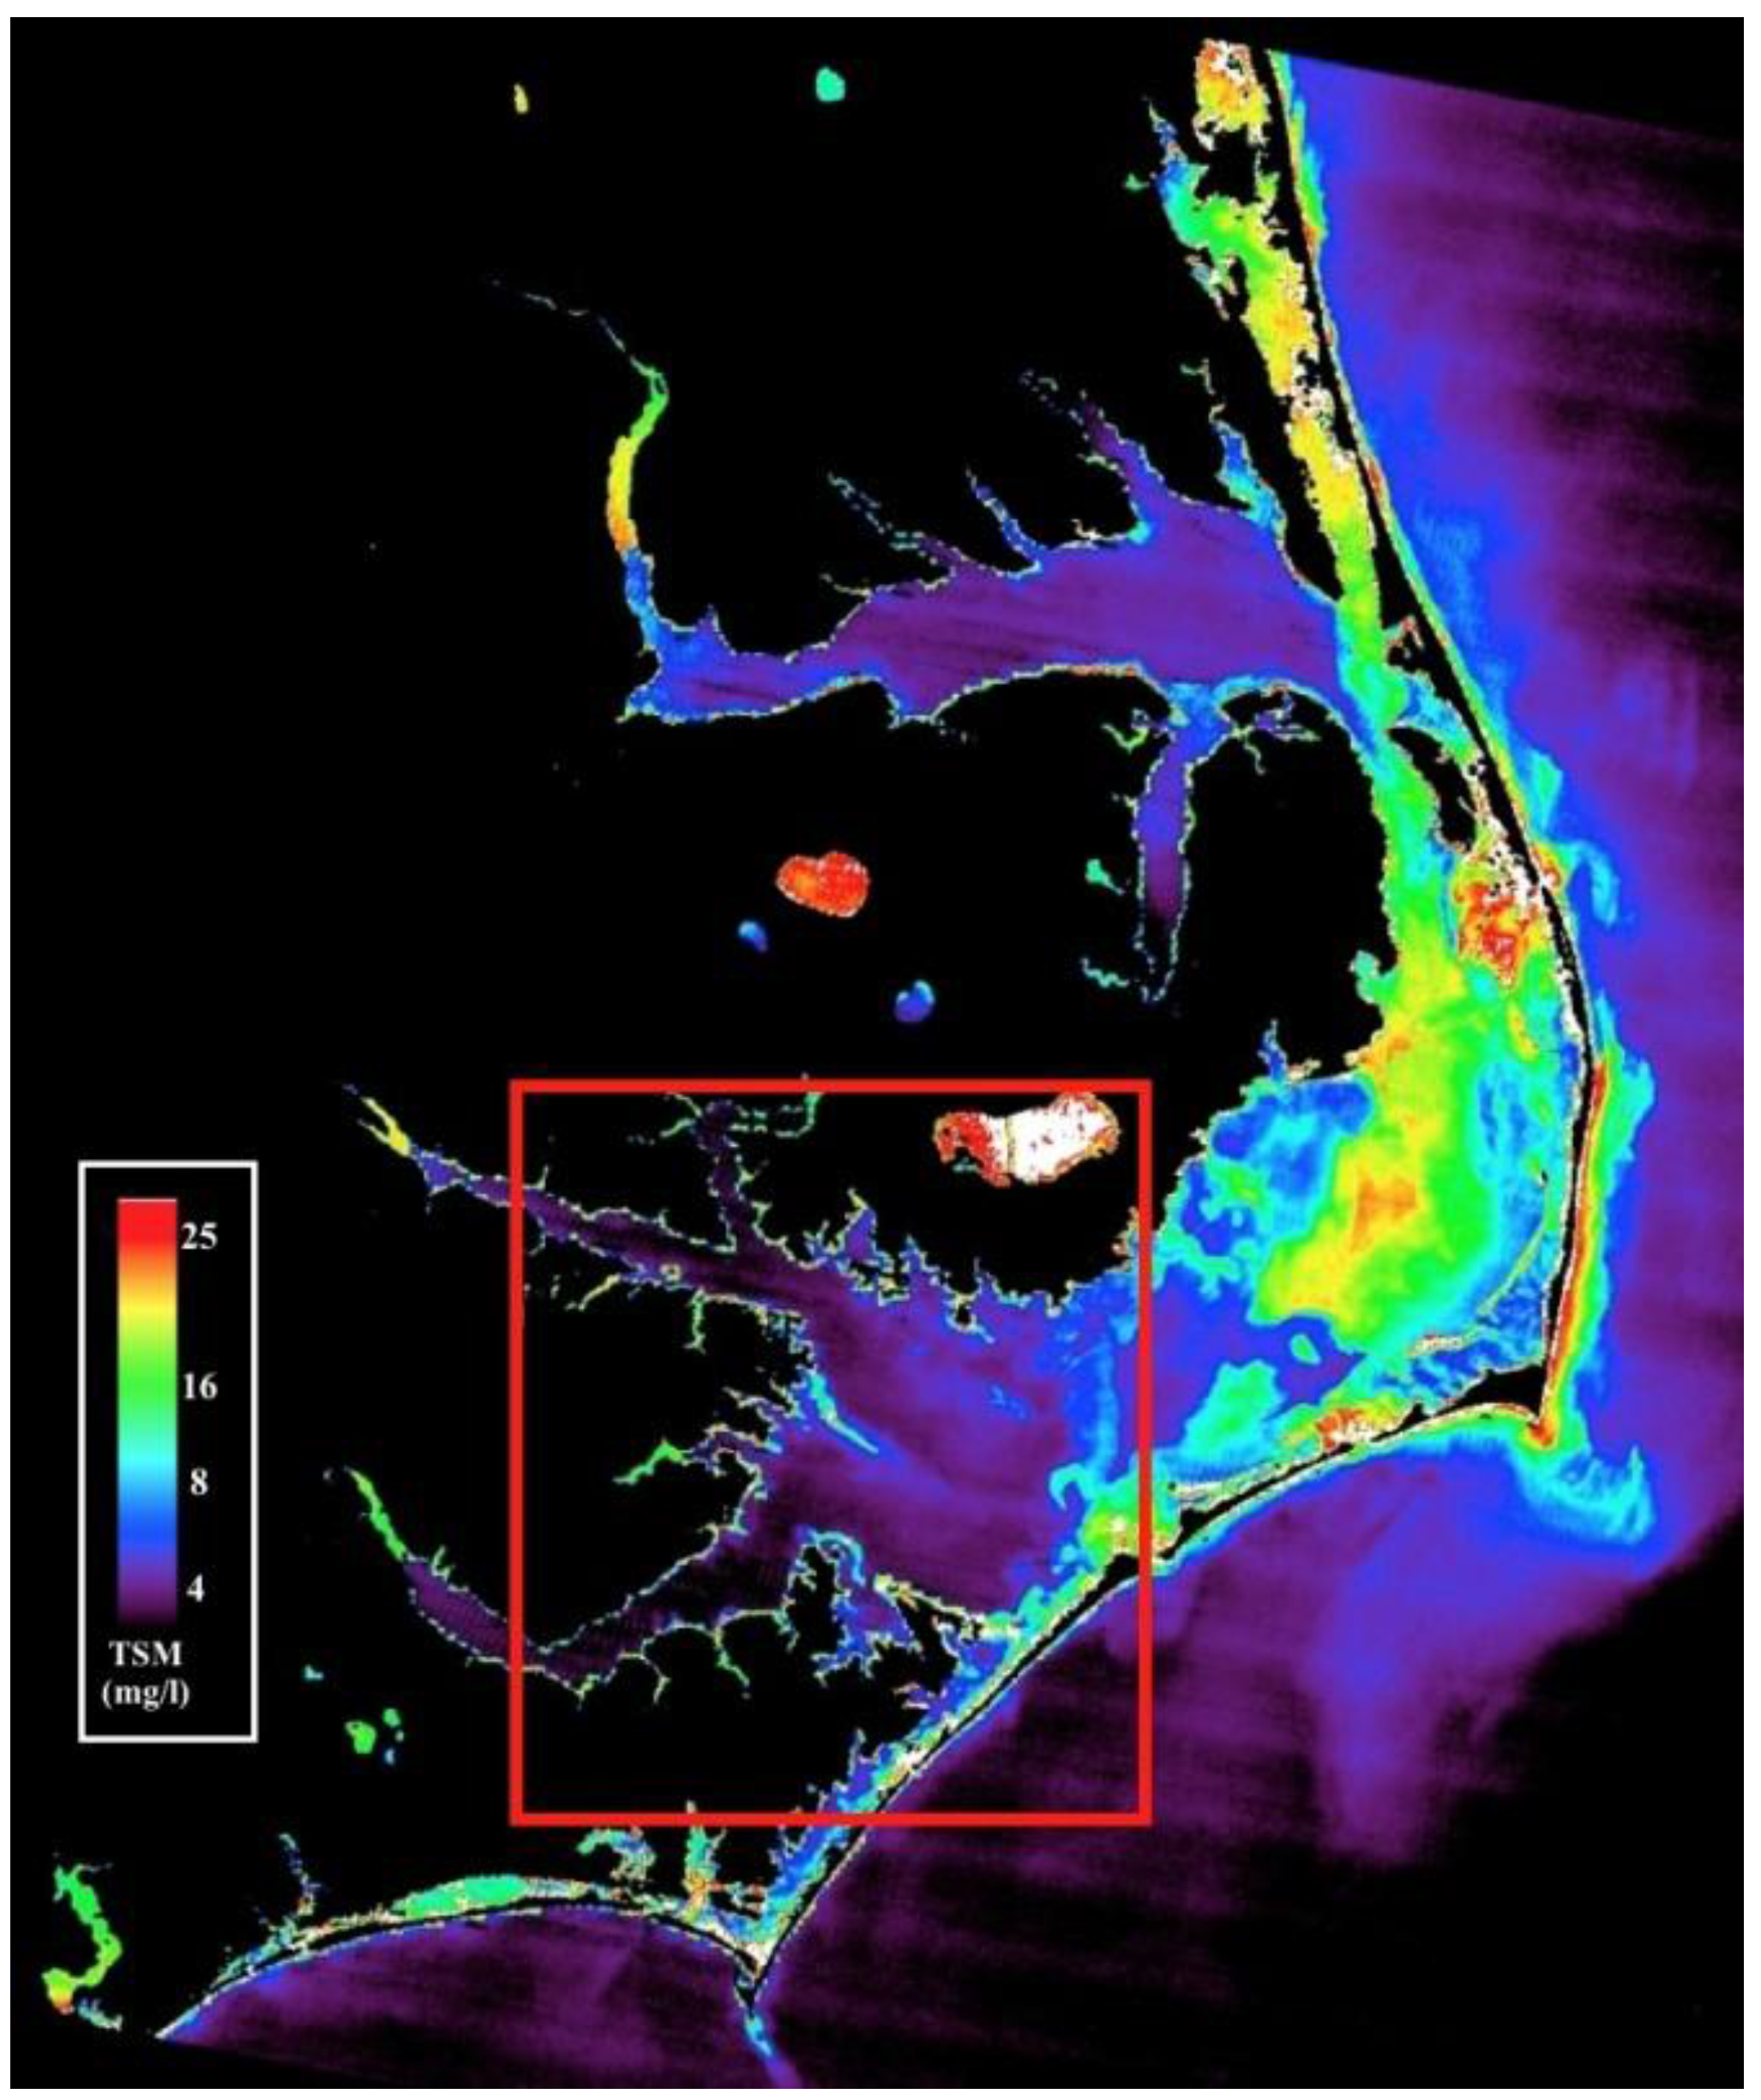
The results of the atmospheric correction yielded reasonable numerical values for all images collected on 8 November and 10 December 2010. However, both Landsat 7 ETM+ and FORMOSAT-2 RSI images on 24 November 2010 could not be atmospherically corrected (
i.e., negative reflectance) using realistic FLAASH atmospheric parameters due to extremely low (e.g., background) TSM concentrations in the lower APES (
Figure 3) and the low signal-to-noise ratio for these two sensors over these waters compared to MODIS. Low TSM concentrations in the Tar and Neuse Rivers and their confluence with Pamilco Sound frequently occur following the passage of major storms in the two rivers’ large watersheds [
37]. Two storm events (3–5 and 16–17 November 2010) passed through the area with over 1.5 in of rain recorded in the upper Neuse watershed contributing to the discharge of low TSM, high CDOM water into Pamlico Sound through the Neuse and Tar Rivers. The 24 November images were excluded from the multi-sensor comparison.
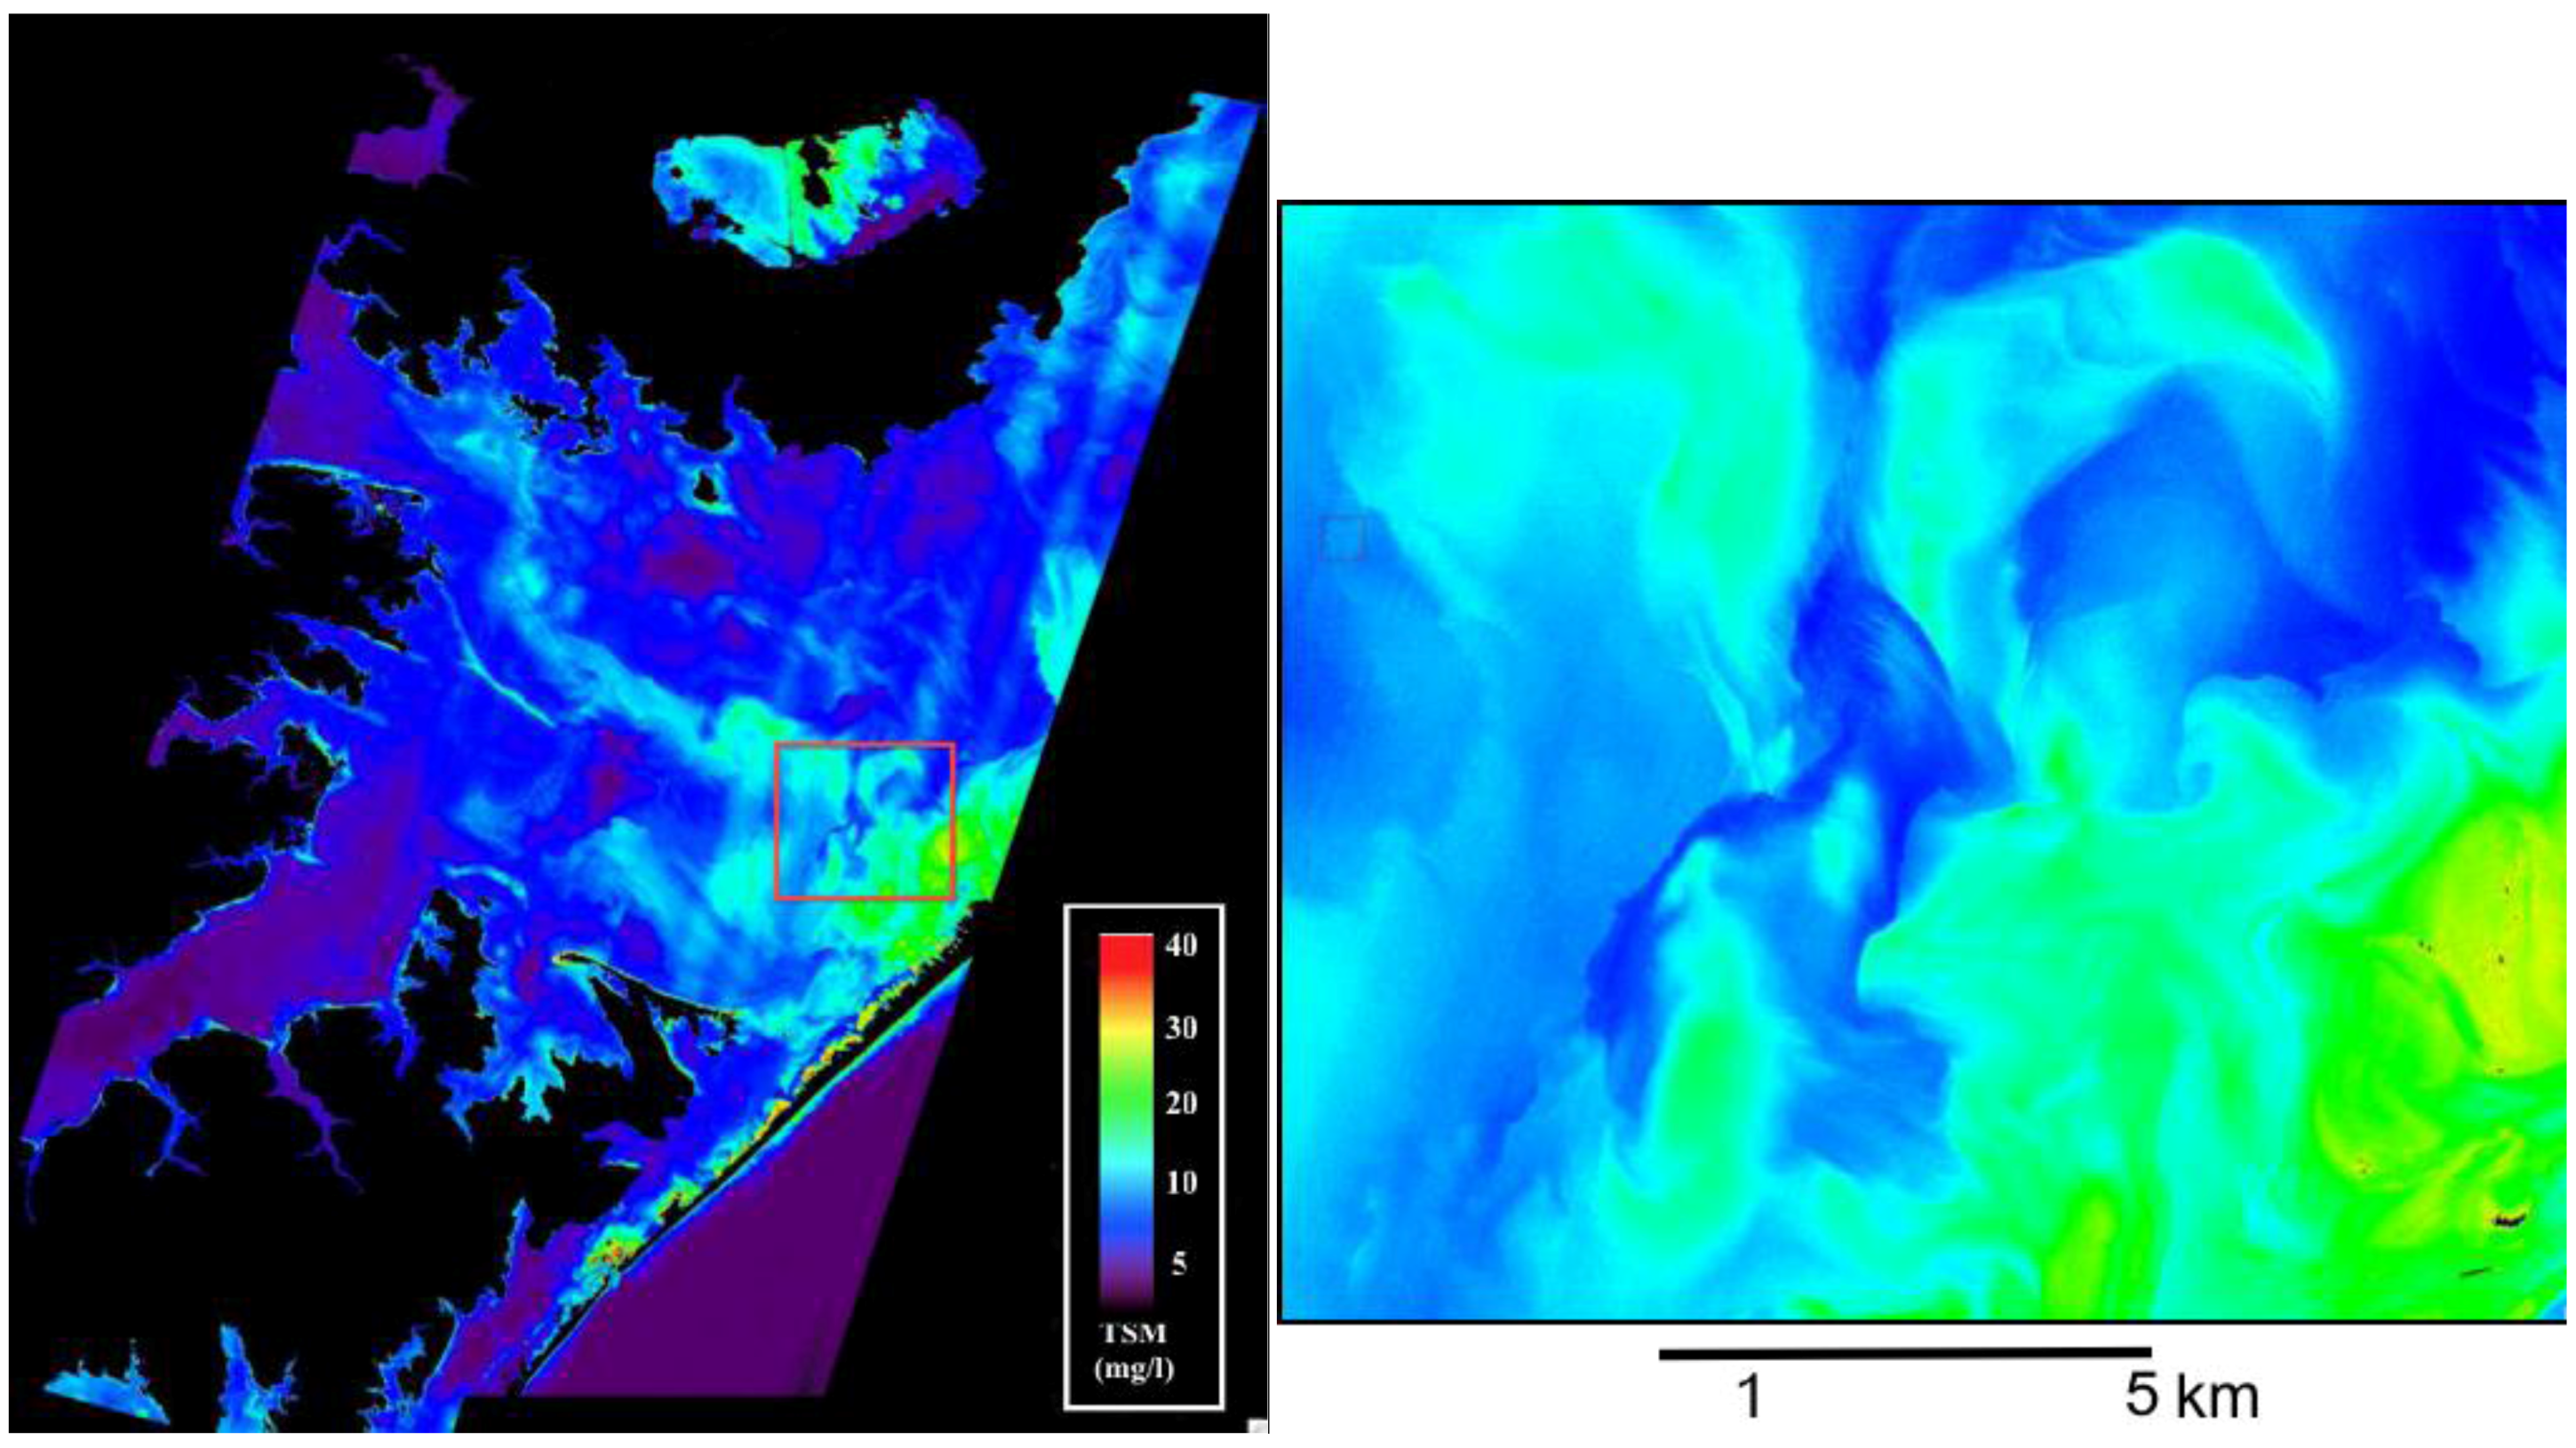
Figure 3.
MODIS 250 m TSM image for 24 November 2010 showing extremely low TSM concentrations in the area imaged by Landsat 7 ETM+ and FOMOSAT-2 RSI sensors (red box) following the passage of two storms in the Neuse and Tar River watersheds.
Figure 3.
MODIS 250 m TSM image for 24 November 2010 showing extremely low TSM concentrations in the area imaged by Landsat 7 ETM+ and FOMOSAT-2 RSI sensors (red box) following the passage of two storms in the Neuse and Tar River watersheds.
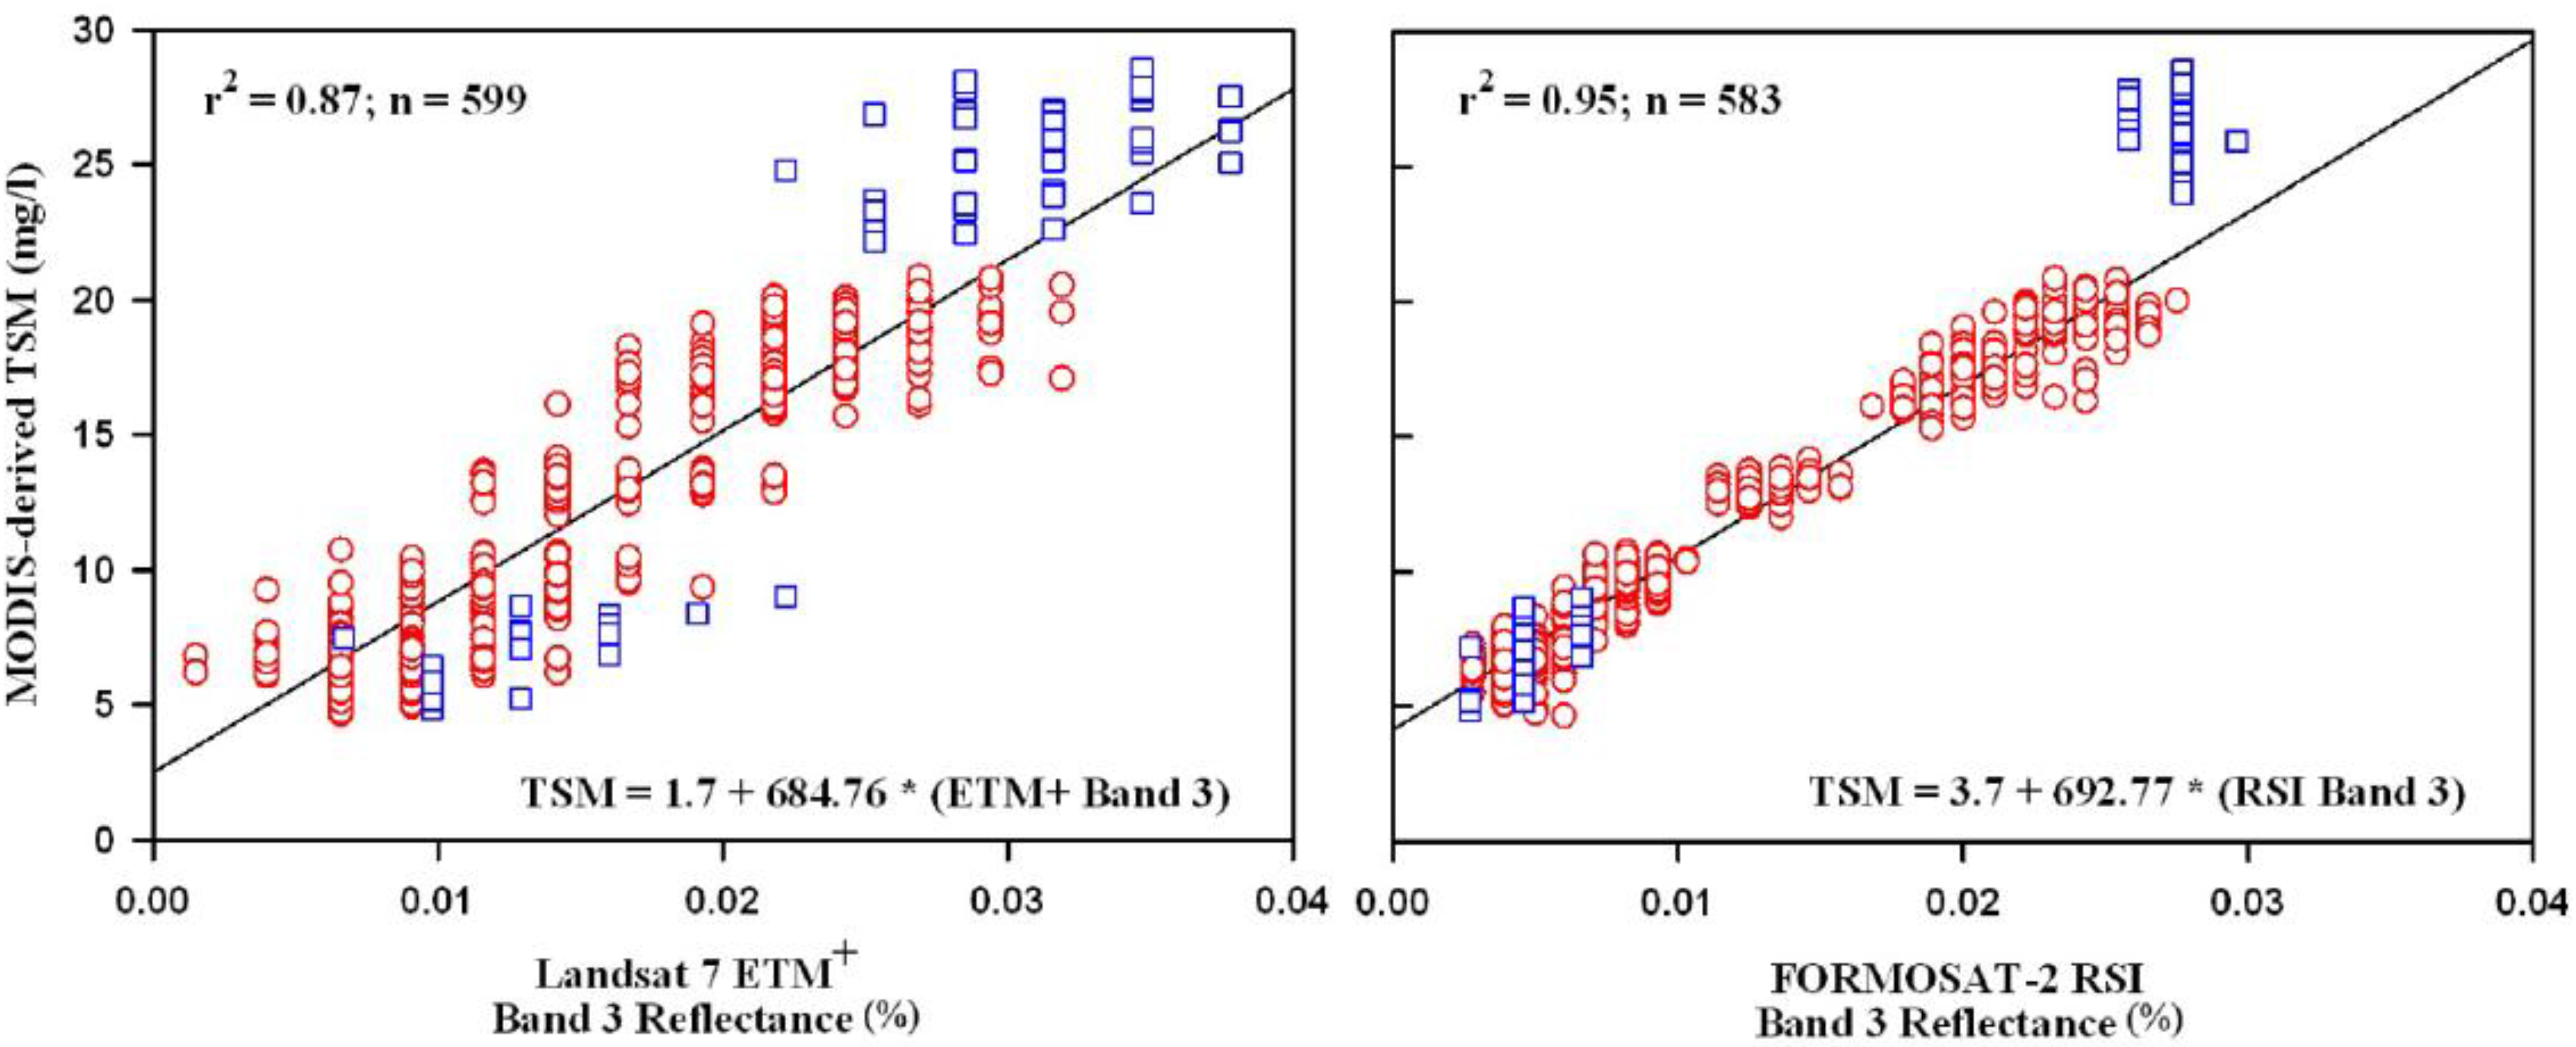
There was a significant linear relationship between MODIS-derived TSM concentration and atmospherically corrected red-band reflectance for both Landsat 7 ETM+ and FORMOSAT-2 RSI (
Figure 4). The larger variation in TSM concentration at each Landsat 7 ETM+ reflectance value is due in part to Coherent Noise (CN) in every Landsat 7 ETM+ image. CN appears as a repeating pattern and is more visible over water [
38]. As with the scan gap missing data, no preprocessing of these known problems was performed to ensure a direct comparison between sensor data that was independent of any particular image processing technique. TSM sensor-based algorithms (e.g., linear regression equations) were then applied to the full resolution 8 November and 10 December 2010 Landsat 7 ETM+ and FORMOSAT-2 RSI images. A selected region of the processed TSM images for all three sensors on 8 November 2010 is shown in
Figure 5. Similar patterns of TSM were observed in the images as expected given the high r
2 values with the Landsat 7 ETM+ and FORMOSAT-2 images providing successively greater detail in TSM distribution. An advantage of using these three sensors for the APES is that all images are acquired within 30 minutes thereby reducing spatial differences in TSM distributions with time due to processes such as advection and particle settling. Image acquisition times for 8 November 2010 were 1534, 1540 and 1555 GMT for Landsat 7 ETM+, FORMOSAT-2 RSI and MODIS Terra, respectively.
This study provides evidence that the dynamics of TSM concentration in the Albemarle-Pamlico Estuarine System can be examined at a range of temporal and spatial scales using remotely sensed images from three sensors—MODIS, Landsat 7 ETM+ and FORMOSAT-2 RSI. Each sensor has advantages and limitations to observing TSM in a coastal system. For example, the sensitivity of the Landsat 7 ETM+ and FORMOSAT-2 RSI red bands were too low for use in low TSM, high CDOM waters as was observed on 24 November 2010 in the Neuse and Tar Rivers following a major rain event.
Figure 4.
Relationship between TSM concentrations derived from MODIS 250 band 1 normalized water-leaving radiance and Landsat 7 ETM+ (left panel) and FORMOSAT-2 RSI (right panel) atmospherically corrected band 3 reflectance. Solid line is the least- squares fit to the data. Matchups correspond to 8 November 2010 (red circles) and 10 December 2010 (blue squares) images.
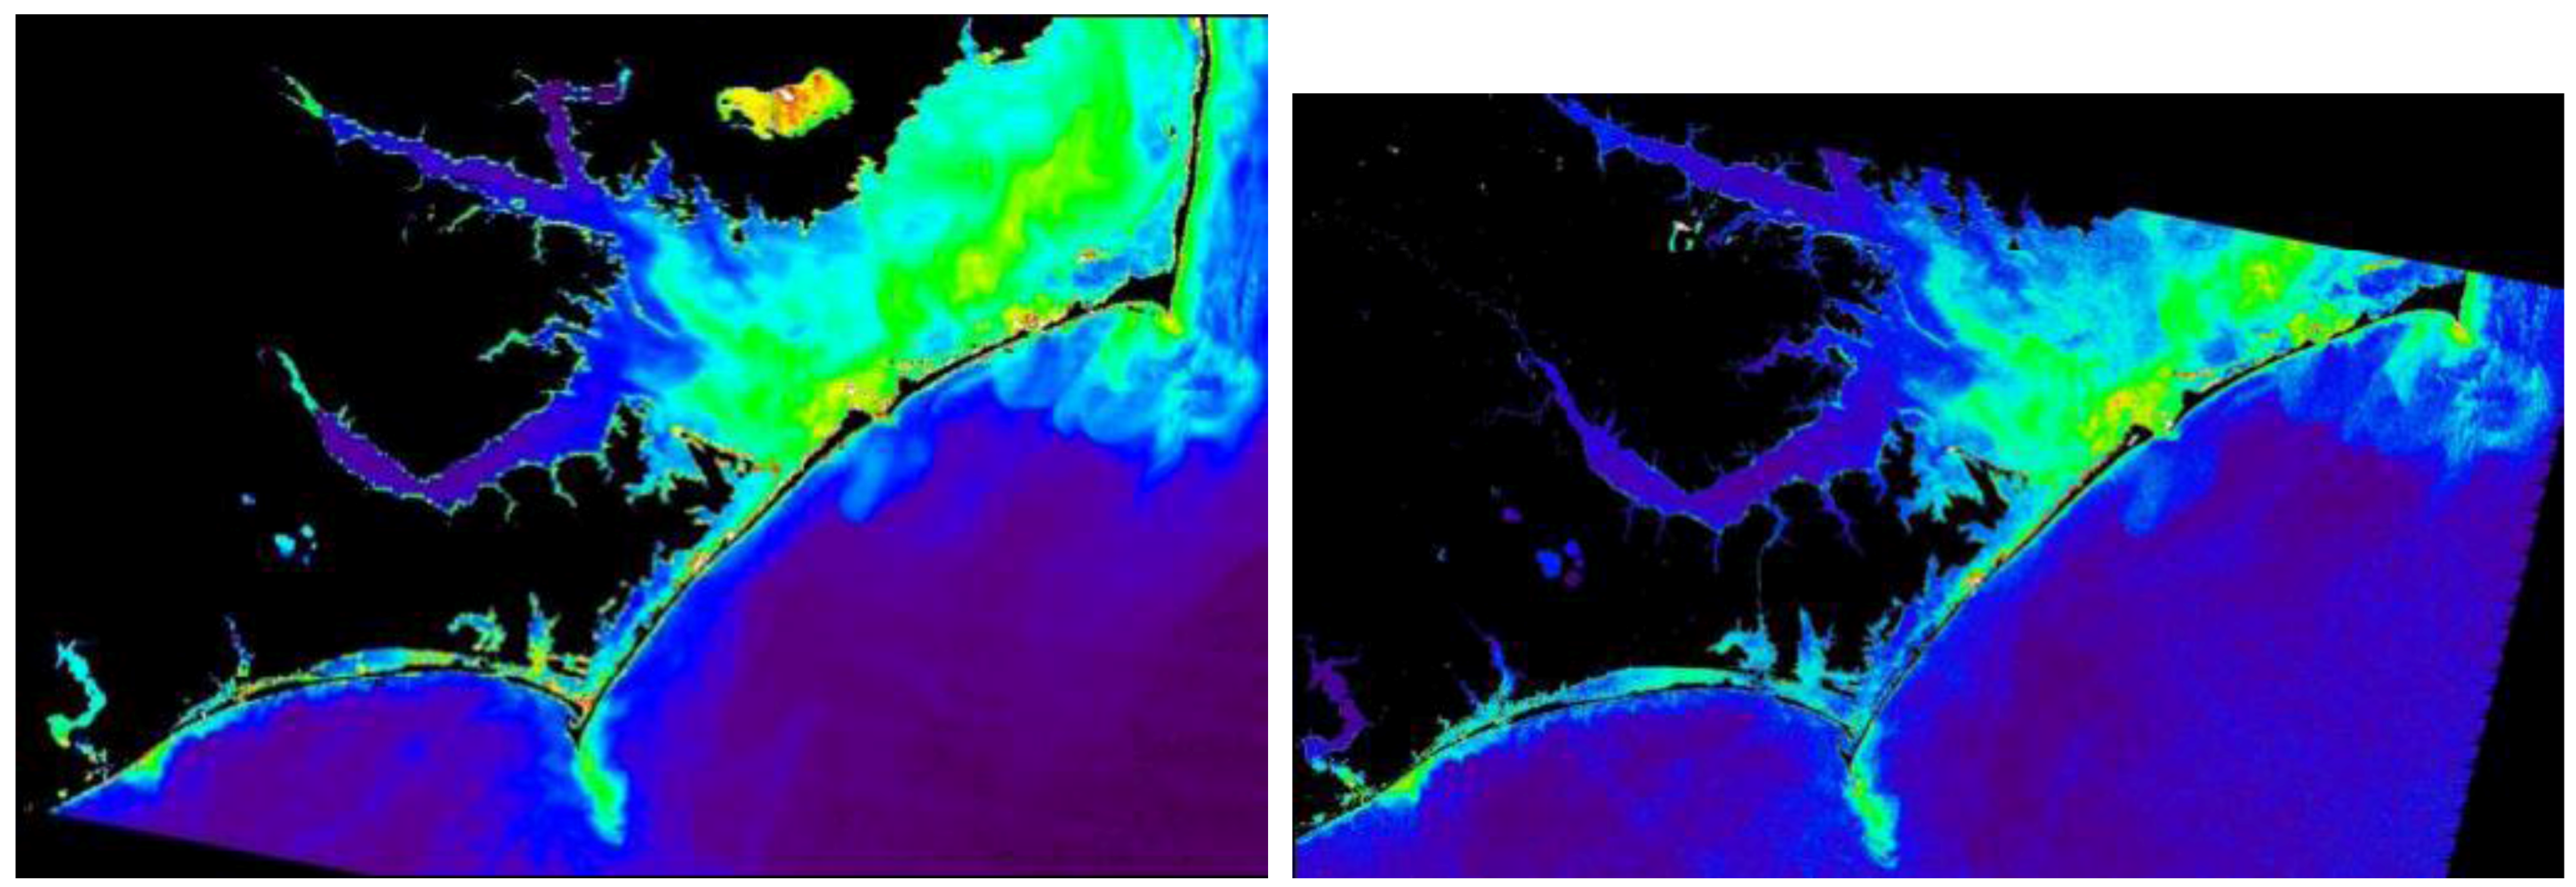
Figure 5.
TSM concentrations mapped at three spatial resolutions for the Neuse and Tar Rivers and lower Pamlico Sound of the APES on 8 November 2010 using the MODIS Terra (250 m, upper left), Landsat 7 ETM+ (30 m, upper right) and FORMOSAT-2 RSI (8 m, lower left) sensors. The FORMOSAT-2 RSI image is a mosaic of two adjacent swaths imaged sequentially during one FORMOSAT-2 overpass. The lower right panel (zoomed image of red box) shows the high spatial detail in TSM concentration available using the FORMOSAT-2 RSI 8 m data that cannot be resolved by the other sensors. TSM concentration as shown in the FORMOSAT-2 RSI image is the same for all images. Land and clouds are masked black.
The major limitation of the Landsat 7 ETM+ is that the sensor images the APES on a 16-day revisit period, hence, cannot capture the temporal dynamics in TSM concentration. However, Landsat 7 ETM+ images most of the APES in one orbital pass (2 scenes) and can provide detail in land cover and land use practices within the APES watersheds that may directly affect the transport of sediments and particulate material from the landscape to the APES. Another major advantage of Landsat 7 ETM+ is the large archive of images, easy access, and large knowledge base on processing and application of Landsat 7 ETM+ and other Landsat products.
Although the primary application of FORMOSAT-2 RSI images has been land-based studies, this work clearly demonstrates that the FORMOSAT-2 RSI can potentially be a valuable asset in examining TSM dynamics in a range of coastal systems. The daily revisit orbit and very high spatial resolution make the sensor ideal for examining high spatial gradients or the dynamics of TSM in small coastal systems. To obtain large spatial coverage the FORMOSAT-2 RSI must acquire multiple 24 km wide swaths of a study site thus increasing data storage requirements and computation time. However, the significant linear relationship with MODIS-derived TSM concentrations observed on two sample days suggests that FORMOSAT-2 RSI images can greatly augment process-oriented studies when both MODIS and FORMOSAT-2 RSI data are used. For example, the three narrow (ca. 1 km wide) inlets of the APES are the only aquatic conduits for the transport of suspended material from the APES to the coastal margin. Their small size, however, limit the use of most remotely sensed data, even Landsat 7 ETM+, due to several emerged sand bars and shallow water areas that significantly increase the number of land-contaminated pixels thereby reducing the number of useful water pixels for monitoring suspended sediments. FORMOSAT-2 RSI 8 m images and daily revisit should be adequate to examine most processes related to sediment dynamics associated with the inlets and adjacent areas.
4. Conclusions
Total Suspended Matter (TSM) is a major component of the in-water constituents of the Albemarle-Pamlico Estuarine System in coastal North Carolina. Traditional field sampling methods of monitoring water quality cannot adequately capture the dynamics of TSM in the APES due to its large size and frequency of resuspension/transport events. While the MODIS instruments onboard the Terra and Aqua satellites can provide synoptic 250 m daily images of TSM of the entire system, the 250 m spatial resolution is too coarse to provide estimates for several important estuaries, sub-estuaries and inlets and furthermore cannot resolve small-scale spatial gradients that may be important in various biological, chemical or geological processes.
The multi-sensor approach developed here will be employed in a wide range of investigations of the dynamics of TSM in the coastal waters of North Carolina. By examining a time series of MODIS, Landsat 7 ETM+ and FORMOSAT-2 TSM images, we will gain a better understanding of the dynamics and distributional patterns of TSM in the APES. This improved understanding will provide guidance to field programs as to where and when to sample in order to provide much-needed data in the APES, necessary to improve sensor-specific TSM as well as calibrate and validate sediment transport models. This integrated approach will support research, management and policy-based investigations.


