1. Introduction
Global urban area maps are essential for investigating urban expansion and the influence of urban areas on the biosphere, for assessing urban area vulnerability to natural hazards, and for illuminating on the connection between settlement characteristics and human health and well-being [
1].
However, available maps show very little agreement in pixels classified as urban [
2]. The inconsistencies among the urban area maps indicate that they have not been sufficiently validated. We suggest that the main obstacles in validating such maps is the scarcity of ground truth data for urban areas. For example, the MOD12Q1 V003 Land Cover Product [
3], the Global Land Cover Ground Truth database [
4], and the Degree Confluence Project ground truth validation databases [
5] include only 0, 3 and 11 ground truth data points, respectively, for urban areas. These ground truth data are obviously insufficient for validating the global urban area maps, which estimate the global urban area to be from 276 × 10
to 3524 × 10
[
1]. We suggest that the primary reason for the scarcity of ground truth data for urban areas is that no ground truth database has been developed specifically for urban areas.
In addition, small cities are more likely than large cities to be omitted from global urban area maps [
6], and the urban areas of small cities are also expected to expand more rapidly than those of large cities [
7]. Measuring urban expansion in small cities is important for predicting the socioeconomic impact of urban development [
7]. Therefore, the omission of small cities in global urban area maps should be rectified by using a ground truth database that covers almost all of the cities of the world, including small cities.
To develop such a database, we employed the Global Rural-Urban Mapping Project (GRUMP) Settlement Points as a primary data source, which is a gazetteer of populated places with latitude and longitude coordinates derived from various kinds of maps. We assumed that urban development existed at the point coordinates of the populated places within that database because those points were previously used as primary input data for an urban area map [
8]. In addition, the gazetteer has a large number of place names of populated places covering the entire world. Thus, we regard this gazetteer as a suitable source of data for a ground truth database for urban areas.
Here, we report on the development of a specialised urban area ground truth database from a gazetteer of populated places. In developing this new database, we visually interpreted high-resolution satellite images to ascertain whether the populated places were urbanised. Then, to demonstrate the usefulness of our ground truth database, we used it to assess the accuracy of eight urban area maps.
2. Development of the Ground Truth Database
To develop our ground truth database for urban areas, we first had to determine what our definition of “urban” would be. Urban areas are commonly defined in the remote sensing literature as places covered with a built environment, incorporating non-vegetative, human-constructed elements (e.g., roads, buildings, runways, and industrial facilities) [
7,
9,
10]. This definition has the advantage of being comparable across or within nations [
6], and thus we have adopted it for this study.
To determine that the ground truth data are unbiased, it is critical to evaluate the geographical distribution of the sampled sites. Spatially balanced systematic sampling at a 1
1
grid of latitude and longitude has been proposed for global land cover classification [
5]; however, this systematic sampling method does not result in a sufficient number of ground truth data points in urban areas, which tend to be strongly concentrated in a very small area of the earth surface. Although more than 197 samples are required for the confidence interval of the overall accuracy to be less than 5% at a 95% confidence level (estimated against an expected overall accuracy of 85% using an equation proposed by [
11]), such sampling of Eurasia resulted in only 11 ground truth data points for urban areas out of a total of 749 points [
5].
Another important consideration in developing the ground truth database is that small cities are more likely to be omitted by global urban area maps than large cities [
6], indicating that more ground truth data are needed for small cities than for large cities. The ground truth data should include attribute data about the geographical size or population size of the city where the ground truth data point is located.
To solve the two problems posed by the concentrated geographical distribution of urban areas and the demand for ground truth data for small cities, we employed a gazetteer of populated places, which is a database of place names with point coordinates, as a primary data set of the global urban sites. Because the point coordinates in gazetteers are provided to allow location of the city [
12], the point coordinates corresponding to a place name can be regarded as a point chosen randomly within the geographical extent represented by the place name. In addition, gazetteers contain numerous data points for cities throughout the world, including those with small populations, and they include place name data for subregions, countries, and districts, and data on miscellaneous city attributes (e.g., population and administrative class).
Several gazetteers have been developed for public use or for specific purposes. We decided to employ the GRUMP Settlement Points (GSP) gazetteer [
13] to develop our ground truth database for three reasons. First, the GSP includes data points for 55,412 populated places with more than 1,000 people worldwide (
Figure 1). We expected that a global distribution of numerous data points for urban areas would provide a sampling of the cities of the world without geographic bias, including many small cities. Second, GSP includes the estimated population of each city, which can be used to classify the cities by population size. Third, the place names, attribute data, and geographical coordinates were manually associated by human decision. This direct human input is indispensable for accurate association of place names with geographic data because insufficient information from the source prevents automatic matching [
14].
The precision of the point coordinates for place names in the GSP is approximately 1 km. Such precision is enough to represent the urban area of a populated place because the urban area of a city is typically more than 1 .
We retrieved from the GSP data about 3,734 populated places, each inhabited by more than 0.1 million people. We visually interpreted the point coordinates of these populated places by using false colour composite images from the Visible and Near-Infrared Radiometer of Advanced Spaceborne Thermal Emission and Reflection radiometer (ASTER/VNIR), with a spatial resolution of 15 m, archived on the Global Earth Observation Grid at the National Institute of Advanced Industrial Science and Technology [
15]. The high-resolution satellite images and aerial photographs in Google Earth, which have much finer resolution than does the ASTER/VNIR, might be a useful data source for visual interpretation. However Google Earth does not necessarily have high-resolution images of all of the cities of the world. We chose the ASTER/VNIR to ensure that visual interpretations would be based on similar criteria at all sites.
Figure 1.
The geographical distribution of the data points from the GRUMP Settlement Points gazetteer. The colour of each grid indicates the number of data points from the GRUMP Settlement Points gazetteer. The geographical unit of the grid is grid polygon.
Figure 1.
The geographical distribution of the data points from the GRUMP Settlement Points gazetteer. The colour of each grid indicates the number of data points from the GRUMP Settlement Points gazetteer. The geographical unit of the grid is grid polygon.
For these images, the near-infrared band (0.52–0.60
) was assigned to the red channel, the red band (0.63–0.69
) was assigned to the green channel, and the green band (0.76–0.86
) was assigned to the blue channel. Three trained operators, including the corresponding author and two assistants, visually interpreted the presence of urbanisation at each point on the false colour composite images based on colour tone and texture. For a point to be interpreted as urban, two of the three operators had to interpret it to be urban.
Figure 2 shows examples of these visual interpretations.
Figure 2.
Examples of the visual interpretations of the point coordinates of cities using the ASTER/VNIR false colour composite images. The white cross represents the coordinates of the point data. (a) The location at the point coordinate for Mexico City (Mexico) was interpreted as urban. (b) The location at the point coordinate for Tokyo (Japan) was interpreted as non-urban. (c) The location at the point coordinate for Addis Ababa (Ethiopia) was interpreted as non-urban.
As a result of this analysis, 2,144 of the 3,734 points were interpreted as urban, 1,388 were interpreted as non-urban, 10 were in between urban and non-urban, and 192 could not be interpreted because of clouds or shadows on the image or the discrepancies in interpretations among the operators. Thus, the number of ground truth data points identified as urban was much larger than the numbers of urban points in existing databases. As we expected, most of the 3,734 populated place coordinates were in urban areas, but the percentage (57.4%) was not very high. This suggests that points identified as populated places cannot be assumed to be urban, and that the use of data from a gazetteer as ground truth data requires point-by-point investigation. We used 3,532 of the points interpreted as urban or non-urban in the following analysis.
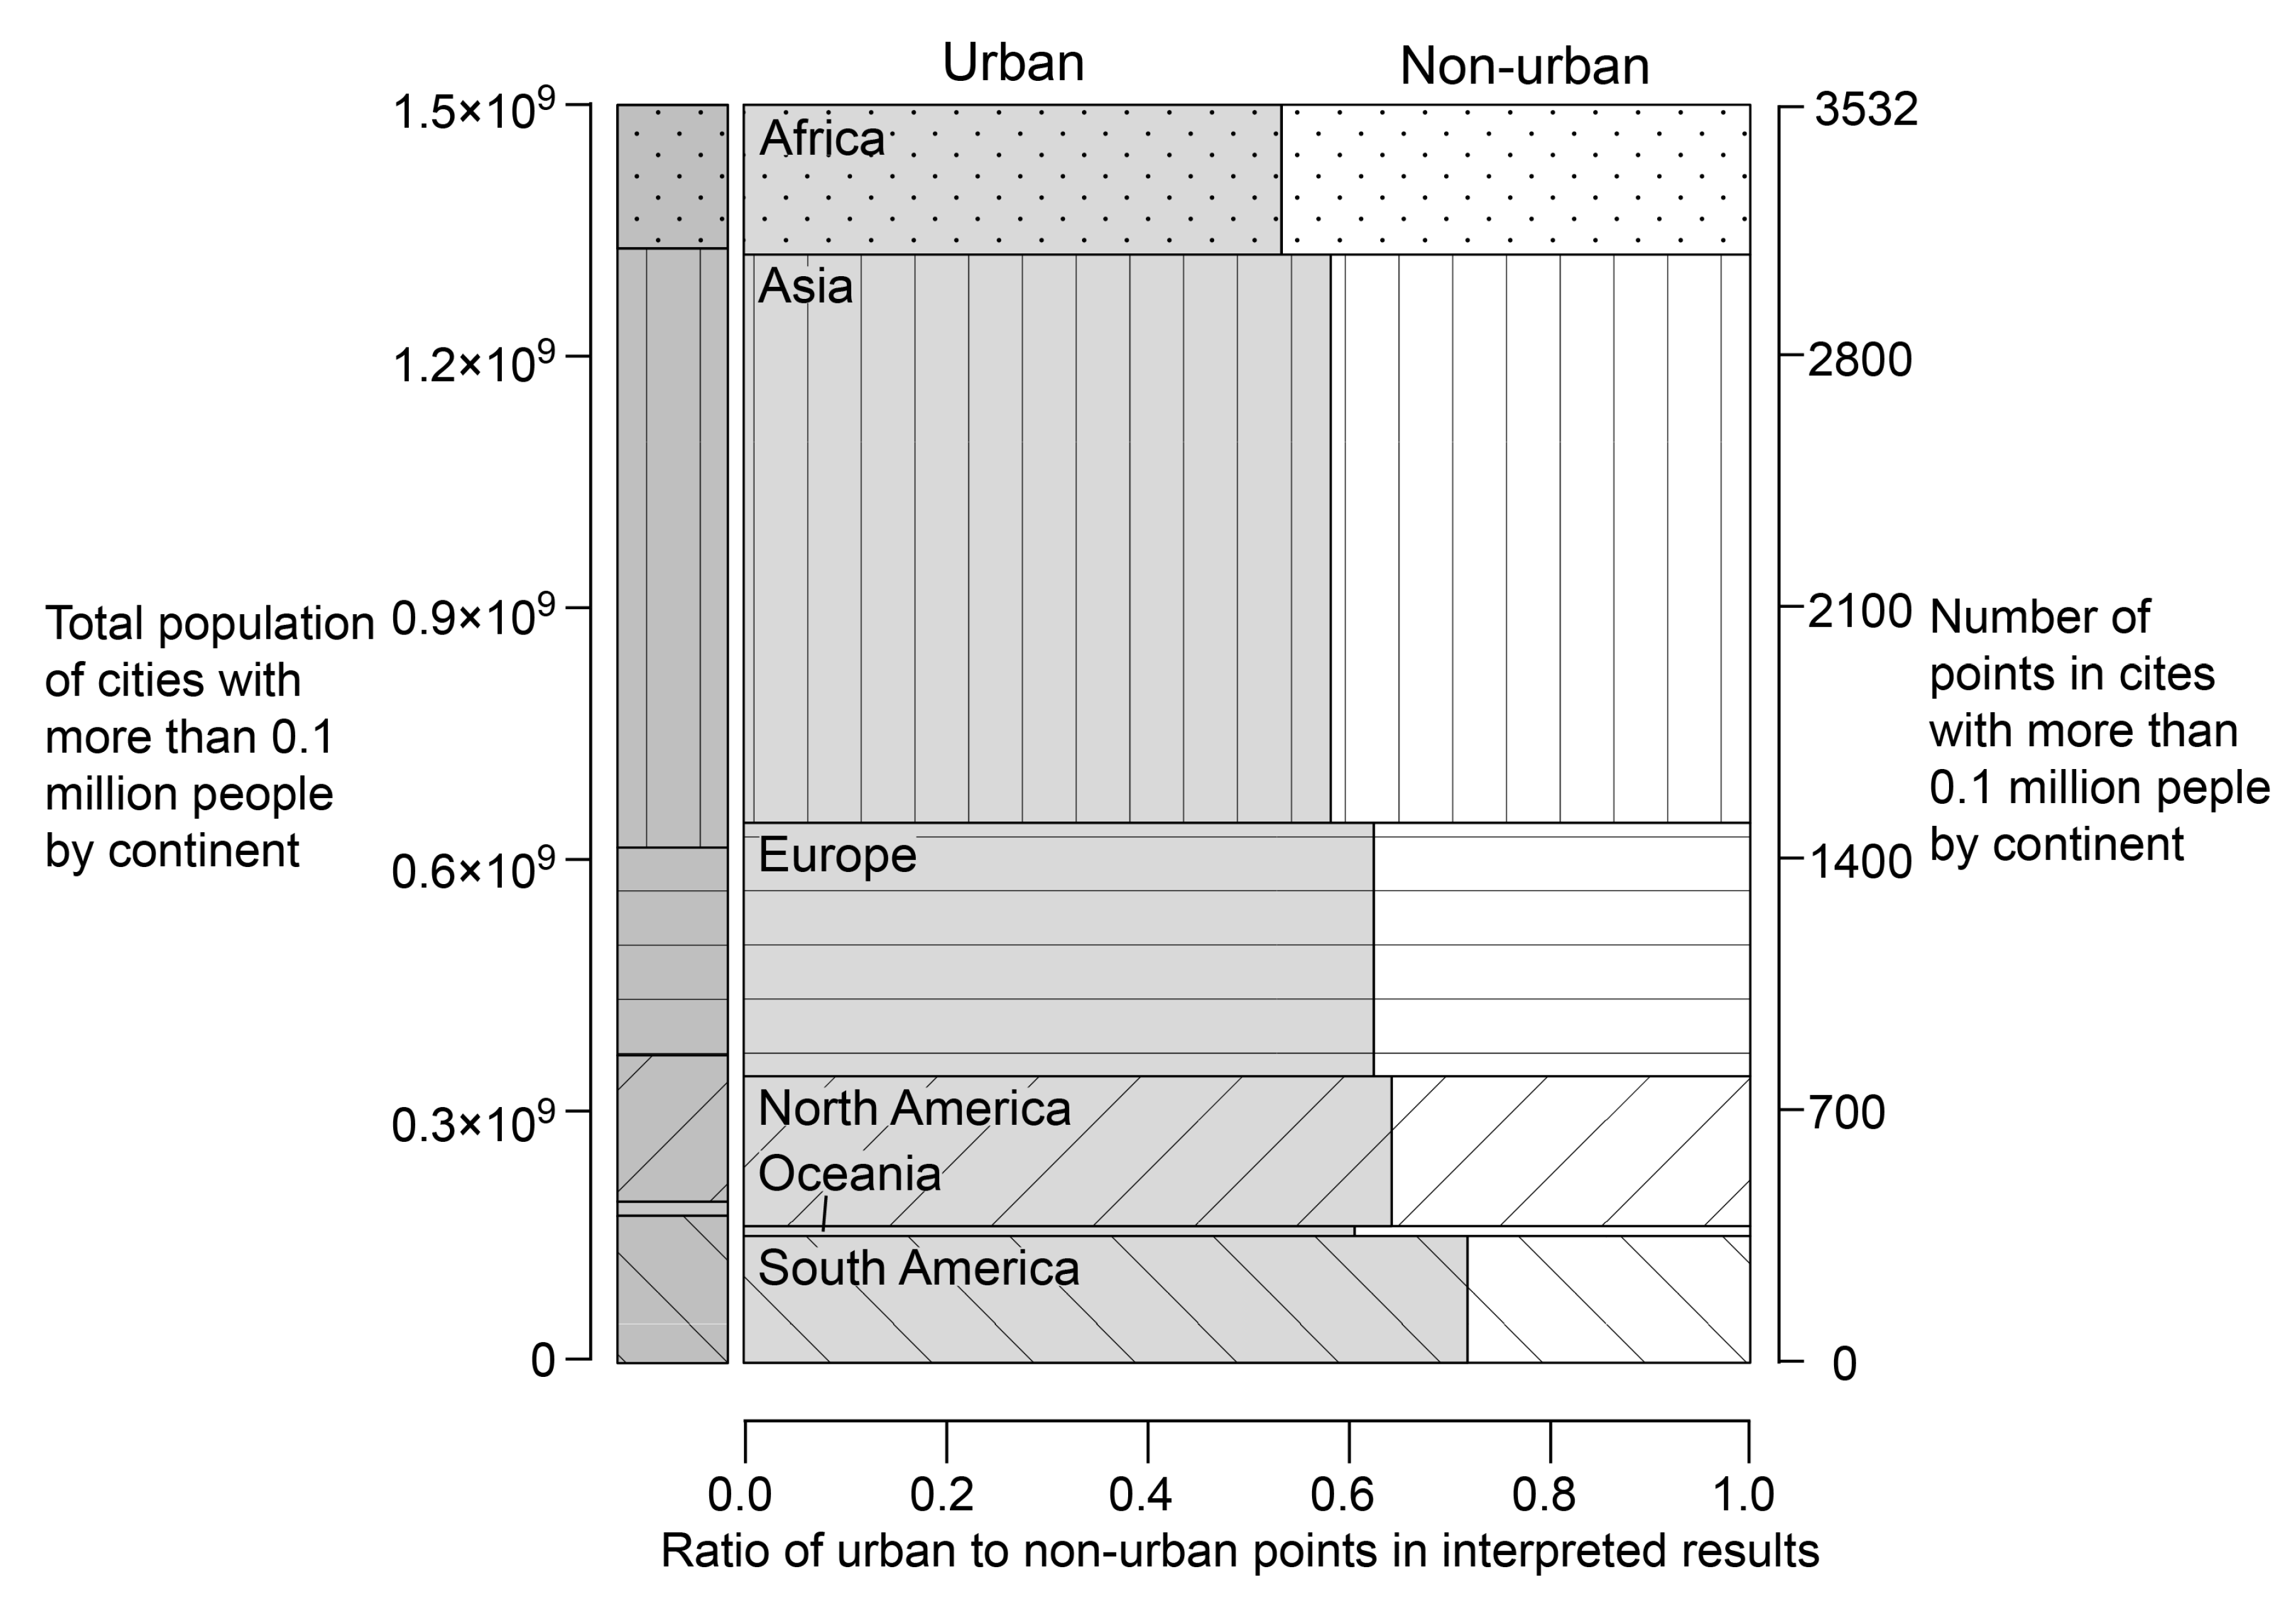
For each continent, we compared the relative number of points associated with cities having more than 0.1 million residents against the total population of all cities having a population of 0.1 million or more. We also calculated the ratio of the number of points interpreted as urban to the number interpreted as non-urban by continent (
Figure 3). Since the population of an urban area is positively correlated with its geographical size [
16], the distribution of the points did not show any strong geographical bias among the continents. Moreover, the urban to non-urban ratio also did not show strong geographical bias among the continents. Thus, we determined that, in general, the geographical distribution of the urban points was reasonable.
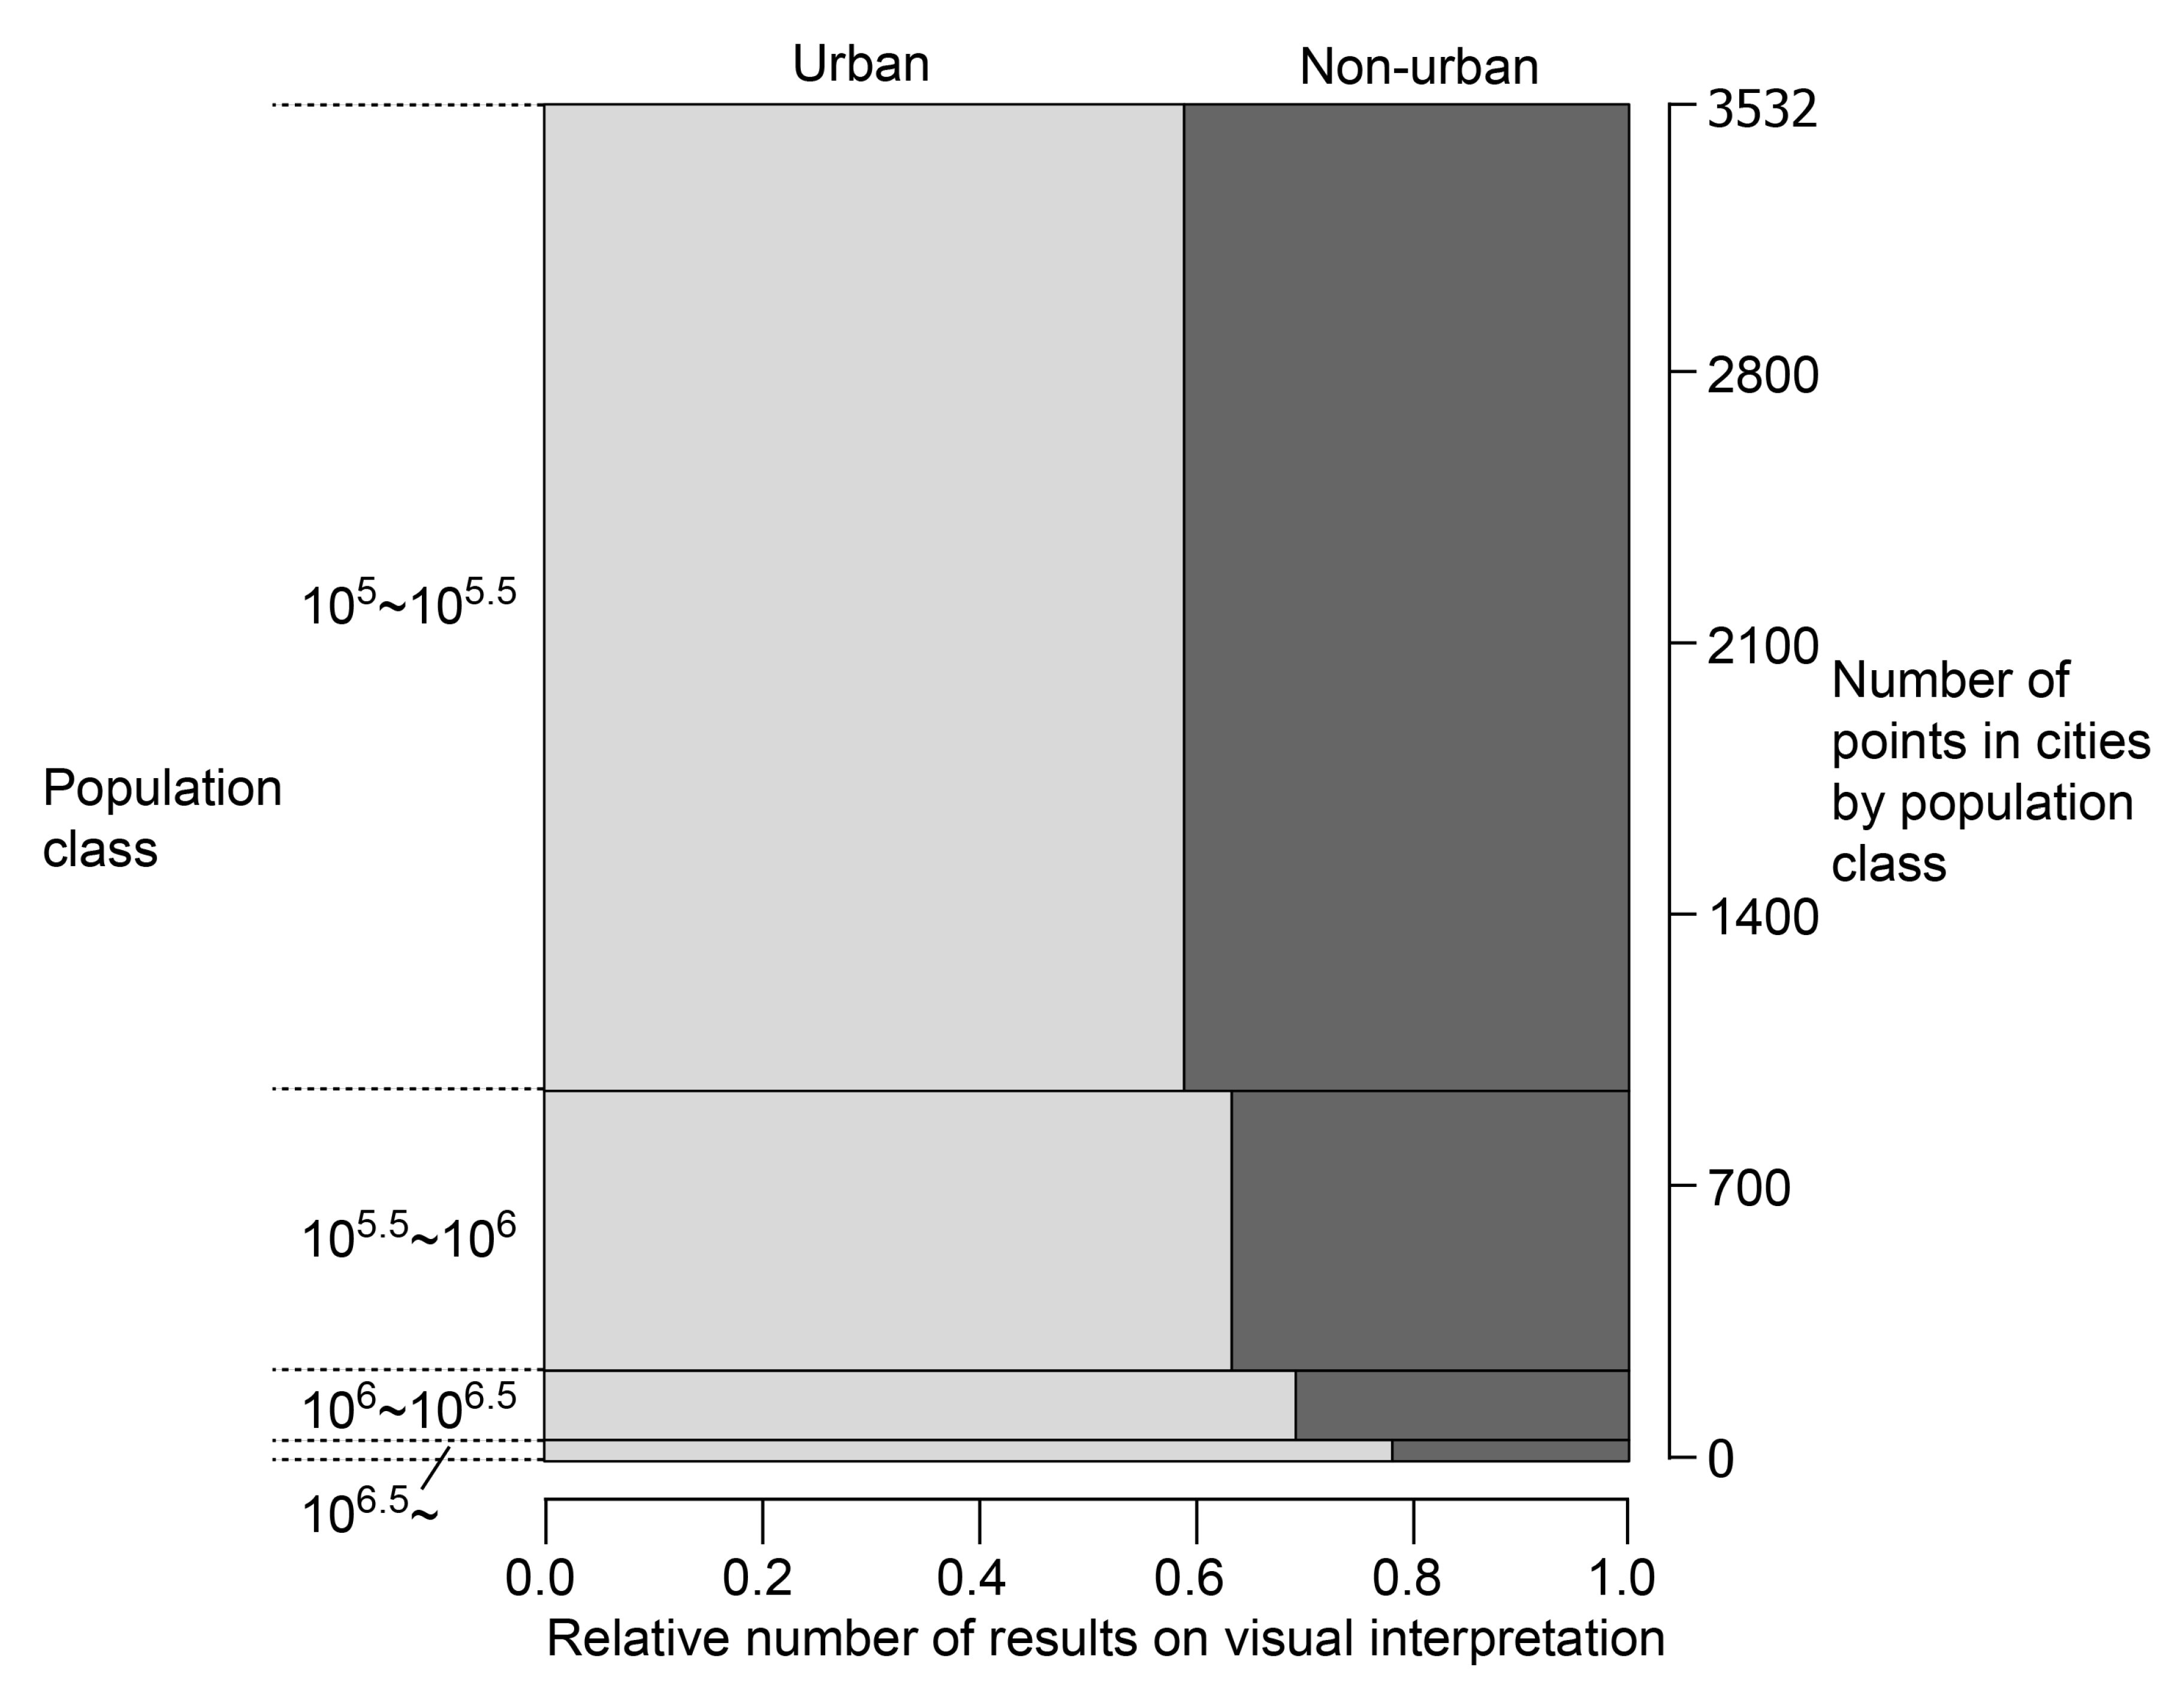
Ninety-three percent of the points were associated with small cities of less than one million people (
Figure 4), indicating that the ground truth database included points for a large number of small cities in addition to the relatively few very large cities. Another strong feature of the database is that the relative number of urban points increased with the population size class (
Figure 4), suggesting that the probability that a point would be identified as urban depended on the population at that point. The positive correlation between population and the geographical size of cities [
16] indicates that the points within larger cities are more likely to be in an urban area than those within smaller cities. As a result, there is a trade-off between the number of ground truth data points and the probability that the ground truth data points are urban. This trade-off represents a practical problem in developing a ground truth database from a gazetteer.
Figure 3.
The ratio of the number of points interpreted as urban to those interpreted as non-urban, and the comparison between the number of points for cities with more than 0.1 million people and total population by continent. The height in the left column represents the total population in cities with more than 0.1 million people. The height in the right column represents the number of point coordinates in cities with more than 0.1 million people, and the width of the grey shading indicates the urban to non-urban ratio from the visual interpretation results.
Figure 4.
The number of points in cities and the ratio of urban to non-urban points in the interpreted results classified by population.
Figure 4.
The number of points in cities and the ratio of urban to non-urban points in the interpreted results classified by population.
3. Validation of Global Land Cover Maps with the New Ground Truth Database
To demonstrate the usefulness of our new ground truth database, we used it to validate previously developed global urban area maps. To complement the ground truth data with non-urban data, we employed the ground truth database of the Degree Confluence Project (DCP), which contains ground information collected at 1
1
grid of latitude and longitude [
5]. We combined the DCP database and our ground truth database into a single database with 2,184 urban points (2,144 from the GSP; 40 from the DCP) and 5,559 non-urban points (1,388 from the GSP; 4,171 from the DCP).
We validated eight satellite-derived global land cover maps and urban area maps (
Table 1) using this composite database, calculating the total urban area,
user’s accuracy for urban areas,
producer’s accuracy for urban areas, overall accuracy, and the kappa coefficient for each of the eight maps (
Figure 5). The spatial resolution of the maps was considerably different from the spatial resolution at which we conducted the visual interpretation. Although it is recommended that the spatial resolution of visual interpretation be the same as that of classified maps [
17], we adopted the original 15 m resolution of our ground truth data to make the assessment protocols equivalent among the maps.
The overall accuracy and the kappa coefficient are commonly used parameters for map comparisons [
18], and the simplest way to determine which map has the highest accuracy is to compare their overall accuracies and kappa coefficients. In terms of these two indices, we determined that the MCD12Q1 was the most accurate urban area map. The results also suggested that the most recently published maps (the GLOB and the NEUA) are not necessarily the most accurate. We found significant differences among the maps between
producer’s accuracy, which is the probability that an urban point is correctly classified as such, and
user’s accuracy, which is the probability that a point classified as urban is actually urban (
Figure 5). Among the eight maps, the GRUMP UE map had the largest estimated total urban area, the highest
producer’s accuracy, and the lowest
user’s accuracy, indicating overestimation of urban areas.
Table 1.
The urban area maps validated in this study. Except for the MCD12Q1 and the NEUA, the maps were validated without correction for the different map projections. In the case of the MCD12Q1, which was published in sinusoidal projection by tiles, the image tiles were merged and resampled onto a grid of 0.004 degrees of latitude and longitude. The NEUA vector map was converted to a raster map with a resolution of 0.004 degrees of latitude and longitude, which is a slightly finer resolution than that of the NEUA source data.
To evaluate the features of our new ground truth database, we compared our accuracy assessment results with those of Potere
et al. [
6], who assessed the accuracy of the same maps using a different ground truth database that primarily included mainly 140 world cities. They sampled ground data from Landsat images on an area basis, aggregated them to the coarse resolution of the maps, and assigned sample pixels to be urban or non-urban by thresholding at 50% urban (
Figure 5). We obtained significantly higher
producer’s accuracy and lower
user’s accuracy than Potere
et al. [
6], which indicates that our assessment was more likely to detect errors of commission in urban areas, whereas theirs was more likely to detect errors of omission in urban areas. Our database might detect more errors of commission in urban areas because it included more points in less urbanised areas far from major urban centres, whereas that of Potere
et al. [
6] focused on the areas surrounding urban centres and the centres themselves, making errors of omission more likely.
Figure 5.
The total urban area and the assessed accuracies of each map in this study and in Potere
et al. [
6].
Figure 5.
The total urban area and the assessed accuracies of each map in this study and in Potere
et al. [
6].
The difference in spatial resolution might also account for the difference in
user’s accuracy. We interpreted data points at a finer resolution than Potere
et al. [
6] did. As a result, our ground truth database captured small greens or open spaces in urban areas that were filled with urban class pixels at a coarser resolution. With our database, such places were assessed as errors of commission in urban areas, whereas with the database of Potere
et al. [
6] they were assessed as the correct classification. This difference might cause the
user’s accuracy of our assessment to be lower than that of Potere
et al. [
6].
Comparing the overall accuracies calculated by Potere
et al. [
6], the four maps other than the GRUMP UE could not be differentiated because of the highly saturated overall accuracies (96%–97%), suggesting that the assessment included many chance agreements, which is a major problem when assessing overall accuracy [
18]. In contrast, the overall accuracies in our assessment ranged from 77% to 83%, and the overall accuracy rank was clearer, with that of each map corresponding to its kappa coefficient ranking. Thus, chance agreement played a lesser role in our accuracy assessment than in that of Potere
et al. [
6]. This difference between the assessments indicates that their database had a greater urban to non-urban ratio of data points than ours, resulting in the greater likelihood of chance agreement in their database.
4. Conclusions
We developed a ground truth database by visually interpreting 3,734 point locations of populated places retrieved from the GSP gazetteer that have more than 0.1 million people. As a result, we acquired 2,144 urban ground truth data points and 1,388 non-urban points, distributed proportionately among the continents according to population. The ground truth database thus contained many more urban points than did previously developed databases, but the use of these ground truth points requires point-by-point investigation.
By combining this database with the DCP database, we acquired a database comprising 2,184 urban ground truth data points and 5,559 non-urban points. We used this ground truth database to assess the accuracy of eight global urban area maps. Among these, we determined that the MCD12Q1 was the most accurate, and that the most recently published maps were not necessarily the most accurate. Users of such maps should consider not only how recently the map was developed but also whether the definition of urban used by the map is consistent with the needs of the user.
We also compared our accuracy assessments with that of Potere
et al. [
6] and found a significant difference both in the type of error detected and in the probability of chance agreement.
We regard our ground truth database as a valuable contribution, both for determining the accuracy of global urban area maps and for evaluating the characteristics of urban area maps. Comparing the accuracy assessments with the ground truth data interpreted at various spatial resolutions (e.g., ASTER/VNIR versus Google Earth) could be a useful way to characterise global urban area maps. This effort could encourage harmonisation of global land cover and urban area maps, and will reduce uncertainty in the projection of interactions and processes of human systems on the earth.


