1. Introduction
Detailed information on urban sprawl is of great interest for town municipalities in the fields of urban planning, water and land resource management, etc. For these purposes, analysis of spatial and temporal data, which help in quantifying growth trends on a spatial scale, are required. Unfortunately, modern mapping data sources are not available for all urban centers, which may prevent an appropriate temporal estimation of territorial evolution. For large scale change detection studies, considering a temporal range of about sixty years, scanned historic aerial photography are the only basic data available to rapidly produce cartographic information on peripheral areas.
Building extraction is one of the main procedures used in updating digital maps and GIS database information. Because of its complexity and its time-consuming manual interpretation, efforts have been made to speed up this process through automatic or semiautomatic procedures. A wide range of techniques and algorithms for detecting and delineating buildings have been proposed in order to automatically construct 2D or 3D building models from satellite and aerial imagery. However, no commercial systems for fully automatic building reconstruction still exist. Rottensteiner reported [
1] that this is due to some unsolved issues: lack of flexibility to handle a large variety of building shapes; need to apply
ad-hoc methods for decision making in the reconstruction process; presence of highly complex roof structures consisting of many small parts that not only result in over-generalized models, but may in fact cause algorithms to fail completely.
In light of the above issues, this paper focuses on a decision making strategy that combines various data mask layers in order to delineate buildings from true-color stereo aerial imagery automatically in a complex built-up area (one to three-floor residential housing with irregular shapes, heterogeneous materials of roofs and close vegetation). We referred to the automatic classification systems suggested by Guelch [
2] in which the main phases are conducted in automatic mode, with the user being only involved in the phases of initial setup, post-editing and identification of errors in the final results. The aerial digital data used and the simplified procedure proposed in this study simulated the working processes of rapid map production and change detection analysis carried out comparing multi-temporal scanned historic aerial photography with the intent of identifying potential urban sprawl in peripheral areas.
To improve the efficiency of the extraction process various geospatial image processing techniques were combined using the spatial and spectral content of imagery, without any external auxiliary data. As these techniques are currently unavailable within a specific single software environment, the procedure was implemented jointly using a photogrammetric system, remote sensing image processing and a GIS platform in such a way that each technique could benefit from the others. The proposed method consists of three phases: Pre-processing; Intermediate data preparation; Data integration. The potential and limitations of our approach are discussed in the following sections. Our method was evaluated based on objective criteria employing the following indices: Detection Percentage (DP), Branch Factor (BF), Correct Extract Edge Percentage (CEP), the Shape Factor (SF) and Root Mean Square Error (RMSEz).
2. Related Works
To date, building delineation and reconstruction from remote sensed imagery are still key issues, aiming at time and costs saving in cartographic production and updating. Full automatic systems in this field are not yet operational [
3] and cannot be implemented in a single step [
4]. The reason behind such difficulties is to be sought in scene complexity, incomplete cue extraction and sensor dependency [
5].
Across the various approaches already proposed in literature, extraction methods have been chosen according to data availability and level of detail to achieve. Very High Spatial Resolution (VHSR) satellite imagery has enhanced our possibility to produce large scale topographic mapping but its effective use is restricted to panchromatic sensors [
6]. Compared to sub-meter resolution of aerial imagery, 1-meter satellite imagery has weaker object resolving power because the same object is represented with relatively fewer pixels. In addition, a higher object density in image space makes it more difficult to separate a single object from surrounding ones and pixel mixing becomes more serious [
7]. As reported in [
8], 1-meter high-resolution satellite imagery also leads to certain interpretation restrictions. About 15% of the building areas measured in aerial images could not be adequately modeled in the satellite imagery.
At the same time, national coverage true color aerial digital data sets with excellent spatial detail are routinely produced, such as every one or two years, for many countries [
9]. In multi-temporal analysis they can be compared with scanned historic aerial photography for assessing and predicting change based on long-term trends [
10]. However, these imagery sources contain certain redundant information for the given task of building extraction with relation to vegetation, shadows, cars and building details [
11]. Moreover, in such data there is a loss of basic information due to occlusions, low contrast or disadvantageous perspective.
In order to cope with such inconveniences, many procedures have been investigated, mainly based on the level of automatic and semi-automatic interaction with human intervention, on single-view and multi-views acquisitions and on region-based and edge-based detection, most often by searching their possible integration in order to reach better results [
12].
Aerial or satellite images are employed as single data source for building extraction by means of auxiliary information such as shadow [
13], perceptual grouping based on the line segment obtained from edge detection, which is useful in defining border pixels [
14], or both of them [
15]. Levitt [
16] proposed a system to extract buildings in sparsely built-up areas based on the integration of both edges and region factors with the implementation of an operator named HO (Homogeneous Operator) and an area filtering operator to get buildings and shadows. Lee
et al. [
17] used the classification result of multi-spectral images to proximately evaluate the location and shape of buildings and the segmentation result of panchromatic images to improve extraction from Ikonos imagery. Jiang
et al. in [
12] proposed a semi-automatic method to extract buildings through segmentation, region growing and edge detection. Shorter
et al. [
18] implemented an unsupervised tertiary classifier for the identification of vegetation, building and non-building objects from a single nadir aerial image.
To obtain a high level of automation while also producing reliable results, multiple images are widely used to extract elevation information through photogrammetric techniques [
19,
20]. Good results have been found in recognizing building structures in laser scanner point clouds, fusing LIDAR (Light Detection and Ranging) data (high vertical accuracy) with stereo matched points extracted from the air-photograph stereo model (high horizontal accuracy) [
21,
22]. LIDAR information is not always available and problems in precise co-registration still remain.
When elevation information is handled to enhance building detection, digital surface models (DSM) created from aerial images or high-resolution satellite images can also be used, also considering their drawbacks [
23]. Generally, building extraction with DSM has quite a lot of limitations. It requires flat terrain and, when the area is large, the extraction result is not good [
20]. To solve this problem, a normalized DSM (nDSM) can be used. Weidner and Förstner [
24] introduced a simple method based on applying a height threshold to a normalized DSM to detect buildings. Alternatively, the complexity of building detection can be greatly reduced by subtracting terrain features from a complex scene as background information [
25,
26]. Haala and Brenner [
27] applied a pixel-based classification where the nDSM was used as an additional channel besides the three spectral bands of the aerial imagery. Chen
et al. [
28] followed a region-based segmentation of nDSM and orthoimages and then used a knowledge-based classification to detect building objects.
Also the spectral content of images has been used to improve accuracy in building identification. In his ATOMI update work, Niederöst [
29] generated the DSM as the primary data source and used image spectral information in order to extract man-made objects from natural objects. Moreover, the Normalized Difference Vegetation Index (NDVI) combined with nDSM proved to be able to discriminate green from trees [
30,
31]. If no infrared data is available, the problem of vegetation detection can be solved under exclusive use of the RGB information of color image [
31].
3. Data and Methods
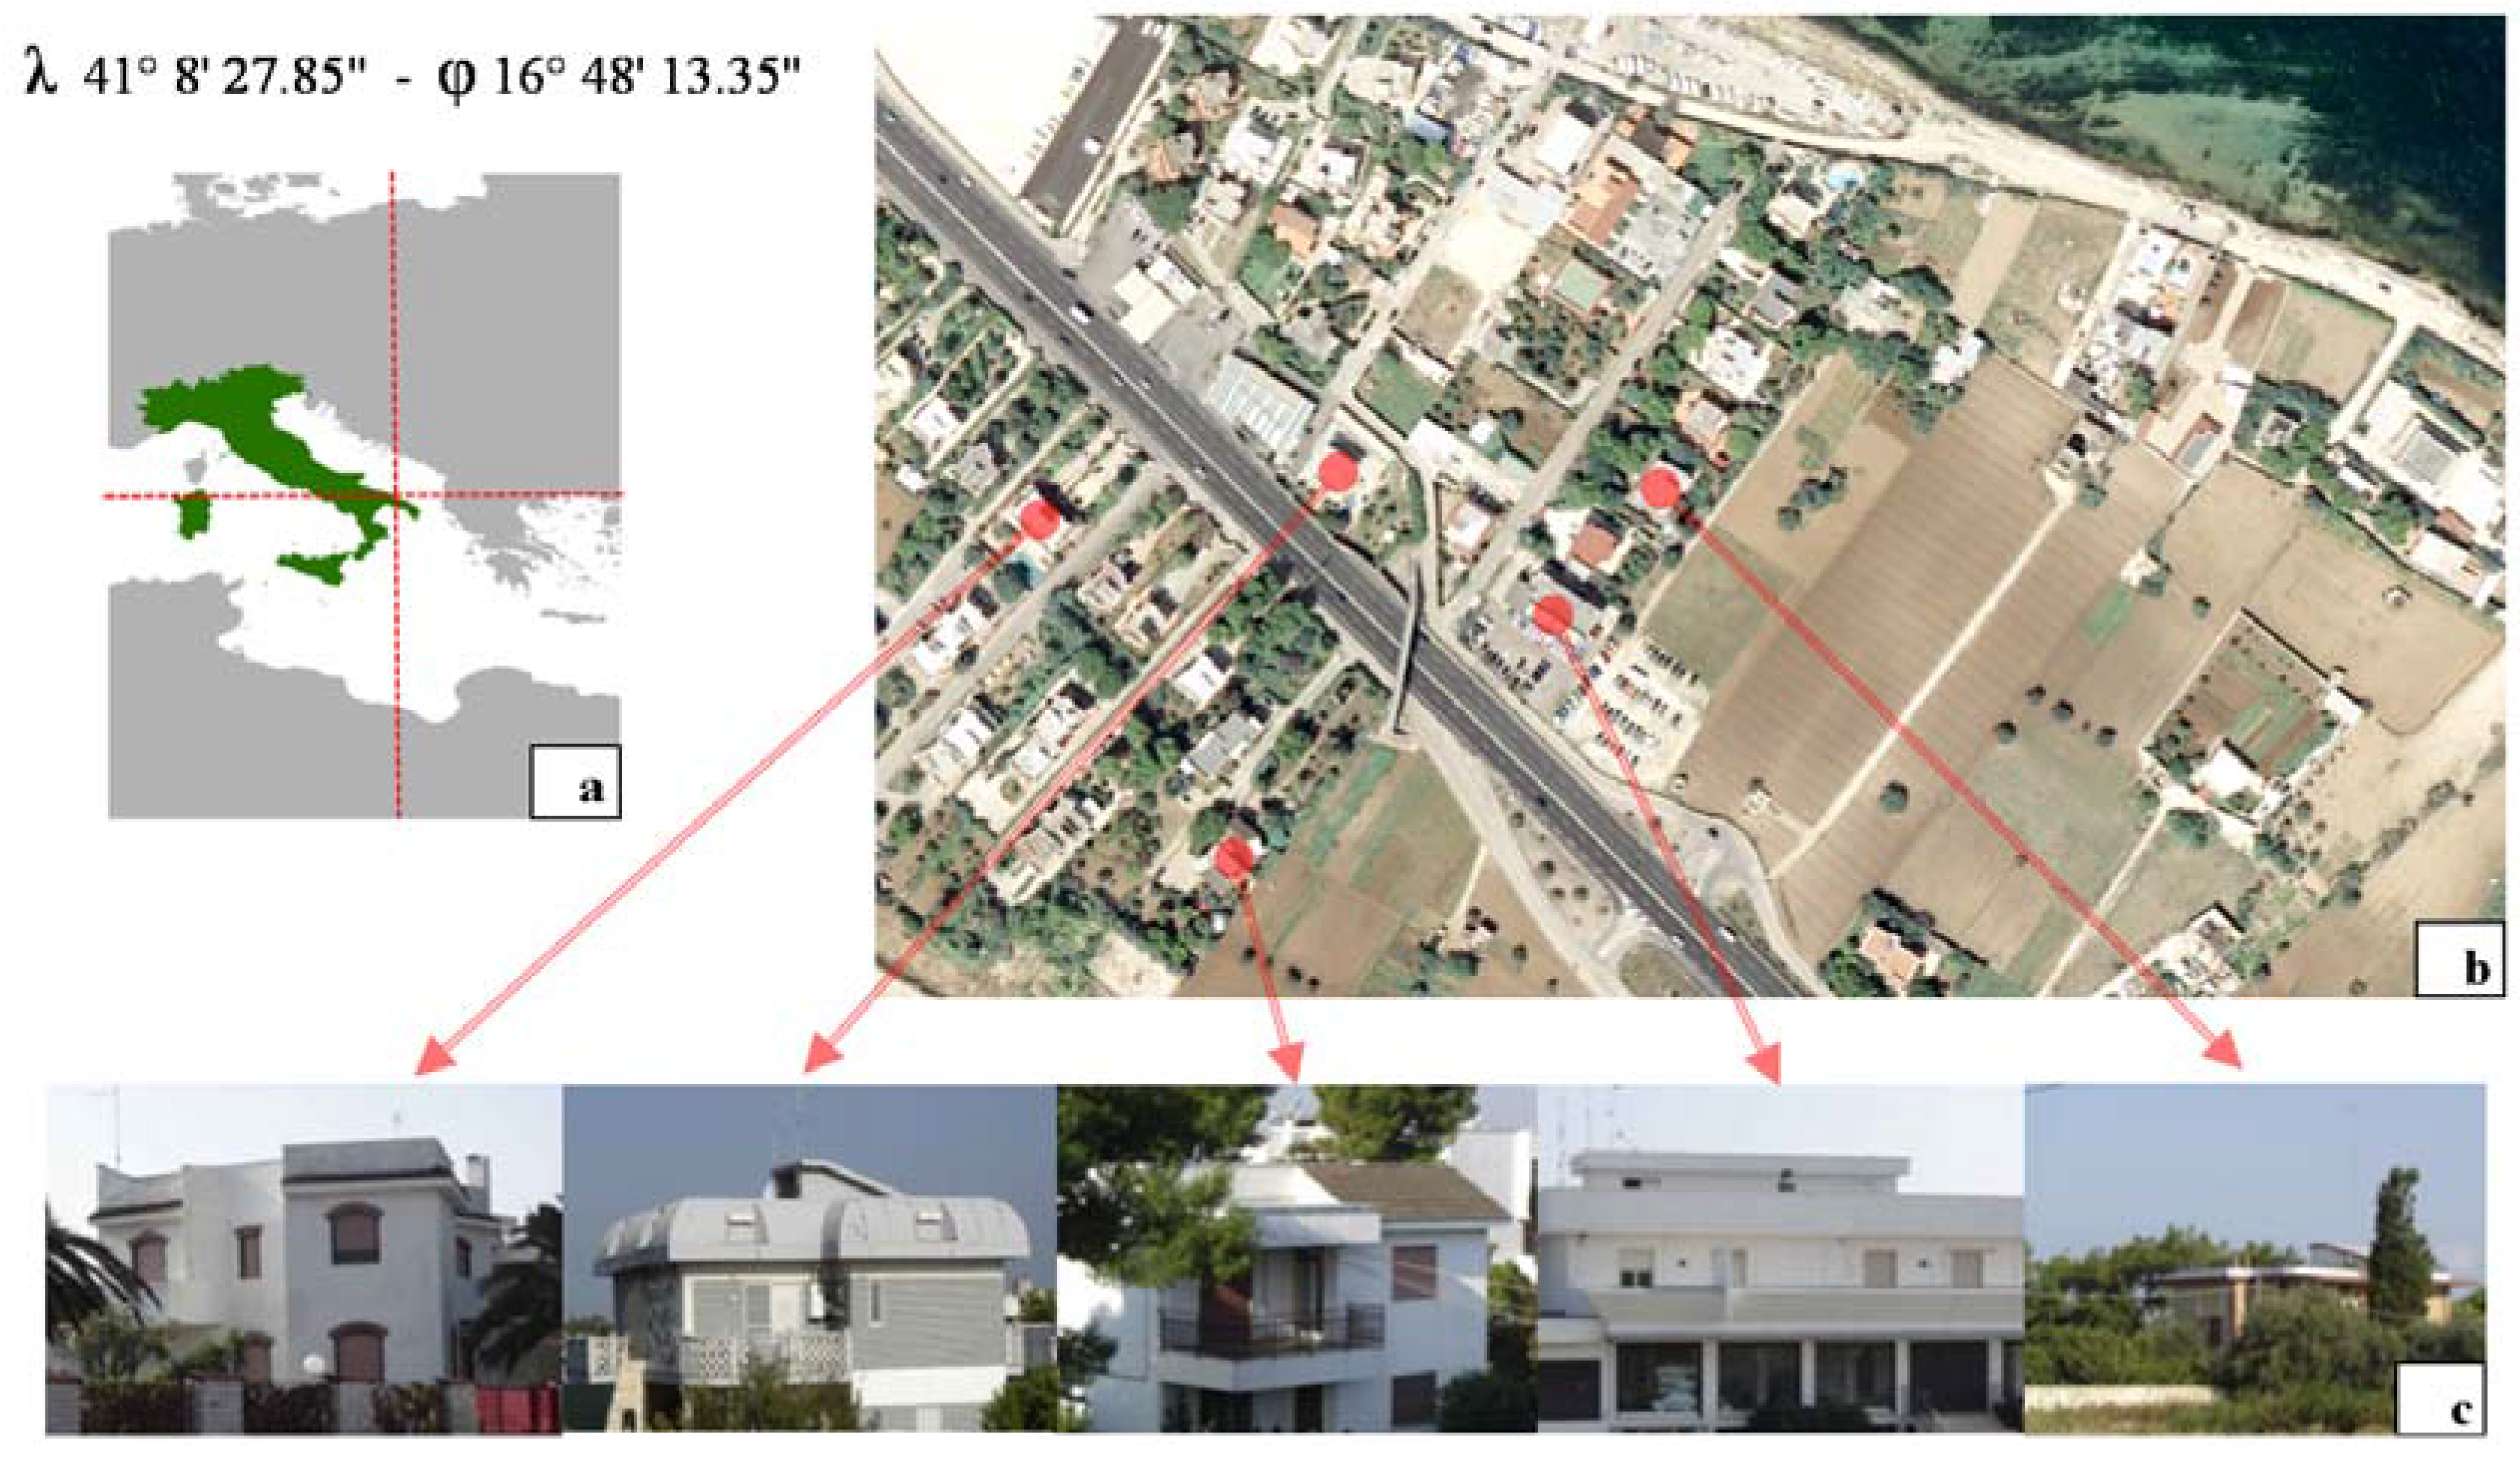
The digital aerial imagery used in this work features a ground sample distance (GSD) of 20 cm, and was acquired on 18 August 2006 using a Z/I Imaging DMC—Intergraph Digital Photogrammetric Camera. The study area is located in a residential district of Bari (Italy) known as Marconi-San Girolamo-Fesca featuring single and multi-family housing. To analyze various types of building objects (from one to three-floor residential housing with irregular shapes, heterogeneous materials of roofs and close vegetation) and to reduce processing times, a sub-set area overlapping two image data sets was studied (
Figure 1).
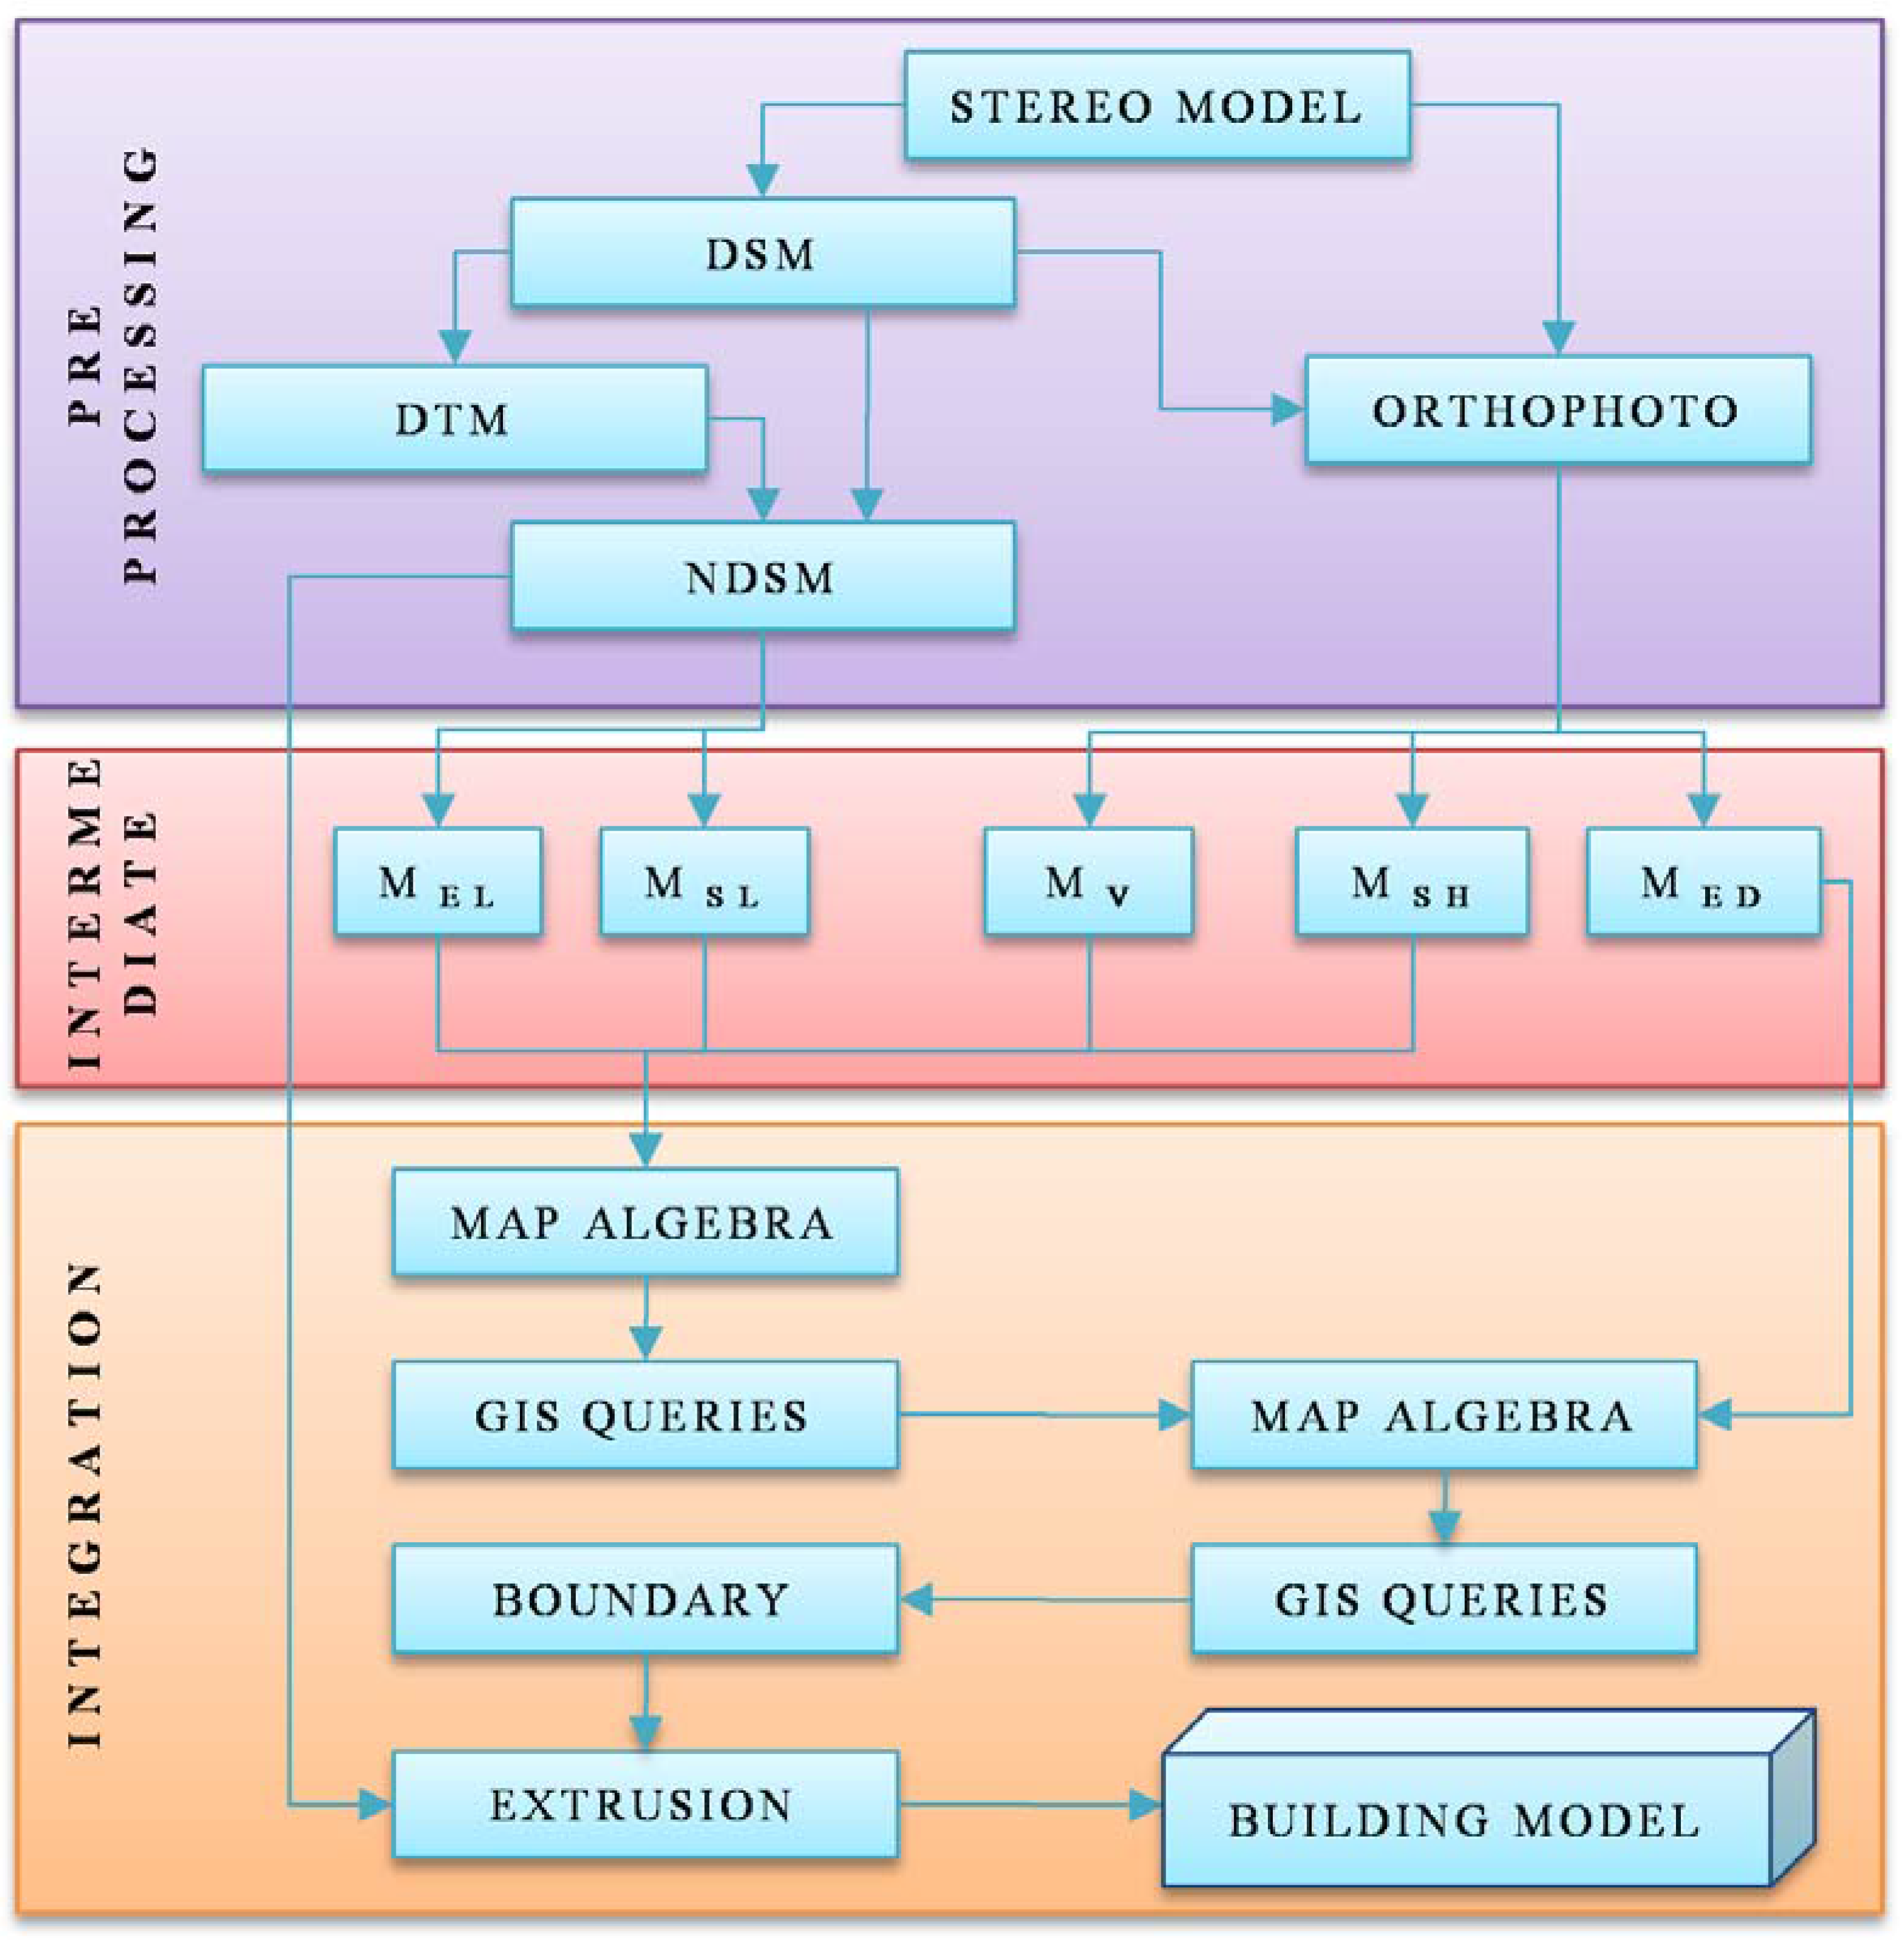
The proposed decision making strategy consists of three phases: Pre-processing; Intermediate data preparation; Data integration. The steps of the implemented algorithm are depicted in
Figure 2. The study method utilizes color and texture information from an orthophoto and height values of a normalized DSM, both of them deriving from a true color stereo aerial imagery.
After the basic photogrammetric operations were performed (first phase), five mask layers were created to discriminate building and no building objects, using the nDSM, color, texture and edges information as basic cues (second phase). In the last phase of the method, mask layers were integrated on the base of the nDSM blobs by means of map algebra rules. Spatial and attribute queries were then implemented in a GIS environment to select building objects and to refine their boundaries from their secondary structures (
i.e., balconies, staircase towers and shelters). A building block model (LoD1) as defined in [
32] was finally extruded by considering the mean value height of the DSM included in every building.
Figure 1.
(a) Localization of the study area, (b) the sub-set data overlapping two stereo image data, and (c) the investigated mixed housing typology.
Figure 1.
(a) Localization of the study area, (b) the sub-set data overlapping two stereo image data, and (c) the investigated mixed housing typology.
Figure 2.
Building detection and extraction block diagram.
Figure 2.
Building detection and extraction block diagram.
3.1. Pre-Processing
This phase was mainly oriented at the creation of basic raster data (nDSM and RGB orthophoto) to be further processed. At this stage, accuracy is crucial for the quality of results if no additional data, such as building footprints, are available.
The stereo-model setup was computed with an iterative least square bundle adjustment in order to refine the parameters of the geometric model with GCPs. These were stereo-plotted on a digital stereo-workstation at the accuracy level of one pixel, to avoid error propagation in the modeling while maintaining accuracy on the order of one pixel.
The DSM was then automatically created through image matching based on 65% forward overlap. Homologous points were computed by cross-correlation, by setting a searching window of 19 × 3, a square correlation window of 7 × 7 and a threshold correlation coefficient of 0.80. The matching approach used combines Area Based Matching (ABM) and Feature Based Matching (FBM) algorithms with epipolar constraints. This procedure is fully automatic and does not require any manual digitations, breaklines, dead areas (i.e., lakes, forests, etc.) and post-editing interventions since points are established with optimal correlation and a 2 m regular grid, according to technical cartography specification at a scale of 1:5,000.
After the determination of the DSM, the orthophoto was generated by setting 20 cm as the grid cell dimension with bilinear resampling and horizontal RMSE value of ±19 cm. In this case the perspective distortion effects at building edges were moderated by the flat nature of the territory and the low height of buildings (up to three floors).
The last operation of this phase focused on the creation of a normalized Digital Surface Model (nDSM = DSM − DTM) aiming at excluding topographic effects [
26]. The Digital Terrain Model (DTM) was generated with the combination of two different matching strategies. This way, if a determined point had the same height value it could be quite likely considered as a ground point [
33]. Both strategies had the same square correlation window (7 × 7) and threshold correlation coefficient of 0.80 but a different searching window: the first of 19 × 3 and the second one of 11 × 3.
A difference between the two elevation models was executed, setting a threshold of 5 cm. Next, only the pixels belonging to the same region with an area greater than 8 m2 were selected, using a segmentation procedure. All points contained within the above regions were interpolated to create the DTM. Lastly the nDSM was generated from the difference between DSM and DTM.
3.2. Intermediate Data Preparation
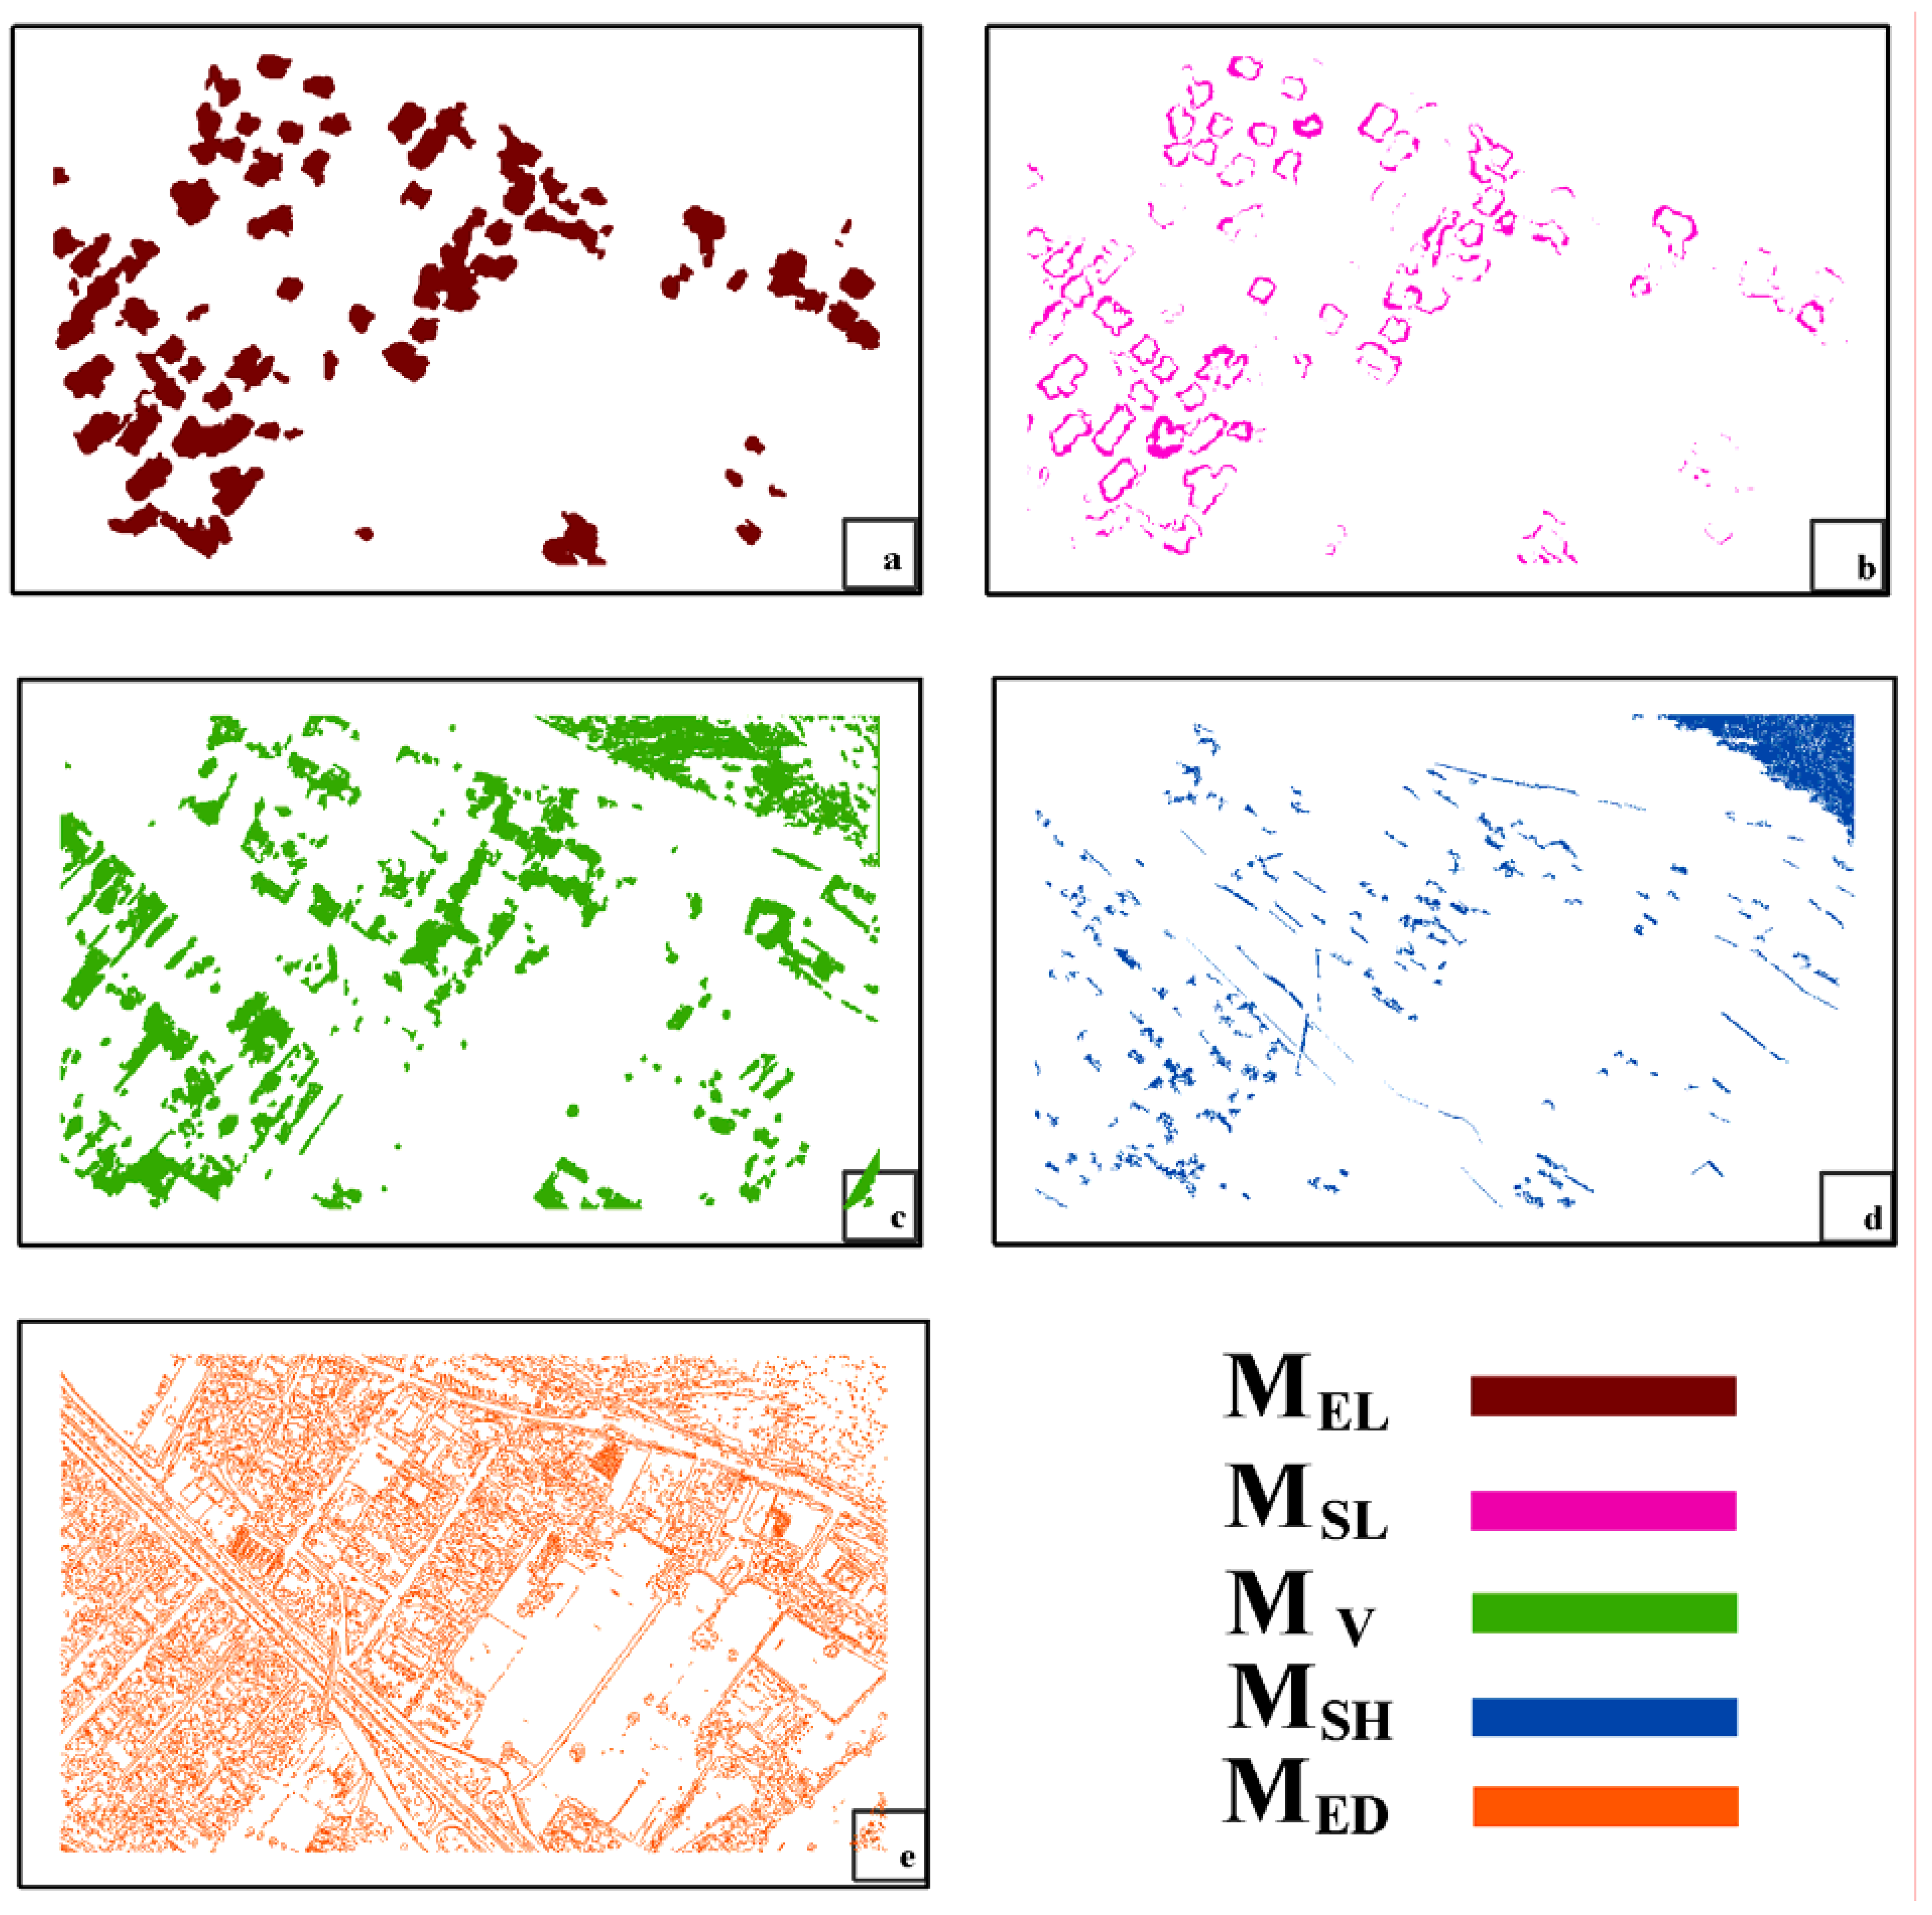
In the second phase of the decision making strategy, the basic contents of the DSM and orthophoto were processed creating binary masks through segmentation rules. To handle a large variety of objects, decision rules were determined on the basis of thresholds set during the preliminary analysis of data, including building typology (one to three-floor residential housing with irregular shapes, heterogeneous materials of roofs and close vegetation) as well as the peculiar conditions of our study case (sun angle, vegetation canopy,
etc.). The resulted raster data (
Figure 3) became the input for the next map algebra operations.
Figure 3.
Intermediate raster data: (a) Elevation mask-layer MEL, (b) Slope mask-layer MSL, (c) Vegetation mask-layer MV, (d) Shadow mask-layer MSH, (e) Edge mask-layer MED.
Figure 3.
Intermediate raster data: (a) Elevation mask-layer MEL, (b) Slope mask-layer MSL, (c) Vegetation mask-layer MV, (d) Shadow mask-layer MSH, (e) Edge mask-layer MED.
3.2.1. Height Threshold and Masks
The primary building mask MEL (Elevation mask-layer) was used for discriminating elevation objects from the earth, with a threshold of TE = 2.5 m, stated as minimum height of buildings. If the nDSM height of a cell value was less than TE, the corresponding pixel in MEL was assigned 0, otherwise it was assigned 1. In order to disjoin single regions an Opening morphological operator with a 3 × 3 convolution kernel was preferred. In this mask only the connected regions with an area greater than 35 m2 were selected by means of a segmentation procedure.
The secondary mask MSL (Slope mask-layer) was processed using slope data from the nDSM model in order to remove errors due to the interpolation of ground points in the altimetric models (both the DSM and DTM). A threshold of TS = 40° was applied to create a binary mask. If the slope of a cell value was less than TS, the corresponding pixel in MSL was assigned 1, otherwise it was assigned 0.
To reduce the effects of balconies, balustrades and staircases, an Erode morphological operator with a 3 × 3 symmetric convolution kernel was favored. As before, only the segmented regions with an area greater than 7 m2 were selected.
3.2.2. Color Threshold and Masks
Color information from the ortho imagery was used to distinguish buildings and man-made objects from vegetation.
Due to the absence of Infrared information, Red and Green bands were combined following the method suggested by Sibiryakov [
34]. The Infrared band was simply replaced with the Green band in order to constitute the Normalized Difference Green Red Index (NDGRI) able to distinguish plant biomass using the spectral contents of RGB data. To create the NDGRI image mask M
N, a minimum threshold T
N = 0.2 was set up. Such value was empirically determined by analyzing the Spectral Signatures on single ground entities.
The main limit in the application of the NDGRI index relates to the erroneous classification of some roof typologies. To reduce these effects the texture Homogeneity of the Grey Level Co-occurrence Matrix (GLCM) [
35] was introduced as a parameter. It was created by setting a moving window of 5 × 5 with diagonal direction of 45° and 1 as distance among pixels.
For the Homogeneity mask MH, a maximum threshold TH = 0.5 was set up based on the empirical analysis performed on plant biomass within the study area.
The spectral information of both the MN and MH masks was then combined through intersection processing in order to create the Vegetation mask-layer MV. If the pixel of MN was less than TN and the pixel of MH greater than TH, the corresponding pixel in MV was assigned 0, otherwise it was assigned 1. A Dilation morphological operator with a square kernel of 5 pixels was applied to regularize the shape of regions and reduce the presence of internal areas. As before, only the segmented regions with an area greater than 4 m2 were selected.
Finally, the orthophoto was converted from RGB to Hue (H), Saturation (S) and Value (V) color system in order to utilize the properties of HSV chrominance information for shadow suppression [
36]. This layer identified large shadow zones that in this stage were classified as “no building” areas.
The Shadow mask-layer MSH was obtained executing the product operator of two image masks: the first mask was derived from the saturation component and the second one was extracted from the intensity component, utilizing a threshold TSAT = 0.5 as minimum value for both of them. If the pixel of the Saturation component was less than TSAT and the pixel of the Intensity component less than TSAT, the corresponding pixel in MV was assigned 0, otherwise it was assigned 1. All shadow zones with a surface smaller than 8 m2 (corresponding to parapets and staircases) were removed, using the previous segmentation approach. Even if many large false positives (i.e., no-shadow zones identified as shadow ones) were found in the resulted mask-layer image, they were not on building roofs.
3.2.3. Edge Identification and Masks
A large number of edge detection algorithms are available. Generally they offer different trade-offs between resolution and noise reduction [
37]. In this study, to remove areas with ‘no buildings’ an
Edge detector [
38] was selected, given its comparative simplicity and wide availability. For the purpose of this study, it was applied on the V-band of the HSV-orthophoto color space, setting a value of 1.5 as standard deviation for the Gauss smoothing filter and 3 as lower threshold value for the non-maximum suppression, without setting the upper threshold parameter for the lack of a uniform image background. If the edge length M
ED was longer than 5 m (stated as minimum dimension of buildings) then the corresponding pixel in M
ED was assigned 1, otherwise it was assigned 0.
3.3. Data Integration
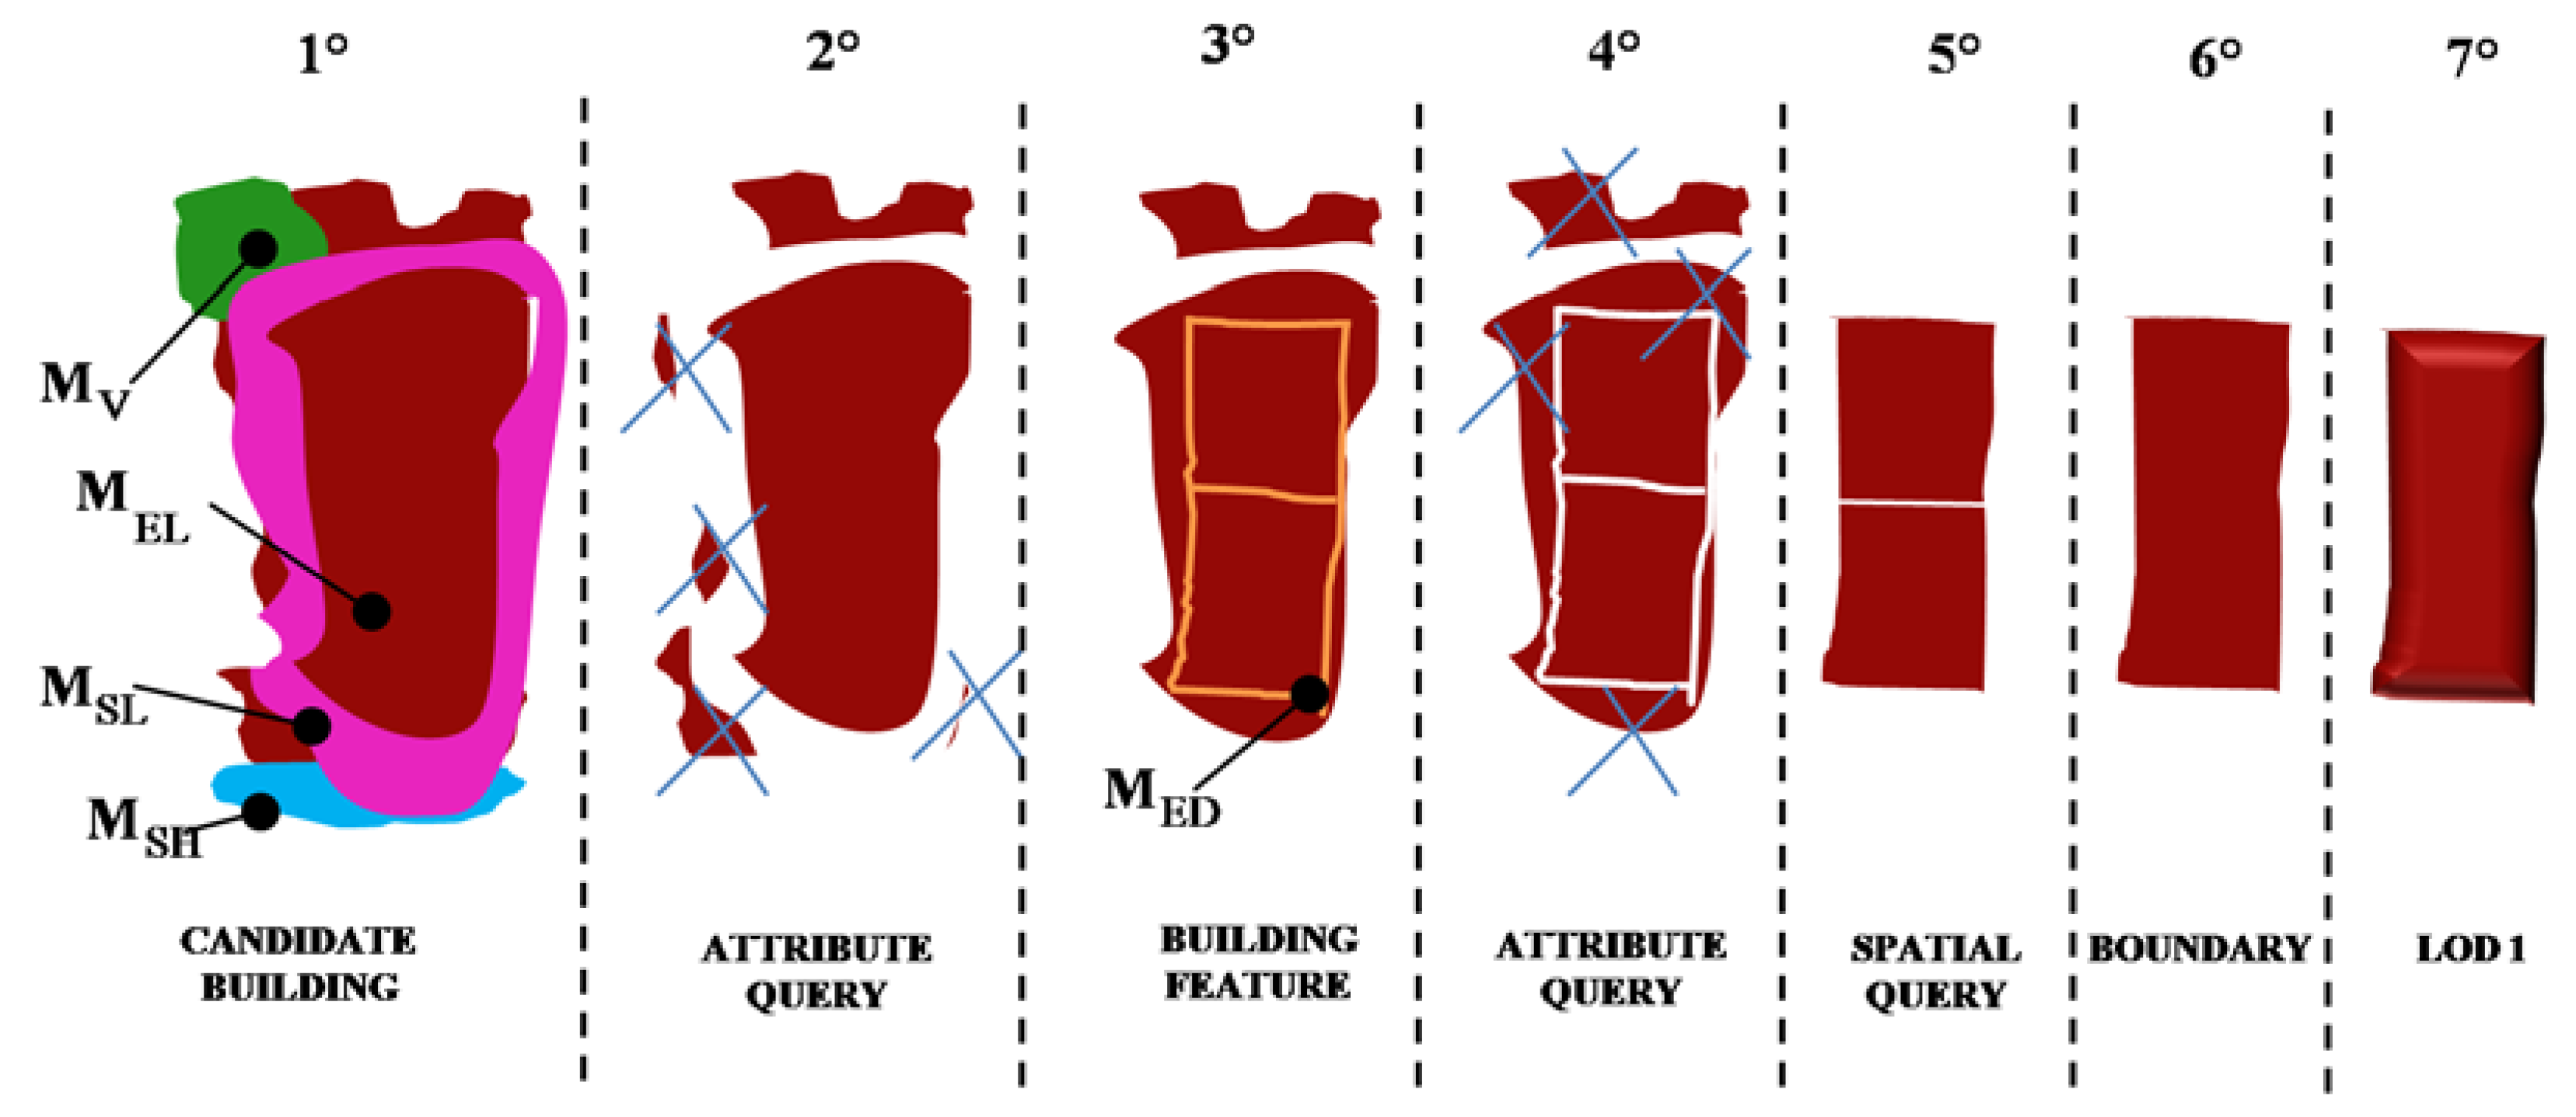
The last stage in the procedure was also highly sensitive to the alteration of the parameters to be introduced, which may be determined by the local conditions of the acquired scene. All the previously derived information was implemented in a GIS software environment in which the definition of parameters depends on the user’s a priori knowledge (e.g., size and mean height of buildings) and can include the modification of minimum area, shape, etc.
The previously obtained masks (M
EL, M
SL, M
V, M
SH, M
ED), were therefore combined in seven sequential sub-steps to determine final building footprints through map algebra and spatial/attribute queries (
Figure 4).
- (1)
The candidate buildings for the final procedure were extracted starting from the elevation mask-layer (M
EL) by executing the multiple raster intersection as follows:
- (2)
Only the connected regions with an area greater than 40 m2 were selected by means of a segmentation procedure.
- (3)
The M
ED mask was used to complete the blob delineation by separating areas close to buildings from internal ones as follows:
- (4)
Rectangular features were selected from (2) by means of an attribute query using areas greater than 25 m2 and thickness ratios greater than 0.25 to search for skinny polygons.
- (5)
Previous features were aggregated in potential buildings if the distance neighbor was less than 0.2 m.
- (6)
Potential buildings borders were regularized by means of the Douglas and Peucker algorithm [
39] using a 3-pixel tolerance.
- (7)
A building block model (LoD1) was extruded by considering the height mean value of the DSM included in every building footprint (
Figure 5).
Figure 4.
From blob-polygons to building detection phases.
Figure 4.
From blob-polygons to building detection phases.
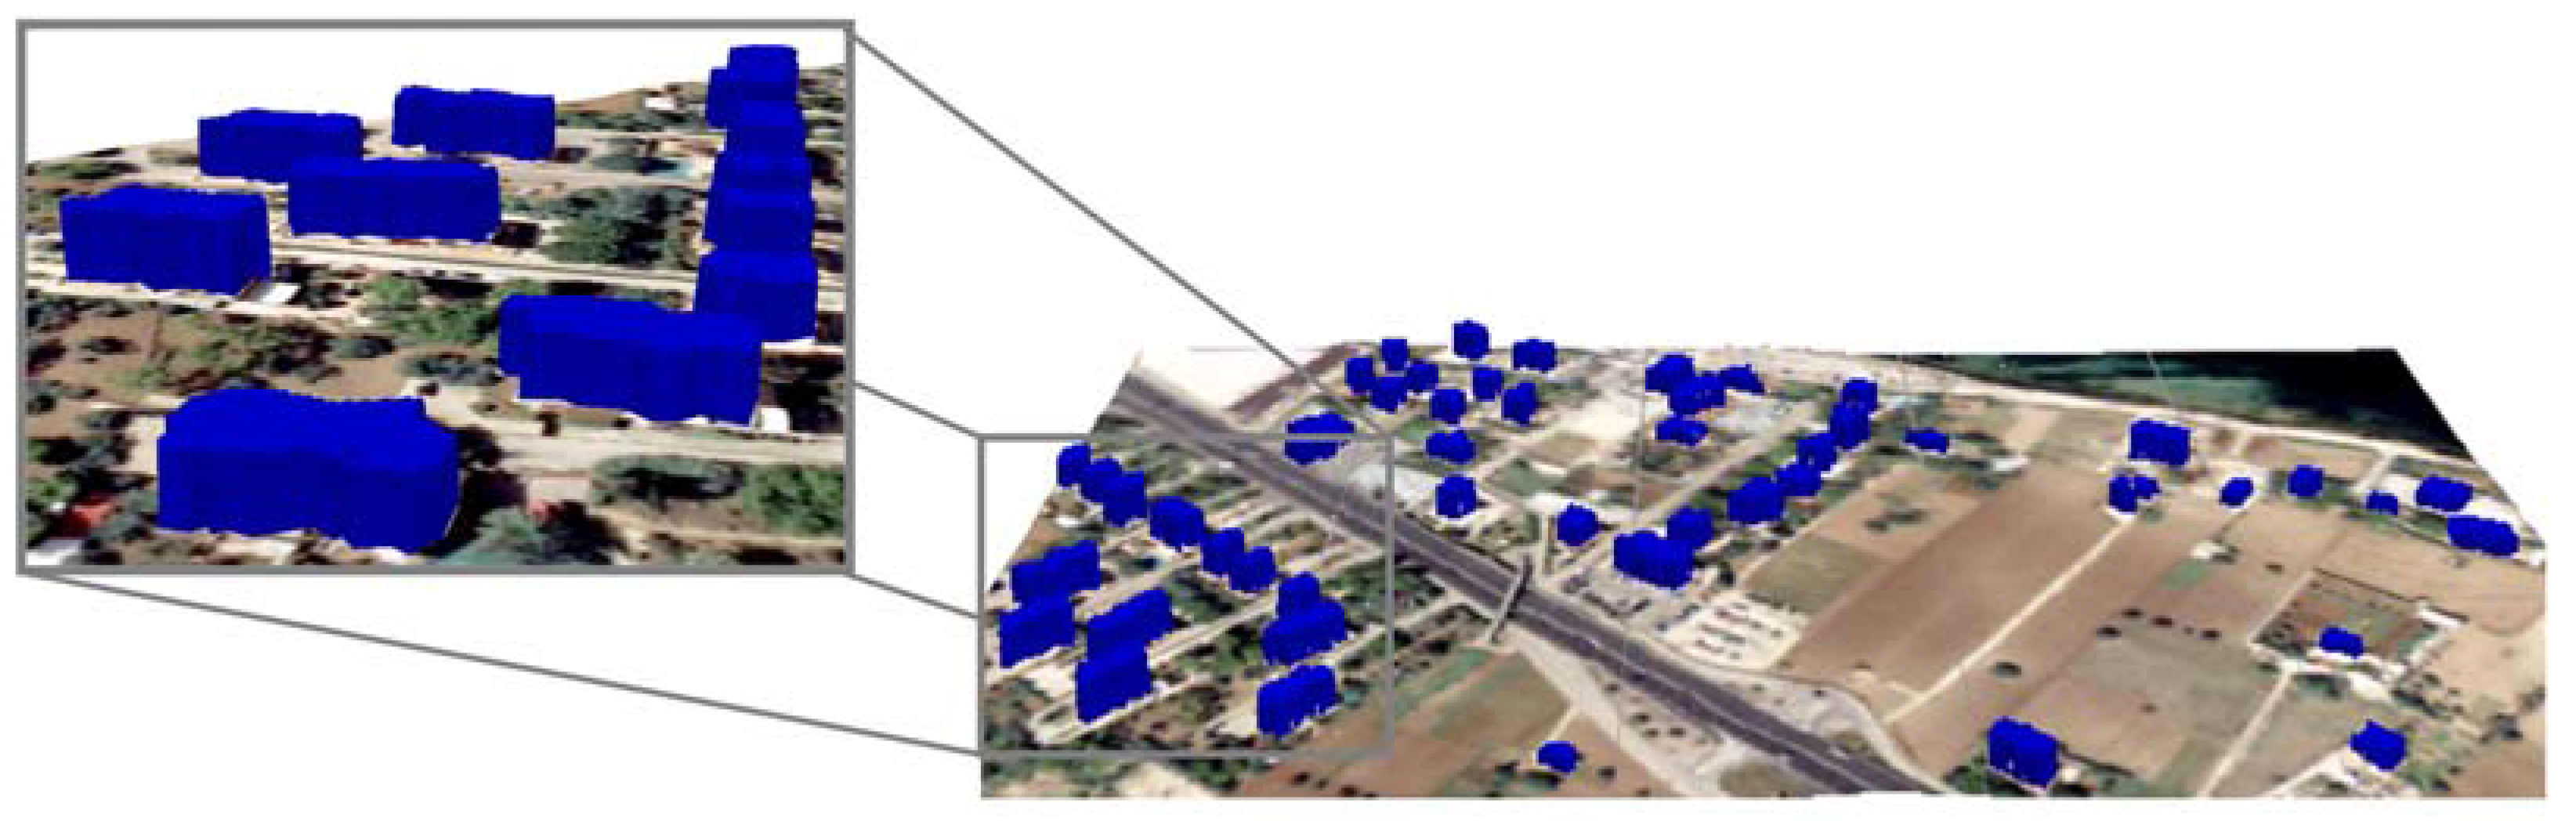
Figure 5.
Extruded buildings on the raw orthophoto.
Figure 5.
Extruded buildings on the raw orthophoto.
4. Evaluation of Results
In order to provide a quantitative assessment of the proposed decision making strategy five performance metrics were employed next.
The first comparison was executed evaluating the automatically extracted buildings and reference buildings, by using the following objective metrics [
13]:
In the formulas above, the Detection Percentage (DP) index (3) describes the number of buildings correctly recognized by means of the automatic procedure in percentage, while the Branch Factor (BF) index (4) expresses the number of buildings erroneously identified. Such indices were calculated by considering the ground truth data obtained through the manual photogrammetric plotting. In this accuracy assessment phase, various indicators were applied to obtain the DP and BF indices: the True Positive (TP) index represented buildings correctly identified both by the user and through the automatic procedure while the False Positive (FP) index referred to buildings identified through the automatic approach but not by the user and the True Negative (TN) to buildings identified by the user but not through the automatic procedure.
As the above metric did not include wrongly identified buildings, i.e., errors of commission, the efficaciousness of our method was also evaluated using three further indicators to also verify its precision in feature extraction: the Correct Extract Edge Percentage (CEP), the Shape Factor (SF) and the Root Mean Square Error (RMSEz) indices.
The Correct Extract Edge Percentage
(CEP) index (5) allows evaluation of accuracy in building edge extraction [
40]:
where
TP is a building detected both manually by the user and through the automatic procedure and
EE is the number of incorrect edges of buildings detected both manually and automatically.
The
SF index (6) evaluates the accuracy of detected buildings on the basis of the extent of overlap between the extracted buildings and their corresponding buildings in the ground truth data [
41].
where A is the area of a building in the ground truth data detected by the user and B the area of the corresponding extracted building.
Finally, the accuracy of the proposed methodology was tested on correctly identified buildings from an altimetric point of view. The evaluation was conducted assuming the measures obtained by the user as accurate and considering them as a reference in the Root Mean Square Error (
RMSEz) calculation for heights assessment. The
RMSEz, as described in [
42], is a commonly used metric to express vertical accuracy of elevation datasets:
where
n is the number of reference observations,
Zr,i the observations obtained by the user and Z
m,i the observations obtained through the procedure.
The results of our system evaluation by building-by-building metric methods are summarized in
Table 1.
Table 1.
Quantitative assessment of results.
Table 1.
Quantitative assessment of results.
| TP | FP | TN | DP (%) | BF (%) | RMSEZ
(47 buildings) |
|---|
| 47 | 3 | 4 | 92.2 | 6.0 | 0.96 |
The procedure pointed out discordant results for
SF and
CEP indices. While the
SF index globally proved highly positive results, the
CEP index showed values around 50%. The high numbers of edges erroneously identified (
EE) was caused by buildings characteristics (irregular shapes, spectral content similar to road pavements, obstacles,
etc.). The edge detection percentage reached high values only in the case of objects with simple and repetitive shapes [
41].
The height accuracy achieved by the automatic procedure is close to specifications for the production of technical cartography at the scale of 1: 5000. Only three detected buildings had a value of mean deviation greater than 3σ, considering the linear error (LE) with a 95% confidence level as .
As last verification, the completeness or shape accuracy of detected buildings was verified based on the extent of overlap between the extracted buildings and their corresponding buildings in the ground truth data.
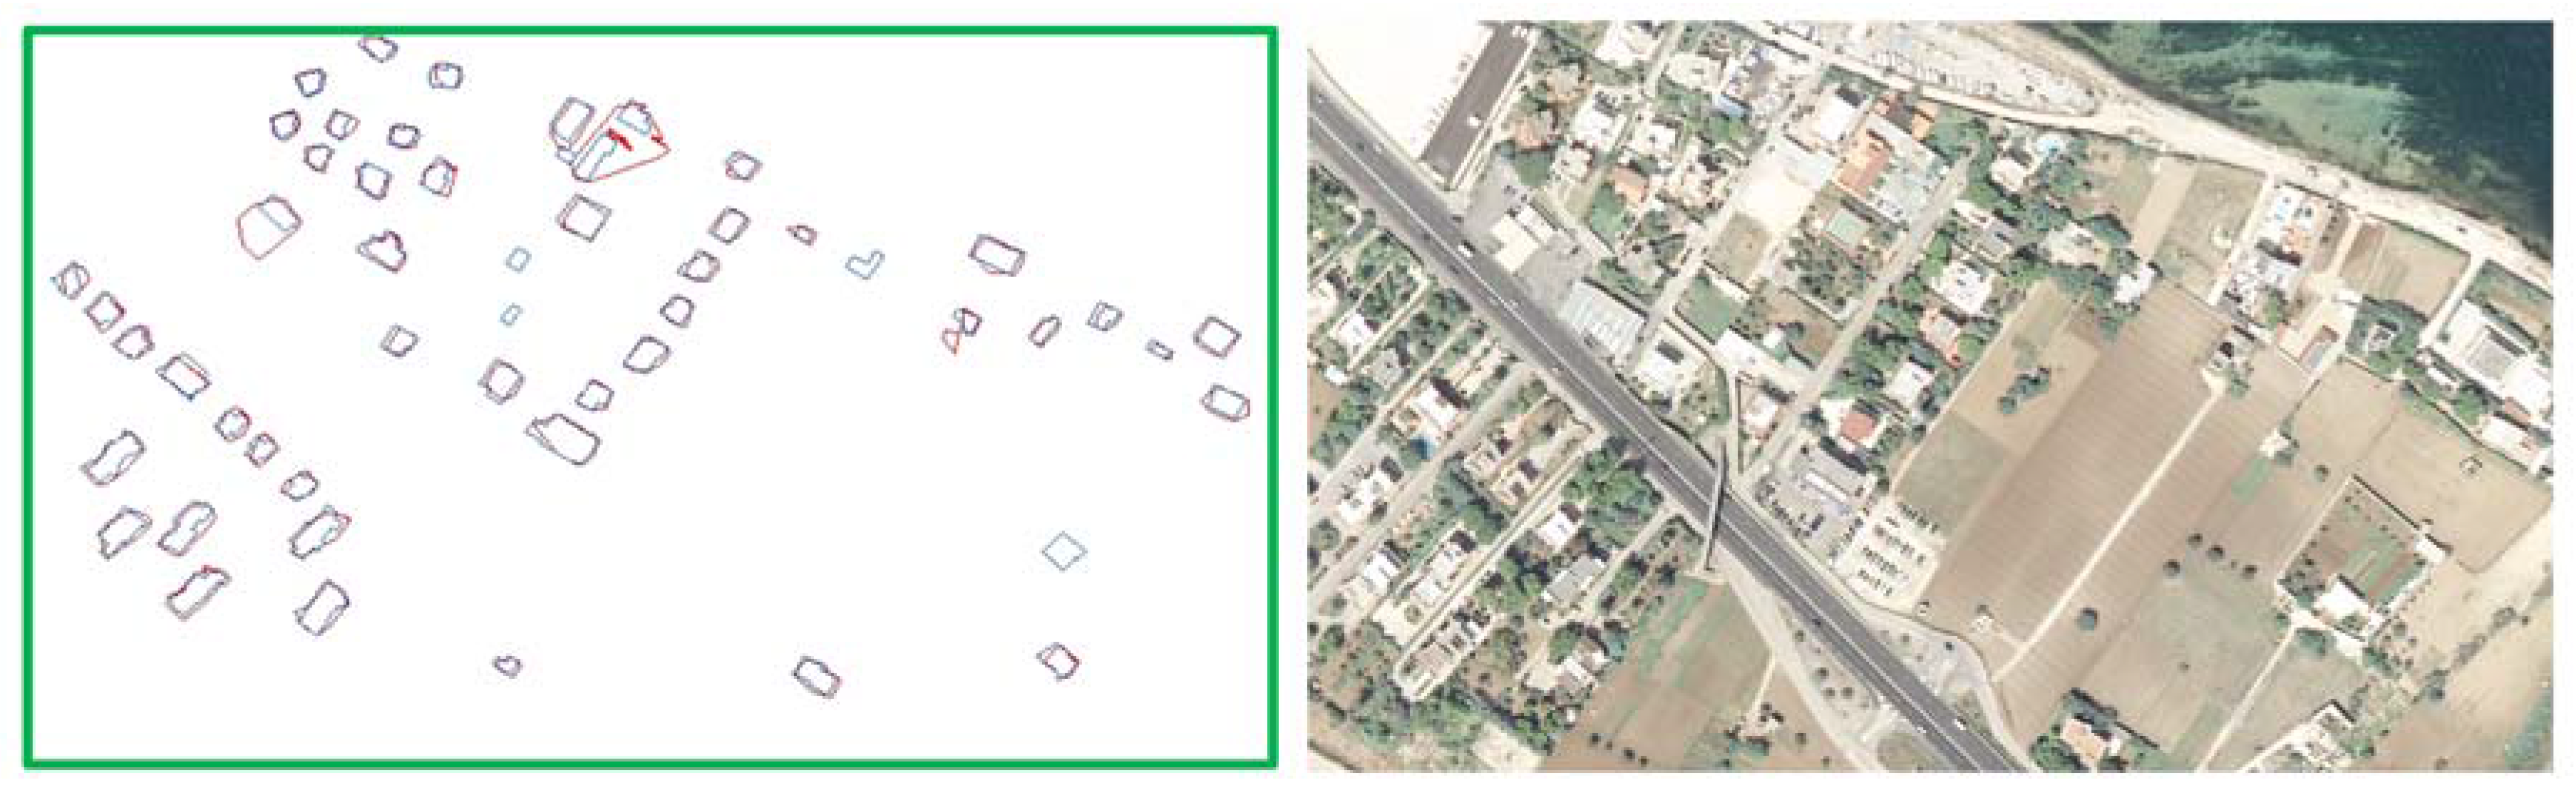
Figure 6 shows the results achieved considering 53 buildings in the test area.
Figure 6.
Results of the quantitative comparison between buildings detected by means of the proposed algorithm (red) and manually edited buildings (blue).
Figure 6.
Results of the quantitative comparison between buildings detected by means of the proposed algorithm (red) and manually edited buildings (blue).
5. Conclusions
Based on the proposed method we were able to automatically reconstruct most of the single standing buildings correctly. This methodology has the advantage of using the spatial and spectral content of digital aerial images without requiring any external auxiliary data, demonstrating its usefulness for rapid maps production and change detection analysis and allowing for an easy comparison with scanned historic aerial photography. The high percentage of the obtained accuracy highlights the validity of this algorithm in building delineation if compared with similar approaches in this application field. Yet some remarks about its effectiveness need to be made. As shown in the final results, the second and third phase generated some matching errors. Such errors were due to the presence of occlusions, vegetation, and similar spectral contents among covers and soil. In contexts with widely diffused regular and spaced buildings the proposed methodology could guarantee better detections.
This work analyzed imagery acquired through two stereo viewings in nadiral directions from an aerial platform, but the same methodology can also be used with an oblique acquisition view or with satellite images by making further adaptations. A theoretical and simulation based study could be used to define single threshold values for the processing of nDSM and intermediate data layers taking into account false alarm and detection rate. Nevertheless, due to the irregular distribution of redundant information (e.g., shadow, vegetation, etc.) along footprint of buildings, such a study is at present still not easy to perform. In this case threshold values were empirically chosen, by evaluating system performance globally. However, evaluating the efficiency of the proposed method in a variety of different situations and scales is our major aim for the future, particularly testing it on other objects (e.g., roads and trees) and diversified urban settlements.


