Article

Effects of Individual Tree Detection Error Sources on Forest Management Planning Calculations

1
Department of Forest Sciences, University of Helsinki, P.O. Box 27 (Latokartanonkaari 7), FI-00014 Helsinki, Finland
2
Finnish Geodetic Institute, FI-02431 Masala, Finland
3
Simosol Oy, Asema-aukio 2, FI-11130 Riihimäki, Finland
4
Metsäteho Ltd., Helsinki, FI-00170, Finland
5
School of Science and Technology, Aalto University, FI-00076 Aalto, Finland
*
Author to whom correspondence should be addressed.
Remote Sens. 2011, 3(8), 1614-1626; https://0-doi-org.brum.beds.ac.uk/10.3390/rs3081614
Submission received: 12 April 2011 / Revised: 20 May 2011 / Accepted: 8 July 2011 / Published: 25 July 2011
(This article belongs to the Special Issue 100 Years ISPRS - Advancing Remote Sensing Science)

Abstract

:
The objective was to investigate the error sources of the airborne laser scanning based individual tree detection (ITD), and its effects on forest management planning calculations. The investigated error sources were detection of trees (etd), error in tree height prediction (eh) and error in tree diameter prediction (ed). The effects of errors were analyzed with Monte Carlo simulations. etd was modeled empirically based on a tree’s relative size. A total of five different tree detection scenarios were tested. Effect of eh was investigated using 5% and 0% and effect of ed using 20%, 15%, 10%, 5%, 0% error levels, respectively. The research material comprised 15 forest stands located in Southern Finland. Measurements of 5,300 trees and their timber assortments were utilized as a starting point for the Monte Carlo simulated ITD inventories. ITD carried out for the same study area provided a starting point (Scenario 1) for etd. In Scenario 1, 60.2% from stem number and 75.9% from total volume (Vtotal) were detected. When the only error source was etd (tree detection varying from 75.9% to 100% of Vtotal), root mean square errors (RMSEs) in stand characteristics ranged between the scenarios from 32.4% to 0.6%, 29.0% to 0.5%, 7.8% to 0.2% and 5.4% to 0.1% in stand basal area (BA), Vtotal, mean height (Hg) and mean diameter (Dg), respectively. Saw wood volume RMSE varied from 25.1% to 0.2%, as pulp wood volume respective varied from 37.8% to 1.0% when errors stemmed only from etd. The effect of ed was most significant for Vtotal and BA and the decrease in RMSE was from 12.0% to 0.6% (BA) and from 10.9% to 0.5% (Vtotal) in the most accurate tree detection scenario when ed varied from 20% to 0%. The effect of increased accuracy in tree height prediction was minor for all the stand characteristics. The results show that the most important error source in ITD is tree detection. At stand level, unbiased predictions for tree height and diameter are enough, given the present tree detection accuracy.

1. Introduction

Interest in highly accurate, mainly remote sensing based forest inventories has arisen following the development of airborne laser scanning (ALS) in the last decade. Forest stand-level statistics are derived from small-footprint ALS using two main approaches, namely the area-based approach (ABA, [1]) and individual tree detection (ITD, [2]). In the ABA, statistical features such as percentiles of the distribution of laser canopy heights are used as predictors in a model-based framework to estimate forest characteristics in a certain sampling area (e.g., raster grid cell or segment). In practice, aerial photographs are often used along with ALS data (e.g., [3]). With the ITD method, individual trees are segmented from the laser point cloud, and tree level attributes are either determined straight from the point cloud or estimated based on various other ALS features that are extracted for the tree segments. This study concentrates on ITD error sources in Nordic boreal forest conditions. The purpose was to shed light on what error source to emphasize in order to achieve more accurate end results at the stand level. This is especially relevant at the moment, as new ALS based forest inventory methodologies are currently being adopted in large-scale operative forest inventories.
The key point in ITD is the detection of trees from laser point clouds. Hyyppä and Inkinen [2] and Brandtberg [4] were among the first to prove that individual trees can be detected from forest stands by high-density laser data. With this method, maxima in the canopy height model (CHM) were used for finding trees, and segmentation for crown edge detection. Hyyppä and Inkinen [2] showed that in this way 40–50% of the trees in coniferous forests could be correctly segmented. Persson et al. [5] improved the crown delineation and were able to link 71% of the tree heights to the reference trees. Linked trees represented 91% of the total volume. Forest structure has a major influence on tree detection accuracy. Tree detection results from more heterogeneous forests are presented in Pitkänen et al. [6] where the detection accuracy was only 40% (70% for dominant trees). Yu et al. [7] presented an accuracy of 69% for tree detection in various forest conditions. These results are on a completely different scale from those in Peuhkurinen et al. [8] where ITD was carried out for two marked stands (density ~465 stems per hectare) and number of harvestable tree was underestimated by only <3%, a result, however, may include some commission errors (segmentation of a single tree into several segments). Tree detection errors were studied with several different ITD algorithms in Kaartinen and Hyyppä [9]. Twelve research groups participated in testing their ITD algorithms with the same dataset. Kaartinen and Hyyppä [9] concluded that the most important factor in tree detection is the algorithm used, while the effect of pulse density (2–8 returns/m2 were tested) was observed to be marginal.
In forest inventories in Scandinavia, species-specific information is needed for forest management planning growth projections and simulated bucking. Tree species composition also has a major effect on forest value, although the number of tree species in boreal forests is rather low. Holmgren and Persson [10] classified Scots pines and Norway spruces by their structural differences with >90% accuracy. However, an operational method for tree species classification is still missing. In recent years, promising tree species classification results have been reported when high point density data has been used combined with aerial images or ALS intensity. Liang et al. [11] classified with an accuracy of 89.8% deciduous-coniferous trees in leaf-off conditions taking advantage of differences in first-last pulse data. Holmgren et al. [12] combined high-density laser data with multi-spectral images. Canopy related metrics such as height distribution and canopy shape were calculated along with spectral features. A classification accuracy of 96% was achieved with 1,711 trees. Vauhkonen et al. [13] used solely high-intensity ALS data (~40 returns/m2) and introduced so-called “alpha shape” metrics describing canopy structure for the identification of tree species. Overall classification accuracy was 95%. When a method similar to that was tested with a larger data set (1,249 vs. 92 trees) and more practical point density (6–8 returns/m2), an identification accuracy of 78% was achieved for three tree species [14]. From a practical point of view, the most promising results for Nordic forest conditions have been achieved by Korpela et al. [15] where 88–90% classification accuracy was achieved for Scots pine, Norway spruce, and birch using ALS intensity statistics. Puttonen et al. [16] used illuminated-shaded area separation from aerial photographs combined with ALS data in tree species classification, and achieved an overall accuracy of 70.8% with three species. Thus taking the latest results into consideration, a solution for practical tree species determination can be said to be within reach, at least in the Nordic countries where amount of commercially important tree species is rather low.
At the individual tree level, the most important variable is diameter at breast height (dbh), from which stem form, volume and timber assortments are estimated. Traditionally in ITD only tree height and different crown diameters are determined and therefore used in predicting dbh (e.g., [17]). In a simulation study performed by Maltamo et al. [18], it was shown that although all other ITD error sources would be error-free, the prediction of dbh causes major uncertainty (root mean square error, RMSE 22.9%–25.3%) in plot-level mean volume. In many studies (e.g., [8,19,20]) more accurate results have been achieved for mean volume with all the error sources included, the problem of the poor allometric relationship between dbh and height is still often discussed. The denser laser data have provided the opportunity to calculate several laser height metrics for individual trees that can be used in prediction of tree attributes. These features are used also in tree species classification, as mentioned above. Maltamo et al. [21] predicted tree attributes and quality characteristics of Scots pines using k-most similar neighbor (k-MSN) estimation combined with plot- and tree-level height metrics calculated from ALS data. The RMSEs for dbh, height and volume were 5.2%, 2.0% and 11%, respectively, when 133 accurately matched trees were used in the validation. The respective accuracies were 13%, 3% and 31% in Vauhkonen et al. [14] and 21%, 10% and 46% in Yu et al. [7]. Vauhkonen et al. [14] used 1,249 and Yu et al. [7] 1476 trees for validation. Particularly in Yu et al. [7], mismatching of reference and laser tree candidates may affect the results. Further, tree height determination from CHM is highly accurate, but includes underestimation. Underestimation was already demonstrated in the 1980s [22]. If the ground elevation and the uppermost proportion of a crown are not detected, then the tree height is automatically underestimated. Laser tree height is often calibrated against field trees to reduce bias which is caused by several scanning parameters and data processing steps such as the filtering used in producing CHM (see e.g., [23]). Still, as can be seen from the above-mentioned studies, tree height is the most accurately determined variable.
In some cases, the ITD method has led to more accurate stand-level inventory results than ABA, especially if theoretical distributions are used to take into account trees obscured in the ALS data (e.g., [24]). However, several studies (e.g., [20,25]) have shown that ITD produces significantly biased inventory results for plots basal area and mean volume. With respect to individual stand characteristics, e.g., mean volume, this bias can be calibrated by accurate field measurements. The main advantages of ITD over ABA are lesser need for ground reference data and that at least a major part of the stem distribution can be derived directly from the interpretation results. Generally, stand dbh or height distributions are invaluable in forest planning related simulation and optimization, logging operation planning and wood supply logistics. The most substantial advantage of the ABA is, in turn, its ability to utilize inexpensive low-density ALS data. ABA inventory results are also easier to integrate into operative forest-planning computations. Currently, aerial photography is being utilized for both methods. Future ALS intensity information may at least partially cancel the need for aerial photography.
The objective of the study was to investigate the error sources of the ALS ITD method, and their effects on forest management planning calculations. The investigated error sources were detection of trees (etd), error in tree height prediction (eh), and error in tree dbh prediction (ed).

2. Material and Methods

2.1. Study Site

The research material comprised 15 forest stands located in an approximately 2,000 ha managed forested area in the vicinity of Evo, Finland (61.19°N, 25.11°E). The forest stands utilized in the study were clear-cut in winter 2008. The site quality varied from grovelike heaths to barren heaths. The dominant tree species in the stands were Norway spruce (Picea Abies [L.] Karst.) representing 73.5% of the total volume. The respective proportion of Scots pine (Pinus Sylvestris L.) and birch (Betula spp.) were 14.3% and 12.1%. The delineation of the examined stands was checked using Global Positioning System (GPS) measurements. Average stand size was 1.0 ha, ranging from 0.2 ha to 1.9 ha with a standard deviation of 0.6 ha.

2.2. Logging Machine Measurements

Tree-wise measurements from the stands were collected with a logging machine and utilized as reference data. The logging machines gathered so-called STM data according to the Standard for Forest Data and Communication [26]. An STM file includes data for each felled tree producing commercial timber (dbh limit ~10 cm) regarding the logging machine’s position at the time of felling, stem diameters at 10 cm intervals from the felling height to the final bucking height, tree species, bucking parameters and bucked assortment volumes. The stands were logged using either Ponsse (Ponsse Oyj, Vieremä, Finland) or John Deere (Deere and Company, Moline, IL, USA) logging machines. The logging machine information obtained covered altogether 5,300 trees. An STM file was saved for each felled tree producing commercial timber. Stem distribution series and assortment outturn volumes were derived from STM data. Stand characteristics (basal area, mean diameter, mean height and total volume) for each clear-cutting stand were calculated using stem diameter and length information in the STM files. The dbh was determined as each stem’s 12th measured diameter (10-cm stump + 120 cm = 130 cm). Total tree height was estimated based on the commercial timber height shown in the STM file [27]. Basic information regarding the stands characteristics calculated from the STM data is presented in Table 1.
Table 1. Statistics for stem number, basal area (BA), total volume (Vtotal), mean diameter (Dg) and mean height (Hg) of the stands (n = 15) according to the logging machine data.
Stand characteristicMeanMinimumMaximumStandard deviation
Stem number33246692244
BA, m215.54.637.511.4
Vtotal, m313741316.594.4
Dg, cm31.42643.84.8
Hg, m18.310.323.63.4

2.3. Simulation of Various Error Sources in ITD

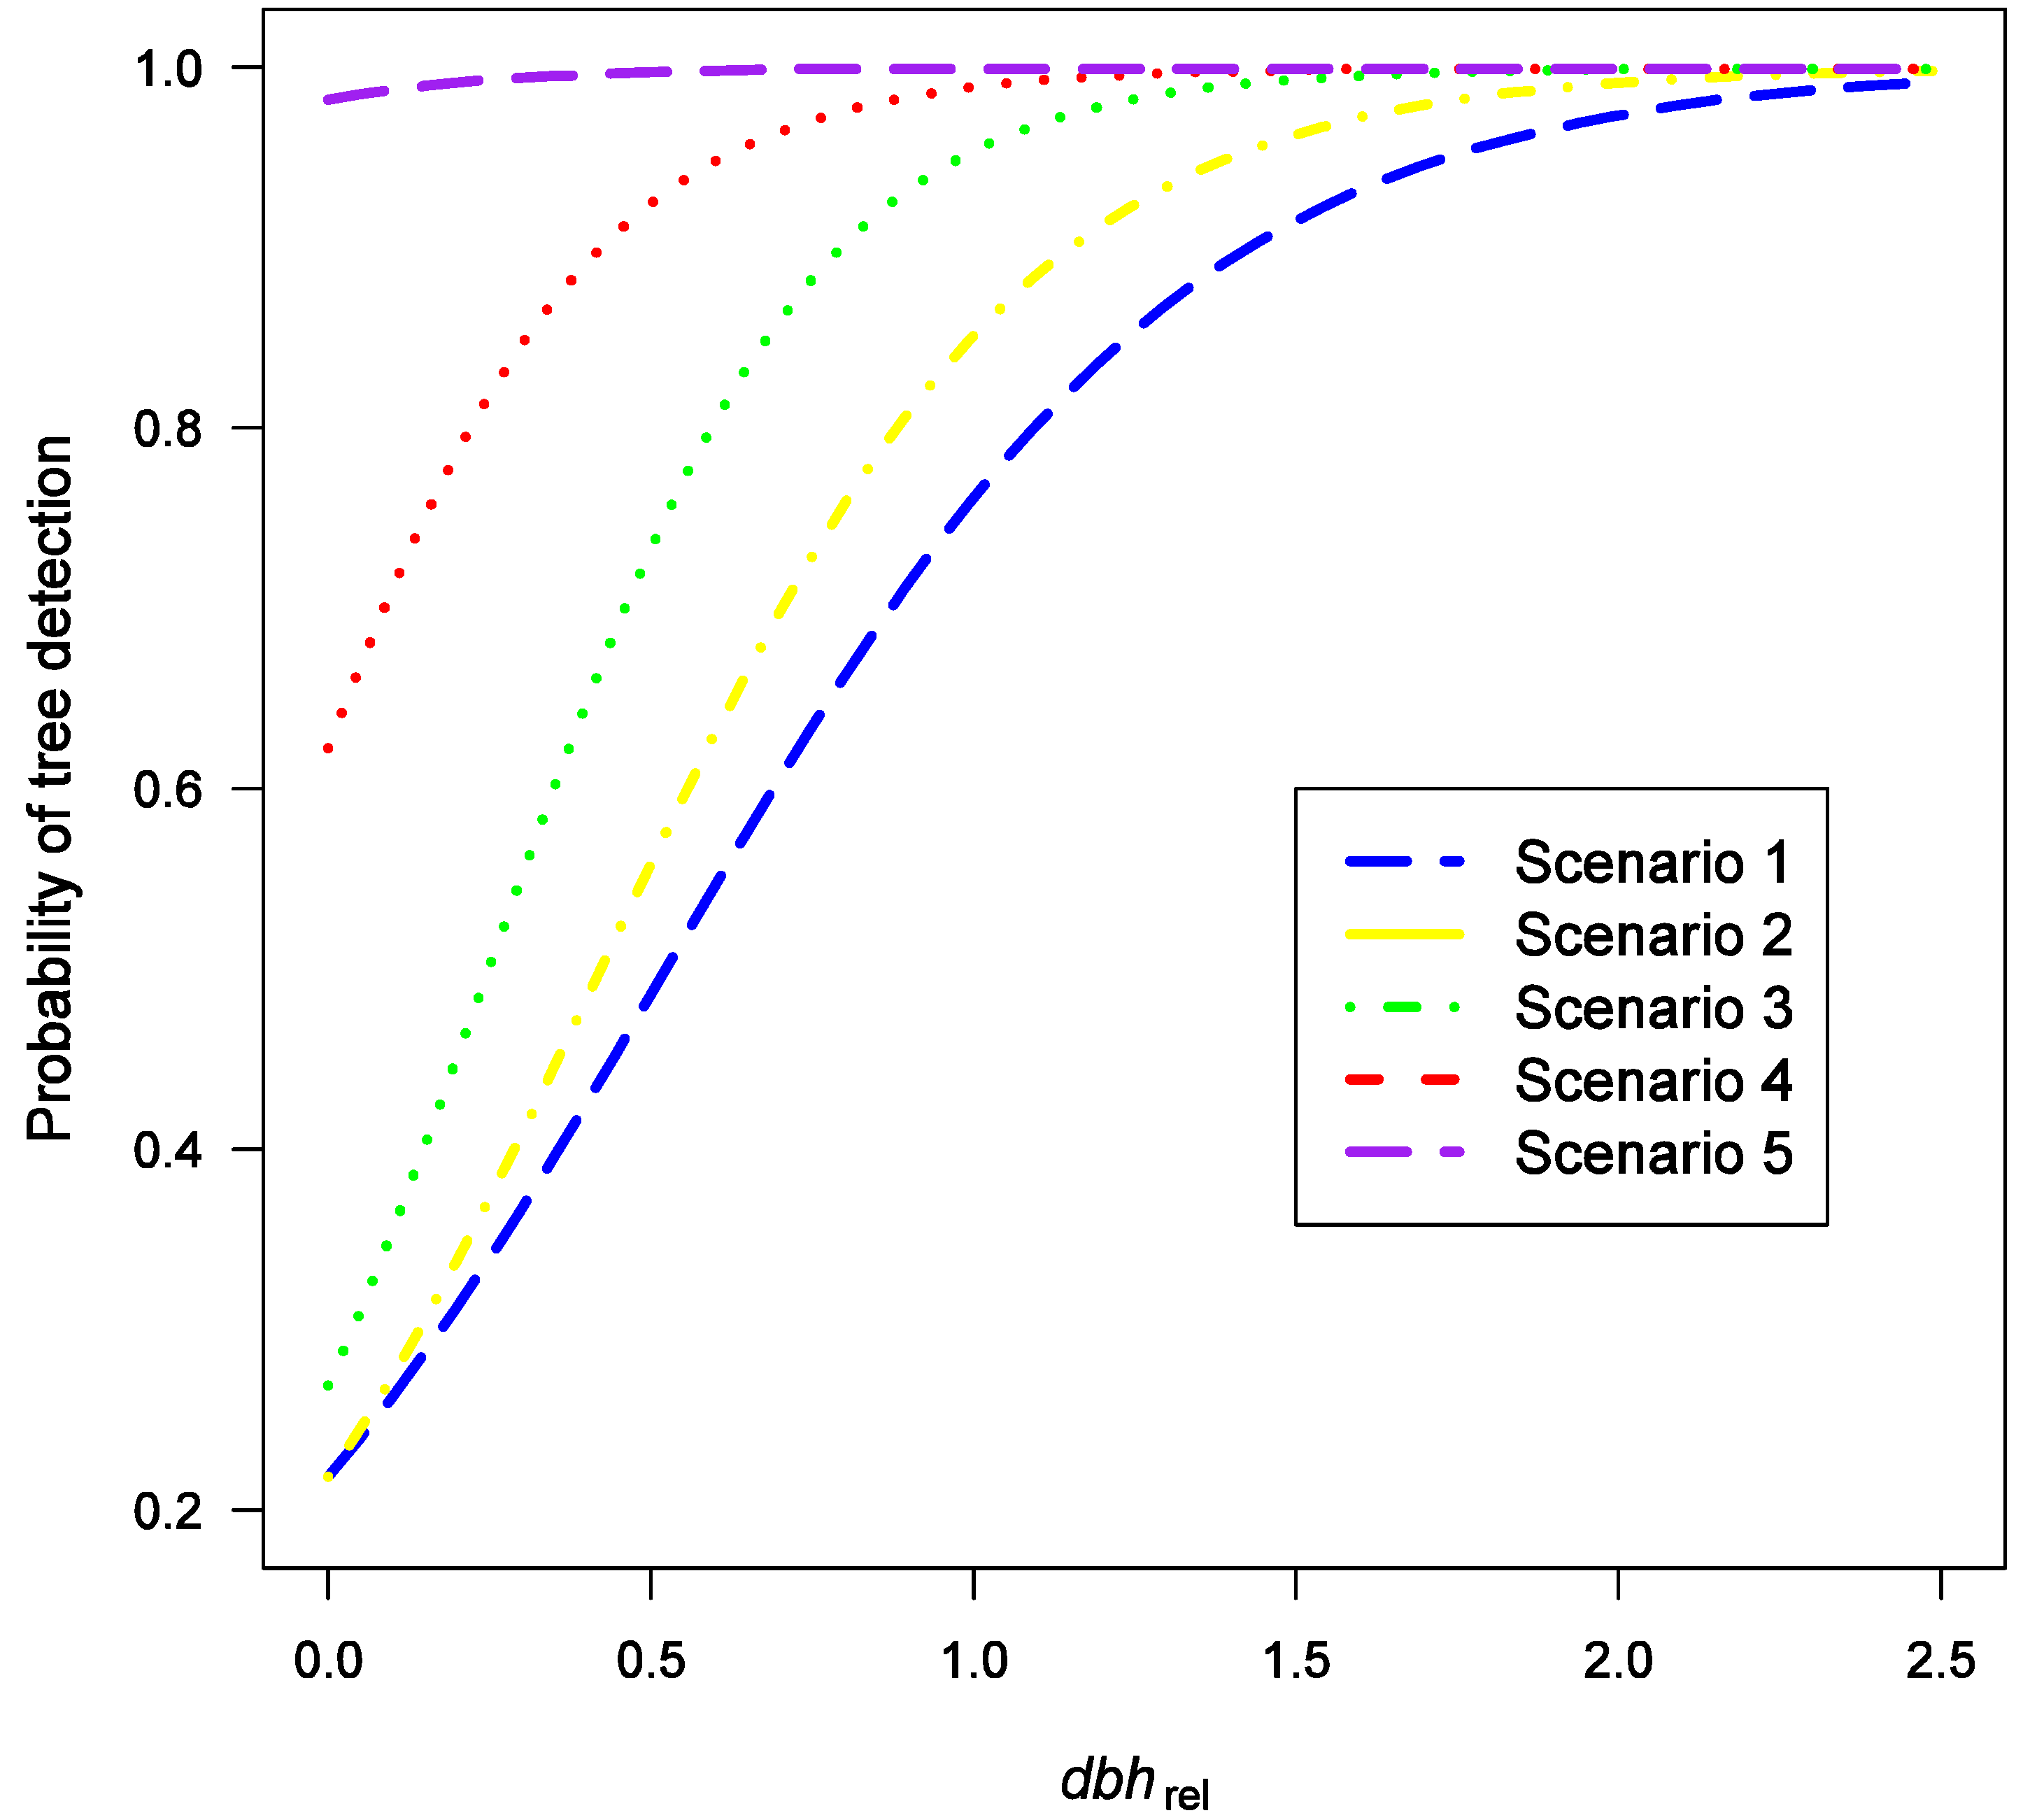
2.3.1. Tree Detection Error

The probability of a tree being detected from ALS data is dependent on the tree’s relative size and stand characteristics (e.g., [28,29]). Dominant trees have a higher probability of being detected than the suppressed trees in the understory. As a starting point, empirical data used in Yu et al. [7] was used to formulate tree detection scenarios causing etd. Yu et al. [7] performed ITD and matched 1,476 laser tree candidates with tree-wise field measurements. The ALS data used in that study was acquired with an Optech ALTM3100C-EA system; the flying altitude was 800 m at a speed of 75 m/s, a half-angle of 16 degrees, a pulse rate of 100 kHz and a footprint diameter of 0.7 m. The average pulse density was 2.6 returns per m2. The accuracies (RMSE) estimated in Yu et al. [7] for tree height, dbh and volume were 10.0%, 21.4% and 45.8%, respectively.
The probability of tree detection was predicted using logistic regression (LR). A tree’s relative size, dbh/Dg (dbhrel), was used as the explanatory variable. A set of five tree detection scenarios was formulated by manipulating LR coefficients of the prediction model that were fitted to empirical tree detection data (Figure 1). These five tree detection scenarios were used to describe the effect of etd in ITD-based forest inventory. In Figure 1, all the tree detection probabilities depending on dbhrel of the scenarios are presented. Scenario 1 describes the state of the ITD accuracy in Evo area in practice. In Scenario 2 tree detection enhances for all the dbh classes, as also in Scenario 3. In Scenario 4 tree detection enhances overall and particularly in small dbh classes. Finally, in Scenario 5 almost all the trees are detected.
Figure 1. The probability of tree detection with five different tree detection scenarios depending on tree’s relative size (dbhrel).
Remotesensing 03 01614 g001

2.3.2. Tree Height and Diameter Prediction Errors

The most accurate tree-level variable in ITD is tree height (e.g., [7,21]). For that reason, only two levels (0% and 5%) of eh were used. An error level of 5% is comparable to the level of tree height prediction accuracy achieved with present ITD methods (e.g., [21]). Dbh must be predicted when ITD is employed. In many cases, allometric models are used; these usually utilize tree height-dbh relation and additionally crown size (e.g., [8,17]). Nearest-neighbor estimation methods have recently become more common in prediction of dbh (e.g., [7,14,21]). Dbh prediction accuracy of at least approximately 20% (RMSE) in ITD has been achieved (e.g., [7,14,21]). In this study, ed level of 20% was chosen as a starting point and error levels of 20%, 15%, 10%, 5% and 0% were used.

2.3.3. Monte Carlo Simulations

The effects of the errors in the ITD were analyzed with Monte Carlo (MC) simulations (e.g., [30,31,32,33,34]). With the MC method the calculation procedure is run dozens or hundreds of times, the results of which are used to determine the final predicted value error statistics. We simulated the ITD inventory 100 times with 50 error combinations for each stand measured with logging machine. The total number of simulated ITD inventories for each stand was 100 × 5 (etd scenarios) × 2 (eh levels) × 5 (ed levels), and for the 15 stands in the dataset the total number of iterations was 60,000.
The random error ε of each error component was presumed to be normally distributed ε ~ N(μ, σ2) and the errors were assumed to be independent for the sake of simplicity. Dbh and tree height estimates were assumed to be unbiased based on previous studies [7,14,21]. At the beginning of each iteration we generated an initial error for the error component in question, or a combination of error components. These errors were generated by adding a Gaussian error term with mean μ and standard deviation σ to the particular error component. The errors caused by non-detected trees in ITD scenarios were simulated by leaving part of the trees in the input data out of the simulation. For each tree, a random number with uniform distribution between 0 and 1 was generated and compared with the detection probability in the scenario in question and the dbhrel of the tree. If the random number value was smaller than the probability of tree detection with the given dbhrel, the tree was removed from the input data (probability of tree detection varied between the scenarios, see Figure 1).
After each MC run tree detection accuracy, basal area (BA), total volume (Vtotal), mean height (Hg), mean diameter (Dg) and timber assortment outturns were calculated and compared to field reference. These differences were interpreted as inventory errors and were analyzed statistically by calculating means (tree detection) and RMSEs (stand characteristics) at the stand level. For the above-mentioned stats, stand level (n = 15) means are presented in the results.

3. Results

The effects of etd, eh and ed were studied to clarify the importance of error components in the present state of ITD. A set of five tree detection scenarios, two error levels in height and five error levels in tree dbh prediction were tested. The effects were examined by calculating the stand characteristics used in practical forest management and volumes for saw (Vlog) and pulp (Vpulp) wood.

3.1. Effect of Tree Detection

The effects of etd were analyzed with a set of five different tree detection scenarios (Table 2). Scenario 1 was empirically developed and represents the state of the present ITD. In Scenario 1, 60.2% from the stem number and 75.9% from Vtotal were detected; in Scenario 5 the respective percentages were 99.8% and 100.0%. When the only error source was tree detection the RMSEs in stand characteristics ranged between the scenarios from 32.4% to 0.6%, 29.0% to 0.5%, 7.8% to 0.2% and 5.4% to 0.1% in BA, Vtotal, Hg and Dg, respectively.
Table 2. Effect of tree detection.
Detection accuracy, %RMSE, %
ScenarioStem numberVtotalBAVtotalHgDgVlogVpulp
160.275.932.429.07.85.425.137.8
265.177.429.427.06.14.524.433.3
384.994.512.010.03.92.57.514.2
495.298.64.94.11.71.13.16.1
599.81000.60.50.20.10.21.0

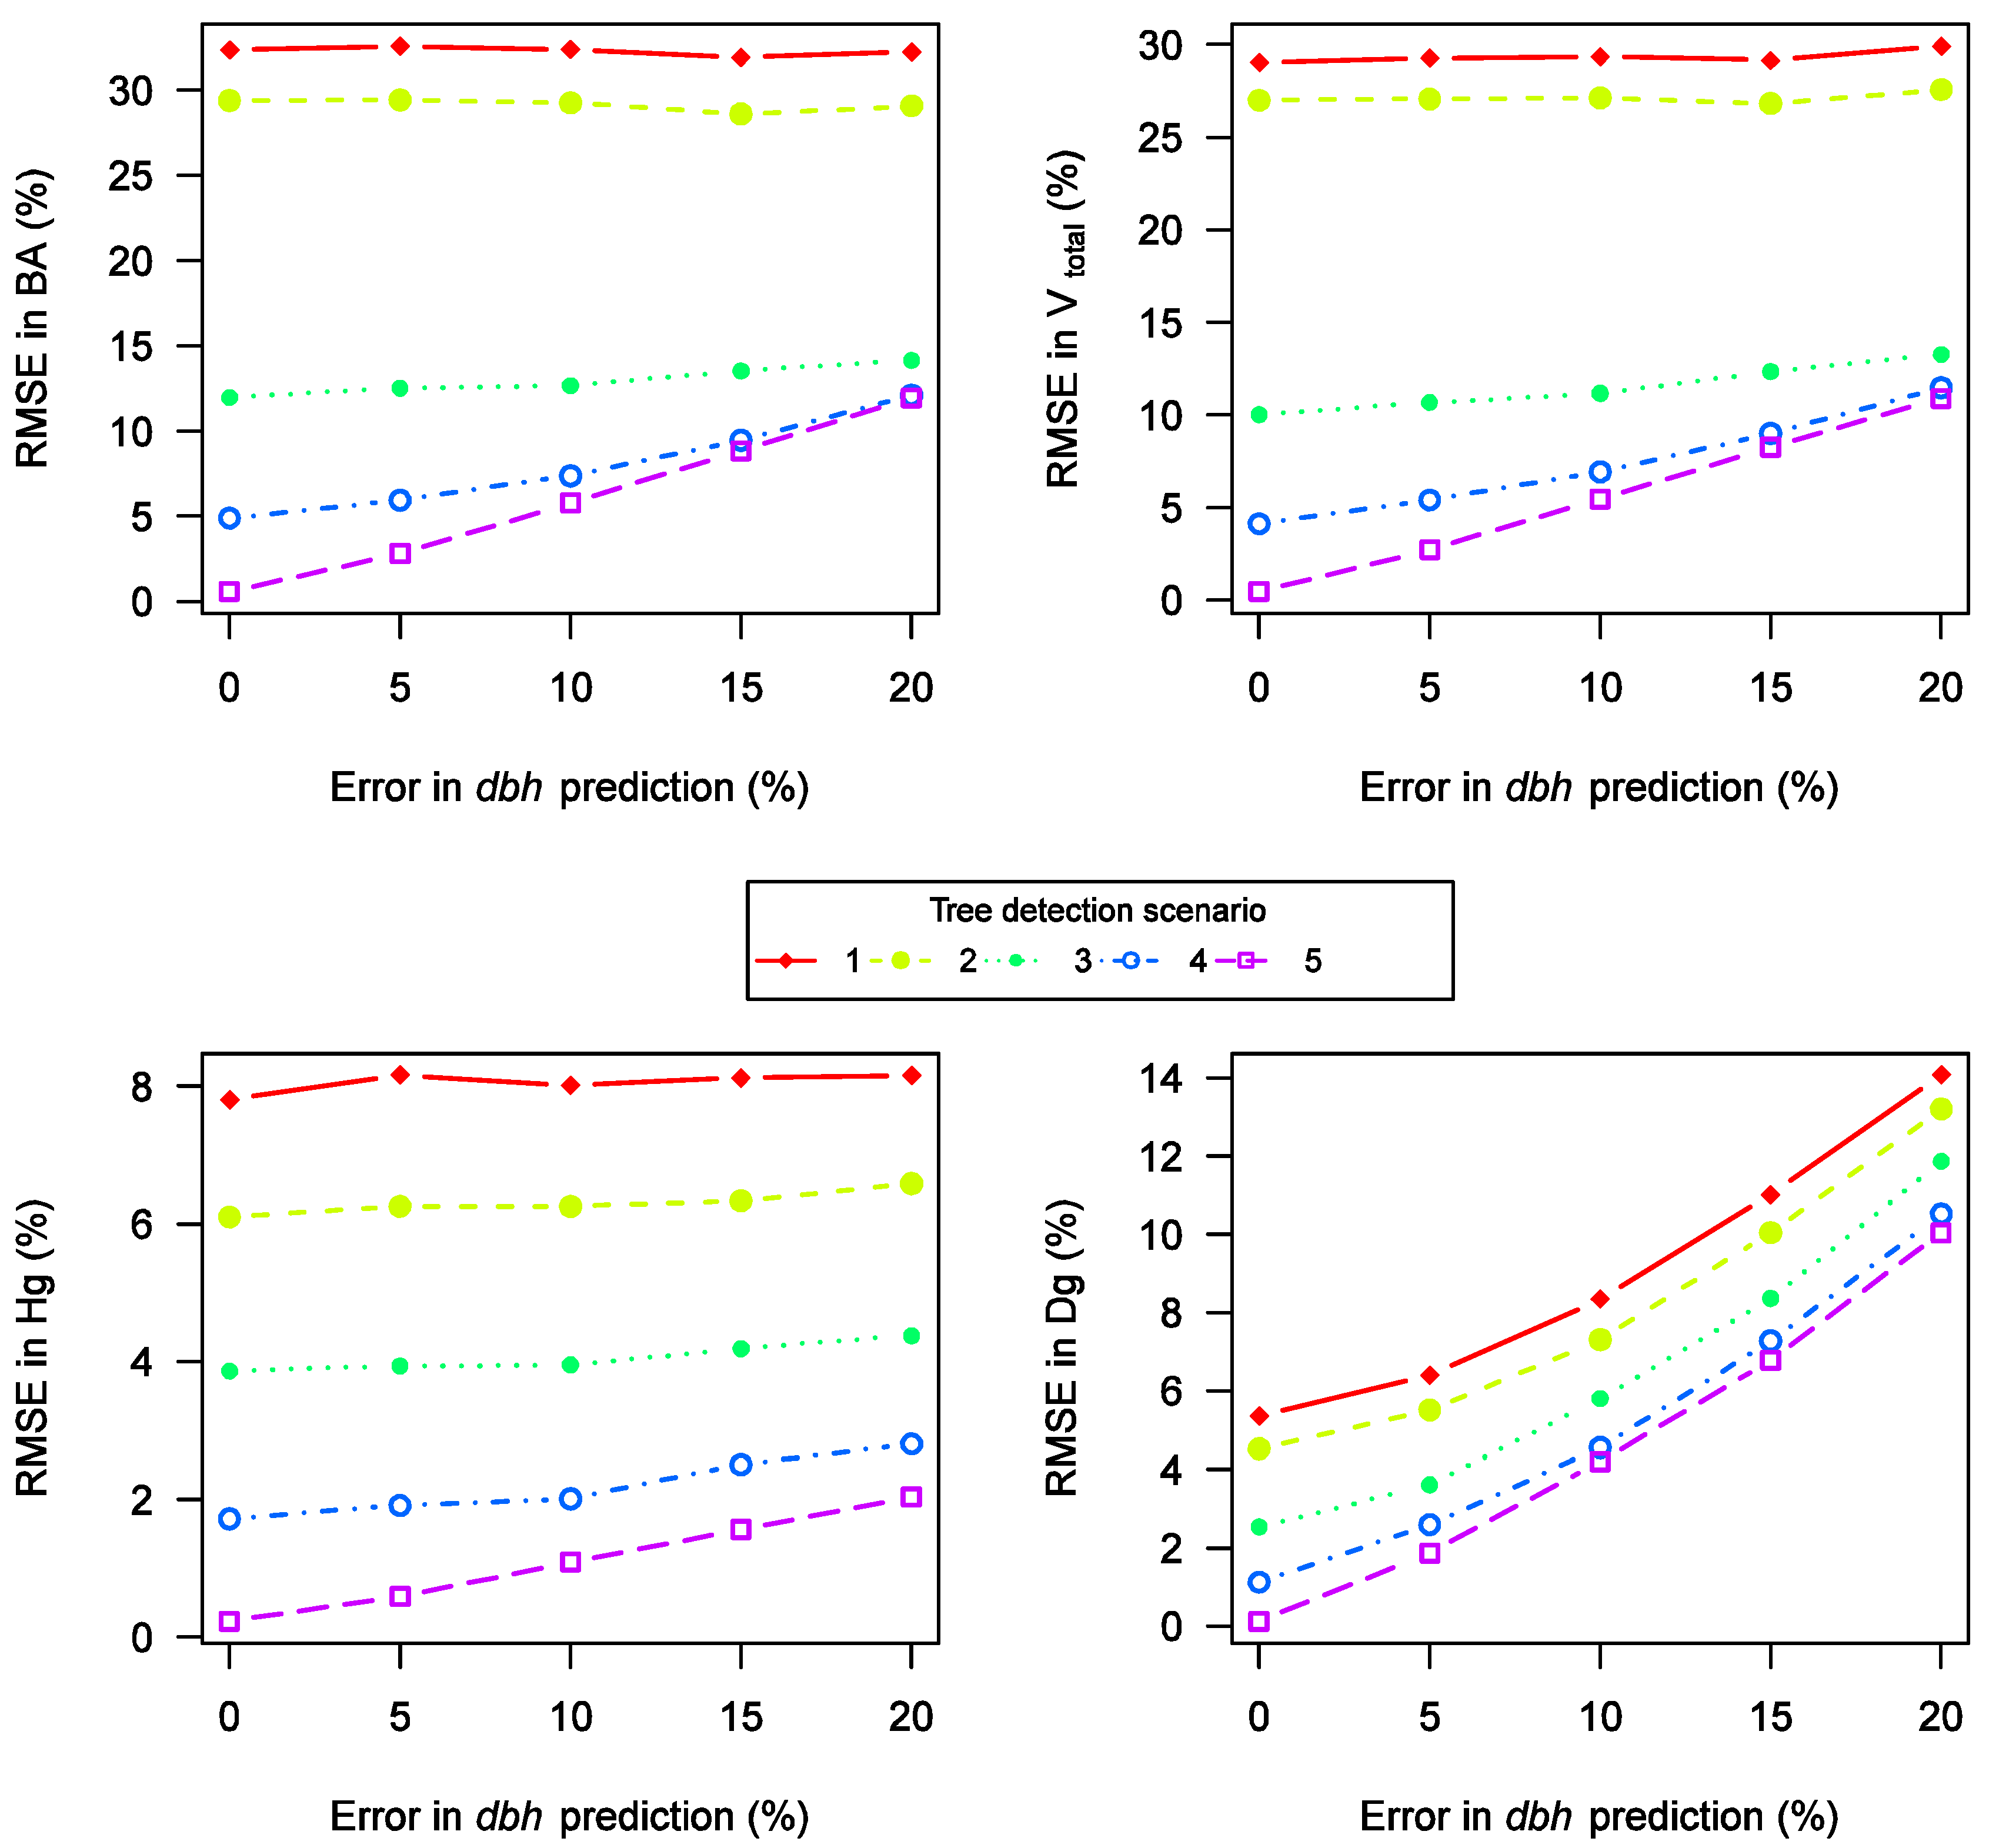
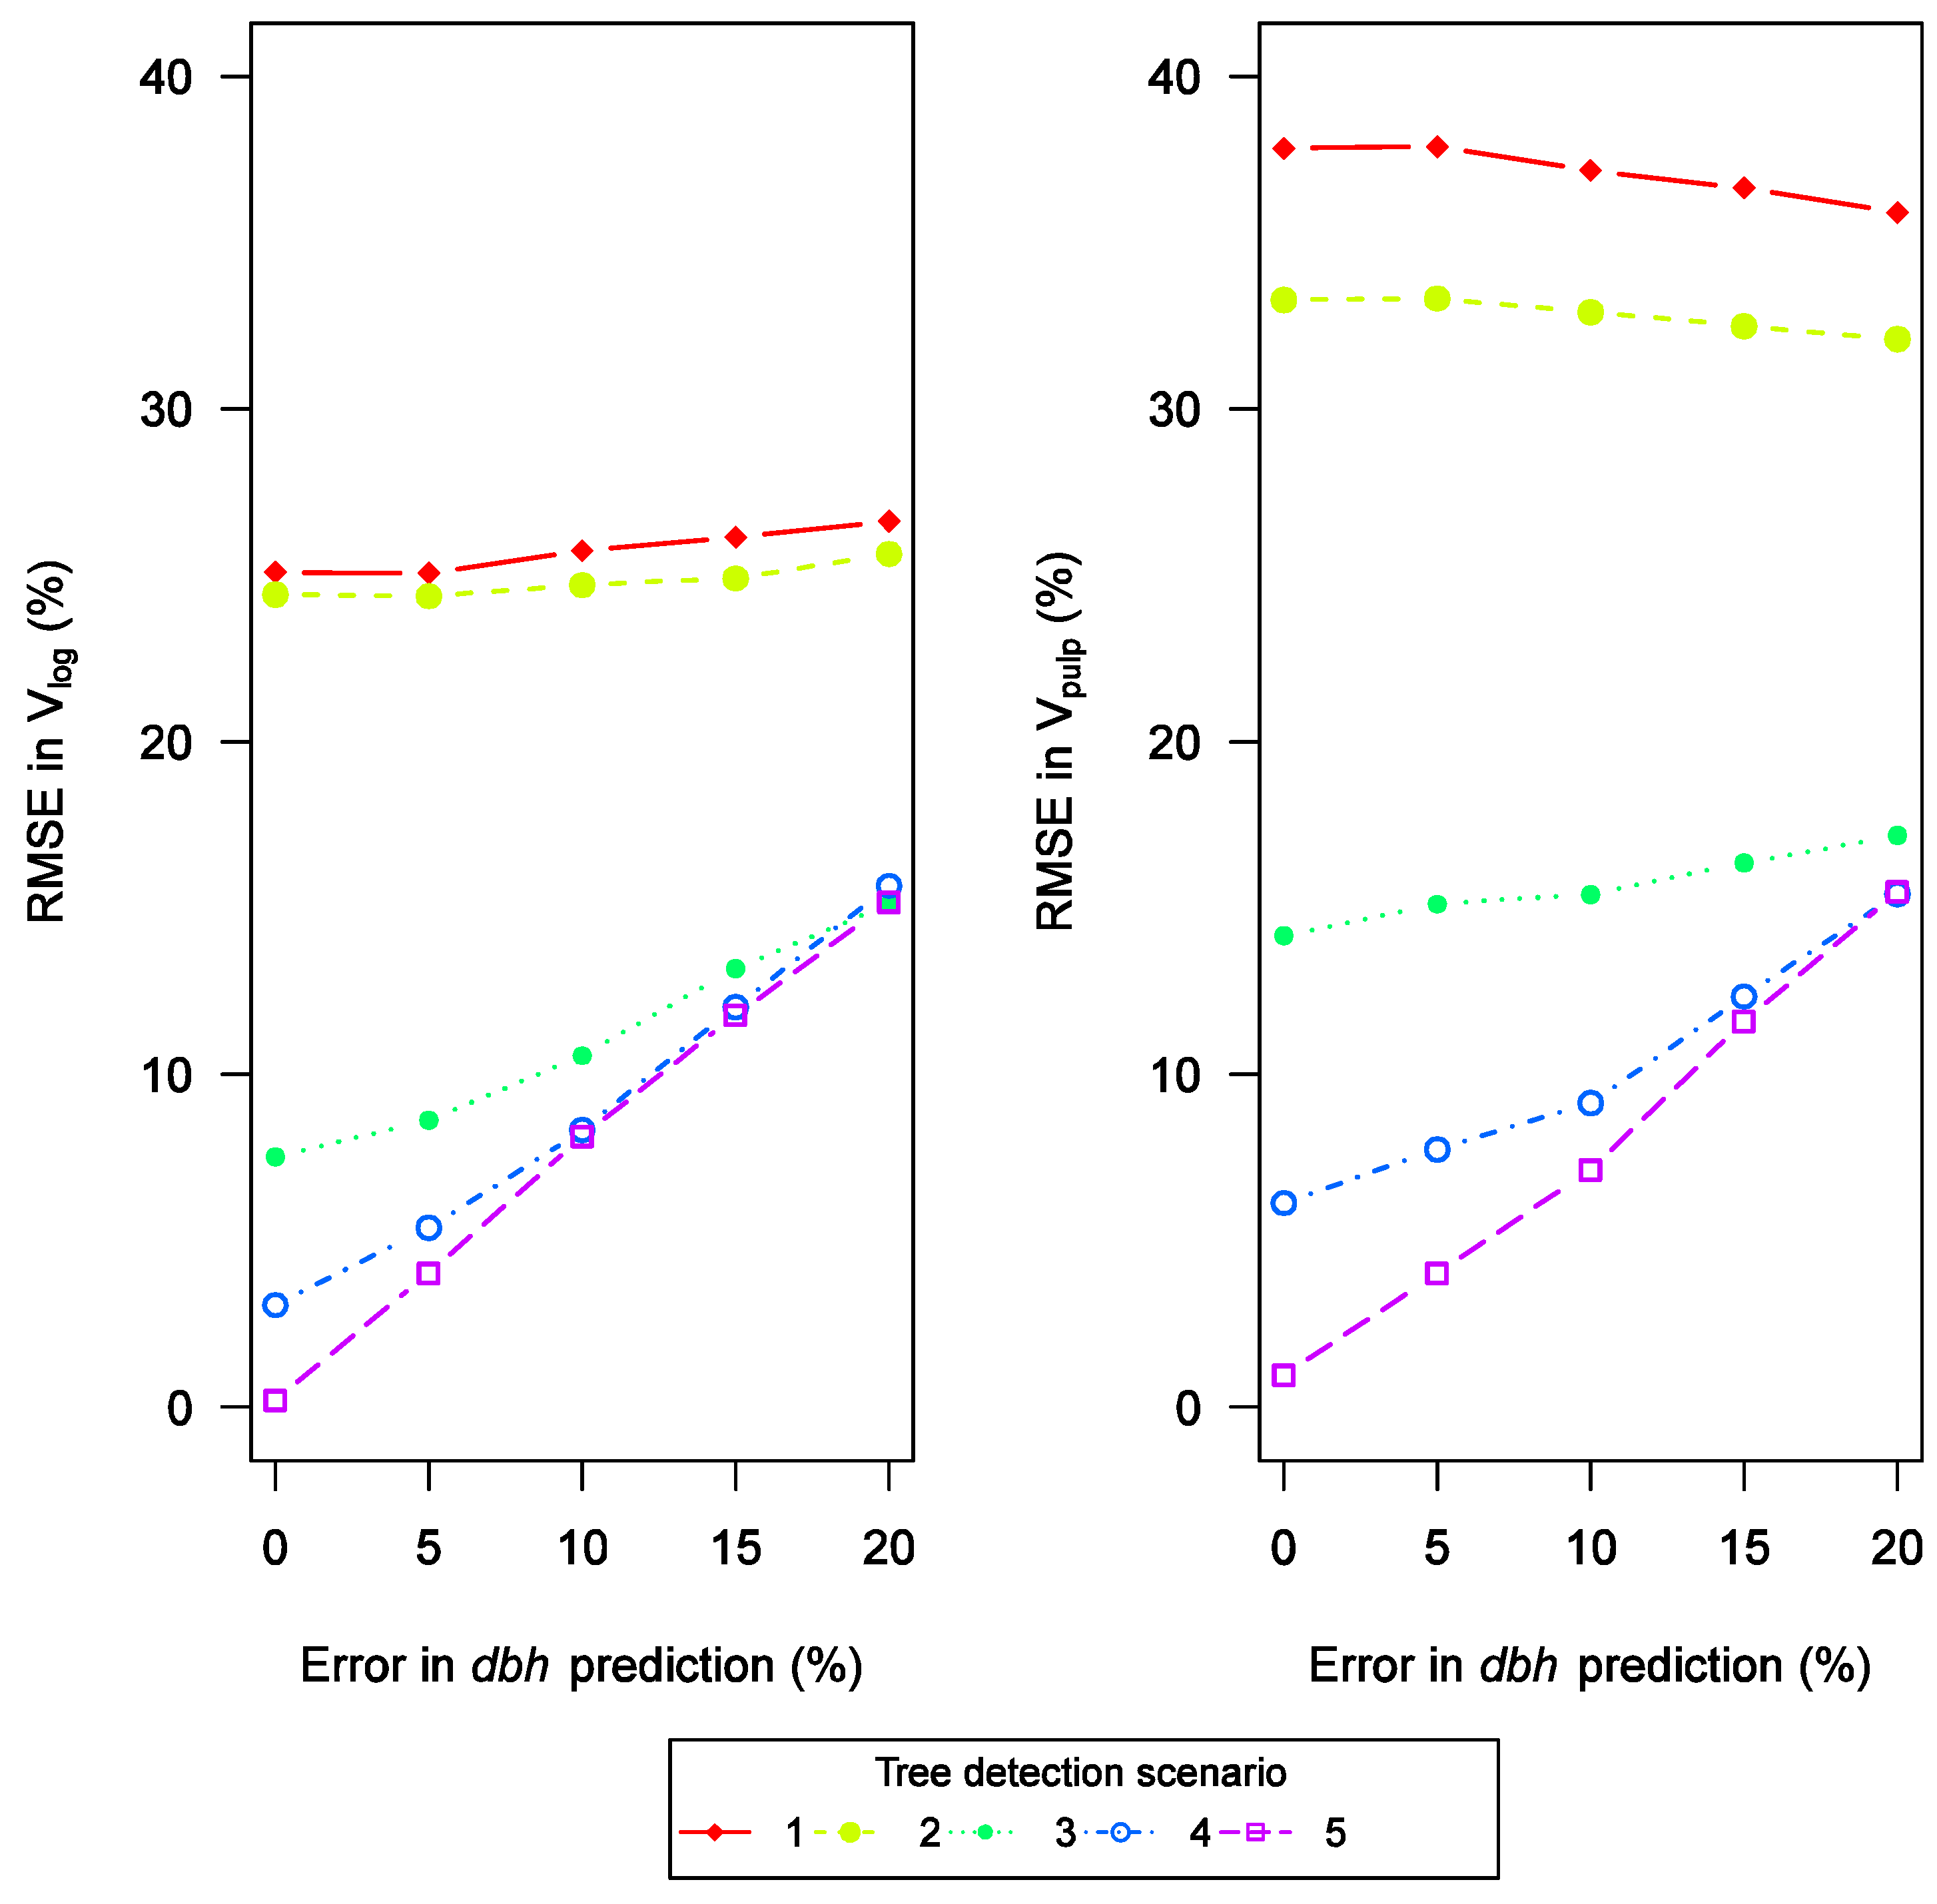
3.2. Effects of Diameter Prediction and Combined Effects of Diameter Prediction and Tree Detection

The effect of ed was most significant for Vtotal and BA (Figure 2). The decrease in RMSE was from 12.0% to 0.6% in BA and from 10.9% to 0.5% in Vtotal in Scenario 5. In Scenarios 1 and 2 there were no notable effects (variation within 1%). In Scenario 3, RMSE in Vtotal decreased 2.2% and RMSE in BA 3.3% as in Scenario 4; the respective percentages were 7.2% and 7.3%. For Hg calculation the ed had only minor effects in all the scenarios. The effect on Dg calculation was similar in all the scenarios, and the RMSE accuracy decreased approximately 8% when the ed decreased from 20% to 0%.
Figure 2. Combined effects of dbh prediction and tree detection on stand characteristics.
Remotesensing 03 01614 g002
Tree dbh prediction mostly affected Vlog predictions in tree detection Scenarios 3, 4 or 5 (Figure 3). In tree detection Scenarios 3, 4 and 5 the predicted Vlog RMSE percentage decreased from approximately 15% to 7.5%, 3.1% and 0.1%, respectively. In Scenarios 1 and 2, the RMSE varied from 24.4% to 26.6% with no notable effect from ed.
When predicting Vpulp outturns there were a slight increase in RMSE when the ed decreased in tree detection Scenarios 1 and 2. This stems from bias in tree detection. In Scenario 3, RMSE decreased from 17.2% to 14.2% when the ed decreased from 20% to 0%. The most effective decrease was detected in tree detection Scenarios 4 and 5, where the effect of ed decreased Vpulp RMSE from 15.4% to 6.2% and from 15.5% to 1.0%, respectively.
Figure 3. Combined effects of dbh prediction and tree detection on the stand log wood (left) and pulp wood (right) outturns.
Remotesensing 03 01614 g003

3.3. Effect of Tree Height Measurements

The effect of eh was analyzed using error levels of 5% and 0%. Only two intervals were used because the height prediction is already the most accurate in ITD and an accuracy of 5% (RMSE) is achieved. The increased accuracy when eh level was lowered from 5% to 0% was minor for all stand characteristics. Accuracy was improved by 0.4%, 1.2%, 0.8% and 0.1% in BA, Vtotal, Hg and Dg, respectively. The combined effects were also similar, as presented in Figure 2 and Figure 3.

4. Discussion and Conclusions

We investigated the effects of three error sources (etd, eh and ed) when using ALS ITD inventory in forest management planning calculations. The results show that the most important error source is tree detection. For example, if 65% of trees are detected, the error in Vtotal is ~27%. Tree diameter prediction error is relevant in the estimation of BA and Vtotal after at least 85% of the trees are detected and when a Vtotal RMSE level of 15% is achieved. Then the effect varies from 5% to 10% in BA and Vtotal calculations. The errors do not affect with the same intensity to the stand’s mean characteristics. For Dg estimation, the effect of diameter prediction error ranging from 20% to 0% is ~8% in all tree detection scenarios. The prediction of tree height without errors gave only slight enhancement compared to the accuracy achieved with an error level of 5%, which has already been achieved in many studies (e.g., [14,21]). The accuracy of Hg mainly depended on tree detection accuracy, with RMSE ranging from 8% to 0%.
This study was based on simulations, and all the error sources were controlled. However, the starting points of the error levels were empirically determined. Mäkinen et al. [35] studied the effects of inventory error distributions and the distribution shape, whether Gaussian or something else, did not affect the results significantly. Here we also assumed the error distributions to be Gaussian. It should be noted that tree species were assumed to be known. The effect of tree species identification on the stand characteristics without species-specific information would be rather minimal, at least if its accuracy would be simulated with accuracy similar to Korpela et al. [15]. If more accurate stand characteristics are desired with ITD as optimally as possible, the effects of various error components should be known.
Allometric models describing the relationships between tree crown size, height and dbh are highly sensitive to errors in their input data. The automatic measurement results of tree crown size in particular tend to be error-prone. Thus estimation of dbh on the basis of tree height and crown size result’s in a rather notable degree of uncertainty. Nearest-neighbor methods applicable to single-tree interpretation are, therefore, currently under development (e.g., [7,14,21]). In light of the results of these effects, it can be noted that if other error sources such as tree detection and tree height prediction (as well as tree species classification) remain at the same level, errors in dbh prediction have only a minor effect on stand characteristics RMSEs. Still, if accurate tree level or stock information is needed, accurate prediction of dbh is required, and this is the issue of why it would be worthwhile to apply ITD instead of the ABA. This issue has culminated in the stem distribution formation method applied in forest-planning computations. Single-tree-level information leads to more accurate results in tasks where stem distributions based on single-tree measurements are required, e.g., in the estimation of timber assortments.
In many studies (e.g., [8,19,20]), the ABA produces results matching the accuracy of ITD. In stand characteristics inventory the advantage of using ITD is the reduced amount of field work. This study showed that the prediction of tree level characteristics can include errors (deviation) up to 20% with the resulting stand-level characteristics still being relatively accurate. The amount of bias is more important. The only source of bias in this study was from the tree detection scenarios. In the case of ITD, this is the most problematic error source.
To increase wood value and productivity in industry, information on wood raw material quantity and quality, combined with logistic concepts that integrate transport systems and management models throughout the wood raw material supply chain, is needed. ITD could pave the way for ‘precision forestry’, in which forest resource monitoring would be carried out at the single-tree level. Many possible additional benefits such as operational planning for optimal timing of operations, better scheduling and logistics, accurate information on stem dimensions, as well as quality and optimal cutting of stems could be achieved if ITD would work accurately and reliably. The present state of ITD cannot meet these requirements (see results of tree detection in Scenario 1, ed 20% and eh 5%). Most of the advantages of ITD are from the true stem distribution series, and without perfect tree detection it is impossible to achieve these goals. On the other hand, in some cases, as in pre-harvest measurements of market stands with relatively low stem number, ITD could provide more accurate results than ABA. Pulse density will hardly be a problem in the future, because of the rapid development of laser technology. ITD should benefit more from denser laser data than ABA.
One interesting possibility for implementing ITD methodology in practical forest inventory is presented by Breidenbach et al. [36]. In this so-called “semi-ITD” method tree detection and the problem of biased ITD estimates are solved practically. Segmentation errors are taken into account by calculating volume for segments, not for individual trees. Because of the above-mentioned procedure, the bias of estimated volume is reduced. Further, several important qualities of ITD are unfortunately missing in this method. Firstly, true stem distribution is not found, although it may still be estimated with good accuracy, and secondly, the amount of field work is not reduced compared to ABA.
In further studies, the effect of ALS pulse density on tree detection should be tested in an operational inventory. In addition, the effects of tree species detection should be investigated using the latest results [14,15]. The results of this study could be utilized when analyzing ITD error sources to emphasize achieving more accurate outputs in forest management planning calculations.

References

  1. Næsset, E. Predicting forest stand characteristics with airborne scanning laser using a practical two-stage procedure and field data. Remote Sens. Environ. 2002, 80, 88–99. [Google Scholar] [CrossRef]
  2. Hyyppä, J.; Inkinen, M. Detecting and estimating attributes for single trees using laser scanner. Photogramm. J. Fin. 1999, 16, 27–42. [Google Scholar]
  3. Packalén, P.; Maltamo, M. The k-MSN method in the prediction of species specific stand attributes using airborne laser scanning and aerial photographs. Remote Sens. Environ. 2007, 109, 328–341. [Google Scholar] [CrossRef]
  4. Brandtberg, T. Automatic Individual Tree-Based Analysis of High Spatial Resolution Remotely Sensed Data. Ph.D. Thesis, Centre for Image Analysis, Swedish University of Agricultural Sciences, Uppsala, Sweden, 1999. [Google Scholar]
  5. Persson, Å.; Holmgren, J.; Söderman, U. Detecting and measuring individual trees using an airborne laser scanner. Photogramm. Eng. Remote Sensing 2002, 68, 925–932. [Google Scholar]
  6. Pitkänen, J.; Maltamo, M.; Hyyppä, J.; Yu, X. Adaptive Methods for Individual Tree Detection on Airborne Laser Based Canopy Height Model. In Proceedings of ISPRS Working Group VIII/2: Laser-Scanners for Forest and Landscape Assessment, Freiburg, Germany, 3–6 October 2004; Theis, M., Koch, B., Spiecker, H., Weinacker, H., Eds.; University of Freiburg: Freiburg, Germany, 2004; pp. 187–191. [Google Scholar]
  7. Yu, X.; Hyyppä, J.; Holopainen, M.; Vastaranta, M.; Viitala, R. Predicting individual tree attributes from airborne laser point clouds based on random forest technique. ISPRS J. Photogramm. Remote Sens. 2011, 66, 28–37. [Google Scholar] [CrossRef]
  8. Peuhkurinen, J.; Maltamo, M.; Malinen, J.; Pitkänen, J.; Packalén, P. Preharvest measurement of marked stands using airborne laser scanning. Forest Sci. 2007, 53, 653–661. [Google Scholar]
  9. Kaartinen, H.; Hyyppä, J. EuroSDR/ISPRS Project, Commission II “Tree Extraction”, Final Report; EuroSDR Official Publication No. 53; European Spatial Data Research: Dublin, Ireland, 2008. [Google Scholar]
  10. Holmgren, J.; Persson, Å. Identifying species of individual trees using airborne laser scanner. Remote Sens. Environ. 2004, 90, 415–423. [Google Scholar] [CrossRef]
  11. Liang, X.; Hyyppä, J.; Matikainen, L. Deciduous-Coniferous Tree Classification Using Difference Between First and Last Pulse Laser Signatures. In Proceedings of the ISPRS Workshop on Laser Scanning 2007 and SilviLaser 2007, Espoo, Finland, 12–14 September 2007.Rönnholm, P.; Hyyppä, H.; Hyyppä, J. (Eds.) IAPRS; 2007; Volume XXXVI, Part 3/W52; pp. 253–257.
  12. Holmgren, J.; Persson, Å.; Söderman, U. Species identification of individual trees by combining high resolution LiDAR data with multi-spectral images. Int. J. Remote Sens. 2008, 29, 1537–1552. [Google Scholar] [CrossRef]
  13. Vauhkonen, J.; Tokola, T.; Packalén, P.; Maltamo, M. Identification of Scandinavian commercial species of individual trees from airborne laser scanning data using alpha shape metrics. Forest Sci. 2009, 55, 37–47. [Google Scholar]
  14. Vauhkonen, J.; Korpela, I.; Maltamo, M.; Tokola, T. Imputation of single-tree attributes using airborne laser scanning-based height, intensity, and alpha shape metrics. Remote Sens. Environ. 2010, 114, 1263–1276. [Google Scholar] [CrossRef]
  15. Korpela, I.; Ørka, H.O.; Maltamo, M.; Tokola, T.; Hyyppä, J. Tree species classification using airborne LIDAR—Effects by stand and tree parameters, downsizing the training set, intensity normalization and sensor type. Silva Fenn. 2010, 44, 319–339. [Google Scholar] [CrossRef]
  16. Puttonen, E.; Litkey, P.; Hyyppä, J. Individual tree species classification by illuminated—Shaded area separation. Remote Sens. 2010, 2, 19–35. [Google Scholar] [CrossRef]
  17. Kalliovirta, J.; Tokola, T. Functions for estimating stem diameter and tree age using tree height, crown width and existing stand database information. Silva Fenn. 2005, 39, 227–248. [Google Scholar] [CrossRef]
  18. Maltamo, M.; Packalén, P.; Peuhkurinen, J.; Suvanto, A.; Pesonen, A.; Hyyppä, J. Experiences and Possibilities of ALS Based Forest Inventory in Finland. In Proceedings of the ISPRS Workshop on Laser Scanning 2007 and SilviLaser 2007, Espoo, Finland, 12–14 September 2007; Rönnholm, P., Hyyppä, H., Hyyppä, J., Eds.; IAPRS: Silves, Portugal, 2007; Volume XXXVI, Part 3/W52. pp. 270–279. [Google Scholar]
  19. Packalén, P.; Pitkänen, J.; Maltamo, M. Comparison of Individual Tree Detection and Canopy Height Distribution Approaches: A Case Study in Finland. In Proceedings of SilviLaser 2008, 8th International Conference on LiDAR Applications in Forest Assessment and Inventory, Edinburgh, UK, 17–19 September 2008; Hill, R., Rossette, J., Suárez, J., Eds.; 2008; pp. 22–29. [Google Scholar]
  20. Vastaranta, M.; Holopainen, M.; Haapanen, R.; Yu, X.; Melkas, T.; Hyyppä, J.; Hyyppä, H. Comparison Between an Area-Based and Individual Tree Detection Method for Low-Pulse Density ALS-Based Forest Inventory. In Proceedings of ISPRS Workshop LaserScanning 2009, Paris, France, 1–2 September 2009; Bretar, F., Pierrot-Deseilligny, M., Vosselman, G., Eds.; 2009; pp. 147–151. [Google Scholar]
  21. Maltamo, M.; Peuhkurinen, J.; Malinen, J.; Vauhkonen, J.; Packalén, P.; Tokola, T. Predicting tree attributes and quality characteristics of scots pine using airborne laser scanning data. Silva Fenn. 2009, 43, 507–521. [Google Scholar] [CrossRef]
  22. Nelson, R.; Krabill, W.; Tonelli, J. Estimating forest biomass and volume using airborne laser data. Remote Sens. Environ. 1988, 24, 247–267. [Google Scholar] [CrossRef]
  23. Hyyppä, J.; Hyyppä, H.; Yu, X.; Kaartinen, H.; Kukko, H.; Holopainen, M. Forest Inventory Using Small-Footprint Airborne lidar. In Topographic Laser Ranging and Scanning: Principles and Processing; Shan, J., Toth, C.K., Eds.; CRC Press: Boca Raton, FL, USA, 2009; pp. 335–370. [Google Scholar]
  24. Maltamo, M.; Eerikäinen, K.; Pitkänen, J.; Hyyppä, J.; Vehmas, M. Estimation of timber volume and stem density based on scanning laser altimetry and expected tree size distribution functions. Remote Sens. Environ. 2004, 90, 319–330. [Google Scholar] [CrossRef]
  25. Yu, X.; Hyyppä, J.; Holopainen, M.; Vastaranta, M. Comparison of area-based and individual tree-based methods for predicting plot-level forest attributes. Remote Sens. 2010, 2, 1481–1495. [Google Scholar] [CrossRef]
  26. StanForD: Standard for Forestry Data and Communication; SkogForsk: Uppsala, Sweden, 2009; Available online: http://www.skogforsk.se/PageFiles/60712/StanForD_MainDoc_070327.pdf (accessed on 12 April 2011).
  27. Varjo, J. Latvan Hukkaosan Pituusmallit Männylle, Kuuselle ja Koivulle Metsurimittausta Varten. Puutavaran Mittauksen Kehittämistutkimuksia 1989–93. In Finnish Forest Research Institute Research Papers 1995; Verkasalo, E., Ed.; 1995; Volume 558, pp. 21–23. [Google Scholar]
  28. Korpela, I. Individual Tree Measurements by Means of Digital Aerial Photogrammetry. Ph.D. Thesis, University of Helsinki, Helsinki, Finland, 2004. [Google Scholar]
  29. Falkowski, M.; Smith, A.; Gessler, P.; Hudak, A.; Vierling, L.; Evans, J. The influence of conifer forest canopy cover on the accuracy of two individual tree measurement algorithms using lidar data. Can. J. Remote Sens. 2008, 34, 338–350. [Google Scholar] [CrossRef]
  30. Mäkelä, A. Performance analyses of a process based stand growth model using Monte-Carlo techniques. Scan. J. Forest Res. 1988, 3, 315–331. [Google Scholar] [CrossRef]
  31. Kangas, A. On the prediction bias and variance in long-term growth projections. Forest Ecol. Manag. 1997, 96, 207–216. [Google Scholar] [CrossRef]
  32. Kangas, A. Methods for assessing uncertainty of growth and yield predictions. Can. J. Forest Res. 1999, 29, 1357–1364. [Google Scholar] [CrossRef]
  33. Mäkinen, A.; Holopainen, M.; Rasinmäki, J.; Kangas, A. Propagating the errors of initial forest variables through stand- and tree-level growth simulators. Eur. J. Forest Res. 2009, 129, 887–897. [Google Scholar]
  34. Holopainen, M.; Mäkinen, A.; Rasinmäki, J.; Hyyppä, J.; Hyyppä, H.; Kaartinen, H.; Viitala, R.; Vastaranta, M.; Kangas, A. Effect of tree level airborne laser scanning accuracy on the timing and expected value of harvest decisions. Eur. J. Forest Res. 2010, 129, 899–907. [Google Scholar] [CrossRef]
  35. Mäkinen, A.; Kangas, A.; Mehtätalo, L. Correlations, distributions, and trends in forest inventory errors and their effects on forest planning. Can. J. Forest Res. 2010, 40, 1386–1396. [Google Scholar] [CrossRef]
  36. Breidenbach, J.; Naesset, E.; Lien, V.; Gobakken, T.; Solberg, S. Prediction of species specific forest inventory attributes using a nonparametric semi-individual tree crown approach based on fused airborne laser scanning and multispectral data. Remote Sens. Environ. 2010, 114, 911–924. [Google Scholar] [CrossRef]

